


Abstract
Maintaining injectivity is essential for the success of CO2-enhanced oil recovery (CO2-EOR) and CO2 storage. This study develops a simple, experimentally based framework to evaluate how sandstone reservoir properties evolve over time during CO2 injection. Static aging experiments were conducted on Berea sandstone for exposure periods of up to three months using CO2-saturated brine at representative reservoir conditions (150 °F and 1500 psi). Changes in rock and fluid properties were quantified using X-ray diffraction (XRD), aqueous chemistry (ICP-OES), and dry mass-loss measurements to quantify reaction progress. Dissolution kinetics were derived from these data and combined with a mass-balance porosity model and the Kozeny–Carman porosity–permeability relationship to project time-dependent porosity and permeability evolution. Short-term experimental results show limited alteration of the quartz-dominated sandstone framework over the duration of the laboratory tests, while the measured permeability decreased by 5.7% and 11.7% after 1 and 3 months of CO2 exposure, respectively. However, kinetic projections indicate that slow dissolution of reactive carbonate cements can gradually enhance pore connectivity over longer timescales. Scenario-based projections over a 30-year injection period predict a potential permeability increase exceeding 140%, accompanied by a model-projected absolute porosity increase of approximately 5.5 percentage points; the permeability projection is contingent on the assumptions of the Kozeny–Carman relationship. The framework links laboratory geochemical measurements with long-term permeability assessment for CO2-EOR and CO2 storage.
1. Introduction
Geological CO2 sequestration is increasingly viewed as a critical pathway for large-scale decarbonization, integrating subsurface engineering, reservoir management, and CO2–brine–rock interaction science [1,2]. CO2 migration and trapping depend on interacting flow, capillary, gravitational, and mass-transfer processes, which require appropriate representation in storage models [1,2,3]. Injectivity is a central design constraint for both CO2-enhanced oil recovery (CO2-EOR) and geological CO2 storage. The ability to place large volumes of CO2 into the subsurface over decades depends on how porosity and permeability evolve in response to coupled hydraulic, geochemical, and geomechanical processes. When CO2 dissolves into formation brine, it acidifies the aqueous phase and promotes mineral reactions that can modify pore geometry and rock strength. The equilibrium solubility of CO2 depends on temperature, pressure, and the concentrations and identities of dissolved salts, making brine composition an important consideration in evaluating CO2–brine–rock interactions [4,5]. Where advection and convective mixing are weak, molecular diffusion becomes an important mechanism governing CO2 transport through the aqueous phase [6]. These solubility and transport effects provide context for interpreting static-aging experiments and extrapolating their results to flowing reservoir systems. In sandstone and saline aquifer settings, mineral reactions are often subtle because the framework is quartz-dominated, yet even modest changes in pore connectivity can significantly influence injectivity over field time scales.
A growing body of experimental work has examined how CO2-rich fluids alter the hydraulic properties of sandstone at the core scale, but the reported trends are not fully consistent. Al-Yaseri et al. [7] performed a series of coreflood experiments on Berea and Bandera Gray sandstones under reservoir conditions, cycling dead brine, live brine, and supercritical CO2. They observed that permeability could either increase or decrease modestly depending on lithology and flow history, with Berea samples generally showing permeability increases after prolonged exposure to live brine, while the overall sensitivity to fluid type and injection rate remained limited. Chen et al. [8] injected CO2-saturated synthetic brine through a quartz-rich Berea core at 60 °C and 20 MPa and reported a 1.8% increase in porosity and a 5.1% reduction in permeability. Tarokh et al. [9] investigated the poromechanical response of pristine and thermally damaged Berea sandstone subjected to liquid CO2 injection, combining drained/undrained mechanical tests, ultrasonic velocities, acoustic emission monitoring, X-ray diffraction (XRD), and petrographic analysis. They found that CO2 exposure decreased strength by 10–15% and increased porosity by approximately 10% and permeability by up to 100%, while poroelastic moduli changed only slightly. Collectively, these studies demonstrate that both permeability increases and decreases have been reported in sandstone during CO2 coreflooding and that the sign and magnitude of change vary across rock types, mineralogies, and test conditions.
Ahmed et al. [10,11,12] contributed a series of studies examining how CO2-brine-rock interaction affects the geochemical, petrophysical, and multiphase-flow properties of sandstone. Ahmed et al. [10] performed static aging experiments on Berea sandstone at 150 °F and 1500 psi to evaluate how one month of CO2 exposure impacts mineralogy, fluid chemistry, porosity, permeability, and mechanical properties. XRD and brine chemistry showed carbonate dissolution accompanied by halite precipitation, with minor reductions in porosity and permeability and minor stiffening of the rock framework. Ahmed et al. [11] then developed a data-driven framework for CO2–brine relative permeability in sandstone reservoirs, combining laboratory measurements with machine-learning models trained on reservoir and fluid properties, and concluded that one-month CO2 storage in quartz-dominated Berea under typical saline aquifer conditions did not measurably alter CO2–brine relative permeability. Building on these petrophysical insights, Ahmed et al. [12] quantified the impact of CO2 exposure on interfacial tension and rock properties relevant to saline aquifer storage, reporting interfacial tension, porosity, permeability, XRD mineralogy, and ICP fluid chemistry data after one month of CO2 exposure at 150 °F and 1500 psi. These studies collectively indicate that over laboratory time scales (~30 days) and in quartz-rich, carbonate-cemented Berea sandstone, geochemical reactions are active but produce only modest changes in measured rock and fluid properties, and they did not explicitly translate those property changes into long-term injectivity forecasts.
More recently, Ahmed et al. [13] and Tale & Dindoruk [14,15] extended this work to longer storage times and coupled reactive-transport modeling. Ahmed et al. [13] evaluated the impact of CO2 storage duration on Berea sandstone over 30- and 90-day static exposure periods at 150 °F and 1500 psi, incorporating a brine-only baseline core to isolate natural brine reactions from CO2-driven reactions. By jointly analyzing porosity, permeability, mineralogy, fluid chemistry, and mechanical stability, they showed that carbonate dissolution and halite precipitation occurred over time and that only small increases in porosity and small decreases in permeability were observed over three months. In parallel, Tale and Dindoruk [14,15] developed and validated a coupled numerical–experimental framework for permeability evolution during CO2-saturated brine injection into sandstone, integrating reactive transport, mineral kinetic laws, fines migration, and the Kozeny–Carman relationship. Their work showed that CO2-saturated brine reduced permeability by up to 64% under certain mineralogical and injection-rate conditions. Together, these studies highlight that static CO2 exposure can yield small changes in porosity and permeability over short laboratory durations, whereas dynamic CO2–brine injection can yield substantial near-wellbore permeability changes under certain conditions. Similarly, Xu et al. [16] investigated coupled flow, mechanical, and geochemical processes during CO2 injection, reporting that competing dissolution and precipitation reactions produce spatially and temporally variable porosity and permeability responses. At larger scales, Boison et al. [17] extended a geochemical model evaluated against laboratory flow-through experiments to a field-scale CO2-storage model, predicting limited net porosity change because mineral dissolution and precipitation largely offset one another.
Despite this progress, two important gaps remain. First, most experimental studies—both from the literature and from our group—are limited to weeks to a few months of exposure, which is much shorter than the operational lifetimes of CO2-EOR and storage projects. Second, while dynamic coreflood models such as those of Tale and Dindoruk [14,15] explicitly couple geochemistry and flow, they primarily resolve near-wellbore behavior over coreflood time scales (capturing the impact of faster reactions) rather than providing simple tools for long-term injectivity forecasting in sandstone reservoirs where geochemical reactions are slow but persistent. In this work, we address these gaps by (i) deriving reaction kinetics for carbonate-cement dissolution in Berea sandstone from carefully controlled static aging experiments at representative reservoir conditions, (ii) combining these kinetics with a mass-balance porosity model and the Kozeny–Carman porosity–permeability relationship project porosity and permeability evolution over longer durations, and (iii) embedding these property trends into injectivity calculations relevant to CO2-EOR and storage. The resulting framework provides an experimentally constrained method to bracket long-term injectivity evolution in carbonate-cemented sandstones, complementing both short-term coreflood observations and fully coupled reactive-transport simulations.
2. Materials and Methods
2.1. Rock Material and Aging Conditions
Berea sandstone cores were used due to their well-characterized mineralogy and relevance as a sandstone reservoir analog. Static aging experiments were conducted using CO2-saturated brine at representative reservoir conditions of 150 °F and 1500 psi. Exposure periods of 1 and 3 months were investigated, along with a brine-only control test.
Five sister cores of gray Berea sandstone were obtained from the same block, and three homogeneous cores were selected by X-ray CT, one for each aging condition: brine only for 1 month (A), CO2–brine for 1 month (B), and CO2–brine for 3 months (C). Each selected 1.5-in-diameter core was sectioned into pieces for different post-aging measurements, including a 0.25-in disc for wettability characterization, a 2.5-in plug for routine core analysis RCA and NMR, and an approximately 8-in section reserved for relative-permeability testing. The sections exposed under each condition had a combined bulk volume of approximately 311 cm3 (Table 1). Pre-aging XRD showed quartz-dominated mineralogy with minor feldspars, clays, and carbonate cements; total carbonate content ranged from 4.3 to 6.8 wt.% among the three tested cores. The samples were vacuum-saturated for 38 h with synthetic brine (100,000 ppm; 80 wt.% NaCl and 20 wt.% KCl), pressurized to 2000 psi for 24 h, and aged under static conditions for 30 or 90 days. For the CO2 tests, CO2 was introduced into a 1-in headspace above the brine to 1500 psi, and the system was maintained at 150 °F and 1500 psi. Diffusive CO2 saturation of the brine was estimated to require ~10 h [18], which is negligible relative to the 30- and 90-day aging periods, and the CO2 gas cap maintained saturation throughout aging. Before and after aging, the rock samples were oven-dried at 110 °C for 24 h and weighed in triplicate (±0.1 g); mass loss was determined from the difference between the pre- and post-aging dry masses. Porosity was measured on the dedicated RCA plug using the Boyle’s-law method, and Klinkenberg-corrected permeability was obtained using the unsteady-state method at net confining stress. Details of the experimental setup and procedures for the CO2 static exposure test were reported in our previous publications [10,11,13]. Static conditions were intentionally selected to isolate intrinsic geochemical reactions from flow-induced effects such as fines migration, capillary end effects, and salt precipitation associated with CO2 dry-out.
Table 1.
Induced property changes in Berea sandstone during static aging experiments (150 °F, 1500 psi).
2.2. Analytical Measurements
Reaction progress was quantified using:
- •
- Dry mass loss to track cumulative mineral dissolution;
- •
- X-ray diffraction (XRD) to identify mineralogical changes;
- •
- Aqueous geochemistry (ICP-OES and titration) to quantify dissolved species;
- •
- Routine porosity and permeability measurements before and after exposure.
These measurements provide the experimental basis for kinetic modeling. Details of the static CO2 exposure experiments, analytical techniques XRD, ICP-OES, and porosity–permeability characterization are provided in Ahmed et al. [13].
2.3. Kinetic Model for Mineral Dissolution
Mineral dissolution was modeled as a first-order depletion process acting on a finite pool of reactive minerals as in Equation (1):
where Mrem is the remaining reactive mineral mass, and kd is the apparent rate constant. The cumulative dissolved mass is W(t):
Model parameters were calibrated using experimentally measured mass loss at 1 and 3 months.
Model parameters were estimated from the experimentally measured mass losses at 1 and 3 months. For the short-term model, M0 and kd were both fitted to these measurements using the finite-pool first-order model. For the long-term bounding scenario, the maximum reactive inventory was constrained using the XRD-derived total carbonate fraction and the initial core mass, and kd,LT was fitted to the same mass-loss data with this inventory fixed.
One independent core was tested for each aging condition (n = 1). Pre- and post-aging dry masses were each measured in triplicate, with identical readings at the balance resolution; the balance accuracy was ±0.1 g. Because M0 and kd were determined from two experimental observations, a regression-based confidence interval could not be estimated. Propagation of the balance accuracy gives kd = 0.167 ± 0.107 month−1. For the long-term bounding scenario, the 6.8 wt.% pre-aging carbonate content of the 3-month core corresponds to M0,LT = 45.31 g. Using the observed sister-core variability in total carbonate content (SD = 1.27 wt.%) as the inventory uncertainty gives kd,LT = 0.0321 ± 0.0063 month−1.
2.4. Porosity Evolution
Porosity evolution was computed by converting dissolved mineral mass into added pore volume:
where ρs is the grain density, ∅0 is the initial porosity pre-aging, Vbulk is the bulk rock volume, and W(t) is the total weight dissolved at time t.
Equation (3) assumes that the experimentally measured net solid mass loss is converted to additional pore volume using grain density. Secondary precipitation and spatial redistribution of reaction products are not represented explicitly and are reflected only through their net contribution to the measured pre- and post-aging rock mass.
2.5. Permeability Evolution via Kozeny–Carman
Permeability evolution was obtained by mapping the reaction-driven porosity changes into permeability space using the Carman–Kozeny (KC) relationship. The KC framework assumes a homogeneous pore structure with uniform enlargement of pore bodies and throats, such that permeability is governed by pore volume, pore surface area, and tortuosity. The general KC form for consolidated sandstones may be expressed as:
where ϕ(t) is porosity, Sv is the specific internal surface area per unit pore volume, and C is a geometric/tortuosity constant. Under the assumption that the pore-shape constant and specific surface area scale proportionally with the initial state, the KC expression can be recast in normalized form as:
where k0 and ϕ0 are the initial permeability and porosity, respectively. This normalized formulation preserves the geometric coefficients without requiring explicit calibration of C or Sv It is widely used for consolidated sandstones under dissolution-driven pore enlargement.
The KC model provides a direct functional link between evolving porosity and permeability:
and therefore enables long-term permeability prediction once ϕ(t) is supplied from the reactive dissolution model described in Section 2.4. This approach represents an upper-bound (optimistic) scenario in which dissolution uniformly enlarges flow pathways without fines mobilization or secondary precipitation.
k(t) = f(ϕ(t))
2.6. Time-Dependent Injectivity Formulation
Injectivity was evaluated using the injectivity index (II), defined as the ratio of injection rate to the pressure differential between the wellbore and the reservoir. Under radial flow assumptions, injectivity can be expressed as:
where q is the injection rate, Δp is the pressure difference between bottom-hole and reservoir pressure, k is permeability, h is formation thickness, μ is fluid viscosity, B is the formation volume factor, re and rw are the drainage and wellbore radii, respectively, and s is the skin factor. For a given well geometry and fluid system, injectivity scales linearly with permeability.
Substituting the time-dependent permeability function yields:
This formulation transforms injectivity from a static reservoir assumption into a time-dependent, reaction-driven prediction, directly linking laboratory-measured geochemical kinetics to field-scale injectivity evolution.
Because the present study employed static aging experiments, injectivity was not measured directly through flow tests. Instead, changes in injectivity were inferred from experimentally derived permeability evolution. This approach isolates the intrinsic geochemical contribution to injectivity by excluding flow-induced effects such as fines migration, salt precipitation, and capillary end effects. Under these conditions, the injectivity ratio (IR) can be approximated as:
where k0 and k(t) are the initial and time-dependent permeabilities, respectively. Using this relationship, reaction-driven permeability changes predicted by the kinetic model were directly translated into time-dependent injectivity trends.
3. Results and Discussion
3.1. Short-Term Rock Property Changes During Static Aging
Table 1 details the petrophysical evolution of Berea sandstone after exposure to reservoir conditions (150 °F, 1500 psi). The data reveals a clear decoupling between porosity and permeability evolution. Across all conditions, the rock lost mass and gained porosity, indicating mineral–fluid interaction. Notably, the brine-only control showed the largest porosity increase (+0.77 percentage points), demonstrating that porosity change alone cannot be attributed specifically to CO2. The control also showed a small mass loss (0.13 wt.%), whereas the CO2-exposed samples showed larger mass losses of 0.24 and 0.62 wt.%. The mineralogical and fluid-chemistry results reported for these experiments in our companion study [13] further support enhanced mineral dissolution under CO2 exposure.
Crucially, bulk dissolution did not translate to improved hydraulic conductivity. Despite the increase in pore volume, Klinkenberg permeability declined across all samples. For the 3-month CO2 exposure, permeability dropped from 214 mD to 189 mD (−11.7%). This counter-intuitive behavior—where porosity increases while permeability decreases— may reflect localized pore-throat obstruction or grain redistribution. A similar response was reported during CO2-saturated brine injection into Berea sandstone, where fines movement following cement dissolution and/or compaction were proposed as possible explanations [8]. However, those flow-through conditions differ from the present static-aging experiments, and the permeability decrease in the brine-only control precludes attributing the entire change specifically to CO2.
Our mineralogical and fluid chemistry analyses provide evidence consistent with net mineral dissolution. As detailed in our companion study [13], XRD analysis confirmed the complete disappearance of siderite and a reduction in chlorite after just one month. Concurrently, ICP-OES data showed a sharp spike in Ca2+ and Fe2+ concentrations. These observations support the dissolution of reactive mineral phases. Localized secondary precipitation or fines redistribution may nevertheless occur within the pore network and could contribute to pore-throat obstruction; however, these mechanisms were not directly quantified in the present study.
3.2. Implication
Pre- and post-aging MICP measurements from the same sister-core experimental program showed condition-dependent changes in threshold capillary pressure, with no systematic trend toward pore-throat constriction with exposure time; notably, the 3-month core showed the largest permeability decrease despite a lower threshold pressure [19]. The specific pore-scale mechanism responsible for the measured permeability decrease remains unresolved.
Figure 1 tracks the cumulative dissolved mass during CO2–brine aging in grams. The reaction trajectory follows a decelerating first-order trend, which physically corresponds to the rapid depletion of the finite reactive mineral inventory. As noted in the XRD analysis, the highly reactive siderite and calcite phases were largely consumed within the first months [13], leaving the slower-reacting silicate framework (quartz and feldspar) to dominate the later-stage kinetics. Fitting the measured mass losses of 1.60 g at 1 month and 4.10 g at 3 months gives M0 = 10.4 g (~1.56 wt.%) and kd = 0.167 month−1, corresponding to a half-life of 4.15 months. The fitted reactive inventory is smaller than the total carbonate content estimated form XRD wt.% and total core mass, indicating that only an effective fraction of the total carbonate inventory reacted under the closed-system laboratory conditions. This decelerating trend aligns with standard rate laws [20] but requires careful extrapolation. Because the reactive carbonate content in Berea is low (~5–7 wt.%), the reaction is self-limiting. Once these cements are exhausted, the dissolution rate will drop by orders of magnitude as it shifts to the sluggish kinetics of aluminosilicates.
Figure 1.
Cumulative mineral dissolution during static CO2–brine aging of Berea sandstone. Symbols represent experimentally measured mass loss of 1.60 g (0.24 wt.%) at 1 month and 4.10 g (0.62 wt.%) at 3 months. The solid curve shows the short-term first-order fit with M0 = 10.4 g and kd = 0.167 month−1. The dotted horizontal line indicates the 10.4 g asymptotic dissolution capacity, and the dashed vertical line marks the 4.15-month half-life. For the long-term bounding scenario, the XRD-derived carbonate fraction (~6.7 wt.%) and the initial core mass (~665–670 g) give a maximum reactive inventory of approximately 45 g. This finite carbonate pool is assumed to be consumed progressively during prolonged CO2–brine exposure. With M0,LT fixed at 45 g, fitting the same mass-loss data gives an effective kd,LT ≈ 0.032 month−1.
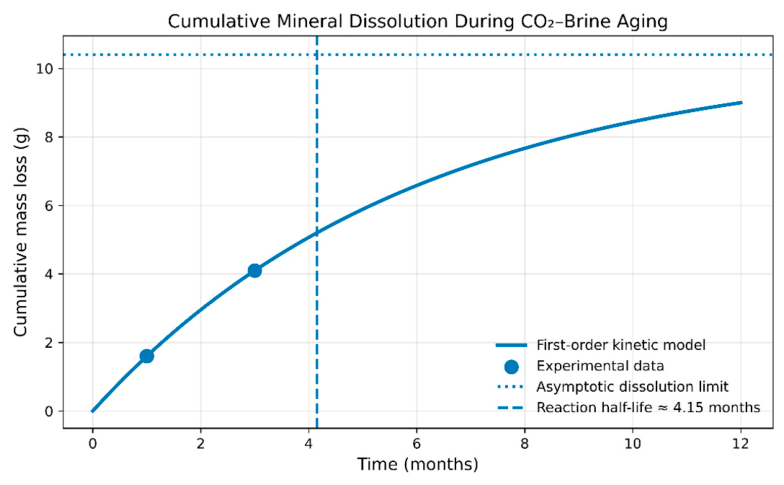
Figure 2a shows long-term porosity evolution based on the kinetic model. The predicted rapid early porosity increase followed by a plateau reflects progressive depletion of carbonate cements and the very slow dissolution rates of silicates at 150 °F. To verify that the analytical porosity evolution function used in Figure 2a is consistent with laboratory observations, the model was evaluated at the CO2–brine exposure durations (1 and 3 months) and compared against the measured porosity increases obtained from Routine Core Analysis (RCA) on the aged Berea samples. The model predicts porosities of 19.79% and 20.10% after 1 and 3 months, compared with measured RCA values of 19.77% and 20.19%, respectively (Table 1). The absolute differences (0.02 and 0.09 percentage points) are within the estimated RCA measurement uncertainty (±0.2–0.3 percentage points). Because the kinetic parameters were calibrated using mass losses at the same two times, this agreement indicates consistency with the available measurements rather than statistical validation. The porosity function is therefore used as a mass-balance-consistent input for the subsequent permeability and injectivity projections, which extend beyond the experimental window.
Figure 2.
(a) Analytical porosity evolution function plotted over 0–30 years and (b) comparison of the model with measured porosity increases from CO2–brine aging experiments at 1 and 3 months. The analytical curve reproduces the observed porosity gains within experimental uncertainty, validating its use for forward permeability and injectivity projections that extend beyond the laboratory exposure window.
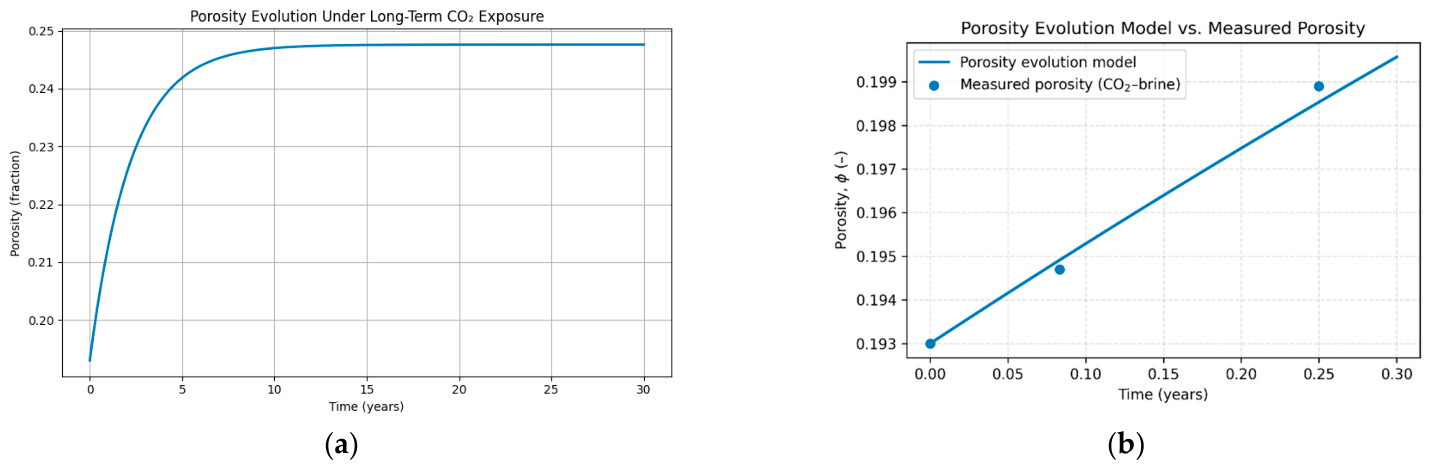
Figure 3 shows estimated permeability based on the Kozeny–Carman relationship, which relates permeability to porosity and internal surface area for granular media. The Kozeny–Carman formulation is widely used in reactive flow simulations to approximate permeability evolution under homogeneous pore-structure assumptions [21]. Under these assumptions, dissolution-induced porosity increases yield permeability enhancement.
3.3. Kozeny–Carman Projection and Measured Permeability Response
The Kozeny–Carman scenario disagrees with the measured permeability decreases in Table 1. At 1 and 3 months, the Kozeny–Carman projection gives k/k0 = 1.03 and 1.09, respectively, whereas the measured CO2–brine values are 0.94 and 0.88 (Table 1; Figure 3). This contrast confirms that the Kozeny–Carman curve represents a mechanistic upper-bound scenario rather than an extrapolation of the measured permeability response. This discrepancy is consistent with CCUS laboratory observations showing that permeability may either:
- •
- Increase due to connectivity enhancement [22,23];
- •
- Decrease due to pore-throat blocking, fines migration, or secondary precipitation [24,25], depending on prevailing pore-scale mechanisms.
Therefore, Figure 3 should be interpreted as a mechanistic upper-bound scenario rather than an extrapolation of measured permeability.
Figure 3.
Projected normalized permeability (k/k0) of Berea sandstone under long-term CO2–brine exposure, derived from reaction-driven porosity changes using the Kozeny–Carman relationship (Equations (3) and (5)) with the long-term scenario parameters (M0,LT = 45.3 g; kd,LT = 0.0321 month−1), plotted on a logarithmic time axis. The shaded region marks the experimental window. Symbols show the measured RCA permeability ratios from Table 1 (filled: CO2–brine, Cores B and C; open: brine-only control, Core A). The measured decreases contrast with the predicted increase, so the curve represents a mechanistic upper-bound scenario rather than an extrapolation of the measured permeability.
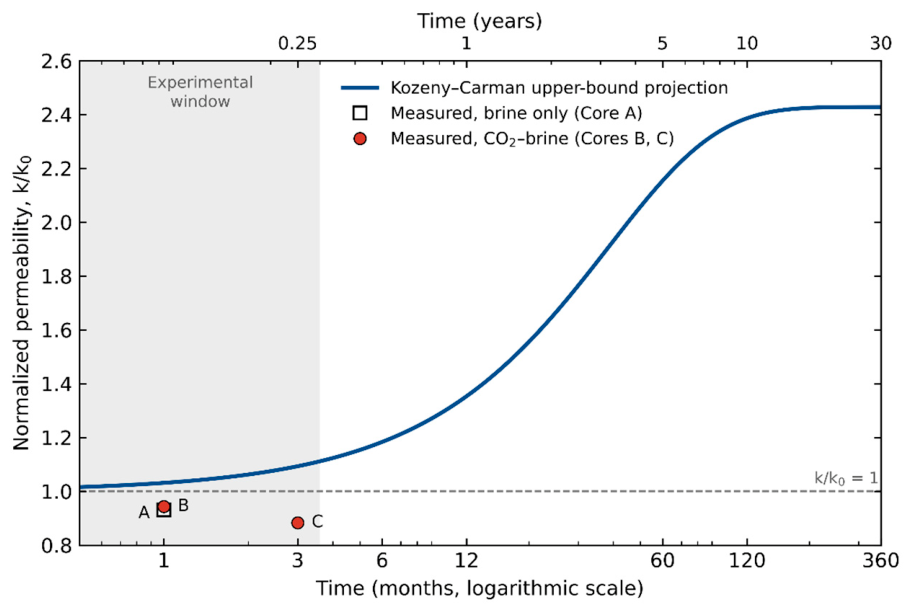
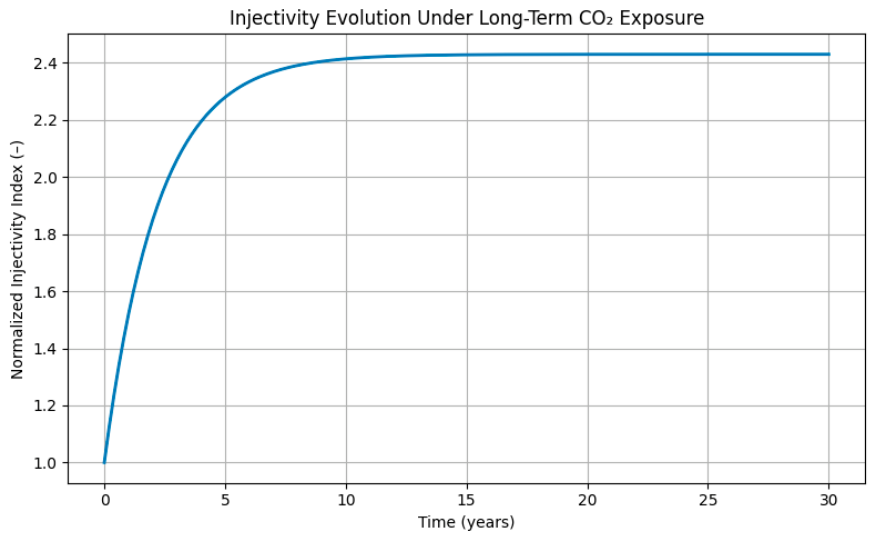
Figure 4 shows the projected evolution of the normalized injectivity index, IR (II/II0), over a 30-year operating horizon. The trajectory is obtained by coupling experimentally derived first-order dissolution kinetics for carbonate cements with a Kozeny–Carman porosity–permeability relationship and embedding the resulting k(t) function into a radial well model following Peaceman [26]. This workflow is consistent with standard geochemical and reactive-transport practice in which Arrhenius-type rate laws are used for carbonate dissolution, reactive surface area controls are applied, and porosity changes are mapped to permeability via Kozeny–Carman [20,27,28]. The model response exhibits an early-time enhancement regime followed by late-time stabilization. The initial enhancement is associated with the rapid dissolution of the small but reactive carbonate-cement fraction measured in the Berea sandstone specimens, which increases pore connectivity and reduces flow resistance near the wellbore. Similar observations have been documented in laboratory studies, where dissolution of carbonate cements in sandstone under CO2-acidified brines resulted in measurable increases in porosity and permeability [14,15]. This aligns with laboratory characterizations showing that carbonate dissolution rates are initially high when reactive surface area and acid availability are both large [20,27]. As dissolution progresses, the system transitions to a reactant-limited regime in which the carbonate inventory dictates the remaining reaction extent. Under these conditions, permeability increments decrease and the injectivity index II approaches an asymptotic value over long times. This type of asymptotic behavior is consistent with reactive-transport simulations of CO2–rock systems, which show that porosity and permeability evolve rapidly at early times and then approach steady values as dissolution fronts migrate and geochemical equilibrium is approached [27,28].
Figure 4.
Normalized injectivity evolution under long-term CO2–brine exposure, derived by embedding reaction-driven permeability evolution into the radial flow injectivity formulation. Injectivity increases rapidly during the early years of CO2 exposure and stabilizes as reactive carbonate minerals are depleted.
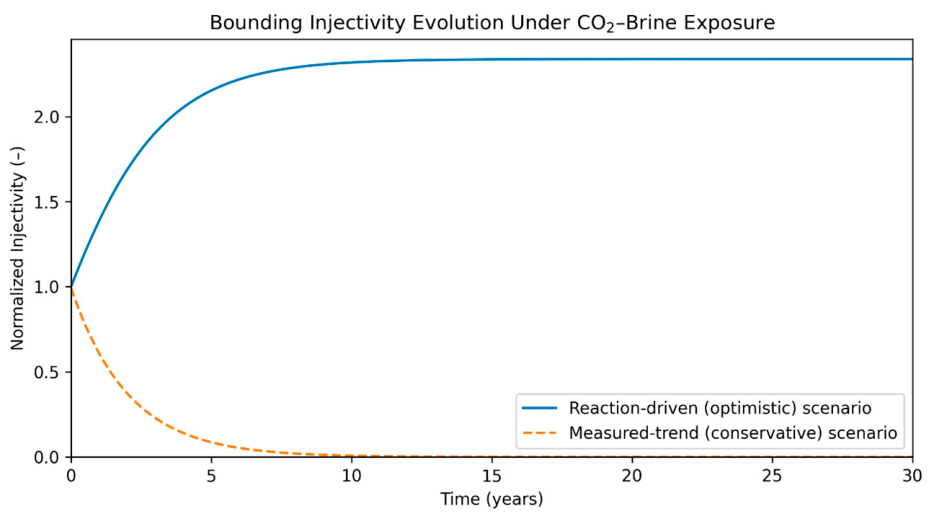
The injectivity projections presented in Figure 5 in this study are derived from static batch aging experiments conducted over limited durations (up to three months) and therefore do not capture flow-induced mechanisms such as advective transport, dynamic fines migration, or near-wellbore salt precipitation that may occur under field injection conditions. The reaction-driven scenario assumes that dissolution-induced porosity gains translate effectively into permeability enhancement at the Darcy scale, which represents an upper-bound response in well-swept, brine-saturated zones. In contrast, the measured-trend scenario incorporates the permeability decline observed during short-term static CO2–brine exposure experiments and extrapolates this behavior over a 30-year horizon to define a conservative lower bound on long-term injectivity. The measured-trend lower bound assumes a first-order exponential decline, II(t)/II0 = k(t)/k0 = exp(−λt), calibrated to the 3-month measurement (k/k0 = 0.883; Table 1), giving λ = 0.50 yr−1 (0.0414 month−1). Because this form asymptotically approaches zero, it represents a hypothetical unmitigated lower bound rather than an expected field response. This extension assumes a closed system with no brine renewal, no advective flushing of reaction products, and no operational intervention, and therefore should not be interpreted as a literal field forecast. As such, the results should be interpreted as bounding scenarios rather than deterministic forecasts. Extension of this framework to specific field applications requires calibration against dynamic coreflood experiments, well-test data, or coupled reactive-transport simulations. This lower-bound trajectory represents an unmitigated decline scenario. In practical field operations, such a decline would typically trigger well stimulation treatments (e.g., acidizing or hydraulic fracturing) to restore injectivity long before the asymptotic low is reached.
Figure 5.
Injectivity bounding scenarios derived from static CO2–brine aging experiments: the reaction-driven scenario (upper bound) assumes that permeability enhancement driven by dissolution-induced porosity increases, whereas the measured-trend scenario (lower bound) incorporates experimentally observed early-time permeability reductions. Model inputs used for Figure 2, Figure 3, Figure 4 and Figure 5: φ0 = 0.193, k0 = 200 mD, ρs = 2.65 g/cm3, and Vbulk = 311 cm3. The short-term kinetic model uses M0 = 10.4 g; the long-term bounding scenario uses M0,LT = 45.31 g.
3.4. Injectivity Bounds and Limitations
The reaction-driven and measured-trend scenarios represent bounding cases rather than deterministic field forecasts. The reaction-driven upper bound assumes that dissolution-driven porosity gains translate into permeability enhancement through the Kozeny–Carman relationship, with no fines mobilization or secondary precipitation; it represents the potential for matrix enhancement in well-swept zones. The measured-trend lower bound extrapolates the experimentally observed permeability decline under closed-system conditions, with no brine renewal, no advective flushing of reaction products, and no operational intervention. Because its exponential form asymptotically approaches zero, it represents a hypothetical unmitigated damage end member rather than an expected field response. In practice, such a decline would typically trigger stimulation treatments (e.g., acidizing or hydraulic fracturing) long before the asymptotic low is reached. The injectivity calculation also assumes single-phase flow with constant viscosity, formation volume factor, thickness, drainage and wellbore radii, and skin factor, so that injectivity changes reflect permeability changes only; these simplifications may not hold in the near-wellbore region during CO2 injection.
Static aging may favor retention of fines or reaction products because hydrodynamic drag forces are absent; under flowing conditions, mobilization and redistribution may shift the response toward the upper-bound scenario. The static aging experiments also do not capture flow-induced processes such as advective transport, dynamic fines migration, CO2 dry-out and salt precipitation, relative-permeability effects, or near-wellbore skin evolution. Field-scale injectivity may therefore evolve between these end members depending on mineralogy, flow regime, stress state, operational conditions, and completion design. Application to specific reservoirs requires calibration against dynamic coreflood experiments, well-test data, or coupled reactive-transport simulations.
4. Conclusions
- Measurable Mineral Dissolution: Static CO2–brine exposure produced cumulative mass loss increasing with time (0.24% at 1 month and 0.62% at 3 months). These trends are consistent with the dissolution of minor carbonate accessory minerals identified by XRD, confirming active geochemical alteration even in quartz-dominated lithologies.
- Porosity Enhancement: Modest absolute porosity gains (up to +0.59% after three months) were observed under CO2–brine conditions. This confirms that dissolution successfully generates additional pore volume, consistent with carbonic-acid-driven dissolution of reactive carbonate cement.
- Transport-Limited Permeability Decline: Despite porosity gains, Klinkenberg permeability decreased across all static cases (e.g., −11.7% after 3 months). Complementary MICP measurements showed condition-dependent pore-throat changes but no systematic constriction with exposure time [14]. The specific pore-scale mechanism responsible for the permeability decrease remains unresolved.
- Kinetic Characterization: The short-term mass-loss data were represented by a first-order depletion model with M0 = 10.4 g (~1.56 wt.%) and kd = 0.167 month−1 (t½ = 4.15 months). For the separate long-term bounding scenario, the reactive inventory was set to approximately 45.3 g (~6.7 wt.%) based on the XRD-derived carbonate content, giving an effective kd,LT ≈ 0.032 month−1. This model captures the decelerating reaction trajectory associated with the progressive depletion of finite reactive carbonate phases.
- Long-Term Projections: Upscaling these kinetics using Kozeny–Carman and radial-flow formulations indicates that, under homogeneous flow assumptions, permeability and injectivity will increase rapidly at early times before stabilizing as carbonates are depleted.
- Performance Envelope: The study defines a bounding performance envelope. The projected increasing trends represent a geochemical upper bound (intrinsic dissolution-driven behavior), whereas the measured static decline represents a conservative lower bound (transport-limited damage). Field-scale injectivity will likely evolve between these limits, depending on the combined effects of mineral reactions, transport processes, flow conditions, and operational factors.
Author Contributions
Conceptualization, methodology, formal analysis, investigation, data curation, visualization, writing—original draft preparation, M.E.M.A.; writing—review and editing, and supervision, B.D. All authors have read and agreed to the published version of the manuscript.
Funding
This research received no external funding.
Data Availability Statement
The data supporting the findings of this study are available from the corresponding author upon request.
Acknowledgments
This research is supported by the members of the Research Consortium “Interaction of Phase Behavior and Flow (IPB&F)” and its affiliates, as well as the CCUS Consortium Industrial Affiliates by Core laboratories at Texas A&M University. We gratefully acknowledge their support.
Conflicts of Interest
The authors declare no conflicts of interest.
Nomenclature
| Symbol/Term | Definition | Units |
| t | Time | month, year |
| k | Permeability | mD |
| k0 | Initial permeability | mD |
| k(t) | Time-dependent permeability | mD |
| kd | Apparent rate constant | Month−1 |
| kd,LT | Effective long-term dissolution rate constant | Month−1 |
| ϕ | Porosity | fraction or % |
| ϕ0 | Initial porosity | fraction or % |
| IR | Injectivity ratio = k(t)/k0 | – |
| II | Injectivity index = q/Δp | stb/day/psi (or compatible) |
| q | Injection rate | stb/day or m3/day |
| Δp | Pressure differential | psi |
| μ | Fluid viscosity | cP |
| h | Formation thickness | ft |
| rₑ | Drainage radius | ft |
| rw | Wellbore radius | ft |
| s | Skin factor | – |
| Mrem(t) | Remaining reactive mineral mass | g |
| M0 | Initial reactive mineral mass | g |
| W(t) | Cumulative dissolved mass | g |
| ρs | Grain density | g/cm3 |
| ICP-OES | Inductively coupled plasma–optical emission spectrometry | – |
| XRD | X-ray diffraction | – |
References
- Bachu, S. CO2 storage in geological media: Role, means, status and barriers to deployment. Prog. Energy Combust. Sci. 2008, 34, 254–273. [Google Scholar] [CrossRef] [Scilit]
- Benson, S.M.; Cole, D.R. CO2 sequestration in deep sedimentary formations. Elements 2008, 4, 325–331. [Google Scholar] [CrossRef] [Scilit]
- Krevor, S.; Blunt, M.J.; Benson, S.M.; Pentland, C.H.; Reynolds, C.; Al-Menhali, A.; Niu, B. Capillary trapping for geologic carbon dioxide storage—From pore scale physics to field scale implications. Int. J. Greenh. Gas Control 2015, 40, 221–237. [Google Scholar] [CrossRef] [Scilit]
- Duan, Z.; Sun, R. An improved model calculating CO2 solubility in pure water and aqueous NaCl solutions from 273 to 533 K and from 0 to 2000 bar. Chem. Geol. 2003, 193, 257–271. [Google Scholar] [CrossRef] [Scilit]
- Spycher, N.; Pruess, K. CO2–H2O mixtures in the geological sequestration of CO2. II. Partitioning in chloride brines at 12–100 °C and up to 600 bar. Geochim. Cosmochim. Acta 2005, 69, 3309–3320. [Google Scholar] [CrossRef] [Scilit]
- Cadogan, S.P.; Maitland, G.C.; Trusler, J.P.M. Diffusion coefficients of CO2 and N2 in water at temperatures between 298.15 K and 423.15 K at pressures up to 45 MPa. J. Chem. Eng. Data 2014, 59, 519–525. [Google Scholar] [CrossRef] [Scilit]
- Al-Yaseri, A.; Zhang, Y.; Ghasemiziarani, M.; Sarmadivaleh, M.; Lebedev, M.; Roshan, H.; Iglauer, S. Permeability evolution in sandstone due to CO2 injection. Energy Fuels 2017, 31, 12390–12398. [Google Scholar] [CrossRef] [Scilit]
- Chen, P.; Saeedi, A.; Noble, R.R.P. An experimental study of CO2 saturated brine reaction with Berea sandstone. In Proceedings of the SPE Western Regional Meeting, Bakersfield, CA, USA, 23–27 April 2017. SPE-185729-MS. [Google Scholar] [CrossRef] [Scilit]
- Tarokh, A.; Makhnenko, R.Y.; Kim, K.; Zhu, X.; Popovics, J.S.; Segvic, B.; Sweet, D.E. Influence of CO2 injection on the poromechanical response of Berea sandstone. Int. J. Greenh. Gas Control 2020, 95, 102959. [Google Scholar] [CrossRef] [Scilit]
- Ahmed, M.E.M.; Paker, D.M.; Dindoruk, B. Physiochemical and mechanical aspects of CO2 storage in deep saline aquifers: An experimental study. In Proceedings of the SPE Annual Technical Conference and Exhibition, New Orleans, LA, USA, 23–25 September 2024. SPE-221060-MS. [Google Scholar] [CrossRef] [Scilit]
- Ahmed, M.E.M.; Paker, D.M.; Abdulwarith, A.; Dindoruk, B.; Drylie, S.; Gautam, S. Quantification of the effect of CO2 storage on CO2–brine relative permeability in sandstone reservoirs: An experimental and machine learning study. In Proceedings of the SPE Annual Technical Conference and Exhibition, New Orleans, LA, USA, 23–25 September 2024. SPE-220974-MS. [Google Scholar] [CrossRef] [Scilit]
- Ahmed, M.E.M.; Paker, D.M.; Dindoruk, B.; Drylie, S. Experimental investigation of the impact of CO2 on interfacial tension and rock properties in application to CO2 storage in saline aquifers. In Proceedings of the Carbon Capture, Utilization, and Storage Conference, Houston, TX, USA, 3–5 March 2025. CCUS-2025-4193861. [Google Scholar] [CrossRef] [Scilit]
- Ahmed, M.E.M.; Paker, D.M.; Ramoin, J.; Drylie, S.; Dindoruk, B. Impact of CO2 storage time on the physicochemical and mechanical properties of sandstone formations: Insights for long-term CCS applications. In Proceedings of the SPWLA 66th Annual Logging Symposium, Dubai, United Arab Emirates, 17–21 May 2025. SPWLA-2025-0025. [Google Scholar] [CrossRef] [Scilit]
- Tale, F.; Abdulwarith, A.; Chen, F.; Drylie, S.; Crombie, A.; Dindoruk, B. Dynamics of permeability changes in CO2-saturated brine injection: An integrated modeling approach. In Proceedings of the Carbon Capture, Utilization, and Storage Conference, Houston, TX, USA, 3–5 March 2025. CCUS-2025-4184874. [Google Scholar] [CrossRef] [Scilit]
- Tale, F.; Dindoruk, B. Numerical and experimental study of the kinetics of permeability changes in CO2-saturated brine injection process for enhanced CO2 sequestration. In Proceedings of the SPE Annual Technical Conference and Exhibition, Houston, TX, USA, 20–22 October 2025. SPE-228087-MS. [Google Scholar] [CrossRef] [Scilit]
- Xu, R.; Yan, T.; Han, X.; Qu, J.; Feng, J. Mass transfer analysis of CO2-water-rock geochemical reactions in reservoirs. Energies 2023, 16, 5862. [Google Scholar] [CrossRef] [Scilit]
- Boison, P.K.N.; Ampomah, W.; Simmons, J.D.; Bui, D.; Sibaweihi, N.; Amosu, A.; Duartey, K.O. Geochemical assessment of long-term CO2 storage from core- to field-scale models. Energies 2025, 18, 4089. [Google Scholar] [CrossRef] [Scilit]
- Oyagha, S.; Ratnakar, R.R.; Dindoruk, B. Measurement of diffusivity of supercritical CO2 in formation brines at reservoir conditions for CCS applications. In Proceedings of the SPE Annual Technical Conference and Exhibition, New Orleans, LA, USA, 23–25 September 2024. SPE-221402-MS. [Google Scholar] [CrossRef] [Scilit]
- Ahmed, M.E.M.; Dindoruk, B. Impact of CO2 Storage Time on CO2–Brine Relative Permeability in Berea Sandstone. In Proceedings of the SPE Annual Technical Conference and Exhibition (ATCE), Houston, TX, USA, 21–23 October 2026. SPE-234042-MS. [Google Scholar]
- Palandri, J.L.; Kharaka, Y.K. A Compilation of Rate Parameters of Water–Mineral Interaction Kinetics for Application to Geochemical Modeling; Open-File Report 2004-1068; U.S. Geological Survey: Menlo Park, CA, USA, 2004. Available online: https://pubs.usgs.gov/of/2004/1068/ (accessed on 25 July 2025).
- Bear, J. Dynamics of Fluids in Porous Media; American Elsevier: New York, NY, USA, 1972. [Google Scholar]
- Ross, G.D.; Todd, A.C.; Tweedie, J.A.; Will, A.G.S. The dissolution effects of CO2-brine systems on the permeability of U.K. and North Sea calcareous sandstones. In Proceedings of the SPE/DOE Third Joint Symposium on Enhanced Oil Recovery, Tulsa, OK, USA, 4–7 April 1982. SPE-10685-MS. [Google Scholar] [CrossRef]
- Koukouzas, N.; Kypritidou, Z.; Purser, G.; Rochelle, C.A.; Vasilatos, C.; Tsoukalas, N. Assessment of the impact of CO2 storage in sandstone formations by experimental studies and geochemical modeling: The case of the Mesohellenic Trough, NW Greece. Int. J. Greenh. Gas Control 2018, 71, 116–132. [Google Scholar] [CrossRef] [Scilit]
- Shiraki, R.; Dunn, T.L. Experimental study on water–rock interactions during CO2 flooding in the Tensleep Formation, Wyoming, USA. Appl. Geochem. 2000, 15, 265–279. [Google Scholar] [CrossRef] [Scilit]
- Müller, N.; Qi, R.; Mackie, E.; Pruess, K.; Blunt, M.J. CO2 injection impairment due to halite precipitation. Energy Procedia 2009, 1, 3507–3514. [Google Scholar] [CrossRef] [Scilit]
- Peaceman, D.W. Interpretation of well-block pressures in numerical reservoir simulation. Soc. Pet. Eng. J. 1978, 18, 183–194. [Google Scholar] [CrossRef] [Scilit]
- Xu, T.; Apps, J.A.; Pruess, K. Reactive geochemical transport simulation to study mineral trapping for CO2 disposal in deep arenaceous formations. J. Geophys. Res. Solid Earth 2003, 108, 2071. [Google Scholar] [CrossRef] [Scilit]
- Nogues, J.P.; Fitts, J.P.; Celia, M.A.; Peters, C.A. Permeability evolution due to dissolution and precipitation of carbonates using reactive transport modeling in pore networks. Water Resour. Res. 2013, 49, 6006–6021. [Google Scholar] [CrossRef] [Scilit]

Disclaimer/Publisher’s Note: The statements, opinions and data contained in all publications are solely those of the individual author(s) and contributor(s) and not of MDPI and/or the editor(s). MDPI and/or the editor(s) disclaim responsibility for any injury to people or property resulting from any ideas, methods, instructions or products referred to in the content. |
© 2026 by the authors. Licensee MDPI, Basel, Switzerland. This article is an open access article distributed under the terms and conditions of the Creative Commons Attribution (CC BY) license.