


Abstract
Excessive methane concentrations are the primary cause of coal mine explosions. To ensure safe underground operations, a predictive model combining variational mode decomposition (VMD), the black kite algorithm (BKA), and a long short-term memory (LSTM) neural network is proposed to predict methane concentration trends. VMD decomposes the methane concentration time series into multiple modal components, reducing the negative impact of nonlinearity on LSTM prediction performance. Several improvement strategies are employed to enhance BKA’s efficiency in optimizing LSTM hyperparameters and improve the prediction accuracy for each modal component. The predicted components are then reconstructed, and the reconstructed result serves as the final prediction. Simulation results show that the VMD-BKA-LSTM model achieves a substantial reduction in the root mean square error (RMSE) compared with other traditional models. It demonstrates the proposed method can enhance LSTM’s ability to predict temporal changes in methane concentration, offering a new research avenue for mine safety assurance.
1. Introduction
Methane is one of the key factors contributing to accidents in coal mining and is closely related to incidents such as methane asphyxiation, methane combustion, and methane explosions. Methane concentrations are highly dynamic and nonlinear time series data that vary over time and are influenced by various factors, including coal seam characteristics, mining methods, gas extraction techniques and airflow [1,2]. Fully understanding the temporal patterns of methane concentrations and accurately predicting methane levels are crucial for preventing accidents related to methane and ensuring safe production in coal mines [3,4].
The mainstream method for methane time series prediction uses the theoretical framework of deep learning, combining deep learning methods with the physical context and temporal characteristics of methane concentration changes and making appropriate modifications to predict future trends in methane concentrations. Both domestic and international scholars are among the first to employ statistical methods for methane concentration prediction. In [5], the authors employed long short-term memory (LSTM), leveraging its ability to capture long-term dependencies in time series to predict trends in methane concentrations. In [6], the authors employed a particle swarm optimization (PSO) algorithm to optimize LSTM hyperparameters, further improving the prediction accuracy of methane concentration changes. In [7], the authors employed an autoregressive integrated moving average (ARIMA)-LSTM model, combining linear and nonlinear methods to predict trends in methane concentrations. In [8], the authors employed variational mode decomposition (VMD) to overcome the effects of nonlinearity, improving overall prediction accuracy. In [9], the authors employed a gated recurrent unit (GRU) model, using a unique gating mechanism to capture the temporal relationships in the methane time series. In [10], the authors employed gray relational analysis (GRA) to screen for key inputs, achieving dimensionality reduction and improving the prediction accuracy of the backpropagation (BP) network for concentrations. In [11], the authors employed a multilayer perceptron (MLP) network and used a sufficient number of neurons to approximate the nonlinear temporal variations in methane. In [12], the authors employed the ensemble learning mechanism of random forests to average the prediction results from multiple trees, effectively reducing the instability of a single model. In [13], the authors improved the prediction accuracy of an LSTM by combining convolutional neural networks (CNN) with the LSTM.
The mainstream prediction methods mentioned above achieved good prediction results in the field of methane time series prediction. However, when predicting methane time series with complex nonlinearities, these models struggle to extract useful feature information, as evidenced by the following two shortcomings: First, raw methane concentration time series are often composed of coupled signals from multiple sources across different frequency domains, including random noise caused by environmental changes. The data features overlap in the time domain, and existing single network architectures lack effective signal decoupling methods. Consequently, they struggle to isolate intrinsic modal features beneficial for network learning from the raw data, making the models highly susceptible to interference from redundant information when extracting effective features. Second, hyperparameters such as the model learning rate and the number of hidden layer nodes are often manually set by prior experience. The method is poorly suited for the fluctuating characteristics of methane time series data changing over time, causing the network to get stuck in local optima during training. Consequently, the model’s predictive performance cannot be fully realized.
To address the first issue, the VMD method is employed to decompose the original time series data into K eigenmodes at different frequency scales. The method breaks down the original methane concentration time series signal into multiple relatively stationary modal components, significantly reducing the modeling complexity of subsequent models and minimizing the impact of nonlinearity on prediction accuracy. Compared to traditional methods such as empirical mode decomposition (EMD), the core advantage of VMD lies in its ability to effectively suppress modal aliasing. By establishing a rigorous variational optimization framework, VMD transforms the decomposition problem into a constrained variational problem, mathematically forcing each mode to be compactly distributed around its own center frequency, which eliminates frequency overlap at its root. The final reconstruction process involves summing the prediction results of these K modal components to recombine them into a complete prediction result. Compared to prediction without VMD processing, the resulting prediction exhibits phase and amplitude characteristics that closely match the true values.
To address the second issue, an optimization algorithm is employed to iteratively optimize the model’s hyperparameters within a specified search space. However, the algorithm can get stuck in local optima during optimization. To avoid local optima, improvements are made in three areas: initialization, iterative process, and optimization results. For initialization, a set of optimal points is used as the initial population, which distributes the population uniformly across the search space, enabling more effective exploration and improving optimization efficiency. In the iterative process, a phased optimization mechanism is employed to divide the search process into different phases according to the number of iterations, each phase using the most efficient search method, increasing the probability of finding the optimal value. For optimization results, a T distribution perturbation strategy using random sampling to determine the mutation magnitude is employed. These nonzero probability mutations enable the algorithm to escape local optima. The combined application of the three strategies enhances the algorithm’s optimization capability.
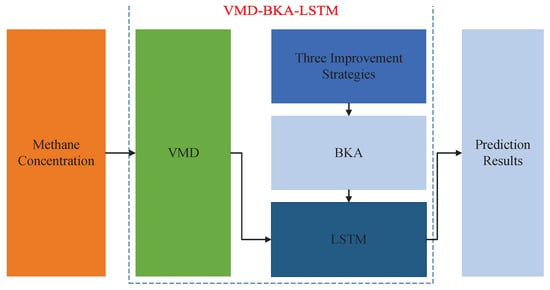
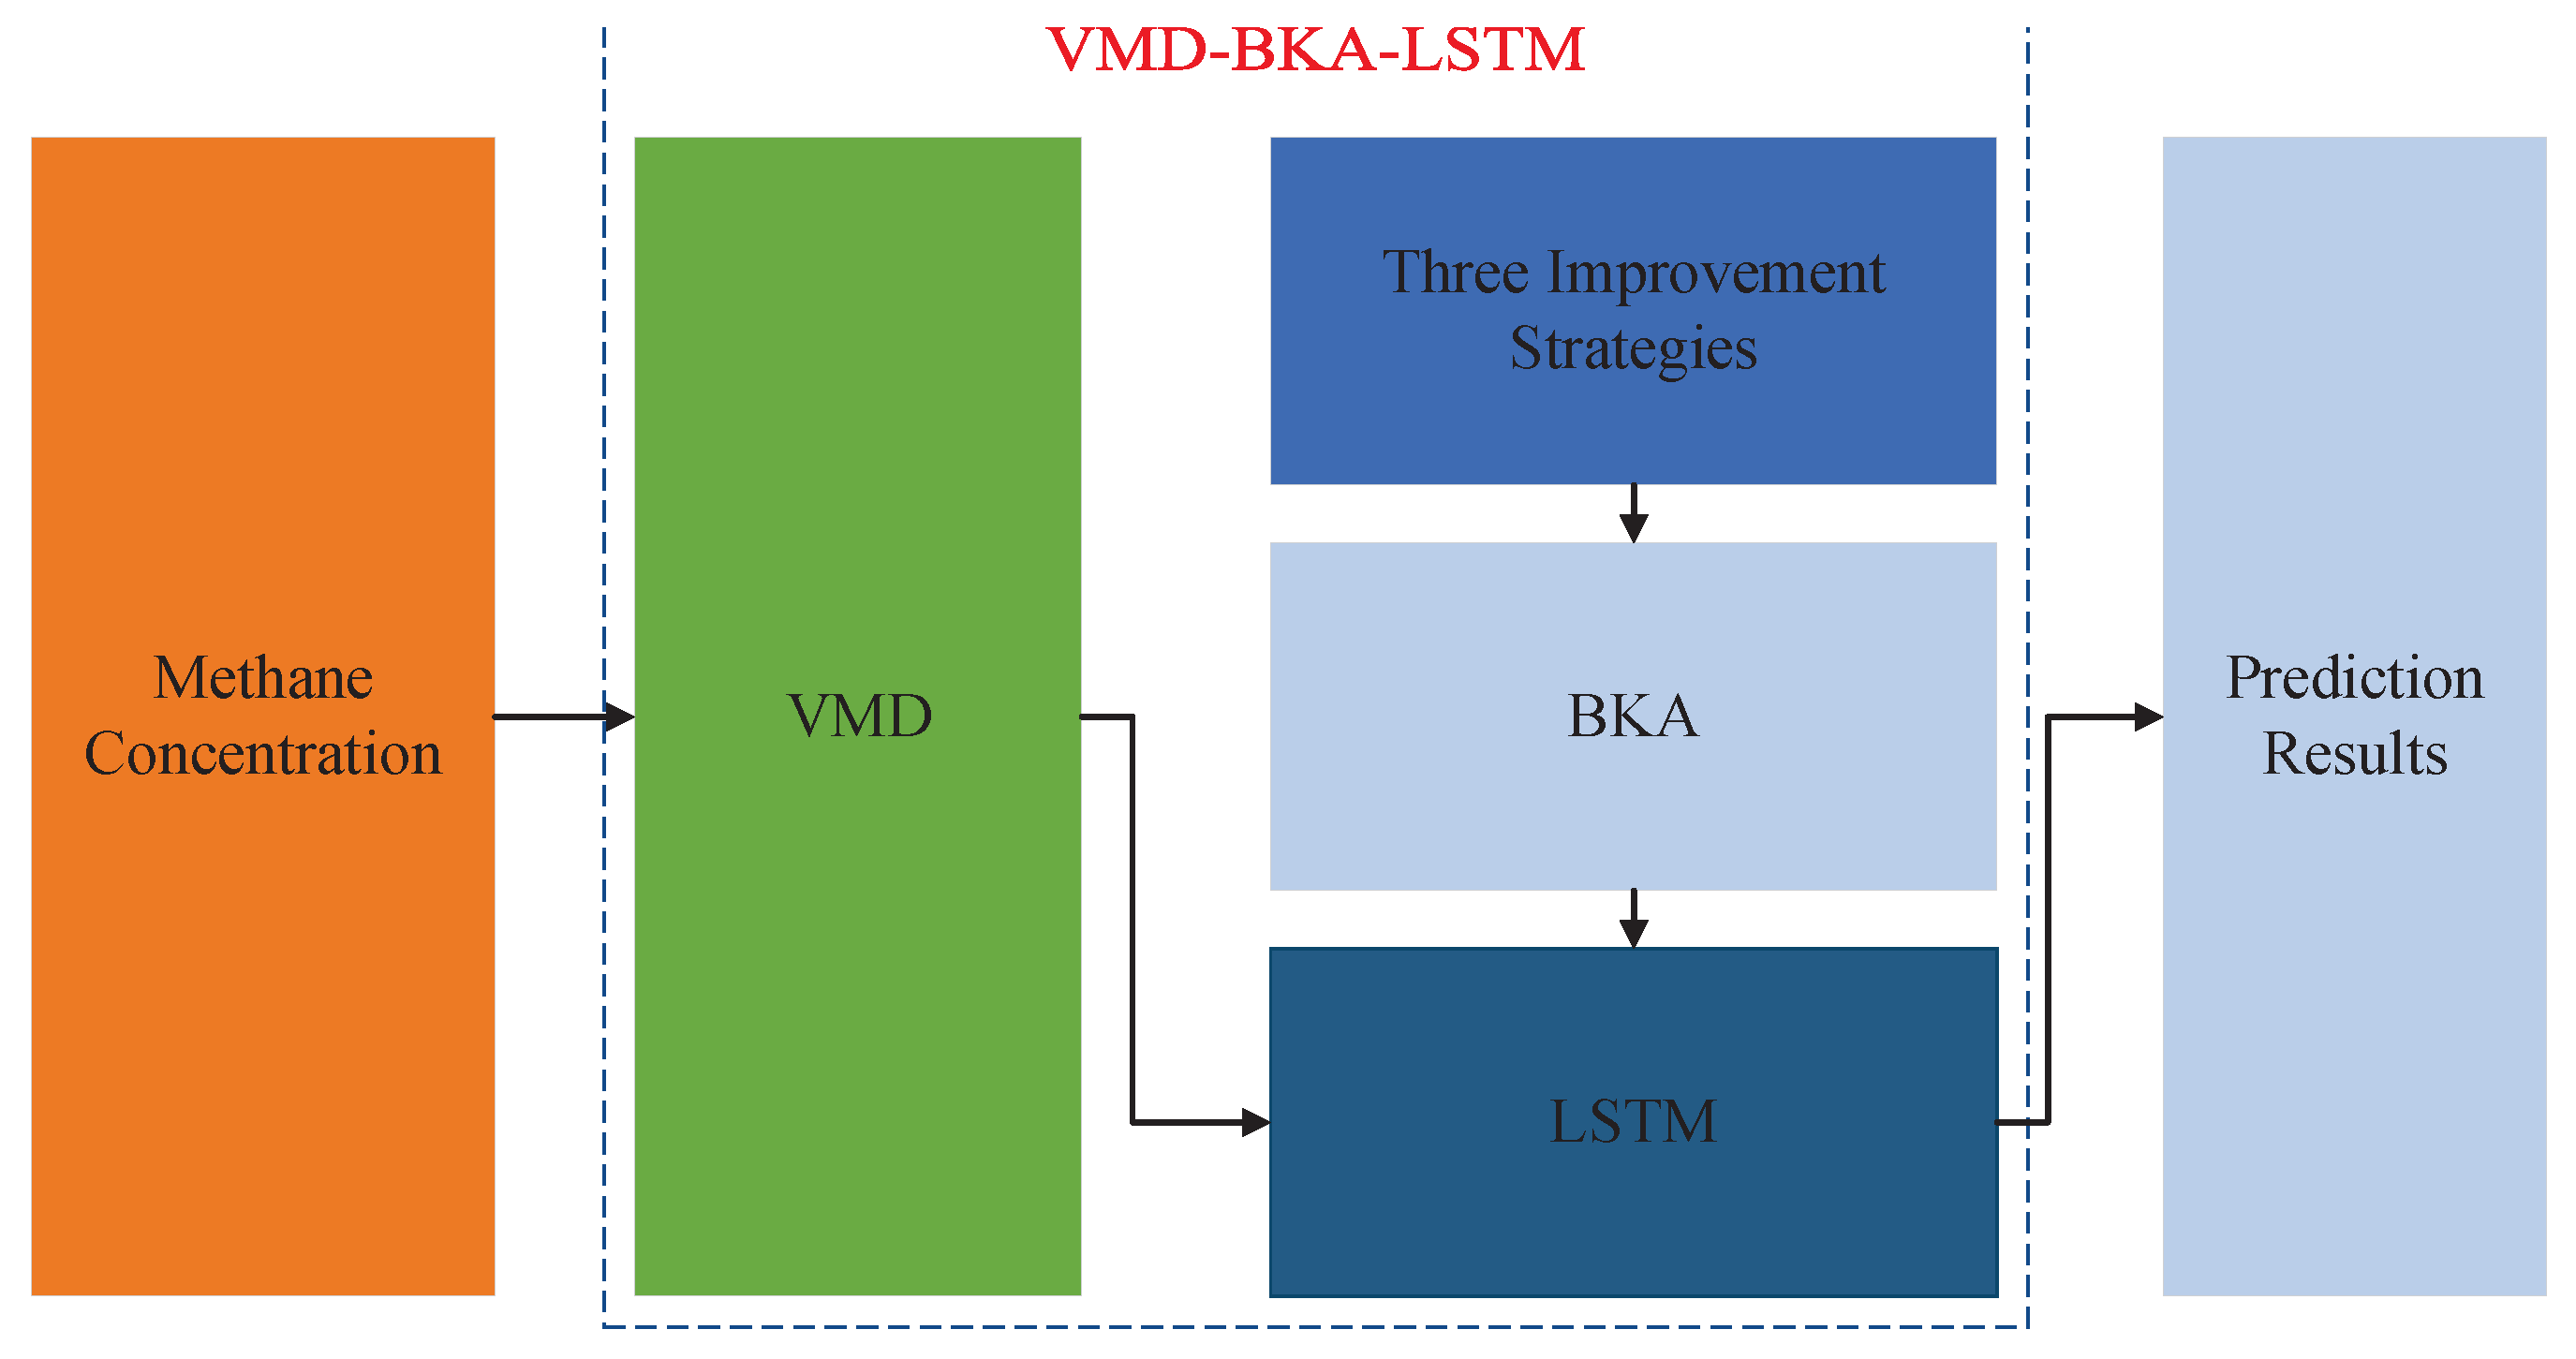
Overall, this paper addresses sequence preprocessing and improved optimization algorithms as two dimensions to collectively improve the accuracy of LSTM predictions for methane concentration sequences. First, in terms of sequence preprocessing, VMD is employed to transform complex, nonlinear sequences into multiple stationary components, significantly simplifying the model’s task of fitting the original sequences and laying the data foundation for improved prediction accuracy. Second, in terms of optimization improvements, the black kite algorithm (BKA) population is initialized using an optimal point set to expand the coverage of the search space, a phased optimization mechanism is employed to avoid early local optima traps, and a T distribution perturbation strategy is introduced to select optimal results. The combination of the three methods significantly improves BKA’s capabilities for global search and local exploration in LSTM hyperparameter tuning. The overall prediction process is shown in Figure 1.
Figure 1.
Prediction process.
Finally, simulation experiments using four different locations of methane concentration variations show that, taking the simulation results at Location 1 as an example, the root mean square error (RMSE) of the VMD-BKA-LSTM is reduced by more than and compared to the VMD-LSTM and LSTM, respectively, and also shows a significant reduction in RMSE compared to other traditional algorithms. The results demonstrate that reducing sequence complexity and selecting appropriate hyperparameters can significantly improve the model’s predictive capability.
This paper is organized as follows. Section 2 introduces the experimental data sources and prediction models. Section 3 enhances LSTM hyperparameter optimization by incorporating improved BKA strategies. Section 4 reduces raw methane data complexity using VMD, improving the LSTM prediction accuracy. Section 5 validates the proposed method using error metrics between the predicted and actual values. Section 6 systematically summarizes the work.
2. Data Foundation and Prediction Model
2.1. Data Foundation
The data in this paper are collected from methane sensors at four different mining locations in a coal mine in China. Sensor performance varies depending on the sampling environment. This paper uses an infrared methane sensor to collect concentration data. The sensors are independent. During data collection, provided that the sensors function properly, ventilation remains stable, and safety conditions permit, data collection should cover typical operating conditions such as normal production, maintenance, and ventilation adjustments. Data should be collected once every minute for a total of three hours. Missing data should be interpolated using linear interpolation to avoid any impact on the predictions caused by data loss.
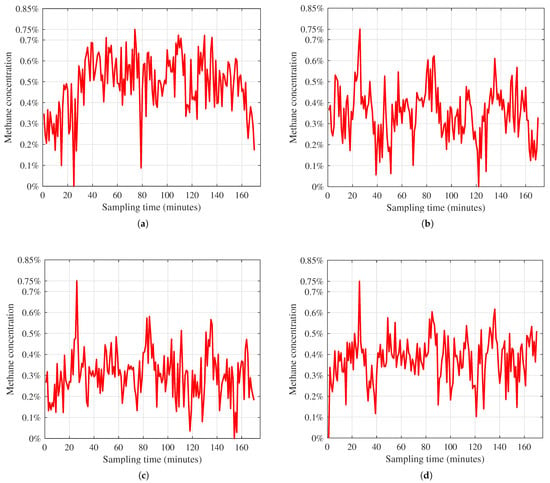
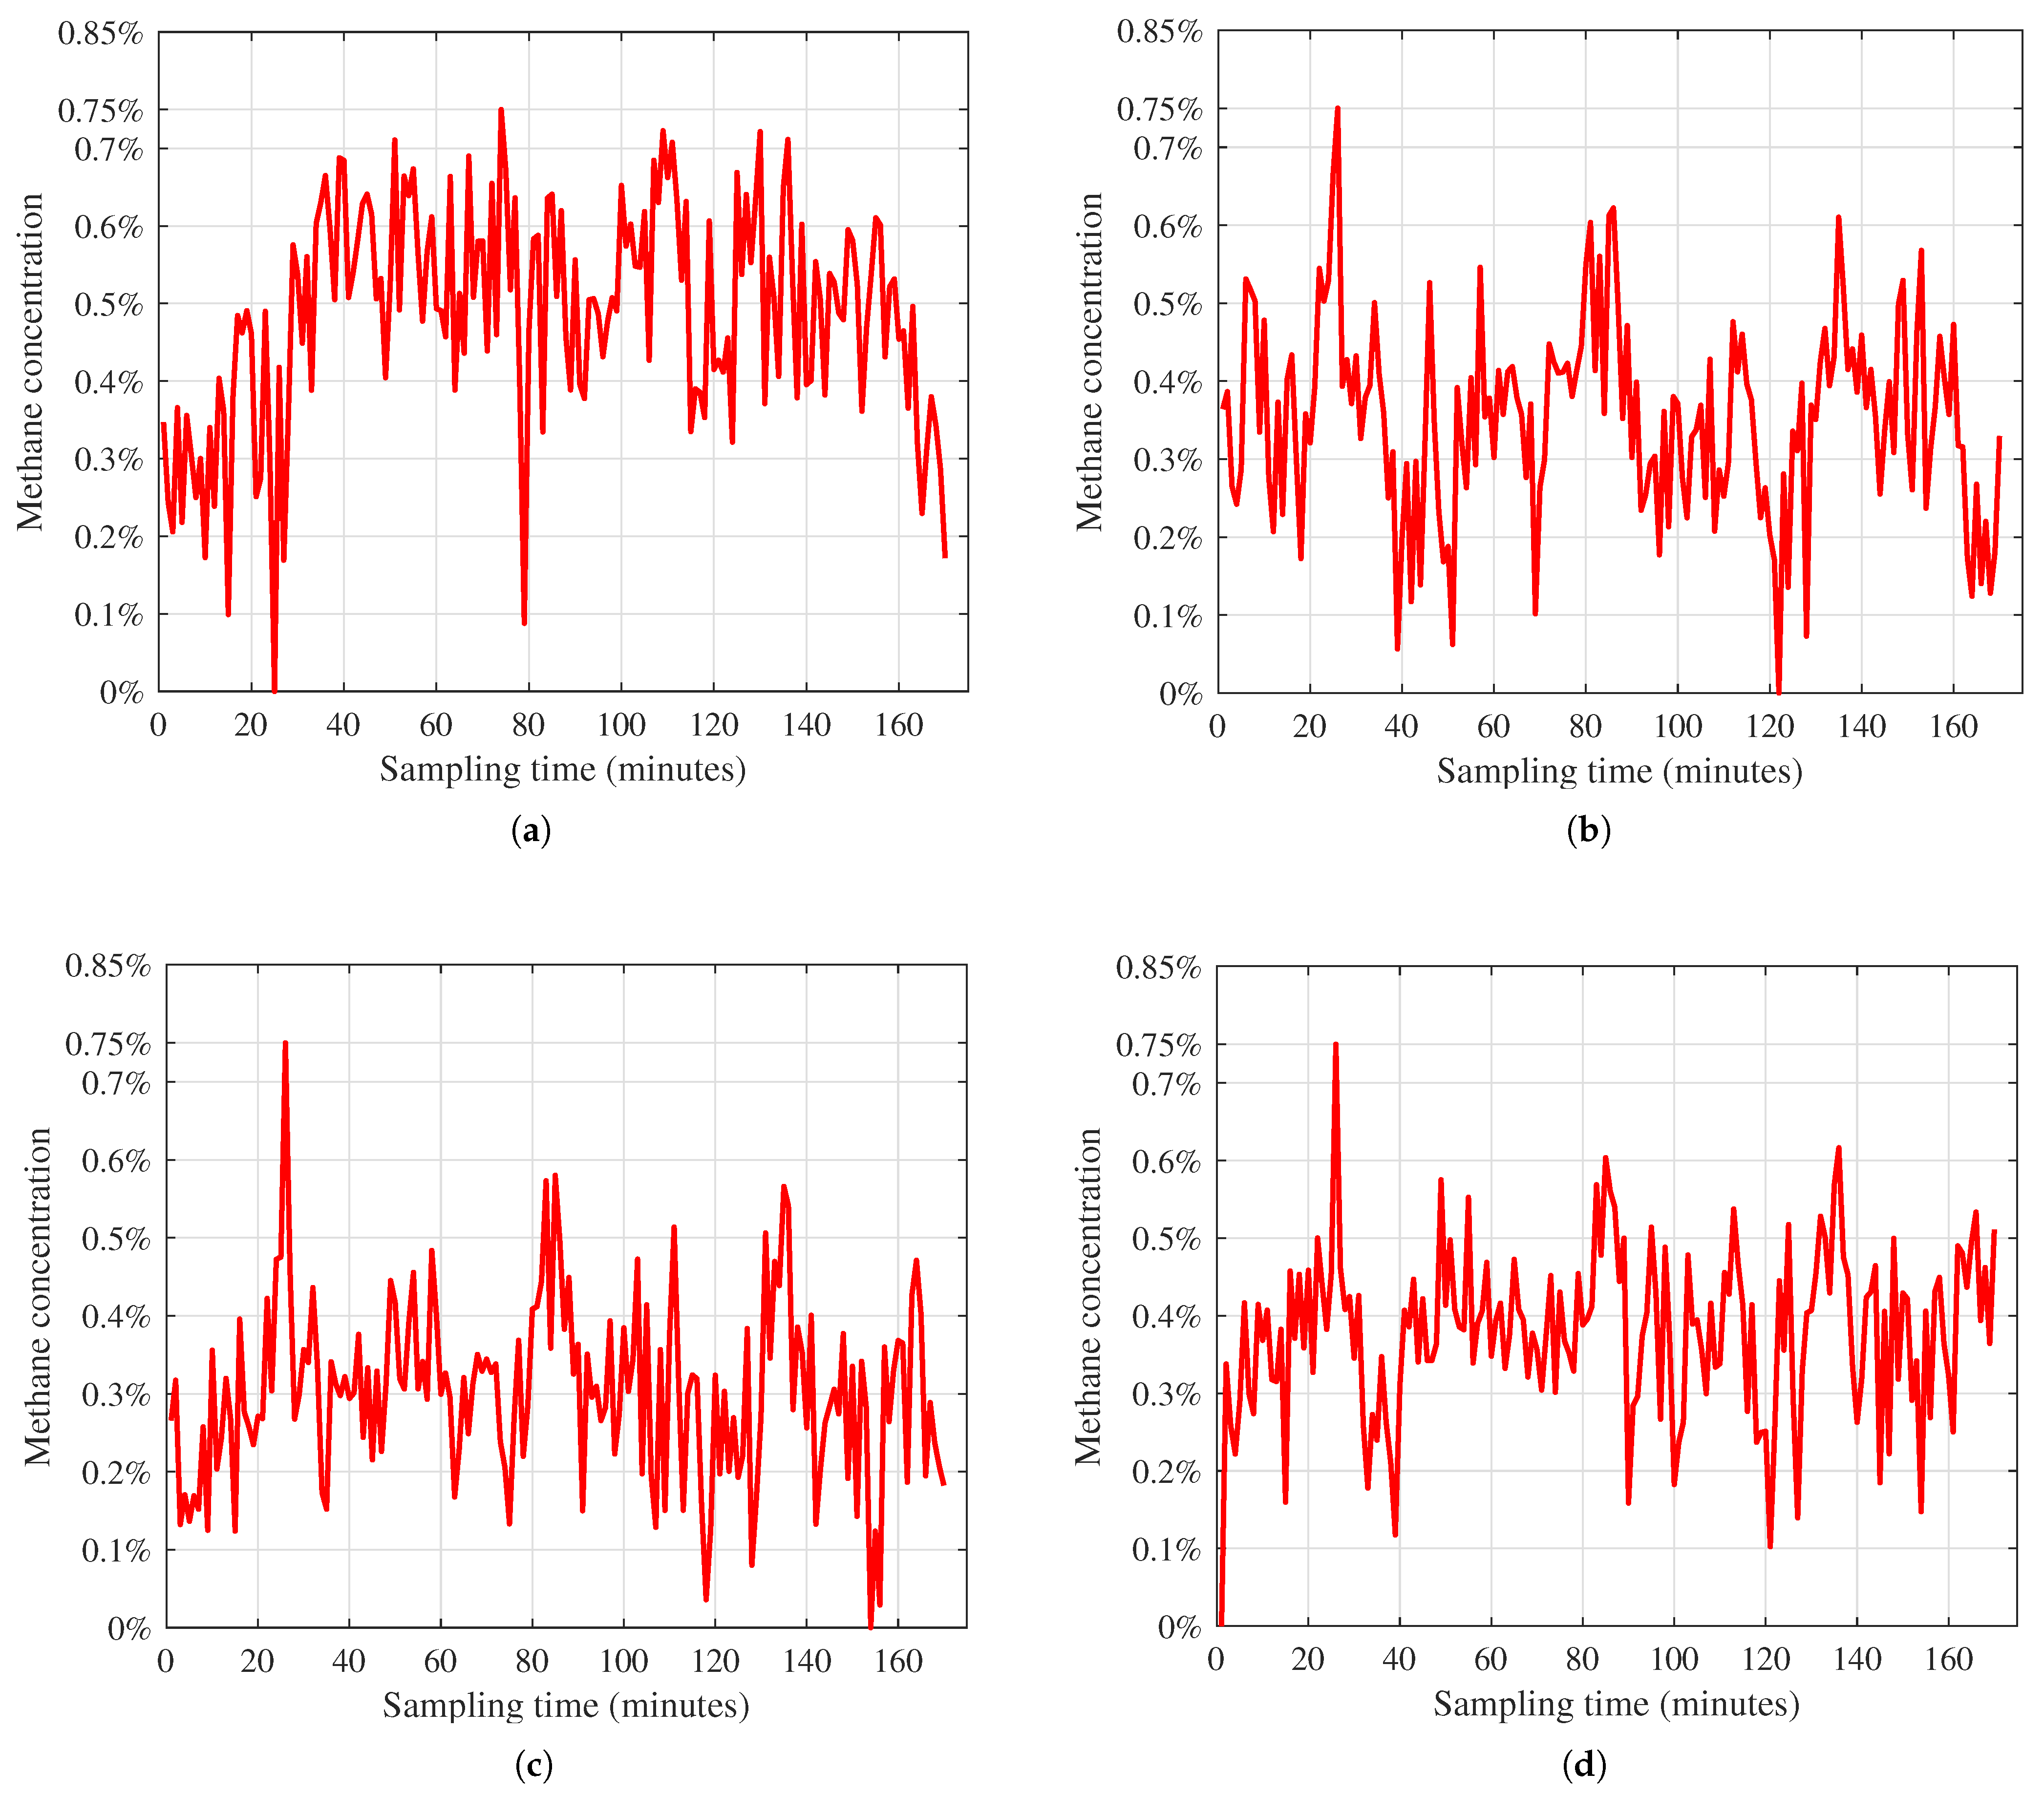
The changes in methane concentration are shown in Figure 2.
Figure 2.
Trends in methane concentrations at four different locations. (a) shows changes in methane concentration at location 1; (b) shows changes in methane concentration at location 2; (c) shows changes in methane concentration at location 3; (d) shows changes in methane concentration at location 4.
Figure 2 shows nonstationary, nonlinear, and multi-scale fluctuations. Such fluctuations arise because methane exists in coal seams and escapes when mining disturbs the original stress and pressure equilibrium. The release rate depends on coal breakage intensity, such as blasting, shearer cutting, and coal fall, together with ventilation, atmospheric pressure, and gas drainage. The concentration series therefore responds to measurable exogenous mining processes [14,15]. From a single concentration record, the exogenous drivers remain unobserved, and their effects mix with noise and multi-source coupling. The apparent irregularity reflects missing exogenous information and nonstationary operating conditions rather than the absence of underlying structure. Due to data collection limitations, the present study is limited to univariate prediction. The combined effects of the multiple factors cause dramatic, erratic changes in methane concentration at any given location over time, making it difficult to predict using simple linear models.
To accurately predict the temporal variations in methane, this paper employs the unique gating mechanism of LSTM and its ability to efficiently capture dependencies among time series data to predict methane time series.
2.2. Prediction Model
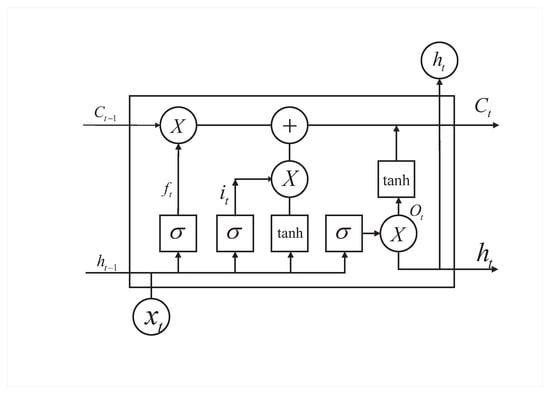
The entire LSTM architecture is shown in Figure 3. In the LSTM model, each cell contains three gates: the forget gate, the input gate, and the output gate [16,17]. The unique model architecture can effectively learn and memorize long-term dependencies in time series.
Figure 3.
LSTM model architecture.
The forget gate is as follows:
where is the activation function of the forget gate, is the bias vector of the forget gate, is the weight matrix of the forget gate, t is the number of iterations, is the input, and is the output value from the previous time step. The update input gate is as follows:
where and are the weight matrices, and are the bias vectors, and tanh are the activation functions.
The memory state is updated as follows:
where is the memory unit at time, ⊙ is the dot product.
The updated output gate is as follows:
where and are the output gate weight matrix and the bias vector, and is the output of the model.
Equations (1) through (6) describe the forward propagation process of the LSTM. Backpropagation is performed using the error between predicted and actual values to continuously update the weight parameters of the LSTM until the maximum number of iterations is reached, allowing the predicted output of the LSTM model to gradually converge to the actual value. Backpropagation is as follows:
where is the learning rate, is the weight parameter, R is the regularization coefficient, H is the number of nodes in the hidden layer, and J is the loss function. is the L2 regularization coefficient.
3. Improvements to the BKA
3.1. BKA Iteration Rules
During mining, methane concentration exhibits nonstationary fluctuations driven by geological conditions, mining disturbances, atmospheric environment, and ventilation status. These drivers are not fully observed in a single concentration record, so the series appears irregular and complex. Network parameters derived from empirical methods are insufficient for effective LSTM training.
The traditional method for hyperparameter selection employs optimization algorithms to iteratively search for the optimal hyperparameters within a specified search space. However, the process is prone to converging at local optima. To overcome this issue, various improvement strategies need to be incorporated into the optimization algorithm.
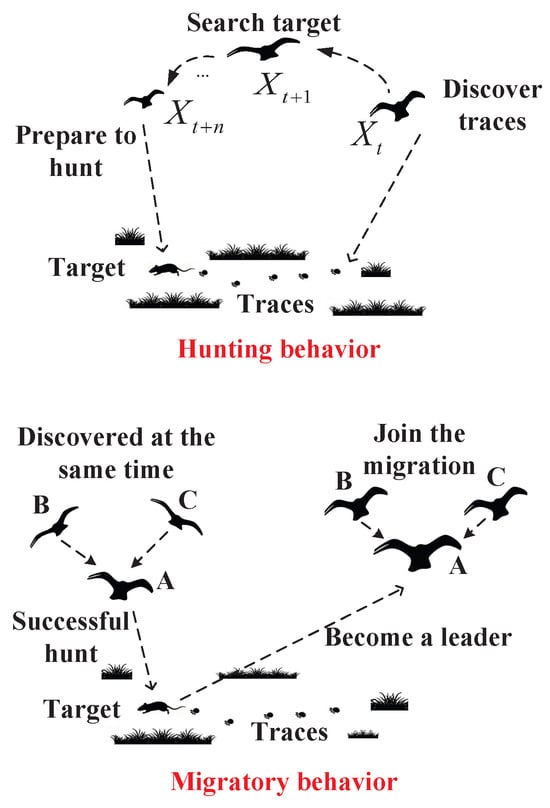
The BKA is a metaheuristic search algorithm inspired by the hunting and migration behaviors of black kites [18,19]. The black kite’s hunting behavior is aimed at securing better survival resources in its current environment and serves to select promising leaders from within the population. Hunting and migration behavior are shown in Figure 4.
Figure 4.
Hunting and migratory behavior.
Figure 4 shows the hunting process of the black kite, helping readers understand the logic behind the BKA optimization. The kite detects target traces at time t. It searches for the target along the traces at time . It locates the target and completes the hunt at time . Times t and correspond to the BKA’s iterative process, while time represents the optimal result of each iteration.
The hunting iteration pattern is as follows:
where and are the positions of the t-th black kite in the J-th dimension and at the -th iteration step, r is a random number between 0 and 1, p is a constant equal to 0.9, T is the total number of iterations, t is the current iteration number, and n decreases as t increases.
Black kites migrate in response to environmental changes in order to secure better living conditions [20,21]. Migratory behavior serves to select the best leaders for the population.
Figure 4 shows that after black kite A successfully hunts a target, black kite B and C follow it to obtain food resources. In BKA, obtaining an optimal result in the first iteration causes subsequent iterations to revolve around that initial optimal result, easily leading to a local optimum as the final result. Improvement 3 in this paper is designed to prevent such local optima.
The migratory iteration pattern is as follows:
where is the leading scorer among the black kites in the j-th dimension at the t-th iteration to date, is the current position of any black kite in the j-th dimension at the t-th iteration, is the fitness value of any black kite at a random position in the j-th dimension at the t-th iteration, is Cauchy mutation, and m is a random number between −1 and 1. The entire algorithm flow is shown in Appendix A.
3.2. Improvement 1: Optimal Point Set Initialization
Let be a search region in a space of dimension s. If , then the optimal point set is as follows:
where is the fractional part, n is the number of points, and is the optimal point (p is the smallest prime number satisfying ). The mapping to the search space is as follows:
where and are the upper and lower bounds of the dimension j. The traditional method of initializing the population is as follows:
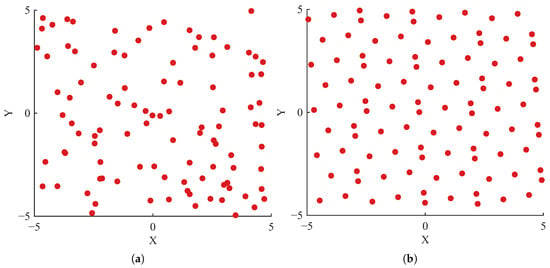
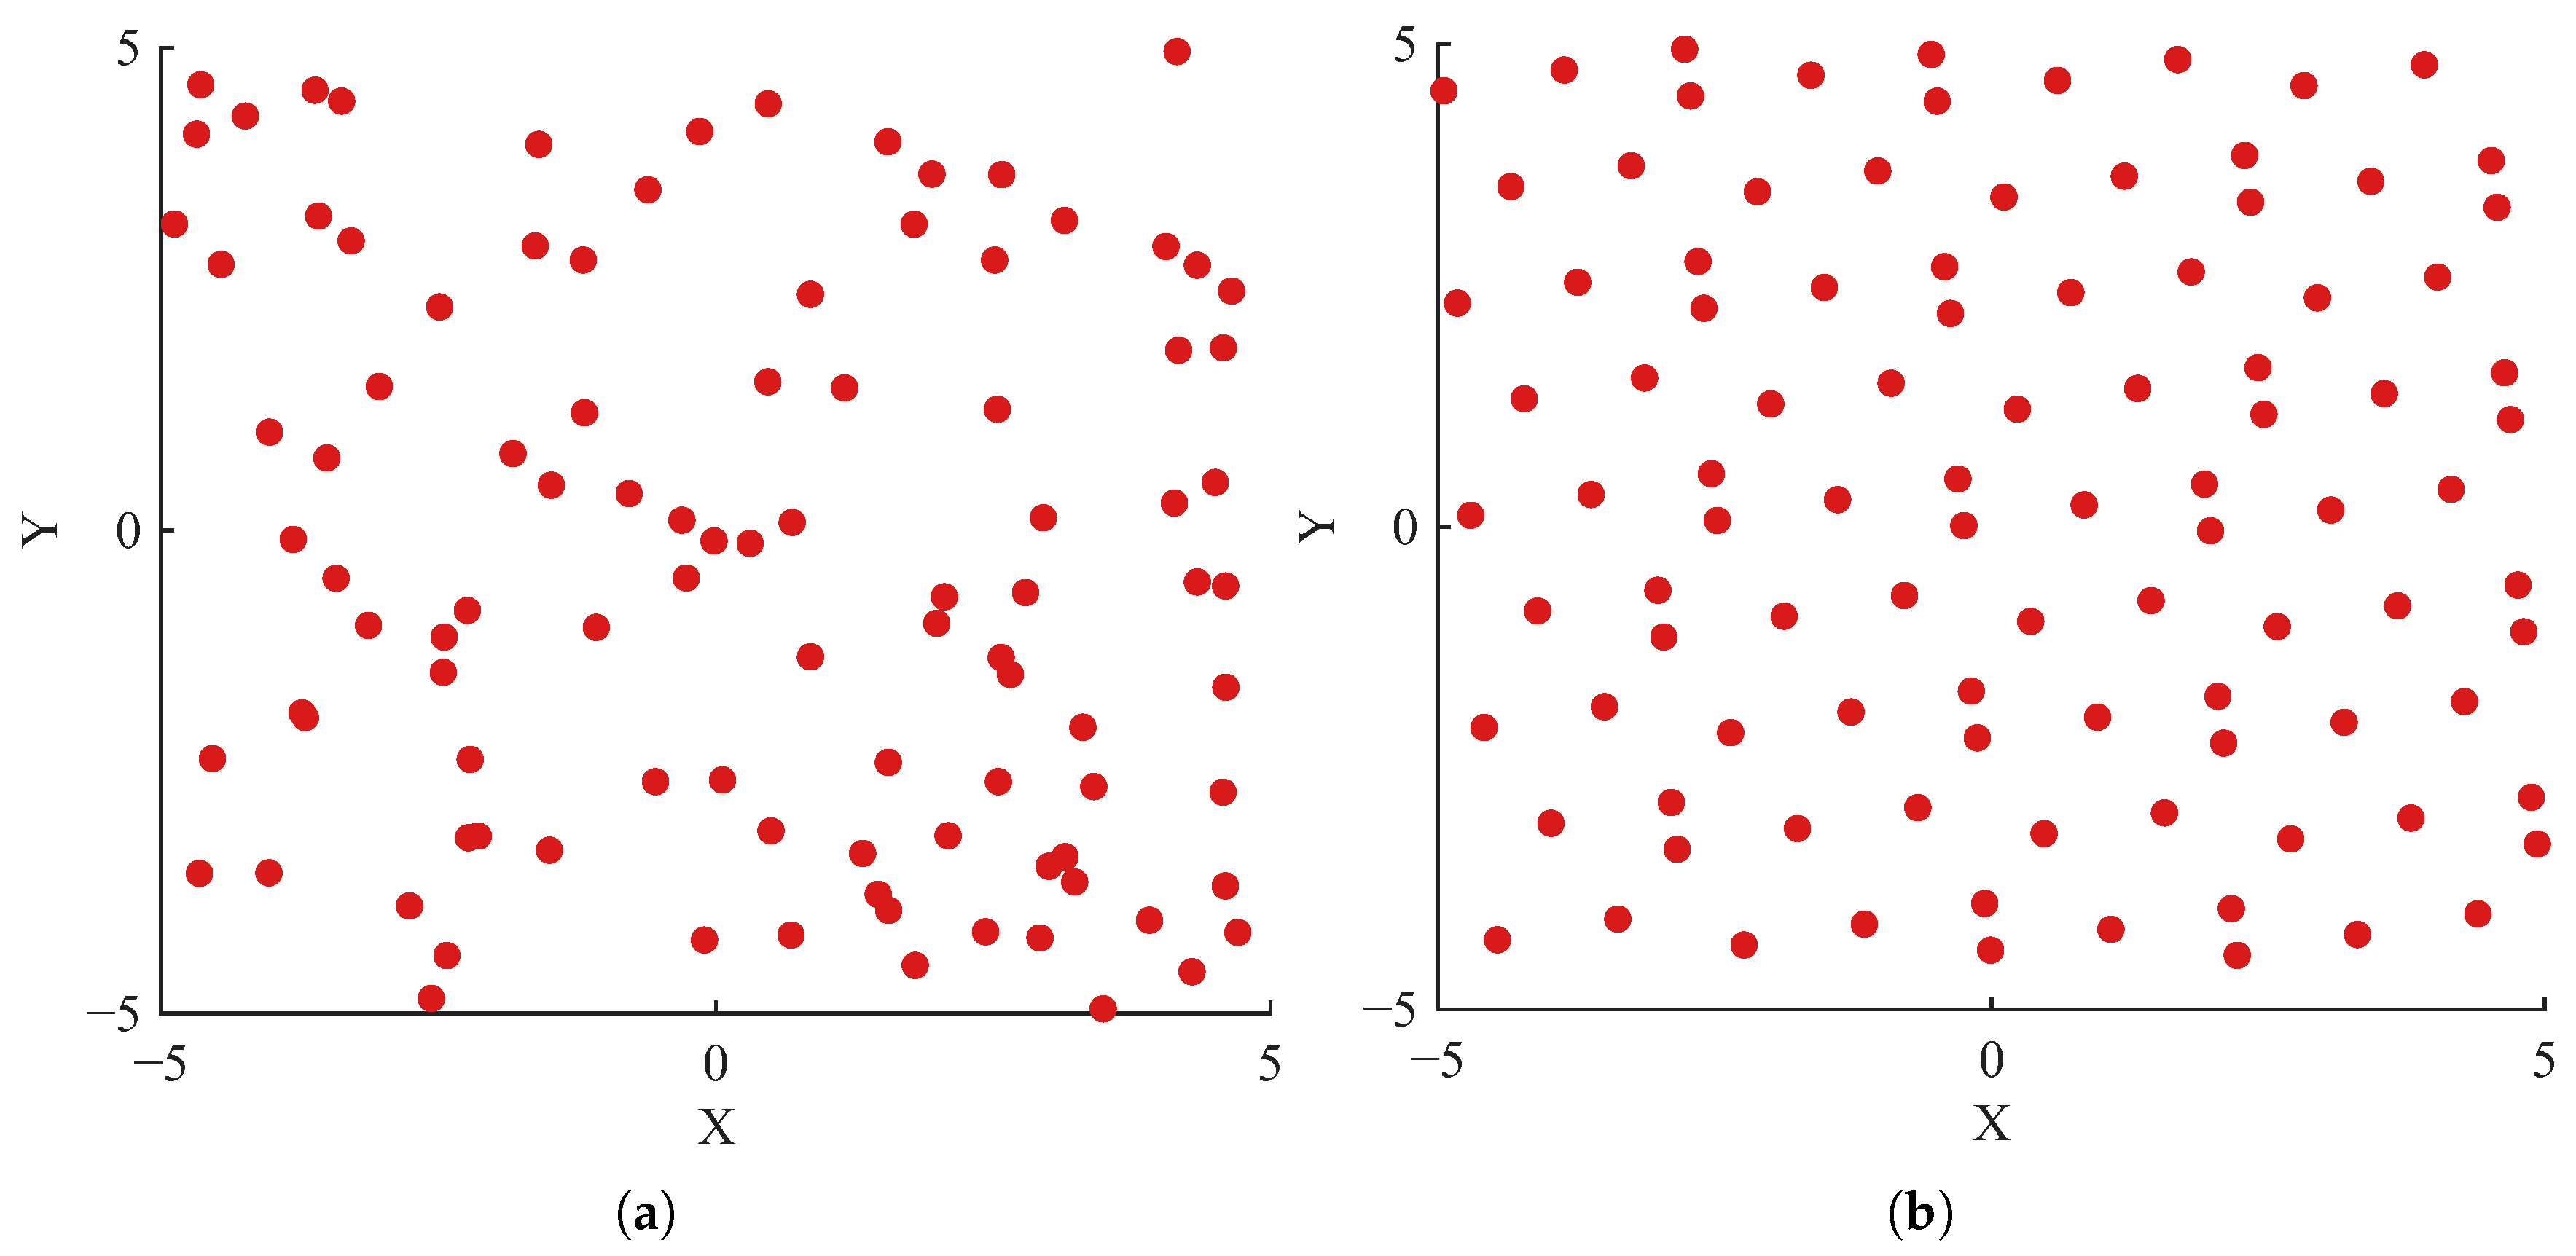
The learning rate, the number of nodes in the hidden layer, and the regularization coefficient are the optimization parameters. With 100 samples, the population distributions of the two initialization algorithms in a two dimensional space are shown in Figure 5.
Figure 5.
Comparison of initialization before and after improvement. (a) shows the results of traditional initialization; (b) shows the results of optimal point set initialization.
Using the optimal point set strategy can optimize the distribution of the initial population, making it more evenly distributed across the search space and enabling more efficient exploration.
3.3. Improvement 2: Phased Optimization
During the BKA iterative optimization process, individuals in the population gradually converge toward an optimal individual in search of corresponding food resources, avoiding migration to more distant locations that could result in missing high-quality food sources. In this case, it is necessary to enhance the algorithm’s ability to optimize locally to achieve a balance between global and local optimization and prevent the search results from becoming local optima.
The proposed phased optimization mechanism divides the iterative process of the BKA optimization algorithm into three phases: , and .
To enhance the global search capability of the BKA algorithm, a difference operation is performed between the positions of any two individuals in phase , using a method that rapidly generates new candidate solutions. Rather than clustering around a single individual, the two individuals move closer to each other, allowing the search path to proceed in multiple directions. The method is as follows:
where and are two random numbers greater than 0 and less than the population size, and is a random scaling factor in the interval . In Phase , the BKA implements the search method described in Equations (9) and (10), grouping individuals in the population in pairs and moving them toward the optimal position, achieving a balance between global and local search.
3.4. Improvement 3: T-Distribution Perturbation
To overcome the problem of the algorithm becoming trapped in local optima during the later stages of iteration, a mutation mechanism is added to BKA during phase to adjust the positions of the individuals. The theoretical optimal value is implied to be already in the vicinity of the search results. The method is as follows:
where is a T distribution with the number of iterations as its degree of freedom. In the early stages of BKA iteration, the T distribution resembles a Cauchy distribution, which gives BKA strong global search capabilities. In the later stages of iteration, the T distribution resembles a variant of the Gaussian distribution, which helps the algorithm achieve better local search capabilities. To verify the improvement in BKA’s optimization performance resulting from the enhanced strategy, tests are conducted using the CEC2022 function set [22,23]. Due to space constraints, this paper selects three test functions for the experiments. This paper uses convergence error in place of convergence curves. The theoretical value represents the error between the convergence value and the actual optimal value. A smaller convergence value indicates higher accuracy. This paper sets the sample size to 30 and the number of iterations to 100. The test results are shown in Table 1.
Table 1.
Test results.
Test results indicate the aforementioned improvement strategies help BKA escape local optima and accelerate the optimization algorithm’s convergence. Although the optimization algorithm can improve the prediction accuracy of LSTM, it cannot resolve the modal aliasing issue caused by the nonstationarity of methane concentration time series data. To reduce the inherent uncertainty in prediction, it is necessary to preprocess the methane concentration time series data by employing the adaptive decomposition and denoising ability of VMD. In recent years, several improved versions of the BKA algorithm have emerged. However, these variants have primarily been validated using benchmark functions and have not yet been systematically adapted to meet the specific requirements of multicomponent time series forecasting in safety-critical fields such as coal mine gas monitoring. It is worth further emphasizing that the contribution of this study lies not in proposing any single, entirely new BKA operator, but rather in integrating these strategies based on a problem-driven approach. Unlike benchmark-oriented BKA variants, the optimization problem in this study involves K independent IMF components, each of which requires its own LSTM hyperparameter configuration and exhibits different levels of adaptability. Additionally, this study validates the method using real methane concentration data from four mining areas. This is precisely what distinguishes this study from other approaches.
4. Variational Mode Decomposition
VMD is a fully nonrecursive decomposition model that employs an adaptive variational method to estimate the corresponding modes while simultaneously determining the relevant frequency bands, balancing the errors among them [24,25]. VMD can also effectively reduce the nonstationarity of nonlinear time series.
(1) Formulation and Solution of the Variational Problem.
The problem is formulated such that the sum of the decomposed modal components equals the original concentration time series. The process is as follows:
where k is the number of decompositions, is the k-th mode, is the central frequency corresponding to the k-th mode, ∗ is the convolution operation, is the original methane concentration and is the gradient operation.
(2) Solving Constrained Variational Problems.
To solve Equation (16), the constrained variational problem is transformed into an unconstrained variational problem by introducing a parameter. The process is as follows:
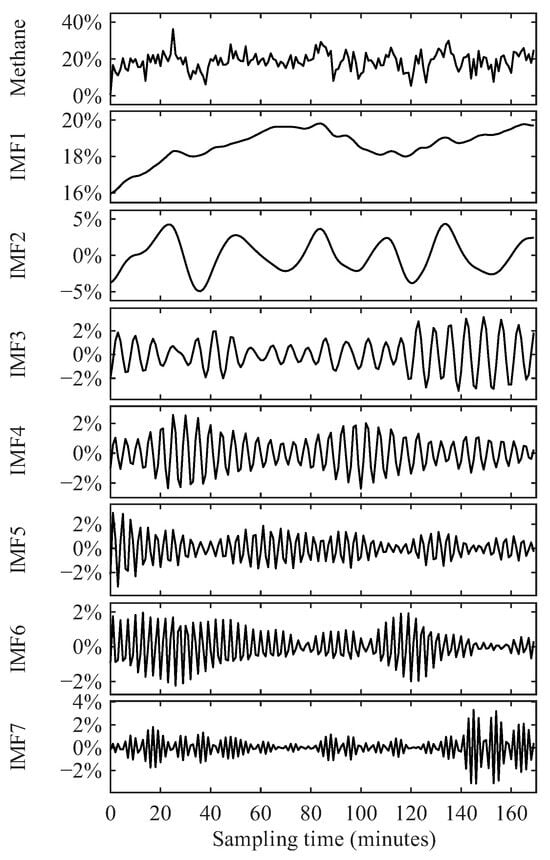
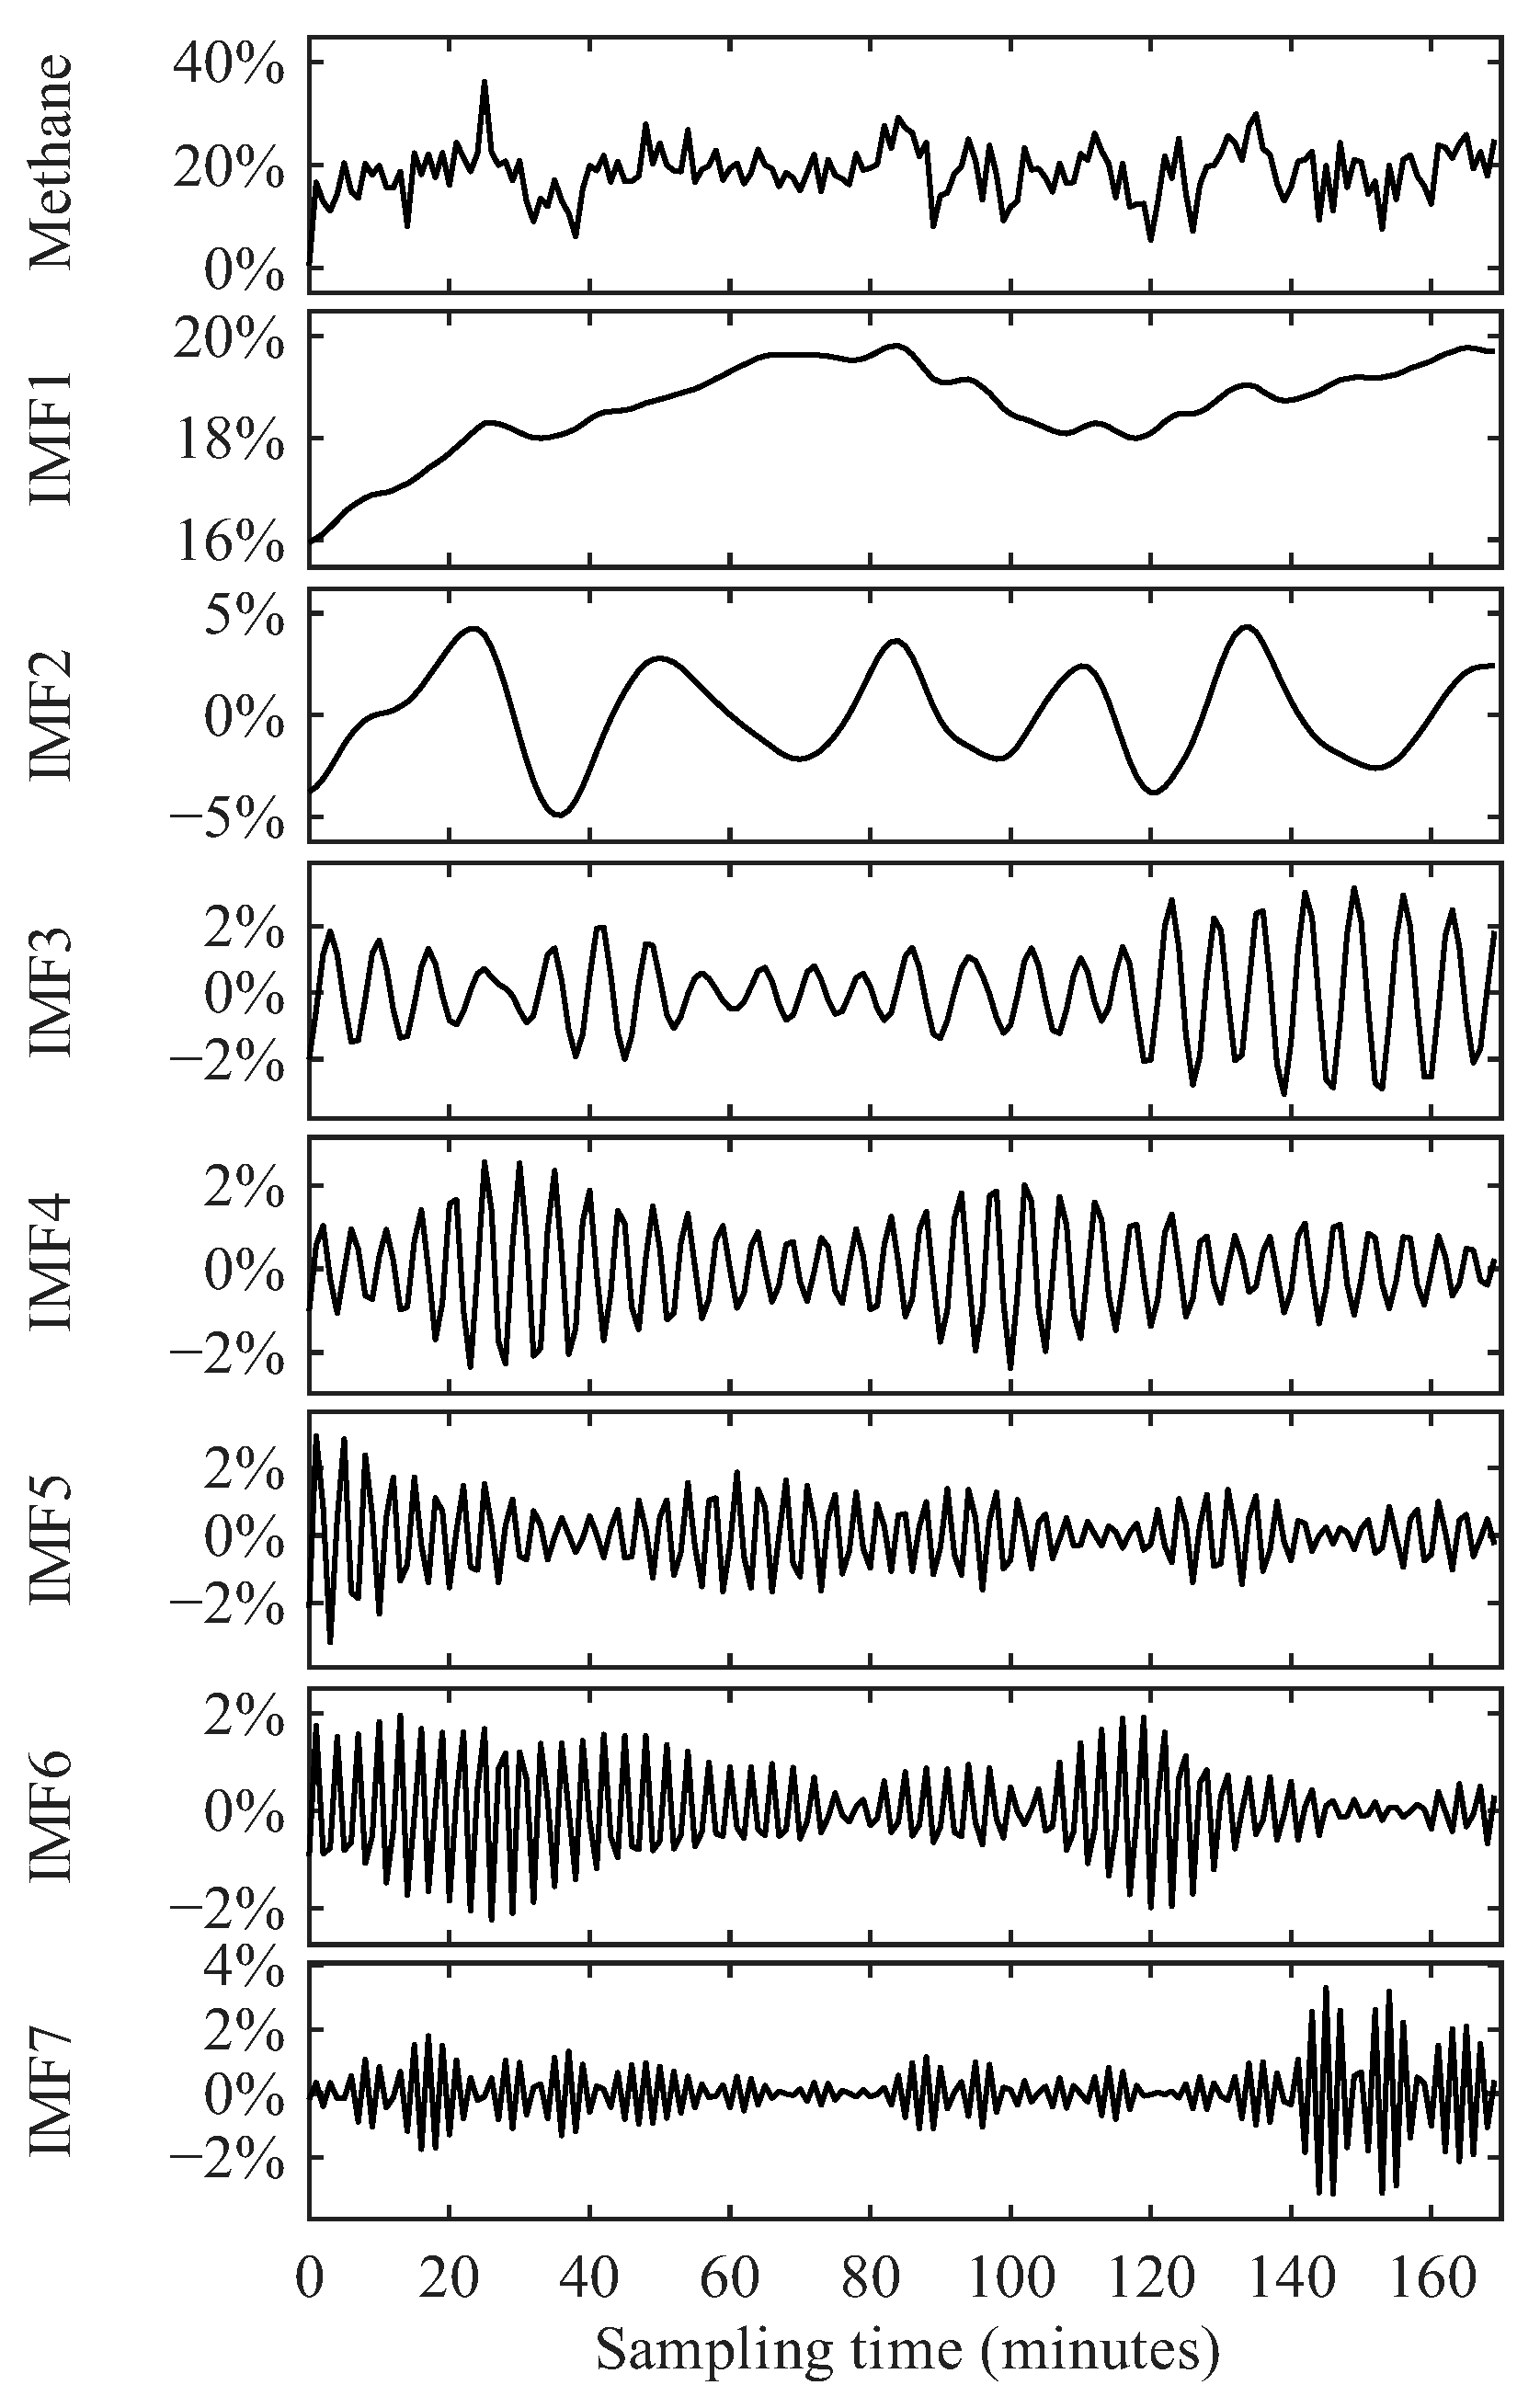
where is the penalty term, is the Lagrangian operator. After VMD decomposition, the randomly varying methane concentration time series is decomposed into multiple modal components that reflect local fluctuation trends. The methane concentration analysis results at location 1 are presented as an example in Figure 6.
Figure 6.
VMD decomposition results.
Among the modes obtained after VMD decomposition, the low-frequency signal intrinsic mode function 1 (IMF1) reflects the overall trend in the original concentration sequence, while the high-frequency signal IMF7 reflects the local fluctuations in the original concentration sequence. Each decomposed mode retains the characteristics of the original concentration sequence while effectively suppressing modal aliasing. The VMD decomposition effectively extracts the different characteristic components of the original sequence, providing valuable information for future analysis and applications. VMD is a global, non-causal transformation that relies on the entire sequence during decomposition. Therefore, this paper proposes an offline prediction method that avoids the data leakage issue associated with online prediction.
5. Experimental Results
The proposed method is evaluated by computing the mean absolute error (MAE), RMSE, and mean absolute percentage error (MAPE) between VMD-BKA-LSTM predictions and the true values, and by comparing the results with outputs from alternative models. The three error metrics are calculated as follows:
where m is the number of samples in the training set, n is the total number of sampling points in the methane concentration sequence, is the predicted value, and is the true value of the methane concentration.
The hyperparameters of the LSTM are optimized using the improved BKA method to make it suitable for methane concentration time series from four different locations. The first of the data in each set of methane sequences are used as the training set, and the remaining as the test set. During network training, the data from the first 10 min are used as input samples, and the input window is shifted in 1-step increments to predict concentration changes from the 11th to the 170th minute. Equations (7) through (8) describe the model weight update process. Hyperparameter optimization applies only to the training set and does not involve the test set. When splitting the dataset, the data is divided by time. The raw methane concentration time series is strictly divided by time; the data is not randomized. The test set is never included in the hyperparameter optimization process. In time series prediction projects, it is unnecessary to prove that parameter optimization uses only the training set. It suffices to ensure that dataset partitions follow chronological order. Different datasets yield different parameters, so only optimization results from time-series datasets are relevant. The optimized parameter results are shown in Table 2, Table 3, Table 4 and Table 5.
Table 2.
Optimal LSTM hyperparameters for the sequence at location 1.
Table 3.
Optimal LSTM hyperparameters for the sequence at location 2.
Table 4.
Optimal LSTM hyperparameters for the sequence at location 3.
Table 5.
Optimal LSTM hyperparameters for the sequence at location 4.
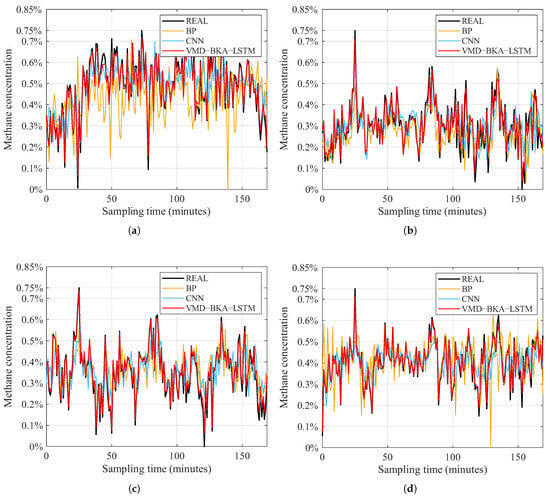
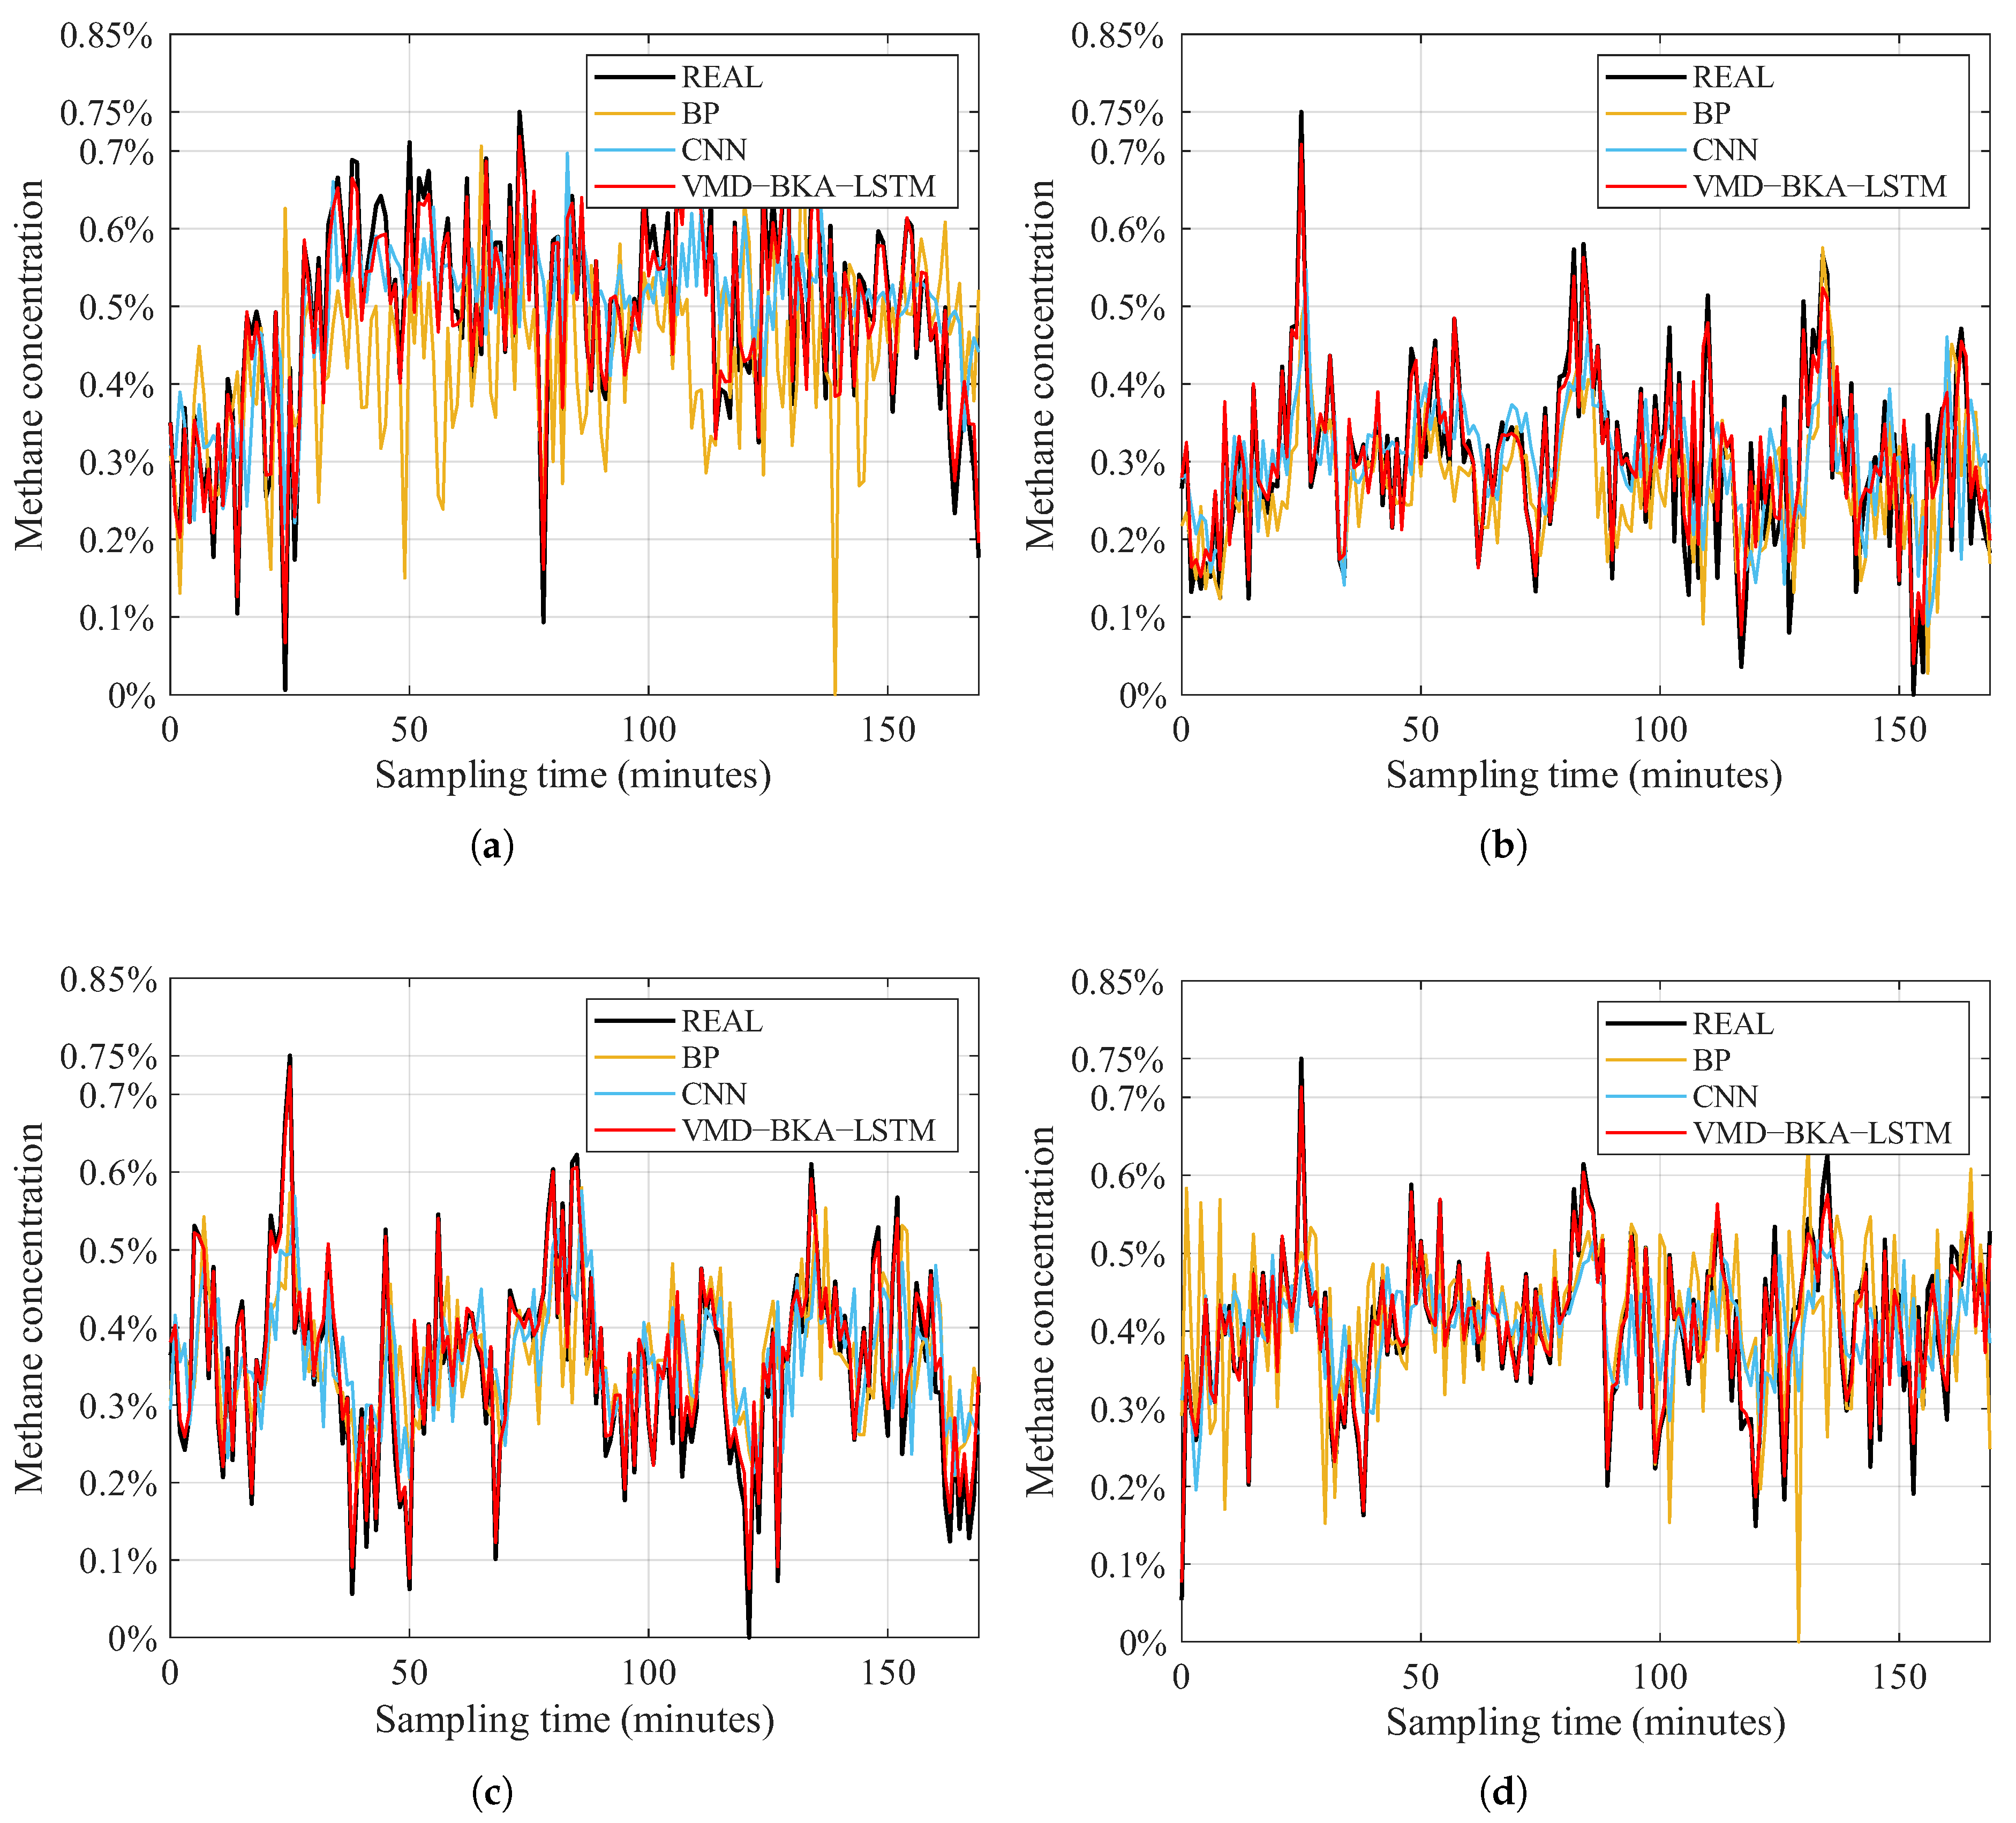
The optimal hyperparameters identified above are used to train an LSTM model for each set of methane time series and to make predictions. The prediction results are shown in Figure 7. It shows the prediction performance of traditional BP, LSTM, and CNN for methane concentration time series. The results indicate that traditional models can predict the trend but exhibit a noticeable lag and inferior prediction accuracy compared with the VMD-BKA-LSTM model. The value on the coordinate axis is merely a scale mark and not a regulatory threshold. It carries no special significance.
Figure 7.
Prediction results from the traditional model. (a) shows the prediction results of the traditional model at location 1; (b) shows the prediction results of the traditional model at location 2; (c) shows the prediction results of the traditional model at location 3; (d) shows the prediction results of the traditional model at location 4.
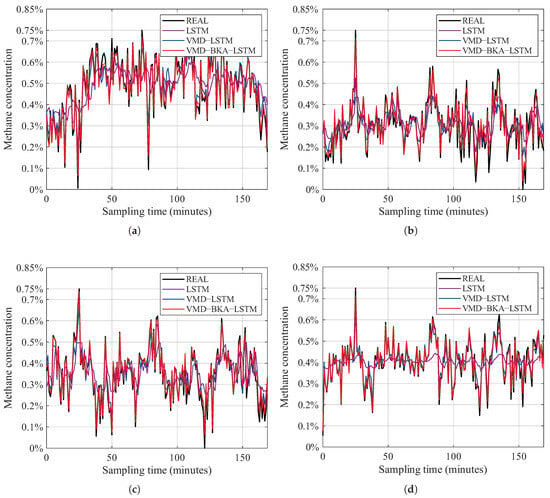
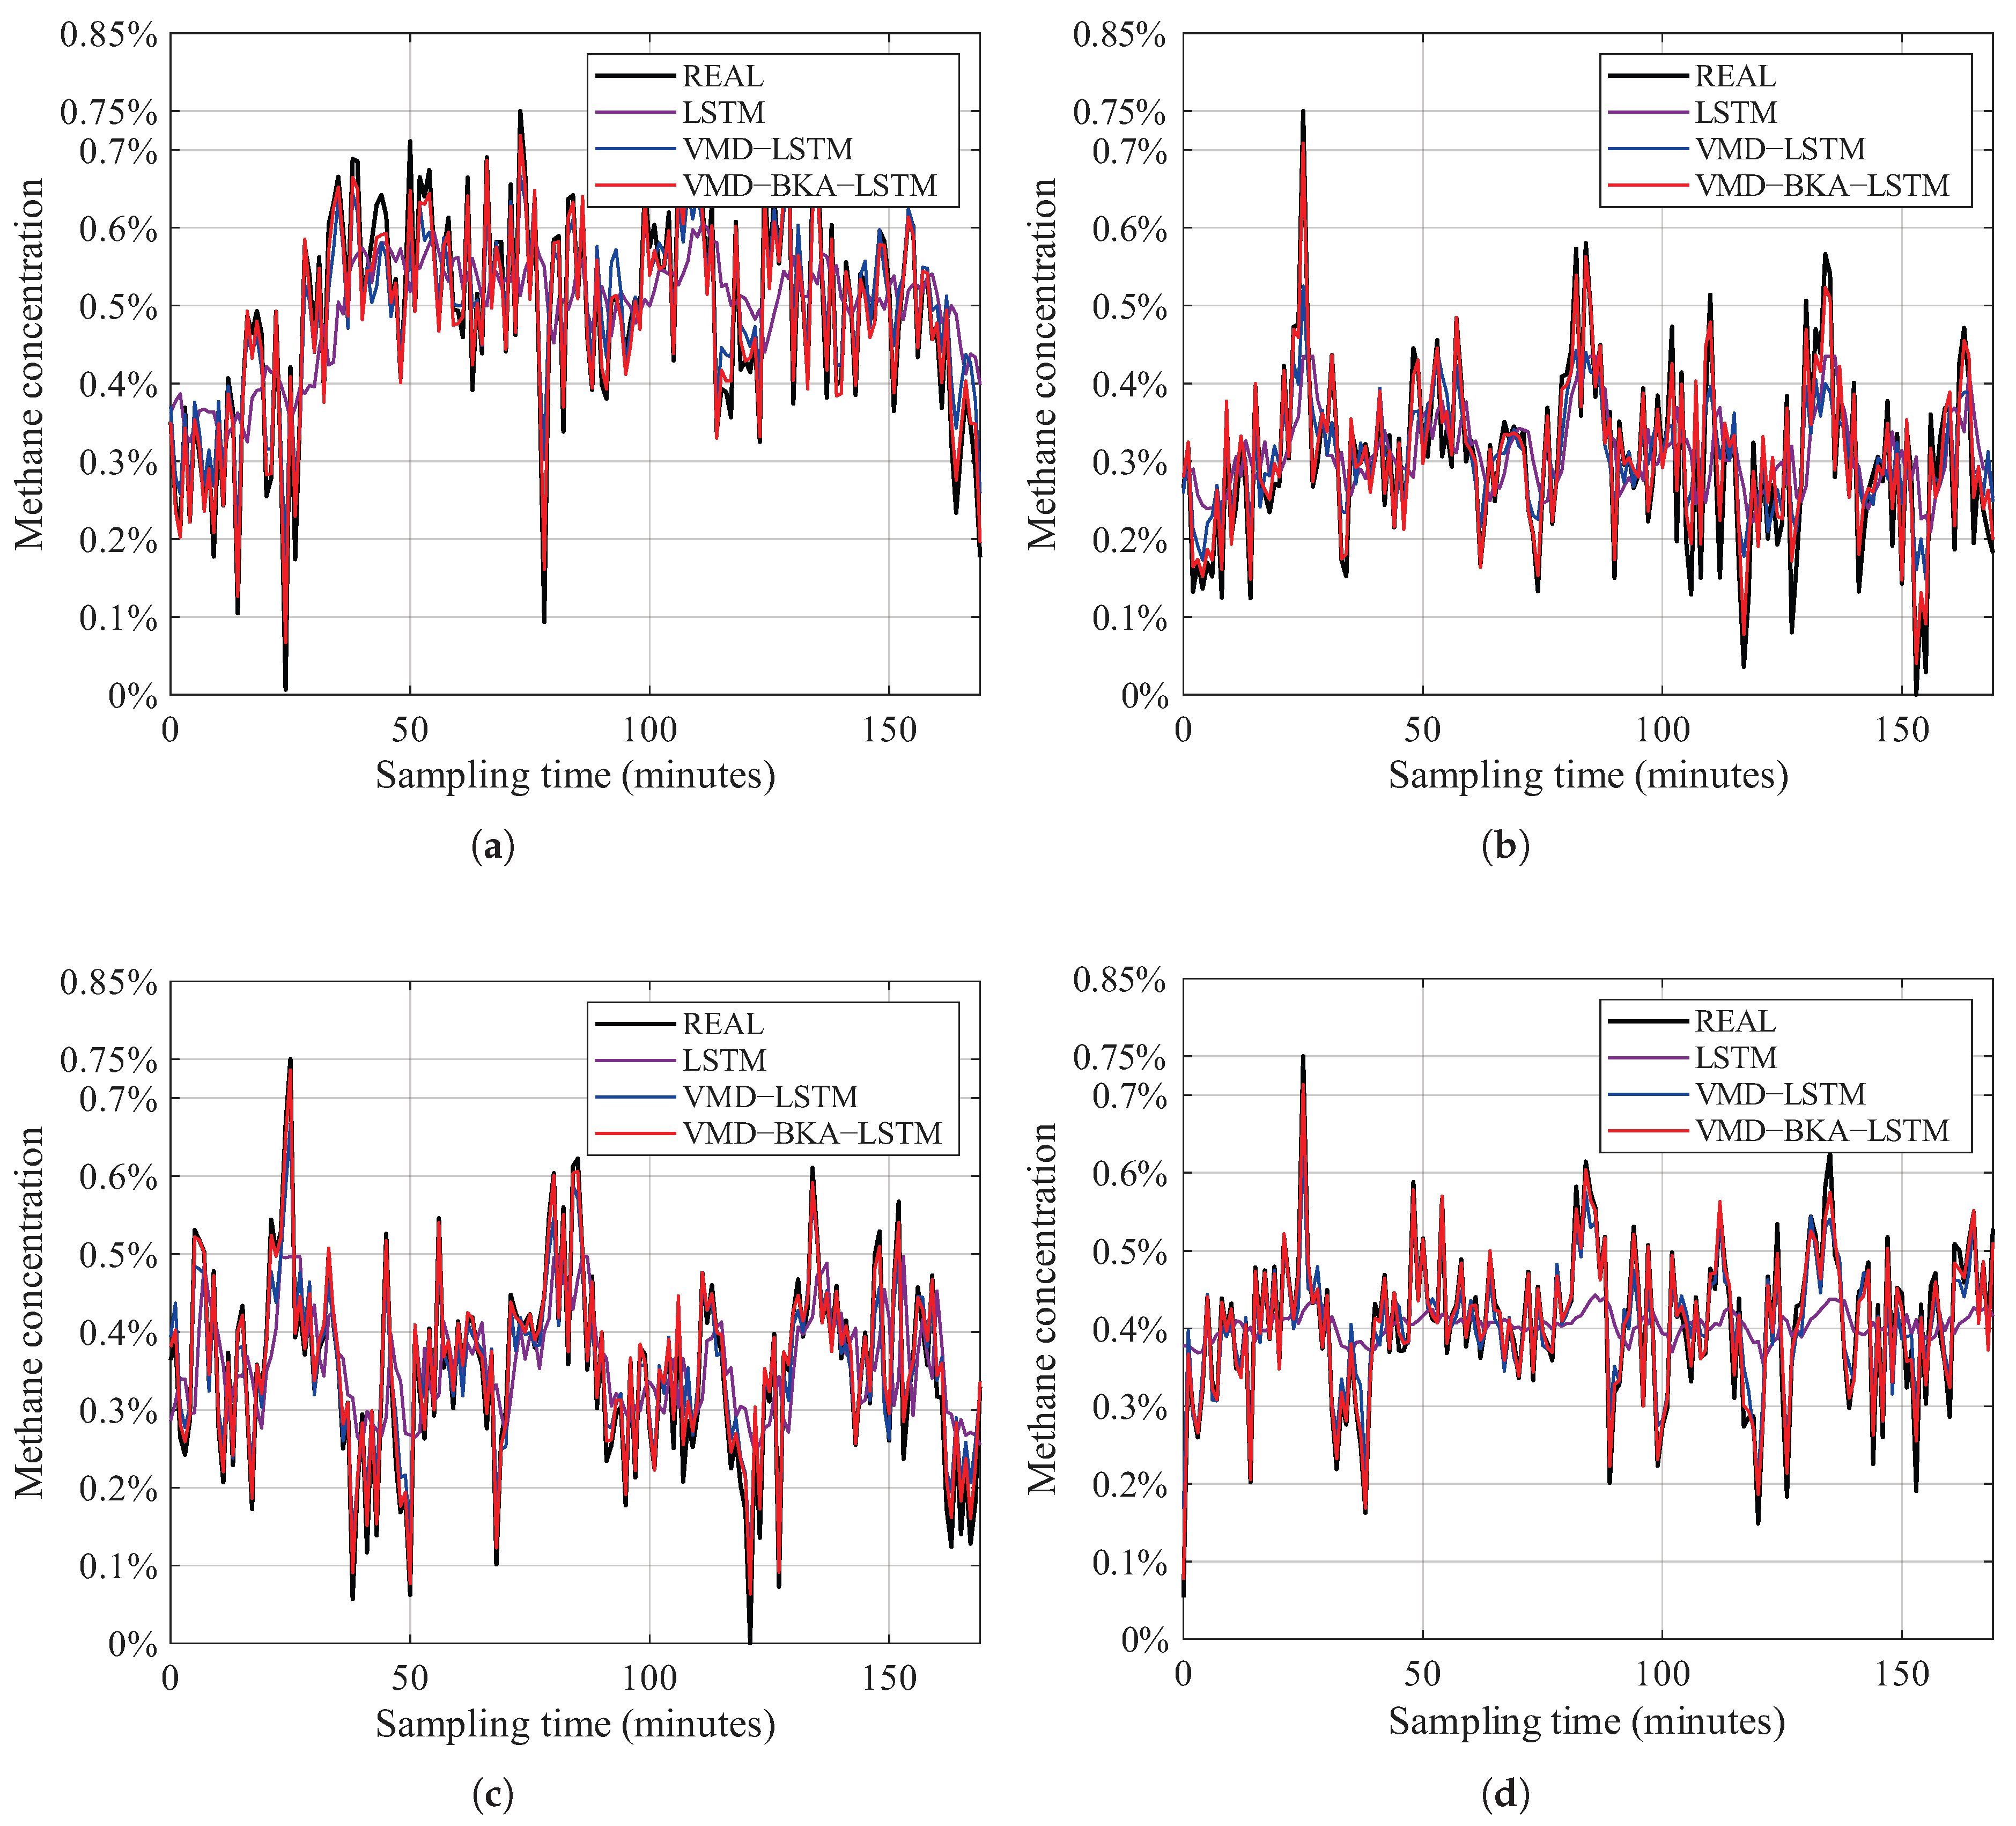
The improvement in LSTM prediction performance achieved by using VMD and the improved BKA is shown in Figure 8. The black curve represents the actual values of the methane concentration time series, the purple curve represents the predictions from the LSTM model, the blue curve represents the predictions from the VMD-LSTM model, and the red curve represents the predictions from the VMD-BKA-LSTM model. A comparison of the LSTM and VMD-LSTM models reveals the VMD-LSTM model has a smaller prediction error, indicating that VMD can reduce the complexity of the features in the methane time series data, improving prediction accuracy to some extent. At points of fluctuation, the predicted values from the VMD-BKA-LSTM model are significantly more accurate than those from the VMD-LSTM model, suggesting that BKA can enhance the prediction accuracy of the LSTM. The proposed VMD-BKA-LSTM model can accurately predict trends in methane concentration and efficiently estimate concentration levels.
Figure 8.
Prediction results from the traditional model. (a) shows the prediction results of the traditional model at location 1; (b) shows the prediction results of the traditional model at location 2; (c) shows the prediction results of the traditional model at location 3; (d) shows the prediction results of the traditional model at location 4.
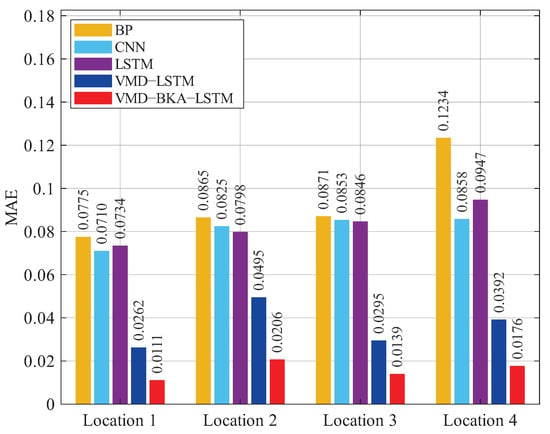
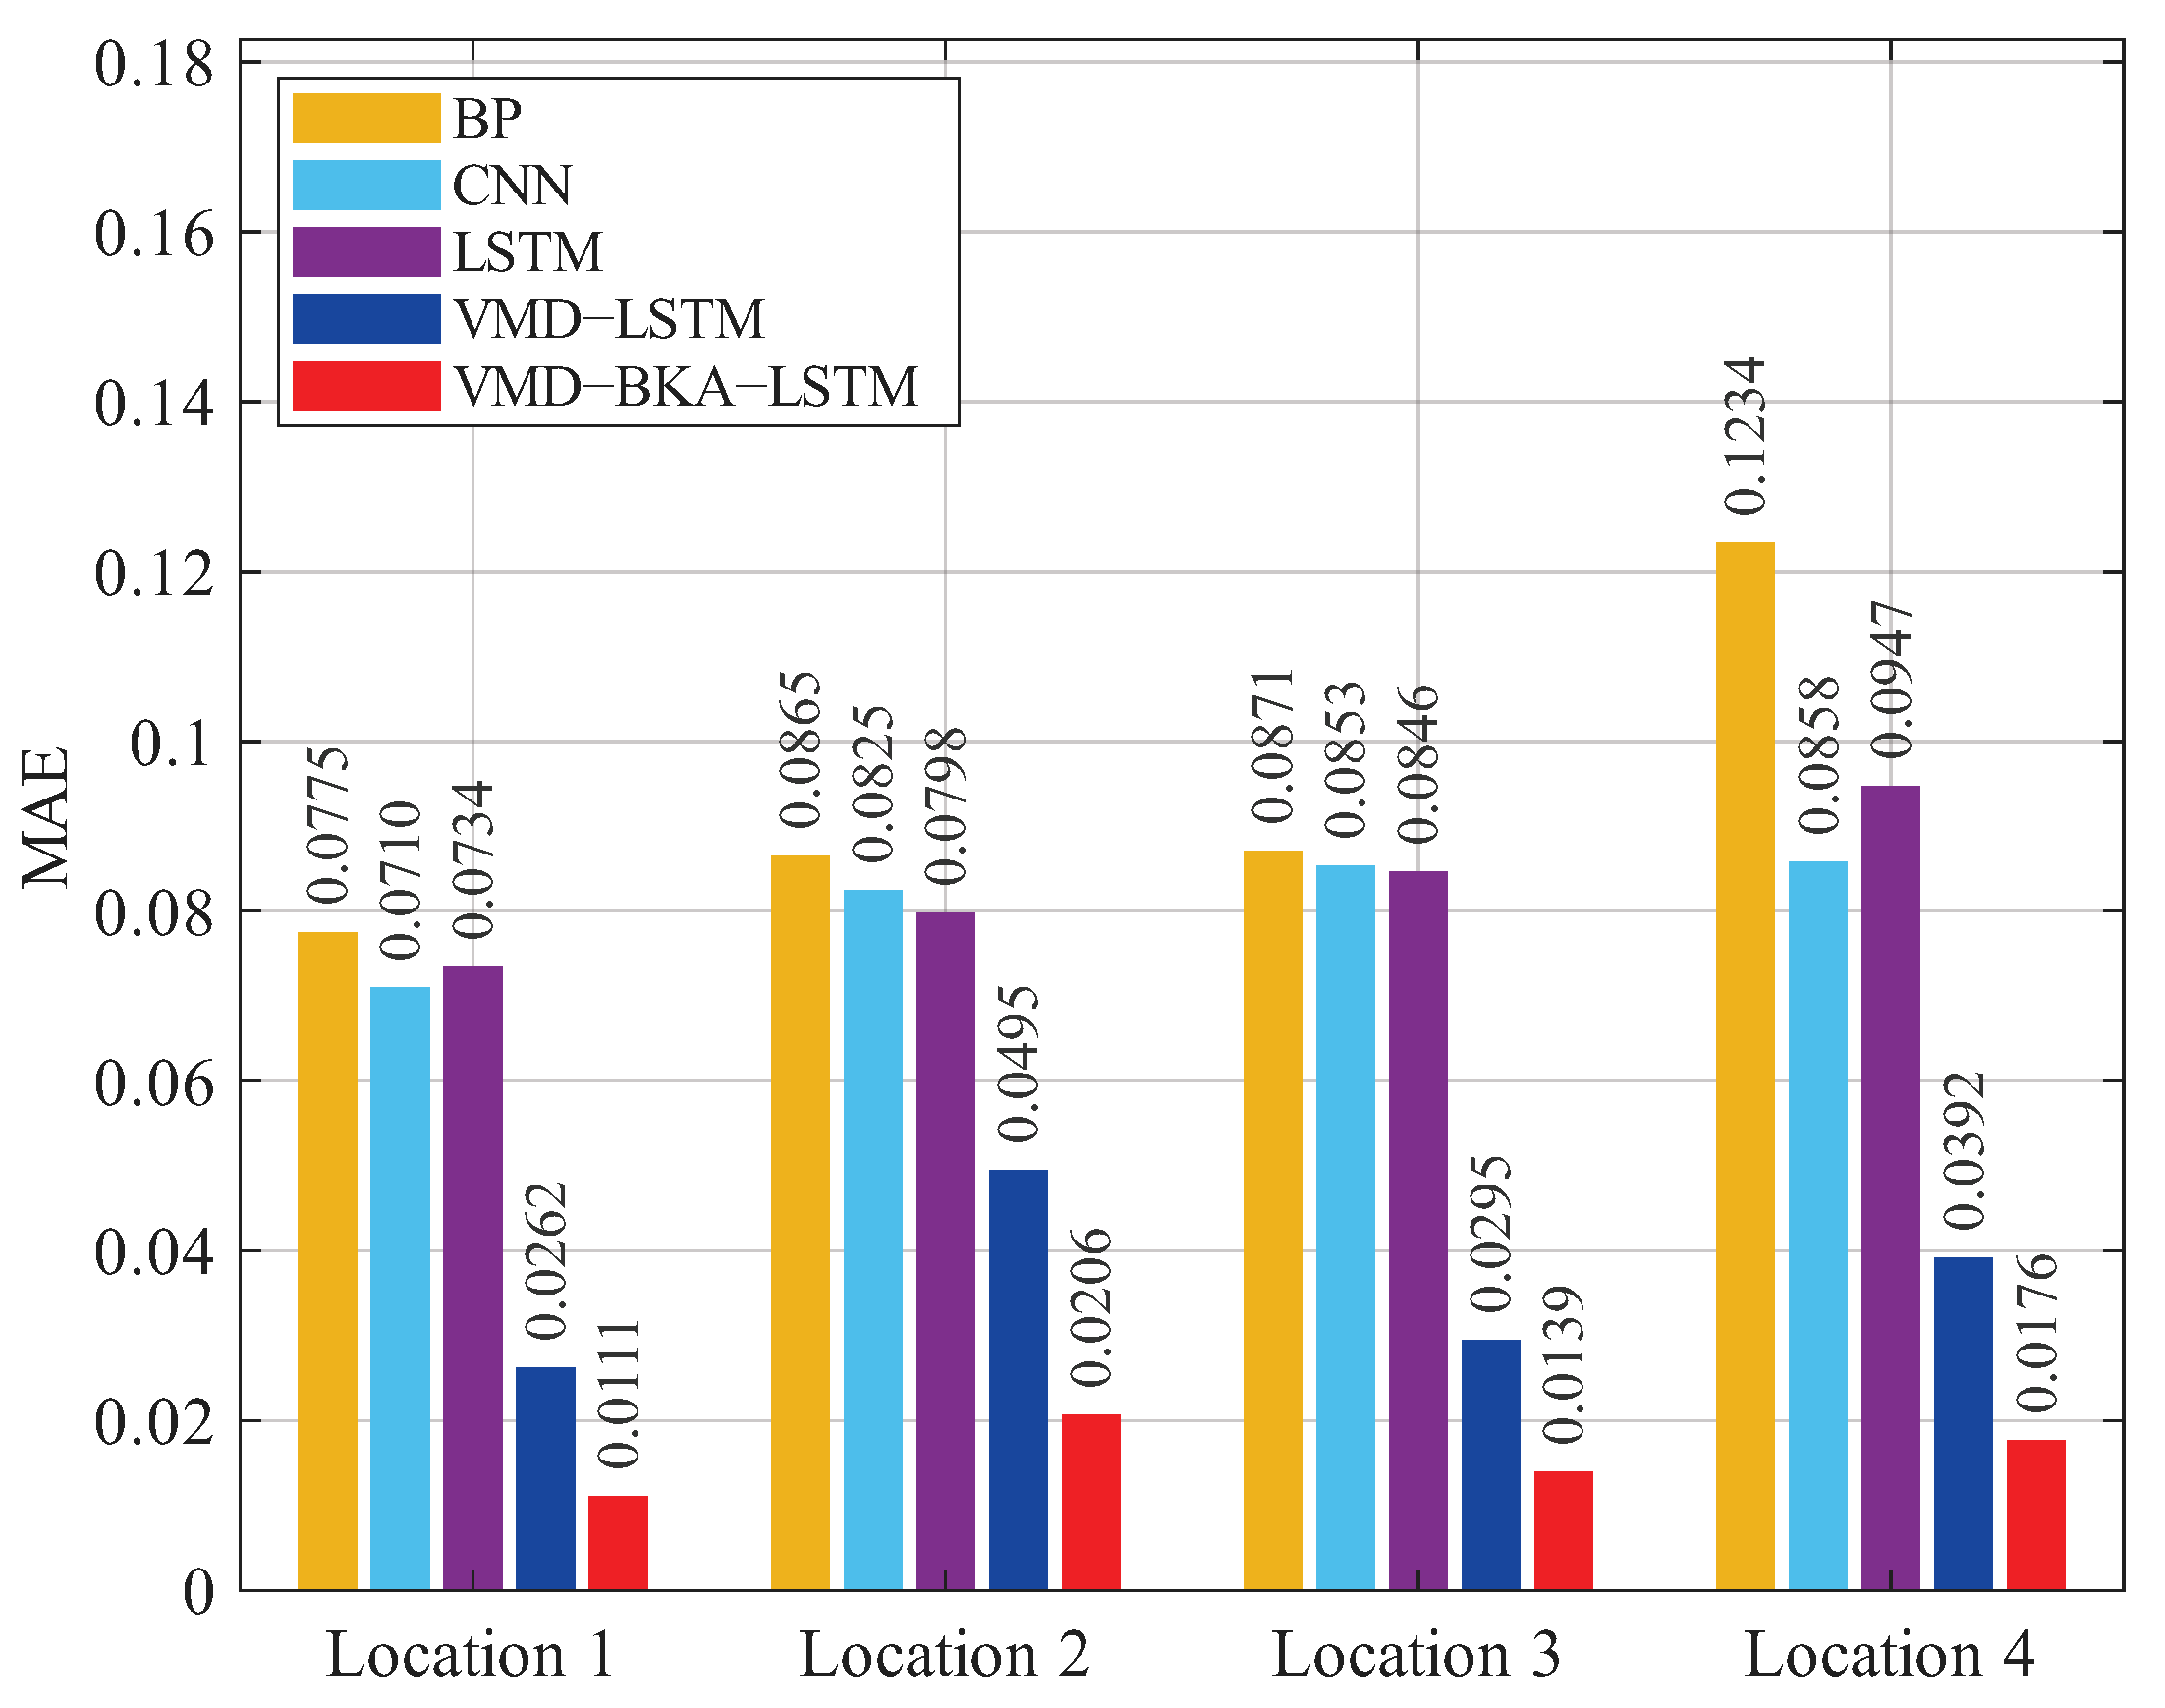
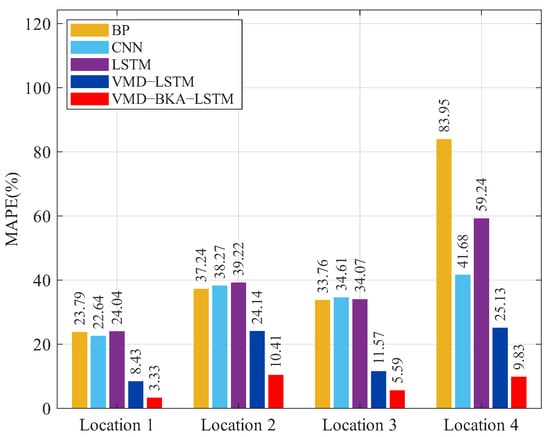
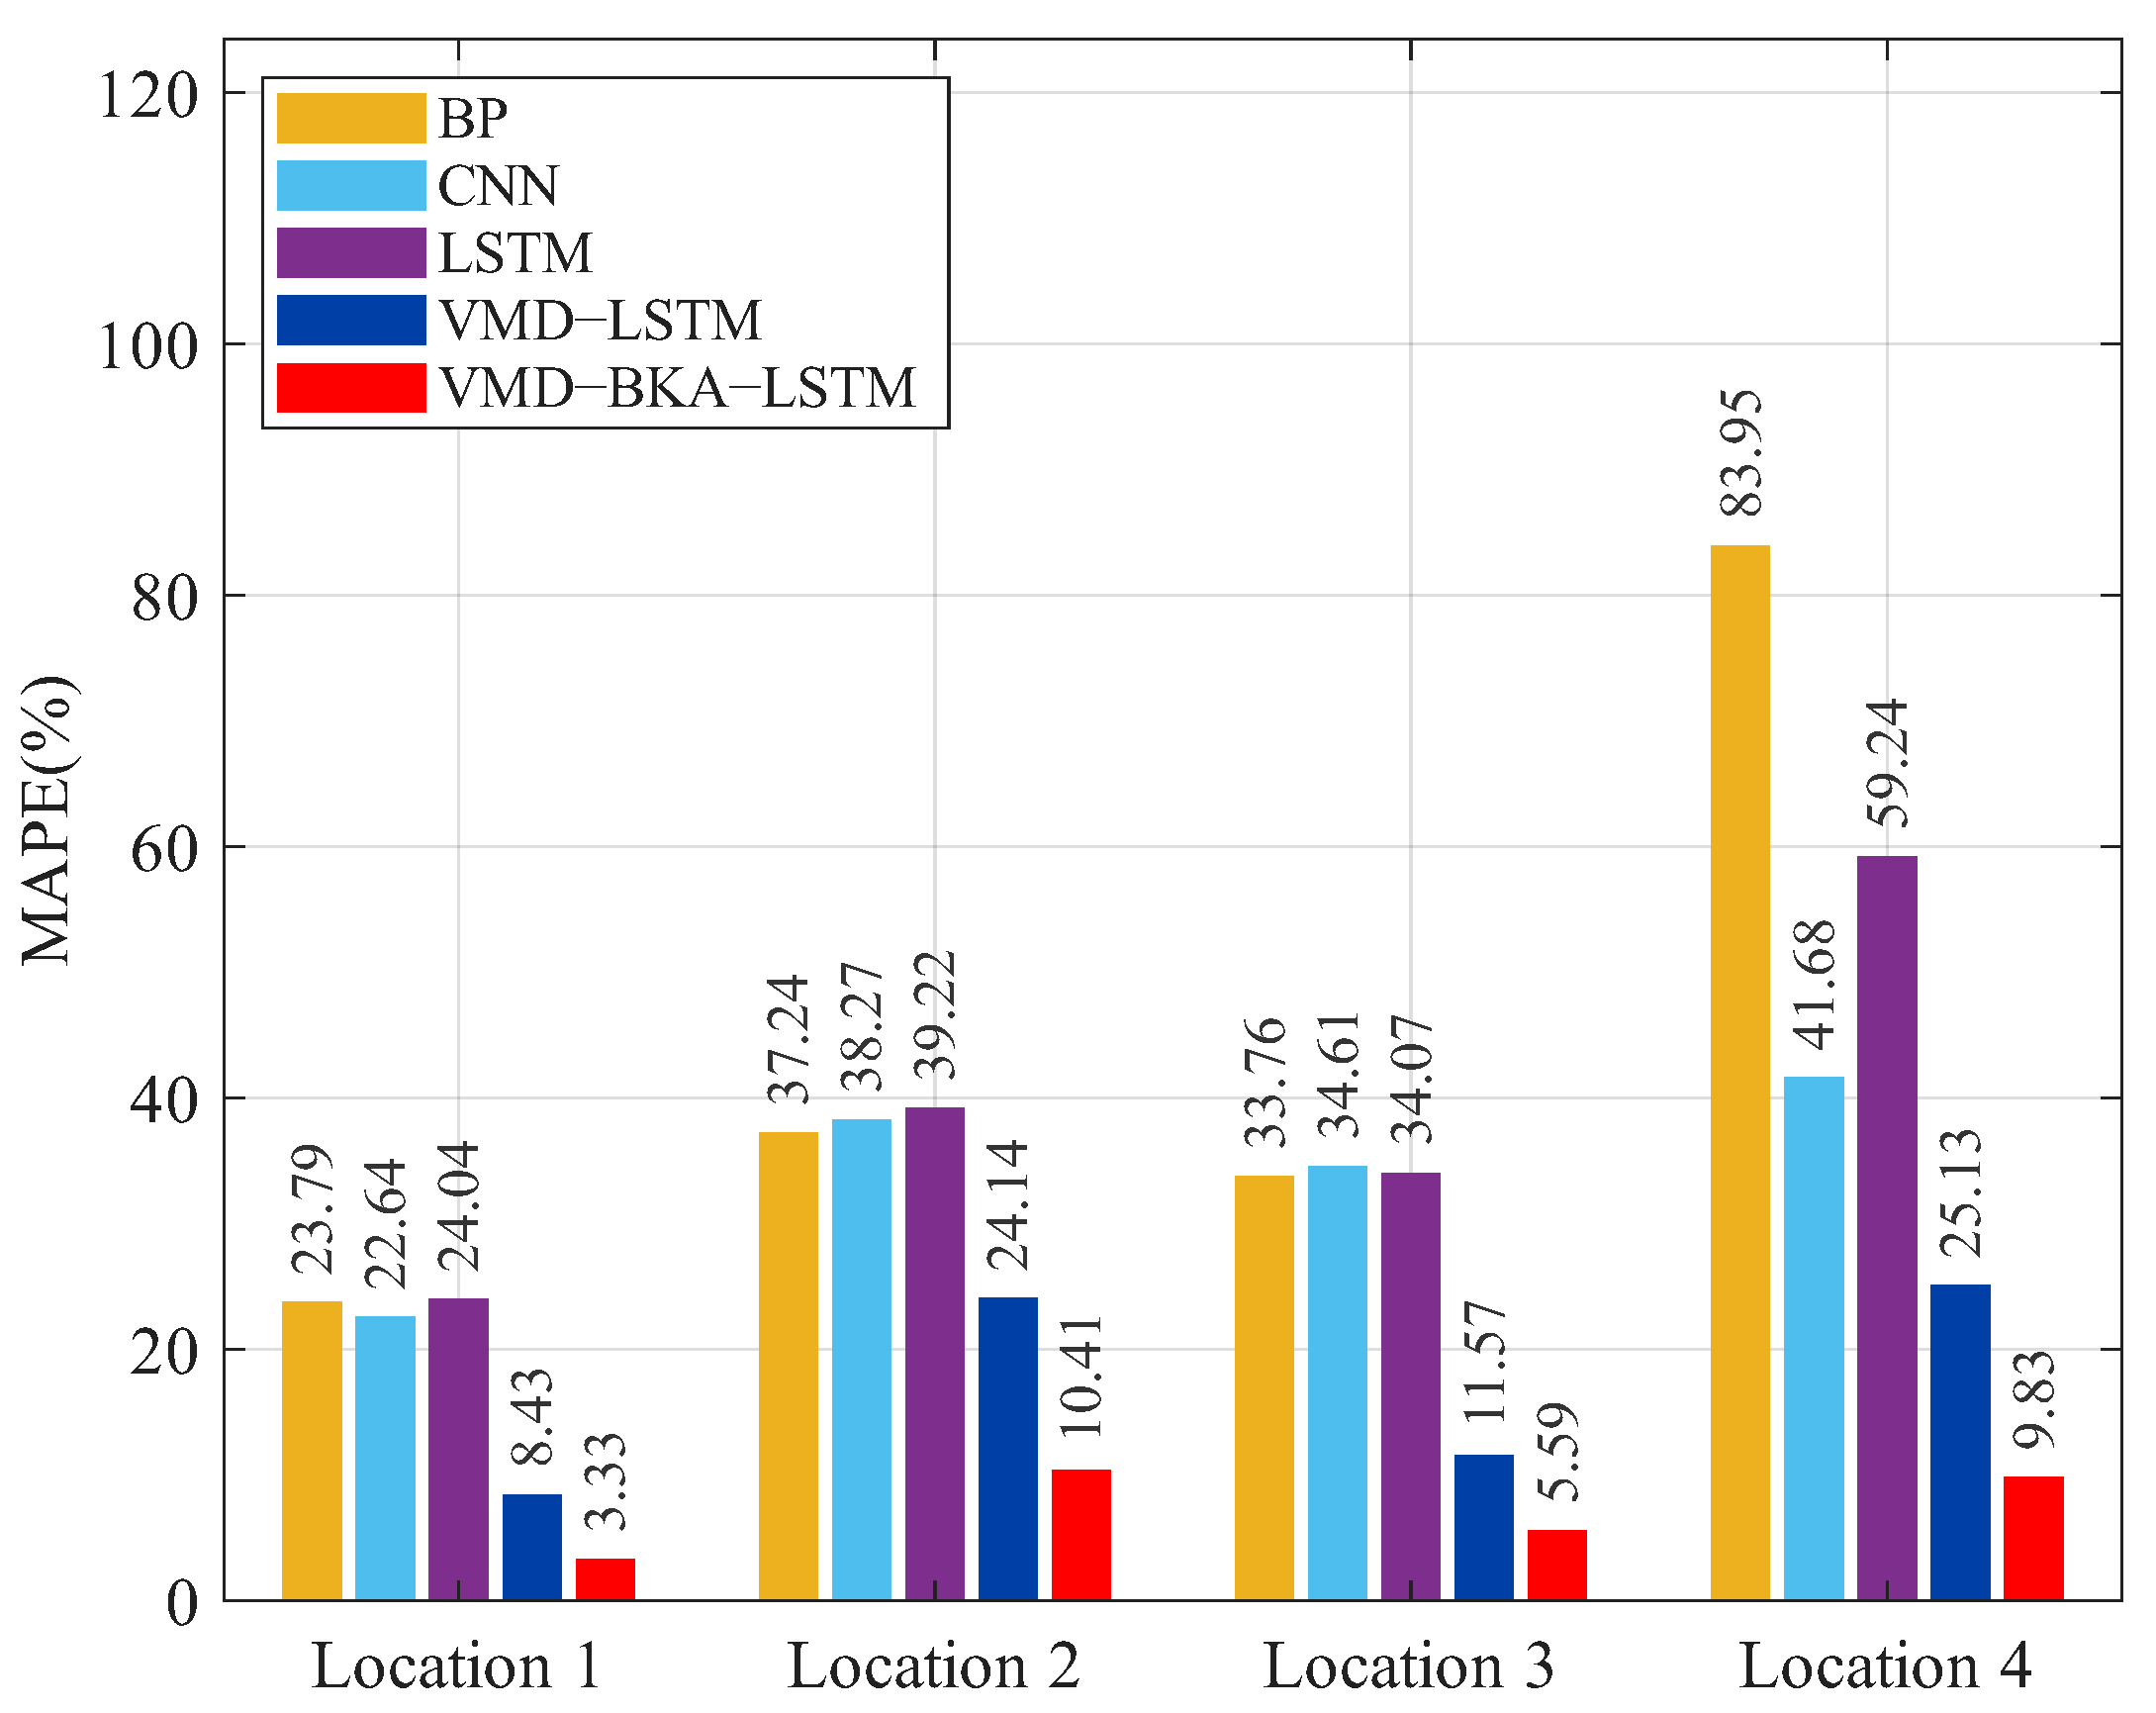
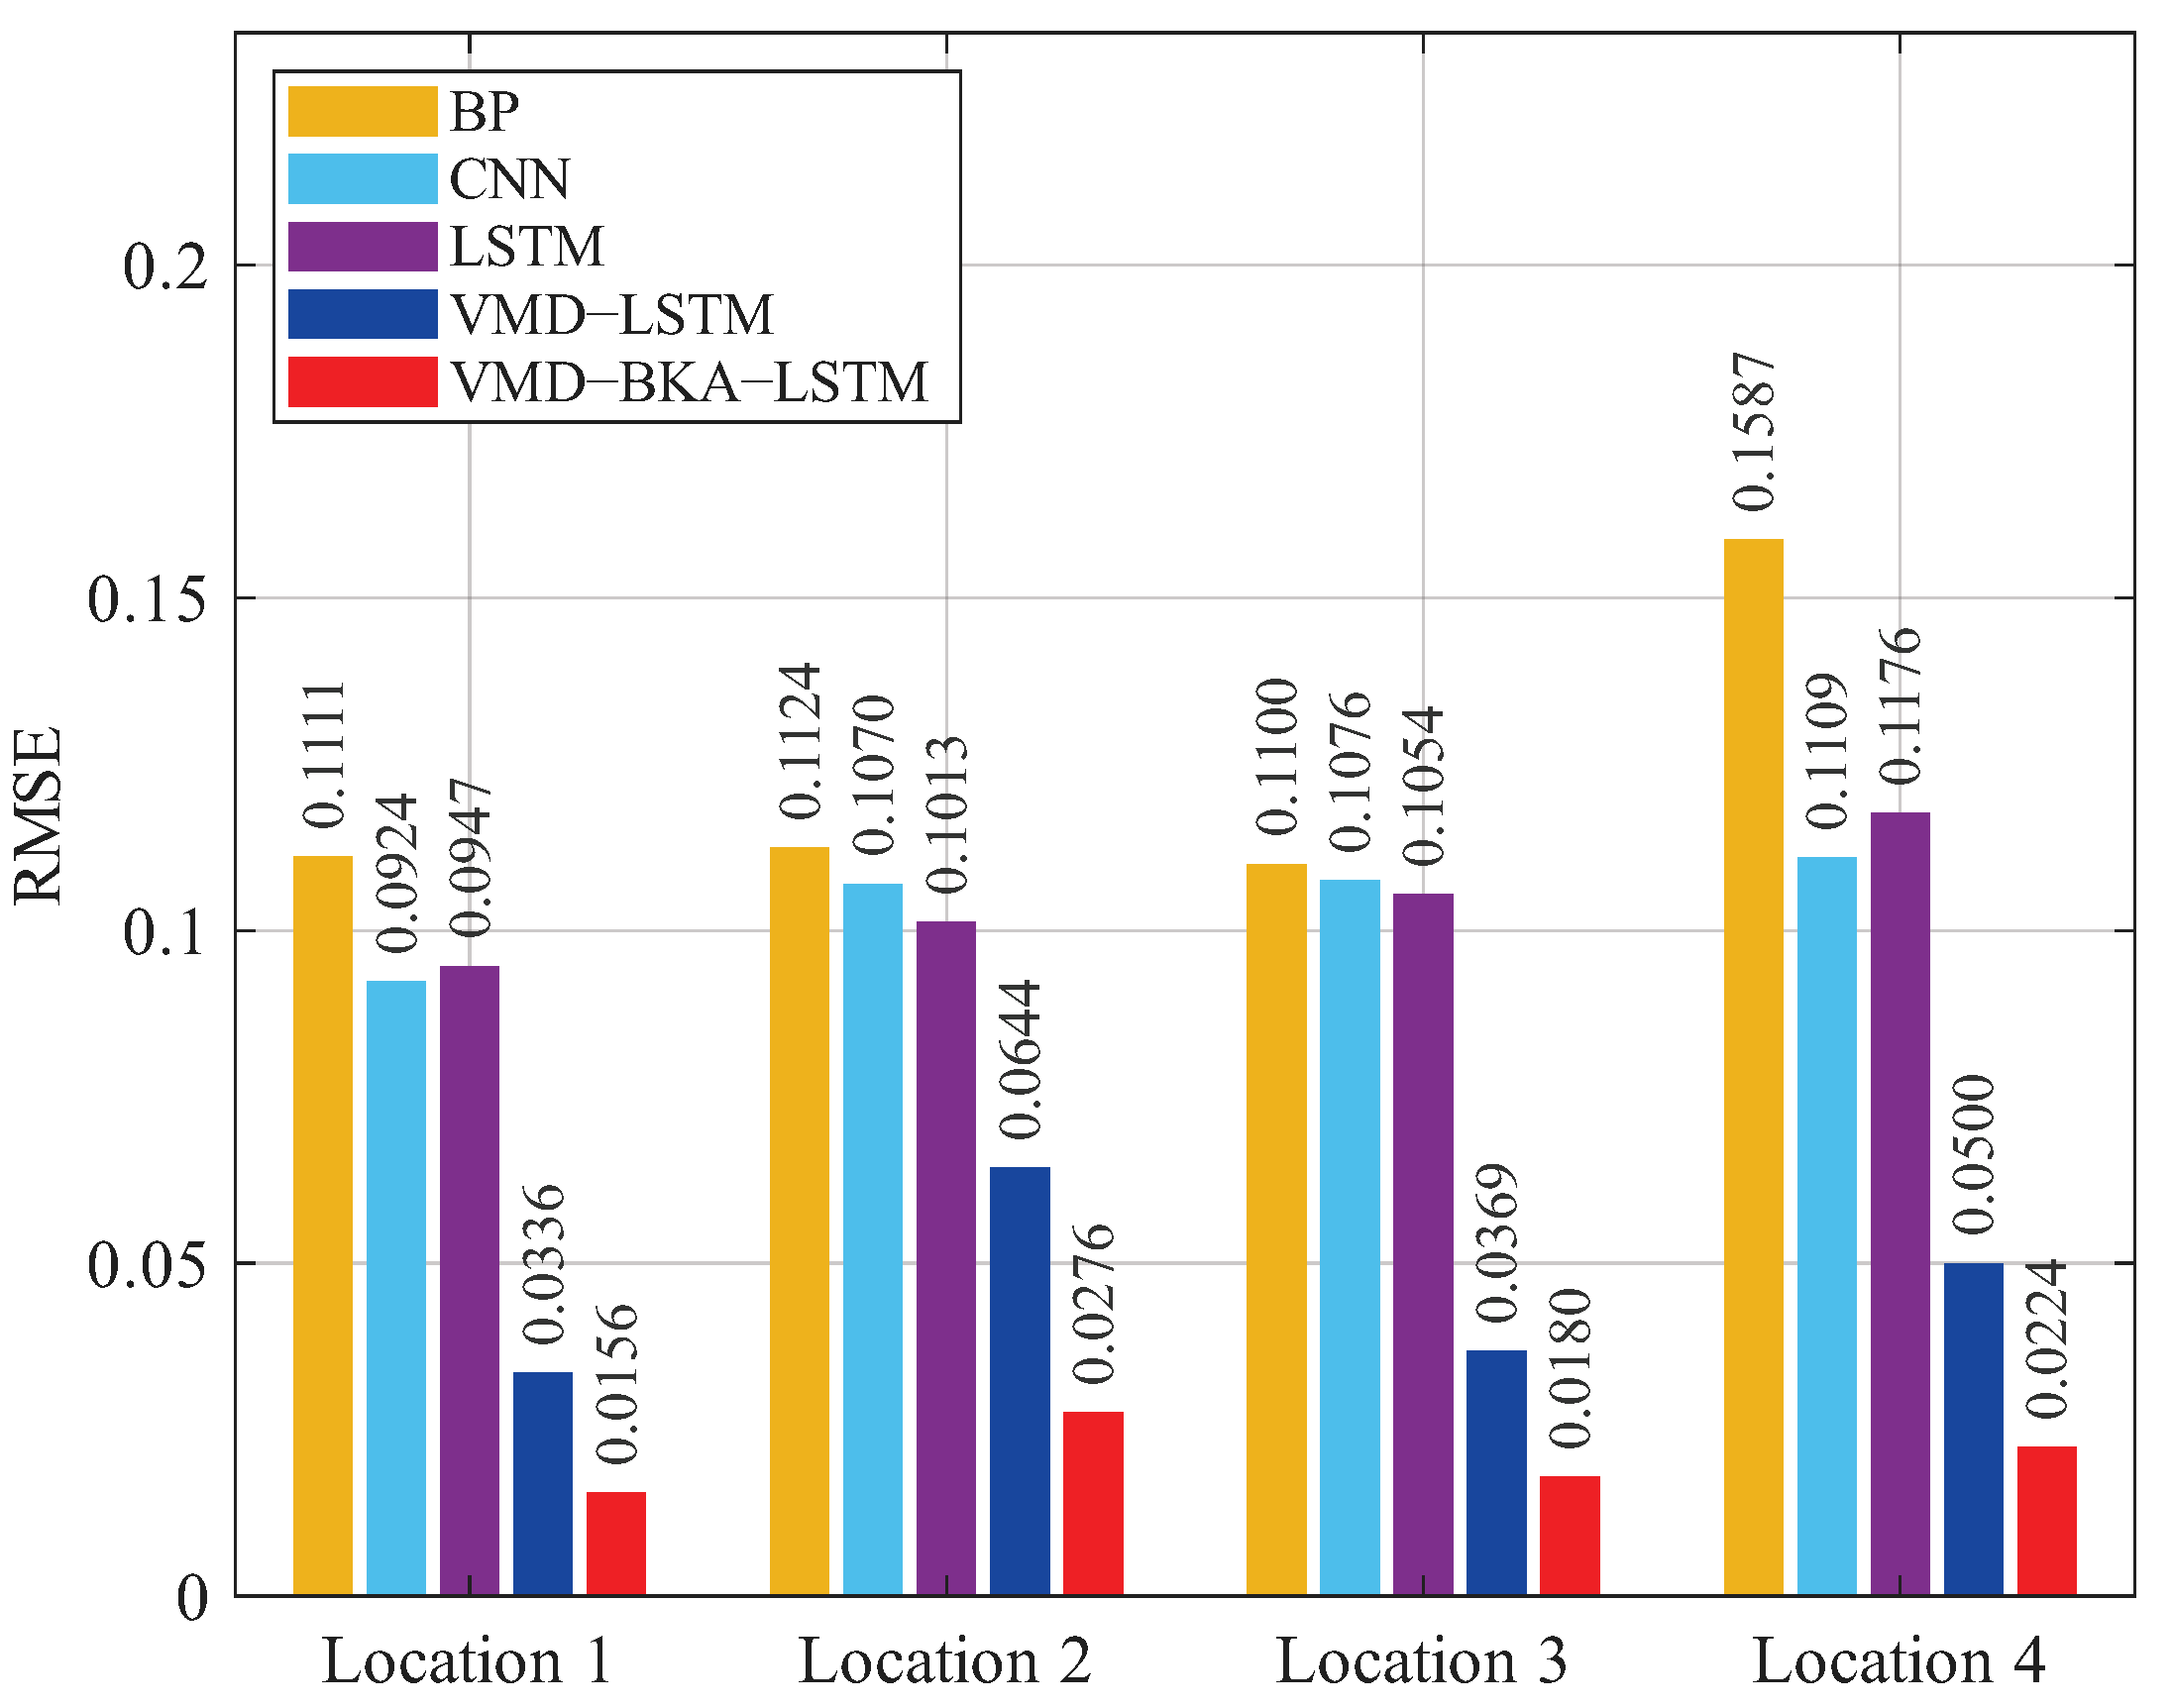
The prediction errors of the different models are compared, and the results are shown in Figure 9, Figure 10 and Figure 11. Compared with other traditional prediction models, the VMD-BKA-LSTM model achieves a substantial reduction in prediction error. It demonstrates the significant improvement in the predictive performance of the VMD-BKA-LSTM model and highlights its excellent ability to reduce prediction errors in methane concentration time series.
Figure 9.
Comparison of MAE across different models.
Figure 10.
Comparison of MAPE across different models.
Figure 11.
Comparison of RMSE across different models.
6. Conclusions
Methane concentration in mines is a key indicator affecting mining safety. However, methane trends are easily influenced by external factors such as changes in ventilation, geological structures, and mining operations, exhibiting strong nonlinearity. Traditional prediction models struggle to effectively track these dynamic changes, leading to frequent false alarms or missed alerts, which pose a serious threat to miners’ lives. Traditional methods suffer from significant prediction errors and fail to meet the timeliness and accuracy requirements for onsite early warning in mines, posing a major safety hazard to underground workers. The work addresses two key issues, decomposing methane concentration sequences and improving the optimization capability of BKA, to enhance the predictive accuracy of LSTM at points of significant change in methane concentration sequences. The above work can be summarized as follows:
(1) The adoption of an optimal point set improvement strategy significantly enhances the BKA population’s exploration efficiency within the search space. The implementation of a phased optimization mechanism prevents BKA from converging to local optima during the early stages of iteration, while the addition of a perturbation strategy probabilistically determines the final optimization result. The combined application of these three improvement strategies significantly enhances BKA’s ability to optimize LSTM hyperparameters.
(2) To mitigate the impact of nonlinear sequences on LSTM prediction accuracy, VMD is employed to decompose the gas concentration sequence into multiple stationary sequences, simplifying the extraction of features from the gas concentration sequence data and effectively improving the prediction accuracy of the model.
The combined application of these two methods significantly improves the accuracy of LSTM predictions of methane concentrations and ensures safety for underground operations such as mining.
Author Contributions
Conceptualization, Y.C.; methodology, Y.C.; software, Y.M.; validation, Y.C. and Y.M.; formal analysis, B.W.; writing—original draft preparation, H.Q.; writing—review and editing, B.W. and H.Q.; visualization, B.W.; supervision, H.Q.; project administration, H.Q.; funding acquisition, Y.M. All authors have read and agreed to the published version of the manuscript.
Funding
This research was funded by the Basic Research Project of Liaoning Provincial Department of Education LJ212510144008.
Institutional Review Board Statement
Not applicable.
Informed Consent Statement
Not applicable.
Data Availability Statement
Data is contained within the article. The original contributions presented in the study are included in the article, further inquiries can be directed to the corresponding author.
Conflicts of Interest
Authors Bei Wang and Haisheng Qiuwas are employed by CCTEG ShenYang Research Institute. The remaining authors declare that the research was conducted in the absence of any commercial or financial relationships that could be construed as a potential conflict of interest.
Appendix A
| Algorithm A1 Improved BKA |
|
References
- Ren, L.F.; Tao, F.; Xiao, Y.; Deng, J.; Li, Q.W.; Zhai, X.W.; Shu, C.M. Progress and development on mechanism and risk assessment of coal spontaneous combustion with gas explosion in underground goaf. J. Loss Prev. Process Ind. 2025, 99, 105795. [Google Scholar] [CrossRef] [Scilit]
- Diaz, J.; Agioutantis, Z.; Hristopulos, D.T.; Luxbacher, K.; Schafrik, S. Forecasting of methane gas in underground coal mines: Univariate versus multivariate time series modeling. Stoch. Environ. Res. Risk Assess. 2023, 37, 2099–2115. [Google Scholar] [CrossRef] [Scilit]
- Guo, H.; Li, S.; Cheng, L. Multi-factor coupling risk assessment method in relation to coal mine gas explosion. J. Loss Prev. Process Ind. 2025, 96, 105648. [Google Scholar] [CrossRef] [Scilit]
- Li, X.; Yang, M.; Ma, J.; Ning, X.; Li, R. Damage assessment of buildings under combustible gas explosion resulting from urban gas pipelines leak. J. Loss Prev. Process Ind. 2025, 96, 105635. [Google Scholar] [CrossRef] [Scilit]
- Gao, K.; Zhou, Z.J.; Qin, Y.H. Gas concentration prediction by LSTM network combined with wavelet thresholding denoising and phase space reconstruction. Heliyon 2024, 10, e28112. [Google Scholar] [CrossRef] [Scilit] [PubMed]
- Yang, G.; Zhu, Q.; Wang, D.; Feng, Y.; Chen, X.; Li, Q. Method and validation of coal mine gas concentration prediction by integrating PSO algorithm and LSTM network. Processes 2024, 12, 898. [Google Scholar] [CrossRef] [Scilit]
- Li, C.; Fang, X.; Yan, Z.; Huang, Y.; Liang, M. Research on gas concentration prediction based on the ARIMA-LSTM combination model. Processes 2023, 11, 174. [Google Scholar] [CrossRef] [Scilit]
- Gan, W.; Ma, R.; Zhao, W.; Peng, X.; Cui, H.; Yan, J.; Duan, S.; Wang, L.; Feng, P.; Chu, J. A VMD-LSTNet-Attention model for concentration prediction of mixed gases. Sens. Actuators B Chem. 2025, 422, 136641. [Google Scholar] [CrossRef] [Scilit]
- Jia, P.; Liu, H.; Wang, S.; Wang, P. Research on a mine gas concentration forecasting model based on a GRU network. IEEE Access 2020, 8, 38023–38031. [Google Scholar] [CrossRef] [Scilit]
- Zhang, J.; Hou, X.; Liu, S.; Chen, L.; Wang, Y. New data-driven method for in situ coalbed methane content evolution: A BP neural network prediction model optimized by grey relation theory and particle swarm. Energy Fuels 2023, 37, 10344–10354. [Google Scholar] [CrossRef] [Scilit]
- Liu, C.; Wang, G.; Zhang, C.; Patimisco, P.; Cui, R.; Feng, C.; Sampaolo, A.; Spagnolo, V.; Dong, L.; Wu, H. End-to-end methane gas detection algorithm based on transformer and multi-layer perceptron. Opt. Express 2023, 32, 987–1002. [Google Scholar] [CrossRef] [Scilit] [PubMed]
- Wang, X.; Zhu, B.; Zheng, H.; Wang, J.; Chen, Z.; Hong, B. Research on Export Oil and Gas Concentration Prediction Based on Machine Learning Methods. Energies 2025, 18, 1078. [Google Scholar] [CrossRef] [Scilit]
- Chen, S.; Du, W.; Wang, X.; Wang, B.; Cao, C.; Peng, X. Gas dispersion modeling in stereoscopic space with obstacles using a novel spatiotemporal prediction network. Comput. Chem. Eng. 2025, 194, 108934. [Google Scholar] [CrossRef] [Scilit]
- Meng, X.; Chang, H.; Wang, X. Methane concentration prediction method based on deep learning and classical time series analysis. Energies 2022, 15, 2262. [Google Scholar] [CrossRef] [Scilit]
- Lyu, P.; Chen, N.; Mao, S.; Li, M. LSTM based encoder-decoder for short-term predictions of gas concentration using multi-sensor fusion. Process Saf. Environ. Prot. 2020, 137, 93–105. [Google Scholar] [CrossRef] [Scilit]
- Yu, Y.; Si, X.; Hu, C.; Zhang, J. A review of recurrent neural networks: LSTM cells and network architectures. Neural Comput. 2019, 31, 1235–1270. [Google Scholar] [CrossRef] [Scilit] [PubMed]
- Sherstinsky, A. Fundamentals of recurrent neural network (RNN) and long short-term memory (LSTM) network. Phys. D. 2020, 404, 132306. [Google Scholar] [CrossRef] [Scilit]
- Zhang, S.; Fu, Z.; An, D.; Yi, H. Network security situation assessment based on BKA and cross dual-channel. J. Supercomput. 2025, 81, 461. [Google Scholar] [CrossRef] [Scilit]
- Sun, Y.; Wang, Z.; Wang, J.; Li, Q. Short-term solar photovoltaic power prediction utilizing the VMD-BKA-BP neural network. Symmetry 2025, 17, 784. [Google Scholar] [CrossRef] [Scilit]
- Shi, S.; Wang, Y.; Li, D.; Qi, D.; Hui, J.; Wang, Z.; Xu, M.; Chen, D.; Lin, S.; Yu, Q. Prediction and Experimental Study of Gas-Water-Foam Three-Phase Flow Patterns in Vertical Wells Using BKA-BP Neural Network. Geoenergy Sci. Eng. 2026, 245, 214404. [Google Scholar] [CrossRef] [Scilit]
- Wu, L.; Dawod, A.Y.; Miao, F. Environmental Prediction Using a Spatiotemporal WSN: A New Method for Integrating BKA Optimization and CNN-BiLSTM. Appl. Sci. 2026, 16, 296. [Google Scholar] [CrossRef] [Scilit]
- Su, H.; Zhao, D.; Heidari, A.A.; Liu, L.; Zhang, X.; Mafarja, M.; Chen, H. RIME: A physics-based optimization. Neurocomputing 2023, 532, 183–214. [Google Scholar] [CrossRef] [Scilit]
- Cao, L.; Wei, Q. SZOA: An Improved Synergistic Zebra Optimization Algorithm for Microgrid Scheduling and Management. Biomimetics 2025, 10, 664. [Google Scholar] [CrossRef] [Scilit] [PubMed]
- Ma, Z.; Zhang, Y. A study on rolling bearing fault diagnosis using RIME-VMD. Sci. Rep. 2025, 15, 4712. [Google Scholar] [CrossRef] [Scilit] [PubMed]
- Ferkous, K.; Menakh, S.; Guermoui, M.; Bellaour, A.; Bekkar, B.; Rabehi, A.; Agajie, T.F.; Benghanem, M. Optimized solar power forecasting: A multi-decomposition framework using VMD and swarm techniques. AIP Adv. 2025, 15, 095311. [Google Scholar] [CrossRef] [Scilit]

Disclaimer/Publisher’s Note: The statements, opinions and data contained in all publications are solely those of the individual author(s) and contributor(s) and not of MDPI and/or the editor(s). MDPI and/or the editor(s) disclaim responsibility for any injury to people or property resulting from any ideas, methods, instructions or products referred to in the content. |
© 2026 by the authors. Licensee MDPI, Basel, Switzerland. This article is an open access article distributed under the terms and conditions of the Creative Commons Attribution (CC BY) license.