


Abstract
This study evaluates performance-improvement and repowering strategies for an existing sugarcane cogeneration plant in Espírito Santo, Brazil, using field data and thermodynamic simulations performed with Thermoflex and EES software. The current operating condition was adopted as the Base Case and compared with three progressively more intensive scenarios. Increasing steam generation from 75 to 110 t/h raised net electrical power from 10.800 to 18.633 MW, while the simulated condenser steam flow reached 41.3 t/h, slightly exceeding its 40 t/h nominal capacity. Operation at the nominal boiler capacity of 150 t/h increased net electrical power to 32.560 MW and required additional condensation capacity. A repowering configuration at the same steam-generation rate, but with higher steam pressure and temperature and reheating, further increased net electrical power to 38.304 MW and net electrical efficiency from 23.12% to 27.44%. Exergetic efficiency increased from 23.50% to 26.85%, while total combined exergy destruction and losses decreased from 147.698 to 140.554 MW. Specific direct CO2 emissions decreased from 2.962 to 1.468 tCO2/MWh between the Base Case and Scenario 3. The revised incremental economic assessment, based on 3300 operating hours per year, resulted in an NPV of US$6.88 million and a discounted payback of 0.67 years for the transition to Scenario 2, whereas the repowering investment resulted in an NPV of −US$27.44 million. The results distinguish capacity recovery from technological repowering and show that higher thermodynamic performance does not necessarily correspond to greater economic attractiveness.
1. Introduction
Sugarcane processing plants are inherently integrated energy systems, since the industrial production of sugar and ethanol requires substantial amounts of thermal and electrical energy while simultaneously generating biomass residues with significant energy content. Bagasse, produced during sugarcane milling, has traditionally been burned in boilers to supply process steam and electricity for internal consumption. As cogeneration systems have evolved, electricity has become an additional product of the sugarcane industry, and modern plants can export a significant fraction of their generation to the electrical grid [1,2,3].
The amount of electricity that can be produced from sugarcane biomass depends strongly on the configuration of the steam cycle and on the thermal demand of the industrial process. Conventional plants historically operated with relatively low steam pressures and back-pressure turbines [4], in which electricity generation was closely coupled to process steam consumption. The adoption of extraction-condensing steam turbines, together with higher steam conditions and electrified mills, increased the flexibility of these systems and enabled larger electricity surpluses [2,5]. Kamate and Gangavati [6], comparing back-pressure and extraction-condensing configurations in a bagasse-fired sugar plant, showed that steam conditions and turbine configuration have a direct influence on both energy and exergy performance. Their analysis also identified the boiler as the main source of thermodynamic irreversibility in the plant. Alves et al. [7] compared the same technologies, while additionally assessing straw availability and its use for off-season power generation to increase surplus electricity production. Other studies [8,9] have investigated new architectures as alternative cogeneration configurations for the fermentation process in ethanol production from sugarcane, highlighting the extraction-condensing configuration as a more flexible option because it allows steam condensation and enables operation throughout the year.
The modernization of sugarcane cogeneration has therefore been studied through different approaches. Improvements based on higher steam parameters, reheating, regeneration, reduction in process steam demand and advanced power cycles have been proposed to increase electricity production and biomass utilization. In the Brazilian sugarcane sector, reheat and regenerative steam cycles have been evaluated as alternatives for increasing cogeneration efficiency and generating additional surplus electricity [4]. Other studies have examined more advanced options, including biomass integrated gasification combined cycles and high-pressure or supercritical Rankine cycles, although the higher technological complexity of these configurations remains an important limitation for retrofit applications in existing plants [2,3,10,11,12,13].
An additional opportunity results from the progressive mechanization of sugarcane harvesting. Besides avoiding the need for pre-harvest burning, mechanized harvesting increases the amount of straw that can potentially be recovered and used as a supplementary fuel [14,15]. Consequently, modern cogeneration systems may operate with mixtures of bagasse and straw, increasing the biomass energy available to the steam cycle. Guerra et al. [16] evaluated ten sugarcane cogeneration scenarios combining different steam pressures and straw recovery rates. Increasing the steam pressure from 20 to 100 bar increased power generation by approximately 63%, while the simultaneous use of residual straw further increased the potential for electricity export. Currently, some Brazilian sugarcane mills use mixtures of sugarcane bagasse and straw as boiler fuel, with straw accounting for approximately 10% of the total mass, and this proportion is expected to increase to up to 25% on a dry basis without significantly increasing deposit formation and corrosion on heat-transfer surfaces [2,7]. In addition, sugarcane bagasse and straw exhibit similar chemical and physicochemical characteristics, differing mainly in their moisture content, with sugarcane straw typically presenting moisture contents in the range of 10–25% [15,17].
The technical potential of straw utilization, however, cannot be assessed independently from the characteristics of the existing plant. Watanabe et al. [18] evaluated retrofit alternatives for electricity production from sugarcane straw in Brazilian mills and showed that economic performance is strongly affected by the industrial operating period and the value of the electricity produced. These results reinforce the distinction between the theoretical energy potential of additional biomass and the amount of this potential that can effectively be converted into economically useful electricity in an existing industrial facility.
The operating conditions of the steam cycle are equally important. Modern Brazilian cogeneration plants based on condensing-extraction steam turbines can operate at considerably higher steam pressures and temperatures than conventional systems. Studies representative of Brazilian mills have considered steam conditions in the range of approximately 105–120 bar and temperatures above 520 °C for high-performance cogeneration systems [2,3,19]. Under these conditions, increasing the thermodynamic quality of the steam allows greater work production per unit of steam generated, which is particularly relevant when the availability of biomass or the nominal steam-generation capacity limits further increases in mass flow.
Energy analysis alone, however, is insufficient to identify the origin and magnitude of the thermodynamic losses within these plants. Exergy analysis has consequently become an important tool for assessing sugarcane cogeneration systems [20]. Several studies have shown that combustion and steam generation generally account for the largest fraction of exergy destruction, while turbines present comparatively higher exergetic efficiencies [6,21,22]. More recent analyses using operating data from industrial sugarcane plants have confirmed the predominance of boiler-related irreversibilities and have used exergy destruction to identify opportunities for plant improvement [23,24]. Another study demonstrated the potential for improving the thermodynamic performance of a sugar mill through the integration of waste-heat recovery technologies [25].
The environmental implications of increasing electricity generation from sugarcane biomass have also received growing attention. The use of bagasse and straw can increase renewable electricity production, but higher biomass consumption generally increases the direct flow of CO2 through the boiler. Therefore, the environmental interpretation depends on the system boundary and on the indicator considered. Guerra et al. [16] combined thermodynamic analysis with life-cycle environmental assessment and showed that increased straw utilization and higher steam parameters can improve electricity-related environmental performance, although additional impacts may arise outside the cogeneration plant boundary. Other studies have combined energy, exergy and exergoenvironmental methods to relate thermodynamic inefficiencies to the environmental burden associated with sugarcane bagasse cogeneration [22].
Several strategies to reduce the environmental impacts of sugarcane cogeneration have been investigated worldwide, highlighting that although cogeneration is generally environmentally advantageous, it is not free from trade-offs and therefore requires a detailed assessment [26]. For instance, in the Cuban sugar industry, the cogeneration stage accounted for approximately 80% of the total environmental impact, with particulate emissions from bagasse combustion identified as the main contributor [27]. Other studies have shown that improvements in harvesting and agricultural management practices can substantially reduce environmental impacts [28,29], while thermal cycle configurations and steam conditions directly influence the environmental performance of cogeneration systems [30,31].
More recent work has expanded this analysis toward operational optimization and integrated assessment. Lozano et al. [32] investigated optimal operating modes and product cost allocation in sugarcane steam cogeneration plants, showing that electricity generation and plant operation depend on the interaction among process energy demands, bagasse availability and the market value of surplus electricity. Integrated exergy, economic and environmental approaches have also been applied to sugarcane-based energy systems, confirming that thermodynamic improvement must be interpreted together with the economic and environmental consequences of the proposed modifications [33,34].
Despite this extensive literature, a substantial part of the published work evaluates reference plants, optimized configurations or advanced cogeneration technologies under prescribed design conditions. Comparatively fewer studies address the progressive recovery of an existing industrial cogeneration system starting from its actual operating condition and considering the constraints imposed by the installed equipment. This distinction is relevant because an existing plant may operate significantly below its nominal capacity, and the sequence of feasible improvements may be governed not only by boiler and turbine performance but also by biomass availability, process steam demand and the capacity of auxiliary and heat-rejection systems.
At the state level, the Government of Espírito Santo established the Plan for Decarbonization and GHG Neutralization [35,36] as part of its commitment to the United Nations’ Race to Zero and Race to Resilience campaigns. The plan establishes strategies and actions to reduce greenhouse gas (GHG) emissions and support the achievement of environmental targets toward 2050. This framework is particularly relevant to the energy and industrial sectors, which together account for more than half of the state’s net CO2 emissions, highlighting the importance of improving the efficiency and environmental performance of existing energy-intensive industrial systems. In this context, the assessment of cogeneration plants operating in Espírito Santo provides a relevant regional perspective on the potential contribution of thermodynamic improvements, biomass utilization and technological retrofitting to broader decarbonization objectives. Recent studies conducted in the state have also investigated industrial measures aligned with these objectives [37,38,39].
Against this background, the present study evaluates an existing sugarcane ethanol plant located in Espírito Santo, southeastern Brazil, using actual operating data collected directly from the industrial facility. Three progressively more intensive alternatives are investigated: (i) increased utilization of the existing steam-generation capacity, (ii) increased biomass availability through the incorporation of sugarcane straw, and (iii) technological repowering of the steam cycle through higher pressure and temperature and the introduction of reheating. Energy, exergy, economic and environmental analyses (4E) are combined to quantify the effects of these alternatives on electricity generation, thermodynamic efficiency, component-level exergy destruction and losses and specific CO2 emissions. A complementary incremental economic assessment is also performed for the transition to full boiler-capacity operation and for the subsequent technological repowering of the steam cycle. By evaluating these alternatives under the constraints of an operating industrial facility, the study distinguishes the potential benefits of recovering underutilized installed capacity from those associated with more extensive steam-cycle repowering. The results provide an integrated basis for assessing thermodynamic improvement and decarbonization-related opportunities in existing sugarcane cogeneration systems.
2. Sugarcane Plant and Cogeneration System
The case study is an existing sugarcane ethanol plant located in northern region of Espírito Santo State, southeastern Brazil. The industrial facility operates during the sugarcane harvesting season, typically from April to November, and primarily produces ethanol and carbon dioxide. Sugarcane harvesting is mechanized, which also allows part of the residual straw to be recovered for energy purposes.
The plant has a nominal sugarcane processing capacity of approximately 600,000 t/year and an average annual processing rate of approximately 550,000 t/year. During regular operation, the average milling rate is approximately 4000 t/day, corresponding to 166.7 t/h. The plant operating records indicate a bagasse production of approximately 28% of the processed sugarcane on a mass basis [7,40], resulting in about 46.7 t/h of bagasse under the average milling condition. This represents the maximum amount of bagasse produced and available for combustion, from which 5% is reserved for emergencies [41]. The milling and cane-preparation systems are electrically driven.
The cogeneration system supplies both the thermal and electrical demands of the industrial facility. Under the operating conditions recorded during the field survey, approximately 75 t/h of steam was produced, while the industrial process required approximately 60 t/h at an extraction pressure of 2.5 bar. This corresponds to a specific process steam consumption of approximately 360 kg of steam per tonne of processed sugarcane. The remaining steam is split, with one portion continuing to expand through the low-pressure section of the turbine and the other being directed to the deaerator.
Steam is generated in a biomass-fired boiler with a nominal capacity of 150 t/h. During the technical survey, the boiler was operating at approximately half of its nominal steam-generation capacity. Plant records indicate that approximately 110 t/h is the highest steam-generation rate previously reached with the existing unit. The boiler design conditions are approximately 62 bar and 520 °C, whereas the operational current steam conditions are approximately 60 bar and 480 °C.
Electricity is generated by a single extraction-condensing steam turbine-generator set with a nominal capacity of approximately 33 MW. The turbine receives high-pressure steam from the boiler and supplies process steam through an extraction at approximately 2.5 bar. The remaining steam expands through the low-pressure section toward the condenser. Under the field operating condition, the condenser operates at approximately 0.06 bar absolute. The turbine manufacturer specifies an exhaust pressure of 0.16 bar absolute at the design condition, while the existing condenser has a nominal condensation capacity of approximately 40 t/h. The distinction between the field and design exhaust pressures is maintained throughout the analysis because the alternative scenarios do not necessarily reproduce the current operating condition.
Under the field operating condition, the plant generates approximately 10.66 MW of electricity. Approximately 5.66 MW is consumed internally by the industrial facility, whereas approximately 5.0 MW is exported to the electrical grid. Therefore, the observed operating point corresponds to approximately 32% of the nominal turbine-generator capacity. Based on the measured steam flow and electrical generation, the specific steam consumption is approximately 7.04 kg/kWh.
The main operating and design characteristics of the investigated plant are summarized in Table 1. The data show that the current cogeneration system operates considerably below the nominal capacity of its main equipment. Steam generation corresponds to 50% of the nominal boiler capacity, while the steam flow to the condenser is approximately 15 t/h, well below its nominal capacity of 40 t/h. This operating margin is relevant because additional steam production can be directed through the condensing section of the turbine while the industrial process steam demand remains approximately unchanged.
Table 1.
Main operating and design characteristics of the existing sugarcane plant and cogeneration system.
The simplified configuration of the existing cogeneration system under the current operating condition is shown in Figure 1. High-pressure steam produced in the boiler enters the extraction-condensing steam turbine, where approximately 60 t/h is extracted to supply the industrial process and the deaerator. The remaining flow, approximately 15 t/h, continues through the low-pressure section and is directed to the condenser, which operates at approximately 0.06 bar absolute under the field condition. The condensate is subsequently returned through the feedwater system and deaerator, completing the water-steam cycle.
Figure 1.
Simplified flow diagram of the existing sugarcane cogeneration system under the current operating condition.
The operating margin identified in Table 1 and illustrated in Figure 1 is central to the definition of the scenarios investigated in this study. The current steam-generation rate is substantially below the nominal boiler capacity, while the extraction-condensing turbine configuration allows part of any additional steam production to be converted into additional electricity without increasing the process steam demand. As the boiler load increases, however, the steam flow through the condensing section also increases and progressively approaches the capacity of the existing heat-rejection system. This interaction between underutilized installed capacity and equipment constraints provides the basis for the performance-improvement and repowering scenarios defined in Section 3.2.
3. Methodology
The methodology adopted in this study consists of five main stages: (i) definition of the current operating condition based on field data; (ii) development of alternative performance-improvement and repowering scenarios; (iii) thermodynamic simulation of all configurations; (iv) comparative assessment based on energy, exergy, environmental, and economic indicators; and (v) sensitivity analysis of selected thermodynamic and economic assumptions.
The current operating condition was adopted as the reference case. The alternative scenarios were defined progressively, considering increased steam-generation rates, greater use of available biomass resources, operation closer to the nominal capacity of the existing equipment, and, finally, an increase in the steam-cycle operating parameters. This structure allows the effects of operational recovery and technological repowering to be evaluated separately.
3.1. Current Plant Configuration
The reference configuration represents the current operating condition and was adopted as the Base Case for the thermodynamic analysis. The model was constructed from field measurements, plant operating records, equipment design data, and complementary information. The field data used for the Base Case were collected during a technical visit conducted in August 2025, where average values were selected to represent a typical operating day of the cogeneration plant.
Under the reference condition, the boiler produces approximately 75 t/h of steam at about 60 bar and 480 °C. Sugarcane bagasse is used as the sole fuel, and a boiler thermal efficiency of 80% is adopted to represent the partial-load operating condition, considering the performance data reported by [42,43]. The generated steam enters the extraction-condensing steam turbine, where approximately 60 t/h is extracted at 2.5 bar to satisfy the industrial process demand. Most of the remaining steam expands through the low-pressure section of the turbine and is directed to the condenser, while the smaller portion is directed to the deaerator.
Under the field operating condition, approximately 15 t/h of steam reaches the condenser at an operating pressure of 0.06 bar absolute. This value differs from the turbine design exhaust pressure of 0.16 bar absolute reported by the manufacturer. The field pressure was therefore adopted in the Base Case to reproduce the current operating condition, whereas the design pressure is considered in the definition of the higher-load scenarios discussed in Section 3.2.
The condensate leaving the condenser is returned through the condensate pump, deaerator, and feedwater pump to the boiler, completing the water-steam cycle. The deaerator pressure in the Base Case is approximately 1.27 bar.
The plant generates approximately 10.66 MW of electrical power under the field condition. Of this amount, approximately 5.66 MW is consumed internally and about 5.0 MW is exported to the electrical grid. These measured values characterize the actual operating condition of the plant and are subsequently used as references for comparison with the thermodynamic simulation.
The main input parameters adopted for the Base Case are summarized in Table 2. The values correspond either to field measurements or to operating assumptions required to reproduce the current plant condition.
Table 2.
Main input parameters adopted for the reference configuration.
As shown in Table 2, the Base Case represents a low-load operating condition relative to the installed capacity of the cogeneration system. The boiler operates at approximately half of its nominal steam-generation capacity, while the condenser receives substantially less steam than its nominal capacity. This operating margin forms the reference from which the progressively higher-load and repowering scenarios were defined.
3.2. Improvement and Repowering Scenarios
Three operating configurations were defined to evaluate progressively more intensive alternatives for improving the performance of the existing cogeneration system. The Base Case represents the actual operating condition and is referred to as Scenario 0, while Scenarios 1–3 progressively increase steam generation, biomass availability, and, in the final configuration, the thermodynamic parameters of the steam cycle.
The scenarios were established from the technical characteristics of the existing equipment, plant operating records, field measurements, and the potential recovery of sugarcane straw associated with mechanized harvesting. Figure 2 illustrates the progressive modifications adopted in each configuration, while the corresponding operating parameters are summarized in Table 3.
Figure 2.
Definition of the investigated performance-improvement and repowering scenarios.
Table 3.
Main operating parameters and modifications adopted for the Base Case and the investigated scenarios.
As illustrated in Figure 2, the proposed configurations were not defined as independent hypothetical plants, but as a progressive sequence of modifications starting from the current industrial condition. Scenario 1 primarily increases the utilization of the existing steam-generation capacity. Scenario 2 extends operation to the nominal boiler capacity and introduces the need for additional condensation capacity. Scenario 3 maintains the same nominal steam-generation rate as Scenario 2 but increases the steam pressure and temperature and introduces reheating, thereby representing a more extensive technological repowering of the steam cycle. Table 3 summarizes the principal operating parameters and modifications adopted for each configuration.
The Base Case represents the operating condition observed during the field survey and was adopted as the reference for all subsequent comparisons. The boiler produces 75 t/h of steam at approximately 60 bar and 480 °C using sugarcane bagasse as the sole fuel. The process steam demand is maintained at approximately 60 t/h, while the remaining steam expands through the low-pressure section of the turbine and is directed to the condenser operating at approximately 0.06 bar absolute. A small fraction of the steam flow extracted from the turbine is directed to the deaerator.
Scenario 1 represents an intermediate recovery of the installed cogeneration capacity. The boiler steam-generation rate is increased from 75 to 110 t/h, corresponding to the highest production level previously reached by the existing unit. The main steam conditions are increased to approximately 62 bar and 500 °C, while the boiler efficiency is maintained at 80%, due to the partial-load operating condition. Sugarcane straw is introduced as a supplementary fuel, corresponding to approximately 10% of the total biomass consumption on a mass basis.
The process steam demand remains approximately constant at 60 t/h. Consequently, most of the additional steam generated in Scenario 1 expands through the condensing section of the turbine. Under this condition, the simulated condenser steam flow reaches approximately 41.3 t/h, exceeding the nominal capacity of the existing condenser (40 t/h) by approximately 3.25%. Since the scenario was formulated without imposing the condenser nominal capacity as an explicit operating constraint, this value should be interpreted as an unconstrained simulation result rather than as a confirmed feasible operating condition. Practical implementation of Scenario 1 would therefore require verification of the actual allowable operating margin of the existing condenser or, alternatively, limitation of the steam flow directed to the condensing section. Such a restriction would reduce the achievable turbine power output and would consequently affect the corresponding energy and exergy performance. Therefore, the reported results for Scenario 1 represent the thermodynamic performance predicted by the model, while the practical feasibility of this operating point remains dependent on the actual condenser operating limits.
Scenario 2 considers operation at the nominal steam-generation capacity of the existing boiler. The steam flow is increased to 150 t/h while the main steam conditions are maintained at approximately 62 bar and 500 °C. A boiler thermal efficiency of 85% was adopted to represent operation near the design condition. This value is consistent with efficiencies reported in the literature for sugarcane bagasse-fired boilers operating at comparable pressure and temperature levels [6,16]. The fraction of sugarcane straw in the biomass mixture is increased to 20%.
Since the industrial process steam demand remains at approximately 60 t/h, the additional steam is predominantly directed through the condensing section of the turbine. The resulting condenser steam flow increases to approximately 77.4 t/h, substantially exceeding the nominal capacity of the existing 40 t/h condenser. Therefore, operation at the nominal boiler capacity requires additional condensation capacity. A second condensation unit with approximately 40 t/h capacity is considered for this configuration, allowing the combined heat-rejection system to accommodate the simulated low-pressure steam flow.
The turbine exhaust pressure adopted in Scenario 2 is 0.16 bar absolute, corresponding to the design exhaust pressure specified by the manufacturer. This condition differs from the 0.06 bar absolute measured under the current field operating condition and adopted in the Base Case and Scenario 1.
Because Scenario 2 requires a specific modification to the existing plant infrastructure, this configuration is also subjected to a complementary economic assessment. The analysis focuses on the additional condensation capacity required to enable operation at the nominal boiler steam-generation rate.
Scenario 3 represents the technological repowering of the steam cycle. The steam-generation rate is maintained at 150 t/h, allowing the effect of increasing the steam-cycle parameters to be evaluated without increasing the nominal steam flow relative to Scenario 2. The main steam pressure is increased from approximately 62 to 110 bar, the main steam temperature is increased to 520 °C, and a reheating stage at 500 °C is introduced.
The biomass mixture is maintained at 80% bagasse and 20% sugarcane straw. Given the higher steam pressure and temperature parameters adopted for the boiler in Scenario 3, a thermal efficiency of 90% was assumed based on the studies by Kamate and Gangavati [6]. The condenser pressure remains at the design value of 0.16 bar absolute. The higher-pressure configuration requires replacement or substantial modification of the existing steam-generation and turbine systems and therefore represents a more extensive repowering alternative than the previous scenarios.
The comparison between Scenarios 2 and 3 is particularly relevant because both configurations operate with the same nominal steam-generation rate and the same biomass composition. Consequently, differences in electrical and exergetic performance between these two cases result from the combined effects of the higher steam pressure and temperature, reheating, the modified turbine configuration, and the assumed changes in boiler and turbine performance.
This progressive definition allows the effects of recovering underutilized installed capacity to be distinguished from those resulting from technological repowering. The Base Case–Scenario 1 comparison mainly reflects increased utilization of the existing plant, the transition to Scenario 2 identifies the consequences of operating at the nominal boiler capacity and the associated condensation constraint, and the Scenario 2–Scenario 3 comparison provides a controlled comparison of the overall high-pressure repowering strategy at the same nominal steam-generation rate.
3.3. Thermodynamic Modeling
The thermodynamic models of the Base Case and the three alternative scenarios were developed using Thermoflex (Version 33) [44]. The simulations were constructed from the physical configuration of the existing cogeneration system, field measurements, equipment design data, manufacturer information, and the operating conditions defined for each scenario.
All configurations were evaluated under steady-state conditions. Variations in kinetic and potential energies were neglected. Under these assumptions, the mass balance applied to each control volume is expressed by Equation (1).
where is the mass flow rate. Equation (1) was applied to the individual components of the cogeneration system to ensure consistency between inlet and outlet mass flows.
The corresponding steady-state energy balance is given by Equation (2).
where h is the specific enthalpy, is the heat-transfer rate, and is the power transferred across the control-volume boundary. Equation (2) was used to determine the energy interactions and thermodynamic states throughout the cogeneration system [45].
The main components represented in the simulations were the biomass-fired boiler, extraction-condensing steam turbine, condenser, condensate and feedwater pumps, deaerator, and the industrial process steam demand. Scenario 3 additionally includes a high-pressure expansion section and steam reheating, according to the repowering configuration defined in Section 3.2.
For the Base Case, the main boundary conditions were established from the field operating data. Steam generation was fixed at 75 t/h, with main steam conditions of approximately 60 bar and 480 °C. The process steam demand was maintained at approximately 60 t/h at 2.5 bar, while most of the remaining steam expanded through the low-pressure turbine section toward the condenser. The condenser pressure was set to 0.06 bar absolute, corresponding to the current operating condition.
The operating parameters were progressively modified for the alternative scenarios according to Table 3. Scenario 1 retained a condenser pressure of 0.06 bar absolute, whereas Scenarios 2 and 3 adopted 0.16 bar absolute, corresponding to the turbine design exhaust pressure. The condenser pressure was therefore treated as a scenario-dependent operating parameter rather than as a common assumption for all configurations.
The turbine isentropic efficiencies were defined according to the operating condition and turbine arrangement represented in each model. For the Base Case, efficiencies of approximately 68.4% and 43.7% were calculated for the successive expansion sections. In Scenario 1, the corresponding efficiencies were approximately 72.3% and 43.7%. Scenario 2 adopted efficiencies of 85% and 80%, whereas Scenario 3 employed efficiencies of 85%, 85%, and 80% for the successive expansion sections of the reheated turbine configuration and extraction and condensate sections of the existing turbine. These assumptions fall within the range commonly adopted in thermodynamic models of sugarcane cogeneration systems [4,16]. Consequently, a single turbine efficiency was not imposed across all scenarios.
The electrical consumption associated with pumps and other auxiliary equipment was obtained directly from the Thermoflex models. The auxiliary power requirements therefore varied according to the steam flow rate, pressure levels, and configuration represented in each scenario rather than being determined from a single fixed pump efficiency.
For the combustion calculations, sugarcane bagasse with a moisture content of 50% on a mass basis was considered together with 30% excess air. Bagasse was used as the sole fuel in the Base Case, whereas sugarcane straw was progressively incorporated in Scenarios 1–3 according to the biomass fractions specified in Table 3.
The boiler efficiency was varied according to the technological conditions adopted for each configuration. Values of 80%, 80%, 85%, and 90% were considered for the Base Case and Scenarios 1, 2, and 3, respectively. These efficiencies were specified as model inputs and, together with the required steam flow rate and steam conditions, determined the biomass consumption calculated for each configuration.
Ambient conditions of 25 °C and 1.013 bar were adopted for all simulations, with a relative humidity of 60% for the atmospheric air used in the combustion calculations. The same temperature and pressure were subsequently adopted as the environmental reference state for the exergy analysis.
Pressure losses along pipes and heat exchangers were neglected. Heat losses from individual components were also neglected, except for those implicitly accounted for through the prescribed boiler efficiency. The principal assumptions adopted in the thermodynamic models are summarized in Table 4.
Table 4.
General assumptions adopted in the thermodynamic modeling.
As summarized in Table 4, the environmental conditions, biomass moisture content, combustion excess air, and treatment of pressure losses were maintained across the investigated configurations. In contrast, the steam conditions, boiler efficiency, turbine performance, biomass composition, and condenser pressure were modified according to the characteristics of each scenario. These parameters therefore constitute part of the physical differences among the investigated configurations rather than common modeling assumptions.
The Thermoflex modelling procedure was conducted using standard components from the Water/Steam library and the software’s default thermodynamic property settings. Bagasse and straw were modeled using the same dry-basis composition obtained from the Thermoflex Profuel library, differing only in their moisture contents. Table 5 shows the proximate and ultimate analysis, on a wet basis, for both fuels. For the simulations, the main assumptions included a 30% excess air ratio in the boiler, negligible pressure drops in the system and condenser, and zero Miscellaneous Auxiliary Power. The boiler model was defined by the steam flow rate, thermal efficiency, and steam outlet conditions, while the turbine model considered the inlet pressure as input data and a mechanical efficiency of 99.75%. The generator efficiency was assumed 95%. The deaerator was modeled by specifying its operating pressure as an input, which determined the extraction steam flow rate required for its operation. The main outputs obtained from the Thermoflex simulations include the mass flow rates and thermodynamic properties of the water-steam streams, biomass consumption, gross electrical power, auxiliary power consumption, net electrical power, plant efficiencies, and CO2 emissions. These results provide the basis for the energy, exergy, and environmental assessments described in Section 3.4, Section 3.5 and Section 3.6.
Table 5.
Proximate and ultimate analyses of sugarcane bagasse and straw used in the simulations.
For the exergy analysis, the thermodynamic properties required for the water-steam streams, particularly specific enthalpy and entropy, were evaluated using the Steam_IAPWS thermodynamic properties formulation, available in Engineering Equation Solver (EES, Professional V9.908) [46]. The thermodynamic states obtained from the plant simulations were subsequently used in the exergy model to determine stream exergies and component-level exergy destruction and losses relative to the environmental reference state. The corresponding formulation is presented in Section 3.5.
Finally, the Base Case was compared with the operating data collected during the technical survey to assess the agreement between the modeled and actual plant conditions. The comparison considered the main steam-flow variables and the electrical generation available from the field measurements. The corresponding results are presented in Section 4.1.
3.4. Energy Analysis
The energy performance of the cogeneration system was evaluated from the thermodynamic simulation results. The main indicators considered were gross electrical power, auxiliary power consumption, net electrical power, net electrical efficiency, useful thermal energy supplied to the industrial process, and overall cogeneration efficiency. The same system boundaries and definitions were applied to all configurations to ensure a consistent comparison among the Base Case and the three investigated scenarios.
The net electrical power generated by the cogeneration system was determined as the difference between the gross electrical power produced by the turbine-generator set and the electrical demand of the auxiliary equipment according to Equation (3).
where is the net electrical power, is the gross electrical power produced by the turbine-generator set, and is the total auxiliary electrical consumption. The latter includes the electrical demand associated with the equipment represented within the cogeneration system boundary, including pumps and boiler auxiliaries.
The energy input associated with the biomass fuels was evaluated on a lower-heating-value basis. For the configurations in which sugarcane bagasse and straw are simultaneously used, the total fuel energy input was calculated by Equation (4).
where and are the mass flow rates of bagasse and sugarcane straw, respectively, and LHVbag and LHVstraw are their corresponding lower heating values, obtained directly from the Thermoflex database. For the Base Case, in which bagasse is the sole biomass fuel, the straw contribution in Equation (4) is zero.
The net electrical efficiency was defined as the ratio between net electrical power and the total biomass energy input according to Equation (5).
where ηel represents the fraction of the chemical energy supplied by the biomass that is converted into net electrical power. This indicator was used to assess the effect of increasing steam generation and modifying the steam-cycle configuration on electricity production.
Because the investigated plant operates in cogeneration mode, the useful thermal energy supplied to the ethanol production process was also quantified. The process thermal demand was calculated from the enthalpy difference between the extracted steam supplied to the process and the condensate returning to the cogeneration system according to Equation (6).
where is the process steam mass flow rate, hsteam is the specific enthalpy of the steam supplied to the industrial process, and hreturn is the specific enthalpy of the returning condensate. Equation (6) therefore represents the thermal energy effectively transferred to the industrial process rather than the total enthalpy flow associated with the extracted steam.
The overall energy efficiency of the cogeneration system was then calculated by considering both useful electrical and thermal products—Equation (7).
where ηCHP represents the fraction of the biomass energy input converted into useful net electrical power and process heat. In contrast to the net electrical efficiency defined by Equation (5), the overall cogeneration efficiency accounts for the dual-purpose operation of the plant and provides a complementary measure of biomass energy utilization.
The indicators defined by Equations (3)–(7) were calculated with Thermoflex software (Version 33), using the same methodological basis for all configurations. Since the industrial process steam demand was maintained approximately constant at 60 t/h, changes in the energy indicators primarily reflect differences in biomass consumption, steam-generation rate, auxiliary power requirements, condenser operating conditions, and steam-cycle parameters. The resulting energy performance is presented and discussed in Section 4.2.
3.5. Exergy Analysis
The exergy analysis was performed to quantify the thermodynamic inefficiencies associated with the main components of the cogeneration system and to evaluate how the proposed improvement and repowering strategies affect the utilization of the available biomass resources. The same environmental reference state adopted in the thermodynamic model was used, with T0 = 25 °C and p0 = 1.013 bar.
For the water-steam streams, kinetic and potential exergies were neglected. Since the chemical composition of the working fluid does not change throughout the steam cycle, the exergy variation in these streams was evaluated from their physical exergy, according to [45]. The specific physical exergy was calculated from the enthalpy and entropy differences relative to the environmental reference state according to Equation (8).
where ePH is the specific physical exergy, h and s are the specific enthalpy and entropy of the stream, and h0 and s0 are the corresponding properties evaluated at the reference state. This formulation is consistent with the conventional treatment of water-steam streams in exergy analysis, for which changes in chemical exergy are not considered when the chemical composition remains unchanged.
The exergy rate associated with each water-steam stream was subsequently calculated by Equation (9), where is the physical exergy rate and is the corresponding mass flow rate.
The exergy input associated with the biomass fuels was evaluated from their chemical exergy. For solid biomass, the specific chemical exergy was estimated using the Szargut and Styrylska formulation reported in [6,21,22], which relates the fuel chemical exergy to its lower heating value and composition. The general expression adopted is stated in Equation (10).
where is the specific chemical exergy of biomass fuel j, LHVj is its lower heating value, wj is the moisture mass fraction, sj is the sulfur mass fraction, and βj is a dimensionless coefficient determined from the elemental composition of the biomass. The subscript j identifies either sugarcane bagasse or sugarcane straw.
For both sugarcane bagasse and straw, the adopted calculation basis uses β = 1.127 as it depends on the biomass elemental composition on a dry basis [22]. Both fuels were modeled using the same dry-basis composition obtained from the Thermoflex library, differing only in their moisture contents. Therefore, the same coefficient value was applied to both fuels when estimating their chemical exergy. This treatment avoids assuming that bagasse and straw have the same thermodynamic quality. The use of the Szargut method for estimating the specific exergy of sugarcane bagasse is consistent with previous thermoeconomic analyses of sugarcane systems.
For configurations using both biomass fuels, the total chemical exergy input was calculated as by Equation (11).
where and are the mass flow rates of bagasse and sugarcane straw, respectively, and and are their corresponding specific chemical exergies. For the Base Case, the second term of Equation (11) is equal to zero because bagasse is the sole biomass fuel.
The exergy analysis of the cogeneration system was performed using a fuel–product approach commonly adopted in thermoeconomic assessments, including those conducted by Cavalcanti et al. [22,33]. Within this framework, each component is characterized by an exergy fuel, representing the resources consumed to perform its function, and an exergy product, representing the useful thermodynamic effect obtained. The exergetic efficiency of each component is defined as the ratio of its exergy product to its exergy fuel. Considering both internal irreversibilities and exergy losses, the fuel–product exergy balance can be expressed by Equation (12) [22].
where and are the exergy rates associated with the fuel and product of component (k), respectively; represents the exergy destroyed by internal irreversibilities; and represents exergy losses that are not recovered as useful products, including exergy carried by discarded material streams or transferred to the surroundings. Therefore, the portion of the supplied fuel exergy that is not converted into the useful product corresponds to the combined effect of internal irreversibilities and exergy losses. When these contributions are not evaluated separately, their sum is represented by the combined exergy destruction and losses, denoted in this study by . Accordingly, this term, as adopted in the present analysis, represents the combined contribution of internal exergy destruction and exergy losses, rather than internal irreversibilities alone.
For the turbine sections, the exergy product was defined as the mechanical power generated, whereas the exergy fuel corresponds to the decrease in the physical exergy of the steam between the inlet and outlet streams. For the pumps, the exergy fuel was defined as the mechanical power consumed, while the exergy product corresponds to the increase in the physical exergy of the working fluid. For the boiler, the chemical exergy of the biomass was considered the exergy fuel, and the increase in the physical exergy of the water–steam stream was defined as the useful exergy product. In the boiler analysis, the physical and chemical exergies of the flue gases leaving the control volume were not calculated separately. Consequently, the portion of the supplied fuel exergy that is not converted into the useful product encompasses both internal irreversibilities and exergy losses, particularly those associated with the exhaust gases. This treatment is consistent with the objective of the present study, which focuses on comparing the thermodynamic performance of different plant configurations rather than separately quantifying all exergy-loss mechanisms within individual components.
The total exergy destruction and losses of the cogeneration plant were obtained by summing the contributions of all components according to Equation (13).
To evaluate the relative contribution of each component to the overall plant internal irreversibilities and losses, the combined exergy destruction and loss ratio was calculated by Equation (14).
where yD/L,k represents the fraction of the total plant exergy destruction and losses associated with component k. This indicator allows changes in the distribution of irreversibilities and losses to be compared among configurations with different biomass inputs and steam-generation rates.
The useful exergy associated with the industrial process steam was determined from the reduction in physical exergy between the extracted steam supplied to the process and the returning condensate according to Equation (15).
where and are the specific physical exergies of the process steam and condensate return, respectively. Equation (15) therefore represents the useful thermodynamic potential transferred from the cogeneration system to the industrial process.
The overall exergetic efficiency of the cogeneration system was defined by Equation (16) considering both useful net electrical power and useful process-steam exergy [45].
where ηex is the overall exergetic efficiency and is the total chemical exergy supplied by the biomass. The use of net electrical power in Equation (16) maintains the same system boundary adopted in the energy analysis and avoids overestimating the useful electrical product by neglecting auxiliary consumption.
The exergy indicators defined by Equations (8)–(16) were applied consistently to the Base Case and to all alternative scenarios. The analysis therefore allows the effects of increased steam generation, biomass co-firing, changes in boiler efficiency, condenser operating conditions, and higher steam-cycle parameters on both the magnitude and the distribution of irreversibilities to be assessed on a common basis. The resulting component-level exergy destruction and losses and overall exergetic efficiencies are presented and discussed in Section 4.3.
3.6. Environmental Assessment
The environmental assessment was performed to evaluate how the proposed performance-improvement and repowering strategies affect the CO2 emissions associated with biomass combustion. Two complementary indicators were considered: the total CO2 emission rate and the specific CO2 emission per unit of net electricity generated. This distinction is necessary because the investigated scenarios differ substantially in biomass consumption and electrical output.
The total CO2 emission rate, , was obtained directly from the combustion calculations performed in Thermoflex. The software determines the flue-gas composition from the biomass flow rate, fuel characteristics, and combustion conditions adopted for each scenario. Consequently, changes in bagasse and straw consumption directly affect the total amount of CO2 released by the cogeneration system.
Because the scenarios produce different amounts of electricity, the absolute CO2 emission rate alone is not sufficient to compare their environmental performance. Therefore, the specific CO2 emission was calculated by Equation (17).
where is the specific CO2 emission, is the total CO2 emission rate from biomass combustion, and is the net electrical power generated by the cogeneration system. When is expressed in t/h and in MW, Equation (17) provides the emission intensity directly in tCO2/MWh.
Equation (17) was adopted as the main environmental performance indicator because it relates the amount of CO2 released to the useful electrical output of the plant. A reduction in therefore indicates that a larger amount of net electricity is generated per unit of CO2 emitted. This reduction may occur even when the absolute hourly CO2 emission increases as a consequence of higher biomass consumption.
To quantify the variation relative to the current plant condition, the percentage reduction in specific CO2 emissions for each alternative scenario was calculated by Equation (18).
where is the percentage reduction in specific CO2 emissions for scenario i, is the specific emission of the Base Case, and is the corresponding value for the evaluated scenario. Equation (18) therefore expresses the reduction in CO2 intensity relative to the current operating condition.
The environmental indicators defined by Equations (17) and (18) were calculated using net electrical power, consistently with the energy and exergy analyses. This common basis allows the increase in electricity generation and the corresponding change in CO2 intensity to be evaluated simultaneously for all configurations.
The CO2 emissions considered in this study correspond exclusively to the direct emissions resulting from biomass combustion within the cogeneration plant boundary. Therefore, the analysis does not constitute a life-cycle greenhouse-gas assessment. Emissions associated with sugarcane cultivation, harvesting, straw recovery, biomass transport, equipment manufacturing, electricity transmission, and other upstream or downstream processes were not included.
Biomass-derived CO2 was reported as the physical amount of carbon dioxide released during combustion and was not assigned a zero-emission factor. Accordingly, the environmental results should be interpreted in terms of direct emission flow and specific CO2 intensity. A reduction in specific emissions does not necessarily imply a reduction in the absolute quantity of CO2 released by the plant.
The total and specific CO2 emissions, together with their variations relative to the Base Case, are presented and discussed in Section 4.4.
3.7. Economic Assessment
The economic assessment was based on the incremental net electrical power between consecutive scenarios. Since the industrial electrical demand outside the cogeneration-system boundary was assumed to remain unchanged among the investigated configurations, this demand cancels in the incremental comparison. The scenario-specific auxiliary electricity consumption is already included in the simulated net electrical power. Accordingly, the incremental powers considered in the economic assessment were 13.927 MW for the transition from Scenario 1 to Scenario 2 and 5.744 MW for the transition from Scenario 2 to Scenario 3.
A complementary incremental economic assessment was performed for Scenarios 2 and 3 to evaluate the economic implications of the two main levels of plant modification identified in the thermodynamic analysis. The assessment was conducted sequentially. Scenario 2 was evaluated relative to Scenario 1 to determine the economic performance of the additional condensation capacity required to enable operation at the nominal boiler steam-generation rate. Scenario 3 was subsequently evaluated relative to Scenario 2 to assess whether the additional electrical output obtained through technological repowering compensates for the investment required in the high-pressure boiler and turbine system.
The economic assessment was based on the incremental net electrical power between consecutive scenarios. Since the industrial electrical demand outside the cogeneration-system boundary was assumed to remain unchanged among the investigated configurations, this demand cancels when the incremental electrical output is calculated. Therefore, no additional subtraction of the plant internal electricity consumption was required in the incremental comparison. The scenario-specific auxiliary electricity consumption of the cogeneration system is already included in the simulated net electrical power. Accordingly, the incremental powers considered in the economic assessment were 13.927 MW for the transition from Scenario 1 to Scenario 2 and 5.744 MW for the transition from Scenario 2 to Scenario 3.
The incremental electrical power associated with each transition was determined by Equation (19).
where ΔPel,i is the additional net electrical power generated in configuration i relative to the preceding configuration.
The corresponding additional annual electricity generation was calculated from the incremental electrical power and the annual operating time according to Equation (20).
where Eadd is the additional annual electricity generation and top is the annual operating time. A reference operating time of approximately 3300 h/year was adopted. This value was calculated from the average annual sugarcane processing of approximately 550,000 t/year and the average milling rate of 166.7 t/h.
Eadd = ΔPel top
The incremental annual gross revenue from electricity sales was calculated according to Equation (21).
where Radd is the additional annual revenue and pel is the electricity selling price. A reference electricity price of 125.16 BRL/MWh was adopted [47]. An exchange rate of 5.55 BRL/US$ was used, corresponding to an electricity price of approximately 22.55 US$/MWh for the economic calculations.
Annual operation and maintenance costs were estimated as a fixed fraction of the incremental capital investment according to Equation (22) [48].
where fO&M is the annual operation and maintenance factor. A value of 6% of the corresponding incremental CAPEX was adopted. The reference electricity selling price of 125.16 BRL/MWh was adopted from the Brazilian electricity-sector source cited in this section [47]. Since electricity prices are subject to market variation, this value was treated as a reference assumption rather than as a guaranteed long-term selling price. The annual O&M cost was estimated as 6% of the incremental CAPEX, consistent with the screening-level methodology reported by Peters et al. [48] for maintenance and repair costs in process industries. Because both parameters are subject to uncertainty, their influence was explicitly evaluated in the economic sensitivity analysis presented in Section 4.6
The annual incremental net cash flow was subsequently calculated according to Equation (23).
where CF is the annual net cash flow associated with the evaluated modification.
For configurations presenting a positive annual cash flow, the simple payback period was determined according to Equation (24) [49].
where PB is the simple payback period, expressed in years.
The net present value was determined by considering the time value of money over the economic lifetime of the investment according to Equation (25) [49].
where CFn is the net cash flow in year n, i is the annual discount rate, and N is the economic lifetime of the investment. An annual discount rate of 12% and an economic lifetime of 20 years were adopted as reference economic assumptions. The influence of the discount rate was subsequently evaluated through the sensitivity analysis presented in Section 4.6, while the financial indicators were calculated according to the conventional discounted-cash-flow formulations presented in [49].
The internal rate of return was defined as the discount rate that makes the net present value equal to zero according to Equation (26) [49].
where IRR is the internal rate of return. For configurations in which the incremental annual cash flow remains negative throughout the project lifetime, neither a conventional positive IRR nor a payback period can be obtained.
The discounted payback period was additionally determined from the cumulative discounted cash flow. The discounted cash flow in year n was calculated according to Equation (27) [49].
The discounted payback corresponds to the time required for the cumulative discounted cash flows to recover the initial investment.
For the transition from Scenario 1 to Scenario 2, the incremental investment was US$594,679.27, corresponding to the additional condensation capacity required to accommodate the increased low-pressure steam flow. For the transition from Scenario 2 to Scenario 3, the incremental investment was US$21,153,238.21, comprising US$18,173,621.72 for the high-pressure boiler and US$2,979,616.49 for the turbine system [50]. The condenser investment was not included again in Scenario 3 because the additional condensation capacity had already been incorporated in Scenario 2.
The economic assessment should be interpreted as a screening-level incremental analysis. The transition from Scenario 1 to Scenario 2 involves simultaneous changes in steam generation, biomass consumption, straw participation, boiler efficiency, turbine performance, and condenser operating conditions. Therefore, the additional electrical output cannot be attributed exclusively to the condenser. The additional condensation capacity is treated as an enabling investment required to remove the heat-rejection constraint and allow operation of the integrated Scenario 2 configuration. Similarly, the economic performance of Scenario 3 represents the incremental effect of the overall repowering configuration relative to Scenario 2 rather than the isolated contribution of a single equipment modification.
Because the economic results depend on assumptions such as annual operating time, electricity selling price, annual O&M cost, and discount rate, their influence was additionally evaluated through the sensitivity analysis described in Section 3.8.
3.8. Sensitivity Analysis
A one-at-a-time sensitivity analysis was performed to quantify the individual influence of selected thermodynamic and economic assumptions on the main results and to assess the sensitivity of the conclusions within the investigated parameter ranges. Each parameter was varied independently while the remaining operating conditions were maintained at their corresponding reference values.
The thermodynamic sensitivity analysis was centered on Scenario 2 because the transition from Scenario 1 to Scenario 2 involves simultaneous changes in steam-generation rate, boiler efficiency, condenser pressure, and turbine performance. Three parameters were considered: boiler thermal efficiency, condenser pressure, and turbine isentropic efficiency.
Boiler thermal efficiency was varied from 80% to 90% around the reference value of 85% adopted for Scenario 2. Since the steam-generation rate and steam conditions were maintained at 150 t/h, 62 bar, and 500 °C, respectively, the variation in boiler efficiency primarily affects the biomass flow required to supply the prescribed thermal duty and, consequently, the fuel-based energy and exergy indicators. The turbine operating conditions were maintained unchanged in this analysis.
The influence of condenser pressure was evaluated by varying the exhaust pressure between 0.06 and 0.20 bar, including the reference value of 0.16 bar adopted in Scenario 2. The steam flow rate, turbine inlet and extraction conditions, and condensing-section isentropic efficiency were maintained at their reference values. This procedure allows the isolated influence of condenser pressure on low-pressure turbine expansion and electrical power generation to be quantified.
The sensitivity to turbine performance was assessed by varying the isentropic efficiencies of the extraction and condensing sections by ±5 percentage points relative to the Scenario 2 reference values of 85% and 80%, respectively. In addition, a first-order diagnostic calculation was performed using the lower isentropic efficiencies associated with Scenario 1 while maintaining the Scenario 2 steam flow rates and thermodynamic boundary conditions. This additional calculation was used to estimate the influence of the assumed turbine-performance improvement on the difference in electrical generation between Scenarios 1 and 2. Because turbine efficiency, extraction conditions, and low-pressure expansion are thermodynamically coupled, this calculation was interpreted as a sensitivity indicator rather than as a strict additive decomposition of the scenario-to-scenario power difference.
The thermodynamic sensitivity calculations were performed by post-processing the Scenario 2 thermodynamic states using EES [46]. The EES representation reproduced the Thermoflex gross and net electrical powers with deviations of approximately 0.11%, providing a consistent basis for the parametric calculations. For Scenario 2, Thermoflex predicted gross and net electrical powers of 33.130 and 32.560 MW, respectively, whereas the corresponding EES results were 33.164 and 32.592 MW.
A complementary economic sensitivity analysis was also defined to evaluate the influence of the assumptions that most directly affect the incremental economic indicators. The parameters considered were annual operating time, electricity selling price, annual operation and maintenance factor, and discount rate. Each parameter was varied independently around its reference value while the remaining economic assumptions were held constant. The purpose of this analysis was to assess how individual variations in the principal economic assumptions affect the conclusions obtained for the transitions from Scenario 1 to Scenario 2 and from Scenario 2 to Scenario 3.
The sensitivity analysis was intended to quantify the individual influence of the principal thermodynamic and economic assumptions rather than to define additional plant configurations or optimized operating points. Since the parameters were varied independently, potential interactions and combined effects were not evaluated. The corresponding results are presented and discussed in Section 4.6.
4. Results and Discussion
The results obtained from the thermodynamic simulations are presented and discussed in this section. The analysis is organized to first verify the ability of the Base Case model to reproduce the actual operating condition of the plant and, subsequently, to compare the performance of the improvement and repowering scenarios.
The discussion is structured according to the main evaluation criteria adopted in the methodology. Section 4.1 presents the Base Case model verification through comparison of simulated outputs with representative operating values obtained from the plant’s field data. Section 4.2 and Section 4.3 discuss the energy and exergy performance of the investigated configurations, respectively. Section 4.4 evaluates the variation in total and specific CO2 emissions, while Section 4.5 presents the incremental economic assessment. Section 4.6 presents the thermodynamic and economic sensitivity analyses, quantifying the influence of the main modeling and economic assumptions. Finally, Section 4.7 provides an integrated comparison among the investigated scenarios, highlighting the main trade-offs associated with capacity recovery and steam-cycle repowering.
4.1. Base-Case Model Verification and Current Operation
The Base Case was developed to reproduce the operating condition observed during the technical survey and to provide a consistent reference for the subsequent scenario comparisons. Since the steam-generation rate, process steam demand, main steam conditions, and condenser pressure were obtained from the plant and used as model boundary conditions, these variables were not treated as independent validation quantities. Instead, model verification focused on comparing simulated gross electrical generation and condenser steam flow rate with representative operating values obtained from the plant’s field data. Additionally, the isentropic efficiencies of both turbine sections were calculated by Thermoflex from the prescribed inlet and outlet thermodynamic conditions, including the measured steam temperatures and pressures, rather than being assumed as input parameters, as discussed in Section 3.3.
The main input variables and simulated results for the Base Case are summarized in Table 6. Their respective roles are explicitly identified to distinguish prescribed inputs from independently evaluated model outputs.
Table 6.
Comparison between field data and Thermoflex results for the Base Case.
Most of the quantities reported for the Base Case were prescribed as model input variables and therefore do not constitute independent validation results. Model verification was based on comparing two calculated outputs, gross electrical generation and condenser steam flow rate, with representative operating values obtained from the plant’s field data. Although these comparisons provide a basis for assessing model consistency, the limited availability of additional independent measurements does not support comprehensive experimental validation.
As shown in Table 6, the simulated steam-flow distribution is consistent with the operating condition represented in Figure 1. Of the 75 t/h of steam generated by the boiler, approximately 60 t/h is supplied to the industrial process, 13.87 t/h is directed to the condenser, and the remaining 1.13 t/h is used for deaeration. The condenser steam flow rate obtained from the plant’s operating data was approximately 15.0 t/h, corresponding to a relative deviation of 7.5% from the simulated value. This comparison provides an additional criterion for verifying the Base Case model.
Gross electrical generation provided the main reference for assessing the agreement between the simulated performance and the plant’s operating data. The field records indicate a total electrical generation of approximately 10.66 MW, whereas the Thermoflex model predicts a gross turbine-generator output of approximately 11.07 MW. The corresponding relative difference is approximately 3.8%. Considering that the model represents the plant under steady-state conditions, while the field value reflects an actual industrial operating condition subject to temporal variations, equipment condition, and measurement uncertainty, the agreement is considered adequate for the comparative purpose of the present study.
It is important to distinguish the simulated gross and net electrical powers. The Thermoflex model predicts approximately 11.07 MW of gross electrical power and approximately 10.80 MW after accounting for about 0.27 MW of cogeneration-system auxiliary consumption. The measured value of 10.66 MW corresponds to the total electrical generation reported by the plant and should therefore be compared with the simulated gross generation rather than with the simulated net power. The plant internal electrical demand of approximately 5.66 MW includes industrial consumers outside the auxiliary boundary adopted in the thermodynamic model and is therefore not directly comparable with the simulated auxiliary consumption.
The Base Case also confirms that the cogeneration system operates substantially below the nominal capacity of its principal equipment. The boiler produces 75 t/h of steam, corresponding to 50% of its nominal capacity of 150 t/h, while the turbine-generator produces approximately one-third of its installed 33 MW capacity. The condenser receives approximately 15 t/h of steam, corresponding to less than 40% of its nominal condensation capacity of 40 t/h. These operating margins confirm that the current limitation is not associated with the nominal capacity of a single major component under the Base Case condition.
The thermodynamic model further indicates a bagasse consumption of approximately 35.92 t/h for the Base Case. This value is lower than the approximately 46.7 t/h of bagasse estimated to be generated from the average sugarcane milling rate. The distinction is relevant: the former represents the fuel requirement calculated for the boiler under the modeled operating condition, whereas the latter represents the approximate biomass production associated with cane processing. Therefore, these quantities should not be interpreted as contradictory measurements.
The calculated performance indicators for the Base Case provide the reference against which the alternative configurations are evaluated. The model yields a net electrical power of approximately 10.80 MW, a net electrical efficiency of 14.19%, and an overall cogeneration energy efficiency of 66.72%. The corresponding overall exergetic efficiency is approximately 20.80%. Direct CO2 emissions from biomass combustion are approximately 31.99 t/h, corresponding to a specific emission of approximately 2.96 tCO2/MWh of net electricity generated. These indicators are examined comparatively in Section 4.2, Section 4.3 and Section 4.4 rather than interpreted in isolation at this stage.
The Base Case therefore serves two purposes in the analysis. First, it reproduces the principal operating characteristics of the existing plant, showing reasonable agreement between simulated results and representative operating values for gross electrical generation and condenser steam flow rate. Second, it establishes the thermodynamic reference from which the effects of recovering underutilized installed capacity and subsequently repowering the steam cycle can be quantified.
4.2. Energy Performance
The energy performance of the investigated configurations was evaluated from the simulated steam-generation rate, gross electrical power, auxiliary power consumption, net electrical power, net electrical efficiency, and overall cogeneration efficiency. Table 7 summarizes the updated energy indicators for the Base Case and Scenarios 1–3.
Table 7.
Energy performance of the Base Case and the investigated improvement and repowering scenarios.
As shown in Table 7, the progressive increase in steam generation results in a substantial increase in electrical output. The net power rises from 10.800 MW in the Base Case to 18.633 MW in Scenario 1, corresponding to an increase of approximately 72.5%. This gain is mainly associated with greater utilization of the existing steam-generation and turbine capacities. Although the main steam pressure increases slightly from approximately 60 to 62 bar, the dominant effect in this transition is the increase in steam flow through the turbine rather than a major modification of the thermodynamic quality of the steam cycle. However, the simulated condenser steam flow in Scenario 1 reaches approximately 41.3 t/h, slightly exceeding the nominal capacity of the existing condenser (40 t/h). Therefore, the reported electrical output for Scenario 1 should be interpreted as an unconstrained thermodynamic result. Its practical achievement would depend on verification of the actual condenser operating margin or on restricting the steam flow to the condensing section, which would reduce the corresponding power output.
The transition from Scenario 1 to Scenario 2 produces a further increase in net electrical power from 18.633 to 32.560 MW, corresponding to approximately 74.7%. In this configuration, steam generation reaches the nominal boiler capacity of 150 t/h. Because the process steam requirement remains approximately constant at 60 t/h, most of the additional steam becomes available for further expansion through the condensing section of the turbine. The increase in electricity generation therefore reflects the combined effect of the higher steam flow, the higher assumed boiler efficiency, the increased use of straw, and the operating conditions adopted for Scenario 2.
This transition also reveals an important plant constraint. Scenario 1 already brings the existing condenser slightly exceeding the nominal capacity, whereas Scenario 2 requires a substantially higher low-pressure steam flow. Consequently, the additional electrical output of Scenario 2 cannot be achieved by increasing boiler load alone; additional condensation capacity is required to sustain operation at the nominal boiler steam-generation rate. The economic implications of this modification are addressed in Section 4.5. Therefore, the reported electrical output for Scenario 1 should be interpreted as an unconstrained thermodynamic result. Its practical achievement would depend on verification of the actual condenser operating margin or on restricting the steam flow to the condensing section
The comparison between Scenarios 2 and 3 is thermodynamically different from the previous transitions. Both configurations operate at the same steam-generation rate of 150 t/h and with the same nominal bagasse-straw proportion. The increase in net electrical power from 32.560 to 38.304 MW therefore occurs without an increase in nominal steam production. The additional 5.744 MW corresponds to an increase of approximately 17.6% relative to Scenario 2 and is mainly associated with the higher main steam pressure and temperature, reheating, the improved boiler efficiency, and the modified turbine configuration adopted in the repowering case.
The net electrical efficiency follows the same overall tendency. It increases from 14.19% in the Base Case to 16.98% in Scenario 1 and to 23.12% in Scenario 2. Scenario 3 reaches 27.44%. The transition from Scenario 2 to Scenario 3 therefore increases the net electrical efficiency by 4.32 percentage points, corresponding to a relative improvement of approximately 18.7%. This comparison is particularly relevant because the two scenarios operate with the same nominal steam-generation rate. The increase therefore reflects a more effective conversion of the biomass energy input into electricity rather than a simple increase in steam production.
The behavior of the overall cogeneration efficiency differs from that of the electrical efficiency. The Base Case presents the highest value, 66.72%, followed by 53.38% in Scenario 1 and 50.31% in Scenario 2. Scenario 3 increases the overall cogeneration efficiency to 54.85%. This behavior results from the approximately constant industrial process steam demand. As steam generation increases from the Base Case to Scenarios 1 and 2, a larger fraction of the biomass energy input is directed toward condensing power generation, while the useful thermal product supplied to the ethanol process changes comparatively little. The additional low-pressure expansion also increases the fraction of energy ultimately rejected through the condenser. Consequently, the overall first-law efficiency decreases even though electrical generation and electrical efficiency increase.
The increase from 50.31% in Scenario 2 to 54.85% in Scenario 3 has a different origin. Since the steam-generation rate remains at 150 t/h, the higher-pressure and reheated cycle produces more electrical work from a similar thermal-production requirement. Thus, the repowering configuration partially recovers the overall cogeneration efficiency while simultaneously increasing the net electrical efficiency.
Auxiliary power consumption of the cogeneration system also increases across the scenarios, from 0.270 MW in the Base Case to 0.418 MW in Scenario 1, 0.570 MW in Scenario 2, and 1.021 MW in Scenario 3. The largest increase occurs in the repowered configuration because the higher pressure level and more complex steam-cycle arrangement impose additional pumping and auxiliary requirements. Nevertheless, the growth in gross electrical generation is considerably larger than the corresponding increase in auxiliary consumption, and the net electrical output therefore increases in every scenario.
Considering the full progression from the Base Case to Scenario 3, the net electrical power increases from 10.800 to 38.304 MW, corresponding to an overall increase of approximately 254.7%. Accordingly, the surplus electricity generation increases from 30.83 to 195.83 kWh/t of sugarcane processed, reaching levels comparable to those reported by Alves et al. [7]. This overall comparison should not, however, be interpreted as the effect of a single modification. It combines the recovery of currently underutilized installed capacity, increased biomass utilization, changes in boiler efficiency and condenser operating conditions, and, finally, technological repowering of the steam cycle. For this reason, the Base Case–Scenario 2 progression is more representative of capacity recovery, whereas the Scenario 2–Scenario 3 comparison provides the clearest indication of the additional effect of repowering at a fixed nominal steam-generation rate.
The energy results therefore identify two distinct improvement mechanisms. The first is the recovery of underutilized plant capacity, limited progressively by the existing condensation system. The second is the increase in thermodynamic quality of the steam cycle, which allows additional electricity generation without increasing the nominal steam-generation rate. The thermodynamic origin of these differences is examined in greater detail through the exergy analysis presented in Section 4.3.
4.3. Exergy Performance
The exergy analysis was used to identify how the progressive modifications in plant configuration affect both the overall second-law performance and the distribution of thermodynamic irreversibilities and losses. Table 8 summarizes the main exergetic indicators obtained for the Base Case and Scenarios 1–3.
Table 8.
Main exergy performance indicators for the investigated configurations.
As shown in Table 8, the Base Case presents an overall exergetic efficiency of 20.80%. In Scenario 1, the value decreases slightly to 20.24%, despite the substantial increase in electrical generation discussed in Section 4.2. This behavior results from the fact that the increase in useful exergy output is accompanied by a proportionally larger increase in the chemical exergy supplied by the additional biomass. The process exergy remains practically unchanged, whereas the additional steam is predominantly directed through the condensing power-generation path. Consequently, the increase in biomass exergy input is not fully converted into useful electrical and process exergy in this intermediate configuration. Kamate and Gangavati [6] reported exergetic efficiency values similar to those obtained in the present scenarios, despite considering lower steam operating conditions (31 bar and 388 °C), whereas Cavalcante et al. [22] reported an exergetic efficiency of 18.73% for a sugarcane bagasse cogeneration system operating at similar steam conditions (67 bar and 520 °C).
The total exergy destruction and losses increased from 80.575 MW in the Base Case to 114.279 MW in Scenario 1. This increase should not be interpreted by itself as a deterioration of the system, because the plant is processing a substantially larger exergy input. Absolute exergy destruction and exergy losses depend on the scale of the energy conversion process, whereas the exergetic efficiency provides a normalized measure of how effectively the available fuel exergy is converted into useful products.
The boiler is the dominant source of combined exergy destruction and losses in all configurations, a similar behavior to those reported in [16]. Its combined exergy destruction and losses increase from 74.648 MW in the Base Case to 103.253 MW in Scenario 1 and 125.717 MW in Scenario 2, before decreasing to 117.572 MW in Scenario 3. In relative terms, the boiler accounts for approximately 92.6% of the total plant exergy destruction and losses in the Base Case, 90.4% in Scenario 1, 85.1% in Scenario 2, and 83.7% in Scenario 3. The reduction in this relative contribution as the system is upgraded indicates that the combined irreversibilities and losses term become more distributed among the remaining plant components, although steam generation remains by far the principal source of combined exergy destruction and losses.
The transition from Scenario 1 to Scenario 2 produces an increase in total exergy destruction and losses from 114.279 to 147.698 MW, mainly because the biomass exergy input and steam-generation rate increase substantially. At the same time, however, the exergetic efficiency rises from 20.24% to 23.50%. This indicates that the useful exergy products increase more rapidly than the fuel exergy input. The higher boiler efficiency and the increased electrical output therefore compensate, on a relative basis, for the larger absolute irreversibilities and losses associated with the higher-capacity operating condition.
The condenser’s combined exergy destruction and losses also become more significant as the condensing steam flow increases. They rise from only 0.345 MW in the Base Case to 1.024 MW in Scenario 1 and approximately 4.33 MW in Scenarios 2 and 3. This trend is physically consistent with the progressive increase in low-pressure steam flow discussed in Section 3.2. Although the condenser remains a secondary source of total plant exergy destruction and losses compared with the boiler, its increasing contribution reflects the greater amount of steam expanded below the process extraction pressure and subsequently rejected to the environment.
The comparison between Scenarios 2 and 3 provides the clearest indication of the thermodynamic effect of the repowering strategy. Both configurations operate with the same nominal steam-generation rate of 150 t/h and the same nominal biomass composition, while the repowered configuration employs higher steam pressure and temperature, reheating, and a higher boiler efficiency. Under these conditions, the overall exergetic efficiency increases from 23.50% to 26.85%, corresponding to an increase of 3.35 percentage points, or approximately 14.3% in relative terms. These exergetic efficiency values are approximately 2.6 percentage points lower than those reported by Kamate and Gangavati [6] for the corresponding steam pressure levels. This difference suggests that further opportunities may exist to improve the exergetic performance of the cogeneration system.
At the same time, total exergy destruction and losses decreased from 147.698 MW in Scenario 2 to 140.554 MW in Scenario 3, a reduction of approximately 4.8%. The chemical exergy supplied by the biomass is also slightly lower in Scenario 3, despite the same nominal steam-generation rate. These results show that the additional electrical power obtained in the repowered configuration is not achieved through a larger exergy input, but through a more effective use of the available fuel exergy.
The boiler accounts for most of this improvement. Its combined exergy destruction and losses decrease by approximately 8.15 MW between Scenarios 2 and 3, from 125.717 to 117.572 MW. This reduction is consistent with the increase in boiler efficiency adopted for the repowered configuration and with the higher thermodynamic quality of the generated steam. In contrast, turbine-generator combined exergy destruction and losses increase moderately from 7.117 to 7.935 MW. This increase is associated with the larger amount of work produced and the more extensive expansion arrangement in Scenario 3 and therefore does not offset the reduction achieved in the boiler.
The useful process exergy remains nearly constant across the investigated scenarios, varying only from approximately 10.34 MW in the Base Case to 9.78 MW in Scenarios 2 and 3. This behavior is expected because the process steam demand is maintained at approximately 60 t/h throughout the analysis. Consequently, the variation in overall exergetic efficiency is governed predominantly by changes in electrical generation, biomass exergy input, and the combined effects of internal irreversibilities and exergy losses associated with steam generation and expansion.
The exergy results reinforce the distinction already identified in the energy analysis between capacity recovery and technological repowering. Increasing steam generation from the Base Case to Scenario 2 raises the absolute magnitude of the thermodynamic losses because a larger amount of biomass is processed, but it also increases the fraction of fuel exergy converted into useful products. The transition from Scenario 2 to Scenario 3 is more significant from a second-law perspective, because it simultaneously increases useful electrical output, reduces total combined exergy destruction and losses, and increases exergetic efficiency without increasing the nominal steam-generation rate.
These results confirm that the main thermodynamic improvement potential remains associated with the steam-generation subsystem, while the repowering strategy improves the overall utilization of the biomass exergy by reducing the combined exergy destruction and losses in the boiler and increasing the work obtained from the steam cycle. The corresponding environmental consequences are examined in Section 4.4.
4.4. Environmental Performance
The environmental performance of the investigated configurations was evaluated based on direct CO2 emissions from biomass combustion and the corresponding specific direct CO2 emissions per unit of net electricity generated. As defined in Section 3.6, the analysis is restricted to the cogeneration plant boundary and therefore does not represent a life-cycle greenhouse-gas assessment.
Table 9 summarizes the total direct CO2 emission rate, the specific direct CO2 emissions, and the reduction in specific emission intensity relative to the Base Case. As shown in Table 9, the absolute CO2 emission rate increases as the plant processes larger amounts of biomass. The Base Case releases approximately 31.99 t/h of CO2, whereas the emission rate increases to 45.05 t/h in Scenario 1 and 56.69 t/h in Scenario 2. These increases are consistent with the greater biomass consumption required to raise steam generation from 75 t/h in the Base Case to 110 and 150 t/h in Scenarios 1 and 2, respectively.
Table 9.
Direct CO2 emission rates, specific CO2 emissions, and reductions in specific emissions for the investigated configurations.
The behavior of the specific direct CO2 emission indicator is markedly different. The specific CO2 emission decreases from 2.962 tCO2/MWh in the Base Case to 2.418 tCO2/MWh in Scenario 1, corresponding to a reduction of approximately 18.4%. Although Scenario 1 requires greater biomass consumption and consequently produces more CO2 per hour, the increase in net electrical generation is proportionally larger than the increase in the direct emission rate.
A further reduction is obtained in Scenario 2. The specific emission decreases to 1.741 tCO2/MWh, approximately 41.2% below the Base Case value. This result reflects the substantial increase in net electrical power achieved when the boiler operates at its nominal steam-generation capacity. The absolute CO2 emission, however, reaches its highest value in this scenario, approximately 56.69 t/h. Therefore, the improvement observed in the specific indicator should not be interpreted as a reduction in the total quantity of CO2 physically released by the plant.
Scenario 3 presents the lowest specific emission among the investigated configurations, with 1.468 tCO2/MWh. This value represents a reduction of approximately 50.4% relative to the Base Case. At the same time, the absolute emission rate is approximately 56.22 t/h, which is slightly lower than the 56.69 t/h obtained for Scenario 2 despite the higher electrical output.
The comparison between Scenarios 2 and 3 is particularly relevant because both operate at the same nominal steam-generation rate of 150 t/h and with the same nominal biomass composition. The net electrical power increases from 32.560 to 38.304 MW, whereas the direct CO2 emission rate decreases slightly from 56.694 to 56.217 t/h. Consequently, the specific emission decreases from 1.741 to 1.468 tCO2/MWh, corresponding to an additional reduction of approximately 15.7% relative to Scenario 2. This result is consistent with the higher energy and exergetic efficiencies obtained for the repowered configuration.
The reduction in specific direct CO2 emissions throughout the scenarios is therefore mainly associated with the progressive increase in the amount of electricity produced from the biomass consumed. From the Base Case to Scenario 3, net electrical generation increases by approximately 255%, whereas the direct CO2 emission rate increases by approximately 75.7%. As a result, the amount of CO2 released per unit of net electricity decreases substantially.
This distinction between absolute and specific emissions is essential for interpreting the environmental results. Increasing the utilization of biomass does not reduce the physical flow of biogenic CO2 released during combustion. Instead, the investigated improvements increase the useful electrical output obtained for a given emission level. Accordingly, the environmental advantage identified within the adopted system boundary refers to a reduction in direct CO2 emission intensity, rather than an absolute reduction in plant CO2 emissions or a demonstrated reduction in life-cycle greenhouse-gas emissions.
The present results should also be interpreted within the limitations of the adopted environmental boundary. The analysis does not include greenhouse-gas emissions associated with sugarcane cultivation, straw recovery, harvesting, biomass transport, equipment construction, or other upstream and downstream activities. In particular, the incorporation of sugarcane straw in Scenarios 1–3 may introduce additional environmental effects outside the cogeneration plant boundary that are not captured by the direct combustion indicator used here. Therefore, the results should not be interpreted as demonstrating a corresponding reduction in life-cycle greenhouse-gas emissions. A comprehensive life-cycle assessment would be required to quantify the net greenhouse-gas implications of these configurations, including the potential effects associated with the additional biomass supply chain.
Within the defined plant boundary, however, the results show a consistent relationship between thermodynamic improvement and direct CO2 emission intensity. The progressive recovery of installed capacity reduces the specific emission from 2.962 to 1.741 tCO2/MWh, while technological repowering further reduces it to 1.468 tCO2/MWh. This behavior reinforces the energy and exergy results presented in Section 4.2 and Section 4.3, showing that a greater fraction of the available biomass resource is converted into useful electrical output as the cogeneration system is progressively upgraded. These findings demonstrate improved direct CO2 emission intensity within the defined plant boundary, but should not be interpreted as evidence of improved life-cycle greenhouse-gas performance without further assessment.
4.5. Economic Implications
The incremental economic assessment revealed markedly different results for the recovery of installed capacity and for the technological repowering of the steam cycle. Scenario 2 was evaluated relative to Scenario 1, whereas Scenario 3 was evaluated relative to Scenario 2. This sequential approach prevents economic benefits already obtained in a preceding configuration from being attributed again to a subsequent investment. The main economic indicators are summarized in Table 10.
Table 10.
Incremental economic performance of the investigated plant modifications.
As shown in Table 10, the transition from Scenario 1 to Scenario 2 requires an incremental investment of approximately US$0.595 million in additional condensation capacity. The incremental net electrical power between the two configurations is 13.927 MW. Considering the annual operating time of 3300 h/year, the corresponding additional electricity generation is approximately 45.96 GWh/year.
At the adopted electricity price, this results in an incremental gross revenue of approximately US$1.036 million/year. The annual operation and maintenance cost associated with the additional condensation capacity is approximately US$35,681, resulting in an annual incremental net cash flow of approximately US$1.00 million.
The corresponding simple payback period is approximately 0.59 years. When the adopted annual discount rate of 12% is considered, the discounted payback is approximately 0.67 years. The NPV over the 20-year economic lifetime is approximately US$6.88 million, while the corresponding IRR is approximately 168%. Under the adopted operating and economic assumptions, the transition from Scenario 1 to Scenario 2 therefore remains economically attractive.
These results should not be interpreted as indicating that the condenser itself is responsible for the additional electricity generation. Its function is to remove the heat-rejection constraint that prevents the plant from operating at the Scenario 2 condition. The additional electrical output results from the combined changes in steam-generation rate, turbine performance, biomass utilization, boiler efficiency, and operating conditions. The condenser should therefore be interpreted as an enabling investment required to make the integrated Scenario 2 configuration technically possible.
The transition from Scenario 2 to Scenario 3 presents a substantially different economic behavior. The incremental net electrical power is 5.744 MW, corresponding to approximately 18.96 GWh/year of additional electricity generation at 3300 operating hours per year.
The technological repowering requires an estimated incremental investment of approximately US$21.15 million. Approximately US$18.17 million corresponds to the high-pressure boiler and US$2.98 million to the turbine system [50]. The condenser investment is not included in this incremental comparison because the additional condensation capacity is already incorporated in Scenario 2.
The additional electricity generated in Scenario 3 provides an incremental gross revenue of approximately US$0.427 million/year. However, the annual O&M cost estimated from the adopted 6% factor is approximately US$1.269 million/year. Consequently, the incremental annual net cash flow is negative, at approximately −US$0.842 million/year.
Because the annual incremental cash flow remains negative, neither a simple nor a discounted payback period is obtained, and no conventional positive IRR exists. The NPV over 20 years at a 12% discount rate is approximately −US$27.44 million. Under the adopted screening-level assumptions, the additional electrical generation provided by the repowering configuration is therefore insufficient to recover the incremental investment and associated annual O&M costs.
The economic results reinforce the distinction between recovery of underutilized installed capacity and technological repowering. The former requires a comparatively small enabling investment and remains economically attractive under the adopted assumptions, whereas the latter provides higher thermodynamic performance but does not achieve economic feasibility when evaluated solely from the incremental revenue associated with electricity sales.
4.6. Sensitivity Analysis Results
The sensitivity analysis was performed to quantify the individual influence of the principal thermodynamic and economic assumptions on the results, providing additional insight into the simultaneous modifications represented by the investigated scenarios. Scenario 2 was adopted as the reference configuration for the thermodynamic sensitivity analysis because the transition from Scenario 1 to Scenario 2 involves simultaneous changes in steam-generation rate, boiler efficiency, condenser pressure, and turbine performance. The main thermodynamic results are summarized in Table 11.
Table 11.
Sensitivity of Scenario 2 to selected thermodynamic parameters.
The boiler-efficiency sensitivity demonstrates that this assumption primarily affects fuel consumption rather than turbine power output when the steam-generation rate and steam conditions are prescribed. In the reference Scenario 2, the boiler produces 150 t/h of steam at approximately 62 bar and 500 °C with a thermal efficiency of 85%, requiring approximately 54.94 t/h of biomass. Reducing the boiler efficiency to 80%, while maintaining the same steam production and steam conditions, increases the estimated biomass requirement to approximately 58.37 t/h. Conversely, increasing the efficiency to 90% decreases the required biomass flow to approximately 51.89 t/h.
Because the turbine inlet conditions and steam flow are maintained in this calculation, net electrical power remains essentially unchanged at 32.56 MW. However, the variation in fuel consumption directly affects the fuel-based performance indicators. The net electrical efficiency decreases from 23.12% at the reference boiler efficiency of 85% to approximately 21.76% at 80%, whereas an increase in boiler efficiency to 90% raises the corresponding value to approximately 24.48%. Therefore, the assumed improvement in boiler efficiency between the scenarios should not be interpreted as the direct cause of the increase in electrical generation; its principal effect is to reduce the biomass input required to produce the prescribed steam conditions.
Condenser pressure has a different physical effect because it directly modifies the available enthalpy drop in the low-pressure turbine section. At the Scenario 2 reference condition, the condensing section receives approximately 21.51 kg/s of steam at 2.5 bar, and the condenser pressure is 0.16 bar. The corresponding condensing-section isentropic efficiency is approximately 80%. The sensitivity calculation indicates that reducing condenser pressure from 0.16 to 0.06 bar would increase the estimated net electrical power from 32.56 to approximately 34.6 MW. Intermediate pressures of 0.10 bar and 0.20 bar result in estimated net electrical powers of approximately 33.6 and 32.1 MW, respectively.
This result is particularly relevant to the comparison between Scenarios 1 and 2. Scenario 1 operates at a condenser pressure of 0.06 bar, whereas Scenario 2 adopts the turbine design exhaust pressure of 0.16 bar. Therefore, the increase in condenser pressure does not contribute positively to the higher electrical generation obtained in Scenario 2. Instead, it imposes an estimated electrical-power penalty of approximately 2.0 MW relative to operation at 0.06 bar under otherwise unchanged Scenario 2 conditions. The increase in electrical output between Scenarios 1 and 2 is therefore obtained despite, rather than because of, the higher condenser pressure.
The assumed turbine isentropic efficiencies have a more pronounced influence on electrical generation. The reference Scenario 2 employs isentropic efficiencies of approximately 85% and 80% for the extraction and condensing sections, respectively. Decreasing both efficiencies by five percentage points, to 80% and 75%, reduces the estimated net electrical power from 32.56 to approximately 30.6 MW. Conversely, increasing the efficiencies to 90% and 85% increases the estimated net electrical power to approximately 34.6 MW. Thus, a variation of ±5 percentage points in the turbine efficiencies changes the predicted net electrical output by approximately ±2 MW, corresponding to about ±6% relative to the reference Scenario 2 value.
The difference between the turbine efficiencies adopted in Scenarios 1 and 2 is larger than the ±5 percentage-point range. Scenario 1 presents extraction- and condensing-section isentropic efficiencies of approximately 72.26% and 43.65%, respectively, whereas Scenario 2 adopts approximately 85% and 80%. As an additional first-order diagnostic, the Scenario 2 steam flows and thermodynamic boundary conditions were maintained while the turbine efficiencies were reduced to the values associated with Scenario 1. Under this approximation, the estimated net electrical power decreases from 32.56 to approximately 25.5 MW.
This suggests that the assumed improvement in turbine performance contributes substantially to the difference between Scenarios 1 and 2. However, the value should not be interpreted as a strict additive decomposition of the scenario-to-scenario power increase because turbine efficiency, extraction conditions, steam-flow distribution, and low-pressure expansion are thermodynamically coupled. Rather, the calculation quantifies the sensitivity of the Scenario 2 result to the turbine-performance assumption.
Overall, the thermodynamic sensitivity analysis shows that the increase from Scenario 1 to Scenario 2 reflects multiple plant modifications rather than a single isolated change. The increase in steam-generation rate provides a larger mass flow for expansion through the turbine, while the higher assumed turbine efficiencies further increase electrical generation. Boiler efficiency primarily affects the biomass requirement and the fuel-based efficiency indicators. In contrast, the increase in condenser pressure from 0.06 to 0.16 bar acts against the increase in electrical power. These results support the treatment of the investigated scenarios as integrated plant configurations while quantifying the individual influence of the principal thermodynamic assumptions.
A complementary sensitivity analysis was performed for the economic assessment. The annual operating time of 3300 h/year was based on the average annual sugarcane processing of approximately 550,000 t/year and the average milling rate of 166.7 t/h. This value was adopted as the reference economic condition. Annual operating time and electricity selling price were varied by ±20%, the annual O&M factor was varied from 4% to 8% of incremental CAPEX, and the discount rate was varied from 8% to 16%. Table 12 summarizes the corresponding NPV results.
Table 12.
Sensitivity of the incremental economic results to the main economic assumptions.
The annual operating time has a significant quantitative influence on the economic indicators but does not alter the qualitative conclusions of the incremental assessment. Using the reference value of 3300 h/year, the additional electricity generation associated with the transition from Scenario 1 to Scenario 2 is approximately 45.96 GWh/year. At the reference electricity price of 125.16 BRL/MWh, the corresponding incremental gross revenue is approximately US$1.04 million/year. After accounting for the annual O&M cost, the incremental net cash flow remains approximately US$1.00 million/year. The resulting simple payback period is approximately 0.59 years, the discounted payback is approximately 0.67 years, and the 20-year NPV at a 12% discount rate is approximately US$6.88 million.
The sensitivity to annual operating time was evaluated over a ±20% range around the revised reference condition. Reducing the annual operating time to 2640 h/year decreases the NPV of the Scenario 1–Scenario 2 transition to approximately US$5.33 million, whereas increasing it to 3960 h/year raises the NPV to approximately US$8.43 million. Therefore, even under a substantially shorter annual operating period, the NPV remains positive.
A similar behavior is observed for the electricity selling price. A 20% reduction from the reference value of 125.16 BRL/MWh decreases the NPV of the Scenario 1–Scenario 2 transition to approximately US$5.33 million, while a 20% increase raises it to approximately US$8.43 million. The equal numerical influence of proportional changes in annual operating time and electricity price results from their direct and linear contribution to annual electricity-sales revenue.
Variations in the annual O&M factor have a comparatively smaller effect on the Scenario 1–Scenario 2 transition because the incremental CAPEX associated with the additional condensation capacity is relatively low. Changing the O&M factor from the reference value of 6% of CAPEX to 4% and 8% results in NPVs of approximately US$6.97 million and US$6.79 million, respectively. The investment therefore remains economically attractive throughout the investigated O&M range.
The discount rate also affects the magnitude of the economic return without changing its sign. Reducing the discount rate from 12% to 8% increases the NPV of the Scenario 1–Scenario 2 transition from approximately US$6.88 million to US$9.23 million, whereas increasing the discount rate to 16% reduces the NPV to approximately US$5.34 million. Thus, the economic attractiveness of the transition to Scenario 2 remains robust over the investigated range of discount rates.
The transition from Scenario 2 to Scenario 3 exhibits a fundamentally different economic behavior. At the reference operating time of 3300 h/year, the additional net electricity generation is approximately 18.96 GWh/year, resulting in an incremental gross electricity revenue of approximately US$0.43 million/year. This revenue remains below the annual O&M cost of approximately US$1.27 million/year estimated from the adopted 6% factor. Consequently, the incremental annual net cash flow is negative, at approximately −US$0.84 million/year, and the corresponding 20-year NPV is approximately −US$27.44 million.
Increasing the annual operating time improves the economic performance of the repowering configuration but is insufficient to reverse this result. At 3960 h/year, the NPV remains negative at approximately −US$26.80 million. Therefore, the variation in the reference operating time changes the magnitude of the result but not the economic interpretation of the repowering alternative.
The same conclusion is obtained for the other economic parameters. A 20% increase in electricity price results in an NPV of approximately −US$26.80 million. Reducing the annual O&M factor from 6% to 4% produces the largest improvement among the investigated economic variations, but the NPV remains negative at approximately −US$24.28 million. Changes in the discount rate between 8% and 16% also do not reverse the result. Accordingly, none of the economic variations considered in the sensitivity analysis renders the Scenario 2–Scenario 3 transition economically attractive under the adopted screening-level cost structure.
Overall, the economic sensitivity analysis indicates that the contrasting economic outcomes of recovering underutilized installed capacity and technological repowering are maintained across the investigated individual parameter variations. The transition to Scenario 2 remains economically attractive throughout the investigated ranges of annual operating time, electricity price, O&M factor, and discount rate. In contrast, Scenario 3 remains economically unattractive when justified exclusively by incremental electricity sales. These results also reinforce that the additional condenser should be interpreted as an enabling modification that removes the heat-rejection constraint of Scenario 2 rather than as the isolated cause of the additional electrical generation. Nevertheless, since the sensitivity analysis varied one parameter at a time, the combined effects and interactions among economic assumptions were not evaluated, and the conclusions are therefore limited to the individual parameter ranges investigated.
4.7. Comparison Among Scenarios
The comparative assessment of the investigated configurations shows that the proposed modifications affect plant performance through two distinct mechanisms: recovery of underutilized installed capacity and technological repowering of the steam cycle. The first mechanism is predominant from the Base Case to Scenario 2, whereas the second is isolated more clearly by the comparison between Scenarios 2 and 3.
The Base Case represents the current low-load operating condition of the plant. Under this condition, the cogeneration system generates 10.800 MW of net electrical power, with a net electrical efficiency of 14.19%, an overall cogeneration efficiency of 66.72%, and an exergetic efficiency of 20.80%. The direct specific CO2 emission is 2.962 tCO2/MWh. These results confirm that the plant operates with considerable unused capacity in the boiler, turbine-generator set, and condenser.
Scenario 1 recovers part of this unused capacity by increasing steam generation from 75 to 110 t/h. Net electrical power increases to 18.633 MW, approximately 72.5% above the Base Case, while the net electrical efficiency rises to 16.98%. The specific CO2 emission decreases to 2.418 tCO2/MWh. However, the overall exergetic efficiency changes only slightly, from 20.80% to 20.24%, and the condenser steam flow reaches approximately 41.3 t/h, slightly exceeding the nominal capacity of the existing unit (40 t/h). Scenario 1 therefore represents an intermediate operating condition in which additional electrical generation can be obtained primarily through increased use of the existing plant, but the predicted operating point exceeds the nominal condenser capacity and therefore requires verification of the actual allowable operating margin.
Scenario 2 extends the recovery strategy to the nominal boiler steam-generation capacity of 150 t/h. The net electrical power reaches 32.560 MW, while the net electrical efficiency increases to 23.12% and the overall exergetic efficiency to 23.50%. The direct specific CO2 emission decreases further to 1.741 tCO2/MWh. These improvements are accompanied by a substantial increase in the steam flow through the condensing section, reaching approximately 77.4 t/h. Consequently, the existing condenser is no longer sufficient, and additional condensation capacity becomes necessary. This result identifies the heat-rejection system as the principal equipment constraint preventing full utilization of the existing boiler capacity.
The transition from Scenario 2 to Scenario 3 differs fundamentally from the previous modifications because the nominal steam-generation rate remains fixed at 150 t/h. The improvement is instead obtained by increasing the main steam pressure and temperature, introducing reheating, and improving the steam-generation subsystem. Net electrical power increases from 32.560 to 38.304 MW, corresponding to an additional gain of approximately 17.6%, while net electrical efficiency increases from 23.12% to 27.44%.
The second-law indicators reinforce this result. The overall exergetic efficiency increases from 23.50% in Scenario 2 to 26.85% in Scenario 3, while total combined exergy destruction and losses decrease from 147.698 to 140.554 MW. The boiler combined exergy destruction and losses decrease from 125.717 to 117.572 MW, indicating that a substantial part of the improvement originates in the steam-generation subsystem. Thus, unlike the previous scenarios, Scenario 3 increases electrical output while simultaneously reducing the total thermodynamic irreversibility at the same nominal steam-generation rate.
The environmental indicator follows the same tendency. The specific CO2 emission decreases from 1.741 tCO2/MWh in Scenario 2 to 1.468 tCO2/MWh in Scenario 3, while the absolute CO2 emission rate remains practically unchanged, decreasing slightly from 56.694 to 56.217 t/h. This result shows that the reduction in specific emissions obtained through repowering is associated with more effective conversion of the biomass input into electricity rather than with lower biomass utilization.
Table 13 summarizes the principal performance indicators and highlights the progression from the current plant condition to the repowered configuration.
Table 13.
Integrated comparison of the investigated configurations.
The results summarized in Table 13 show that the largest increase in electrical generation is obtained through progressive recovery of the installed steam-generation capacity, but this strategy eventually becomes constrained by the existing condenser. The transition to Scenario 3 then demonstrates that further gains can be achieved without increasing the nominal steam-generation rate, provided that the thermodynamic quality of the steam cycle is improved.
From a plant-development perspective, the investigated configurations therefore represent a sequence of increasing technical intervention. Scenario 1 requires comparatively limited changes and primarily exploits existing installed capacity. Scenario 2 requires the removal of a specific infrastructure constraint to enable operation at the boiler nominal capacity. Scenario 3 requires a more extensive modification of the steam-generation and turbine systems, but provides the highest electrical and exergetic efficiencies and the lowest direct specific CO2 emission among the investigated configurations.
This distinction is reinforced by the economic assessment. The transition from Scenario 1 to Scenario 2 requires a comparatively limited investment to remove the condensation constraint and presents favorable economic indicators under the adopted assumptions. In contrast, Scenario 3 provides the highest thermodynamic performance but requires a substantially larger investment in the boiler and turbine system, which is not recovered through the additional electricity revenue under the reference economic conditions. Therefore, the technically most efficient configuration is not necessarily the most economically attractive.
5. Conclusions
This study evaluated progressive performance-improvement and repowering strategies for an existing sugarcane cogeneration plant using field operating data and thermodynamic simulations. The analysis distinguished improvements associated with recovery of underutilized installed capacity from those obtained through more extensive technological repowering.
The Base Case confirmed that the plant operates substantially below the nominal capacity of its main equipment. Increasing steam generation from 75 to 110 t/h in Scenario 1 raised net electrical power from 10.800 to 18.633 MW, corresponding to an increase of approximately 72.5%. However, the simulated condenser steam flow reached approximately 41.3 t/h, slightly exceeding the nominal capacity of the existing condenser. Therefore, the reported Scenario 1 performance represents an unconstrained thermodynamic result whose practical implementation depends on the actual condenser operating margin or on limiting the condensing steam flow.
Scenario 2 extended operation to the nominal boiler capacity of 150 t/h. Under this condition, net electrical power increased to 32.560 MW and net electrical efficiency reached 23.12%. The required condenser steam flow substantially exceeded the existing condenser capacity, demonstrating that additional condensation capacity is required to enable full-capacity operation.
Scenario 3 maintained the same nominal steam-generation rate of 150 t/h but introduced higher steam pressure and temperature, reheating, and a modified turbine configuration. Net electrical power increased to 38.304 MW, approximately 17.6% above Scenario 2, while net electrical efficiency increased from 23.12% to 27.44%. The exergetic efficiency increased from 23.50% to 26.85%, and total exergy destruction and losses decreased from 147.698 to 140.554 MW. These improvements result from the combined effect of the repowered steam-cycle configuration and the assumed improvements in boiler and turbine performance, rather than from a single modification.
The boiler remained the dominant source of thermodynamic irreversibility and exergy loss in all investigated configurations. In Scenario 3, boiler combined exergy destruction and losses decreased from 125.717 to 117.572 MW relative to Scenario 2, indicating improved thermodynamic performance of the steam-generation subsystem.
The environmental assessment showed that the direct CO2 emission rate increased from 31.990 t/h in the Base Case to 56.217 t/h in Scenario 3 as biomass consumption increased. Nevertheless, the specific direct CO2 emission decreased from 2.962 to 1.468 tCO2/MWh, corresponding to a reduction of approximately 50.4%. This reduction reflects an improvement in direct operational CO2 emission intensity and should not be interpreted as evidence of reduced absolute CO2 emissions or lower life-cycle greenhouse-gas impacts, which were not assessed in this study.
The incremental economic assessment, based on approximately 3300 operating hours per year, showed that the transition from Scenario 1 to Scenario 2 remains economically attractive under the adopted assumptions, with an NPV of approximately US$6.88 million and a discounted payback of approximately 0.67 years. In contrast, the transition from Scenario 2 to Scenario 3 resulted in an NPV of approximately −US$27.44 million and no payback period. The sensitivity analysis indicated that these qualitative conclusions remain unchanged under the individual variations in the economic parameters within the investigated ranges.
Overall, the results show that recovery of underutilized installed capacity offers the most favorable balance between technical improvement and economic performance for the investigated plant. More extensive repowering can provide additional gains in electrical and exergetic performance, but these gains do not necessarily translate into economic attractiveness under the adopted investment and electricity-price assumptions.
Author Contributions
Conceptualization, I.C.B. and A.B.L.; methodology, I.C.B., R.G.S. and P.R.F.; validation, I.C.B., F.M.F., R.G.S., P.R.F., A.B.L. and J.J.C.S.S.; formal analysis, I.C.B., F.M.F., R.G.S., P.R.F. and M.S.; investigation, I.C.B., R.G.S. and P.R.F.; data curation, I.C.B.; writing—original draft preparation, I.C.B., R.G.S. and P.R.F.; writing—review and editing, I.C.B., F.M.F., R.G.S., P.R.F., A.B.L., J.J.C.S.S., J.M.B.M.S.R. and M.S.; supervision, J.J.C.S.S. and J.M.B.M.S.R.; funding acquisition, J.J.C.S.S. and J.M.B.M.S.R. All authors have read and agreed to the published version of the manuscript.
Funding
This work was supported by the Espírito Santo Research and Innovation Support Foundation (FAPES), under Grant No. 1141/2025; the National Council for Scientific and Technological Development (CNPq), under Grant No. 306097/2025-7; and the Coordination for the Improvement of Higher Education Personnel (CAPES), through the Support Program for Graduate Studies (PROAP).
Data Availability Statement
The original contributions presented in the study are included in the article; further inquiries can be directed to the corresponding author.
Acknowledgments
The authors would like to thank the Federal Institute of Espírito Santo (IFES), the Federal University of Espírito Santo (UFES), University of Coimbra (UC), the National Council for Scientific and Technological Development (CNPq), the Brazilian Electricity Regulatory Agency (ANEEL), and the Espírito Santo Research and Innovation Support Foundation (FAPES).
Conflicts of Interest
The authors declare no conflicts of interest.
Abbreviations
| 4E | Energy, Exergy, Economic and Environmental |
| BRL | Brazilian currency |
| CH | Chemical |
| CHP | Combined heat and power |
| GHG | Greenhouse gas |
| Ex | Exergetic |
| HP | High pressure |
| IRR | Internal Rate of Return |
| LHV | Low heat value |
| LP | Low pressure |
| NPV | Net present value |
| PH | Physical |
References
- Soares, M.Y.; Ramos, D.S.; de Oliveira Pavan, M.; Diuana, F.A. Barriers to the Expansion of Sugarcane Bioelectricity in Brazilian Energy Transition. Energies 2023, 16, 955. [Google Scholar] [CrossRef] [Scilit]
- Fioranelli, A.; Bizzo, W.A. Generation of surplus electricity in sugarcane mills from sugarcane bagasse and straw: Challenges, failures and opportunities. Renew. Sustain. Energy Rev. 2023, 186, 113647. [Google Scholar] [CrossRef] [Scilit]
- Palacios-Bereche, M.C.; Palacios-Bereche, R.; Ensinas, A.V.; Gallego, A.G.; Modesto, M.; Nebra, S.A. Brazilian sugar cane industry—A survey on future improvements in the process energy management. Energy 2022, 259, 124903. [Google Scholar] [CrossRef] [Scilit]
- Pérez, Á.A.D.; Palacio, J.C.E.; Venturini, O.J.; Reyes, A.M.M.; Orozco, D.J.R.; Lora, E.E.S.; del Olmo, O.A.A. Thermodynamic and economic evaluation of reheat and regeneration alternatives in cogeneration systems of the Brazilian sugarcane and alcohol sector. Energy 2018, 152, 247–262. [Google Scholar] [CrossRef] [Scilit]
- Khatiwada, D.; Seabra, J.; Silveira, S.; Walter, A. Power generation from sugarcane biomass—A complementary option to hydroelectricity in Nepal and Brazil. Energy 2012, 48, 241–254. [Google Scholar] [CrossRef] [Scilit]
- Kamate, S.C.; Gangavati, P.B. Exergy analysis of cogeneration power plants in sugar industries. Appl. Therm. Eng. 2009, 29, 1187–1194. [Google Scholar] [CrossRef] [Scilit]
- Alves, M.; Ponce, G.H.S.F.; Silva, M.A.; Ensinas, A.V. Surplus electricity production in sugarcane mills using residual bagasse and straw as fuel. Energy 2015, 91, 751–757. [Google Scholar] [CrossRef] [Scilit]
- Palacios-Bereche, R.; Ensinas, A.; Modesto, M.; Nebra, S.A. New alternatives for the fermentation process in the ethanol production from sugarcane: Extractive and low temperature fermentation. Energy 2014, 70, 595–604. [Google Scholar] [CrossRef] [Scilit]
- Pina, E.A.; Palacios-Bereche, R.; Chavez-Rodriguez, M.F.; Ensinas, A.V.; Modesto, M.; Nebra, S.A. Reduction of process steam demand and water-usage through heat integration in sugar and ethanol production from sugarcane—Evaluation of different plant configurations. Energy 2017, 138, 1263–1280. [Google Scholar] [CrossRef] [Scilit]
- Colombo, G.; Ocampo-Duque, W.; Rinaldi, F. Challenges in Bioenergy Production from Sugarcane Mills in Developing Countries: A Case Study. Energies 2014, 7, 5874–5898. [Google Scholar] [CrossRef] [Scilit]
- Pellegrini, L.F.; de Oliveira Júnior, S.; Burbano, J.C. Supercritical steam cycles and biomass integrated gasification combined cycles for sugarcane mills. Energy 2010, 35, 1172–1180, Erratum to Energy 2011, 36, 708–708. [Google Scholar] [CrossRef] [Scilit]
- Machin, E.B.; Pedroso, D.T.; Machín, A.B.; Acosta, D.G.; dos Santos, M.I.S.; de Carvalho, F.S.; Pérez, N.P.; Pascual, R.; Júnior, J.A.d.C. Biomass integrated gasification-gas turbine combined cycle (BIG/GTCC) implementation in the Brazilian sugarcane industry: Economic and environmental appraisal. Renew. Energy 2021, 172, 529–540. [Google Scholar] [CrossRef] [Scilit]
- Deshmukh, R.; Jacobson, A.; Chamberlin, C.; Kammen, D. Thermal gasification or direct combustion? Comparison of advanced cogeneration systems in the sugarcane industry. Biomass Bioenergy 2013, 55, 163–174. [Google Scholar] [CrossRef] [Scilit]
- Camargo, J.M.O.; Gallego-Ríos, J.M.; Neto, A.M.P.; Antonio, G.C.; Modesto, M.; Leite, J.T.C. Characterization of sugarcane straw and bagasse from dry cleaning system of sugarcane for cogeneration system. Renew. Energy 2020, 158, 500–508. [Google Scholar] [CrossRef] [Scilit]
- Aguiar, A.; Milessi, T.S.; Mulinari, D.R.; Lopes, M.S.; da Costa, S.M.; Candido, R.G. Sugarcane straw as a potential second generation feedstock for biorefinery and white biotechnology applications. Biomass Bioenergy 2021, 144, 105896. [Google Scholar] [CrossRef] [Scilit]
- Guerra, J.; Cardoso, F.; Nogueira, A.; Kulay, L. Thermodynamic and Environmental Analysis of Scaling up Cogeneration Units Driven by Sugarcane Biomass to Enhance Power Exports. Energies 2018, 11, 73. [Google Scholar] [CrossRef] [Scilit]
- Bizzo, W.A.; Lenço, P.C.; Carvalho, D.J.; Veiga, J.P.S. The generation of residual biomass during the production of bio-ethanol from sugarcane, its characterization and its use in energy production. Renew. Sustain. Energy Rev. 2014, 29, 589–603. [Google Scholar] [CrossRef] [Scilit]
- Watanabe, M.D.B.; Morais, E.R.; Cardoso, T.F.; Chagas, M.F.; Junqueira, T.L.; Carvalho, D.J.; Bonomi, A. Process simulation of renewable electricity from sugarcane straw: Techno-economic assessment of retrofit scenarios in Brazil. J. Clean Prod. 2020, 254, 120081. [Google Scholar] [CrossRef] [Scilit]
- Restrepo-Valencia, S.; Walter, A. Techno-Economic Assessment of Bio-Energy with Carbon Capture and Storage Systems in a Typical Sugarcane Mill in Brazil. Energies 2019, 12, 1129. [Google Scholar] [CrossRef] [Scilit]
- Kamate, S.C.; Gangavati, P.B. Energy and Exergy Analysis of a 44-MW Bagasse-based Cogeneration Plant in India. Cogener. Distrib. Gener. J. 2010, 25, 35–51. [Google Scholar] [CrossRef] [Scilit]
- Singh, O.K. Exergy analysis of a grid-connected bagasse-based cogeneration plant of sugar factory and exhaust heat utilization for running a cold storage. Renew. Energy 2019, 143, 149–163. [Google Scholar] [CrossRef] [Scilit]
- Cavalcanti, E.J.C.; Carvalho, M.; da Silva, D.R.S. Energy, exergy and exergoenvironmental analyses of a sugarcane bagasse power cogeneration system. Energy Convers. Manag. 2020, 222, 113232. [Google Scholar] [CrossRef] [Scilit] [PubMed]
- Mo, Q.; Lu, W. Exergy diagnosis and performance analysis of a typical bagasse boiler. Int. J. Exergy 2022, 39, 45. [Google Scholar] [CrossRef] [Scilit]
- Abouelsoud, M.; Khalil, M.Y.; Ali, R.H.; Maghrabie, H.M. Performance assessment of a cogeneration system in a sugar cane factory using energy and exergy analysis. Case Stud. Therm. Eng. 2025, 65, 105622. [Google Scholar] [CrossRef] [Scilit]
- Dogbe, E.S.; Mandegari, M.; Görgens, J.F. Assessment of the thermodynamic performance improvement of a typical sugar mill through the integration of waste-heat recovery technologies. Appl. Therm. Eng. 2019, 158, 113768. [Google Scholar] [CrossRef] [Scilit]
- Ramjeawon, T. Life cycle assessment of electricity generation from bagasse in Mauritius. J. Clean. Prod. 2008, 16, 1727–1734. [Google Scholar] [CrossRef] [Scilit]
- Gil, M.P.; Moya, A.M.C.; Domínguez, E.R. Life cycle assessment of the cogeneration processes in the Cuban sugar industry. J. Clean Prod. 2013, 41, 222–231. [Google Scholar] [CrossRef] [Scilit]
- Silva, D.A.L.; Delai, I.; Montes, M.L.D.; Ometto, A.R. Life cycle assessment of the sugarcane bagasse electricity generation in Brazil. Renew. Sustain. Energy Rev. 2014, 32, 532–547. [Google Scholar] [CrossRef] [Scilit]
- Prasara, A.J.; Gheewala, S.H.; Silalertruksa, T.; Pongpat, P.; Sawaengsak, W. Environmental and social life cycle assessment to enhance sustainability of sugarcane-based products in Thailand. Clean Technol. Environ. Policy 2019, 21, 1447–1458. [Google Scholar] [CrossRef] [Scilit]
- Hiloidhari, M.; Banerjee, R.; Rao, A.B. Life cycle assessment of sugar and electricity production under different sugarcane cultivation and cogeneration scenarios in India. J. Clean. Prod. 2021, 290, 125170. [Google Scholar] [CrossRef] [Scilit]
- Guerra, J.P.M.; Coleta, J.R.; Arruda, L.C.M.; Silva, G.A.; Kulay, L. Comparative analysis of electricity cogeneration scenarios in sugarcane production by LCA. Int. J. Life Cycle Assess. 2014, 19, 814–825. [Google Scholar] [CrossRef] [Scilit]
- Lozano, M.A.; dos Santos, R.; Santos, J.J.C.S.; Serra, L.M. Optimal modes of operation and product cost allocation in sugarcane steam cogeneration plants. Therm. Sci. Eng. Prog. 2024, 52, 102686. [Google Scholar] [CrossRef] [Scilit]
- Cavalcanti, E.J.C.; da Silva, D.R.S.; Mota, F.A.S.; Lima, A.A.S.; Carvalho, M.; Palacios-Bereche, R. Integrated Exergy, Exergoeconomic, and Exergoenvironmental Evaluations of Ethanol Production Using a Sugarcane Bagasse Cogeneration System. Int. J. Energy Res. 2026, 2026, 4193901. [Google Scholar] [CrossRef] [Scilit]
- Morandin, M.; Toffolo, A.; Lazzaretto, A.; Maréchal, F.; Ensinas, A.V.; Nebra, S.A. Synthesis and parameter optimization of a combined sugar and ethanol production process integrated with a CHP system. Energy 2011, 36, 3675–3690. [Google Scholar] [CrossRef] [Scilit]
- Governo do Estado do Espírito Santo. Espírito Santo’s Decarbonization and GHG Emissions Neutralization Plan—Executive Summary. 2023. Available online: https://planodescarbonizacao.es.gov.br/Media/PlanoDescarbonizacao/Documentos/Executive%20Summary.pdf (accessed on 2 September 2025).
- Governo do Estado do Espírito Santo. Plano de Descarbonização e Neutralização das Emissões de GEE do Espírito Santo—Caderno de Planejamento Estratégico: Estratégias, Ações e Políticas Públicas Necessárias para a Neutralização das Emissões de GEE do ES até 2050. 2023. Available online: https://planodescarbonizacao.es.gov.br/Media/PlanoDescarbonizacao/Documentos/Plano%20de%20Neutraliza%C3%A7%C3%A3o%20das%20Emiss%C3%B5es%20de%20GEE%20do%20Esp%C3%ADrito%20Santo%20-%20Vers%C3%A3o%20II.pdf (accessed on 2 September 2025).
- Quintão, A.L.; Sant’ana, B.B.P.; Fonseca, F.M.; de Faria, P.R.; Santos, J.J.C.S. Simulation and thermodynamic evaluation of steam cogeneration system configurations for energy recovery from exhaust gases of a carbo-chemical industry. Front. Chem. Eng. 2025, 7, 1695423. [Google Scholar] [CrossRef] [Scilit]
- Gonçalves, A.N.; Fonseca, F.M.; Morawski, A.P.; de Faria, P.R.; Santos, J.J.C.S. 4E comparative analysis of energy transition scenarios for the decarbonization of a chocolate factory utilities in Brazil. Front. Chem. Eng. 2025, 7, 1716804. [Google Scholar] [CrossRef] [Scilit]
- Loyola, L.R.; Piski, G.B.; Fonseca, F.M.; dos Santos, R.G.; de Faria, P.R.; Santos, J.J.C.S.; Ribeiro, J.M.B.M.d.S.; Santos, M. 3E investigation of ORC and absorption chiller for repowering a Brazilian landfill biogas power plant. Front. Chem. Eng. 2026, 8, 1895157. [Google Scholar] [CrossRef] [Scilit]
- Silva, R.A.C.; Julio, A.A.V.; Venturini, O.J.; Júnior, J.C.F.; Palacio, J.C.E.; Reyes, A.M.M. Exergoeconomic insights into sugarcane biomass conversion: Integrating thermochemical and biochemical technologies for enhanced efficiency and profitability. Energy Convers. Manag. 2025, 323, 119232. [Google Scholar] [CrossRef] [Scilit]
- Carpio, L.G.T.; de Souza, F.S. Optimal allocation of sugarcane bagasse for producing bioelectricity and second generation ethanol in Brazil: Scenarios of cost reductions. Renew. Energy 2017, 111, 771–780. [Google Scholar] [CrossRef] [Scilit]
- Mo, Q.; Zhu, X.; Deng, C.; Cen, S.; Ye, H.; Wang, C.; Lu, W.; Chen, X.; Lin, X. Analysis on influencing factors and improvement of thermal efficiency of bagasse boilers based on performance test data. Energy 2023, 271, 127099. [Google Scholar] [CrossRef] [Scilit]
- Wang, Y.; Zou, Z.; Lu, K.; Li, Q.; Hu, P.; Wang, D. Modeling for on-line monitoring of carbon burnout coefficient in boiler under partial load. Energy 2024, 288, 129859. [Google Scholar] [CrossRef] [Scilit]
- Thermoflow Inc. THERMOFLEX: Thermodynamic Process Simulation Software. 2026. Available online: https://www.thermoflow.com/products_generalpurpose.html (accessed on 14 September 2026).
- Moran, M.J.; Shapiro, H.N.; Boettner, D.D.; Bailey, M.B. Fundamentals of Engineering Thermodynamics, 9th ed.; Wiley: Hoboken, NJ, USA, 2018. [Google Scholar]
- F-Chart Software. Engineering Equation Solver (EES). 2026. Available online: https://www.fchartsoftware.com/ees/ (accessed on 14 September 2026).
- FGV Energia. Informe: Setor Elétrico, Agosto 2024. 2024. Available online: https://fgvenergia.fgv.br/publicacao/informe-do-setor-eletrico-agosto2024 (accessed on 30 September 2026).
- Peters, M.S.; Timmerhaus, K.D.; West, R.E. Plant Design and Economics for Chemical Engineers, 5th ed.; McGraw-Hill: New York, NY, USA, 2003. [Google Scholar]
- Ross, S.A.; Westerfield, R.W.; Jaffe, J. Corporate Finance, 11th ed.; McGraw-Hill Education: New York, NY, USA, 2016. [Google Scholar]
- Lozano, M.A.; Valero, A.; Serra, L.M. Local Optimization of Energy Systems; Energy Systems Division. ASME Book No. G0122. A.B.; ASME: New York, NY, USA, 1996; pp. 241–250. [Google Scholar]
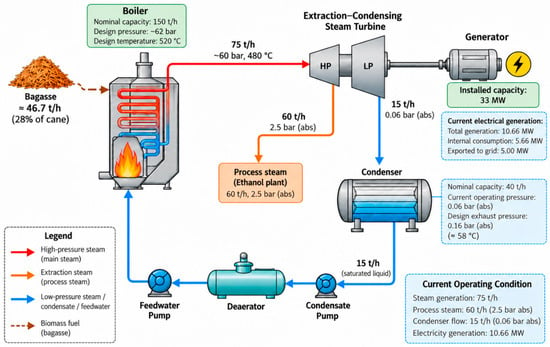
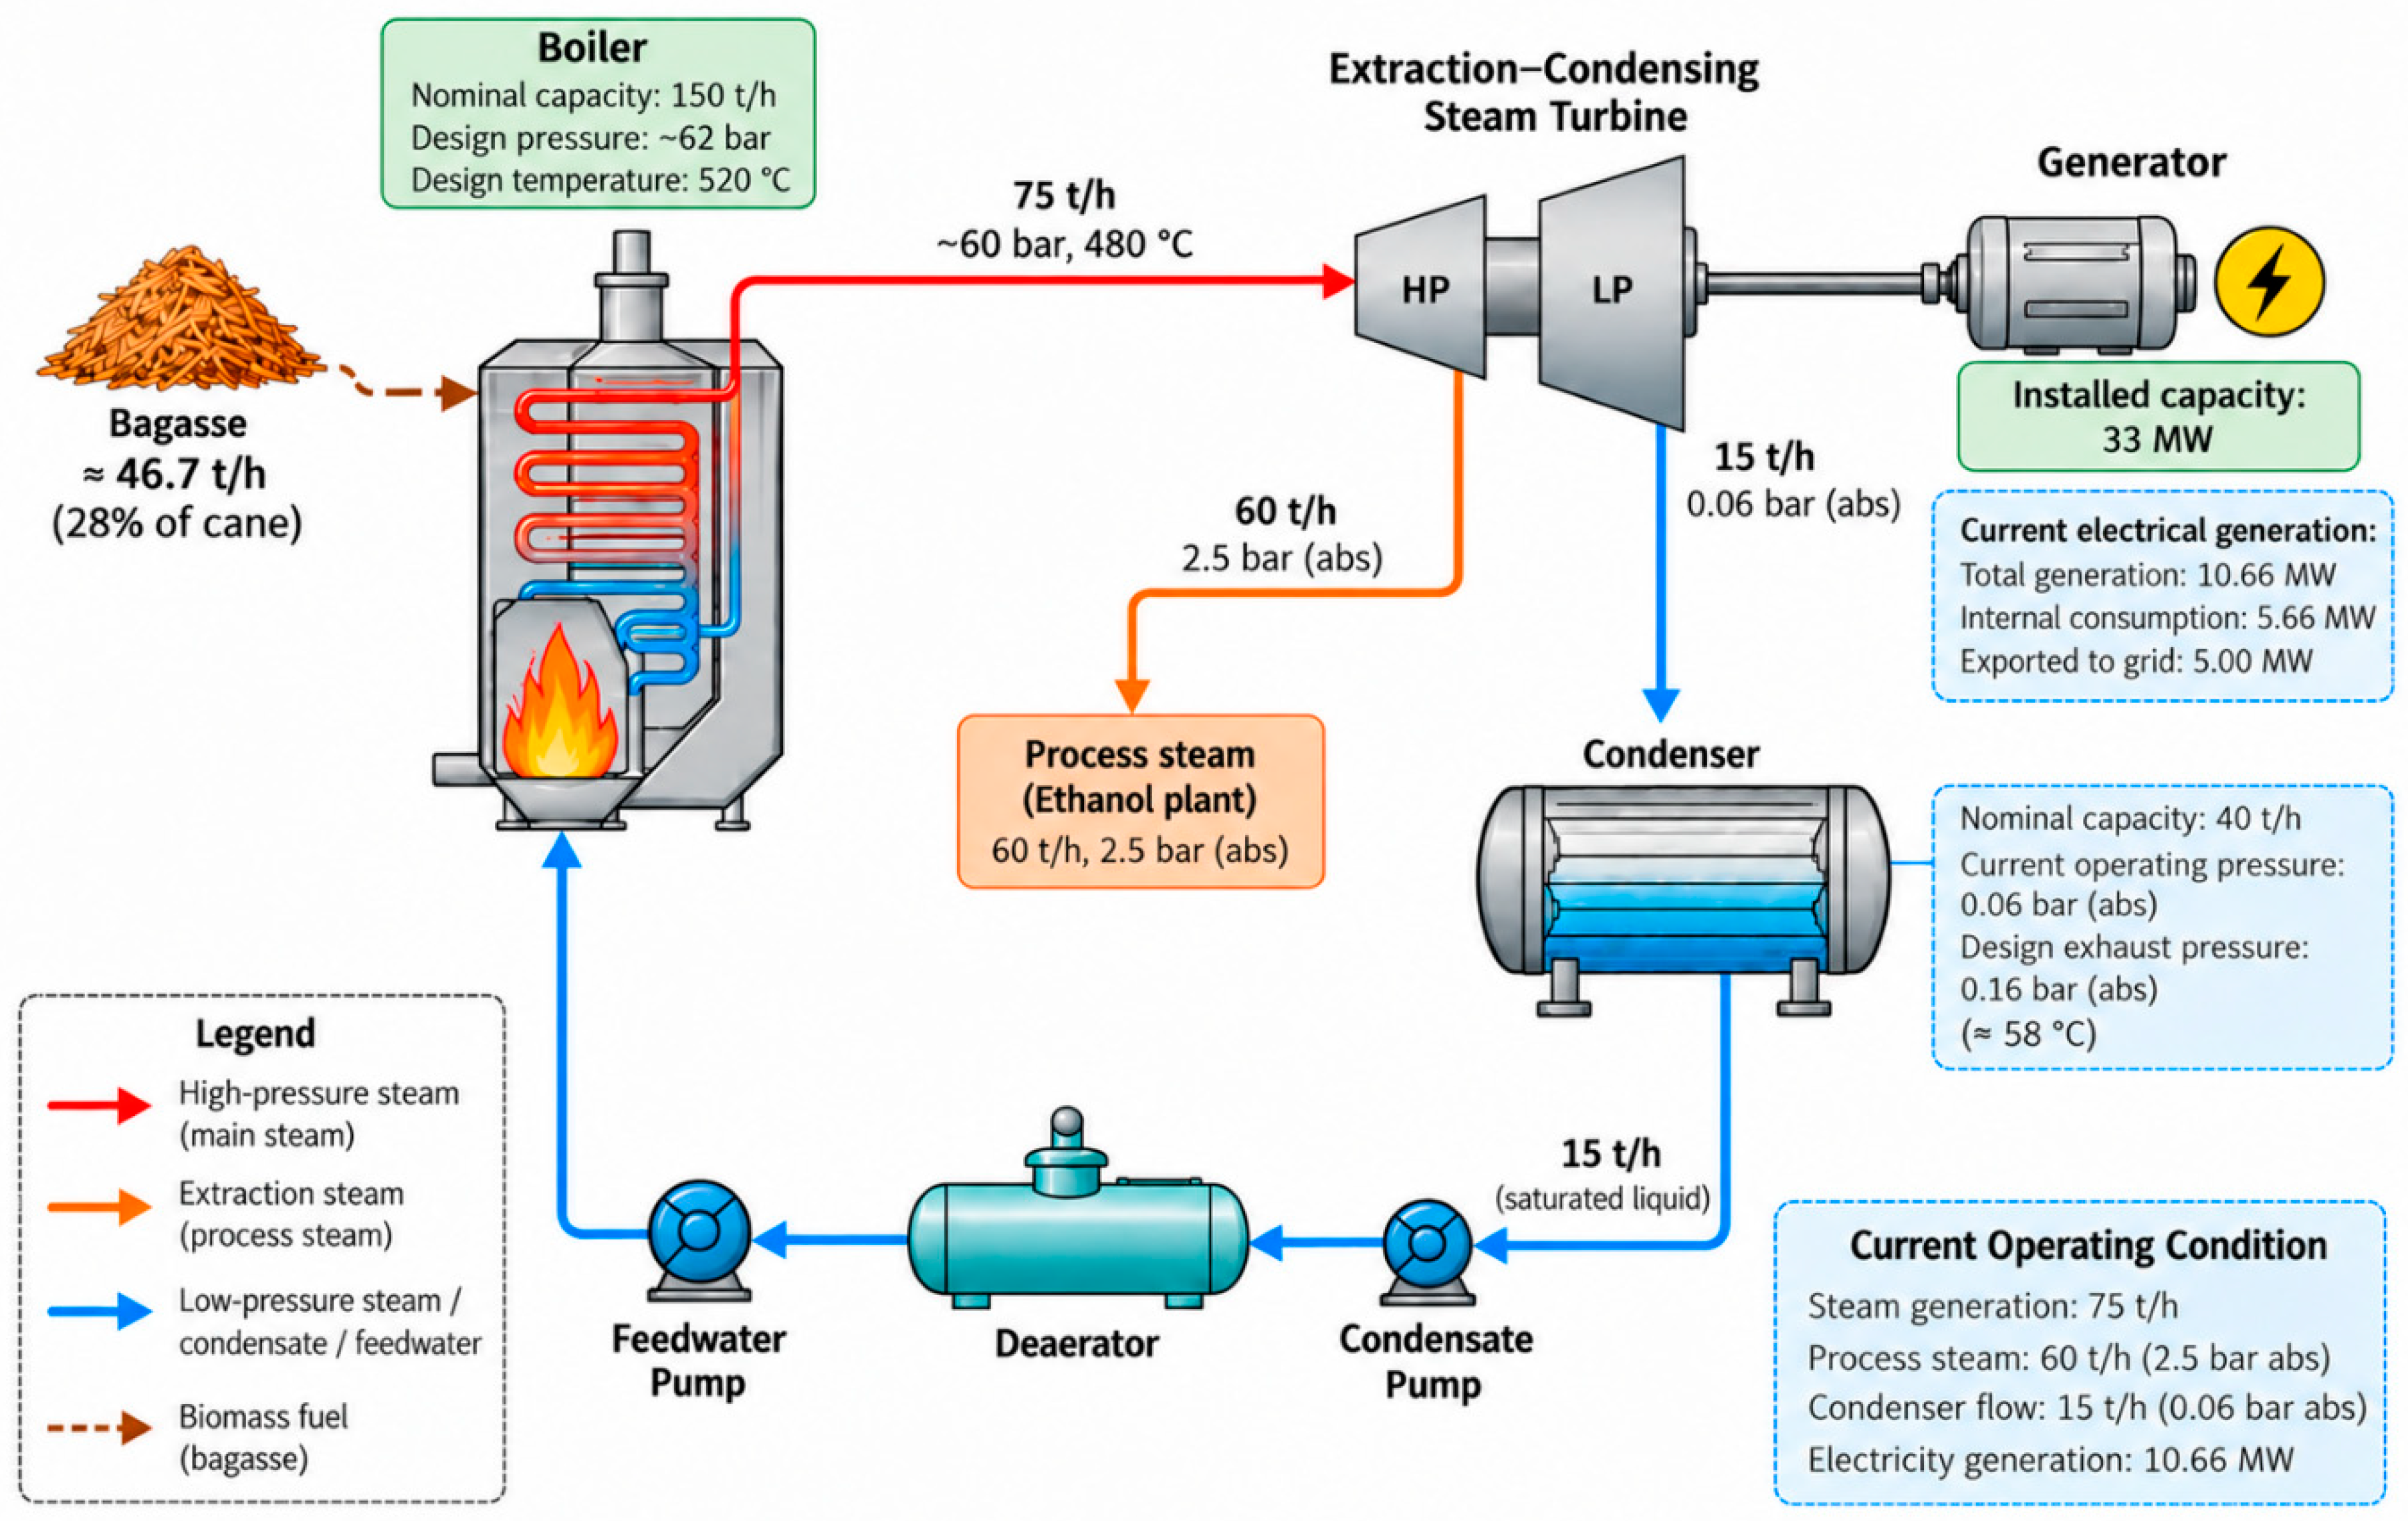
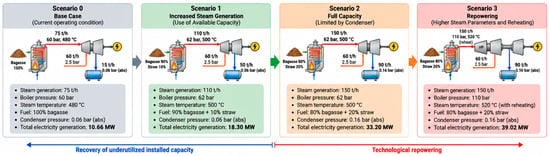
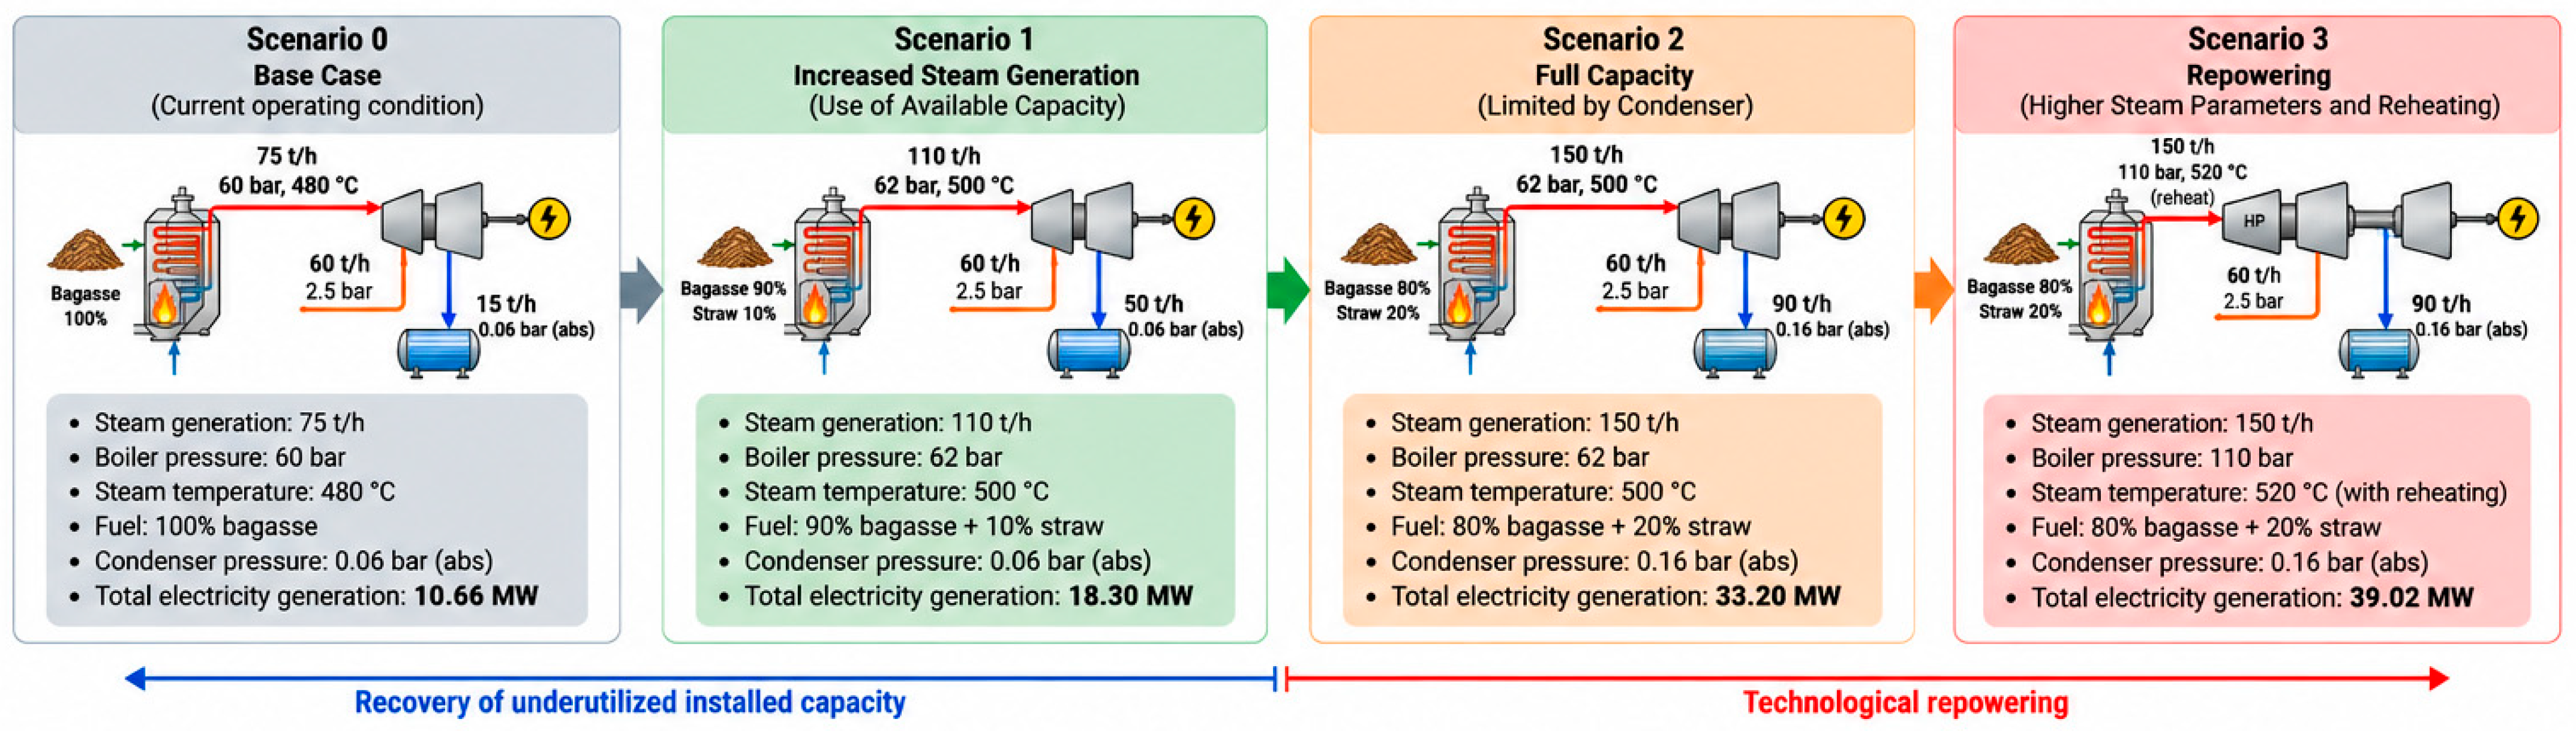

Disclaimer/Publisher’s Note: The statements, opinions and data contained in all publications are solely those of the individual author(s) and contributor(s) and not of MDPI and/or the editor(s). MDPI and/or the editor(s) disclaim responsibility for any injury to people or property resulting from any ideas, methods, instructions or products referred to in the content. |
© 2026 by the authors. Licensee MDPI, Basel, Switzerland. This article is an open access article distributed under the terms and conditions of the Creative Commons Attribution (CC BY) license.