


Abstract
The transformation of the European Union’s energy sector increasingly requires the simultaneous pursuit of decarbonization, energy security, and strategic energy autonomy, which necessitates a comprehensive assessment of the processes shaping a new energy architecture. The aim of this study is to develop a methodological approach to the multi-criteria assessment of energy transformation across the 27 European Union countries over the period 2015–2024. The proposed approach combines a system of quantitative indicators, normalization procedures, the calculation of sub-indices of energy security, decarbonization, and strategic energy autonomy, and their subsequent aggregation into a Composite Energy Transformation Index. To identify structural differences among countries, Ward’s clustering method was additionally applied. The results indicate an overall positive trend in energy transformation across all EU countries; however, the pace and structural balance of these processes differ substantially. Three typical transformation profiles were identified: decarbonization-oriented, asymmetric, and advanced integrated. The highest average level across the three dimensions was observed in Denmark, Italy, and Romania; this profile, however, rests largely on their domestic oil and gas reserves and disappears when the reserve-to-production indicators are excluded. Country rankings are robust to alternative weights, whereas the profiles are weakly separated and are best read as positions along a continuum. The findings confirm the multidimensional nature of the EU energy transformation and the need to differentiate management decisions according to the specific features of individual countries’ transformation profiles.
1. Introduction
A review of academic publications, analytical reports, and EU policy documents reveals a broadly shared understanding of the contemporary role of energy transformation in Europe. Energy transformation is increasingly viewed not only as an element of climate policy but also as an instrument for strengthening the European Union’s energy security, advancing decarbonization, and enhancing strategic energy autonomy, thereby contributing to the economic resilience and competitiveness of the overall system. In particular, Moser [1] emphasizes that energy transformation encompasses changes not only in energy supply and the power sector but also in heating, transport, investment policy, market mechanisms, and the role of consumers. Based on the recommendations presented by Barani et al. [2], the key prerequisites for a successful energy transformation include the establishment of an effective system of financial incentives for the deployment of innovative technologies, a stable regulatory environment, and the alignment of national energy policies with the objectives of REPowerEU [3]. Other important priorities include strategic investment in the manufacturing of critical energy technologies, stronger commitments to the development of renewable energy sources and the electrification of economic sectors, as well as the expansion of decentralized energy systems, energy communities, and local initiatives. Such an approach can enhance the resilience of the European energy system, strengthen its technological autonomy, reduce geopolitical risks, and support the achievement of long-term energy transformation objectives. The REPowerEU Plan [3] in particular, clearly identifies and substantiates the need to strengthen the EU’s strategic energy autonomy through the development of domestic manufacturing capacity, critical technologies, and energy infrastructure.
Plagnol [4] argues that, despite the high share of renewable energy sources in electricity generation, Europe’s overall energy balance remains heavily dependent on fossil fuels. The core challenge lies not so much in electricity generation as in final energy consumption. For example, the transport sector remains predominantly dependent on oil, while the chemical industry continues to rely heavily on hydrocarbons. The inertia of the building sector, infrastructure, and industrial value chains means that the decline in the share of fossil fuels in the overall energy balance is occurring much more slowly than in the power sector.
Another major challenge is the need to adapt energy grids to new climate-related constraints and growing demand, which requires substantial investment. Decarbonization is therefore progressing slowly in sectors such as heating, buildings, and conventional transport.
It is also important to consider bottlenecks in the availability and supply of critical raw materials such as lithium, nickel, cobalt, copper, and rare earth elements, which are essential for the expansion of wind and solar power, battery production, and related technologies. Demand for these materials is therefore expected to increase sharply. As a result, securing a reliable supply of critical raw materials has become a key priority of EU energy and industrial policy.
The challenge is no longer limited to diversifying energy sources themselves; it also involves diversifying the raw material base required for renewable energy technologies, components, and related materials. This includes the diversification of supply chains, the expansion and diversification of energy infrastructure, and the development of energy storage infrastructure. In this context, the concept of Europe’s strategic energy autonomy becomes increasingly relevant [5]. For example, the rapid scaling-up of clean energy industries by major external powers such as China is intensifying competitive pressure on Europe and increasing the importance of preserving its strategic autonomy and industrial market position [4].
Based on the analysis of the studies and policy documents [1,2,3,4,5], the current energy transformation of the European Union can be characterized by the following interrelated trends:
- •
- Decarbonization not only of the power sector but of the entire energy system;
- •
- Integration of climate policy and energy security objectives;
- •
- Large-scale electrification of final energy consumption sectors;
- •
- Accelerated investment in low-carbon technologies;
- •
- A structural decline in fossil fuel consumption;
- •
- The development of strategic energy autonomy;
- •
- The growing role of EU regulatory policy in driving the transformation;
- •
- The integration of energy transformation with efforts to enhance competitiveness and economic resilience.
Europe is gradually developing an interconnected system in which different technologies, infrastructure, and institutions perform distinct but complementary functions as parts of a broader whole referred to as the energy architecture (Table 1).
Table 1.
Components of Europe’s Energy Architecture.
Infrastructure is not defined solely by its individual components; rather, it is shaped by the interconnections among them. Each layer responds to different constraints, together forming a single interconnected energy architecture. Infrastructure consists of physical assets such as transmission lines, storage facilities, ports, electrolyzers, factories, and data centers. Energy architecture describes how these assets are interconnected, how information circulates among them, and how institutions enable such coordination. In this sense, Europe’s energy transformation involves more than simply replacing one energy source with another. It requires a reconfiguration of the relationships among energy, information, materials, industry, and institutions. Accordingly, the future will favor those capable of integrating technologies into a coherent system [6].
Bruce-Lockhart [7] presents energy architecture as a concept encompassing processes ranging from the relatively slow dynamics of global governance to continuously changing financial markets—in other words, all processes that determine or influence how energy is supplied and managed worldwide. Among these influences, a central role is played by the transition from fossil fuels to alternative methods of energy production. The ultimate objective of energy architecture is to achieve a more sustainable, affordable, secure, and inclusive energy system [8].
In this study, “energy architecture” is used as an analytical framing rather than as a new theoretical construct. The term draws on two bodies of work. In the engineering sense, system (grid) architecture describes the structure of an energy system: its components, their interfaces, and the allocation of control functions among them [9]. In the socio-technical transitions literature, energy-system change is understood as the co-evolution of technologies, infrastructures, markets, institutions, and user practices across niche, regime, and landscape levels [10]. Building on both, we define the energy architecture of a country as the configuration of its supply sources, infrastructures, and governance arrangements that determines how far its energy system is secure, low-carbon, and autonomous. The three pillars of the index are thus outcome dimensions of this configuration; the index does not measure the architecture itself.
After 2022, this architecture has been reshaped above all by the reduction in energy dependence on Russia, the integration of the energy systems of EU Member States and Ukraine, and the protection of energy infrastructure against military and cyber threats [3,11].
Thus, the new energy architecture can be understood as a new model for the functioning of Europe’s energy sector under conditions of geopolitical risks, climate objectives, and technological change, based on the pursuit of energy security, decarbonization, and strategic energy autonomy. Accordingly, energy security is intended to ensure the reliability, continuity, and resilience of energy supply in the event of disruptions or energy resource shortages; decarbonization involves reducing greenhouse gas emissions and replacing carbon-intensive technologies; and strategic energy autonomy implies achieving a high degree of control over energy sources and energy value chains, energy technologies, infrastructure, and the management of domestic energy supply.
The aim of this study is to develop a methodological approach to the multi-criteria assessment of energy transformation in European Union countries in the context of the emerging new energy architecture, based on an integrated assessment of decarbonization, energy security, and strategic energy autonomy, and to use this assessment to identify transformation profiles of EU countries.
Several composite indices already cover parts of this agenda. The World Energy Council’s Energy Trilemma Index assesses countries along three dimensions: energy security, energy equity, and environmental sustainability [12]. The World Economic Forum’s Energy Architecture Performance Index combined economic growth and development, environmental sustainability, and energy access and security [8,11]. Its successor, the Energy Transition Index, adds a pillar on transition readiness [13]. EU-focused studies have assessed energy and climate sustainability [14], the efficiency of the energy transition [15], and the diversification and renewability of energy supply [16].
From the perspective of the EU’s new energy architecture, these frameworks share three limitations. First, energy autonomy and self-sufficiency have been studied mainly at the level of local and regional communities [17,18,19], whereas at the national level they usually enter security indices only through import dependence [20]; national composite indices of the energy transition rarely treat autonomy as a separate pillar alongside security and decarbonization. Second, global indices use indicator sets designed for worldwide coverage and do not draw on the harmonized Eurostat energy indicators available for all 27 Member States. Third, most applications are cross-sectional or end before the 2022 energy crisis and therefore do not capture the adjustment triggered by REPowerEU.
This study addresses these gaps. Its contribution is threefold. First, it operationalizes strategic energy autonomy as a distinct dimension, alongside energy security and decarbonization, using resource, innovation, infrastructure, economic, and decentralization indicators. Given current data limits, this dimension captures the structural capacity for autonomy and reduced external exposure rather than full control over technology value chains (see Section 5). Second, it builds a harmonized panel for the EU-27 over 2015–2024, a period that covers both the pre-crisis years and the post-2022 REPowerEU adjustment. Third, it combines the composite index with cluster analysis, so that countries can be compared not only by the overall level of transformation but also by the balance among its dimensions.
Accordingly, the study tests the following falsifiable hypotheses:
H1a.
The Composite Energy Transformation Index increased between 2015 and 2024 in all 27 EU Member States (sign count).
H1b.
On a standardized scale, the increase in the Decarbonization Sub-Index was larger than the increases in the Energy Security and Strategic Energy Autonomy Sub-Indices (mean paired differences with 95% bootstrap confidence intervals, supplemented by one-sided Wilcoxon signed-rank tests).
H2.
EU Member States form groups that are stable under resampling of countries (mean bootstrap Jaccard coefficient of each cluster above 0.6) and that differ in variables not used in the clustering (Kruskal–Wallis tests).
H3.
Transformation profiles are not reducible to the overall level of transformation: cluster membership does not coincide with a grouping of countries into terciles of the composite index (adjusted Rand index below 0.3).
2. Conceptual and Methodological Model for Studying Energy Transformation in European Countries Under the New Energy Architecture
The theoretical analysis indicates that the transformation of the EU energy sector under the emerging new energy architecture should be viewed as a complex process influenced by a combination of geopolitical, climatic, technological, socioeconomic, and institutional-regulatory factors. Their combined effects drive structural changes in the energy sector and create new requirements for its functioning, primarily related to ensuring energy security, advancing decarbonization, and strengthening strategic energy autonomy.
At the same time, these components should not be regarded as isolated dimensions of transformation. Their interaction determines the ability of the EU energy system to simultaneously ensure the reliability of energy supply, reduce the carbon intensity of the economy, limit critical external dependencies, and adapt to geopolitical, technological, and climate-related challenges. The effectiveness of such transformation is reflected in greater energy-system resilience, progress toward climate neutrality, and the creation of conditions for enhancing the competitiveness of the European economy.
Given the multidimensional nature of these processes, their analysis requires a combination of conceptual and theoretical justification, quantitative multi-criteria assessment, and subsequent interpretation of the results to support management decision-making. Accordingly, the authors propose a model for studying energy transformation in EU countries that structurally integrates three blocks: conceptual and theoretical, methodological, and management blocks (Figure 1).
The first, conceptual and theoretical block, provides the theoretical foundation of the study. At this stage, the key drivers of the transition toward the EU’s new energy architecture are systematized, including geopolitical risks and uncertainty, climate objectives, technological change and digitalization, socioeconomic and resource-related factors, as well as institutional and regulatory factors. Their combined influence determines the directions of transformation of the European energy system and the formation of its new architecture. Within this block, the EU’s new energy architecture is considered through three interrelated components: energy security, decarbonization, and strategic energy autonomy. This structure makes it possible to capture distinct but complementary aspects of the transformation: the ability of the energy system to ensure stable and reliable energy supply; the gradual reduction in its carbon intensity; and the capacity of the EU to reduce critical external dependencies and strengthen control over resources, technologies, and energy infrastructure. A logical continuation of the conceptual-theoretical block is the identification of the expected outcomes of the transformation. In the proposed model, these include economic competitiveness, climate neutrality, and energy-system resilience. Thus, the first block establishes the causal logic of the study by linking the drivers of transformation to the formation of the new energy architecture, its key components, and the resulting transformation outcomes.
Figure 1.
Research Model for Energy Transformation under the EU’s New Energy Architecture.
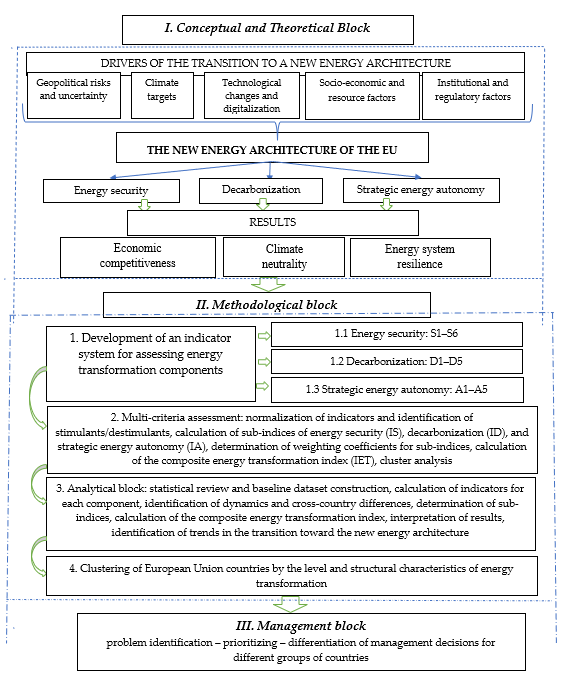
The second, methodological block, provides the transition from the conceptual representation of energy transformation under the emerging new energy architecture to its quantitative assessment. First, a system of indicators is developed to assess each of the three components: energy security, decarbonization, and strategic energy autonomy. The next stage involves implementing a multi-criteria assessment algorithm, including determining the direction of influence of each indicator and classifying it as a stimulant or destimulant, normalizing the initial data, calculating sub-indices, and aggregating them to obtain a Composite Energy Transformation Index. To ensure the comparability of indicators expressed in different units of measurement, the min–max normalization method was applied. The minimum and maximum values for each indicator were determined across the entire panel dataset comprising 27 EU Member States over the period 2015–2024.
For stimulants, whose higher values indicate better performance, normalization was performed using the following formula:
For destimulants, whose lower values indicate better performance, the inverse min–max transformation was applied:
where vijt is the normalized value of indicator j for country i in year t; xijt is the original value of the corresponding indicator; and are the minimum and maximum values of indicator j, respectively, determined across all 27 EU Member States over the entire period 2015–2024.
The use of common minimum and maximum values for the entire observation period ensures that all observations are evaluated against a consistent reference range, thereby preserving the temporal comparability of the normalized indicators and the resulting composite indices. Consequently, changes in index values between 2015 and 2024 reflect changes in the underlying indicators rather than annual adjustments of the normalization boundaries.
The normalization bounds of all 16 indicators are reported in Table A4. The compiled panel of raw and normalized values is provided as Appendix A.
Because the results depend on several methodological choices, the study includes a set of robustness checks. They cover (i) alternative weights of the three dimensions and of the individual indicators, with rank stability measured by Kendall’s τ and cluster stability by the adjusted Rand index (ARI) [21]; (ii) alternative specifications of the reserve-to-production indicators; (iii) the correlation structure and effective dimensionality of the indicator set; and (iv) the stability and significance of the cluster solution, assessed by bootstrap Jaccard coefficients [22] and Kruskal–Wallis tests [23] and (v) the external validity of the clusters, assessed against variables not used in the clustering. The indices were calculated in Microsoft Excel; the clustering and robustness analyses were performed in Python 3.13 with NumPy 2.5, SciPy 1.18, and scikit-learn 1.9.
Equal weights do not imply equal influence on the level of the composite index. Because the three sub-indices have different means (in 2024, 0.296 for IS, 0.768 for ID, and 0.262 for IA), ID accounts for about 58% of a typical IET value. Statements about the level and change of the composite index, including the test of H1, are therefore based on a standardized composite, in which each sub-index is converted to z-scores over the pooled panel (270 country-years) before averaging. The raw-scale IET is retained for rankings, which are almost identical under the two scalings (Kendall’s τ = 0.91 in 2024).
The analytical stage of the methodological block includes compiling the statistical database, calculating the selected indicators and indices, examining their dynamics, identifying anomalous values and structural shifts, interpreting the results, and determining trends in the transition of EU countries toward the new energy architecture. The final stage of the methodological block is the clustering of EU countries according to their level of energy transformation. This makes it possible to move beyond the analysis of individual values of the Composite Energy Transformation Index and identify groups of countries with similar characteristics and levels of transformation, as well as to distinguish leading countries from those experiencing slower transformation processes.
The third, management block, logically completes the research model and involves using the results of quantitative assessment and clustering to identify problem areas, establish priority directions for transformation, and substantiate management decisions concerning the further development of the EU’s new energy architecture.
Thus, the proposed model provides a coherent framework for studying energy transformation in EU countries from the perspective of the transition toward a new EU energy architecture by integrating the theoretical justification of its formation, the methodological tools of multi-criteria assessment, and the interpretation of the results for management decision-making. This provides a basis for the subsequent detailed justification of the indicator system and the assessment methodology for each of the three components of the new energy architecture.
3. Concept and Assessment of Energy Security in EU Countries
The concept of energy security does not have a single universally accepted definition and remains highly context-dependent. In this regard, Kruyt et al. [20] conceptualize energy security as a multidimensional category and systematize existing approaches to its assessment according to four key dimensions:
- •
- Availability—the availability of sufficient energy resources over the long term;
- •
- Accessibility—the ability to obtain energy from the required sources, taking into account, among other factors, geographical and political risks;
- •
- Affordability—the ability to ensure energy supply at an acceptable cost;
- •
- Acceptability—the environmental and social acceptability of the energy system and, more broadly, the environmental and societal implications of energy use.
The authors emphasize that no single indicator can fully capture the level of energy security; therefore, its assessment requires a set of complementary indicators.
Unlike most studies in which diversification is assessed using a single indicator, Azzuni and Breyer [24] adopt a comprehensive approach by considering four dimensions of diversification: diversification of energy sources, energy carriers, energy technologies, and supplier countries. This approach makes it possible to assess diversification not only in terms of the structure of the energy mix, but also in relation to technological options and external energy supply.
According to another approach presented by Schmitz et al. [25], energy security is likewise regarded as a multidimensional concept encompassing not only the uninterrupted supply of energy resources at an affordable cost, but also such dimensions as import dependence, diversification of energy sources and supplier countries, and the resilience of the energy system to external shocks and crisis situations. This approach reflects the current challenges facing the energy sector and provides a methodological basis for developing a system of indicators for assessing energy security across countries.
The development of energy storage infrastructure is also an important component of ensuring the availability and resilience of the energy system. In particular, underground natural gas storage facilities play a strategic role in balancing seasonal fluctuations in demand, maintaining reserve capacity, and strengthening the system’s resilience to supply disruptions. As shown by Iwaszczuk et al. [26], the development and efficient utilization of underground gas storage capacity can be regarded as an important instrument for enhancing energy security and ensuring the reliability of gas supply.
The reliability of energy infrastructure is another important aspect of energy security. Zelinska et al. [27] emphasize the role of gas transmission system reliability in ensuring energy security, demonstrating that timely detection of pipeline failures, predictive modeling, and infrastructure modernization contribute to reducing operational risks and improving the continuity of energy supply.
Energy security can be defined as a condition of the energy system in which a country has access to sufficient quantities of environmentally and socially acceptable energy resources at an affordable cost, while these resources are supplied from diversified sources and by multiple suppliers, thereby enhancing the system’s resilience to an unstable external environment. Since no single indicator can capture this complexity, the assessment of energy security requires a system of complementary indicators.
In this study, we proceed from the assumption that the new energy architecture represents an integrated model of how the European energy system functions under conditions of geopolitical risks, climate-related challenges, and technological transformation. Accordingly, the concept of energy security adopted in this study is analytically separated from the dimensions of strategic energy autonomy and decarbonization. This methodological distinction is essential, as it allows the assessment to focus specifically on the operational resilience, reliability, and physical and economic accessibility of energy resources without conflating these characteristics with the long-term objectives of climate transformation, i.e., decarbonization, or with geopolitical objectives related to self-sufficiency, i.e., strategic energy autonomy.
The study covers the period 2015–2024, representing the most recent decade for which comparable statistical data were available at the time of the analysis. This time horizon makes it possible to assess the dynamics and identify the key trends in energy transformation. To develop a comprehensive framework for assessing energy security, a set of quantitative indicators is proposed and grouped into two key dimensions:
3.1. Availability
S1—Share of Renewable Energy in Gross Final Energy Consumption (%).
This indicator reflects the expansion of a country’s domestic long-term energy resource base. It is classified under availability rather than diversification because it measures the size of the domestic, non-depletable resource base, whereas indicators S4–S6 measure how evenly supply is spread across sources, carriers, and suppliers.
The indicator measures the share of energy from renewable sources in a country’s gross final energy consumption. From an energy security perspective, it reflects the contribution of domestic, non-depletable resources to energy supply and, consequently, the capacity of the energy system to reduce dependence on fossil fuels, particularly imported oil, natural gas, and coal. A higher share of renewable energy indicates a greater contribution of domestic renewable resources to energy supply and, consequently, a potentially lower exposure to supply disruptions and fossil fuel price volatility.
This approach is consistent with the position of the European Environment Agency (EEA) [28], which emphasizes that renewable energy sources provide important advantages over fossil fuels, including improvements in energy security. An increasing share of renewables also contributes to reducing the EU’s dependence on volatile fossil fuel imports.
De Rosa et al. [16] consider the share of renewable energy alongside energy mix diversification and import dependence as important dimensions of energy security in EU countries.
The S1 indicator is calculated as follows:
where REit represents the gross final energy consumption from renewable source in country i in year t, ktoe; FEit represents the gross final energy consumption from all sources in country i in year t, ktoe.
This methodology is also adopted by Eurostat [29]. The indicator is a stimulant: an increase in its value reflects the growing role of renewable energy sources in the energy consumption structure, a reduction in the energy system’s dependence on fossil fuels, and greater diversification and energy security.
Another important indicator is the Reserve-to-Production Ratio (R/P). It reflects a country’s long-term resource availability and indicates the potential number of years for which proven reserves of a given fossil energy resource could meet energy needs if the current production rate were maintained. Kruyt et al. [20] consider the reserve-to-production ratio to be a basic indicator of energy security within the security of supply dimension. The authors note that the ratio indicates the number of years for which a resource can continue to be extracted at the current production rate, thereby linking the physical availability of the resource to the time horizon of its availability.
In this study, the R/P ratio is calculated exclusively for oil and natural gas, while coal is excluded from the calculation. This limitation is due to both data-related and substantive considerations:
- Lack of a continuous time series. Official data from the Energy Institute (Statistical Review of World Energy) [30] on proved coal reserves for individual EU countries are available only for 2020, which precludes calculation of the R/P ratio for the entire 2015–2024 period.
- Specific features of EU environmental policy under the European Green Deal. Since 2015, most EU Member States have been gradually reducing coal production not because of the physical depletion of coal reserves, but as part of decarbonization policies, the phase-out of coal-based power generation, and the implementation of climate commitments under the Paris Agreement [31,32]. Under conditions of deliberately declining production, the mathematical calculation of the R/P ratio would produce artificially high, or effectively “infinite,” values expressed in years. This would distort the actual state of energy security, as such values would reflect the declining rate of resource extraction rather than the underlying resource potential.
Within the proposed assessment framework, S2 represents oil resource availability, whereas S3 represents natural gas resource availability.
The quantitative values of indicators S2 and S3 are calculated as follows:
where Rit is the proved reserves of the respective energy resource in country i at the end of year t, expressed in million tonnes for oil or billion cubic metres for natural gas; Pit is the annual production volume of the respective energy resource in country i in year t, expressed in million tonnes for oil or billion cubic metres for natural gas.
These indicators are also stimulants: an increase in their values indicates greater long-term availability of domestic energy resources, reduced dependence on external supply sources, and enhanced resilience of the energy system to potential supply disruptions.
Due to the lack of officially reported data on proved oil and natural gas reserves for certain EU countries for the period 2021–2024 in the Energy Institute database [30], the reserve values used to calculate the S2 and S3 indicators were estimated using a dynamic adjustment method based on annual production volumes. The estimation procedure was based on the assumption that changes in reserves over time were primarily attributable to their annual depletion through production. Proved reserves for each subsequent year were calculated by subtracting the annual production volume from the estimated reserves at the beginning of the year. This procedure was applied sequentially for each year from 2021 to 2024, using the estimated reserves from the previous year and the corresponding annual production volume. For countries without domestic production or proved reserves of oil or natural gas, the R/P ratio is undefined; in these cases, S2 and S3 were set to zero, reflecting the absence of domestic resource availability.
This treatment has important consequences that must be stated explicitly. In the Energy Institute data, only three Member States—Denmark, Italy, and Romania—have a non-zero oil R/P ratio (S2), and six—Denmark, Germany, Italy, the Netherlands, Poland, and Romania—have a non-zero gas R/P ratio (S3). For all other countries, S2 = S3 = 0, including several with small domestic production (e.g., Austria, Croatia, and Hungary) for which no country-level reserves are reported. Because S2 and S3 together carry one-third of the weight of IS, they act as a near-binary indicator of hydrocarbon endowment. In 2024 they account for 45% of the IS value of Denmark, 44% of Romania, 38% of Italy, 40% of Poland, and 20% of the Netherlands (Table A5 and Table A6). Setting S2 = S3 = 0 also treats the absence of domestic resources as the worst level of availability rather than as a structural property, and the panel-wide maximum anchors the scale to the most resource-rich producer. The indicators are retained because domestic resource availability is a standard component of security of supply [20]. However, three alternative specifications are tested in Section 7: R/P winsorized at the 75th percentile of producing countries, R/P capped at 10 years, and IS calculated without S2 and S3.
Two further specifications address data quality. First, the zeros assigned to countries with small domestic production but no reported reserves represent missing data rather than the absence of resources; IS is therefore also computed on an available-case basis, averaging only the indicators observed for each country. Second, rolling reserves forward without revisions or additions produces a systematic downward drift in R/P; R/P is therefore also computed with reserves held at their last reported (2020) values. A revision-aware country-level reserve series for 2021–2024 is not available from the Energy Institute.
3.2. Diversification
In this study, taking into account the availability and comparability of statistical data across the 27 EU countries, this dimension is represented by three indicators from the Eurostat indicator framework: S4—diversification of primary energy sources, S5—diversification of final energy carriers; S6—diversification of import supplier countries [33].
S4—Diversity Index of Primary Energy Sources is an indicator that reflects the degree of balance in the energy supply structure across different primary energy sources, including coal, oil, natural gas, nuclear energy, hydropower, solar energy, wind energy, and others.
From an energy security perspective, greater diversification of primary energy sources implies lower dependence of the energy system on any single type of resource and greater substitution capacity in the event of supply disruptions or price shocks.
The indicator is calculated using the Shannon–Wiener Index, adapted in accordance with Eurostat’s methodology for compiling energy balances [34]:
where Zeit is the share of the e-th primary energy source in the country’s total gross available energy consumption (); n is the number of types of energy resources; i is country; t is year.
The S4 indicator is a stimulant: an increase in its value indicates a lower degree of concentration in the energy system, greater scope for substitution among energy resources, and enhanced resilience of energy supply.
S5—Weighted Diversity Index of Energy Carriers in Final Energy Consumption is an indicator that reflects the degree of balance in final energy consumption across different energy carriers, including electricity, natural gas, petroleum products, heat, and renewable energy sources, across sectors of the economy.
From an energy security perspective, diversification of final energy carriers reduces consumers’ dependence on any single type of energy and increases the potential for substitution with alternative carriers in the event of supply disruptions or price shocks.
The indicator is calculated using a weighted Shannon-Wiener Index [34]:
where Zeikt is the share of the e-th energy carrier in the final energy consumption of the k-th economic sector (); ykit is the share of the k-th sector (industry, transport, households, services, etc.) in the country’s total final energy consumption (); m is the number of final energy consumption sectors.
The S5 indicator is a stimulant: an increase in its value reflects a more balanced structure of final energy consumption, a greater range of alternative energy carriers, and, consequently, higher resilience of the energy system.
Diversification of external energy supply sources is an important component of energy security. As shown by Dzoba et al. [35], it helps reduce dependence on individual suppliers. Therefore, the indicator system should include a measure of supplier-country concentration, reflecting the degree of a country’s external supply dependence.
S6—Energy Import Origin Concentration Index is an indicator that reflects the degree of geographical concentration of energy imports among individual supplier countries. It captures the extent to which a country’s external energy supply depends on a limited number of trading partners.
From an energy security perspective, a lower level of concentration—or, equivalently, greater diversification of import suppliers—implies lower vulnerability to geopolitical risks, trade restrictions, or supply disruptions originating from individual supplier countries.
The S6 indicator is calculated using the classical Herfindahl–Hirschman Index (HHI) [34]:
Spit is the share of imports from the p-th partner country in the total imports of country i in year t of the respective energy resource or aggregated energy basket (); c is the total number of import supplier countries.
The S6 indicator is a destimulant: a value approaching 1 indicates a high degree of import concentration, whereas a value approaching 0 reflects a high level of supplier diversification and lower external vulnerability of the energy system.
The selected indicators provide a comprehensive framework for the quantitative assessment of energy security in EU countries. The framework captures the dimensions of physical availability and long-term resource adequacy, as well as the structural, sectoral, and geographical diversification of energy flows. The main characteristics of indicators S1–S6, their units of measurement, and the direction of their impact on the level of energy security are presented in Table 2.
Table 2.
Indicators for assessing the level of energy security.
An analysis of the direction of influence of the indicators presented in Table 2 shows that they affect the level of energy security differently: indicators S1–S5 are stimulants, whereas S6 is a destimulant. Given the substantial differences among the indicators in terms of units of measurement—including percentages, time intervals expressed in years, and dimensionless indices—as well as their ranges and scales of variation, the initial data were normalized to ensure comparability and enable their subsequent aggregation.
Based on the normalized indicator values, an Energy Security Sub-Index was constructed for the EU Member States for the period 2015–2024. The proposed sub-index provides a comprehensive quantitative assessment of the energy security of national energy systems, taking into account long-term domestic energy resource availability, the use of renewable energy sources, and the degree of diversification of primary energy sources, final energy carriers, and supplier countries.
The final value of the Energy Security Sub-Index (IS) is determined by aggregating the normalized values of indicators S1–S6 using the corresponding weighting coefficients. The study assumes equal importance of all indicators, and therefore assigns an equal weight to each of them. Since this dimension comprises six indicators, the weight assigned to each indicator is WJ = 1/6 ≈ 0.1667 (16.67%), and the sum of the weighting coefficients equals 1:
where ISit represents the Energy Security Sub-Index of the i-th country in year t; Sjit represents the normalized value of the j-th energy security indicator for the i-th country in year t; Wj represents the weighting coefficient of the j-th indicator; j represents indicator number (j = 1, …, 6); i represents EU Member State; t represents year.
Higher values of the Energy Security Sub-Index correspond to a higher level of energy security, whereas lower values indicate greater vulnerability of the energy system across the set of characteristics considered.
The calculated values of the Energy Security Sub-Index are presented in Table 3.
Table 3.
Values of the Energy Security Sub-Index for EU Countries, 2015–2024.
The results reveal substantial differentiation among EU countries in terms of the Energy Security Sub-Index, largely reflecting differences in their domestic resource base and their capacity to compensate for shortages of conventional energy resources. In 2024, the highest values were recorded in Italy (0.486), Denmark (0.481), and Romania (0.464). A relatively high value was also observed in Malta (0.430), whereas Spain (0.327) lies only slightly above the EU mean of 0.296; in both countries, energy security has increasingly been supported by diversification and the expansion of renewable energy sources despite the depletion or absence of significant domestic oil and natural gas reserves. Poland demonstrated a particularly pronounced positive trend over the study period, with its index increasing from 0.180 in 2015 to 0.330 in 2024. Lithuania followed a similar trajectory, rising from 0.199 to 0.358, which indicates progress in developing alternative energy capacities and strengthening energy-system resilience.
The position of Italy and Malta requires explanation. Italy’s score reflects a combination of domestic oil and gas resources (S2, S3), a balanced primary energy mix (S4), and imports spread across many suppliers (S6). Malta’s result must be interpreted with more caution. Malta has no domestic hydrocarbons (S2 = S3 = 0) and a low renewable share, so its score is driven by the diversity indicators (S5, S6, (S4–S6; normalized values of 0.70, 0.76, and 0.93 in 2024). These indicators measure how evenly supply is spread, not the scale or physical redundancy of the system. A small island system with a single electricity interconnector can therefore score well on diversity while remaining physically vulnerable.
At the same time, the condition of the traditional resource base and the structural characteristics of national energy systems remain constraining factors for several countries. In Germany, the index remained almost unchanged, increasing only from 0.257 in 2015 to 0.261 in 2024, which is associated with substantial dependence on hydrocarbon imports in the absence of significant domestic oil and natural gas reserves. The Netherlands experienced a noticeable decline from 0.381 in 2015 to 0.323 in 2024, including a decrease to 0.278 in 2018. This trend is consistent with the gradual phase-out of production at the Groningen gas field and may reflect the effects of declining domestic resource availability on the country’s energy security position. A decline was also recorded in Luxembourg, where the index fell from 0.308 in 2015 to 0.233 in 2024.
In Cyprus, IS rose from 0.229 in 2023 to 0.312 in 2024, the largest annual change in the table. It results almost entirely from a sharp increase in the Eurostat diversity indices for Cyprus in 2024 (normalized S4 from 0.24 to 0.40 and S5 from 0.28 to 0.69). No structural change of comparable size could be identified in the Cypriot energy system in that year, so the 2024 value may partly reflect a statistical revision and should be treated as provisional. In Denmark, IS declined from 0.558 in 2021 to 0.481 in 2024, although Denmark leads the composite ranking. The decline reflects a lower gas R/P ratio (from 18.2 to 13.3 years), as gas production increased in 2024 while reserves were rolled forward without revision, a lower oil R/P ratio (from 16.6 to 15.0 years), and a higher concentration of import origins (normalized S6 from 0.91 to 0.63). Part of this decline is therefore an artefact of frozen reserve estimates.
The crisis period of 2022–2024 represented a turning point in the formation of the EU’s new energy architecture. In 2022, several countries experienced a temporary decline in the index, which coincided with the 2022 energy crisis and constraints on imported energy supplies. This was observed, in particular, in Austria, where the index decreased from 0.270 in 2021 to 0.238 in 2022, and in Ireland, where it fell from 0.174 to 0.145. However, by 2023–2024, many countries had stabilized or improved their positions. Finland increased its index from 0.158 in 2015 to 0.270 in 2024, Slovakia from 0.068 to 0.152, and Czechia from 0.126 to 0.186. These results indicate that the absence of substantial domestic oil and natural gas reserves does not necessarily constitute a persistent structural constraint on energy security. Its adverse effects can be mitigated through the accelerated deployment of renewable energy sources and deeper structural transformation of national energy systems.
4. Concept and Assessment of Decarbonization Within the EU’s New Energy Architecture
Decarbonization is a complex and multidimensional process for which no single universally accepted methodological approach has been established in the academic literature. Šimić et al. [39] emphasize that decarbonization requires substantial transformations across all sectors of the economy and a systematic reduction in fossil fuel use. To assess its effectiveness, the authors employ a set of 13 energy-related indicators, confirming that this process cannot be adequately captured by a single indicator.
The multidimensional nature of decarbonization is also evident in Brodny, Tutak, and Grebski [15]. The authors consider decarbonization of the energy sector to be one of the key components of energy transformation, alongside improvements in energy efficiency, the development of renewable energy sources, reductions in greenhouse gas emissions, and lower import dependence. This approach demonstrates that decarbonization is closely interconnected with the economic, social, and security-related characteristics of the energy system.
Tutak, Brodny, and Bindzár [14] likewise apply a multi-criteria approach, developing a system of 14 indicators grouped into four dimensions of energy and climate sustainability covering energy, climate, economic, and social aspects. The findings of previous studies therefore support the need for a comprehensive assessment of decarbonization that considers not only final emission levels but also the structural characteristics of the energy system and the intensity of emissions generation.
Drawing on these approaches, decarbonization can be defined as a systemic process of reducing greenhouse gas emissions and the carbon intensity of energy and economic activity through the gradual decline in the role of fossil fuels and the transition toward a low-carbon model of energy production and consumption.
Since the EU’s new energy architecture is represented in this study by three interrelated but analytically separated components, decarbonization is methodologically distinguished from energy security and strategic energy autonomy. This distinction is justified by the fact that decarbonization directly reflects the reduction in the use of carbon-intensive energy sources and the decline in the carbon burden of the energy system and the economy.
Accordingly, a system of five complementary indicators was developed to assess decarbonization. Their selection follows a consistent cause-and-effect logic: share of fossil fuels in gross available energy (D1), carbon intensity of energy consumption (D2), carbon intensity of electricity generation (D3), greenhouse gas emission intensity relative to gross value added (D4), and greenhouse gas emissions per capita (D5). This approach captures different stages of the decarbonization process, ranging from the structural characteristics of the energy system to the carbon efficiency of the economy and the resulting environmental outcome.
D1—Share of Fossil Fuels in Gross Available Energy (%) is an indicator that reflects the structural dependence of a country’s energy system on fossil energy sources and represents the share of its total energy needs met by coal, oil, natural gas, and other fossil fuels.
The inclusion of this indicator in the decarbonization assessment framework is supported by the approach adopted by Brodny, Tutak, and Grebski [15], who consider the decarbonization of the energy sector to be one of the key criteria of the energy transition, reflected in a declining share of emission-intensive energy sources in the energy consumption structure. According to the authors, a reduction in the share of such sources, particularly coal and natural gas, indicates progress in energy transformation. A similar rationale is found in Tutak, Brodny, and Bindzár [14], where the structure of the energy mix, the share of renewable energy, dependence on fossil fuels, and greenhouse gas emissions are considered interrelated characteristics of energy and climate sustainability in EU countries.
The quantitative value of D1 is calculated as the ratio of fossil energy sources to gross available energy:
where FFit is the volume of fossil energy sources in country i in year t, ktoe; GAEit is gross available energy in country i in year t, ktoe.
The indicator is a destimulant: a decrease in its value indicates reduced dependence of the energy system on carbon-intensive energy sources and deeper structural decarbonization.
D2—Greenhouse Gas Emissions Intensity of Energy Consumption (t CO2-eq./toe) is an indicator that reflects the amount of greenhouse gas emissions generated per unit of gross available energy and captures the carbon intensity of the energy system. A decline in this indicator indicates a reduction in emissions generated per unit of energy used and, consequently, further progress in decarbonization.
The methodological rationale for using D2 is provided by the approaches of [14] and [15], in which the energy and climate transformation of EU countries is assessed through the interrelationship between energy consumption, the structure of the energy system, decarbonization processes, and greenhouse gas emissions. In this context, the carbon intensity of energy consumption makes it possible to quantify the amount of greenhouse gas emissions generated per unit of energy used.
The quantitative value of D2 is calculated as the ratio of greenhouse gas emissions from the energy sector to gross available energy:
where represents the greenhouse gas emissions from the energy sector in country i in year t, thousand tonnes of CO2 equivalent.
The D2 indicator is a destimulant: the lower the volume of greenhouse gas emissions per unit of gross available energy, the higher the level of decarbonization of the energy system.
D3—Life-Cycle Carbon Intensity of Electricity Generation (g CO2-eq./kWh) is an indicator that reflects the amount of life-cycle greenhouse gas emissions (direct emissions plus upstream emissions from fuel supply and plant construction) associated with the generation of one unit of electricity and captures the degree of decarbonization of the power sector. Its value depends directly on the electricity generation mix: a higher share of fossil fuels increases carbon intensity, whereas a greater contribution from renewable and other low-carbon energy sources reduces it.
The rationale for using D3 is supported, in particular, by Scarlat, Prussi, and Padella [40], who provide a quantitative assessment of the carbon intensity of electricity produced and consumed across European countries. The authors identify substantial cross-country differences as well as an overall downward trend in electricity carbon intensity, highlighting the important role of power-sector decarbonization in enabling further emission reductions across other sectors of the economy.
The relationship between the electricity generation mix and its carbon intensity is also confirmed by Horobet et al. [41]. Based on an analysis of 163 countries, the authors found that electricity generation from fossil fuels is one of the main drivers of higher carbon intensity of electricity generation, whereas nuclear and renewable energy sources contribute to its reduction.
The development of solar energy also plays an important role in reducing the carbon intensity of electricity generation. As shown by Iwaszczuk et al. [42], the expansion of photovoltaics contributes to the transformation of the electricity generation mix and the substitution of conventional carbon-intensive energy sources, thereby confirming its importance for decarbonization processes.
Quantitatively, the indicator is calculated as the ratio of greenhouse gas emissions associated with electricity generation to the total volume of electricity generated:
where represents the lifecycle greenhouse gas emissions of electricity generation in country i in year t, g CO2-eq.; EGit represents the electricity generated in country i in year t, kWh.
The D3 indicator is a destimulant: the lower the volume of greenhouse gas emissions per unit of electricity generated, the higher the level of decarbonization of the power sector. Data for D3 were taken from Our World in Data [14], whose series is based on Ember and Energy Institute data and uses life-cycle emission factors. Equation (11) and the unit g CO2-eq./kWh therefore refer to life-cycle intensities, not to direct (stack) emission factors. They were used because they provide a consistent series for all 27 countries over 2015–2024.
D4—Greenhouse Gas Emissions Intensity of Gross Value Added (g CO2-eq./EUR of GVA) is an indicator that reflects the amount of greenhouse gas emissions generated per unit of gross value added and captures the carbon efficiency of economic activity. A decline in this indicator means that a lower volume of greenhouse gas emissions is generated per unit of economic value created, indicating a gradual decoupling of economic activity from carbon emissions.
The use of D4 is consistent with the approach adopted by Tutak, Brodny, and Bindzár, who include Total GHG-GDP intensity, expressed in tonnes of CO2 equivalent per million EUR, as a destimulant in their indicator framework for assessing energy and climate sustainability in EU countries [14]. A similar approach is found in Gajdzik et al. [43], where greenhouse gas emission intensity is treated as an outcome indicator of energy transformation associated with the efficiency of energy use in the economy.
The quantitative value of D4 is calculated as the ratio of greenhouse gas emissions from economic activity to gross value added:
where GHGit represents greenhouse gas emissions from economic activities in country i in year t, g CO2-eq.; GVAit represents gross value added in country i in year t, EUR.
The D4 indicator is a destimulant: the lower the volume of greenhouse gas emissions per unit of gross value added generated, the higher the carbon efficiency of the economy and the greater the level of decarbonization.
D5—Greenhouse Gas Emissions per Capita (t CO2-eq./person) is an indicator that reflects the volume of greenhouse gas emissions per inhabitant and captures the final per capita environmental outcome of decarbonization processes. Unlike absolute emission volumes, the use of a per capita indicator enables comparisons between countries with different population sizes and makes it possible to assess differences in the carbon burden attributable to each person.
Per capita emission indicators are widely used for comparative assessments of countries’ climate performance. In particular, Šimić et al. [39], Brodny, Tutak, and Grebski [28], and Tutak, Brodny, and Bindzár [29] treat greenhouse gas emissions as one of the key outcome characteristics of energy and climate transformation. Expressing the indicator on a per capita basis additionally accounts for differences in population size and enables more meaningful cross-country comparisons.
The quantitative value of D5 is calculated as the ratio of total greenhouse gas emissions to the country’s population:
where GHGit represents greenhouse gas emissions in country i in year t, tonnes of CO2 equivalent; POPit represents population of country i in year t, persons.
The D5 indicator is a destimulant: the lower the volume of greenhouse gas emissions per capita, the higher the level of decarbonization. Within the decarbonization indicator framework, this indicator serves as a final outcome measure, as it reflects the overall environmental result of changes in the structure of energy consumption, the carbon intensity of the energy system, and the carbon intensity of economic activity.
The selected indicators form a comprehensive framework for the quantitative assessment of decarbonization in EU countries. The framework covers the structural characteristics of the energy mix, the carbon intensity of energy consumption and electricity generation, the carbon efficiency of economic activity, and the per capita level of greenhouse gas emissions. The main characteristics of indicators D1–D5, their units of measurement, and the direction of their impact on the level of decarbonization are presented in Table 4.
Table 4.
Indicators for assessing the level of decarbonization.
As shown in Table 4, all selected indicators D1–D5 are destimulants, meaning that a decrease in their values corresponds to positive progress in decarbonization. Because the indicators differ in their units of measurement and scales, they were transformed into a comparable form in accordance with the general methodology of the study. Given their destimulating nature, an inverse direction of assessment was applied during normalization: a lower initial indicator value corresponds to a higher normalized value, whereas a higher initial value corresponds to a lower normalized value. As a result, all normalized indicators have a common orientation, whereby a value approaching 1 indicates a higher relative level of decarbonization, while a value approaching 0 indicates a lower level. Therefore, an increase in the Decarbonization Sub-Index reflects positive decarbonization dynamics, despite the fact that the original D1–D5 indicators are destimulants.
Based on the normalized indicator values, the Decarbonization Sub-Index was calculated for EU countries for the period 2015–2024. The resulting values characterize the relative level of decarbonization of national energy systems, taking into account the structure of energy consumption, the carbon intensity of electricity generation and economic activity, as well as per capita greenhouse gas emissions.
The Decarbonization Sub-Index (ID) is calculated by aggregating the normalized values of indicators D1–D5:
where IDit represents the Decarbonization Sub-Index of the i-th country in year t; Dijt represents the normalized value of the j-th decarbonization indicator for the i-th country in year t.
The study assumes equal importance of all five indicators included in the Decarbonization Sub-Index; therefore, each indicator is assigned an equal weight of 0.2 (20%). This approach ensures an equal contribution of each indicator to the overall sub-index value.
The calculated values of the Decarbonization Sub-Index are presented in Table 5.
Table 5.
Values of the Decarbonization Sub-Index for EU Countries, 2015–2024.
The results indicate an overall increase in the normalized Decarbonization Sub-Index across EU countries over the period 2015–2024, which, given the adopted normalization direction, reflects positive progress in decarbonization. The average value of the sub-index increased from 0.639 in 2015 to 0.768 in 2024, and in all countries included in the analysis, the value recorded at the end of the period exceeded the initial level.
Sweden remained the leading country throughout the study period, with the sub-index reaching 0.985 in 2024. High values were also recorded in Finland (0.926), France (0.921), Latvia (0.861), Portugal (0.853), and Denmark (0.843). By contrast, the lowest values in 2024 were observed in Poland (0.561), Cyprus (0.570), and Malta (0.605), indicating persistent cross-country differences in both the pace and outcomes of decarbonization.
The largest increases over 2015–2024 were observed in Estonia, where the sub-index rose from 0.439 to 0.757, Bulgaria, from 0.483 to 0.750, and Luxembourg, from 0.459 to 0.705. At the same time, the trajectories of individual countries were uneven over the study period, indicating differences in the pace and pattern of structural and carbon transformation of their energy systems.
The assessment demonstrates that the decarbonization of EU countries’ energy systems is progressing unevenly and that the levels achieved differ substantially across countries. This confirms the need to consider decarbonization as a distinct dimension of the transformation toward the EU’s new energy architecture, alongside energy security and strategic energy autonomy.
5. Strategic Energy Autonomy as a Distinct Component of the EU’s New Energy Architecture
Strategic energy autonomy reflects the extent to which a state is able to control the sources, technologies, infrastructure, and governance mechanisms underlying its own energy supply. More broadly, strategic autonomy can be understood as the ability of a state or a regional integration bloc to independently meet its critical needs and make strategic decisions without excessive dependence on other countries. In the energy sector, this implies:
- •
- Minimizing dependence on energy imports from politically unstable or hostile countries;
- •
- Maintaining sufficient domestic energy production capacity;
- •
- Retaining control over critical energy infrastructure;
- •
- Ensuring access to critical raw materials;
- •
- Developing domestic energy technologies;
- •
- Strengthening resilience to external political and economic pressure.
According to [50], the main challenges hindering the achievement of the European Union’s strategic energy autonomy include critical dependence on fossil fuel imports, geopolitical risks, dependence on imported critical technologies and raw materials, insufficient integration of energy infrastructure, high volatility in global energy markets, the slow deployment of renewable energy sources and energy storage systems, fragmentation of regulatory policies across EU Member States, cyber threats to critical energy infrastructure, and insufficient investment in advanced energy technologies.
Accordingly, energy autonomy can be understood as an integrated characteristic of the capacity of a state or a regional integration bloc to ensure the effective functioning and long-term development of its energy system through sufficient resource, technological, infrastructural, economic, institutional, investment, and innovation capabilities. Such capacity enables the reduction in critical external dependencies and allows the country or regional integration bloc to independently shape its energy development trajectory. In the context of the European Union, strategic energy autonomy refers to the ability of the EU energy system to meet its own energy needs and make strategic decisions concerning the development of the energy sector without critical dependence on external suppliers of energy resources, technologies, equipment, or raw materials. This capacity is supported by the development of domestic energy production, diversification of supply sources, strengthening of domestic industrial capacity, and access to strategic energy resources.
When assessing the level of strategic energy autonomy, a comprehensive approach should be applied. Such an approach should take into account not only innovation, technological, and economic autonomy, but also access to critical raw materials and energy equipment, the capacity to meet peak energy demand using domestic resources, and the development of decentralized energy supply systems.
Thus, the multidimensional nature of strategic energy autonomy requires its decomposition into individual components, each reflecting a specific aspect of a country’s capacity to reduce critical external dependencies and independently ensure the functioning and development of its energy system. To operationalize strategic energy autonomy quantitatively, it is appropriate to develop a system of indicators that, on the one hand, represent its key components and, on the other, satisfy the criteria of economic relevance, cross-country comparability within the EU, data availability, and sufficient temporal coverage. In accordance with these criteria, this study assesses strategic energy autonomy using indicators reflecting the resource, innovation and technological, infrastructural, and economic capacities of EU countries’ energy systems, as well as their degree of decentralization.
In our view, the resource dimension of strategic energy autonomy can be represented both by the overall level of energy import dependence and by more specific indicators reflecting dependence on imports of critical raw materials required for the energy sector, including lithium, cobalt, copper, battery-grade graphite, nickel, manganese, rare earth elements used in permanent magnets, silicon metal, and platinum-group metals. It should also capture the degree to which strategic energy technologies, equipment, and components are supplied by domestic manufacturing, including solar panels, batteries, wind turbines, and electrolyzers [51,52,53].
In this study, we use the overall indicator reflecting the degree of a country’s dependence on energy imports. A1—Energy Import Dependency (%) is an indicator that reflects the extent to which a country relies on imported energy resources to meet its domestic energy needs. It shows the share of energy demand covered by imported energy carriers rather than domestic production. This indicator is one of the key measures of strategic energy autonomy, as it reflects a country’s capacity to meet its energy needs using domestic resources. The lower the level of energy import dependence, the higher the country’s resource autonomy.
According to the Eurostat methodology, the indicator is calculated as the ratio of net energy imports to gross available energy:
where NIit represents net energy imports of country i in year t (imports minus exports), ktoe.
If a country is a net energy exporter, the indicator may take a negative value [54].
To characterize the innovation and technological dimension of strategic energy autonomy, we use the A2—Patent Activity in Climate-Neutral Energy Technologies indicator. The calculation of this indicator includes patents classified under Y02E of the Cooperative Patent Classification (CPC), in particular:
- Y02E 10—renewable energy generation;
- Y02E 20—combustion technologies with mitigation potential;
- Y02E 30—nuclear energy;
- Y02E 40—technologies for efficient electrical power generation, transmission or distribution;
- Y02E 50—fuels of non-fossil origin;
- Y02E 60—enabling technologies, in particular energy storage, batteries, hydrogen-related technologies etc.;
- Y02E 70—other energy-related greenhouse gas (GHG) reduction technologies [55].
The quantitative value of A2 is calculated as the number of Y02E patent inventions per 1 million inhabitants:
where Y02Eit represents number of Y02E patent inventions in country i in year t; POPit represents population of country i in year t, persons. Patent counts refer to inventions by priority date and by the inventor’s country of residence, as published by the OECD [56]. Because the Y02E tags are applied retrospectively to the whole patent database when the scheme is revised, reclassification does not create breaks between years; the most recent years, however, are incomplete because of publication lags.
The infrastructural dimension of strategic energy autonomy is assessed using A3—Electricity Interconnection Level (%). This is an official European Commission indicator used within the Energy Union framework, by ENTSO-E, and under [57] to assess the degree of integration of a national electricity system with the power systems of other EU Member States. Following the European Commission, the indicator is defined as the ratio of the net import transfer capacity of a Member State’s cross-border interconnectors to its installed electricity generation capacity, expressed as a percentage [58]. Interconnection capacities were taken from the ENTSO-E seasonal outlooks [59] and installed generation capacities from Eurostat [60].
For 2015–2017, the interconnection levels published by the European Commission in its reports on the electricity interconnection target were used [58]; from 2018 onward, the level was calculated from the import transfer capacities reported in the ENTSO-E winter outlook for the respective year, which state the capacities available in that year, and from Eurostat installed capacities.
where ICit represents import interconnection capacity of country i in year t, MW; IGCit represemts installed electricity generation capacity of country i in year t, MW.
The indicator reflects the extent to which a country is integrated into the European electricity market and its capacity for cross-border electricity exchange. A higher value indicates greater capacity to import electricity during periods of domestic supply shortages, export surplus electricity, achieve deeper integration into the EU internal energy market, and facilitate the integration of renewable energy sources [58].
To assess the economic dimension of strategic energy autonomy, we use A4—Energy Productivity, one of Eurostat’s key indicators. It reflects the amount of economic output, expressed in terms of GDP, generated per unit of energy consumed and is calculated as follows:
where represents gross domestic product of country i in year t, expressed in Purchasing Power Standards, PPS; GAEit represents gross available energy in country i in year t, kgoe. Here kgoe denotes kilograms of oil equivalent (1 ktoe = 106 kgoe). Since GDP is expressed in PPS and GAE in kilograms of oil equivalent, A4 is expressed in PPS per kgoe (PPS/kgoe), the unit used by Eurostat [61]. GAE is expressed in ktoe in Equations (9) and (10) and in kgoe here, following the Eurostat convention for energy productivity; the ratios are unaffected.
GAE includes primary production, recovered products, imports minus exports, and stock changes (+/−) [62]. This indicator is used to monitor progress toward the Sustainable Development Goal 7 (SDG 7), the European Green Deal, and the Energy Union. Energy productivity is defined as the ratio of gross domestic product (GDP) to Gross Available Energy (GAE) and reflects the economic output generated per unit of energy resources used. An increase in the indicator indicates greater efficiency in energy use and a weaker dependence of economic growth on additional energy consumption. For the calculation of energy productivity, Eurostat expresses GDP either in millions of euros in chain-linked volumes with 2010 as the reference year (at 2010 exchange rates) or in millions of Purchasing Power Standards (PPS). The use of chain-linked euro values makes it possible to analyze energy productivity trends over time within a given geographical area, whereas PPS values enable cross-country comparisons for the same year [63].
To capture the decentralization of the energy supply system, we propose assessing the degree of decentralization of electricity generation. More detailed assessments could additionally incorporate indicators such as reserve capacity of energy networks, adequacy of strategic energy reserves, and other relevant characteristics.
A5—Decentralized Electricity Generation Proxy (DEG), % reflects the degree of decentralization of electricity generation by measuring the share of electricity produced by autoproducers relative to the country’s final electricity consumption:
where APGit represents electricity generated by autoproducers in country i in year t, GWh; FECit represents final electricity consumption in country i in year t, GWh.
In several Member States, autoproduction largely reflects captive generation in industry, including fossil-fuelled and, in some cases, coal-fired combined heat and power plants. A5 therefore measures the share of on-site generation rather than decentralization in the sense of small-scale, distributed, and low-carbon supply, and its results should be read accordingly.
Final electricity consumption is used as the denominator because the indicator is intended to show how much of end-use electricity demand could be covered by on-site generation, which is the relevant quantity for local supply security. Because generation and final consumption differ by network losses, the own use of power plants, and cross-border trade, A5 is not bounded at 100%; in the sample it ranges from 0.3% to 38.6%.The description of the indicators used to assess the level of strategic energy autonomy is presented in Table 6.
Table 6.
Description of Indicators Used to Assess the Level of Strategic Energy Autonomy.
The proposed framework for assessing energy autonomy is consistent with current European Union policy priorities reflected in REPowerEU [3], the Net-Zero Industry Act (Regulation (EU) 2024/1735) [64], the Critical Raw Materials Act (Regulation (EU) 2024/1252) [65], and the Green Deal Industrial Plan (COM(2023) 62 final) [66]. These policy documents frame strategic energy autonomy not merely as a reduction in dependence on imported energy resources, but as the broader capacity of the European Union to meet its own needs for strategic energy technologies, critical raw materials, innovation, manufacturing capacity, and the infrastructure required to support the energy transition.
The link between each indicator and autonomy differs in strength and should be stated explicitly. A1 measures autonomy directly, as the share of energy demand that must be covered by imports. A2 proxies the inventive capacity needed to develop domestic clean-energy technologies; it measures inventive activity, not control over manufacturing capacity or critical raw materials. A3 is ambivalent. Interconnection allows a country to cover domestic shortfalls from its neighbours, but it also deepens its interdependence with them. It is treated as a stimulant because, within the EU internal market, interconnection replaces exposure to single extra-EU suppliers with mutually binding intra-EU arrangements, in line with the EU interconnection targets [58]; the alternative interpretation is tested by excluding A3 (Table A7). Excluding A3 changes the ranking only slightly (Kendall’s τ = 0.90) but alters the cluster partition (ARI = 0.20), so the autonomy pillar, and the clusters derived from it, partly reflect integration into the internal electricity market. A4 relates to autonomy through demand: a country that produces more output per unit of energy needs less imported energy for the same level of activity, although A4 is primarily an efficiency indicator. A5 captures only one facet of decentralization. Taken together, the pillar measures the structural capacity for autonomy and reduced external exposure rather than strategic autonomy in the full sense defined above. The name of the pillar is retained for consistency with EU policy documents [3,64,65,66], but the results should be read in this narrower sense.
This narrower operationalization of strategic energy autonomy is primarily due to limitations in the availability of comprehensive, harmonized, and comparable statistical data for all 27 EU Member States over the period 2015–2024. In particular, Eurostat does not currently provide a complete and consistent set of country-level indicators covering dependence on critical raw materials, domestic manufacturing capacities for clean-energy technologies, control over strategic technology value chains, and other aspects of technological and industrial autonomy. Consequently, the proposed sub-index does not fully capture all dimensions of strategic energy autonomy outlined in the conceptual framework of this study. These data limitations highlight the need for further refinement of the assessment methodology as more comprehensive statistical data become available.
The Strategic Energy Autonomy Sub-Index (IA) is obtained by aggregating the normalized values of indicators A1–A5:
where IAit represents the Strategic Energy Autonomy Sub-Index of the i-th country in year t; Ajit represents the normalized value of the j-th strategic energy autonomy indicator for the i-th country in year t.
The study assumes equal importance of all indicators, with each indicator assigned the same weight. Since the index comprises five indicators, the weighting coefficient for each indicator is 0.2 (20%), and the sum of the weighting coefficients equals 1.
The calculated Strategic Energy Autonomy Sub-Indices are presented in Table 7.
Table 7.
Values of the Strategic Energy Autonomy Sub-Index for EU Countries, 2015–2024.
The application of the linear trend extrapolation method to estimate patent activity indicators for 2023–2024 is methodologically justified by the short-term forecasting horizon and the availability of actual data for 2015–2022. The selected method ensures transparency and reproducibility of calculations, captures the overall trend in the indicator, and allows for the construction of a complete time-series panel covering all 27 EU Member States. The application of a uniform forecasting approach ensures methodological consistency in the assessment, while the resulting values are treated as estimates subject to inherent forecasting uncertainty. Because per capita patent counts are unstable for small countries, A2 was also replaced by its logarithm and by a three-year moving average; neither change alters the 2024 cluster partition (ARI = 1.00), and Kendall’s τ for the ranking is 0.91 and 1.00, respectively (Table A12).
The results indicate substantial differentiation among EU countries in both the level and dynamics of strategic energy autonomy. Denmark remained the leading country throughout the study period, with its sub-index increasing from 0.420 in 2015 to 0.498 in 2024. Relatively high values in 2024 were also recorded in Romania (0.373), the Netherlands (0.346), Luxembourg (0.327), Estonia (0.321), and Austria (0.311).
Most countries exhibited a positive trend. The largest increases over 2015–2024 were observed in Latvia, where the sub-index rose from 0.149 to 0.292, Italy from 0.135 to 0.251, Ireland from 0.180 to 0.285, Hungary from 0.152 to 0.255, and Cyprus from 0.070 to 0.165. Positive developments were also observed in Belgium, Estonia, Germany, Poland, Slovenia, and Austria.
The values for Czechia, Slovakia, Finland, and Greece remained relatively stable, with only limited changes over the study period. By contrast, Croatia and Malta were the only countries in which the 2024 sub-index value was lower than in 2015. Overall, in 2024 the sub-index ranged from 0.126 in Malta to 0.498 in Denmark, confirming persistent and substantial cross-country differences in the level of strategic energy autonomy across the EU.
Malta’s IA series is also highly volatile (e.g., 0.068 in 2017 and 0.201 in 2018). The volatility comes mainly from A2: for a country with about half a million inhabitants, one or two patent families change the per capita value substantially (normalized A2 varies between 0 and 0.61 across years). Single-year movements for Malta should therefore not be over-interpreted.
The period 2022–2024 deserves particular attention, as it may be regarded as a turning point in the formation of the EU’s new energy architecture. In 2022, several countries experienced declines and increased volatility in the sub-index, reflecting the effects of the energy crisis and the need for rapid adjustments to established energy supply models. In 2023–2024, however, most countries showed signs of recovery and improvement in strategic energy autonomy. This pattern may indicate a gradual shift from short-term adaptation to the 2022 energy shock toward a deeper structural transformation of national energy systems, focused on supply diversification, reducing critical external dependencies, developing domestic technologies and infrastructure, and improving energy-use efficiency.
6. Composite Energy Transformation Index
The Composite Energy Transformation Index is an aggregate measure that reflects the degree of transformation of a national energy system across three interrelated dimensions: energy security, decarbonization, and strategic energy autonomy.
The overall assessment of the transformation of the energy architecture of EU countries is based on three previously calculated sub-indices: the Energy Security Sub-Index, the Decarbonization Sub-Index, and the Strategic Energy Autonomy Sub-Index.
The three sub-indices represent the key dimensions of energy transformation identified in this study. Their weighting coefficients are assumed to be equal, reflecting the equal importance assigned to energy security, decarbonization, and strategic energy autonomy in the formation of the overall transformation level.
The Composite Energy Transformation Index (IET) is defined as:
where IETit represents the Composite Energy Transformation Index; W represents the weighting coefficient assigned to each sub-index.
IETit = W × ISit + W × IDit + W × IAit,
The three dimensions are conceptually distinct, but some indicators are related across them. Two pairs deserve particular attention. First, S1 (share of renewables in gross final energy consumption) and D1 (share of fossil fuels in gross available energy) are not mirror images. They use different denominators, and nuclear energy, non-renewable waste, and electricity trade lower D1 without raising S1. Countries with large nuclear fleets, such as France, Slovakia, Belgium, and Czechia, therefore score markedly better on D1 than on S1 (e.g., France 0.75 versus 0.30 in 2024). Second, S6 (import origin concentration) and A1 (import dependency) measure different properties of external supply. A1 measures how much energy is imported, whereas S6 measures how evenly imports are spread across suppliers. A country can be highly import dependent yet well diversified, or only moderately dependent but reliant on a single supplier. The first is a question of autonomy, the second of security.
Empirically, however, the overlap is not negligible. In the pooled panel (270 country-year observations), the correlation between normalized S1 and D1 is 0.76, and A1 is correlated with D1 (0.52) and D2 (0.63), whereas its correlation with S6 is low (−0.20). Among the decarbonization indicators, the pairwise correlations range from −0.15 to 0.74, the highest being D1–D3; D2, D4, and D5 therefore do not repeat the same information. A principal component analysis of the 16 normalized indicators yields five components with eigenvalues above 1 (3.81, 2.72, 2.39, 1.58, 1.41), which together explain 74% of the variance, and an effective dimensionality (participation ratio) of 7.4. The indicator set thus does not collapse into a single latent factor, but S1 and D1 partly double-count the substitution of renewables for fossil fuels. The full correlation matrix is reported in Table A8.
The study assumes equal importance of the three components of the Composite Energy Transformation Index: energy security, decarbonization, and strategic energy autonomy. Accordingly, each sub-index is assigned an equal weighting coefficient of W = 1/3 ≈ 0.333 (33.3%). The application of equal weighting coefficients is based on the multidimensional structure of the proposed assessment framework, in which energy security, decarbonization, and strategic energy autonomy constitute three distinct and interrelated components of the EU’s new energy architecture. Each component reflects an essential aspect of energy transformation and performs a specific function in ensuring the sustainability, resilience, and long-term development of the energy system. Equal weights do not, however, ensure equal influence on the level of the index (Section 2); level statements are therefore based on the standardized composite. Because of the normalization and the rank shifts reported below (up to 13 positions under entropy weights), IET values are best read as ordinal bands rather than as cardinal scores. This approach provides a transparent, consistent, and reproducible basis for comparing energy transformation across EU Member States over the period 2015–2024. Equal weighting is, however, itself a normative choice [68]; its consequences for the rankings and for the cluster solution are tested below and in Section 7.
Thus, the proposed composite index reflects the multidimensional nature of energy transformation and incorporates the quantitative characteristics of its individual dimensions. The results of the Composite Energy Transformation Index are presented in Table 8.
Table 8.
Values of the Composite Energy Transformation Index for EU Countries, 2015–2024.
The change in the composite index between 2015 and 2024 is shown in Figure 2.
The overall dynamics of the Composite Energy Transformation Index (IET) across EU countries over the period 2015–2024 were positive. In all 27 countries included in the study, the index value in 2024 exceeded its 2015 level, indicating systematic progress in energy transformation across the EU. However, the pace of transformation varied substantially among countries.
In most countries, the index increased gradually, although short-term fluctuations were observed. A particularly noticeable acceleration occurred after 2019–2020 and, for some countries, during 2022–2024. This indicates an intensification of transformation processes in the European energy sector toward the end of the study period. At the same time, several countries experienced temporary declines in the index in individual years, demonstrating that energy transformation cannot be characterized as a uniform or linear process.
The largest absolute increases in the index between 2015 and 2024 were recorded in Estonia, from 0.308 to 0.442 (+0.134), Bulgaria, from 0.235 to 0.368 (+0.133), Poland, from 0.265 to 0.391 (+0.126), Denmark, from 0.487 to 0.607 (+0.120), and Lithuania, from 0.346 to 0.454 (+0.108). Thus, relatively rapid transformation was observed not only in countries with already strong initial positions, such as Denmark, but also in countries starting from comparatively lower index levels.
At the same time, countries with high initial values generally maintained their strong positions. Denmark and Sweden remained among the leaders throughout the study period, with index values of 0.607 and 0.533, respectively, in 2024. High values were also recorded in Romania (0.537), Italy (0.494), Latvia (0.486), and Finland (0.481). The smallest increases over the decade were observed in France (+0.017) and Croatia (+0.020), which can largely be attributed to their relatively higher initial positions. Between 2015 and 2024, the EU-27 mean of the Decarbonization Sub-Index increased by 0.129 (from 0.639 to 0.768), compared with 0.062 for strategic energy autonomy (from 0.200 to 0.262) and 0.037 for energy security (from 0.259 to 0.296). Decarbonization improved in all 27 countries, strategic energy autonomy in 25, and energy security in 22. Decarbonization was therefore the main driver of the composite index, and progress across the three dimensions was uneven.
Figure 2.
Change in the Composite Energy Transformation Index between 2015 and 2024 by country. Open circles—2015; filled markers—2024.
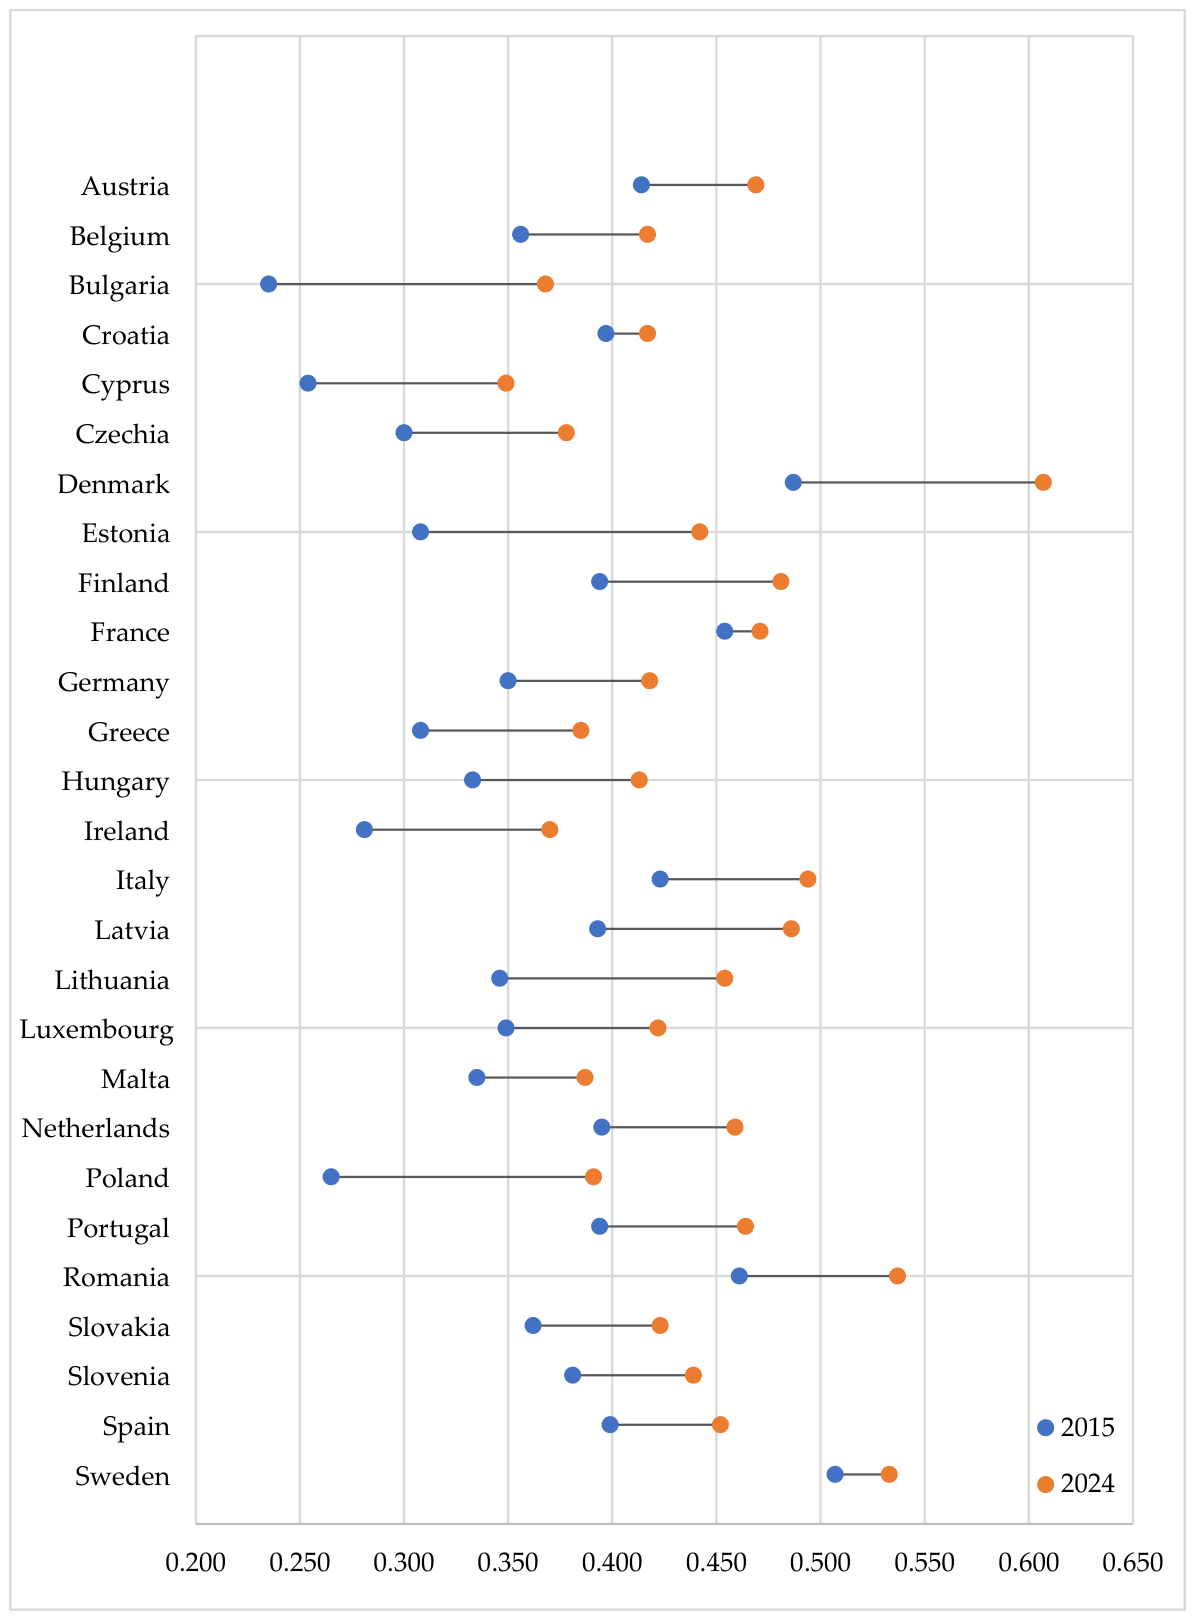
Germany deserves particular attention given its weight in the European energy system. Its composite index rose only from 0.350 to 0.418, placing it 17th in 2024. The three dimensions developed very differently. The Energy Security Sub-Index remained almost flat (0.257 in 2015 and 0.261 in 2024), reflecting the lack of significant domestic hydrocarbons. The temporary dip in 2021 and the recovery in 2022–2024 coincide with the rapid construction of LNG import capacity and the diversification of gas suppliers. The Decarbonization Sub-Index increased from 0.589 to 0.703, but remains below the EU average because coal still plays an important role in power generation and nuclear generation ended in April 2023. The Strategic Energy Autonomy Sub-Index rose from 0.203 to 0.292, with a sharp increase in 2023.
These results support H1a. Both the raw and the standardized composite index increased in all 27 countries between 2015 and 2024. When only observed data are used (2015–2022, without the forecast patent values), the raw composite increased in 26 countries; the exception is France (−0.005).
H1b is supported for energy security but only partly for strategic energy autonomy (Table A13). On the standardized scale, the mean increase in ID exceeded that in IS by 0.63 standard deviations (95% bootstrap CI 0.34 to 0.95; larger in 21 of 27 countries; Wilcoxon p < 0.001), but exceeded that in IA by only 0.14 (95% CI −0.13 to 0.41; 15 of 27 countries; p = 0.22). For 2015–2022, both differences are positive and significant (ID–IS: 0.33, CI 0.05 to 0.62; ID–IA: 0.25, CI 0.04 to 0.45). The full-period comparison with IA is therefore inconclusive, partly because the IA gains of 2023–2024 include forecast patent values. On the raw scale, both differences are larger and significant, but this partly reflects the different headroom of the three normalized scales.
Because IET is an arithmetic mean, it is fully compensatory: weak energy security can be offset by strong decarbonization. To express the balance that Section 8 treats as central, the composite is complemented by an imbalance measure, defined as the standard deviation of a country’s three standardized sub-indices in 2024 (lower values indicate a more balanced configuration). The most balanced countries are Belgium (0.28), Spain (0.35), and Latvia (0.41); the least balanced are Malta (1.19), Slovakia (1.04), and Denmark (1.02). Geometric aggregation, which penalizes imbalance, changes the ranking moderately (Kendall’s τ = 0.84; Table A9).
The sensitivity of the 2024 ranking to the weighting scheme was tested at two lev-els. At the level of the dimensions (Table A9), the composite index was recomputed with one dimension weighted at 0.50 and the other two at 0.25, with entropy weights, with weights derived from principal component analysis, with standardized sub-indices, and with geometric aggregation; in addition, 10,000 weight vectors were drawn at random from a uniform Dirichlet distribution [69]. Kendall’s τ relative to the baseline ranking ranges from 0.68 (entropy weights, which assign only 9% of the weight to decarbonization) to 0.96, with a median of 0.70 in the random draws. At the level of the indicators (Table A7), each of the 16 indicators was in turn excluded or given double weight, and D2–D5 were also combined into a single block with the same weight as D1. Kendall’s τ ranges from 0.79 to 0.97 across these 33 specifications. The rankings are therefore robust at the top and the bottom, while mid-table positions should be read as bands rather than exact ranks.
7. Cluster Analysis of EU Countries
To identify typical profiles of energy-system transformation across EU countries, a cluster analysis was conducted using the values of the three sub-indices for 2024: the Energy Security Sub-Index, the Decarbonization Sub-Index, and the Strategic Energy Autonomy Sub-Index. Using the sub-indices as clustering variables makes it possible to account not only for the overall level of energy transformation but also for the relative balance among its key dimensions.
The countries were grouped using Ward’s method with Euclidean distance [70]. Since all three sub-indices had already been normalized to a common dimensionless scale ranging from 0 to 1, the baseline solution uses the sub-index values directly. Because the sub-indices differ in variance, a solution based on z-scores is reported as a robustness check. Ward’s method sequentially merges countries into groups while minimizing the increase in within-cluster variance. The optimal number of clusters was determined by comparing the silhouette coefficients [71] of solutions with two to six clusters (Table A2). For the raw sub-indices, the three-cluster solution has the highest value (0.390, compared with 0.355 for two clusters and 0.322 for four). For z-scores, the values for two and three clusters are almost identical (0.384 and 0.378).
The baseline uses the raw sub-indices and three clusters for three reasons. First, Euclidean distance is not affected by differences in means, only by differences in spread, and the 2024 standard deviations of the sub-indices are similar (0.093 for IS, 0.103 for ID, and 0.077 for IA). The raw solution is therefore not dominated by the decarbonization axis, and the z-score specification yields exactly the same three clusters (ARI = 1.00). Second, under z-scores the silhouette coefficients for two and three clusters are virtually equal (0.384 and 0.378), so the data do not favor two clusters over three. Third, the two-cluster solution merges the asymmetric and the advanced integrated groups, whose decarbonization levels differ markedly (mean ID of 0.60 and 0.79), and is therefore substantively uninformative. A silhouette coefficient of 0.39 nevertheless indicates a weak structure, and the clusters should be read as typical profiles along a continuum rather than as sharply separated groups.
The results presented in Table A3 confirm the stability of the three-cluster solution across different clustering algorithms and data preprocessing methods. Ward’s method applied to z-scores, average linkage, and k-means produce exactly the same three clusters (adjusted Rand index, ARI = 1.00). K-means applied to z-scores moves only Italy from Cluster 3 to Cluster 2 (ARI = 0.97).
Countries were assigned to clusters according to the overall similarity of their IS, ID, and IA values, while the substantive interpretation of the resulting groups was based on the mean values of these sub-indices within each cluster. Across the full sample of 27 EU countries in 2024, the mean values were 0.296 for IS, 0.768 for ID, and 0.262 for IA.
For a visual representation of the results, EU countries were plotted in three pairwise projections of the Energy Security, Decarbonization, and Strategic Energy Autonomy Sub-Indices for 2024, which make the assignment of borderline countries visible. The spatial distribution of the countries and the resulting clusters are presented in Figure 3.
Figure 3.
Pairwise projections of the Energy Security (IS), Decarbonization (ID), and Strategic Energy Autonomy (IA) Sub-Indices of EU countries in 2024, by cluster; crosses mark the cluster centroids. Country codes (ISO 3166-1 alpha-2): AT Austria, BE Belgium, BG Bulgaria, HR Croatia, CY Cyprus, CZ Czechia, DK Denmark, EE Estonia, FI Finland, FR France, DE Germany, GR Greece, HU Hungary, IE Ireland, IT Italy, LV Latvia, LT Lithuania, LU Luxembourg, MT Malta, NL Netherlands, PL Poland, PT Portugal, RO Romania, SK Slovakia, SI Slovenia, ES Spain, SE Sweden.
The clustering results revealed three typical profiles of energy-system transformation across EU countries. The largest group, Cluster 1, includes Austria, Belgium, Bulgaria, Croatia, Czechia, Estonia, Finland, France, Germany, Hungary, Ireland, Latvia, Lithuania, Luxembourg, the Netherlands, Portugal, Slovakia, Slovenia, Spain, and Sweden. The average value of the Decarbonization Sub-Index in this group is ID = 0.798, exceeding the overall mean for the full sample. By contrast, the average level of energy security is lower (IS = 0.257), while the Strategic Energy Autonomy Sub-Index (IA = 0.262) is almost equal to the EU-wide average. This configuration allows the group to be classified as a decarbonization-oriented transformation profile, in which decarbonization is the most pronounced dimension of energy transformation. The group is, however, heterogeneous (ID ranges from 0.674 to 0.985; Table A10) and is held together mainly by its below-average IS and near-average IA rather than by uniformly high decarbonization; the label describes the group average, not every member.
Cluster 2 comprises Cyprus, Greece, Malta, and Poland. It is characterized by a relatively higher-than-average level of energy security (IS = 0.354), combined with the lowest values among the three clusters for decarbonization (ID = 0.603) and strategic energy autonomy (IA = 0.177). This structure indicates an unbalanced pattern of energy transformation, in which relatively stronger performance in the security dimension is not accompanied by comparable progress in decarbonization and strategic energy autonomy. Accordingly, this cluster can be characterized as an asymmetric transformation profile.
Cluster 3 includes Denmark, Italy, and Romania. This group records the highest average values of the Energy Security Sub-Index (IS = 0.477) and the Strategic Energy Autonomy Sub-Index (IA = 0.374), while the Decarbonization Sub-Index also remains high (ID = 0.787). The average value of the Composite Energy Transformation Index for the countries in this cluster in 2024 is 0.546, the highest among the three groups. This combination provides a basis for defining the cluster as an advanced integrated transformation profile, in the sense of the highest average level across the three dimensions. The label does not fit all three members equally: Italy’s ID (0.745) and IA (0.251) are both below the EU means (0.768 and 0.262), so Italy is a high-security, otherwise average case that enters the group mainly through its hydrocarbon reserves. On the standardized scale, the cluster is also not more balanced than the others: its mean imbalance (0.82) is similar to that of Cluster 2 (0.82) and higher than that of Cluster 1 (0.62). Its distinguishing feature is a high level of energy security, not balance.
A country’s assignment to a particular cluster is determined not by the absolute value of any single sub-index, but by the overall configuration of all three dimensions of energy transformation. For example, Sweden records the highest level of decarbonization in the sample (ID = 0.985); however, its energy security and strategic energy autonomy profile differs from that of the countries in Cluster 3, which explains its assignment to Cluster 1. By contrast, Denmark, Italy, and Romania form a separate group mainly because of their high energy security values, which rest largely on domestic oil and gas reserves.
Sweden and France belong to the decarbonization-oriented cluster although they rank first and third on decarbonization. The reason lies in the other two dimensions. Their 2024 values of the Energy Security Sub-Index (0.340 and 0.279) and of the Strategic Energy Autonomy Sub-Index (0.273 and 0.211) are close to or below the EU averages (0.296 and 0.262) and well below the means of Cluster 3 (0.477 and 0.374). Neither country has significant domestic oil or gas resources, so S2 and S3 contribute little to their energy security scores. In France, the strong decarbonization result rests on nuclear power, which lowers D1–D5 but does not raise the renewable share (S1). Thus, Sweden and France can be considered countries approaching the advanced integrated transformation profile represented by Cluster 3. Further progress in energy transformation, particularly in strengthening energy security and strategic energy autonomy while maintaining high decarbonization performance, could facilitate their transition to this cluster.
The stability and distinctiveness of the clusters were assessed directly. Within-cluster ranges are wide (Table A10): in Cluster 1, ID ranges from 0.674 to 0.985, so Sweden and Estonia share a cluster because their IS and IA values are similar, not their decarbonization levels. The mean bootstrap Jaccard coefficients, based on 1000 resamples of countries, are 0.76 for Cluster 1, 0.74 for Cluster 2, and 0.68 for Cluster 3. According to the usual interpretation [22], values between 0.6 and 0.75 indicate patterns in the data but not highly stable clusters. Kruskal–Wallis tests on the clustering variables themselves are reported in Table A10 for completeness, but because the clusters were formed on these variables, they cannot validate the partition. As an external check, the clusters were compared on two variables not used in the clustering: GDP per capita in purchasing power standards in 2024 [72] and population size. The clusters do not differ significantly in either variable (Kruskal–Wallis p = 0.80 and p = 0.33; Table A14). H2 is therefore only partly supported: the clusters are reasonably stable under resampling, but no external difference could be detected.
The cluster partition is less robust to the weighting scheme than the rankings. Under alternative dimension weights (Table A9), the partition is reproduced exactly with security-led, autonomy-led, PCA-based, and standardized specifications, but not with decarbonization-led weights (ARI = 0.27) or entropy weights (ARI = 0.86). Across the random weight draws, Denmark, Italy, and Romania remain in the same cluster in 85% of cases and form a cluster on their own in 41%. At the indicator level, the three countries form a separate cluster in 24 of the 33 specifications (Table A7).
The decisive indicators are S2 and S3 (Table A5 and Table A6). Winsorizing the R/P ratios at the 75th percentile of producing countries leaves the partition unchanged (ARI = 1.00), and capping them at 10 years adds only the Netherlands to Cluster 3 (ARI = 0.87). Excluding S2 and S3 from IS, however, dissolves the advanced integrated profile (ARI = 0.20). Denmark and Romania then join a group with Bulgaria, Czechia, Estonia, Germany, Hungary, Ireland, Luxembourg, the Netherlands, Poland, and Slovakia; Italy joins the decarbonization-oriented group; and Cyprus, Greece, and Malta remain an asymmetric group. The advanced integrated profile thus rests on domestic oil and gas availability. This does not invalidate it, since domestic resources are a legitimate component of security of supply, but the profile combines a resource endowment with good performance in the other dimensions, and its relevance will diminish as reserves are depleted. The two data-quality specifications point in the same direction (Table A1). Treating unreported reserves as missing (available-case IS) has the same effect as excluding S2 and S3 (ARI = 0.20), whereas holding reserves at their 2020 values keeps Denmark, Italy, and Romania together and moves the Netherlands and Poland to Cluster 2 (ARI = 0.87). The composite index increases in all 27 countries under every specification.
Finally, clustering the changes between 2015 and 2024 (ΔIS, ΔID, ΔIA) instead of the 2024 levels uses the panel dimension of the data (Table A11). It identifies three trajectories that are almost unrelated to the level profiles (ARI = 0.01): a decarbonization catch-up group (Bulgaria, Estonia, Luxembourg, Malta, the Netherlands, and Portugal; mean ΔID = 0.23 with no gain in security), a group that improved in both security and decarbonization (Czechia, Denmark, Finland, Greece, Lithuania, Poland, and Slovakia; mean ΔIS = 0.11 and ΔID = 0.13), and a group with moderate, balanced progress (the remaining 14 countries). Poland, for example, belongs to the asymmetric profile by level but is among the strongest improvers. Level profiles and trajectories therefore provide complementary information for policy.
The profiles are also not determined by the composite level: the agreement between the clusters and a grouping of countries into terciles of the composite index is low (ARI = 0.10). Sweden (IET = 0.533) and Romania (IET = 0.537), for example, have almost identical composite values but belong to different profiles. This supports H3.
To verify the robustness of the clustering results and demonstrate that the identified energy transformation profiles are not an artificial outcome of the extrapolation procedure applied to the A2 indicator, an additional clustering analysis was conducted using an alternative specification of the Strategic Energy Autonomy Sub-Index. The comparison revealed that all 27 EU Member States retained their original cluster assignments, while the silhouette coefficient decreased only slightly from 0.390 to 0.376. The detailed comparison is presented in Appendix A (Table A1). These findings confirm that the identified cluster structure remains unchanged under the alternative specification and is not driven by the extrapolated values of the A2 indicator.
Thus, the cluster analysis confirms the heterogeneity of the processes shaping the EU’s new energy architecture. EU countries exhibit different combinations of energy security, decarbonization, and strategic energy autonomy, three typical energy transformation profiles to be identified: decarbonization-oriented, asymmetric, and advanced integrated. This approach complements the results of the composite assessment by revealing structural differences among countries that are not fully captured by the Composite Energy Transformation Index (IET) alone. Given the weak separation and the absence of external differences, these profiles should be read as positions along a continuum rather than as sharply distinct types.
8. Discussion: Development of Management Priorities
Based on the results of the cluster analysis, differentiated management priorities were developed for the three types of energy transformation identified among EU countries (Table 9); each priority is linked to the indicator-level gaps that define the cluster (mean normalized values in 2024).
Table 9.
Management priorities for EU countries by energy transformation cluster.
For the countries in Cluster 1, management priorities should focus on strengthening energy security while preserving the level of decarbonization already achieved. The main directions should include diversification of energy supply sources and routes, development of cross-border energy interconnections, expansion of energy storage capacity, and deployment of other instruments that enhance energy-system flexibility. Another important task is to ensure sufficient reserve mechanisms capable of maintaining reliable energy supply as the share of variable renewable generation increases. These priorities follow from the structure of the low IS values in this cluster. Most of its members have no or negligible domestic oil and gas reserves, so S2 and S3 are close to zero. Their energy security can therefore improve only through renewables (S1) and diversification of sources, carriers, and suppliers (S4–S6). For this reason, interconnectors, storage, and the diversification of suppliers and routes matter more for this group than domestic resource availability.
For Cluster 2, the key challenge is to address the structural imbalance between relatively stronger energy security performance and lower levels of decarbonization and strategic energy autonomy. Priority areas include reducing dependence on fossil fuels, modernizing energy-intensive industries, expanding renewable and decentralized generation, improving energy efficiency, and stimulating investment in low-carbon technologies. Strengthening domestic technological and resource capacity should contribute simultaneously to reducing carbon intensity and enhancing strategic energy autonomy. The low ID of this cluster reflects a fossil-based power sector: coal in Poland, lignite in Greece (which is being phased out), and imported oil and gas in the island systems of Cyprus and Malta. Its low IA reflects the high import dependency of Cyprus and Malta (A1) and weak electricity interconnection (A3); Cyprus is not connected to the European electricity grid at all. The most targeted measures are therefore the phase-out of coal and oil in power generation and new interconnections.
For the countries in Cluster 3, the priority is to maintain the high level of transformation achieved while reducing its dependence on domestic hydrocarbons. Management decisions should focus on scaling up technological innovation, developing smart grids and energy storage systems, expanding demand-side management, advancing electrification, and strengthening sector integration. Countries in this cluster may also serve as testing grounds for new energy policy instruments and as reference cases for disseminating effective transformation practices across other EU Member States. At the same time, the high IS values of this cluster partly rest on domestic oil and gas resources (S2, S3), which are declining. Denmark, for example, has decided to end oil and gas extraction in the North Sea by 2050. Maintaining the balance will therefore require replacing this resource-based security with system flexibility, storage, and interconnection.
Thus, the clustering results support the need for a differentiated approach to managing energy transformation across EU countries. For the decarbonization-oriented group, the primary task is to strengthen energy security; for countries with an asymmetric profile, priorities should focus on accelerating decarbonization and increasing strategic energy autonomy; while for the advanced integrated group, the emphasis should be placed on replacing resource-based security with system flexibility and progressing toward more technologically advanced forms of energy transformation.
The three dimensions also interact in ways that require trade-offs. Diversification is a key component of energy security, but it has costs. Each additional supplier, fuel, or technology requires its own infrastructure, contracts, and technical standards, and different energy sources are not always interoperable. LNG terminals, hydrogen-ready pipelines, and grids that accommodate variable renewables all require investment. Diversification that is pursued too broadly can therefore raise system costs and, if it relies on imported technologies, reduce rather than increase autonomy. Decarbonization raises similar interoperability challenges. A system dominated by variable renewables needs flexibility, storage, and grid-forming capacity that conventional systems provided implicitly. An overly rapid or poorly sequenced decarbonization, for example closing dispatchable plants before replacement capacity, storage, and interconnectors are in place, can weaken both the availability and the diversification components of energy security.
Uneven development carries long-term risks. Decarbonization without parallel progress in security can leave systems exposed to price shocks and adequacy problems during periods of low renewable output. Decarbonization without autonomy may simply replace dependence on imported fossil fuels with dependence on imported technologies and critical raw materials. Conversely, security based on domestic fossil resources without decarbonization risks carbon lock-in and stranded assets as carbon prices rise. Balanced progress across the three dimensions is therefore not only desirable in itself but also a condition for the resilience of the transformation.
Because each cluster is defined by its indicator gaps, priorities derived only from those gaps risk circularity. The national energy and climate plans (NECPs) provide an independent check [73]. Several measures already planned address precisely the gaps identified in Table 9. The Great Sea Interconnector, a Project of Common Interest, would connect Cyprus to the European grid and address its A3 gap; Malta’s second electricity interconnector with Italy addresses the same weakness. Poland’s plans for offshore wind in the Baltic Sea and for its first nuclear power plant address the coal dependence behind its low ID. Denmark’s decision to end oil and gas extraction in the North Sea by 2050 confirms that the resource-based part of its energy security is temporary. These commitments show that the gaps are recognized in national policy; the framework adds a common metric with which the effect of such measures can be monitored. The policy context has also moved on since REPowerEU (2022) [3], which is now the starting point rather than the current reference of this shift. The Clean Industrial Deal of 2025 links decarbonization explicitly with industrial competitiveness and with the security of supply of clean technologies [74], and the Commission’s 2025 proposal to amend the European Climate Law sets a 2040 target of a 90% net reduction in greenhouse gas emissions relative to 1990 [75]. Both increase the weight of the autonomy pillar and of the trade-offs between the three dimensions discussed above.
9. Conclusions
This study substantiates a comprehensive approach to assessing the transformation of the energy sector across European Union countries in the context of the emerging new energy architecture. Unlike approaches focused on individual areas of energy policy, the proposed framework simultaneously incorporates three interrelated dimensions: energy security, decarbonization, and strategic energy autonomy. This makes it possible to conceptualize energy transformation as a multidimensional process whose effectiveness depends not only on progress within individual dimensions but also on the balance among them.
For the quantitative assessment, a system of indicators was developed, normalized, and aggregated into the Energy Security Sub-Index, Decarbonization Sub-Index, and Strategic Energy Autonomy Sub-Index. These sub-indices were subsequently combined to construct the Composite Energy Transformation Index, providing an overall assessment of the transformation level of national energy systems across the EU.
The results for 2015–2024 indicate an overall positive trajectory of energy transformation. In all 27 EU countries, the Composite Energy Transformation Index in 2024 exceeded its 2015 level. On a standardized scale, decarbonization advanced faster than energy security, while the difference relative to strategic energy autonomy is inconclusive for the full period. At the same time, substantial cross-country differences were identified in the pace of transformation. In most countries, the index increased gradually, while a more pronounced acceleration was observed mainly after 2019–2020 and, for some countries, during 2022–2024. Denmark and Sweden maintained leading positions, reaching index values of 0.607 and 0.533, respectively, in 2024; relatively high values were also recorded for Romania, Italy, Latvia, and Finland.
The cluster analysis based on the three sub-indices for 2024 confirmed the structural heterogeneity of energy transformation across EU countries. The application of Ward’s method identified three typical transformation profiles: decarbonization-oriented, asymmetric, and advanced integrated. The group comprising Denmark, Italy, and Romania shows the highest average level across the three dimensions (mean composite index of 0.546 in 2024), but this result rests largely on domestic oil and gas reserves: the group disappears when the reserve-to-production indicators are excluded, and on a standardized scale it is not more balanced than the other groups.
The findings demonstrate that a high level of performance in any single dimension is not sufficient to ensure balanced energy transformation. A country’s transformation profile is determined by the configuration of all three dimensions. Sweden, for example, records the highest Decarbonization Sub-Index in the sample, yet differences in energy security and strategic energy autonomy place it within the decarbonization-oriented rather than the advanced integrated profile. This confirms the value of combining composite and cluster analysis: the former captures the overall level of transformation, whereas the latter reveals internal structural imbalances that may remain obscured by the composite index alone.
The practical significance of the proposed approach lies in its potential to support the differentiation of energy policy priorities according to countries’ transformation profiles. For countries with a decarbonization-oriented profile, priority should be given to strengthening energy security and energy-system resilience. For countries with an asymmetric profile, the main task is to reduce imbalances among energy security, decarbonization, and strategic energy autonomy. For countries with an advanced integrated profile, the emphasis should be placed replacing resource-based security with system flexibility as domestic reserves decline. Such differentiation provides a basis for moving away from a uniform policy approach toward more targeted management decisions in the further development of the EU’s new energy architecture.
The study has several limitations. First, part of the data is estimated: proved reserves for 2021–2024 were rolled forward from production data, and patent counts for 2023–2024 were extrapolated. The robustness checks show that the main cluster results do not depend on these estimates (Table A1). Second, equal weights were used at both aggregation levels. Sensitivity analyses at the level of the dimensions and of the individual indicators (Table A7 and Table A9) show that the rankings are robust, whereas the cluster partition is sensitive to the weighting and, in particular, to the inclusion of the reserve-to-production indicators, which act as a near-binary measure of hydrocarbon endowment. Third, the diversity indicators measure how evenly supply is spread, not the scale or physical redundancy of the system, which may overstate the energy security of small, isolated systems such as Malta. Fourth, the resource dimension of autonomy is represented only by overall import dependency, because comparable time series on critical raw materials and domestic manufacturing of clean-energy technologies are not yet available for all Member States. As a result, the autonomy pillar measures structural capacity and reduced external exposure rather than strategic autonomy in the full sense. Fifth, some 2024 values, such as the Eurostat diversity indices for Cyprus, may be revised. Sixth, the cluster solution could be compared with only two external variables (GDP per capita and population), neither of which differs between clusters. Seventh, A5 captures decentralized electricity generation, including captive industrial generation and fossil-fuelled combined heat and power. Therefore, it should be interpreted as an indicator of generation decentralization rather than as a direct measure of low-carbon energy supply.
Future research will focus on improving the methodological framework by developing expert-based weighting schemes; replacing the reserve-to-production indicators with measures of resource availability that do not penalize countries without domestic hydrocarbons; refining the assessment of energy security by incorporating indicators of infrastructure resilience and system redundancy; and expanding the strategic energy autonomy dimension to include critical raw material dependencies and domestic clean-energy technology manufacturing capacities as comparable data become available.
Author Contributions
Conceptualization, I.Z. and N.I.; methodology, I.Z. and A.I.; validation, N.I.; formal analysis, I.Z., N.K. and O.R.; investigation, I.Z., N.K. and O.R.; resources, A.I. and N.I.; data curation, A.I.; writing—original draft preparation, I.Z. and A.I.; writing—review and editing, N.K. and A.I.; visualization, N.K. and O.R.; supervision, I.Z. and N.I.; project administration, A.I.; funding acquisition, N.I. All authors have read and agreed to the published version of the manuscript.
Funding
This research was funded by AGH University of Krakow (subsidy and project IDUB).
Data Availability Statement
The data presented in this study are openly available from the sources listed in the References. Additional data and supporting results are presented in Appendix A (Table A2, Table A3, Table A4, Table A6, Table A7, Table A8, Table A9, Table A10, Table A11, Table A12, Table A13 and Table A14), including normalization bounds for the 16 indicators (Table A4), correlation analysis (Table A8), and assessments of clustering robustness under alternative algorithms, data specifications, and preprocessing methods (Table A2, Table A3, Table A5 and Table A6). The appendices also provide indicator- and dimension-level sensitivity analyses (Table A7 and Table A9), cluster stability tests (Table A10), and an assessment of energy transformation trajectories over 2015–2024 (Table A11). Furthermore, alternative treatments of estimated reserve and patent data (Table A12), statistical tests of hypothesis H1 (Table A13), and external validation of cluster profiles (Table A14) are presented. These materials enhance the transparency and reproducibility of the proposed methodology.
Conflicts of Interest
The authors declare no conflicts of interest.
Appendix A
Table A1.
Comparison of EU Member States’ clustering results for 2024 with and without extrapolated A2 values.
Table A2.
Silhouette coefficients of Ward’s solutions for 2024.
Table A3.
Three-cluster classification using different clustering algorithms.
Table A4.
Normalization bounds (minimum and maximum over the panel of 27 countries × 2015–2024).
Table A5.
Contribution of Reserve-to-Production Indicators (S2 and S3) to the Energy Security Sub-Index in 2024.
Table A6.
Robustness of Energy Security Assessment under Alternative Specifications of Reserve-to-Production Indicators.
Table A7.
Indicator-level sensitivity: each indicator excluded or given double weight (2024).
Table A8.
Pearson correlation matrix of the 16 normalized indicators (pooled panel, n = 270).
Table A9.
Sensitivity to the weights of the three dimensions (2024).
Table A10.
Within-cluster ranges, bootstrap stability, and Kruskal–Wallis tests (2024).
Table A11.
Clustering of the changes in the sub-indices between 2015 and 2024 (Ward’s method, three clusters).
Table A12.
Alternative treatments of reserve and patent data (2024 cluster solution).
Table A13.
Tests of hypothesis H1: changes in the composite index and the sub-indices.
Table A14.
External validation of the 2024 clusters and imbalance of the transformation profile.
References
- Welsch, M. (Ed.) Europe’s Energy Transition: Insights for Policy Making; Elsevier: Amsterdam, The Netherlands, 2017. [Google Scholar] [CrossRef] [Scilit]
- Barani, M.; Löffler, K.; del Granado, P.C.; Moskalenko, N.; Panos, E.; Hoffart, F.M.; von Hirschhausen, C.; Kannavou, M.; Auer, H.; Hainsch, K.; et al. European energy vision 2050 and beyond: Designing scenarios for Europe’s energy transition. Renew. Sustain. Energy Rev. 2025, 225, 116074. [Google Scholar] [CrossRef] [Scilit]
- European Commission. REPowerEU Plan. Communication from the Commission to the European Parliament, the European Council, the Council, the European Economic and Social Committee and the Committee of the Regions.COM(2022) 230 final. Brussels. 18 May 2022. Available online: https://eur-lex.europa.eu/legal-content/EN/TXT/?uri=CELEX:52022DC0230 (accessed on 6 August 2026).
- Plagnol, V. The 2026 Oil Crisis: An Opportunity for Europe’s Energy Transition. 21 April 2026. Fondation Robert Schuman. The Research and Studies Centre of Europe. Available online: https://www.robert-schuman.eu/en/european-issues/831-the-2026-oil-crisis-an-opportunity-for-europe-s-energy-transition (accessed on 3 August 2026).
- Publications Office of the European Union. Critical Raw Materials for the Energy Transition: Not a Rock-Solid Policy: Special Report 04/2026/ European Court of Auditors; Publications Office of the European Union: Luxembourg, 2026; Available online: https://www.eca.europa.eu/en/publications/SR-2026-04 (accessed on 4 August 2026).
- Hoogervorst, K. Europe’s Emerging Energy Architecture. Altair Media Europe. 18 July 2026. Available online: https://altairmedia.eu/europes-emerging-energy-architecture/ (accessed on 4 August 2026).
- Bruce-Lockhart, A. What is ‘Energy Architecture’? World Economic Forum. 2 March 2016. Available online: https://www.weforum.org/stories/2016/03/what-is-energy-architecture/ (accessed on 4 August 2026).
- World Economic Forum. Global Energy Architecture Performance Index Report 2017; World Economic Forum: Geneva, Switzerland; Available online: https://www3.weforum.org/docs/WEF_Energy_Architecture_Performance_Index_2017.pdf (accessed on 4 August 2026).
- Taft, J.D.; Becker-Dippmann, A. Grid Architecture; Report PNNL-24044; Pacific Northwest National Laboratory: Richland, WA, USA, 2015. Available online: https://www.pnnl.gov/main/publications/external/technical_reports/PNNL-24044.pdf (accessed on 22 October 2026).
- Geels, F.W. Technological Transitions as Evolutionary Reconfiguration Processes: A Multi-Level Perspective and a Case-Study. Res. Policy 2002, 31, 1257–1274. [Google Scholar] [CrossRef] [Scilit]
- World Economic Forum. Global Energy Architecture Performance Index Report 2016; World Economic Forum: Geneva, Switzerland, 2016; Available online: https://www3.weforum.org/docs/WEF_Energy_Architecture_Performance_Index_2016.pdf (accessed on 4 August 2026).
- World Energy Council. World Energy Trilemma 2024: Evolving with Resilience and Justice; World Energy Council: London, UK, 2024; Available online: https://www.worldenergy.org/publications/entry/world-energy-trilemma-report-2024 (accessed on 13 October 2026).
- World Economic Forum. Fostering Effective Energy Transition 2025; World Economic Forum: Geneva, Switzerland, 2025; Available online: https://www.weforum.org/publications/fostering-effective-energy-transition-2025/ (accessed on 13 October 2026).
- Tutak, M.; Brodny, J.; Bindzár, P. Assessing the Level of Energy and Climate Sustainability in the European Union Countries in the Context of the European Green Deal Strategy and Agenda 2030. Energies 2021, 14, 1767. [Google Scholar] [CrossRef] [Scilit]
- Brodny, J.; Tutak, M.; Grebski, W.W. Empirical Evaluation of the Energy Transition Efficiency in the EU-27 Countries over a Decade—A Non-Obvious Perspective. Energies 2025, 18, 3367. [Google Scholar] [CrossRef] [Scilit]
- De Rosa, M.; Gainsford, K.; Pallonetto, F.; Finn, D.P. Diversification, concentration and renewability of the energy supply in the European Union. Energy 2022, 253, 124097. [Google Scholar] [CrossRef] [Scilit]
- Müller, M.O.; Stämpfli, A.; Dold, U.; Hammer, T. Energy Autarky: A Conceptual Framework for Sustainable Regional Development. Energy Policy 2011, 39, 5800–5810. [Google Scholar] [CrossRef] [Scilit]
- Rae, C.; Bradley, F. Energy Autonomy in Sustainable Communities—A Review of Key Issues. Renew. Sustain. Energy Rev. 2012, 16, 6497–6506. [Google Scholar] [CrossRef] [Scilit]
- Juntunen, J.K.; Martiskainen, M. Improving Understanding of Energy Autonomy: A Systematic Review. Renew. Sustain. Energy Rev. 2021, 141, 110797. [Google Scholar] [CrossRef] [Scilit]
- Kruyt, B.; van Vuuren, D.; de Vries, H.; Groenenberg, H. Indicators for energy security. Energy Policy 2009, 37, 2166–2181. [Google Scholar] [CrossRef] [Scilit]
- Hubert, L.; Arabie, P. Comparing Partitions. J. Classif. 1985, 2, 193–218. [Google Scholar] [CrossRef] [Scilit]
- Hennig, C. Cluster-Wise Assessment of Cluster Stability. Comput. Stat. Data Anal. 2007, 52, 258–271. [Google Scholar] [CrossRef] [Scilit]
- Kruskal, W.H.; Wallis, W.A. Use of Ranks in One-Criterion Variance Analysis. J. Am. Stat. Assoc. 1952, 47, 583–621. [Google Scholar] [CrossRef]
- Azzuni, A.; Breyer, C. Global Energy Security Index and Its Application on National Level. Energies 2020, 13, 2502. [Google Scholar] [CrossRef] [Scilit]
- Schmitz, R.; Flachsbarth, F.; Plaga, L.S.; Braun, M.; Härtel, P. Energy security and resilience: Revisiting concepts and advancing planning perspectives for transforming integrated energy systems. Energy Policy 2025, 207, 114796. [Google Scholar] [CrossRef] [Scilit]
- Iwaszczuk, N.; Zapukhliak, I.; Iwaszczuk, A.; Dzoba, O.; Romashko, O. Underground Gas Storage Facilities in Ukraine: Current State and Future Prospects. Energies 2022, 15, 6604. [Google Scholar] [CrossRef] [Scilit]
- Zelinska, H.; Fedorovych, I.; Andrusiv, U.; Chernova, O.; Kupalova, H. Modeling and Prediction of the Gas Pipelines Reliability Indicators in the Context of Energy Security of Ukraine. In CEUR Workshop Proceedings; Academy of Cognitive and Natural Sciences: Kryvyi Rih, Ukraine, 2020; Volume 2713, pp. 415–433. Available online: https://ceur-ws.org/Vol-2713/paper46.pdf (accessed on 18 October 2026).
- Share of Energy Consumption from Renewable Sources in Europe. European Environment Agency. 23 April 2026. Available online: https://www.eea.europa.eu/en/analysis/indicators/share-of-energy-consumption-from (accessed on 6 August 2026).
- Directive (EU) 2018/2001 of the European Parliament and of the Council of 11 December 2018 on the Promotion of the Use of Energy from Renewable Sources (Recast), as Amended by Directive (EU) 2023/2413 of 18 October 2023. Official Journal of the European Union, L 328, 21 December 2018. pp. 82–209. Available online: https://eur-lex.europa.eu/eli/dir/2018/2001/oj (accessed on 10 August 2026).
- Energy Institute. Statistical Review of World Energy 2024. Available online: https://www.energyinst.org/statistical-review (accessed on 10 August 2026).
- Beyond Fossil Fuels. Europe’s Coal Exit: Country Phase-Out Dates & Status. Available online: https://beyondfossilfuels.org/europes-coal-exit/ (accessed on 12 August 2026).
- Oei, P.-Y.; Brauers, H.; Herpich, P. Lessons from Germany’s hard coal mining phase-out: Policies and transition from 1950 to 2018. Clim. Policy 2020, 20, 963–979. [Google Scholar] [CrossRef] [Scilit]
- Eurostat. Diversity Index of Energy Supply. Available online: https://ec.europa.eu/eurostat/databrowser/view/nrg_ind_di/default/table (accessed on 19 August 2026).
- Eurostat. Energy Statistics Database (nrg_ind). European Commission. Available online: https://ec.europa.eu/eurostat/web/energy/database (accessed on 15 August 2026).
- Dzoba, O.; Marynchak, L.; Romashko, O. A new approach to the assessment of effective management of gas supply diversification. Balt. J. Econ. Stud. 2017, 3, 24–30. [Google Scholar] [CrossRef] [Scilit][Green Version]
- Eurostat. Share of Renewable Energy in Gross Final Energy Consumption. Available online: https://ec.europa.eu/eurostat/databrowser/view/nrg_ind_ren/default/table (accessed on 16 August 2026).
- Eurostat. Diversity Index of Final Energy Consumption by Sector. Available online: https://ec.europa.eu/eurostat/databrowser/view/nrg_ind_difec/default/table (accessed on 18 August 2026).
- Eurostat. Energy Import Origin Concentration Index by Fuel. Available online: https://ec.europa.eu/eurostat/databrowser/view/nrg_ind_ioc/default/table (accessed on 18 August 2026).
- Šimić, G.; Radovanović, M.; Filipović, S. Assessment of the decarbonization efficiency in the European Union: Machine learning approach. Energy Sustain. Soc. 2025, 15, 52. [Google Scholar] [CrossRef] [Scilit]
- Scarlat, N.; Prussi, M.; Padella, M. Quantification of the Carbon Intensity of Electricity Produced and Used in Europe. Appl. Energy 2022, 305, 117901. [Google Scholar] [CrossRef] [Scilit]
- Horobet, A.; Tudor, C.D.; Belascu, L.; Dumitrescu, D.G. The Role of Distinct Electricity Sources on Pollution Abatement: Evidence from a Wide Global Panel. Front. Environ. Sci. 2022, 10, 996515. [Google Scholar] [CrossRef] [Scilit]
- Iwaszczuk, A.; Zapukhliak, I.; Iwaszczuk, N.; Dzoba, O.; Romashko, O.; Krykhivska, N. Prospects for the Development of Photovoltaics in Ukraine. Eur. Res. Stud. J. 2023, 26, 308–338. [Google Scholar] [CrossRef] [Scilit]
- Gajdzik, B.; Nagaj, R.; Wolniak, R.; Grebski, W.-W. Mechanisms Shaping Greenhouse Gas Emission Intensity Through the Integration of Power Generation Availability Indicators and Energy Intensity Measures: Case Study of Poland. Energies 2026, 19, 1378. [Google Scholar] [CrossRef] [Scilit]
- Lifecycle Carbon Intensity of Electricity. Our World in Data (Based on Ember and Energy Institute data). Available online: https://ourworldindata.org/grapher/carbon-intensity-electricity (accessed on 22 August 2026).
- Eurostat. Share of Fossil Fuels in Gross Available Energy. Available online: https://ec.europa.eu/eurostat/databrowser/view/nrg_ind_ffgae/default/table?lang=en (accessed on 19 August 2026).
- Eurostat. Greenhouse Gas Emissions by Source Sector. Available online: https://ec.europa.eu/eurostat/databrowser/view/env_air_gge/default/table?lang=en (accessed on 19 August 2026).
- Eurostat. Simplified Energy Balances. Available online: https://ec.europa.eu/eurostat/databrowser/view/nrg_bal_s/default/table?lang=en (accessed on 19 August 2026).
- Eurostat. Air Emissions Intensities by NACE Rev. 2 Activity. Available online: https://ec.europa.eu/eurostat/databrowser/view/env_ac_aeint_r2/default/table?lang=en (accessed on 22 August 2026).
- Eurostat. Domestic Net Greenhouse Gas Emissions. Available online: https://ec.europa.eu/eurostat/databrowser/view/sdg_13_10__custom_22148115/default/table (accessed on 21 August 2026).
- Hancher, L.; de Hauteclocque, A. EU Strategic Energy Autonomy and the Electrification Strategy, 2025. RSC 2025/51 Robert Schuman Centre for Advanced Studies Florence School of Regulation. Available online: https://cadmus.eui.eu/entities/publication/e511346e-e68d-481c-8397-5e65f9ad17d9 (accessed on 8 August 2026).
- European Parliament, Monitoring the Supply of Critical Raw Materials in the EU, 2026. Available online: https://www.europarl.europa.eu/RegData/etudes/BRIE/2026/785676/EPRS_BRI(2026)785676_EN.pdf (accessed on 19 August 2026).
- Consolidated Text: Regulation (EU) 2024/1252 of the European Parliament and of the Council of 11 April 2024 Establishing a Framework for Ensuring a Secure and Sustainable Supply of Critical Raw Materials and Amending Regulations (EU) No 168/2013, (EU) 2018/858, (EU) 2018/1724 and (EU) 2019/1020 (Text with EEA Relevance). Available online: https://eur-lex.europa.eu/eli/reg/2024/1252/oj (accessed on 19 August 2026).
- European Commission, RMIS—Raw Materials Information System. Available online: https://rmis.jrc.ec.europa.eu/critical-and-strategic-materials (accessed on 19 August 2026).
- Eurostat. Energy Imports Dependency. Euro SDMX Metadata Structure (ESMS). Available online: https://ec.europa.eu/eurostat/cache/metadata/en/nrg_ind_id_esmsip2.htm (accessed on 8 August 2026).
- Cooperative Patent Classification. Available online: https://www.cooperativepatentclassification.org/cpcSchemeAndDefinitions/table (accessed on 19 August 2026).
- OECD Data Explorer. Available online: https://data-explorer.oecd.org/vis?bp=true&df[ds]=dsDisseminateFinalDMZ&df[id]=DSD_PATENTS%40DF_PATENTS_ENVIROMENT&df[ag]=OECD.STI.PIE&df[vs]=1.0&dq=.A..PATN.PRIORITY...INVENTOR...ENE&lc=en&pd=2015,2023&to[TIME_PERIOD]=false&vw=tb (accessed on 15 July 2026).
- REGULATION (EU) 2018/1999 OF THE EUROPEAN PARLIAMENT AND OF THE COUNCIL. Available online: https://eur-lex.europa.eu/eli/reg/2018/1999/oj/eng (accessed on 20 November 2023).
- European Commission. Electricity Interconnection Targets. Directorate-General for Energy. Available online: https://energy.ec.europa.eu/topics/infrastructure/electricity-interconnection-targets_en (accessed on 19 August 2026).
- ENTSOE, Connecting Europe, Electrifying the Future, Summer Outlook 2026, Winter Outlook 2025-2026 Review. Available online: https://www.entsoe.eu/outlooks/seasonal/ (accessed on 29 July 2026).
- Electricity Production Capacities by Main Fuel Groups and Operator. Available online: https://ec.europa.eu/eurostat/databrowser/view/NRG_INF_EPC__custom_5967261/default/table?lang=en (accessed on 19 August 2026).
- Eurostat. Energy Productivity. Available online: https://ec.europa.eu/eurostat/databrowser/view/sdg_07_30/default/table?lang=en (accessed on 19 August 2026).
- Eurostat. Glossary: Gross Available Energy. Statistics Explained. European Commission. Available online: https://ec.europa.eu/eurostat/statistics-explained/SEPDF/cache/104631.pdf (accessed on 19 August 2026).
- Energy Productivity. Available online: https://data.europa.eu/data/datasets/xwit1fbpf5q1zcvlqc2upg?locale=en (accessed on 19 August 2026).
- Regulation (EU) 2024/1735 of the European Parliament and of the Council of 13 June 2024 on Establishing a Framework of Measures for Strengthening Europe’s Net-Zero Technology Manufacturing Ecosystem and Amending Regulation (EU) 2018/1724. Official Journal of the European Union, L 2024/1735, 28 June 2024. Available online: https://ec.europa.eu/eurostat/databrowser/view/nrg_inf_epc/default/table?lang=en (accessed on 20 August 2026).
- Regulation (EU) 2024/1252 of the European Parliament and of the Council of 11 April 2024 establishing a framework for ensuring a secure and sustainable supply of critical raw materials and amending Regulations (EU) No 168/2013, (EU) 2018/858, (EU) 2018/1724 and (EU) 2019/1020. Official Journal of the European Union, L 2024/1252, 3 May 2024. Available online: https://eur-lex.europa.eu/eli/reg/2024/1735/oj/eng (accessed on 19 August 2026).
- European Commission. A Green Deal Industrial Plan for the Net-Zero Age. Communication from the Commission. COM(2023) 62 Final. Brussels, 1 February 2023. Available online: https://eur-lex.europa.eu/eli/reg/2024/1252/oj/eng (accessed on 20 August 2026).
- Production of Electricity and Heat by Autoproducers and Type of Plant. Available online: https://ec.europa.eu/eurostat/databrowser/view/nrg_ind_pehap/default/table?lang=en (accessed on 19 August 2026).
- OECD; European Commission Joint Research Centre. Handbook on Constructing Composite Indicators: Methodology and User Guide; OECD Publishing: Paris, France, 2008. [Google Scholar] [CrossRef] [Scilit]
- Saisana, M.; Saltelli, A.; Tarantola, S. Uncertainty and Sensitivity Analysis Techniques as Tools for the Quality Assessment of Composite Indicators. J. R. Stat. Soc. Ser. A Stat. Soc. 2005, 168, 307–323. [Google Scholar] [CrossRef] [Scilit]
- Randriamihamison, N.; Vialaneix, N.; Neuvial, P. Applicability and Interpretability of Ward’s Hierarchical Agglomerative Clustering With or Without Contiguity Constraints. J. Classif. 2021, 38, 363–389. [Google Scholar] [CrossRef] [Scilit]
- Rousseeuw, P.J. Silhouettes: A Graphical Aid to the Interpretation and Validation of Cluster Analysis. J. Comput. Appl. Math. 1987, 20, 53–65. [Google Scholar] [CrossRef] [Scilit]
- Eurostat. GDP per Capita in PPS (tec00114), 2024 Data, as Published in: Croatian Bureau of Statistics. Gross Domestic Product and Actual Individual Consumption in Purchasing Power Standard, 2024. First Release 2025. Available online: https://ec.europa.eu/eurostat/databrowser/view/tec00114/default/table?lang=en (accessed on 22 October 2026).
- European Commission. National Energy and Climate Plans. Available online: https://commission.europa.eu/energy-climate-change-environment/implementation-eu-countries/energy-and-climate-governance-and-reporting/national-energy-and-climate-plans_en (accessed on 22 October 2026).
- European Commission. The Clean Industrial Deal: A Joint Roadmap for Competitiveness and Decarbonisation. COM(2025) 85 Final. Brussels, 26 February 2025. Available online: https://eur-lex.europa.eu/legal-content/EN/TXT/?uri=celex:52025DC0085 (accessed on 25 August 2026).
- European Commission. Proposal for a Regulation of the European Parliament and of the Council Amending Regulation (EU) 2021/1119 for Establishing the Framework for Achieving Climate Neutrality. COM(2025) 524 Final. Brussels, 2 July 2025. Available online: https://eur-lex.europa.eu/legal-content/EN/TXT/?uri=celex:52025PC0524 (accessed on 25 August 2026).
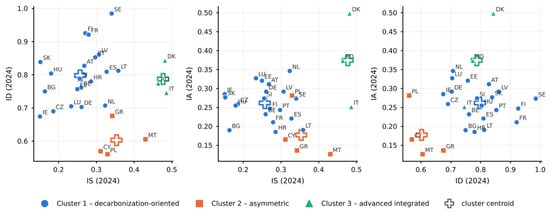
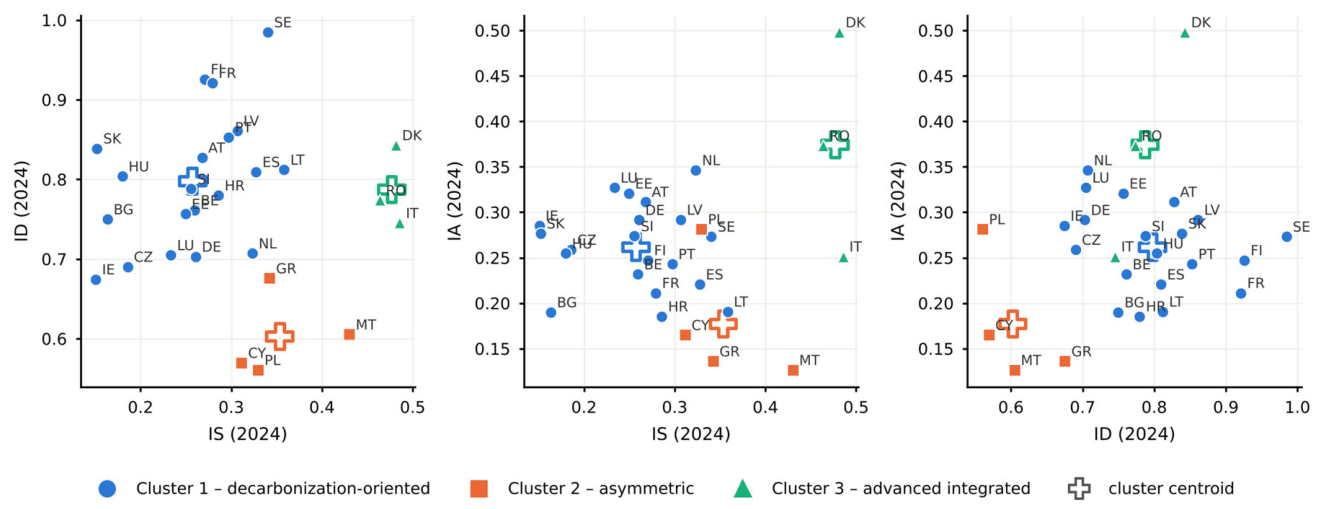

Disclaimer/Publisher’s Note: The statements, opinions and data contained in all publications are solely those of the individual author(s) and contributor(s) and not of MDPI and/or the editor(s). MDPI and/or the editor(s) disclaim responsibility for any injury to people or property resulting from any ideas, methods, instructions or products referred to in the content. |
© 2026 by the authors. Licensee MDPI, Basel, Switzerland. This article is an open access article distributed under the terms and conditions of the Creative Commons Attribution (CC BY) license.