


Abstract
Concentrated solar photovoltaic (PV) sourcing poses challenges for supply security during energy transition. This study examines supplier-country policy conditions, bounded portfolio reallocation, and observed sourcing adjustment within importer-specific trade portfolios. Using PV-related CEPII BACI data for 2017–2024, we analyze 197 importing geographic units, with baseline portfolios constructed from 2017–2019 trade and policy conditions mapped for 2020–2021. Mapped exposure is strongly correlated with China’s supplier share (Spearman = 0.946). Under a 10-percentage-point reallocation budget, 194 portfolios complete the accounting shift without recipient absorption limits. Contribution-ranked reallocation produces a median exposure reduction of 0.034, compared with 0.038 under exposure-minimizing linear programming, but achieves a larger reduction in supplier concentration (0.099 vs. 0.076). Historical absorption bounds substantially restrict reallocation among 76 evaluable portfolios. Mapped exposure is weakly negatively correlated with nominal import value growth ( = −0.164; N = 193), but the association is not statistically significant in composition-adjusted regressions. Higher-exposure portfolios also exhibit lower sequential supplier-share reconfiguration across the pre-, focal, and post-periods, although the conditional associations weaken after accounting for China’s supplier share. These findings reveal important differences among measured exposure, portfolio diversification, and observed sourcing adjustment.
1. Introduction
Solar photovoltaic (PV) capacity approached 3 TW worldwide at the end of 2025 [1]. The continued expansion of PV deployment depends on internationally integrated manufacturing and trade networks, with production concentrated across several key supply chain stages [2,3,4]. China’s manufacturing scale has played an important role in the development and diffusion of low-carbon technologies [5], while global PV production networks have contributed to cost reductions and technological progress [6,7,8]. Although these arrangements support economies of scale and international specialization, concentrated sourcing also creates dependence on a limited number of supplier countries. Changes in the conditions facing these suppliers may therefore affect the sourcing options available to importing economies. Understanding PV supply security requires attention to both the geographic distribution of suppliers and the conditions under which international sourcing takes place.
Supply chain management research has long examined how firms respond to supply uncertainty through diversification, mitigation, and contingency strategies [9,10]. The effectiveness of these strategies depends not only on the number of available suppliers but also on supply relationships, switching costs, and the ability to adjust sourcing arrangements [11,12,13]. In the PV industry, existing research has explored technological development and strategic dependencies within global production networks [14,15]. Other studies have examined the evolution of international PV trade, network vulnerability, and the geographic transmission of trade disruptions [16,17]. These studies establish the importance of trade-network structure and geographic interdependence for understanding PV sourcing vulnerability.
Studies most closely related to this paper address different dimensions of PV supply-chain security. Ding and Ren [16] characterize the evolution and vulnerability of global PV industry-chain trade patterns, while Li et al. [17] examine geographical linkages and the transmission of trade disruptions. Gervais et al. [18] trace how specified disruptions propagate through alternative PV supply-chain configurations, including diversification, reshoring, and friendshoring. Wang et al. [19] evaluate the implications of PV trade barriers for global carbon mitigation, whereas Cui et al. [20] assess policy-driven changes in global PV supply chains and the associated trade-offs in regional production and economic costs. The 2026 studies further address trade-friction risk dynamics [21] and adaptive network evolution under synergistic green-policy portfolios [22]. Compared with these works, the present study uses importer-specific sourcing portfolios as its analytical unit. It maps supplier-country policy conditions onto pre-existing supplier shares, compares bounded reallocations under alternative exposure and concentration objectives, and examines associations with observed sourcing adjustments. It complements network- and scenario-based studies rather than modeling physical disruption propagation, causal policy shocks, or adaptive network dynamics.
Despite these contributions, an empirical gap remains in integrating these perspectives at the importer-portfolio level. To our knowledge, the existing literature has not jointly examined how supplier-country policy conditions mapped to pre-existing import shares relate to (i) the accounting scope for reallocating shares among already observed suppliers, including a historical recipient-absorption constraint, or (ii) realized import-value changes and supplier-share reconfiguration over time. The gap is therefore not a lack of research on PV trade risk itself, but the limited integration of policy-condition exposure, bounded portfolio reallocation, and observed sourcing persistence within a common empirical design.
These considerations motivate three research questions. First, to what extent does mapped supplier-country policy exposure reflect the existing sourcing composition? Second, how do alternative reallocation rules and recipient absorption constraints affect exposure and supplier concentration within established portfolios? Third, how is mapped exposure associated with observed import value changes and supplier-share reconfiguration across periods? Together, these questions link exposure measurement and counterfactual accounting reallocation to observed trade adjustment.
To address these questions, this study combines CEPII BACI bilateral trade data for 2017–2024 with supplier-country policy indicators from the Oxford COVID-19 Government Response Tracker. Baseline sourcing portfolios are constructed from 2017–2019 trade for 197 eligible importing geographic units and mapped to policy conditions during 2020–2021. Contribution-ranked reallocation is compared with exposure-minimizing linear programming, randomized donor ordering, and HHI minimization, while historical supplier-share expansion is used to assess recipient-absorption constraints. The analysis then examines associations between mapped exposure and observed trade adjustment, linking counterfactual portfolio comparisons with realized sourcing patterns without interpreting either as a causal estimate of policy effects or proof of commercially feasible substitution.
2. Materials and Methods
In this analysis, we use importer-specific sourcing portfolios as the common unit linking three complementary exercises. First, baseline supplier shares are combined with supplier-country policy conditions to measure mapped exposure. Second, these same portfolios provide the starting point for counterfactual reallocations under alternative objectives and constraints. Third, observed trade outcomes are examined for their associations with baseline exposure, including the extent to which these associations depend on sourcing composition. The first two exercises characterize portfolio exposure and accounting adjustment space, whereas the third assesses their empirical relevance through descriptive trade associations. The analysis does not assume that observed sourcing changes follow the counterfactual reallocation rules.
2.1. Data Sources and Analytical Sample
Bilateral trade data were obtained from the CEPII BACI database (release V202601, 22 January 2026) [23]. Values reported in thousands of current US dollars were converted into US dollars. Baseline sourcing portfolios were constructed from pooled bilateral trade values for 2017–2019. For 2017–2021, the product proxy is HS 2007 code 854140, which covers photosensitive semiconductor devices, including photovoltaic (PV) cells and light-emitting diodes. For 2022–2024, HS 2022 codes 854142 and 854143 identify PV cells not assembled into, and assembled into, modules or panels, respectively [24]. These product categories are not equivalent because the earlier category also includes non-PV devices. The 2021–2022 supplier-share transition was therefore excluded, and cross-period comparisons are interpreted with this classification difference in mind. As a classification sensitivity check, post-window supplier-share reconfiguration was also calculated using HS 2007 code 854140 for 2022–2024, allowing comparison with the original HS 2022 product definition (Supplementary Table S11).
Supplier-country policy data were obtained from the archived Oxford COVID-19 Government Response Tracker (OxCGRT) [25]. The national Stringency Index was used as the primary policy condition measure, while Workplace Closing and International Travel Controls were retained for sensitivity analyses. Daily observations were aggregated to monthly means and subsequently averaged over January 2020–December 2021 (Section 2.2). These indicators characterize pandemic-related policy conditions rather than observed disruptions to PV production or trade.
The baseline comprises 8829 importer–supplier relationships involving 225 importing geographic units and 215 suppliers. Of the 225 importers, 219 had at least two baseline suppliers, and 205 of these met the requirement that policy observations cover at least 90% of the baseline sourcing weight. Applying the inherited IRENA/Ember geographic eligibility frame and policy data completeness criteria yielded 197 importers (Table 1). This sample accounted for 76.2% of the pooled 2017–2019 trade value among the initial 225 geographic units. Coverage was limited by the unmatched BACI supplier category S19 (Other Asia, not elsewhere specified) and geographic eligibility restrictions. Alternative policy-mapping and eligibility assumptions were examined in supplementary sensitivity analyses, yielding samples of 211, 204, and 218 importers, respectively.
Table 1.
Construction of the analytical sample and outcome-specific samples.
Outcome availability and complete-case controls produced smaller analytical samples (Table 1). Unobserved importer years were not treated as verified zero imports. The 2019 PV installed-capacity control was obtained from IRENA Renewable Capacity Statistics 2026, using the sum of reported on-grid and off-grid capacity in megawatts where available. Installed generation capacity is distinct from domestic PV manufacturing capacity.
2.2. PV Import Portfolio Construction and Supplier Condition Mapping
Importer-specific PV sourcing portfolios were constructed from bilateral trade flows observed during 2017–2019 using CEPII BACI records [23]. Let denote the value of imports by economy from supplier in year . Baseline supplier weights were calculated from bilateral trade values pooled over 2017–2019:
The baseline weights sum to one for each importer. Supplier concentration was measured using the Herfindahl–Hirschman Index (HHI) [26]:
Higher HHI values indicate greater supplier concentration. The baseline China supplier share was retained as a separate measure of sourcing geography and was calculated from the original portfolio weights without policy coverage normalization.
Supplier-country policy conditions are represented by the Oxford COVID-19 Government Response Tracker (OxCGRT) Stringency Index, which combines nine government response indicators, including workplace restrictions and mobility-related measures [25]. These measures characterize policy environments that may affect production and logistics conditions. The conceptual rationale is that policy measures affecting workplace operations and mobility may alter the operating and logistics conditions under which suppliers produce and deliver PV-related goods. Weighting these supplier-country conditions by pre-existing import shares therefore indicates the extent to which an importer’s established sourcing portfolio is associated with these policy environments, rather than directly measuring the probability or magnitude of an actual supply disruption. The national aggregate StringencyIndex_Average series was used, with daily observations averaged within each month and the 24 monthly observations from January 2020 to December 2021 weighted equally. The Stringency Index, Workplace Closing, and International Travel Controls were normalized to [0, 1] by dividing their original values by 100, 3, and 4, respectively. Let denote the resulting supplier-country policy condition. Importer-level mapped exposure is defined as
Here, denotes the set of suppliers with available policy observations, and is their combined baseline weight. Dividing by yields a weighted mean conditional on policy data coverage, without assigning zero values to unmatched suppliers. With baseline sourcing weights held fixed, mapped exposure describes the correspondence between pre-existing supplier composition and policy conditions during 2020–2021. It is a portfolio screening measure rather than an estimate of realized PV supply disruptions or causal policy effects.
2.3. Bounded PV Import Portfolio Stress Test Design
The portfolio stress test evaluates changes in mapped exposure and supplier concentration under limited reallocations within each importer’s observed supplier set. Baseline supplier identities and the total sourcing weight remain fixed. The analysis characterizes the accounting implications of alternative allocation rules rather than commercially feasible procurement decisions.
The observed portfolio serves as the baseline. Three scenarios permit reallocation budgets of = 0.05, 0.10, and 0.20, corresponding to 5, 10, and 20 percentage points of total portfolio weight, respectively. Each scenario starts from the same baseline portfolio.
In Equation (4), denotes the baseline supplier share and the pooled 2020–2021 Stringency measure. Eligible donors are ranked by their exposure contributions, , in descending order. The policy-matched supplier or suppliers with the lowest serve as recipients and are excluded from donor selection. Weight is withdrawn sequentially until the budget or eligible donor weight is exhausted. Where multiple recipients share the minimum , additions are proportional to their baseline shares. Restricting reallocations to established suppliers is consistent with research on global supply chain restructuring [13].
Contribution ranking was adopted as a transparent screening heuristic that prioritizes suppliers making the largest contributions to baseline mapped exposure. It does not necessarily maximize the marginal exposure reduction per unit of transferred sourcing weight. For this reason, exposure-minimizing linear programming and alternative allocation benchmarks are used to assess the consequences of the ranking rule under comparable reallocation constraints.
For each budget , the counterfactual supplier weights satisfy the following:
The implemented rule permits withdrawals only from eligible donors and additions only to designated recipients. Other weights, including those of unmatched suppliers, remain unchanged. Recipient additions follow fixed baseline share proportions, preserving the total portfolio weight and policy-matched weight. The executed shift is limited by the requested budget and available eligible donor weight; incomplete reallocations remain in the sample.
The contribution-ranked rule is compared with an exposure-minimizing linear programming LP benchmark using the same donor and recipient sets, recipient allocation proportions, and executed shift. Unlike contribution ranking, exposure minimization prioritizes donors according to their marginal reduction in mapped exposure. A random-order benchmark evaluates the sensitivity to donor ranking using 5000 simulations, while an HHI-minimizing benchmark examines the trade-off between exposure reduction and supplier concentration. All benchmarks retain the same executed reallocation amount and feasible supplier set. Mathematical specifications are provided in the Supplementary Methods.
Annual supplier-share reconfiguration is measured using the total variation distance:
The 5-, 10-, and 20-percentage-point reallocation budgets were selected as illustrative lower, central, and upper sensitivity scenarios. Their scale was assessed against 1889 observed annual portfolio transitions during 2010–2019, consistent with the broader motivation for examining sourcing diversification and disruption-response strategies [9,10,13]. The historical transitions provide empirical context rather than identifying unique optimal budgets, and the selected values are not estimates of commercially feasible procurement adjustments.
Sensitivity analyses consider alternative policy measures, annual policy conditions, and recipient absorption bounds. The pooled Stringency-based counterfactual weights are evaluated under Stringency, Workplace Closing, and International Travel Controls for 2020, 2021, and the pooled 2020–2021 window without reranking suppliers. For separate annual reallocation scenarios, year-specific Stringency conditions are used to recalculate donor and recipient selections. Recipient absorption is further restricted by the largest observed positive annual increase in bilateral supplier share during 2017–2019, where consecutive observations are available. This historical expansion bound is a trade-based proxy rather than a measure of production capacity. A separate China-share scenario reallocates up to 10 percentage points from China to existing, policy-matched non-China suppliers in proportion to their baseline weights. Supplier capacity, procurement costs, qualification requirements, and switching constraints are not directly observed [10].
2.4. Observed Sourcing Adjustment and Robustness Analyses
Observed sourcing adjustment is examined through changes in nominal PV-related import values and supplier-share distributions. Mapped exposure is compared with trade outcomes during 2020–2021 and supplier-share reconfiguration before, during, and after this period. These analyses describe cross-importer associations rather than causal policy effects or the predictive performance of the reallocation scenarios.
Nominal import value growth is measured as the difference in ln(1 + mean annual imports) for 2020–2021 and 2017–2019, with import values expressed in current US dollars. Let denote the total recorded import value of economy in year , expressed in current US dollars. The outcome is defined as
Equation (7) uses annual means rather than period totals. The main analysis requires observed import values in all five years (N = 193). A sensitivity analysis uses the mean of available baseline years (N = 196), without treating missing years as zero imports. The logarithmic transformation accommodates differences in import scale; the outcome measures nominal value changes rather than physical import volumes.
Sequential changes in supplier shares are measured using the total variation distance (TVD):
Sequential supplier-share reconfiguration is measured by averaging the TVD across available adjacent-year transitions within the pre-period (2017–2019), focal window (2019–2021), and post-window (2022–2024). Each importer contributes one or two valid transitions per period. The 2021–2022 transition is excluded because of the change in HS product classification. Contemporaneous reconfiguration is measured separately as the mean TVD between the pooled 2017–2019 baseline portfolio and the 2020 and 2021 portfolios. Weighted supplier exit and new-supplier shares capture changes in existing sourcing relationships and the emergence of newly observed suppliers, respectively [13].
Spearman rank correlations are evaluated using two-sided permutation tests with 5000 permutations, and Benjamini–Hochberg false discovery rate adjustment is applied within predefined test families [27]. The four contemporaneous outcomes and three period-specific sequential reconfiguration outcomes form separate families. For ordinary least-squares regressions, we use HC3 robust standard errors [28], controlling for baseline import scale, the 2017–2019 import value trend, supplier HHI, and installed PV capacity in 2019. The baseline China supplier share is added in a separate specification. Complete-case samples comprise 185 importers for nominal import value growth and 184 for post-window reconfiguration. Exposure coefficients are scaled to a 0.10 increase in mapped exposure; HC3 p-values are not BH-adjusted.
Robustness checks include alternative non-overlapping baseline portfolios, a common cohort of 191 importers, and transition-level regressions with importer-clustered standard errors and transition indicators. Additional analyses examine multicollinearity, nonlinear associations, influential observations, outcome trimming, and leave-one-importer-out stability. China-share adjustment, non-China exposure decomposition, and alternative policy condition measures assess sensitivity to sourcing composition and indicator choice. Common-sample and exploratory subgroup tests are treated as separate inference families. Further definitions, inference procedures, and computational settings are provided in the Supplementary Methods. All data processing and statistical analyses were performed using Python (version 3.12.10).
3. Results
The results are presented in four steps. First, we examine the structure of mapped supplier condition exposure and its relationship with baseline PV sourcing characteristics. Second, we report the bounded portfolio stress test results and assess their sensitivity to alternative supplier-country policy measures. Third, mapped exposure is compared with realized trade adjustment during the 2020–2021 global policy condition stress window. Finally, pre-period, post-window, and composition-adjusted analyses are used to assess whether the observed sourcing patterns precede or persist beyond the focal window and to define the empirical boundaries of the portfolio screening framework.
3.1. Exposure Structure and Portfolio Composition
Across the 197 importing economies, the median policy-matched supplier weight was 0.998, and median mapped Stringency exposure was 0.625 (Table 2). China accounted for a median 55.9% of mapped exposure. The median annual exposure increased from 0.605 in 2020 to 0.658 in 2021.
Table 2.
Mapped supplier condition exposure and baseline PV sourcing composition.
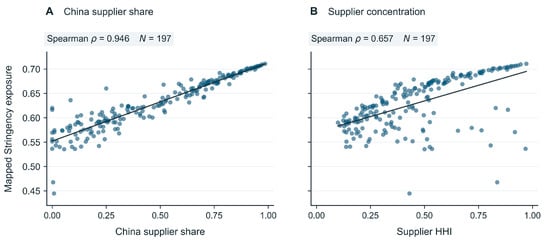
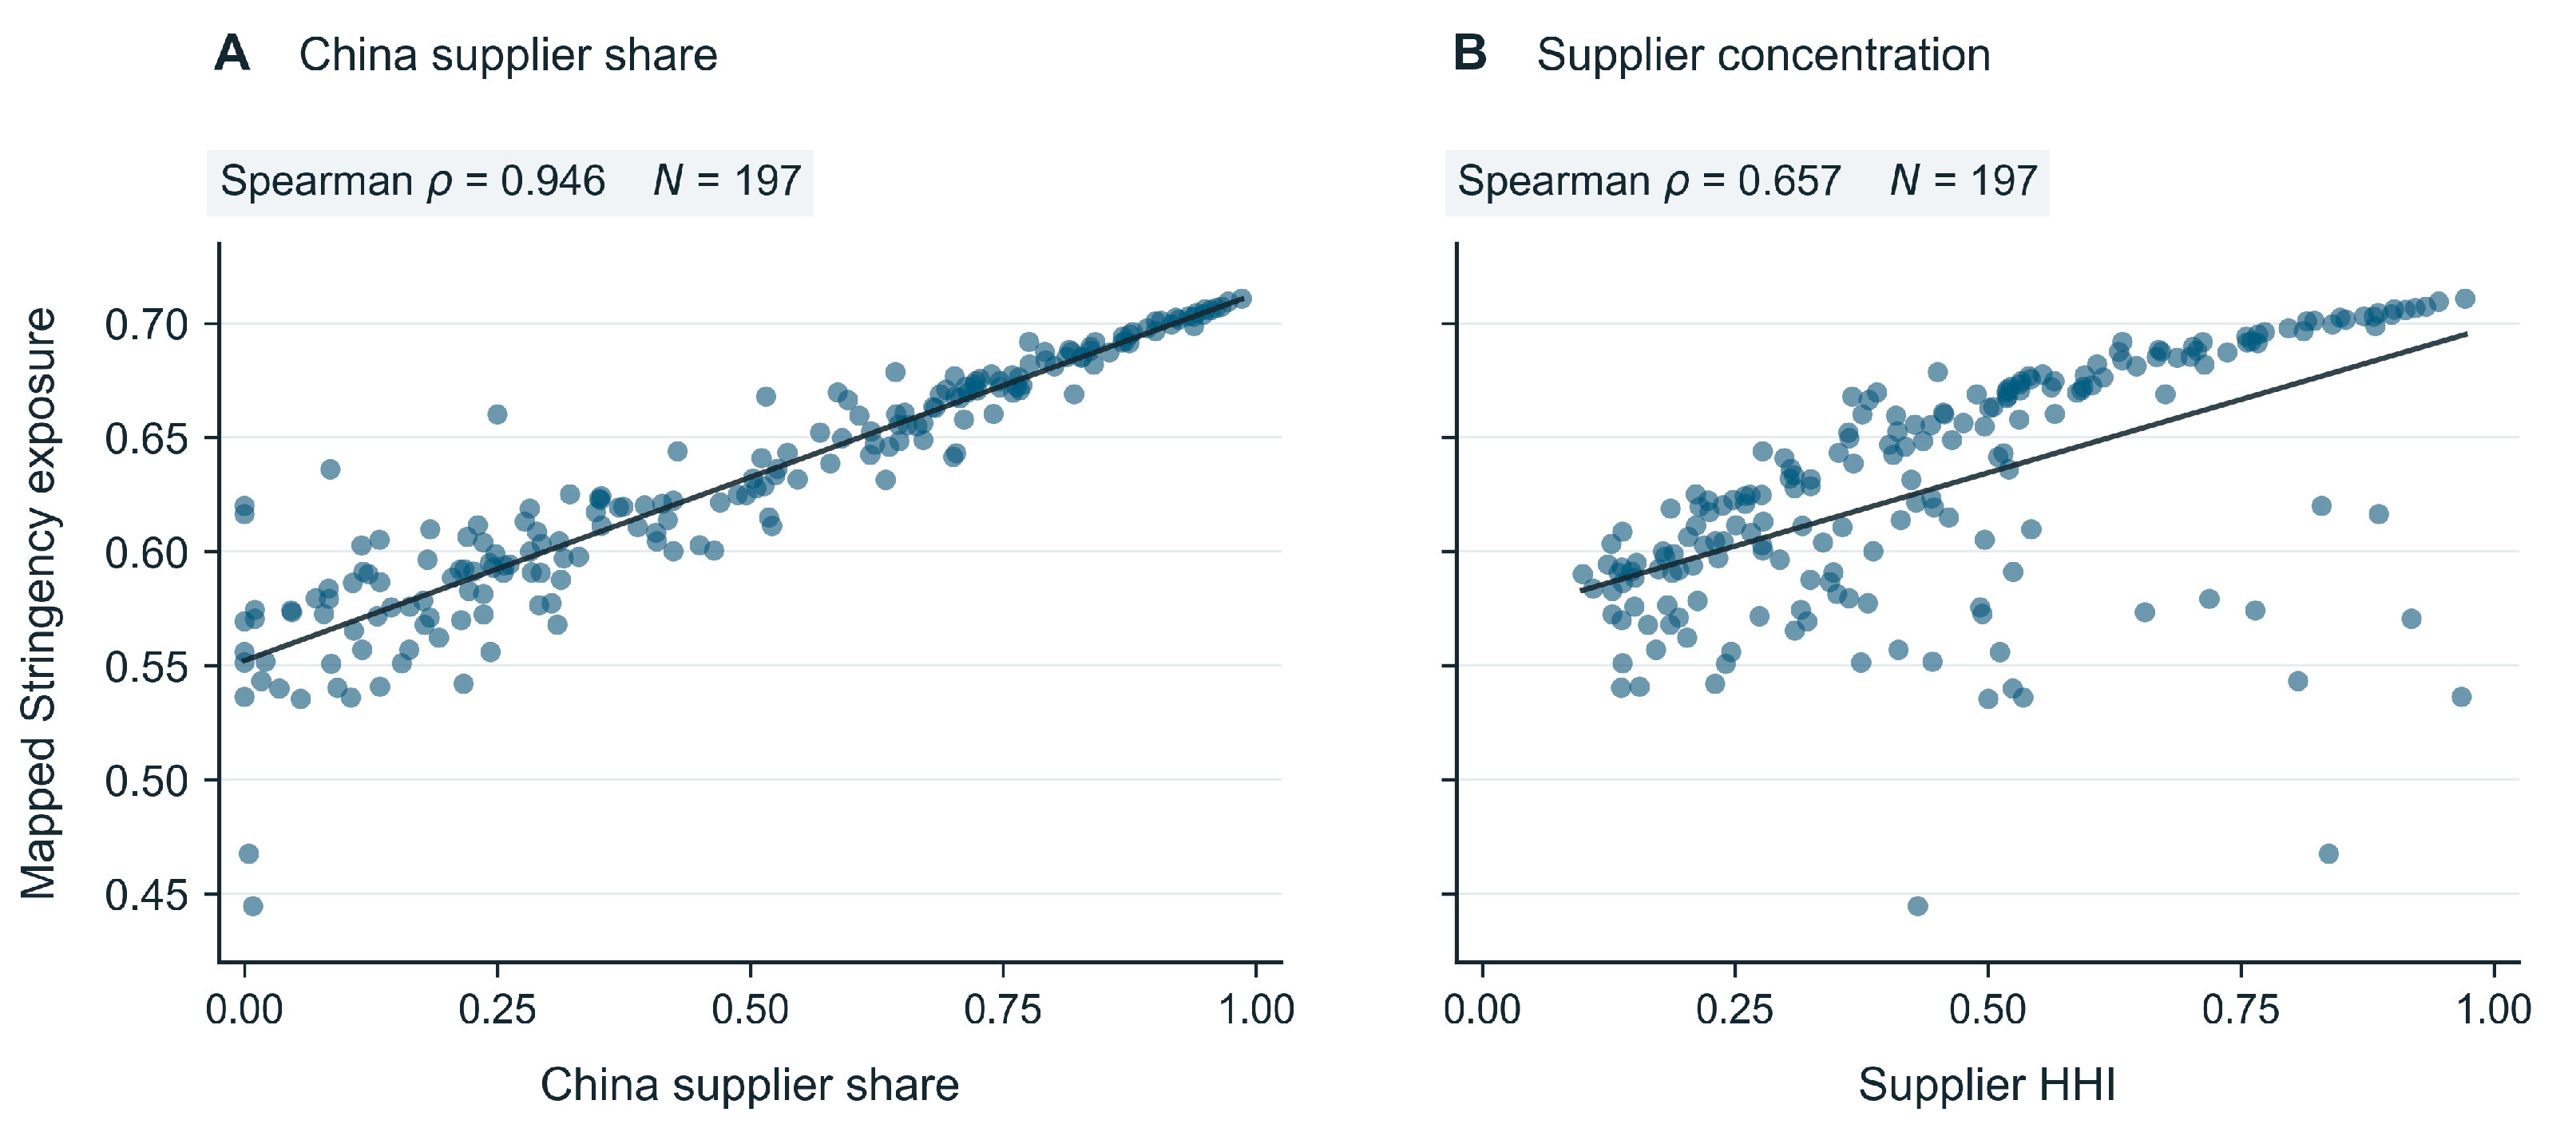
Mapped exposure was strongly correlated with the baseline China supplier share (Spearman = 0.946; Pearson = 0.930) and moderately correlated with the baseline supplier concentration ( = 0.657). Correlations with baseline import scale ( = 0.240; N = 194) and non-China mapped exposure ( = 0.400; N = 197) were weaker. All four Spearman correlations had permutation < 0.001 and BH-FDR < 0.001 (Table 2). Figure 1 illustrates the relationships between mapped exposure, China’s supplier share, and supplier concentration.
Figure 1.
Relationships between mapped Stringency exposure and baseline PV sourcing characteristics: (A) China supplier share and (B) supplier concentration (HHI). Each dot represents an importing economy (N = 197), and the solid lines indicate fitted linear trends.
These results indicate that mapped exposure is closely associated with the baseline sourcing composition, particularly China’s supplier share. Although the measure is not identical to China’s share or the HHI, these correlations do not establish additional explanatory power beyond portfolio structure. Its conditional association with realized trade outcomes is examined in Section 3.3 and Section 3.4.
3.2. Bounded PV Import Portfolio Stress Test Results
Across all three reallocation budgets, 194 of the 197 portfolios (98.5%) completed the requested shift, with the same three portfolios having insufficient eligible donor weight (Table 3). The same three portfolios had insufficient eligible donor weight to complete even the smallest 5-percentage-point budget, whereas the remaining 194 portfolios could complete all three specified budgets. The unchanged completion rate therefore reflects the donor-weight constraints of the accounting model and should not be interpreted as evidence that 98.5% of importing economies possess equivalent real-world supplier-switching flexibility. Under the central 10-percentage-point budget, the median reduction in mapped Stringency exposure was 0.034 (IQR: 0.027–0.043; 95% bootstrap CI: 0.031–0.038), accompanied by a median HHI change of −0.099 (95% CI: −0.109 to −0.085). The HHI increased in four portfolios (2.0%). Increasing the budget from five to 20 percentage points raised the median exposure reduction from 0.017 to 0.068 and the median HHI reduction from 0.055 to 0.159. Non-China suppliers accounted for approximately 28% of withdrawn weight across budgets.
Table 3.
Bounded PV import portfolio stress test outcomes.
The China-share sensitivity scenario completed the full 10-percentage-point shift in 88.3% of portfolios, compared with 98.5% under contribution-ranked reallocation. Although it produced a larger mean reduction in China’s supplier share (0.093 vs. 0.071), its median reductions in mapped exposure (0.016 vs. 0.034) and HHI (0.058 vs. 0.099) were smaller. This distinction shows that reducing reliance on China and reducing condition-weighted exposure are not equivalent under the specified allocation rules.
The exposure-minimizing LP achieved a greater median exposure reduction than contribution ranking (0.038 vs. 0.034), with the latter being suboptimal in 78 of 197 portfolios. However, LP produced a smaller median HHI reduction (0.076 vs. 0.099) and more cases of increased concentration (15 vs. four). The randomized-donor-order benchmark yielded a median exposure reduction of 0.026, calculated as the cross-importer median of importer-specific means from 5000 simulations. The HHI-minimizing benchmark further illustrated the trade-off between exposure and concentration objectives. All benchmarks used identical eligible supplier sets and executed transfer amounts.
Baseline and counterfactual distributions of mapped exposure and supplier HHI are reported in Supplementary Table S4, Panel B. Panel C reports the distribution of HHI changes and the frequency of adverse concentration outcomes. These results complement the median changes and uncertainty estimates reported above.
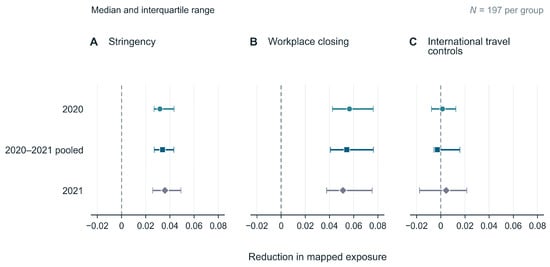
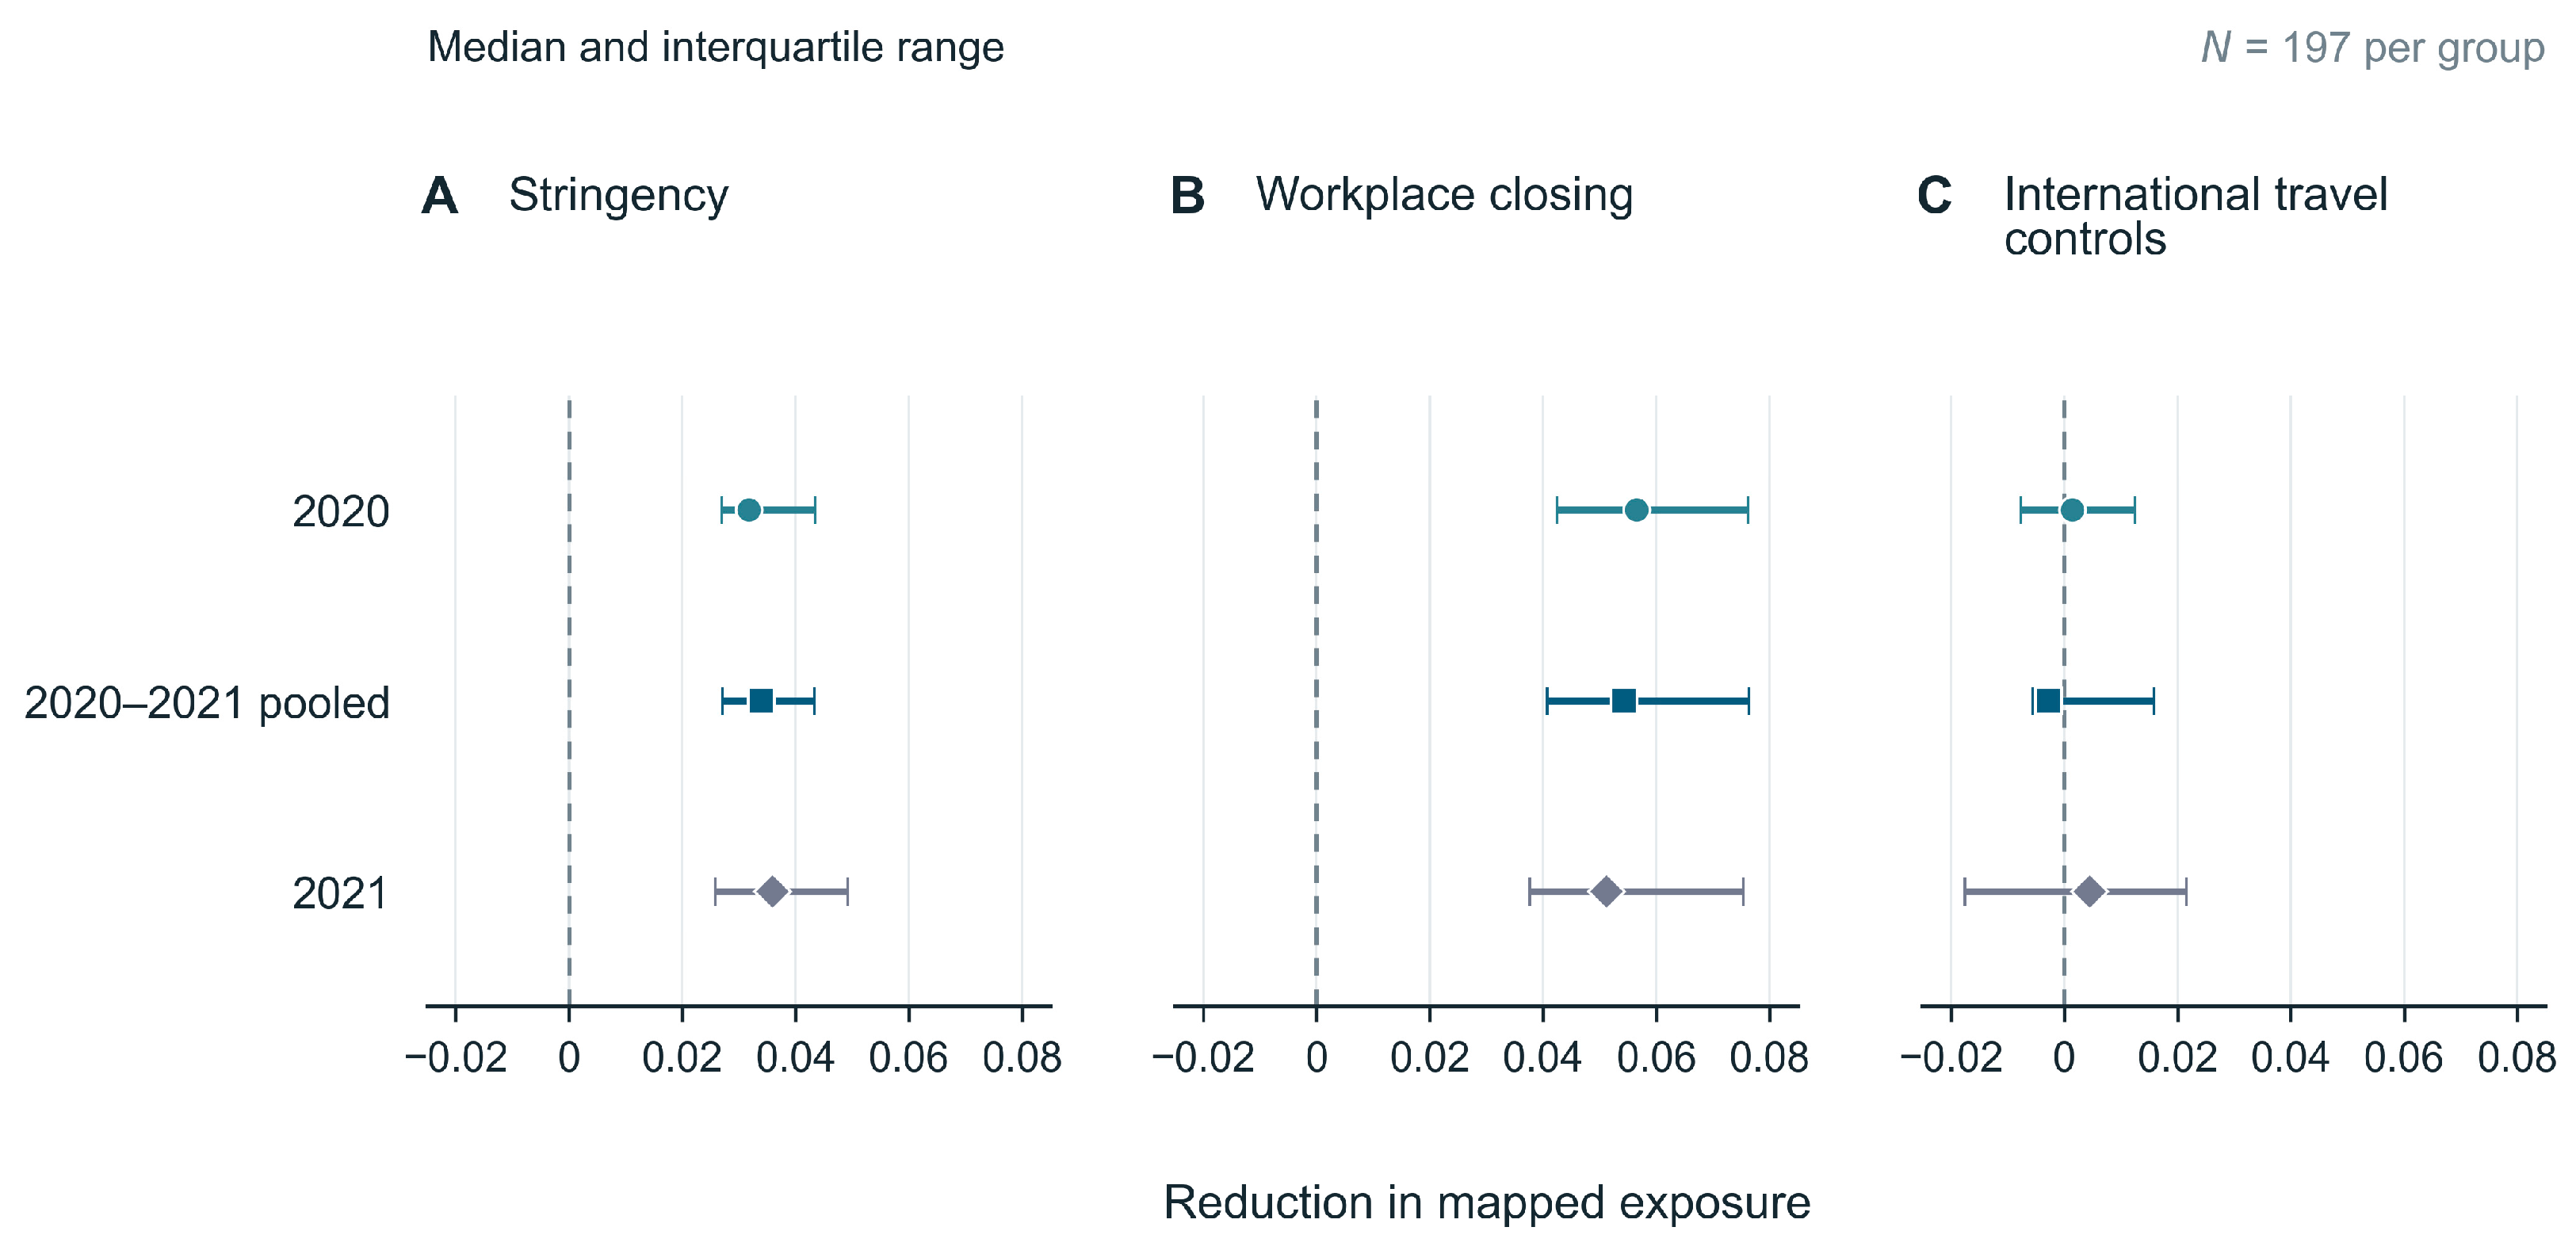
Policy measure sensitivity was examined using fixed pooled-Stringency counterfactual weights across three indicators and three evaluation windows (Figure 2; Supplementary Table S6, Panel C). Under pooled conditions, the median exposure reductions were 0.034 for Stringency and 0.054 for Workplace Closing, whereas International Travel Controls indicated a slight median increase in exposure of 0.003. Year-specific Stringency reranking produced median reductions of approximately 0.036 in both 2020 and 2021 (Supplementary Table S6, Panel B). These comparisons distinguish changes in the evaluated policy conditions from changes in supplier allocation.
Figure 2.
Policy measure and evaluation window sensitivity under fixed counterfactual supplier weights. Circles, squares, and diamonds represent the 2020, pooled 2020–2021, and 2021 evaluation windows, respectively. Symbols indicate medians, horizontal bars represent interquartile ranges, and dashed vertical lines indicate zero exposure reduction.
Alternative policy-mapping and importer eligibility assumptions yielded median exposure reductions of 0.033–0.039 under the central contribution-ranked scenario (Supplementary Table S2). The constructed exposure improvement remained positive, although its magnitude varied across scenarios. Section 3.3 examines the associations between mapped exposure and observed trade outcomes.
3.3. Realized Trade Associations
Mapped exposure was weakly negatively correlated with nominal PV-related import value growth during 2020–2021 (Spearman = −0.164, N = 193; permutation = 0.026; BH-FDR = 0.034; Table 4). The association was sensitive to the alternative supplier policy-mapping and sample eligibility assumptions examined in the supplementary analyses.
Table 4.
Contemporaneous realized trade associations during 2020–2021.
Mapped exposure was negatively correlated with weighted supplier exit ( = −0.177, = 0.013, = 0.027) and baseline-relative supplier-share reconfiguration ( = −0.515, < 0.001, < 0.001), based on 196 importers. Its association with new-supplier share was not statistically significant ( = −0.090, = 0.211, = 0.211). The stronger association with supplier-share reconfiguration indicates greater persistence of baseline sourcing distributions among higher-exposure portfolios.
Exploratory subgroup analyses examined baseline-relative supplier-share reconfiguration across import scale, China-share, and supplier concentration groups (Supplementary Table S10). The exposure–reconfiguration correlation was −0.588 among importers at or above the median (N = 98), compared with 0.106 among those below the median (N = 98). Correlations remained negative across import scale groups ( = −0.542 and −0.582) but differed between low- and high-concentration portfolios ( = −0.198 and −0.532). These patterns indicate that the aggregate association varies across sourcing structures, without establishing causal heterogeneity.
The negative rank association was not supported by the linear regression estimates. The unadjusted HC3 coefficient was −0.206 (SE = 0.128, = 0.108; N = 193). Controlling for baseline import scale, the 2017–2019 import value trend, supplier HHI, and 2019 installed PV capacity brought the coefficient to 0.224 (SE = 0.187, = 0.232; N = 185). Further adjustment for China’s supplier share yielded a coefficient of 0.097 (SE = 0.529, = 0.855), with an incremental R2 of 0.0004 for mapped exposure. These estimates provide limited evidence of an independent association between mapped exposure and nominal import value growth beyond the baseline sourcing composition.
Additional diagnostics are reported in Supplementary Table S12. The unadjusted rank-regression and spline analyses indicated a negative rank association and possible nonlinearity, respectively. However, neither the adjusted rank-regression coefficient nor the adjusted nonlinear term was statistically significant. Huber regression and influence diagnostics further indicate that these findings should not be interpreted as evidence of a robust independent effect.
3.4. Temporal Persistence and Empirical Boundary Checks
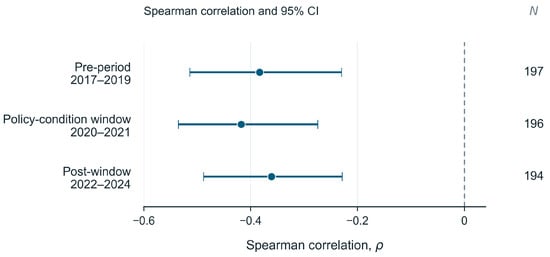
Temporal comparisons distinguished nominal import value growth from sequential supplier-share reconfiguration (Table 5). Mapped exposure was not associated with pre-period nominal import value growth (Spearman = 0.029, N = 197, permutation = 0.680). Its association with contemporaneous growth was weakly negative ( = −0.164, N = 193, = 0.026, BH-FDR = 0.034). By contrast, exposure was negatively associated with sequential reconfiguration in the pre-period ( = −0.383, N = 197), the 2020–2021 policy window ( = −0.418, N = 196), and the 2022–2024 post-window period ( = −0.361, N = 194; all permutations < 0.001). These results indicate that lower supplier-share adjustment among higher-exposure portfolios predates and extends beyond the focal window, without establishing a causal effect of supplier-country policy conditions.
Table 5.
Temporal persistence and empirical boundary checks through 2024.
The negative post-window association also remained in the balanced 2017–2024 reporting sample ( = −0.373, N = 191, < 0.001). In a common cohort of 191 importers with all six comparable annual transitions observed, mapped exposure remained negatively associated with sequential reconfiguration in the pre-period ( = −0.388), the policy window ( = −0.429), and the post-window period ( = −0.373; all permutations = 0.0002; Supplementary Table S9, Panel A). The consistency of these unadjusted associations supports a descriptive pattern of persistent sourcing structure but does not establish that mapped exposure independently determines supplier adjustment.
A negative post-window association was also observed under the alternative HS 2007 classification for 2022–2024 ( = −0.406; N = 195). Among 194 importers observed under both product definitions, the correlations were −0.402 for HS 2007 and −0.361 for HS 2022. The paired difference was −0.041 (95% bootstrap CI: −0.143 to 0.057). The association remained negative when the comparison was restricted to importers with two valid post-window transitions and to the original balanced sample of 191 importers (Supplementary Table S11). These results support the direction of the descriptive association across product classifications.
Non-overlapping baseline checks yielded mixed evidence on the magnitude of the association (Supplementary Table S9, Panel B). When 2014–2016 supplier shares were used to construct exposure, the correlation with mean sequential reconfiguration over 2017–2019 was −0.313 (N = 174), compared with −0.430 under the pooled 2017–2019 baseline in the same cohort. The paired difference was 0.117 (95% CI: 0.003–0.227). By contrast, using 2017 supplier shares to evaluate the 2018–2019 transition produced a correlation of −0.457 (N = 185), close to −0.452 under the pooled baseline; the paired difference was −0.005 (95% CI: −0.087–0.070). Thus, the negative association persists under alternative baseline constructions, but its magnitude depends on the baseline period. These comparisons do not isolate temporal overlap as the sole source of the difference. The period-specific exposure–reconfiguration correlations and their 95% confidence intervals are summarized in Figure 3.
Figure 3.
Temporal persistence of realized PV sourcing adjustment through 2024.
Composition-adjusted estimates further delimited the interpretation of mapped exposure. In the 2022–2024 post-window sample, the exposure coefficient remained negative after adjustment for market scale and portfolio structure ( = −0.073 per 0.10 increase in exposure, SE = 0.029, = 0.012; N = 184). After the baseline China supplier share was added, the coefficient was attenuated to −0.034 (SE = 0.064, = 0.594). A separate transition-level analysis of the common 191-importer cohort, using importer-clustered standard errors, likewise found negative unadjusted exposure coefficients across the three periods ( = −0.128, −0.142, and −0.110; nominal < 0.001 in each period). However, after the baseline China share was added to the pre-period trade controls, the corresponding coefficients were 0.087, 0.082, and −0.007, with p-values of 0.175, 0.235, and 0.904, respectively. The persistence of the unadjusted correlations is therefore clearer than the independent association of exposure conditional on sourcing composition.
Additional checks retained a negative sign for the contemporaneous growth association under outcome trimming and leave-one-importer-out analysis, but the adjusted coefficient remained statistically indistinguishable from zero. The BH-FDR significance also varied across alternative sample and policy-mapping specifications. Cross-period comparisons require a further qualification: trade outcomes through 2021 used HS 854140, whereas the 2022–2024 post-window used HS 854142 and HS 854143 under HS 2022. Excluding the 2021–2022 transition avoids a direct comparison across the classification break but does not establish identical product coverage across periods. The findings therefore support descriptive evidence of persistent sourcing composition and bounded accounting reallocation, rather than causal policy effects, a uniform cross-period measure of PV trade, or demonstrated commercial substitution capacity.
4. Discussion
4.1. Accounting Reallocation Space vs. Realized Sourcing Adjustment
The stress tests and realized trade analyses captured distinct dimensions of sourcing adjustment. Contribution-ranked reallocations identified accounting changes within established supplier portfolios, whereas observed trade data described actual changes in supplier shares. The exposure-minimizing LP achieved greater exposure reductions than contribution ranking under identical constraints, but it produced a smaller median reduction in supplier concentration. This trade-off indicates that exposure minimization and geographic diversification are not equivalent objectives. Neither the constructed reallocations nor their optimization benchmarks establish the feasibility or speed of actual procurement adjustment.
Recipient absorption constraints further qualified the accounting reallocation results. Applying historical supplier-share expansion bounds substantially reduced the proportion of portfolios able to complete the central reallocation budget. However, these bounds reflect observed trade adjustments rather than verified production or export capacity. Actual sourcing substitution also depends on product compatibility, supplier qualification, contractual arrangements, logistics, and switching costs, consistent with the operational constraints emphasized in supply disruption research [10]. Consequently, the unrestricted scenarios describe accounting reallocation possibilities, while the historical bounds provide a partial, sample-limited assessment of recipient absorption.
Gervais et al. [18] examined how supply disruptions propagate through alternative PV supply chain configurations, including reshoring and friendshoring. Their approach was to estimate downstream shortages under specified disruptions. In contrast, the present study evaluated limited reallocations among suppliers already observed in importer portfolios, without simulating physical supply losses. The historical absorption results highlight a practical constraint on diversification but cannot be interpreted as estimates of disruption-induced shortages.
The temporal evidence also points to persistent differences in sourcing composition. Higher mapped exposure was associated with lower sequential supplier-share reconfiguration before, during, and after the 2020–2021 policy window. Although the negative association persisted in common-sample and non-overlapping baseline analyses, its magnitude varied with baseline construction. Moreover, the conditional association was weakened after the baseline China supplier share was controlled for. These patterns suggest that mapped exposure primarily reflects established sourcing geography rather than an independently identified effect of supplier-country policy conditions.
Taken together, these findings are consistent with previous research identifying strategic dependencies and structural vulnerabilities in global PV supply networks [15,16,17], but they add an important importer-level qualification. Mapped policy-condition exposure is strongly associated with baseline sourcing geography, particularly China’s supplier share (Spearman’s = 0.946), and should therefore not be interpreted as an independent measure of policy risk. The negative associations between exposure and supplier-share reconfiguration before, during, and after the 2020–2021 window extend the literature by documenting a descriptive pattern of sourcing persistence across periods. However, the weakening of these associations after controlling for baseline China share indicates that the results do not establish an independent effect of supplier-country policy conditions on sourcing adjustment. In contrast to studies examining disruption propagation, trade barriers, and policy-driven supply-chain restructuring [18,19,20], the present analysis quantifies accounting reallocation within observed supplier portfolios and the trade-offs between exposure reduction and supplier concentration. It does not estimate physical supply shortages, carbon-mitigation effects, or cost-optimal diversification. Recent research on trade-friction risks and adaptive supply-chain networks under coordinated green policies [21,22] addresses complementary mechanisms that fall outside the scope of the present framework.
4.2. Implications for PV Supply Security and Energy Transition Policy
Supplier concentration and mapped policy condition exposure provide complementary descriptive measures of PV-related sourcing portfolios. The HHI captures the distribution of sourcing shares, whereas mapped exposure incorporates supplier-country policy conditions. Given its strong dependence on baseline sourcing geography, mapped exposure should be assessed alongside supplier shares and concentration rather than as an independent indicator of supply vulnerability. These indicators can be jointly used to identify portfolios requiring closer examination of geographic dependence and supplier conditions.
Portfolio reallocation also involves competing objectives. Exposure-minimizing allocations do not necessarily achieve the greatest reduction in supplier concentration, while historical absorption bounds substantially restrict the adjustments permitted by unrestricted accounting scenarios. These findings suggest that sourcing alternatives should be evaluated against both exposure and concentration criteria. Their operational feasibility further depends on available supplier capacity, product compatibility, qualification requirements, delivery conditions, and procurement costs. The economic consequences of diversification therefore require assessments beyond trade-based stress tests.
Cui et al. [20] evaluated alternative PV supply chain configurations by considering manufacturing expansion, regional objectives, and economic costs. Their results showed that greater regional self-sufficiency can involve substantial cost trade-offs. The present study addresses a narrower decision problem: comparing mapped exposure and supplier concentration within existing import portfolios. The differences between the exposure-minimizing and HHI-minimizing outcomes therefore inform initial portfolio screening, rather than identifying a cost-optimal sourcing strategy.
Sourcing diversification may also involve economic and environmental trade-offs that are not captured by the present framework. Alternative suppliers may differ in production technologies, electricity mixes, transport distances, and locations, potentially affecting total landed costs and embodied greenhouse-gas emissions. Shifting sourcing patterns may also require additional supplier qualification, logistics adjustments, manufacturing capacity, or supporting infrastructure, thereby increasing implementation costs. Consequently, a reduction in mapped policy-condition exposure or supplier concentration does not necessarily imply lower life-cycle costs, lower emissions, or greater operational feasibility. The present analysis relies on country-level trade shares and policy-condition indicators and does not incorporate supplier-specific life-cycle inventories, production costs, transport emissions, or infrastructure investment. These outcomes therefore cannot be quantified directly from the current results. Integrating life-cycle assessment, supplier-level cost and capacity data, electricity-mix information, and infrastructure requirements would enable future research to evaluate these trade-offs more directly.
These results support a screening role across four types of supply-chain decisions, rather than providing a direct operational optimization. For procurement diversification, under the central 10-percentage-point reallocation budget, contribution-ranked reallocation achieved a median mapped-exposure reduction of 0.0340 and a median change in the Herfindahl–Hirschman Index (ΔHHI) of −0.0993, with HHI increasing in 4 portfolios. Exposure-minimizing linear programming achieved a larger median exposure reduction of 0.0382, but a smaller median HHI reduction (ΔHHI = −0.0763), with HHI increasing in 15 portfolios (Supplementary Table S3). This trade-off can help procurement teams compare alternative sourcing objectives and prioritize portfolios for further assessment, without prescribing actual purchase shares. For manufacturing localization and supplier development, completed reallocations fell from 73 under the unrestricted scenario to 5 under the main historical recipient-absorption constraint among 76 evaluable portfolios (Supplementary Table S5). This result identifies cases in which proposed sourcing shifts warrant closer assessment of recipient capacity, product qualification, delivery conditions, costs, and localization feasibility. Historical supplier-share expansion, however, is only a partial proxy for absorption and does not measure physical production capacity. For inventory and continuity planning, portfolios with high mapped exposure or supplier concentration can be prioritized for contingency-plan review, but the present framework cannot determine optimal safety-stock levels because it does not model demand variability, lead times, or inventory costs. The results should therefore be interpreted as quantitative screening inputs for subsequent operational assessment, rather than as estimates of procurement savings or commercially feasible sourcing decisions.
4.3. Limitations and Future Research Directions
The mapped exposure described in this study combined fixed 2017–2019 sourcing shares with national policy conditions observed during 2020–2021. These policy measures do not directly capture PV-specific production losses or supply disruptions. Moreover, exposure is strongly associated with the baseline China supplier share, and its conditional relationships with realized trade outcomes are sensitive to model specification and sample construction. The temporal comparisons in this study are retrospective and do not identify causal policy effects or establish predictive performance. This differs from the trade friction risk dynamics reviewed by Zhao et al. [21] and the policy-driven firm and network adaptation modeled by Yang and Zheng [22]. The present study neither evaluated trade friction mechanisms nor estimated behavioral responses to coordinated green policies.
Product classification and geographic coverage impose further limitations. The pre-2022 HS 854140 category included non-PV devices, whereas the narrower HS 2022 categories do not provide an equivalent product basket. Excluding the 2021–2022 transition avoids direct comparisons across the classification break but does not eliminate differences in product coverage. The alternative HS 2007 classification yielded a similar negative post-window association, although this broader category still included non-PV devices, and importer-level reconfiguration measures remained sensitive to product coverage. The 197-importer sample accounted for 76.2% of pooled 2017–2019 HS 854140 trade value among the initial 225 importing geographic codes, rather than an equivalent share of global PV-specific imports. The unmatched S19 supplier category and geographic eligibility restrictions further limited sample coverage. Alternative policy-mapping and eligibility assumptions affected some estimates and their statistical significance.
The stress tests did not incorporate observed manufacturing capacity, supplier qualification, procurement contracts, logistics, switching costs, supplier-specific life-cycle inventories, embodied emissions, total landed costs, or infrastructure investment. Historical supplier-share expansion provided a partial absorption constraint but was estimable for only 76 portfolios and did not measure physical supply capacity. Future research could combine more disaggregated PV product and firm-level trade data with supplier capacity, procurement and total landed costs, supplier-specific life-cycle inventories, electricity mixes, transport emissions, infrastructure requirements, and disruption indicators. Such information would allow a more direct evaluation of substitution feasibility, adjustment costs, environmental impacts, and supply-security outcomes.
5. Conclusions
This study developed a portfolio-level screening framework integrating supplier-country policy condition mapping, bounded sourcing reallocation, and realized trade analysis. Using PV-related bilateral trade data from 2017–2024, it examined baseline sourcing portfolios and subsequent adjustment across 197 eligible importing geographic units.
Three findings emerged. First, mapped exposure was strongly associated with the baseline sourcing geography, particularly China’s supplier share ( = 0.946), and provided limited incremental explanatory value in composition-adjusted trade models. Second, under the central 10-percentage-point budget, contribution-ranked reallocation reduced the median mapped exposure by 0.034, compared with 0.038 under exposure-minimizing linear programming. The latter achieved a smaller median reduction in supplier concentration, while historical recipient absorption bounds substantially restricted completed reallocations. Third, higher-exposure portfolios exhibited lower sequential supplier-share reconfiguration before, during, and after the 2020–2021 policy window. However, conditional associations weakened after the baseline China share was accounted for, and the relationship with nominal import value growth was sensitive to model specifications.
The framework contributes a reproducible approach to comparing policy-conditioned exposure, alternative within-portfolio reallocation rules, and observed sourcing persistence. Its practical value lies in identifying portfolios and sourcing alternatives for further assessment, rather than predicting disruption losses or demonstrating commercially feasible substitutions. Procurement and diversification decisions require additional evidence for supplier capacity, product compatibility, logistics, and adjustment costs.
Supplementary Materials
The following supporting information can be downloaded at: https://www.mdpi.com/article/10.3390/en19215216/s1, Supplementary Methods: SM1. Trade classification, policy matching, and analytical samples; SM2. Portfolio weights, exposure, and contribution-ranked reallocation; SM3. Optimization benchmarks and comparability; SM4. Historical recipient-absorption sensitivity; SM5. Trade outcomes and statistical inference; Table S1: Analytical sample construction and eligibility diagnostics; Table S2: Policy mapping and sample-eligibility sensitivity; Table S3: Reallocation algorithms under identical executed transfers (10 percentage points); Table S4: Dispersion and importer-bootstrap uncertainty for contribution-ranked reallocations; Table S5: Recipient absorption bounds: paired unbounded and constrained outcomes; Table S6: Annual policy conditions and 10-percentage-point scenario sensitivity; Table S7: Exposure composition dependence and common-sample model comparisons; Table S8: Nominal Import-Value Growth and Inference Sensitivity; Table S9: Sequential Supplier-Share Reconfiguration and Robustness Checks; Table S10: Exploratory subgroups for baseline-relative contemporaneous reconfiguration; Table S11: Sensitivity of Post-Window Supplier-Share Reconfiguration to HS Product Classification; Table S12: Functional-Form, Residual, and Influence Diagnostics for Nominal Import-Value Growth.
Author Contributions
Conceptualization, Y.G. and L.Z.; methodology, Y.G.; data curation, Y.G.; formal analysis, Y.G.; visualization, Y.G.; funding acquisition, Y.G.; supervision, L.Z.; writing—original draft preparation, Y.G.; writing—review and editing, Y.G. and L.Z. All authors have read and agreed to the published version of the manuscript.
Funding
This research was funded by the Hebei Provincial Social Science Fund, grant number HB25GL012, and the Fundamental Research Funds for the Central Universities, grant number CUC230B052.
Data Availability Statement
The data analyzed in this study were obtained from the CEPII BACI database and the Oxford COVID-19 Government Response Tracker. The processed analytical data and supporting computational materials are available from the corresponding author upon reasonable request, subject to any applicable restrictions on the redistribution of third-party data.
Conflicts of Interest
The authors declare no conflicts of interest.
References
- de l’Epine, M.; Dominguez, G.; Kaizuka, I.; Jäger-Waldau, A. A Snapshot of Global PV Markets; Report No. T1-49:2026; IEA PVPS Task 1: Paris, France, 2026. [Google Scholar]
- International Energy Agency (IEA). Solar PV Global Supply Chains: An IEA Special Report; IEA: Paris, France, 2022. [Google Scholar] [CrossRef] [Scilit]
- International Energy Agency (IEA). Energy Technology Perspectives 2026; IEA: Paris, France, 2026. [Google Scholar]
- International Renewable Energy Agency (IRENA). Solar PV Supply Chains: Technical and ESG Standards for Market Integration; IRENA: Abu Dhabi, United Arab Emirates, 2024. [Google Scholar]
- Helveston, J.P.; Nahm, J. China’s key role in scaling low-carbon energy technologies. Science 2019, 366, 794–796. [Google Scholar] [CrossRef] [Scilit] [PubMed]
- Helveston, J.P.; He, G.; Davidson, M.R. Quantifying the cost savings of global solar photovoltaic supply chains. Nature 2022, 612, 83–87, Correction in Nature 2023, 618, E24. [Google Scholar] [CrossRef] [Scilit] [PubMed]
- Chen, Z.; Gu, B.; Yu, D.; Wang, C. Quantifying the accelerated diffusion and cost savings of global solar photovoltaic supply chains. iScience 2025, 28, 111610. [Google Scholar] [CrossRef] [Scilit] [PubMed]
- Liu, J.; Shen, X. Global PV supply chains: Costs and energy savings, GHG emissions reductions. Energy Policy 2025, 205, 114716. [Google Scholar] [CrossRef] [Scilit]
- Anupindi, R.; Akella, R. Diversification under supply uncertainty. Manag. Sci. 1993, 39, 944–963. [Google Scholar] [CrossRef] [Scilit]
- Tomlin, B. On the value of mitigation and contingency strategies for managing supply chain disruption risks. Manag. Sci. 2006, 52, 639–657. [Google Scholar] [CrossRef] [Scilit]
- Jain, N.; Girotra, K.; Netessine, S. Recovering global supply chains from sourcing interruptions: The role of sourcing strategy. Manuf. Serv. Oper. Manag. 2022, 24, 846–863. [Google Scholar] [CrossRef] [Scilit]
- Pichler, A.; Diem, C.; Brintrup, A.; Lafond, F.; Magerman, G.; Buiten, G.; Choi, T.Y.; Carvalho, V.M.; Farmer, J.D.; Thurner, S. Building an alliance to map global supply networks. Science 2023, 382, 270–272. [Google Scholar] [CrossRef] [Scilit] [PubMed]
- Niu, Y.; Werle, N.; Cohen, M.; Cui, S.; Deshpande, V.; Ernst, R.; Huchzermeier, A.; Tsay, A.A.; Wu, J. Restructuring global supply chains: Navigating challenges of the COVID-19 pandemic and beyond. Manuf. Serv. Oper. Manag. 2025, 27, 1025–1036. [Google Scholar] [CrossRef] [Scilit]
- Shubbak, M.H. The technological system of production and innovation: The case of photovoltaic technology in China. Res. Policy 2019, 48, 993–1015. [Google Scholar] [CrossRef] [Scilit]
- Caravella, S.; Crespi, F.; Cucignatto, G.; Guarascio, D. Technological sovereignty and strategic dependencies: The case of the photovoltaic supply chain. J. Clean. Prod. 2024, 434, 140222. [Google Scholar] [CrossRef] [Scilit]
- Ding, C.; Ren, X. Evolution and vulnerability analysis of global photovoltaic industry chain trade pattern. Sci. Rep. 2025, 15, 6275. [Google Scholar] [CrossRef] [Scilit] [PubMed]
- Li, W.; Zhang, M.; Han, M. Geographical linkage and trade disruption within global photovoltaic supply chains. Geogr. Sustain. 2025, 6, 100323. [Google Scholar] [CrossRef] [Scilit]
- Gervais, E.; Sprecher, B.; Nold, S.; Brailovsky, P.; Kleijn, R. Tracing the propagation of disruptions in supply chain scenarios: A case study of photovoltaics diversification. Resour. Conserv. Recycl. 2025, 212, 107948. [Google Scholar] [CrossRef] [Scilit]
- Wang, M.; Mao, X.; Xing, Y.; Lu, J.; Song, P.; Liu, Z.; Guo, Z.; Tu, K.; Zusman, E. Breaking down barriers on PV trade will facilitate global carbon mitigation. Nat. Commun. 2021, 12, 6820. [Google Scholar] [CrossRef] [Scilit] [PubMed]
- Cui, C.; Lonergan, K.E.; Sansavini, G. Policy-driven transformation of global solar PV supply chains and resulting impacts. Nat. Commun. 2025, 16, 6742. [Google Scholar] [CrossRef] [Scilit] [PubMed]
- Zhao, Y.; McLellan, B.C.; Wang, C.; Shuai, J.; Xiang, W.; Shuai, C. Risk dynamics and strategies of China’s solar PV industry chain under trade frictions: A review. Energy Policy 2026, 208, 114942. [Google Scholar] [CrossRef] [Scilit]
- Yang, W.; Zheng, Y. Reshaping the solar PV supply chain: Adaptive network evolution driven by synergistic green policy portfolios. Energy Policy 2026, 215, 115327. [Google Scholar] [CrossRef] [Scilit]
- Gaulier, G.; Zignago, S. BACI: International Trade Database at the Product-Level—The 1994–2007 Version; CEPII Working Paper No. 2010-23; CEPII: Paris, France, 2010. [Google Scholar]
- World Customs Organization (WCO). Harmonized System Nomenclature 2022 Edition; WCO: Brussels, Belgium, 2022. [Google Scholar]
- Hale, T.; Angrist, N.; Goldszmidt, R.; Kira, B.; Petherick, A.; Phillips, T.; Webster, S.; Cameron-Blake, E.; Hallas, L.; Majumdar, S.; et al. A global panel database of pandemic policies (Oxford COVID-19 Government Response Tracker). Nat. Hum. Behav. 2021, 5, 529–538. [Google Scholar] [CrossRef] [Scilit] [PubMed]
- Hirschman, A.O. The paternity of an index. Am. Econ. Rev. 1964, 54, 761–762. [Google Scholar]
- Benjamini, Y.; Hochberg, Y. Controlling the false discovery rate: A practical and powerful approach to multiple testing. J. R. Stat. Soc. Ser. B 1995, 57, 289–300. [Google Scholar] [CrossRef] [Scilit]
- MacKinnon, J.G.; White, H. Some heteroskedasticity-consistent covariance matrix estimators with improved finite sample properties. J. Econom. 1985, 29, 305–325. [Google Scholar] [CrossRef] [Scilit]

Disclaimer/Publisher’s Note: The statements, opinions and data contained in all publications are solely those of the individual author(s) and contributor(s) and not of MDPI and/or the editor(s). MDPI and/or the editor(s) disclaim responsibility for any injury to people or property resulting from any ideas, methods, instructions or products referred to in the content. |
© 2026 by the authors. Licensee MDPI, Basel, Switzerland. This article is an open access article distributed under the terms and conditions of the Creative Commons Attribution (CC BY) license.