


Abstract
High-precision state of charge (SOC) estimation is essential for reliable supercapacitor (SC) energy storage systems. However, irregular noise and sensor biases can degrade estimation accuracy. To address these issues, an estimated-value correction (EVC) strategy integrating forgetting factor recursive least squares (FFRLS) and Sage–Husa adaptive extended Kalman filtering (SHEKF) is developed. FFRLS enables online parameter identification, while the Sage–Husa mechanism improves noise adaptability. An ampere-hour integration (AHI)-assisted correction mechanism with open-circuit voltage (OCV) slope-dependent gain modulation is introduced to mitigate sensor-bias-induced estimation deviations. Experiments under dynamic stress test (DST) and urban dynamometer driving schedule (UDDS) conditions demonstrate that EVC-SHEKF achieves root mean square errors (RMSEs) of 1.096% and 1.113%, respectively, under coupled voltage and current sensor biases, outperforming the investigated filtering and bias-compensation methods. Parameter sensitivity analysis supports the selected correction gain, while temperature experiments from 10 °C to 40 °C yield RMSEs between 1.09% and 1.14%. These results demonstrate the effectiveness and robustness of the proposed framework under the investigated measurement uncertainties and operating conditions.
1. Introduction
Supercapacitors (SCs), characterized by rapid power delivery, strong temperature adaptability, and excellent durability, have been extensively applied across various applications including electric vehicles, renewable energy systems, and rail transit [1]. To satisfy high-power requirements, SC cells are commonly assembled in series–parallel configurations to construct energy storage systems [1,2]. In these systems, the SC management system (SCMS) is used for managing the status of SCs, ensuring system safety and reliability [2]. State of charge (SOC) is a key indicator for the SCMS, which is fundamental to indicating the remaining usable energy and optimizing control strategies. Therefore, high-precision SOC estimation plays an important role in maintaining reliable system operation and enhancing the energy utilization performance of energy storage systems [3].
At present, SOC estimation methods for SCs can be classified into model-free and model-based categories [2,3]. The former mainly consist of direct calculation and data-driven techniques. Direct calculation methods primarily include ampere-hour integration (AHI) and the open-circuit voltage (OCV) method, both of which are typically open-loop estimation approaches. AHI estimates SOC by integrating the measured current over time, but its open-loop nature makes it susceptible to accumulated errors caused by current measurement bias and inaccurate initial SOC. The OCV method estimates SOC based on a predefined OCV–SOC relationship. However, under dynamic operating conditions, terminal voltage is affected by ohmic voltage drops and polarization effects, making accurate OCV determination difficult without sufficient relaxation [4]. Consequently, both methods exhibit poor robustness as they lack a feedback mechanism to suppress errors. In contrast, data-driven methods, such as support vector machines and PSO-CatBoost, estimate SOC by learning relationships from historical operating data [5,6,7]. However, their estimation accuracy may depend on the representativeness of the training data, particularly when operating conditions differ from those encountered during training [7]. Model-based approaches include Luenberger observers, sliding-mode observers, adaptive Luenberger observers, and Kalman-filter-based estimators [8,9,10,11]. Among these methods, KF and its variants have been extensively studied [11]. Conventional Kalman filtering assumes a linear system model, and its estimation performance may deteriorate when nonlinear system dynamics are not adequately represented. Furthermore, estimation accuracy is influenced by model uncertainties, noise characteristics, and measurement errors. To address these limitations, various improved Kalman-filter-based methods have been developed [11].
To improve SOC estimation accuracy under nonlinear operating conditions, various Kalman-filter-based methods have been investigated. For example, adaptive state estimation and improved unscented Kalman filtering (UKF) approaches have been developed to enhance estimation performance under different operating conditions [12,13,14]. However, the effectiveness of these methods depends on the accuracy of the system model and the assumed noise characteristics. To address uncertainties in noise statistics, researchers have developed adaptive filtering strategies, including the Sage–Husa adaptive extended Kalman filter (EKF) [15], window-varying adaptive EKF approaches [16,17], and other EKF- and adaptive UKF-based estimation frameworks [18,19]. These studies demonstrate the potential of adaptive filtering to improve estimation accuracy under uncertain or time-varying noise conditions.
In addition to noise uncertainty, measurement abnormalities and model mismatch can also degrade SOC estimation performance. Liu et al. [20] combined a cubature Kalman filter with least-squares estimation and gradient correction, while Li et al. [21] investigated robust SOC estimation under randomly missing current measurements. Tong et al. [22] further considered measurement loss and inaccurate noise covariance matrices. Moreover, the electrical parameters of energy storage devices may vary with temperature, aging, and operating conditions, making online parameter identification important for accurate model-based estimation. To address this issue, Sun et al. [23] developed an adaptive forgetting factor recursive least-squares (FFRLS) method for equivalent-circuit parameter identification. Subsequently, FFRLS-based identification was integrated with Kalman-filter-based SOC estimation frameworks, including improved FFRLS combined with an interacting multiple-model UKF [24] and FFRLS combined with EKF [25]. These approaches provide useful methods for reducing the influence of parameter uncertainties and model mismatch on SOC estimation.
In practical applications, voltage and current measurements are inevitably affected by sensor noise, systematic biases, and other measurement uncertainties. Unlike zero-mean random noise, persistent sensor biases may introduce systematic deviations into the SOC estimation process. The effects of sensor bias and measurement variance on Kalman-filter-based SOC estimation have been theoretically investigated [26]. These findings indicate that adjusting filter parameters or noise covariance matrices alone may be insufficient to eliminate persistent estimation deviations caused by biased measurements.
To address sensor-related estimation errors, various observer-based and compensation strategies have been developed. For example, a switching observer was designed for SOC estimation in reconfigurable supercapacitor systems [27], while a current-bias compensation method incorporating a proportional–integral observer structure was investigated for lithium-ion battery SOC estimation [28]. Kadem and Kim [29] developed a noisy-input Kalman filtering (NiKF) approach to mitigate SOC estimation errors associated with current measurement uncertainty. Furthermore, Wang et al. [30] proposed an estimated-value compensation method for lithium-ion batteries by incorporating an ampere-hour integration (AHI)-based auxiliary reference and open-circuit voltage (OCV)-related correction information. More recently, Wang et al. [31] developed a bias-free Kalman filtering framework combined with an uncertain bias estimator (UBE) for supercapacitor SOC estimation under uncertain measurement biases.
These studies demonstrate that sensor-induced estimation errors can be addressed through different mechanisms, including observer design, explicit bias estimation, and auxiliary-reference-based correction. Building on this research, the present study investigates the integration of AHI-assisted estimated-value correction with online parameter identification and Sage–Husa adaptive noise estimation for supercapacitors under coupled voltage and current measurement biases. Rather than explicitly augmenting the state vector with additional sensor-bias estimation states, the proposed EVC mechanism uses the discrepancy between the filtering estimate and an AHI-based auxiliary reference to correct persistent SOC estimation deviations, with the correction strength further modulated by the local OCV–SOC slope.
Despite these advancements, accurate SOC estimation remains challenging when time-varying noise characteristics and persistent sensor biases coexist. Existing methods address different sources of estimation uncertainty through adaptive filtering, observer design, explicit bias estimation, or auxiliary-reference-based correction. However, improvements in noise covariance estimation or model parameter identification do not necessarily eliminate systematic SOC deviations caused by biased measurements. Furthermore, although AHI-assisted compensation and explicit bias estimation have been investigated in previous studies, their integration with adaptive noise estimation for supercapacitor SOC tracking under coupled voltage and current measurement biases requires further evaluation. This motivates the development and experimental investigation of a correction framework that combines adaptive filtering with an AHI-based discrepancy signal and OCV–SOC slope-dependent gain modulation, without explicitly introducing additional sensor-bias estimation states.
To address these issues, this study develops an SOC estimation framework integrating forgetting factor recursive least squares (FFRLS), Sage–Husa adaptive extended Kalman filtering (SHEKF), and an estimated-value correction (EVC) strategy. The FFRLS algorithm is employed for online parameter identification, while the Sage–Husa mechanism is incorporated to improve filtering performance under irregular noise. Based on the analysis of sensor-induced SOC estimation errors, an AHI-assisted correction mechanism with OCV–SOC slope-dependent gain modulation is introduced to mitigate persistent estimation deviations. The proposed framework is further evaluated under different sensor-bias conditions, correction gains, temperatures, and dynamic operating cycles, with comparisons against existing estimation and bias-compensation methods.
The main contributions of this study are summarized as follows:
- (1)
- The effects of voltage and current measurement biases on SOC estimation are analyzed based on the error propagation characteristics of the Kalman filtering framework. The relationship between the voltage-bias-induced estimation error and the local OCV–SOC slope is further investigated, providing a theoretical basis for the slope-dependent modulation of the correction gain.
- (2)
- An AHI-assisted estimated-value correction strategy is developed for SC SOC estimation under coupled measurement biases. By incorporating the discrepancy between the filtering estimate and the AHI-based auxiliary reference, the strategy mitigates persistent estimation deviations without explicitly estimating additional sensor-bias states. The correction gain is further modulated according to the local OCV–SOC slope.
- (3)
- The EVC strategy is integrated with FFRLS-based online parameter identification and Sage–Husa adaptive noise estimation to improve SOC estimation performance under parameter uncertainties, irregular noise, and persistent measurement biases. The influence of the nominal correction gain is further investigated through a sensitivity analysis to support its parameter selection.
- (4)
- Experimental validation is performed under the DST and UDDS conditions, multiple sensor-bias levels, and different temperatures. The proposed method is also compared with existing Kalman-filter-based estimators and representative bias-compensation methods, including UBE and NiKF, demonstrating its competitive estimation accuracy under the investigated operating conditions.
The structure of this paper is organized as follows: Section 2 describes the SC models and analyzes the impact of sensor errors and noise on SOC estimation. Section 3 presents the working principle of the developed method. Section 4 presents the platform setup and testing procedures. Section 5 performs the verification and analyzes the results. Section 6 summarizes conclusions.
2. SC Modeling and Error Analysis
2.1. Equivalent Circuit Model of the SC
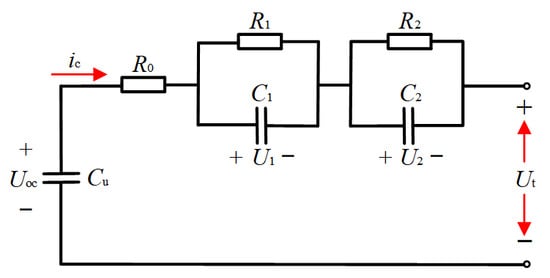
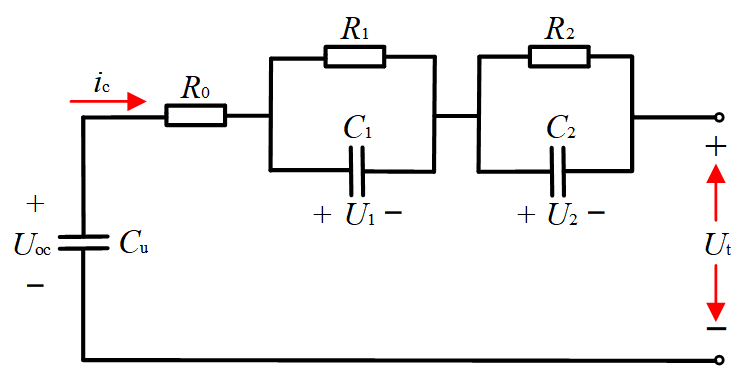
SCs exhibit internal phenomena such as polarization and relaxation effects. To describe their dynamic electrical characteristics, equivalent circuit models (ECMs) are commonly employed. Different ECM structures have been investigated to balance model fidelity and computational complexity [32]. In this study, a second-order RC ECM is adopted to represent the terminal voltage dynamics of the SC, as illustrated in Figure 1.
Figure 1.
Second-order RC equivalent circuit model of the SC.
Here, UOC denotes the OCV; Ut is the terminal voltage; Cu denotes the equivalent capacitance; R0 represents the equivalent series resistance; R1, C1 and R2, C2 represent the resistance and capacitance of the two RC branches; and Ic denotes the discharge current.
Based on Kirchhoff’s laws, the voltage relationship of the ECM is given by:
SOC is defined as the ratio of the remaining available capacity to the total capacity. Based on the AHI method, SOC can be calculated by integrating the current over time, and its expression is given by:
where η represents the Coulombic efficiency, typically set to 1; CN denotes the rated capacity.
By combining the voltage–current relationship of the ECM with the definition of SOC, the state-space equations can be expressed as:
where SOCk represents SOC at time step k; Uoc,k represents the OCV at time step k; wk and vk respectively represent process and observation noise.
Ut,k = Uoc,k − U1,k − U2,k − ikR0,k + vk,
OCV can be expressed as a polynomial function of SOC:
Uoc(SOC) = A0 + A1SOC + A2SOC2+…+AnSOCn.
2.2. Analysis of SOC Estimation Errors
Under real conditions, the measurement value contains ideal value and error:
where Uk and Ik denote the measured terminal voltage and current, respectively; Ut,k and Ireal,k denote their corresponding true values; and ΔU and ΔI represent the voltage and current sensor biases.
To facilitate subsequent analysis, the OCV-SOC relationship is locally linearized:
where denotes the local slope of the OCV-SOC curve evaluated at SOCk.
Uoc(SOC) ≈ ak ⋅ SOC + bk,
The output equation that contains measurement errors can be expressed as follows:
Since the proposed framework employs the EKF and its adaptive variants, the following analysis of SOC estimation error propagation is based on the general EKF prediction and measurement-update structure [33]. The SOC update equation is derived from the first component of the EKF state-update equation:
where KSOC,k denotes the SOC-related element of the Kalman gain vector, i.e., the first element corresponding to the SOC state, and indicates the a priori predicted value of SOC.
The a priori SOC prediction is given by:
The corresponding a priori voltage prediction is:
The SOC estimation error is:
where SOCk denotes the reference SOC and denotes the posterior SOC estimate.
For analytical simplicity, the direct contribution of current sensor bias to the voltage innovation through the ohmic resistance is neglected, while its accumulated effect through SOC prediction is retained. Combining Equations (10)–(13), it can be derived that:
The expectation of the estimation error can be expressed in the following recursive form:
where
where E1,k denotes the initial estimation error; E2,k and E3,k denote the cumulative impact of process and measurement noise, respectively; E4,k and E5,k denote the steady-state deviations induced by the voltage and current measurement bias.
E[ek] = E1,k + E2,k + E3,k + E4,k + E5,k,
When the system satisfies the stability condition, |1 − aiKSOC,i| ≤ ρ < 1, the contribution of the initial estimation error asymptotically vanishes:
Under the standard zero-mean noise assumption, E[wi−1] = 0 and E[vi] = 0. Therefore, within the adopted local linearized error model, the process and measurement noise do not introduce systematic bias into the mean SOC estimation error:
E2,k = 0,
E3,k = 0.
In practical applications, sensors may encounter irregular noise with a non-zero mean. In such cases, E[wi−1] and E[vi] may no longer be zero, and the corresponding terms in Equations (17) and (18) can introduce persistent bias into the mean estimation error. To suppress the effects of irregular noise, it is necessary to employ adaptive algorithms or noise-correlation compensation methods.
While the effects of irregular noise can be mitigated by adaptive methods, steady-state deviations caused by the sensor biases cannot be eliminated by the algorithm itself and require the adoption of auxiliary methods to suppress their impact. For the following steady-state analysis, a local SOC interval is considered in which the OCV-SOC slope varies slowly and can be approximated as a constant. After filter convergence, the SOC-related Kalman gain is also assumed to approach a constant value. Therefore, KSOC,i ≈ KSOC, ai ≈ a. The steady-state deviations are given by:
As shown in the derived formulas, the steady-state SOC error induced by voltage bias is inversely proportional to a. As indicated by Equations (25) and (26), the voltage-bias-induced error is directly related to the inverse of the local OCV-SOC slope, whereas the contribution of current bias additionally depends on the sampling interval, nominal capacity, and Kalman gain. Therefore, the relative influence of the two sensor biases depends on the specific operating conditions and system parameters. Under the bias amplitudes and test duration considered in this study, the voltage-bias-induced error is more pronounced, as will be further verified experimentally. Therefore, the subsequent discussion focuses primarily on suppressing the steady-state deviation caused by voltage measurement bias.
Similarly, when the stability condition, |1 − aKSOC| < 1, is satisfied and the time horizon is sufficiently long, the geometric term vanishes, the steady-state mean estimation error is obtained as:
Theoretical analysis indicates that sensor-induced errors lead to inherent steady-state bias in SOC estimation, which cannot be eliminated solely through parameter optimization, such as tuning the Kalman gain. Furthermore, qualitative analysis reveals that voltage errors exert a more significant impact on estimation accuracy than current errors. Specifically, under voltage-bias-dominant conditions, the magnitude of the steady-state SOC estimation error is inversely related to the magnitude of the local OCV-SOC slope.
3. State Estimation Algorithm
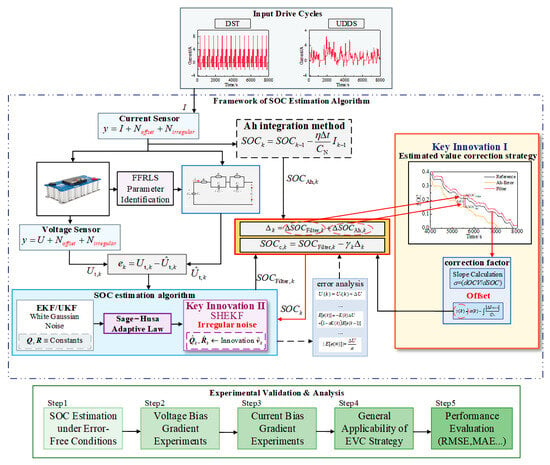
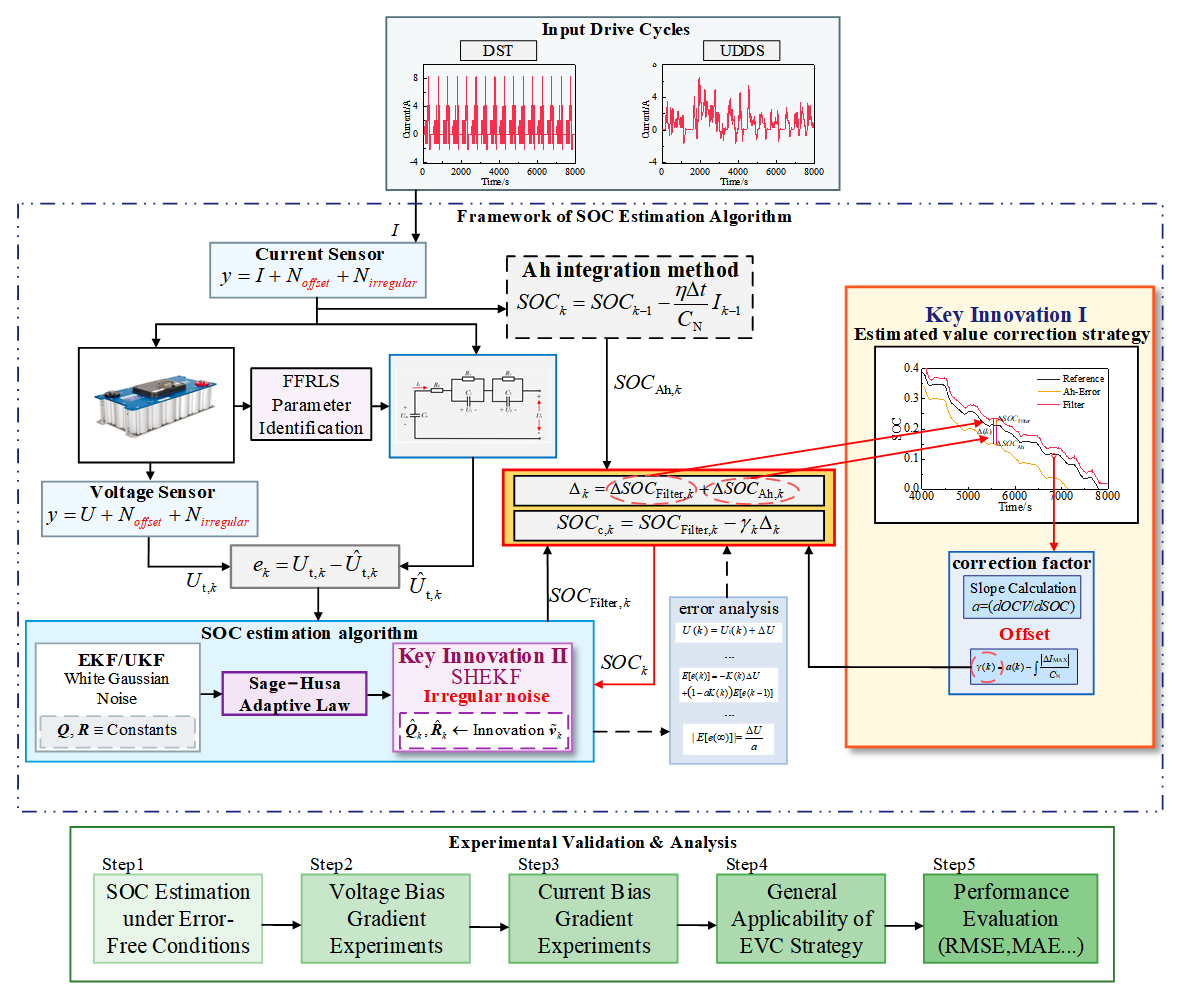
To improve the accuracy of SOC estimation, the Sage–Husa noise adaptive mechanism is first integrated into EKF, so that irregular noise can be suppressed. Secondly, by introducing an AHI reference correction mechanism based on voltage slope weighting, it fundamentally compensates for the inherent deviation caused by sensor errors. The flowchart of the SOC estimation algorithm proposed in this paper is shown in Figure 2.
Figure 2.
Flowchart of SOC estimation algorithm.
3.1. FFRLS-EKF Algorithm
3.1.1. Parameter Identification Using FFRLS
To account for variations in the electrical parameters of the SC model, an online parameter identification method based on forgetting factor recursive least squares (FFRLS) is employed. By introducing a forgetting factor, FFRLS reduces the influence of older observations and assigns greater relative weight to recent measurements, thereby improving its ability to track parameter variations. Related studies have investigated adaptive forgetting factor recursive least squares for equivalent circuit parameter identification [23] and its integration with Kalman-filter-based SOC estimation methods [24,25]. In this study, the forgetting factor is set to 0.99, and the recursive identification procedure is implemented as follows:
- Gain vector calculation
- 2.
- Output error computation
- 3.
- Parameter update
θk = θk−1 + Kθ,kδk,
- 4.
- Covariance matrix update
3.1.2. EKF-Based State Estimation
Kalman-filter-based approaches have also been investigated for SC SOC estimation [34]. In this study, the EKF is employed to account for the nonlinear relationship between OCV and SOC, and its recursive estimation procedure is summarized below.
Time update
- A Priori state estimate:
- 2.
- A Priori covariance:
Measurement update
- Kalman gain:
- 2.
- Posteriori state:
- 3.
- Posteriori covariance:
3.2. Sage–Husa Noise Adaptive Mechanism
To enhance robustness under non-Gaussian and irregular noise conditions, SHEKF is incorporated to adaptively improve the noise adaptability of the algorithm. The Sage–Husa method dynamically estimates the characteristics of noise, thereby optimizing the noise model and enhancing estimation accuracy for systems with unknown or time-varying noise characteristics. The Sage–Husa formulation yields the following equations for updating noise parameters:
where c is the forgetting factor, which controls the weighting of new data. A larger value of c assigns greater weight to previous estimates, resulting in smoother but slower adaptation, whereas a smaller value increases the contribution of recent observations and enables faster adaptation to changing noise characteristics. In this study, c is selected within the range of 0.95–0.99. ε denotes the innovation sequence, and q and r represent the estimated means of process and measurement noise, respectively.
3.3. Estimated Value Correction (EVC) Based on OCV-SOC Slope
While adaptive filtering methods can mitigate the impact of irregular noise to some extent, it remains inherently limited. Specifically, state estimation based on the EKF is highly reliant on voltage measurements. Based on the aforementioned analysis, any constant sensor bias or voltage measurement error will lead to persistent estimation biases that the algorithm cannot eliminate on its own.
Therefore, an estimated value correction strategy is proposed by utilizing the AHI method as an online reference. The core of this strategy lies in the complementarity of the two methods: the filters are excellent at tracking dynamic system changes but highly sensitive to voltage measurement bias; the AHI method provides a smooth SOC trend because it is entirely independent of voltage measurements. By initializing both the filter and AHI with the same accurate SOC, derived from OCV-based estimation or recorded data, the AHI result can be used as an auxiliary variable to indirectly reconstruct the reference needed by filter.
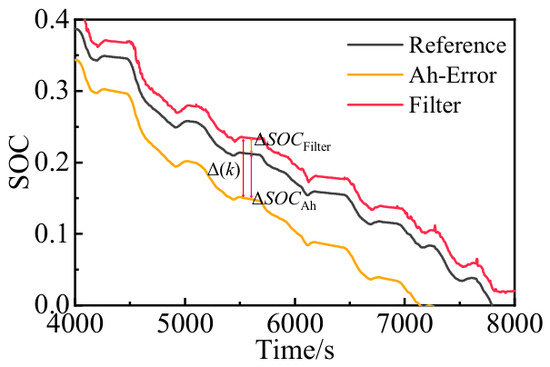
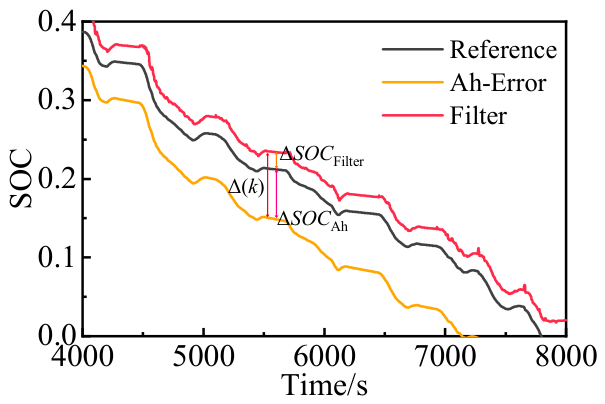
Figure 3 presents the procedure used to obtain the correction values.
Figure 3.
Construction of the EVC discrepancy signal.
Figure 3 schematically illustrates the relationship among the reference SOC, the AHI estimate, and the filter estimate; it is used to explain the construction of the correction discrepancy rather than represent a specific experimental trajectory.
Since the true SOC is unavailable during online estimation, the filter error cannot be obtained directly from an exact reference. Therefore, the reference required for filter error estimation is constructed indirectly with the aid of the AHI result. The core idea is to use the available filter estimate and AHI result to indirectly infer the filter error. The difference between the filter estimate and the AHI result at each time step k is:
where SOCAh,k denotes the value from AHI, and SOCFilter,k denotes the estimation results of the filters. The discrepancy Δk is directly available during online estimation and does not require knowledge of the true SOC.
Δk = SOCFilter,k − SOCAh,k,
This difference represents a combination of the filter’s deviation from the true SOC and AHI’s own integration drift:
where ΔSOCAh,k and ΔSOCFilter,k represent the estimation deviations of the AHI and EKF methods respectively.
Δk = (SOCFilter,k − SOCk) − (SOCAh,k − SOCk)=ΔSOCFilter,k−ΔSOCAh,k,
Based on the reconstructed filter error, a correction factor γ is introduced to adjust the correction amount, and the corrected SOC is obtained as:
where γ is the correction gain used to regulate the contribution of the discrepancy signal.
SOCc,k = SOCFilter,k − γkΔk,
The final corrected SOC is fed back into the filter’s state vector. This feedback mechanism initializes the subsequent state prediction with a corrected value, effectively suppressing the filter’s tendency to deviate due to sensor bias and ensuring a smooth, convergent estimation.
According to the error propagation analysis in Section 2.2, when voltage bias dominates the steady-state estimation error, the magnitude of the SOC bias is approximately inversely related to the magnitude of the local OCV-SOC slope, as expressed in Equation (28). This relationship provides a physics-based basis for determining the relative correction strength. Therefore, the correction gain is modulated according to the local OCV-SOC slope as follows:
where ak denotes the local OCV-SOC slope at time step k, aref denotes the average slope over the considered SOC interval, and γ0 is the nominal correction gain. The ratio aref/|ak| is dimensionless and preserves the inverse relationship between voltage-bias sensitivity and the local OCV-SOC slope. Thus, a smaller local slope results in a relatively larger correction gain.
For the SC module investigated in this study, the experimentally identified OCV–SOC relationship exhibits only limited variation in its local slope over the considered SOC range. Therefore, the normalized slope-weighting term introduces relatively small variations in the correction gain. Nevertheless, this weighting mechanism provides a physical basis for adjusting the correction strength according to the sensitivity of SOC estimation to voltage measurement bias.
It should be noted that the inverse relationship between the voltage-bias-induced SOC error and the local OCV–SOC slope provides a theoretical basis for relative gain modulation but does not uniquely determine the magnitude of the nominal correction gain. The nominal gain γ0 determines the overall correction strength and must therefore be evaluated separately. In this study, γ0 = 0.021 is selected based on the parameter sensitivity analysis presented in Section 5.4. The results indicate that this setting achieves the lowest RMSE among the tested gain values for all three EVC-based filtering algorithms. Furthermore, the estimation error increases when the gain deviates substantially from this value, demonstrating the importance of an appropriate correction strength.
4. Experimental Setup and Data Acquisition
4.1. SC Test Platform
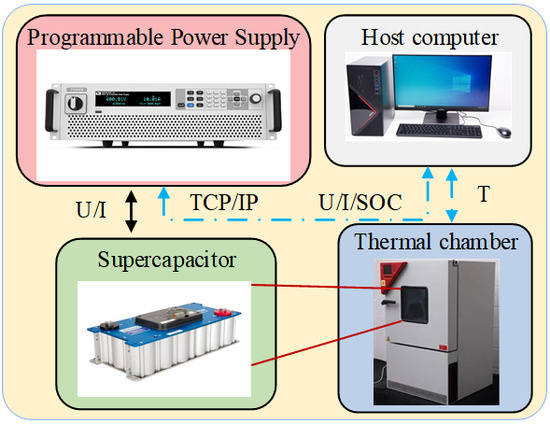
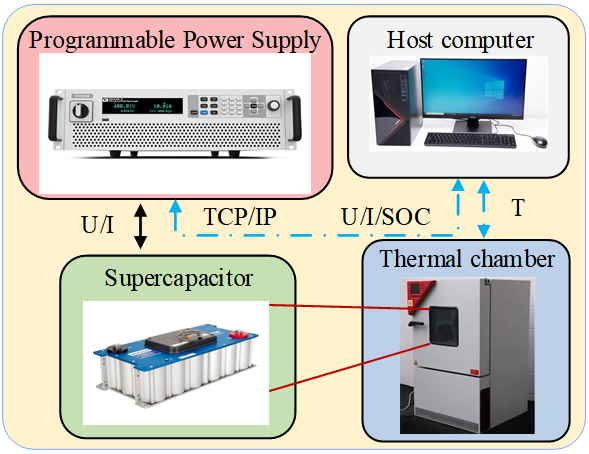
An experimental platform is developed for SC characteristic testing and the verification of SOC estimation algorithms. The platform consists of a programmable power supply (IT6005C-80-150), a thermal chamber (Binder MK 53), an SC module to be tested, and a host computer for data acquisition and control. The programmable power supply executes precision charging/discharging profiles, while the thermal chamber maintains a stable temperature environment to ensure the consistency of experimental conditions. The upper computer serves as the control hub, synchronized with the power supply to perform real-time data acquisition of voltage, current, and temperature. Figure 4 represents the physical configuration of the experimental arrangement. The SC module selected for this study is the BMOD0165 P048 C0B, and its key parameters are summarized in Table 1.
Figure 4.
The experimental test platform.
Table 1.
Critical parameters of the SC.
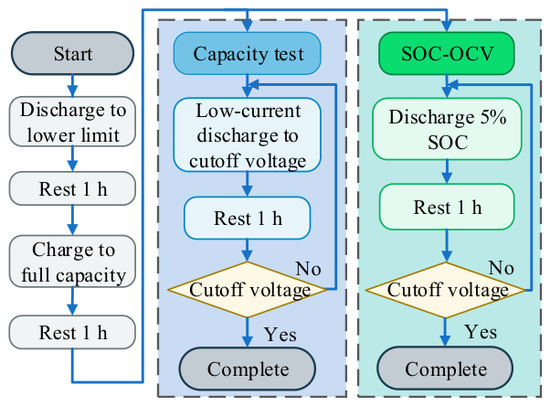
Since this study focuses on the effects of measurement errors, the nominal capacity is assumed to be accurate. Accordingly, a capacity test and OCV characterization were performed prior to algorithm validation. The overall testing procedure is shown in Figure 5.
Figure 5.
Flowchart of SC test.
4.1.1. Capacity Test
During the initialization stage, the SC module was first discharged to the specified lower cut-off voltage. After a sufficient rest period, it was charged to the fully charged state using constant-current and constant-voltage charging, followed by a one-hour rest. The SC module was then discharged at a low constant current to the lower cut-off voltage and allowed to rest for one hour to reduce the influence of polarization. The discharge–rest procedure was repeated until the SC voltage stabilized near the lower cut-off voltage. The total discharged energy was determined by summing the energy delivered during each discharge stage. Three tests were conducted under the same conditions, yielding measured energy values of 53.70 Wh, 53.68 Wh, and 53.67 Wh, respectively. Their average, 53.68 Wh, was used as the measured available energy of the SC module in this study.
4.1.2. SOC-OCV Curve Identification
After initialization, the SC module was discharged at a low current in successive steps corresponding to approximately 5% SOC intervals. Following each discharge step, the module was allowed to rest for one hour, after which the terminal voltage was recorded as the corresponding OCV measurement. This discharge–rest–measurement procedure was repeated until the lower cut-off voltage was reached. Three sets of experimental data were obtained and averaged to construct the OCV–SOC relationship. Polynomial functions of different orders were evaluated, and a second-order polynomial was selected to balance fitting accuracy and model simplicity. The resulting fitting RMSE was 0.04 V, and the identified OCV–SOC relationship is expressed as follows:
Uoc = −0.1762SOC2 + 48.3145SOC + 0.2144.
4.2. Analysis of SC Measurement Errors
In practical SC energy storage systems, voltage and current measurements may be affected by sensor inaccuracies, signal-conditioning circuits, and calibration errors. Voltage acquisition typically requires measurement devices with appropriate voltage ranges and, when necessary, additional signal-conditioning circuits. Current measurements may similarly be affected by sensor offset, gain errors, and other measurement uncertainties. Consequently, persistent voltage and current measurement biases can arise in practical acquisition systems and influence SOC estimation accuracy. To investigate their effects, controlled measurement biases are introduced in the subsequent experiments, allowing the estimation performance of different algorithms to be evaluated under specified voltage and current error conditions.
5. Experimental Validation and Analysis of Results
5.1. SOC Estimation Under Error-Free Conditions
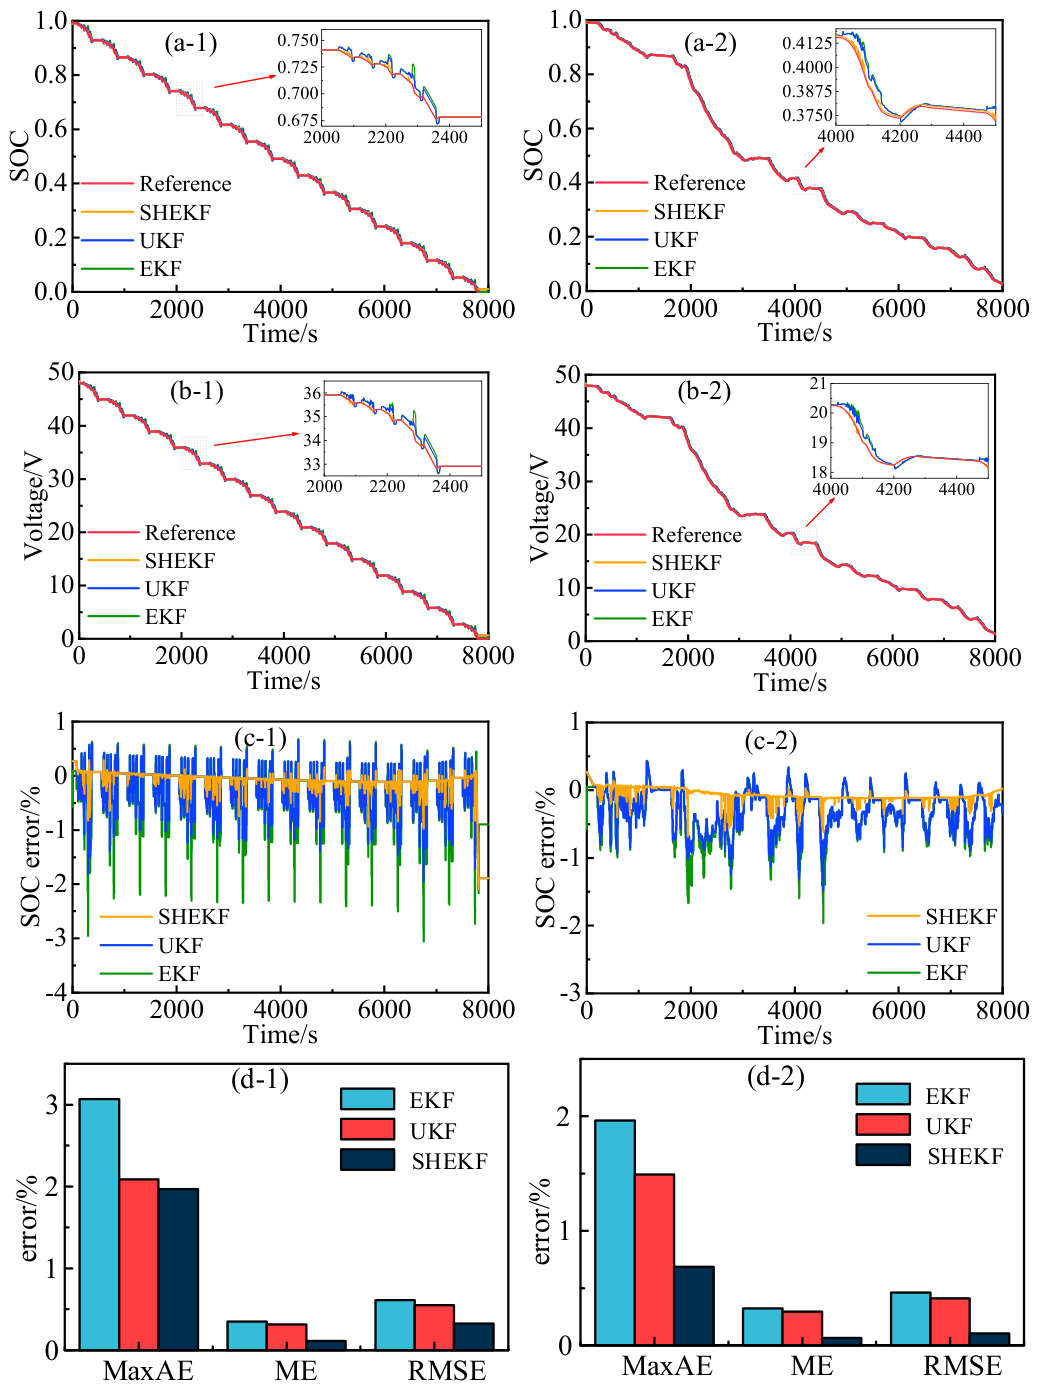
To verify the fundamental state estimation capabilities of the algorithms, experiments were conducted using a dynamic stress test (DST) and urban dynamometer driving schedule (UDDS). For all test scenarios, the initial SOC was set to 1, and the temperature was maintained at 25 °C. To ensure a fair comparison, the initial parameters for the algorithms, including the process and measurement noise covariance matrix, were individually optimized through empirical tuning to ensure that each algorithm performs at its respective best. The comparative results of the SOC estimation under these error-free conditions are shown in Figure 6. Rows (a)–(c) show the SOC trajectory, terminal voltage, and SOC estimation error, respectively, while row (d) summarizes the statistical metrics, Columns (1) and (2) correspond to the DST and UDDS driving cycles. According to the statistical results shown in Figure 6, under the UDDS condition, the maximum absolute error (MaxAE), mean error (ME), and root mean square error (RMSE) of EKF are 1.87%, 0.31%, and 0.48%, respectively, while the corresponding values of UKF are 1.46%, 0.29%, and 0.41%. For the proposed SHEKF, the MaxAE, ME, and RMSE are 0.63%, 0.08%, and 0.14%, respectively. It can be observed that the SHEKF achieves the smallest MaxAE, ME, and RMSE among the three algorithms. A similar trend can also be observed under the DST condition. These results indicate that the proposed method provides higher SOC estimation accuracy than the EKF and UKF under dynamic operating conditions. In addition, all three algorithms are able to accomplish SOC estimation, which also demonstrates that the SC model is capable of supporting state estimation.
Figure 6.
SOC estimation results under error-free conditions. Rows (a-1,a-2,b-1,b-2,c-1,c-2) present the SOC trajectory, voltage, and SOC estimation error, respectively, while row (d-1,d-2) presents the statistical error metrics (MaxAE, ME, and RMSE). Columns (1) and (2) correspond to the DST and UDDS driving cycles.
5.2. Sensor Bias Gradient Experiments
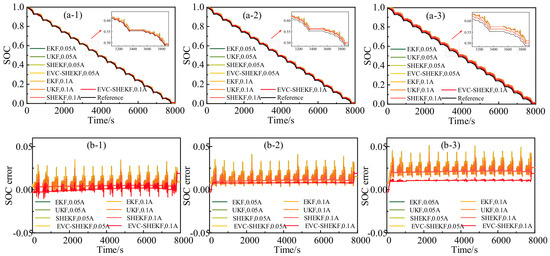
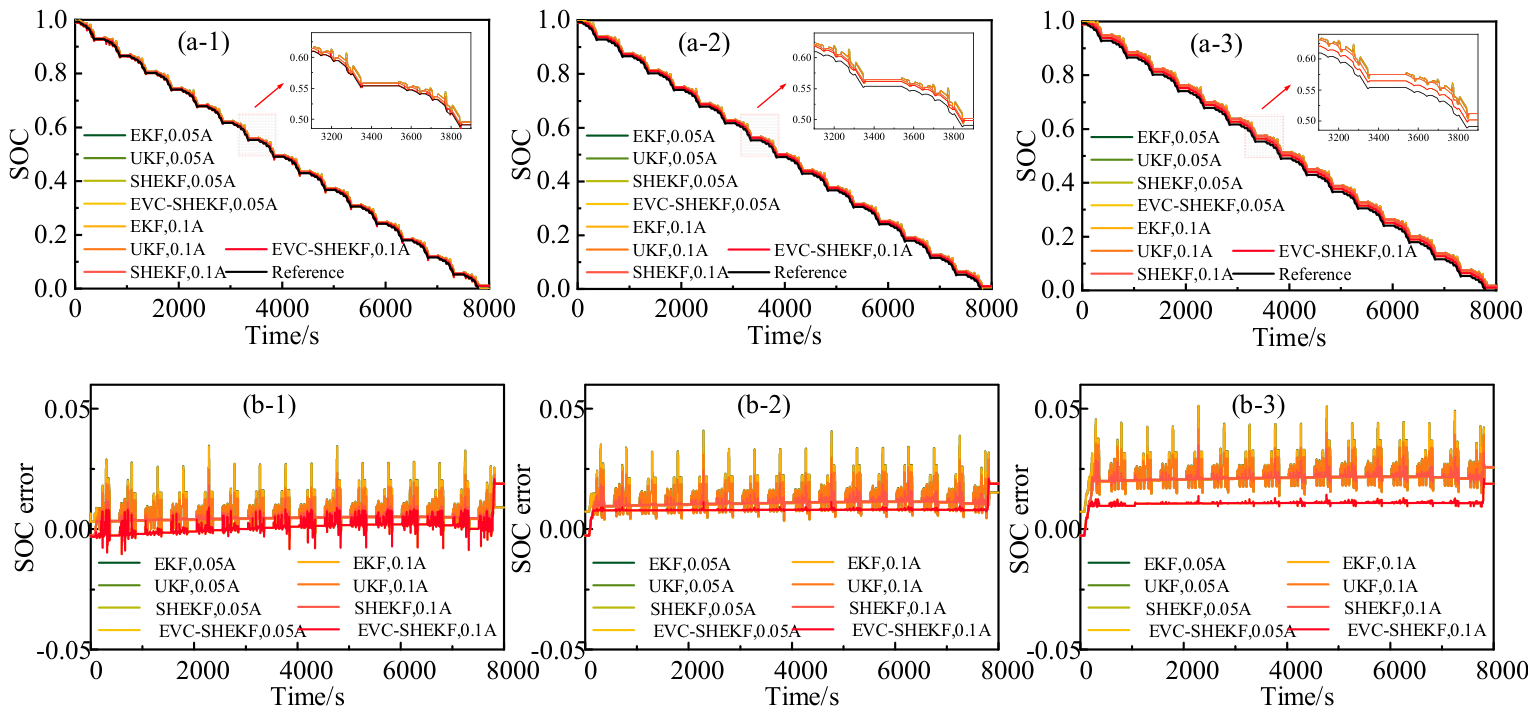
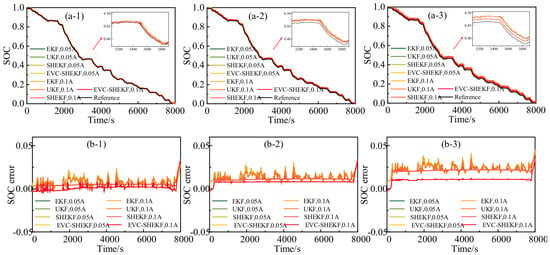
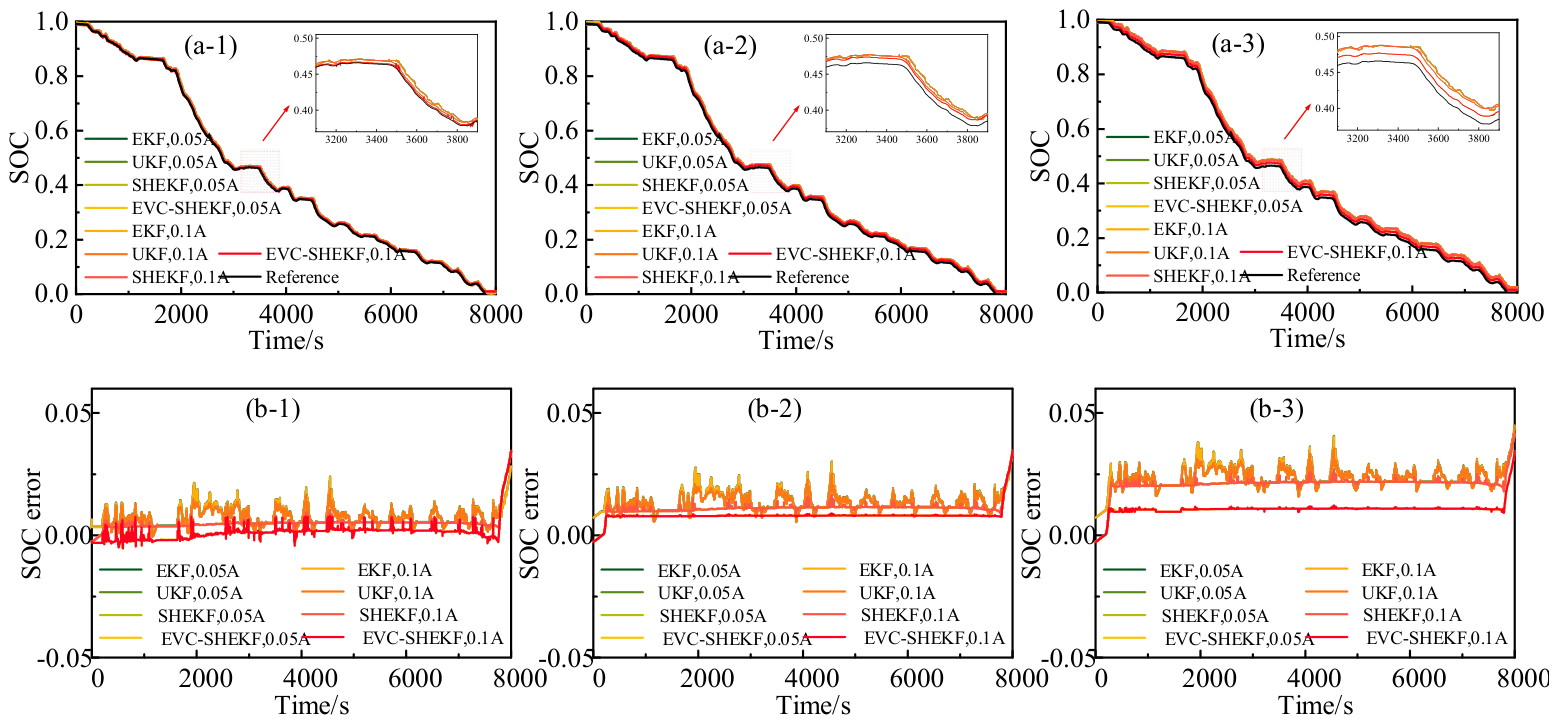
To further investigate the influence of coupled sensor biases on estimation stability, coupled bias gradient experiments are conducted across the DST and UDDS. The experiments are designed by fixing the voltage bias at three levels, 0.2 V, 0.5 V, and 1 V, while varying the current biases between 0.05 A and 0.1 A. This setup aims to verify the theoretical analysis regarding the algorithms’ sensitivity to different errors and to evaluate the effectiveness of the EVC mechanism. The results under these coupled bias conditions are shown in Figure 7 and Figure 8. For each figure, the subplots are organized as follows: (a-1), (a-2), and (a-3) show the SOC estimating performance under the three voltage-bias conditions, respectively; (b-1), (b-2), and (b-3) show the SOC error fluctuations for the corresponding voltage bias levels. The quantitative performance of the four algorithms is summarized in Table 2 and Table 3.
Figure 7.
SOC estimation results under DST condition with bias gradient. Row (a-1–a-3) shows the SOC estimation curves, and row (b-1–b-3) presents the corresponding SOC errors. Columns (1)–(3) correspond to voltage biases of 0.2 V, 0.5 V, and 1 V, respectively.
Figure 8.
SOC estimation results under UDDS condition with bias gradient. Row (a-1–a-3) shows the SOC estimation curves, and row (b-1–b-3) presents the corresponding SOC errors. Columns (1)–(3) correspond to voltage biases of 0.2 V, 0.5 V, and 1 V, respectively.
Table 2.
Statistical analysis of SOC estimation under DST with different sensor biases.
Table 3.
Statistical analysis of SOC estimation under UDDS with different sensor biases.
For the DST condition, the SOC estimation results and corresponding SOC error curves are shown in Figure 7, and the quantitative results are listed in Table 2. As shown in Table 2, under the bias condition of 0.05 A and 0.2 V, the RMSEs of SOC based on EKF, UKF, SHEKF, and EVC-SHEKF are 0.90%, 0.83%, 0.58%, and 0.39%, respectively, while the corresponding MEs are 0.75%, 0.71%, 0.52%, and 0.15%. When the current bias increases from 0.05 A to 0.1 A at the same voltage bias of 0.2 V, the corresponding RMSEs become 0.89%, 0.82%, 0.58%, and 0.39%, respectively, indicating only slight changes. By contrast, when the voltage bias increases from 0.2 V to 0.5 V at a fixed current bias of 0.05 A, the RMSE of EKF increases from 0.90% to 1.46%, while UKF increases from 0.83% to 1.37%. The RMSE of SHEKF also rises from 0.58% to 1.13%, whereas the corresponding RMSE of EVC-SHEKF rises from 0.39% to 0.84%. Similar variation can also be observed in the ME results shown in Table 2. These results indicate that, under the tested bias amplitudes and test duration, the SOC estimation error is more sensitive to voltage bias than to the variation in current bias. Meanwhile, among the four algorithms, EVC-SHEKF consistently achieves the smallest error indices, which demonstrates that the EVC mechanism can effectively suppress estimation deviation under coupled sensor bias conditions.
For the UDDS condition, the SOC estimation results and SOC error curves are shown in Figure 8, and the quantitative results are listed in Table 3. As shown in Table 3, under the bias condition of 0.05 A and 0.2 V, the RMSEs of EKF, UKF, SHEKF, and EVC-SHEKF are 0.85%, 0.84%, 0.61%, and 0.44%, respectively, while the corresponding MEs are 0.76%, 0.73%, 0.51%, and 0.15%. When the current bias increases to 0.1 A while the voltage bias remains 0.2 V, the RMSEs change to 0.84%, 0.84%, 0.61%, and 0.44%, respectively, which shows that under the considered bias amplitudes and test duration, the variation in current bias produces only limited changes, whereas increasing voltage bias causes a more pronounced estimation deterioration. However, when the voltage bias increases from 0.2 V to 1 V at a fixed current bias of 0.05 A, the RMSEs of EKF, UKF, SHEKF, and EVC-SHEKF increase from 0.85%, 0.84%, 0.61%, and 0.44% to 2.42%, 2.38%, 2.14%, and 1.11%, respectively. It can be seen that the UDDS condition presents the same trend as the DST condition, namely that voltage bias causes more severe estimation deterioration than current bias, and the EVC-SHEKF always provides the best estimation performance among the four algorithms. Therefore, the experimental results further verify the previous theoretical analysis and confirm that the proposed EVC mechanism can significantly improve estimation robustness and dynamic response capability under complex operating conditions.
5.3. Applicability of the EVC Strategy to Kalman-Filter-Based Estimators
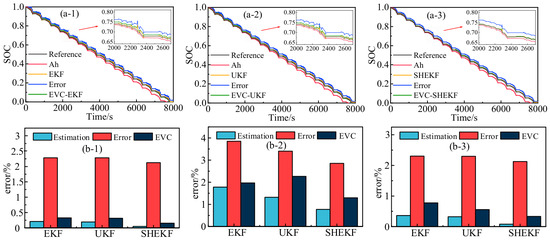
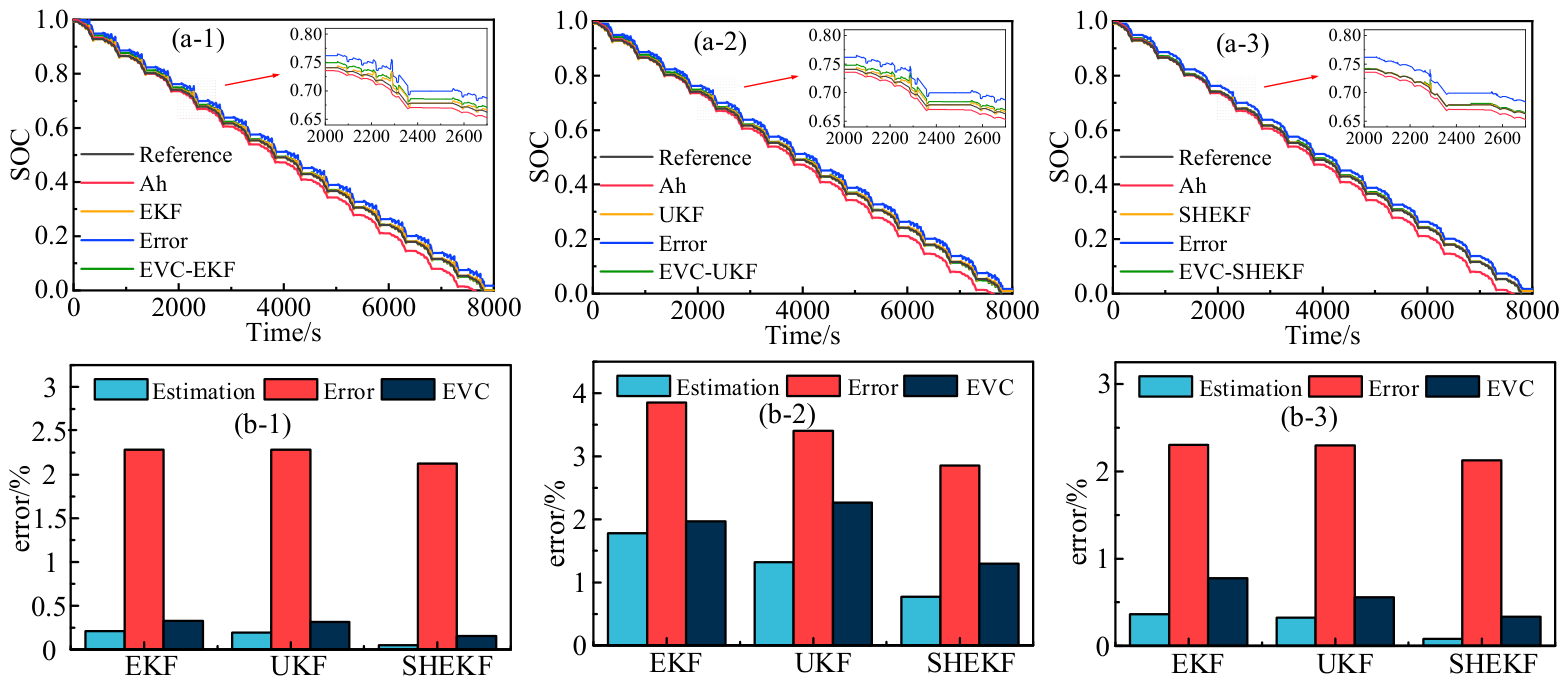
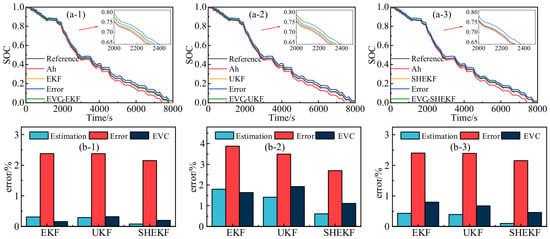
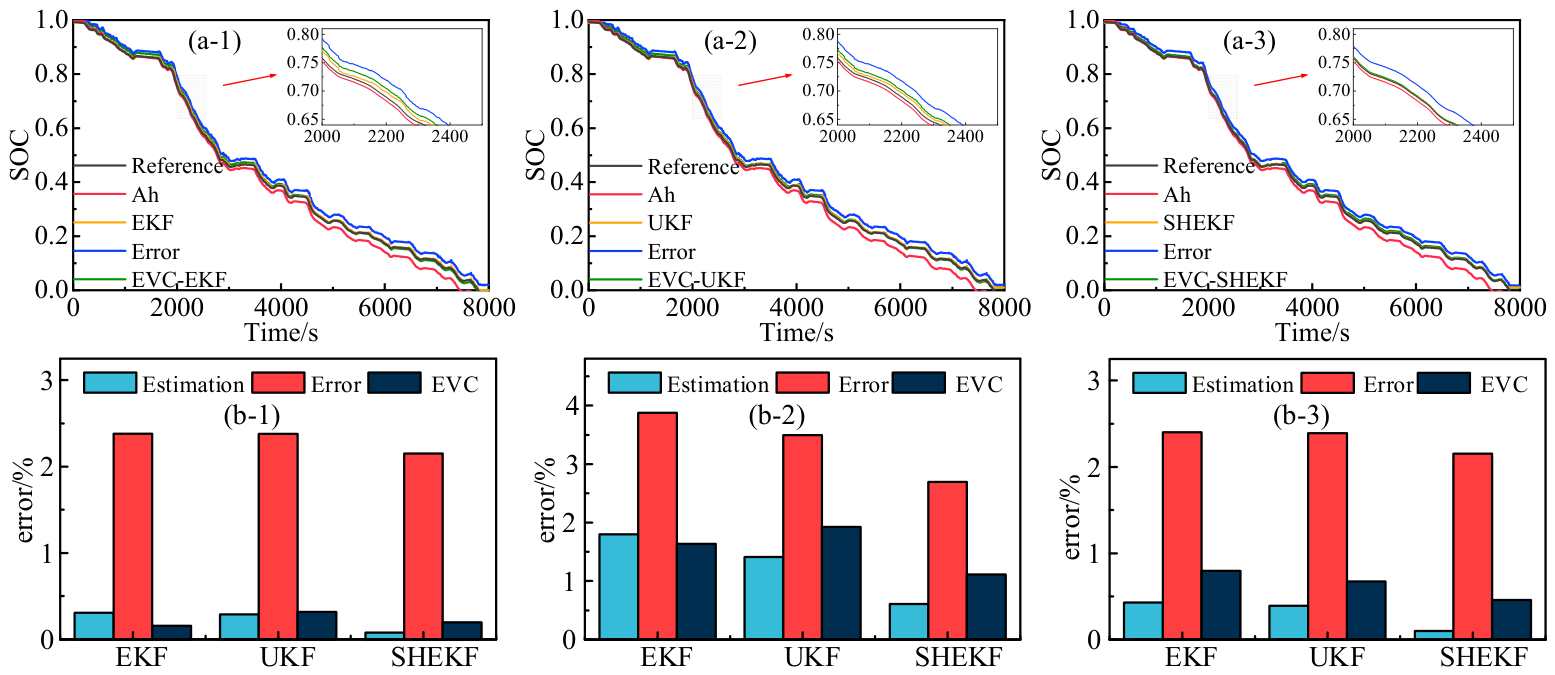
To evaluate the compatibility of the EVC strategy with different Kalman-filter-based estimators, the correction mechanism is further incorporated into EKF, UKF, and SHEKF. Experiments are conducted using the DST and UDDS, with sensor biases introduced to simulate real disturbances. The comprehensive results are shown in Figure 9 (DST) and Figure 10 (UDDS). In each figure, (a-1), (a-2), and (a-3) show the SOC curves for the EKF, UKF, and SHEKF algorithms, respectively. Each plot compares five curves: the reference SOC, the filter output without error, the uncorrected filter output under error, the results of the AHI, and the SOC estimated by the EVC method; (b-1), (b-2), and (b-3) present the quantitative error analysis in terms of MaxAE, ME, and RMSE, respectively.
Figure 9.
SOC estimation results of the EVC strategy under DST conditions. Row (a-1–a-3) shows the SOC trajectories from EKF, UKF, and SHEKF, respectively. Row (b-1–b-3) presents the corresponding statistical error metrics, including MaxAE, ME, and RMSE.
Figure 10.
SOC estimation results of the EVC strategy under UDDS conditions. Row (a-1–a-3) shows the SOC trajectories from EKF, UKF, and SHEKF, respectively. Row (b-1–b-3) presents the corresponding statistical error metrics, including MaxAE, ME, and RMSE.
For the DST condition, the experimental results are shown in Figure 9. After the introduction of the EVC mechanism, the SOC estimation curves of EKF, UKF, and SHEKF all move closer to the reference SOC, and the deviation caused by sensor bias is significantly reduced. After applying the EVC strategy, the RMSE of SHEKF decreases from 2.36% to 0.71%. For the EKF and UKF frameworks, the error indices also decrease from 2.26% to 0.61% and from 2.07% to 0.41%, respectively. It can be observed that the EVC strategy improves the estimation performance in all three filtering frameworks under the DST condition. These results demonstrate that the EVC strategy can be effectively incorporated into the three Kalman-filter-based estimators investigated in this study.
For the UDDS condition, the corresponding results are shown in Figure 10. The corresponding statistical results show a similar trend to those under the DST condition, indicating that the EVC strategy can also effectively reduce the estimation errors of different algorithms under more complex operating conditions. Overall, the above results confirm that the proposed EVC strategy exhibits good compatibility with the tested Kalman-filter-based estimation frameworks.
5.4. Sensitivity Analysis of the Correction Gain
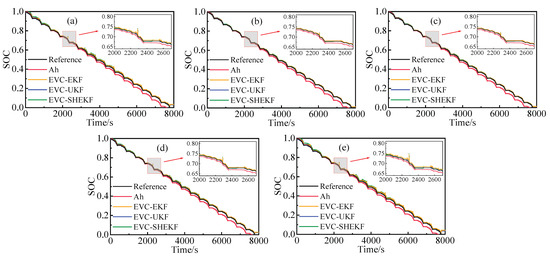
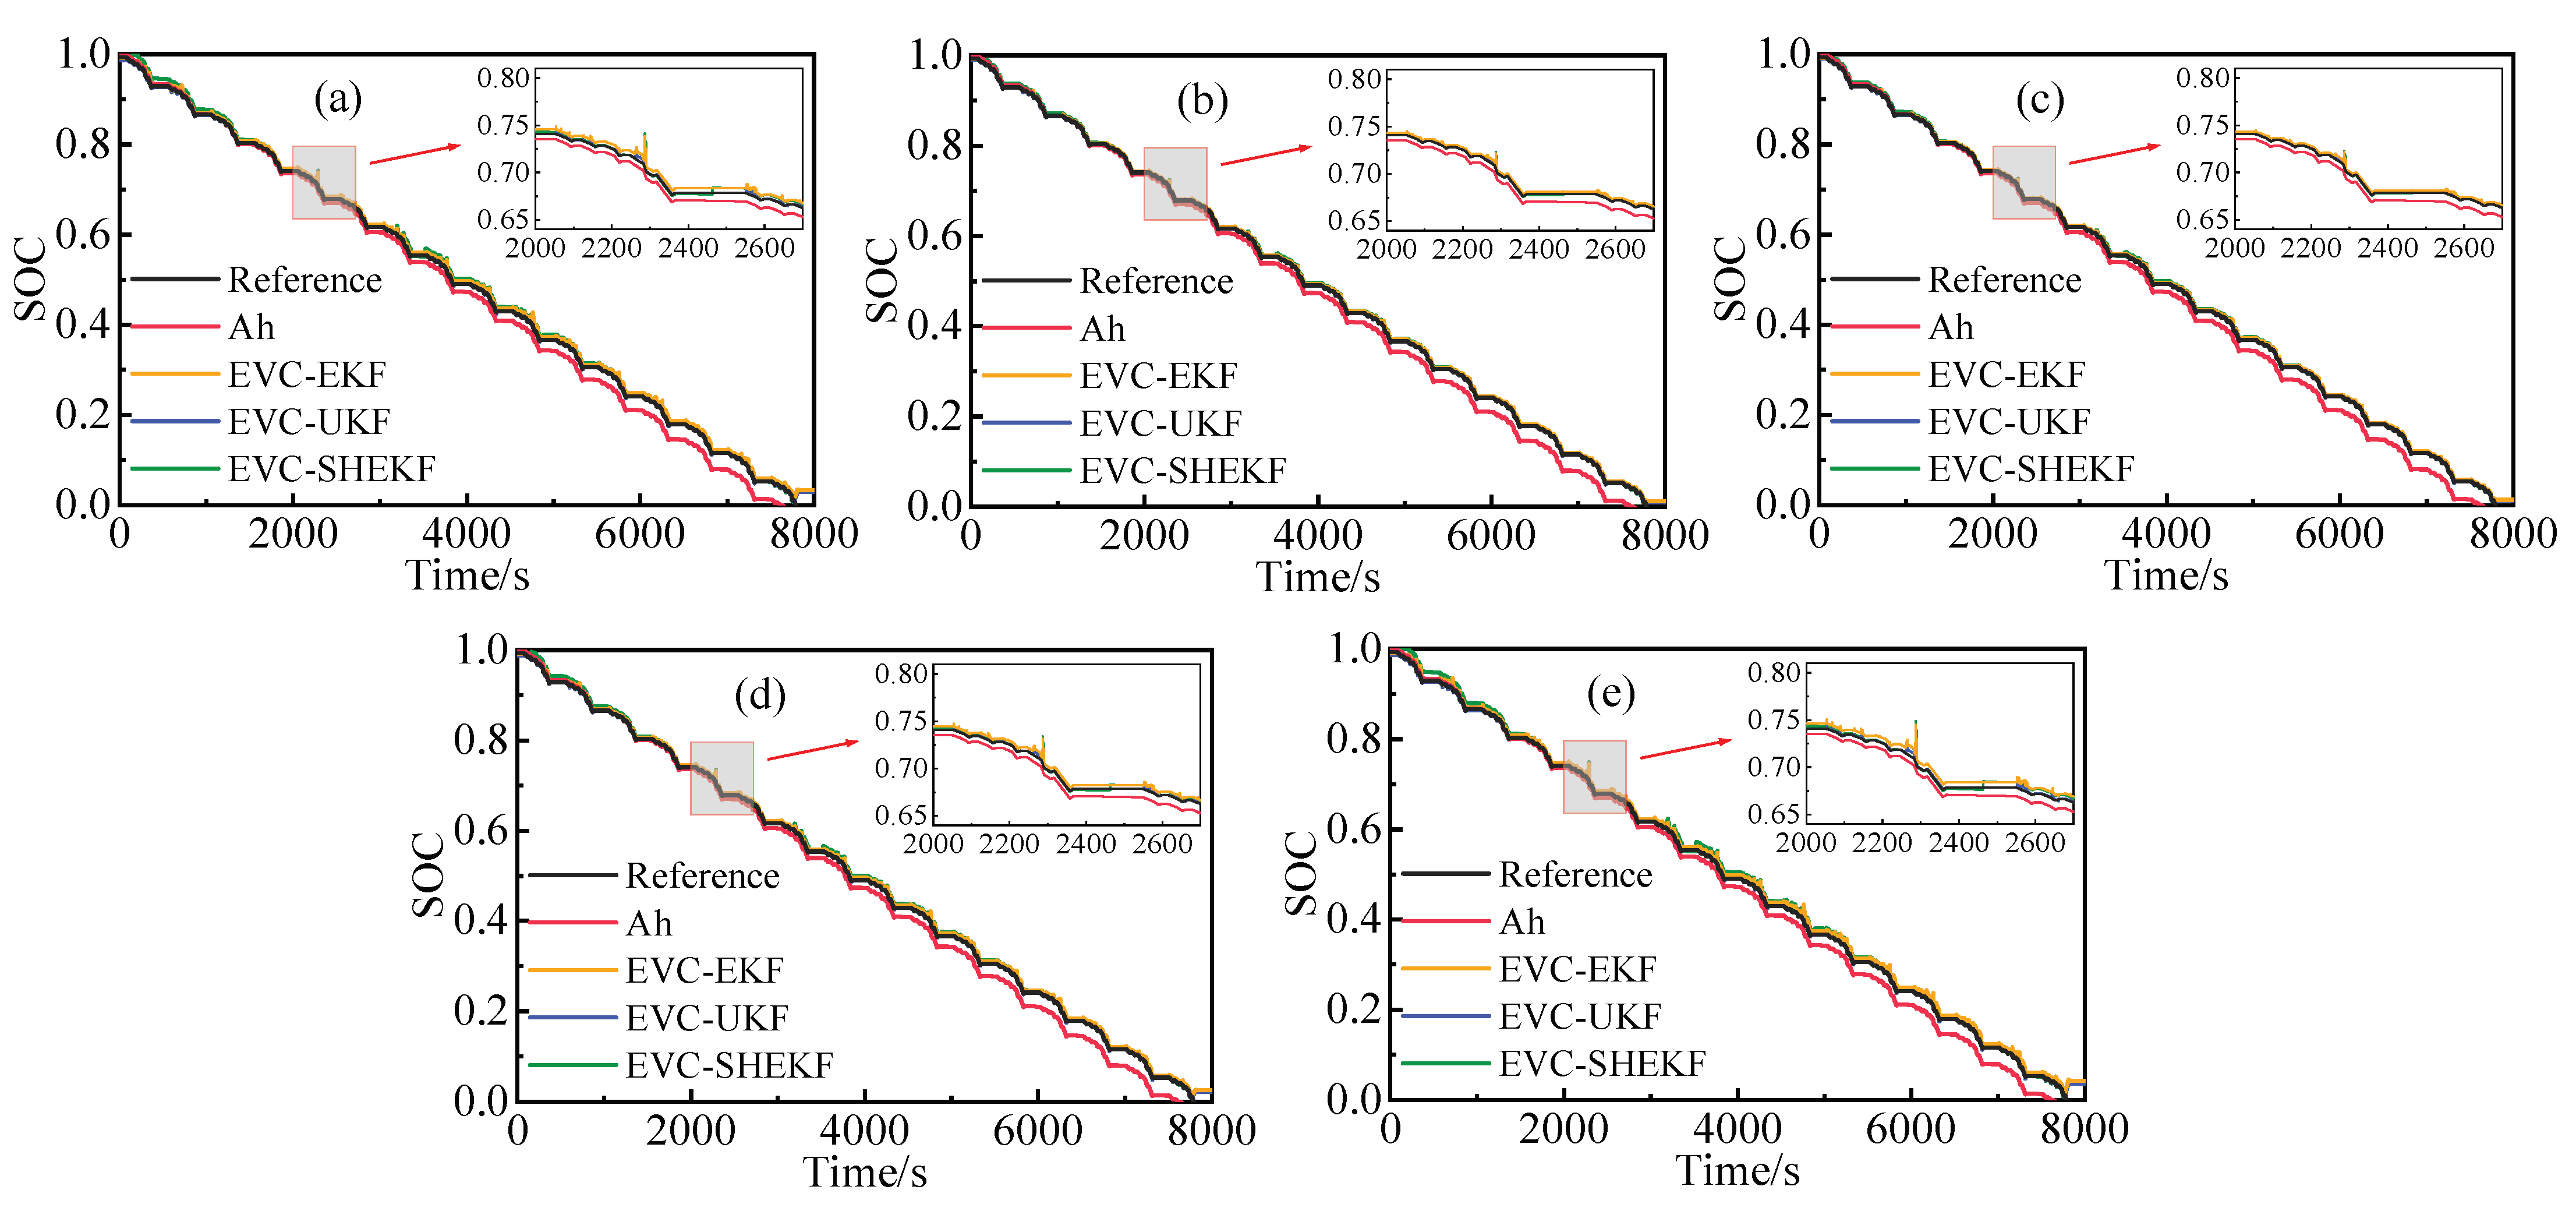
To investigate the influence of the nominal correction gain on SOC estimation accuracy, a parameter sensitivity analysis was conducted for the EVC-EKF, EVC-UKF, and EVC-SHEKF algorithms. According to Equation (43), the nominal correction gain γ0 determines the overall correction strength of the EVC strategy. Therefore, five gain values, namely 0.010, 0.020, 0.021, 0.030, and 0.040, were selected for evaluation, while the remaining algorithm parameters were kept unchanged. The estimation performance was evaluated using the mean error (ME) and root mean square error (RMSE).
Figure 11 illustrates the variation in estimation error with different nominal correction gains, while Table 4 summarizes the corresponding quantitative results.
Figure 11.
Influence of the nominal correction gain on the SOC estimation accuracy of different EVC-based algorithms: (a) γ0 = 0.010; (b) γ0 = 0.020; (c) γ0 = 0.021; (d) γ0 = 0.030; (e) γ0 = 0.040.
Table 4.
SOC estimation errors under different nominal correction gains.
As shown in Figure 11 and Table 4, the three algorithms exhibit a similar trend as the nominal correction gain increases. When γ0 increases from 0.010 to 0.021, the RMSE decreases for all three algorithms, indicating that an appropriate increase in correction strength can effectively reduce SOC estimation errors. At γ0 = 0.021, the RMSE values of EVC-EKF, EVC-UKF, and EVC-SHEKF reach 2.11%, 1.97%, and 1.09%, respectively, representing the lowest values among the tested gains.
When γ0 is further increased to 0.030 and 0.040, the estimation accuracy deteriorates. In particular, the RMSE of EVC-SHEKF increases from 1.09% at γ0 = 0.021 to 2.38% at γ0 = 0.040. This indicates that an excessively large correction gain may introduce overcorrection and amplify the influence of errors in the auxiliary AHI reference.
It is also observed that the RMSE values at γ0 = 0.020 and γ0 = 0.021 are relatively close, suggesting that favorable estimation accuracy can be achieved within a narrow gain range around 0.020. Based on these results, γ0 = 0.021 is selected as the nominal correction gain for the subsequent experiments. The sensitivity analysis demonstrates the importance of selecting an appropriate correction strength and supports the parameter setting adopted in the proposed EVC strategy.
5.5. SOC Estimation Performance at Different Temperatures
To further evaluate the applicability of the proposed EVC strategy under different temperature conditions, additional SOC estimation experiments were conducted at 10 °C, 25 °C, and 40 °C. Since temperature variations may affect the electrical characteristics of SCs, including the OCV–SOC relationship, the temperature-dependent voltage characteristics were first investigated. Following the OCV characterization procedure described in Section 4.1.2, the OCV–SOC relationships at the three temperatures were fitted using second-order polynomial functions. The corresponding fitting equations are expressed as follows:
The OCV generally increases with temperature at a given SOC, while the overall characteristics remain similar across the investigated temperature range. The relatively small quadratic coefficients indicate that the local OCV–SOC slopes exhibit limited variation within each temperature condition. Nevertheless, the differences in the fitted coefficients suggest that temperature affects the voltage characteristics of the SC module.
The corresponding temperature-dependent OCV–SOC relationships were incorporated into the state estimation algorithms. This allows the estimation performance to be evaluated under different temperature conditions while accounting for the variations in the OCV characteristics.
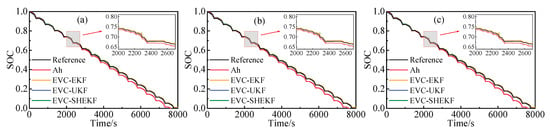
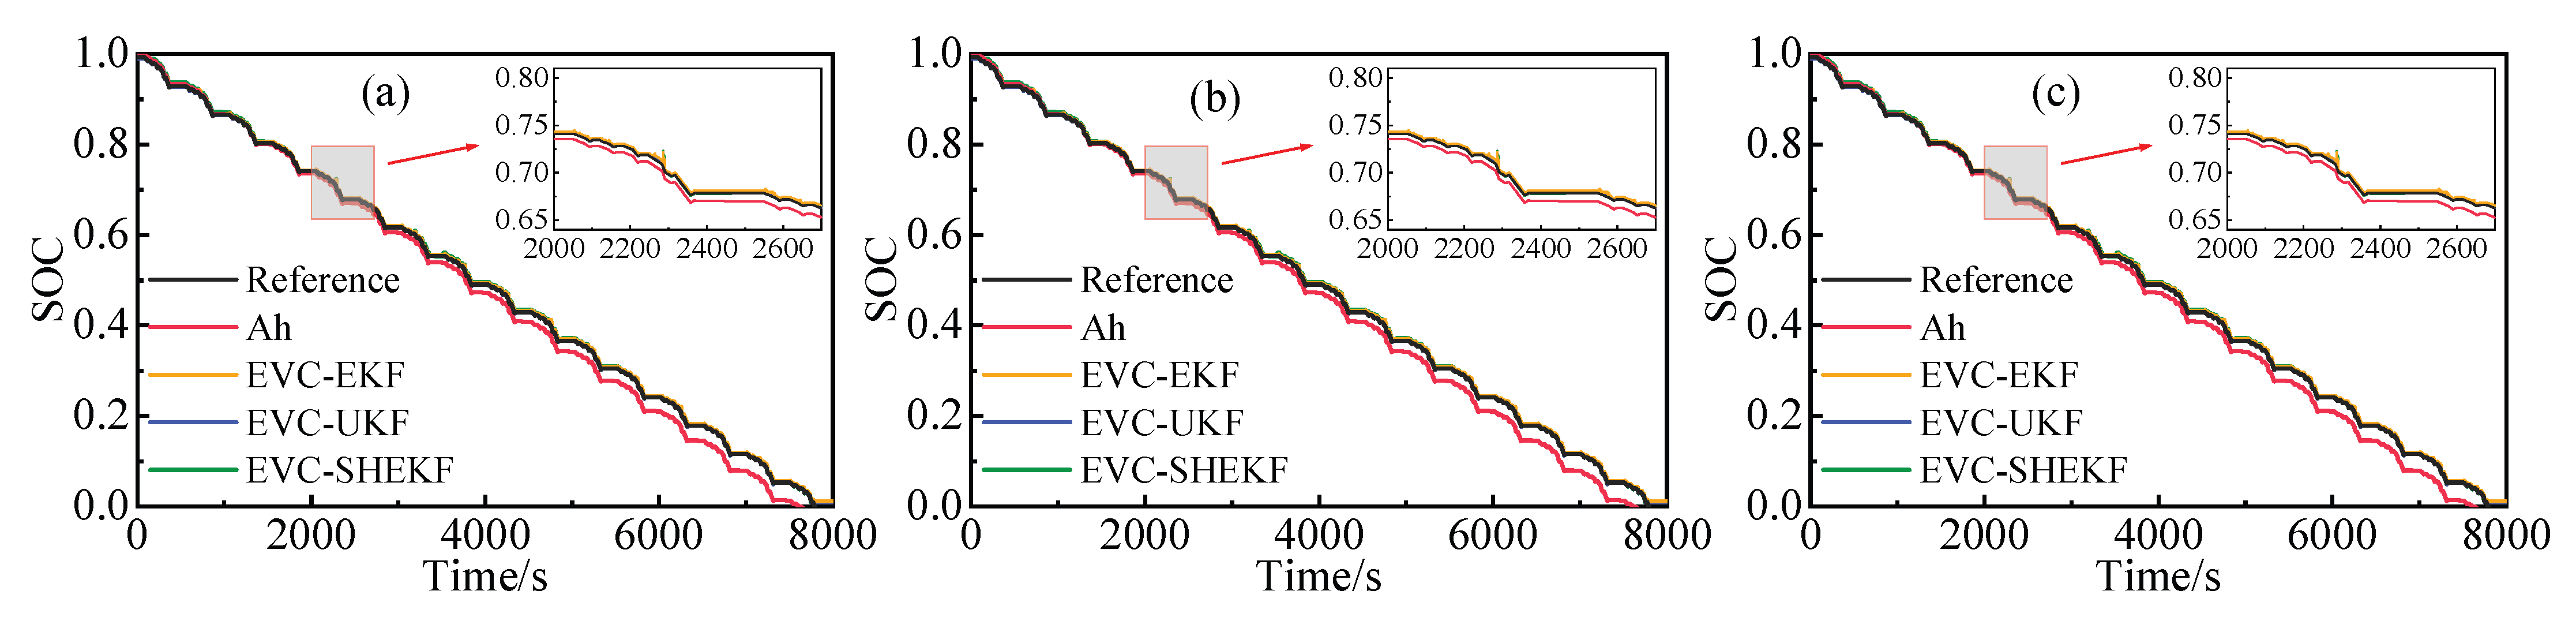
Based on the identified OCV–SOC relationships, SOC estimation experiments were conducted at 10 °C, 25 °C, and 40 °C to evaluate the performance of the EVC strategy under different temperature conditions. Figure 12 presents the SOC estimation results of EVC-EKF, EVC-UKF, and EVC-SHEKF, while Table 5 summarizes the corresponding estimation errors in terms of ME and RMSE.
Figure 12.
SOC estimation results under different temperature conditions: (a) 10 °C; (b) 25 °C; (c) 40 °C.
Table 5.
SOC estimation errors of different EVC-based algorithms at various temperatures.
As shown in Figure 12, all three algorithms are capable of tracking the SOC variation under the tested temperature conditions. However, differences in estimation accuracy can be observed, particularly in the enlarged regions. The EVC-SHEKF algorithm exhibits relatively small deviations from the reference SOC throughout the estimation process.
According to Table 5, the RMSE values of EVC-SHEKF are 1.12%, 1.09%, and 1.14% at 10 °C, 25 °C, and 40 °C, respectively, consistently lower than those of EVC-EKF and EVC-UKF. Moreover, the maximum difference in RMSE across the three temperatures is only 0.05 percentage points, indicating relatively stable estimation performance within the investigated temperature range. In contrast, the RMSE values of EVC-EKF range from 2.11% to 2.21%, while those of EVC-UKF range from 1.91% to 2.09%.
These results demonstrate that the proposed EVC-SHEKF framework maintains favorable SOC estimation accuracy under different temperature conditions. The combination of the EVC strategy and Sage–Husa adaptive filtering contributes to the overall estimation performance, supporting the applicability of the proposed method within the tested temperature range.
5.6. Comparison with Existing SOC Estimation Algorithms
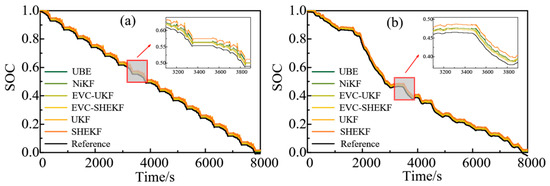
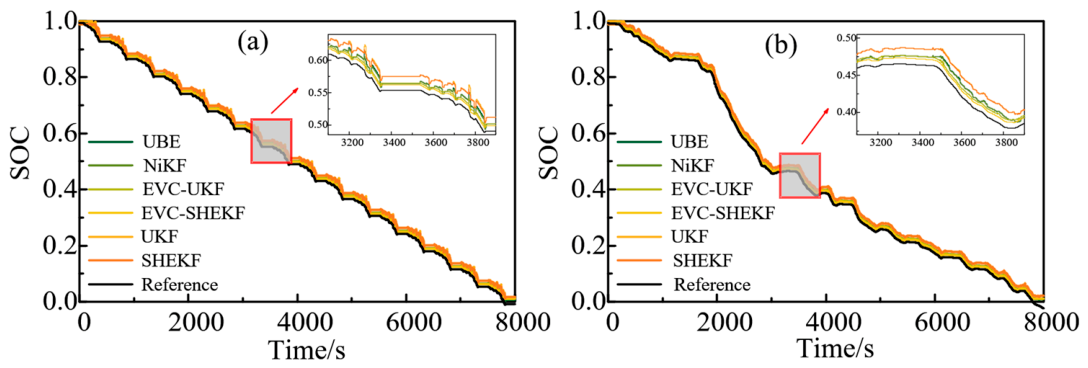
To further evaluate the estimation performance of the proposed EVC-SHEKF algorithm, comparative experiments were conducted against several SOC estimation methods, including UKF, SHEKF, EVC-UKF, the bias-free Kalman filter combined with an uncertain bias estimator (UBE) [31], and the noisy-input Kalman filter (NiKF) [29]. The UBE method explicitly estimates uncertain measurement biases, while NiKF addresses SOC estimation errors associated with current measurement uncertainty. In contrast, the proposed EVC-SHEKF algorithm employs an AHI-assisted correction mechanism that adjusts the estimated SOC according to the discrepancy between the filtering result and an auxiliary AHI reference, with correction strength modulated by the local OCV–SOC slope.
The comparative experiments were performed under the DST and UDDS conditions, with a current measurement bias of 0.05 A and a voltage measurement bias of 1 V. Figure 13 presents the SOC estimation results of the different algorithms, while Table 6 summarizes their estimation errors in terms of ME and RMSE.
Figure 13.
Comparison of SOC estimation results obtained using different algorithms under coupled voltage and current measurement biases: (a) DST; (b) UDDS.
Table 6.
Comparison of SOC estimation errors for different algorithms under DST and UDDS conditions.
As shown in Figure 13, all the algorithms generally follow the variation in the reference SOC, although differences in their estimation deviations can be observed in the enlarged regions. According to Table 6, the EVC-SHEKF algorithm achieves the lowest RMSE values under both driving cycles, reaching 1.09% and 1.11% under the DST and UDDS conditions, respectively. Compared with the conventional SHEKF, the RMSE is reduced by approximately 49.1% and 48.1% under the two conditions, demonstrating the effectiveness of the EVC mechanism in reducing SOC estimation errors.
Compared with the UBE method, the proposed EVC-SHEKF achieves RMSE reductions of approximately 24.8% and 22.4% under the DST and UDDS conditions, respectively. Furthermore, the estimation accuracy of EVC-SHEKF is comparable to that of NiKF under the DST condition, with RMSE values of 1.09% and 1.13%, respectively. Under the UDDS condition, EVC-SHEKF achieves a lower RMSE of 1.11%, compared with 1.31% for NiKF.
The compared methods employ different strategies to mitigate measurement-induced estimation errors. While UBE explicitly estimates uncertain biases and NiKF accounts for current measurement uncertainty, the proposed EVC strategy corrects the estimated SOC using an auxiliary AHI-based discrepancy signal without explicitly introducing additional sensor-bias estimation states. The comparative results indicate that EVC-SHEKF provides competitive SOC estimation accuracy under the investigated coupled voltage and current measurement biases.
6. Conclusions
This study developed an EVC-SHEKF framework for supercapacitor SOC estimation under measurement noise and sensor biases. Based on a second-order RC model, FFRLS was employed for online parameter identification, while the Sage–Husa adaptive mechanism was incorporated to improve noise adaptability. Furthermore, an AHI-assisted estimated-value correction strategy with OCV–SOC slope-dependent gain modulation was introduced to mitigate persistent SOC estimation deviations caused by sensor biases.
The experimental results demonstrate the effectiveness of the proposed framework. Under coupled current and voltage measurement biases of 0.05 A and 1 V, respectively, EVC-SHEKF achieved RMSE values of 1.096% and 1.113% under the DST and UDDS conditions, representing reductions of approximately 48.8% and 47.9% compared with SHEKF. The correction gain sensitivity analysis indicated that γ0 = 0.021 provided the lowest RMSE among the tested gain values. In addition, temperature experiments conducted at 10 °C, 25 °C, and 40 °C yielded RMSE values of 1.12%, 1.09%, and 1.14%, respectively, indicating stable estimation performance within the investigated temperature range. Comparisons with UBE and NiKF further demonstrated the competitive accuracy of EVC-SHEKF under the tested coupled sensor-bias conditions.
Author Contributions
Conceptualization, H.W., J.D. and K.Z.; methodology, H.W.; software, H.W.; validation, H.W.; formal analysis, H.W. and J.D.; investigation, H.W. and L.W.; resources, J.D. and K.Z.; data curation, H.W., J.D. and L.W.; writing—original draft preparation, H.W. and J.D.; writing—review and editing, H.W.; visualization, H.W. and L.W.; supervision, J.D. and K.Z.; funding acquisition, J.D. All authors have read and agreed to the published version of the manuscript.
Funding
This research was funded by the National Natural Science Foundation of China, grant number 52177211.
Institutional Review Board Statement
Not applicable.
Informed Consent Statement
Not applicable.
Data Availability Statement
The data presented in this study are available on request from the corresponding author.
Conflicts of Interest
The authors declare no conflicts of interest. The funders had no role in the design of the study; in the collection, analyses, or interpretation of data; in the writing of the manuscript; or in the decision to publish the results.
Abbreviations
The following abbreviations are used in this manuscript:
| SOC | state of charge |
| SC | supercapacitor |
| EVC | estimated value correction |
| FFRLS | forgetting factor recursive least squares |
| EKF | extended Kalman filter |
| AHI | ampere-hour integration |
| SCMS | SC management system |
| OCV | open circuit voltage |
| KF | Kalman filter |
| UKF | unscented Kalman filter |
| UBE | uncertain bias estimator |
| NiKF | noisy-input Kalman filter |
| SHEKF | Sage–Husa adaptive extended Kalman filter |
| ECM | equivalent circuit model |
| DST | dynamic stress test |
| UDDS | urban dynamometer driving schedule |
| MaxAE | maximum absolute error |
| ME | mean error |
| RMSE | root mean square error |
References
- Zhang, L.; Hu, X.; Wang, Z.; Sun, F.; Dorrell, D.G. A review of supercapacitor modeling, estimation, and applications: A control/management perspective. Renew. Sustain. Energy Rev. 2018, 81, 1868–1878. [Google Scholar] [CrossRef] [Scilit]
- Naseri, F.; Karimi, S.; Farjah, E.; Schaltz, E. Supercapacitor management system: A comprehensive review of modeling, estimation, balancing, and protection techniques. Renew. Sustain. Energy Rev. 2022, 155, 111913. [Google Scholar] [CrossRef] [Scilit]
- Ayob, A.; Ansari, S.; Lipu, M.S.H.; Hussain, A.; Saad, M.H.M. SOC, SOH and RUL estimation for supercapacitor management system: Methods, implementation factors, limitations and future research improvements. Batteries 2022, 8, 189. [Google Scholar] [CrossRef] [Scilit]
- Li, Z.; Chen, C.; Yang, R.; Li, H.; Xiong, R. Entropy-driven online open circuit voltage identification for precise state estimation in lithium-ion batteries. iScience 2025, 28, 113290. [Google Scholar] [CrossRef] [Scilit] [PubMed]
- Liu, B.; Wang, H.; Tseng, M.-L.; Li, Z. State of charge estimation for lithium-ion batteries based on improved barnacle mating optimizer and support vector machine. J. Energy Storage 2022, 55, 105830. [Google Scholar] [CrossRef] [Scilit]
- Wang, D.; Chang, Y.; Ji, P.; Suo, Y.; Chen, N. State of charge prediction of mine-used LiFePO4 battery based on PSO-Catboost. Energies 2024, 17, 5920. [Google Scholar] [CrossRef] [Scilit]
- Zhang, C.; Wang, T.; Zhang, B.; Qiao, L.; Lian, G.; Wei, M. Closed-loop state of charge estimation of lithium-ion batteries based on machine learning and Kalman filtering. Arab. J. Sci. Eng. 2026, 51, 1651–1668. [Google Scholar] [CrossRef] [Scilit]
- Rezaei, O.; Dinh, T.Q. A robust adaptive battery state of charge estimation based on integrated Luenberger observer: An investigation for electric urban air mobility application. J. Energy Storage 2025, 128, 117128. [Google Scholar] [CrossRef] [Scilit]
- Nath, A.; Gupta, R.; Mehta, R.; Bahga, S.S.; Gupta, A.; Bhasin, S. Attractive ellipsoid sliding mode observer design for state of charge estimation of lithium-ion cells. IEEE Trans. Veh. Technol. 2020, 69, 14701–14712. [Google Scholar] [CrossRef] [Scilit]
- Hu, X.; Sun, F.; Zou, Y. Estimation of state of charge of a lithium-ion battery pack for electric vehicles using an adaptive Luenberger observer. Energies 2010, 3, 1586–1603. [Google Scholar] [CrossRef] [Scilit]
- Plett, G.L. Sigma-point Kalman filtering for battery management systems of LiPB-based HEV battery packs: Part 1: Introduction and state estimation. J. Power Sources 2006, 161, 1356–1368. [Google Scholar] [CrossRef] [Scilit]
- Yang, J.; Xia, B.; Shang, Y.; Huang, W.; Mi, C.C. Adaptive state-of-charge estimation based on a split battery model for electric vehicle applications. IEEE Trans. Veh. Technol. 2017, 66, 10889–10898. [Google Scholar] [CrossRef] [Scilit]
- Peng, S.; Chen, C.; Shi, H.; Yao, Z. State of charge estimation of battery energy storage systems based on adaptive unscented Kalman filter with a noise statistics estimator. IEEE Access 2017, 5, 13202–13212. [Google Scholar] [CrossRef] [Scilit]
- Chen, Z.; Yang, L.; Zhao, X.; Wang, Y.; He, Z. Online state of charge estimation of Li-ion battery based on an improved unscented Kalman filter approach. Appl. Math. Model. 2019, 70, 532–544. [Google Scholar] [CrossRef] [Scilit]
- Luo, Z.; Qu, D.; Fan, L.; Yang, S. State of charge estimation for the vanadium redox flow battery based on the Sage–Husa adaptive extended Kalman filter. Int. J. Circuit Theory Appl. 2024, 52, 380–395. [Google Scholar] [CrossRef] [Scilit]
- Gu, C.; Ni, L.; Tian, X.; Fan, C. Physics-based battery SOC estimation: A joint data-driven and window-varying adaptive extended Kalman filter approach. J. Energy Storage 2025, 121, 116465. [Google Scholar] [CrossRef] [Scilit]
- Du, J.; Wang, J.; Tan, B.; Cao, X.; Qu, C.; Ou, Y.; He, X.; Xiong, L.; Tu, R. Estimation of battery state of charge based on changing window adaptive extended Kalman filtering. J. Energy Storage 2024, 103, 114325. [Google Scholar] [CrossRef] [Scilit]
- Taborelli, C.; Onori, S. State of charge estimation using extended Kalman filters for battery management system. In Proceedings of the 2014 IEEE International Electric Vehicle Conference (IEVC), Florence, Italy, 17–19 December 2014; pp. 1–8. [Google Scholar] [CrossRef] [Scilit]
- Meng, J.; Luo, G.; Gao, F. Lithium polymer battery state-of-charge estimation based on adaptive unscented Kalman filter and support vector machine. IEEE Trans. Power Electron. 2016, 31, 2226–2238. [Google Scholar] [CrossRef] [Scilit]
- Liu, Z.; Chen, S.; Wu, H.; Huang, H.; Zhao, Z. A combined state of charge estimation method for lithium-ion batteries using cubature Kalman filter and least square with gradient correction. Adv. Theory Simul. 2022, 5, 2100331. [Google Scholar] [CrossRef] [Scilit]
- Li, X.; Zheng, Z.; Meng, J.; Wang, Q. Robust estimation of lithium battery state of charge with random missing current measurement data. Electronics 2024, 13, 4436. [Google Scholar] [CrossRef] [Scilit]
- Tong, Y.; Zheng, Z.; Fan, W.; Liu, Z. Improved unscented Kalman filter for state of charge estimation of lithium-ion battery with one-step randomly measurement loss and inaccurate noise covariance matrices. Digit. Signal Process. 2022, 131, 103780. [Google Scholar] [CrossRef] [Scilit]
- Sun, X.; Ji, J.; Ren, B.; Xie, C.; Yan, D. Adaptive forgetting factor recursive least square algorithm for online identification of equivalent circuit model parameters of a lithium-ion battery. Energies 2019, 12, 2242. [Google Scholar] [CrossRef] [Scilit]
- Zhao, X.; Wang, T.; Li, L.; Cheng, Y. Estimation of lithium-ion battery SOC based on IFFRLS-IMMUKF. World Electr. Veh. J. 2024, 15, 494. [Google Scholar] [CrossRef] [Scilit]
- Yang, T.; Li, J.; Zhan, N.; Wang, X.; Zhang, X. A SOC estimation method for energy storage batteries based on FFRLS-EKF. In Proceedings of the 2025 2nd International Symposium on New Energy Technologies and Power Systems (NETPS 2025), Hangzhou, China, 23–25 May 2025; pp. 298–303. [Google Scholar] [CrossRef] [Scilit]
- Lin, X. Theoretical analysis of battery SOC estimation errors under sensor bias and variance. IEEE Trans. Ind. Electron. 2018, 65, 7138–7148. [Google Scholar] [CrossRef] [Scilit]
- Li, H.; Zhou, Z.; Hu, C. A switching observer for state-of-charge estimation of reconfigurable supercapacitors. Appl. Sci. 2024, 14, 8005. [Google Scholar] [CrossRef] [Scilit]
- Wu, L.; Liu, K.; Pang, H.; Jin, J. Online SOC estimation based on simplified electrochemical model for lithium-ion batteries considering current bias. Energies 2021, 14, 5265. [Google Scholar] [CrossRef] [Scilit]
- Kadem, O.; Kim, J. Mitigation of state of charge estimation error due to noisy current input measurement. Proc. Inst. Mech. Eng. Part I J. Syst. Control Eng. 2024, 238, 34–46. [Google Scholar] [CrossRef] [Scilit]
- Wang, L.; Duan, J.; Fan, S.; Zhao, K. An estimated value compensation method for state of charge estimation of lithium battery based on open circuit voltage change rate. Energy 2024, 313, 134119. [Google Scholar] [CrossRef] [Scilit]
- Wang, L.; Duan, J.; Fan, S.; Jiang, H. Online state of charge estimation of supercapacitor considering uncertain bias compensation. J. Energy Storage 2025, 134, 118038. [Google Scholar] [CrossRef] [Scilit]
- Hu, X.; Li, S.; Peng, H. A comparative study of equivalent circuit models for Li-ion batteries. J. Power Sources 2012, 198, 359–367. [Google Scholar] [CrossRef] [Scilit]
- Yuan, S.; Wu, H.; Yin, C. State of charge estimation using the extended Kalman filter for battery management systems based on the ARX battery model. Energies 2013, 6, 444–470. [Google Scholar] [CrossRef] [Scilit]
- Nadeau, A.; Sharma, G.; Soyata, T. State-of-charge estimation for supercapacitors: A Kalman filtering formulation. In Proceedings of the 2014 IEEE International Conference on Acoustics, Speech and Signal Processing (ICASSP), Florence, Italy, 4–9 May 2014; pp. 2194–2198. [Google Scholar] [CrossRef] [Scilit]

Disclaimer/Publisher’s Note: The statements, opinions and data contained in all publications are solely those of the individual author(s) and contributor(s) and not of MDPI and/or the editor(s). MDPI and/or the editor(s) disclaim responsibility for any injury to people or property resulting from any ideas, methods, instructions or products referred to in the content. |
© 2026 by the authors. Licensee MDPI, Basel, Switzerland. This article is an open access article distributed under the terms and conditions of the Creative Commons Attribution (CC BY) license.