


Abstract
Hydrogen represents a promising fuel for spark-ignition internal combustion engines, particularly under lean operating conditions, where high combustion efficiency can be combined with very low NOx emissions. In this work, experimental measurements and three-dimensional CFD simulations are used to investigate hydrogen combustion in a port-fuel-injected single-cylinder research engine operating at 1000 rpm and three relative air–fuel ratios, λ = 1.7, 2.0, and 2.3. RANS simulations are performed using the G-equation combustion model in CONVERGE, with hydrogen laminar flame speed supplied through a tabulated approach based on detailed chemical kinetics. Different values of the turbulent flame-speed model constant are assessed over the complete set of operating conditions, and is selected as the best overall compromise and retained for all simulations. The model reproduces the experimentally observed slowing of combustion with increasing λ, while differences in the combustion-rate profile and late combustion become more pronounced towards the leanest condition. The CFD overpredicts the maximum in-cylinder pressure by 4.1–9.9%, while its crank-angle location is reproduced within approximately 1.2 CAD. Increasing mixture dilution substantially reduces the predicted in-cylinder temperature and NOx formation, with NOx reductions of 84% and 98% at λ = 2.0 and 2.3, respectively, relative to λ = 1.7, consistently with the strong experimental reduction. Overall, the results indicate that a single G-equation calibration can provide a consistent description of the main changes in hydrogen combustion behavior across the investigated lean operating range, without condition-specific adjustment of the turbulent flame-speed parameter.
1. Introduction
The decarbonization of the transport sector requires the development of energy conversion technologies capable of combining high efficiency with a substantial reduction in greenhouse gas and pollutant emissions. In this context, hydrogen has attracted increasing interest as an energy carrier for transportation applications, particularly when produced from low-carbon or renewable energy sources [1,2,3,4,5,6,7]. Unlike hydrocarbon fuels, hydrogen does not contain carbon and therefore does not directly generate fuel-derived carbon dioxide (CO2) during combustion. Furthermore, its high laminar burning velocity and wide flammability limits enable stable combustion over a broad range of air–fuel ratios, making hydrogen particularly attractive for lean and ultra-lean spark-ignition (SI) operation [8,9].
Hydrogen can be employed in internal combustion engines while retaining a substantial part of the architecture and manufacturing infrastructure developed for conventional powertrains. Nevertheless, its distinctive physical and chemical properties introduce specific challenges in terms of mixture formation, combustion control, and pollutant emissions. Its low ignition energy and high reactivity can increase susceptibility to abnormal combustion phenomena, including pre-ignition and backfire, particularly in port-fuel-injected (PFI) configurations [10,11,12,13]. In addition, although carbon-related exhaust emissions originating from the fuel are intrinsically avoided, nitrogen oxides (NOx) remain the main pollutant associated with hydrogen combustion and are strongly affected by the local temperature history and mixture composition.
Lean and ultra-lean operation represent one of the most promising strategies for exploiting the combustion characteristics of hydrogen. Increasing the relative air–fuel ratio reduces combustion temperatures and can strongly suppress NOx formation while retaining stable flame propagation under mixture conditions that would not generally be accessible with conventional hydrocarbon fuels [8,9]. At the same time, however, the combustion process becomes increasingly sensitive to the interaction between chemical kinetics, turbulence, flame stretch, differential diffusion, and flame–wall interaction. These effects make the accurate numerical prediction of lean hydrogen combustion particularly challenging.
A relevant characteristic of lean premixed hydrogen–air flames is their low effective Lewis number. Preferential diffusion of hydrogen can promote thermo-diffusive instabilities (TDI), which affect flame morphology, flame surface area, and the resulting propagation rate. Their relative importance depends on mixture composition and thermodynamic conditions, as well as on the interaction between intrinsic flame instabilities and turbulence. Recent experimental and numerical investigations have therefore devoted increasing attention to the explicit representation of thermo-diffusive effects in combustion models for lean and ultra-lean hydrogen operation [14,15].
Three-dimensional Computational Fluid Dynamics (CFD) represents a valuable tool for investigating these phenomena, since it provides detailed information on in-cylinder flow, mixture preparation, flame propagation, temperature distribution, and pollutant formation. CFD can therefore support the development and optimization of hydrogen-fueled internal combustion engines while reducing the experimental effort required during the design process. However, its practical value depends on the capability of the adopted combustion model to provide consistent predictions when the operating condition is varied. Combustion models originally developed and calibrated for conventional hydrocarbon fuels cannot necessarily be transferred directly to hydrogen without assessing their performance against the distinctive combustion characteristics of this fuel.
Different numerical approaches have been proposed for hydrogen-fueled engines. Ge et al. [16] investigated a premixed spark-ignition hydrogen engine using a detailed-chemistry combustion approach and analyzed the influence of equivalence ratio on combustion development and abnormal pressure behavior. Aljabri et al. [17] employed CFD simulations with detailed hydrogen chemistry to investigate hydrogen-fueled SI operation and the effect of compression ratio and mixture conditions. Teodosio et al. [18] adopted a G-equation combustion model to investigate a diesel engine virtually converted to ultra-lean hydrogen SI operation, highlighting the potential benefits in terms of efficiency and NOx emissions. Other numerical studies have focused on direct-injection hydrogen engines, where jet development, air entrainment, and mixture stratification introduce additional uncertainties in the combustion process [19,20].
More recent investigations have specifically addressed the capability of flame-propagation models to reproduce hydrogen combustion over multiple operating conditions. G-equation-based CFD frameworks have demonstrated that satisfactory agreement with experimental combustion data can be achieved over a range of lean and ultra-lean operating conditions using a common turbulent flame-speed formulation [21,22]. At the same time, these studies have highlighted the importance of physical mechanisms that are not explicitly represented in conventional flame-propagation frameworks. In particular, thermo-diffusive instabilities can modify lean hydrogen flame propagation, while their interaction with turbulence can influence their overall effect on the combustion rate [14,15,21].
Flame–wall interaction represents an additional challenge for flame-propagation models, particularly during the late stages of combustion, when an increasing fraction of the flame approaches the combustion-chamber boundaries. The accurate description of this phase requires an appropriate representation of flame quenching in the near-wall region. Recent numerical investigations have also shown that thermo-diffusive effects, turbulence–instability interaction, and flame–wall quenching may influence different phases of hydrogen combustion and may produce competing effects under specific operating conditions [14]. Consequently, agreement in global combustion indicators does not necessarily imply that all the underlying physical mechanisms are reproduced with the same level of accuracy.
Independently adjusting combustion-model parameters for each operating condition may provide excellent agreement with individual experimental measurements, but such condition-specific calibration substantially limits the usefulness of CFD as a predictive design tool. If experimental information were required a priori for every new operating condition to determine the appropriate model parameters, the numerical methodology would provide limited capability for exploring conditions for which measurements are not yet available. A more useful approach is therefore to assess whether a common model calibration can provide a consistent description of the combustion process while responding to changes in mixture composition through the underlying physical and chemical submodels.
The present work addresses this issue through a combined experimental and numerical investigation of hydrogen combustion in the University of Perugia single-cylinder research engine. The study extends the preliminary numerical investigation reported by Gammaidoni et al. [23] by introducing a systematic comparison with experimental engine measurements. The engine is operated in PFI mode at 1000 rpm under three lean conditions, corresponding to relative air–fuel ratios of λ = 1.7, 2.0, and 2.3. The PFI configuration provides an approximately homogeneous fuel–air mixture upstream of the combustion chamber, thereby limiting uncertainties associated with in-cylinder mixture stratification and allowing the analysis to focus primarily on flame propagation and combustion modeling.
Three-dimensional RANS simulations are performed using the G-equation combustion model. Hydrogen laminar flame speed is supplied through a tabulated approach generated from a detailed kinetic mechanism and is first assessed against experimental measurements available in the literature. Attention is then devoted to the turbulent flame-speed formulation. Different values of the model constant are preliminarily assessed over the complete set of investigated operating conditions, and is selected as the single value providing the best overall compromise in reproducing the experimentally observed combustion evolution. Importantly, the model constant is not independently adjusted for each value of λ, and the same calibration is retained for all simulations.
The objective is therefore not to obtain an independently optimized fit at each operating point, but to assess whether a single G-equation calibration can provide a consistent description of the variation in hydrogen combustion behavior as the mixture becomes progressively leaner. Numerical predictions are compared with experimental measurements in terms of mass fraction burned and in-cylinder pressure, while the CFD results are further analyzed in terms of flame-front evolution, in-cylinder temperature, and NOx emissions. This approach allows both the capabilities and the limitations of the adopted combustion framework to be evaluated over the investigated mixture range. The present numerical framework does not include a dedicated correction for thermo-diffusive effects or an explicit treatment of flame-wall quenching. The systematic assessment of these phenomena is therefore identified as a future development of the numerical methodology.
2. Experimental Setup and Data
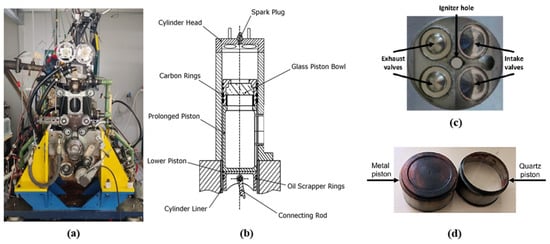
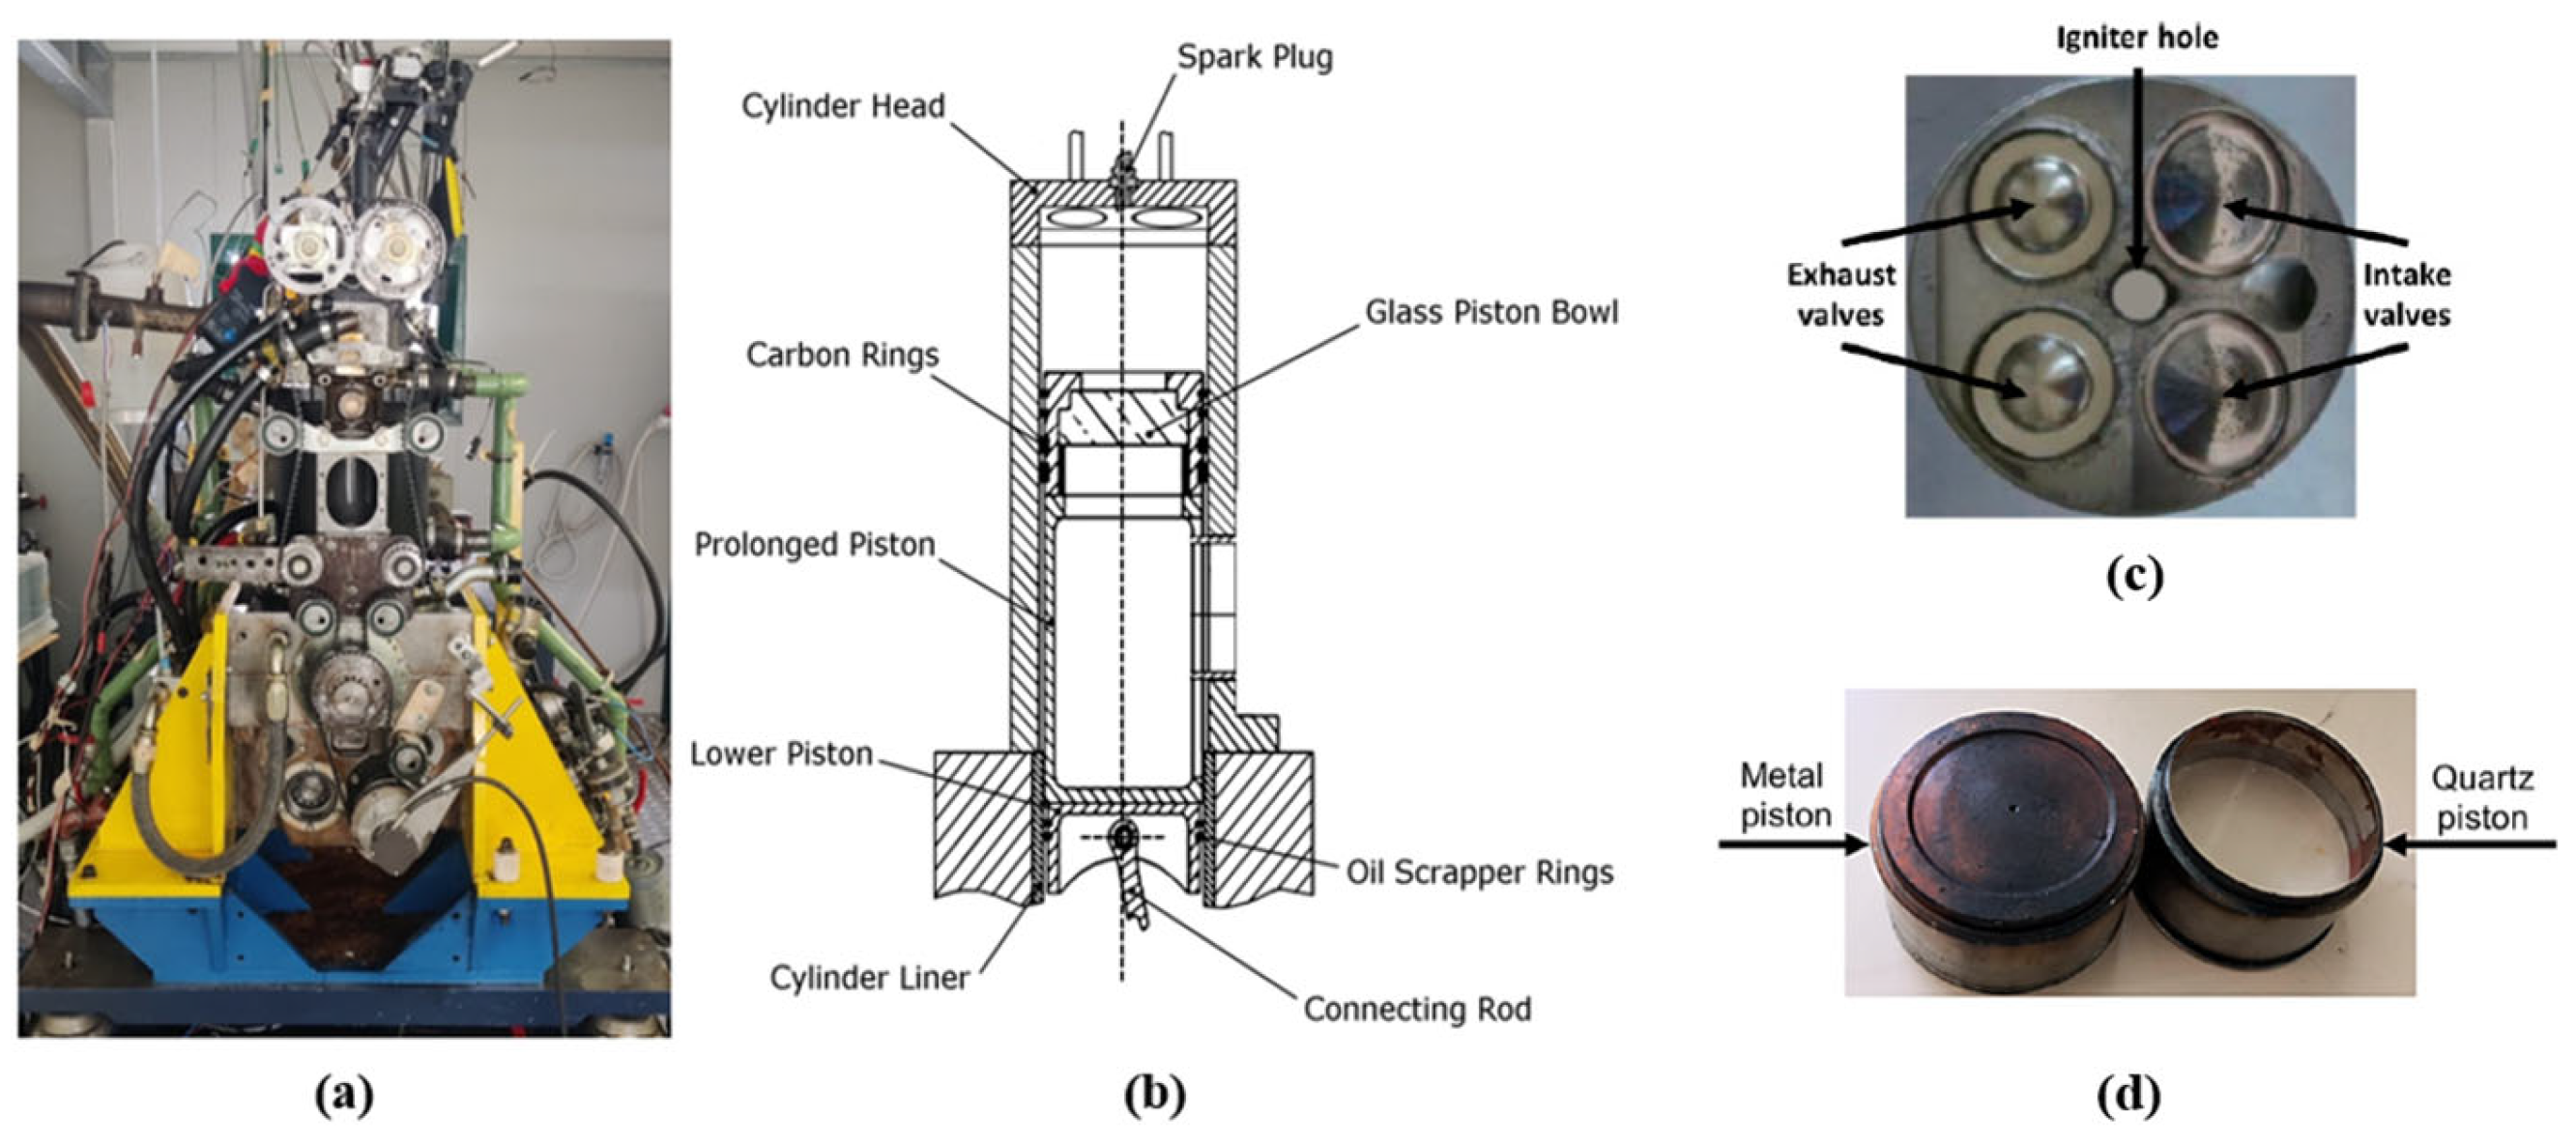
The experimental campaign was conducted on the University of Perugia single-cylinder research engine shown in Figure 1, extending the experimental activities reported by Avana et al. [24]. The engine has a displacement of 500 cm3 and features a four-valve pent-roof combustion chamber and a reverse-tumble intake-port configuration. Both port fuel injection (PFI) and direct injection (DI) can be accommodated. Although the engine can also be configured for optical access, the present experiments were performed using the metal piston crown shown in Figure 1d. The main engine specifications and operating conditions are summarized in Table 1.
Figure 1.
University of Perugia single-cylinder research engine: (a) experimental engine, (b) schematic view, (c) cylinder-head details, and (d) metal piston (left) and quartz piston (right).
Table 1.
Engine specifications and investigated operating conditions.
All experiments were performed with hydrogen in PFI mode at a constant engine speed of 1000 rpm. Three lean operating conditions were investigated, corresponding to relative air–fuel ratios of λ = 1.7, 2.0, and 2.3. The spark timing was adjusted for each operating condition and set to 8, 18, and 23 crank angle degree (CAD) before top dead center firing (bTDCf), respectively, as reported in Table 1. A conventional spark igniter was centrally located in the cylinder head.
The throttle valve opening (TVO) was kept fixed at 10% throughout the experimental campaign, resulting in an approximately constant air mass flow rate of 2.32 g/s across all investigated operating conditions. The relative air–fuel ratio was varied by changing the hydrogen injector energizing time and, consequently, the injected fuel quantity, while maintaining a constant hydrogen injection pressure of 4.5 bar absolute. The resulting mixture condition was verified from exhaust measurements using a Horiba MEXA-720 analyzer, which was also used to measure the exhaust O2 concentration and NOx emissions.
For the operating conditions considered in the present work, hydrogen mass flow rates of 0.040 g/s, 0.034 g/s, and 0.029 g/s were measured for λ = 1.7, 2.0, and 2.3, respectively. Considering the spark timings reported in Table 1, the corresponding engine loads, expressed in terms of indicated mean effective pressure (IMEP), were 3.89 bar, 3.30 bar, and 2.88 bar, while the combustion stability remained very high, with coefficient of variance of IMEP (CoVIMEP) values of 1.28%, 1.40%, and 1.87%, respectively.
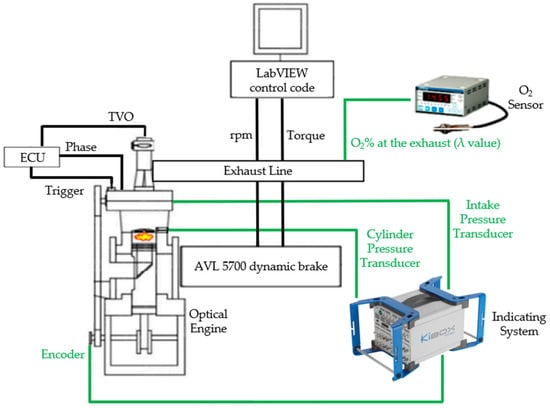
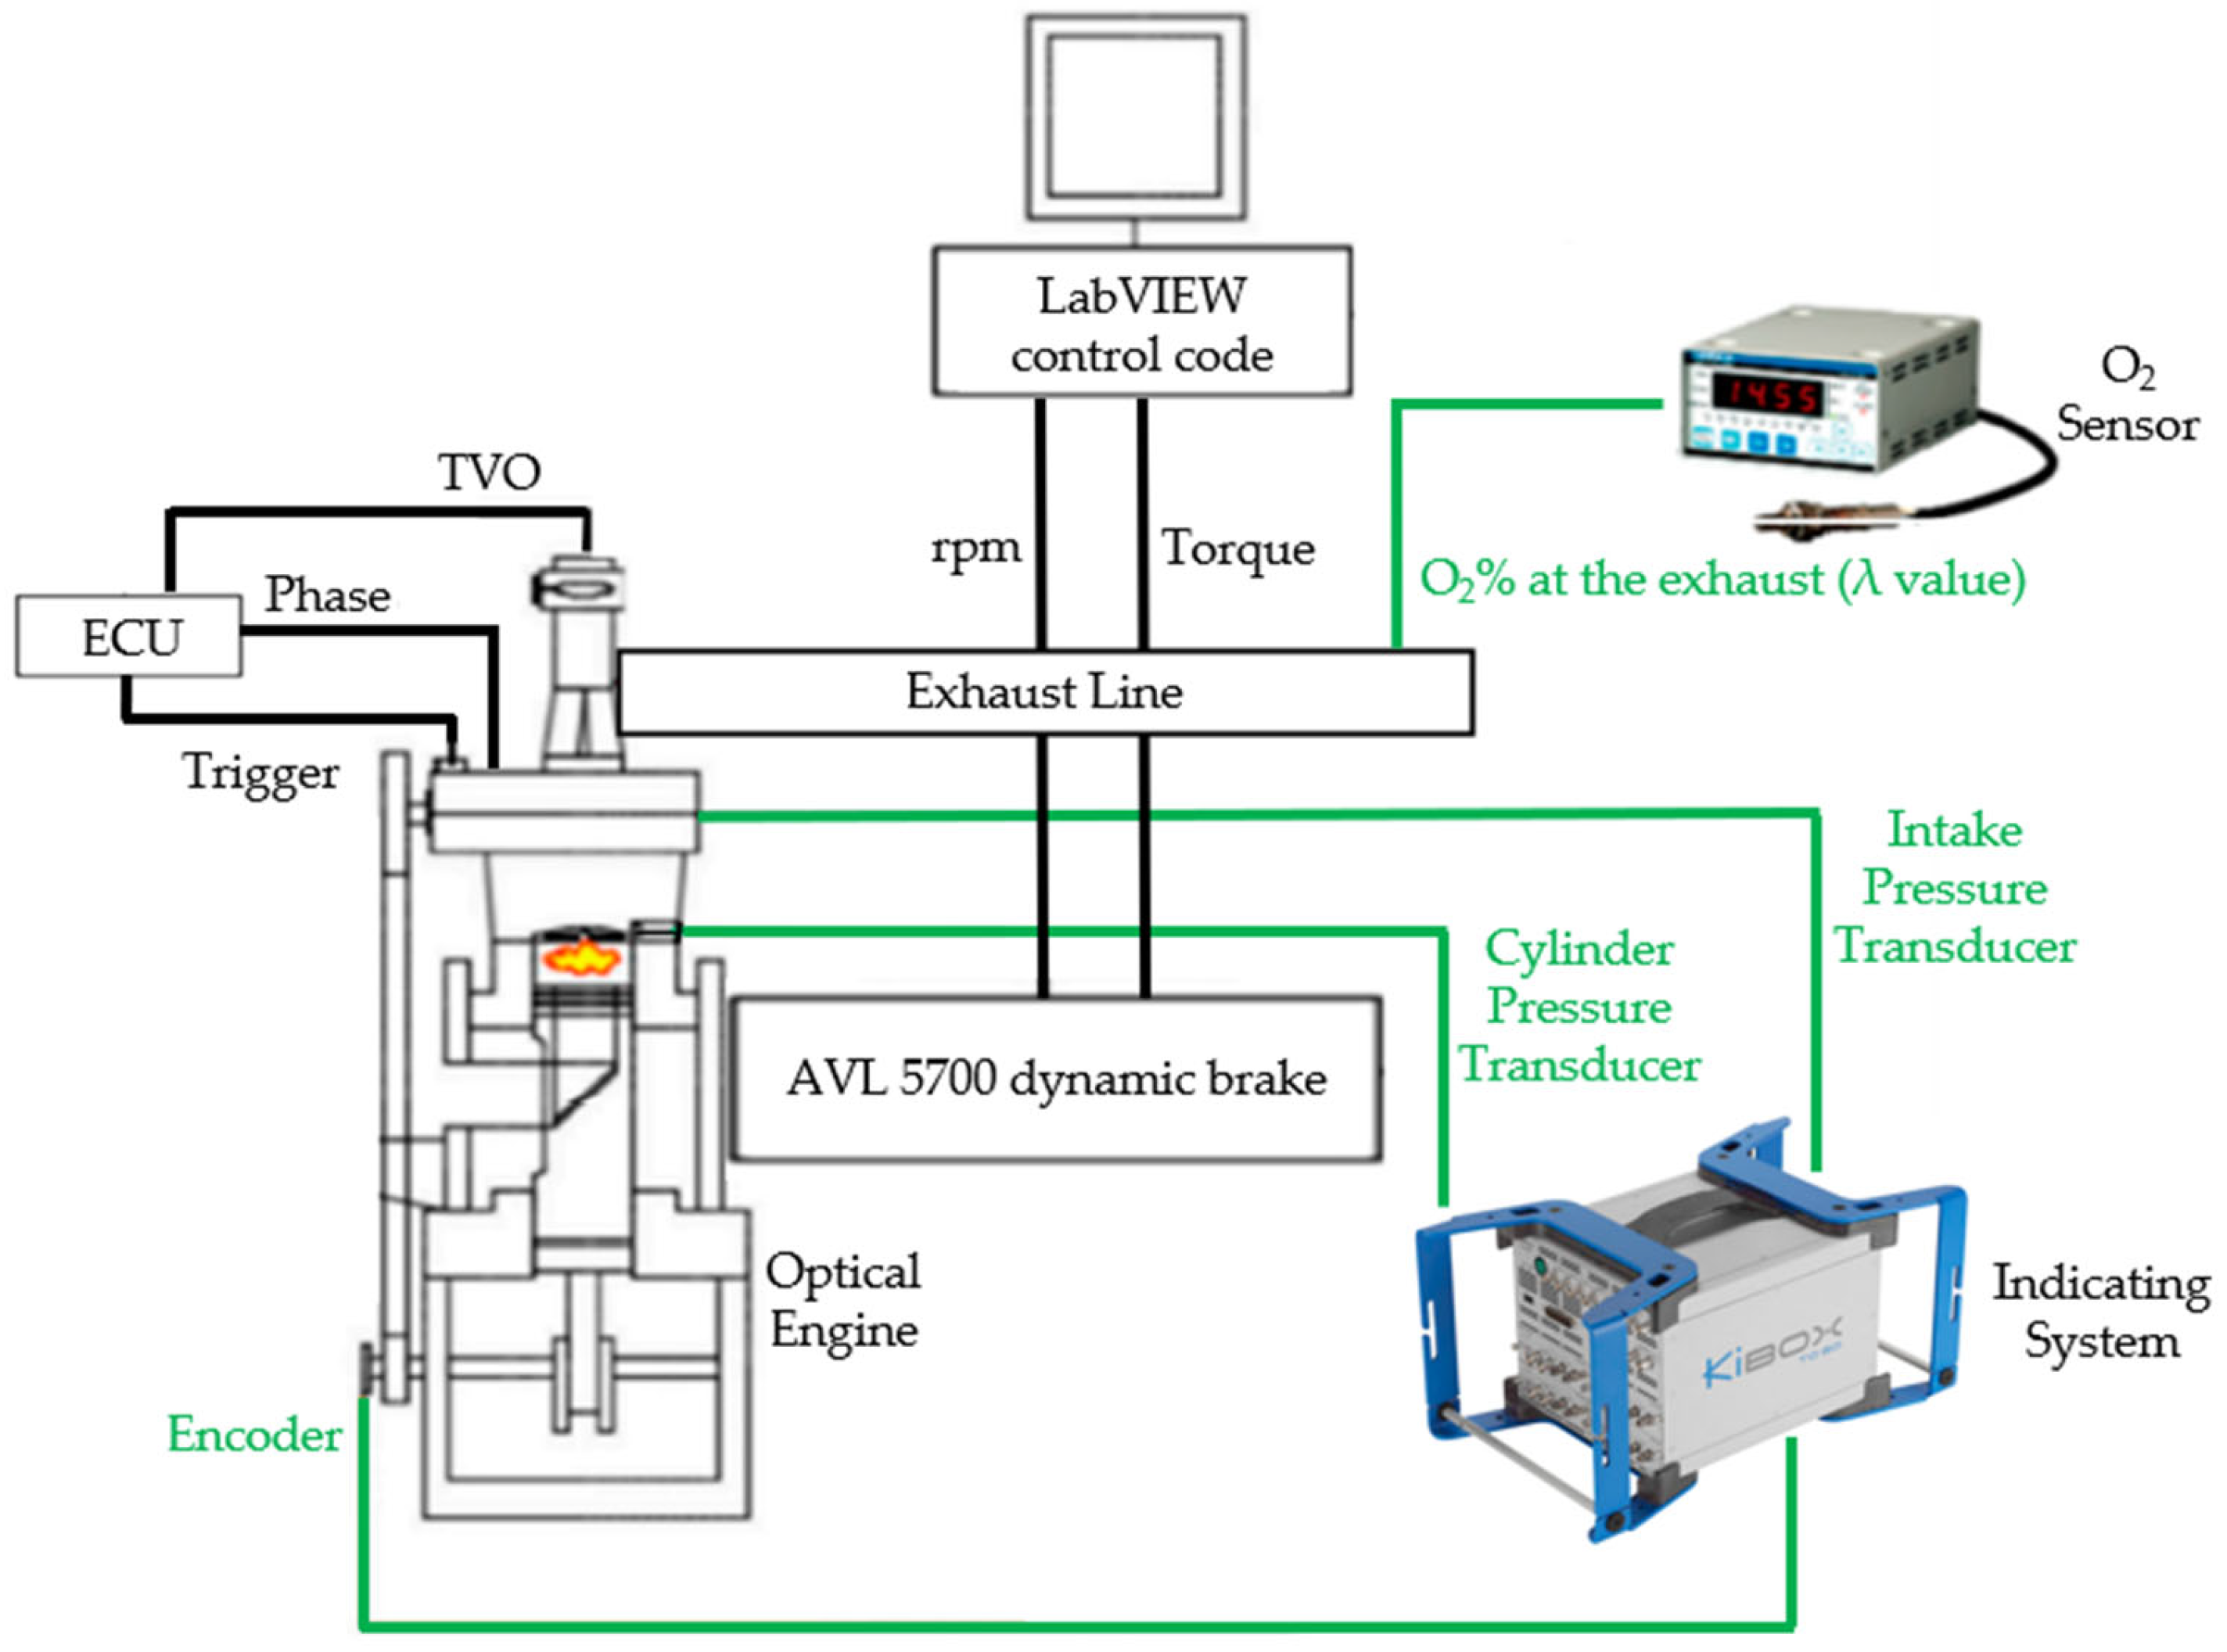
In-cylinder pressure was measured using a Kistler 6061B piezoelectric pressure transducer, while the intake-manifold pressure measured by a Kistler 4075A5 piezoresistive sensor was used for pressure pegging. Crank-angle-resolved measurements were synchronized using an AVL 365C optical encoder. Engine speed was controlled by an AVL 5700 dynamometer, while hydrogen injection and spark timing were managed through an Athena GET HPUH4 research ECU. The overall experimental setup is shown in Figure 2, while the measurement equipment and corresponding specifications are summarized in Table 2.
Figure 2.
Experimental setup and measurement equipment.
Table 2.
Measurement equipment and specifications.
For each operating condition, 103 consecutive firing cycles were acquired and subsequently post-processed. The apparent heat-release rate was calculated from the measured in-cylinder pressure using the Kistler KiBox combustion analysis system. The cumulative apparent heat release was then obtained by integration and normalized between 0 and 1 to determine the experimental burned mass fraction, . For consistency, the same pressure-based procedure was applied to the simulated in-cylinder pressure traces to derive the corresponding numerical . Therefore, the experimental and numerical combustion evolutions discussed in Section 4 are compared using the same post-processing methodology.
3. Numerical Model and Setup
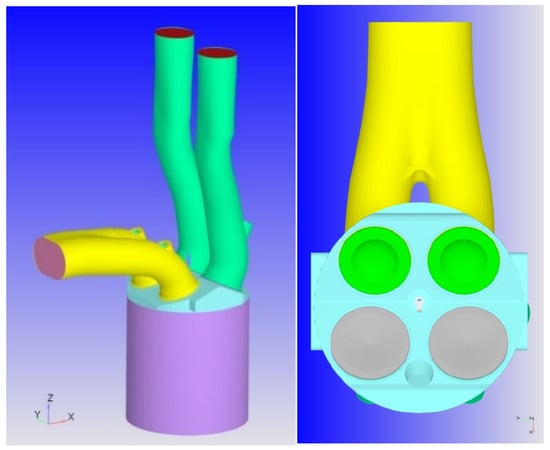
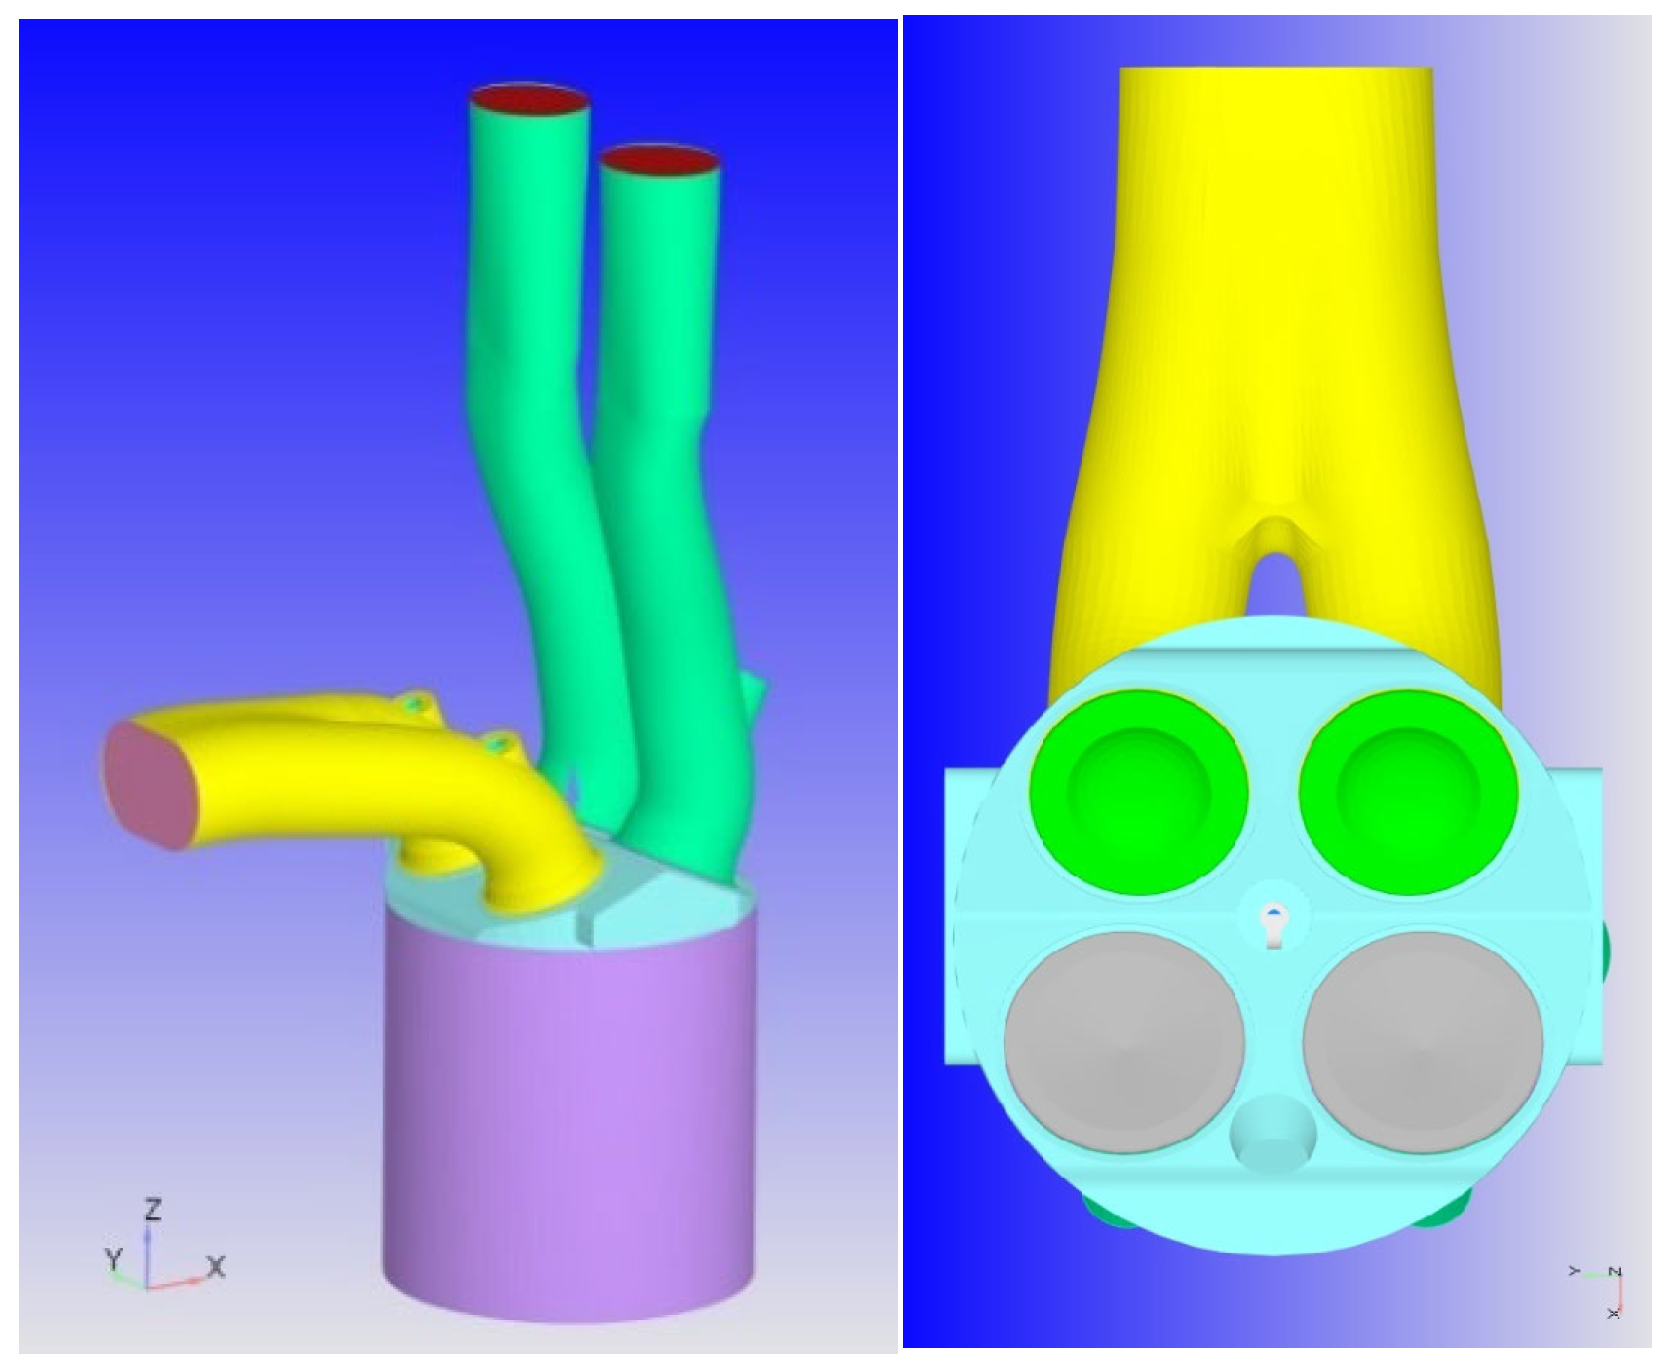
Three-dimensional CFD simulations were performed using CONVERGE CFD v3.1 [25]. The governing equations for mass, momentum, energy, and species conservation were solved using the finite-volume method within an unsteady Reynolds-Averaged Navier–Stokes (RANS) framework. Pressure–velocity coupling was handled using the Pressure-Implicit with Splitting of Operators (PISO) algorithm. Second-order spatial discretization schemes were adopted for conservation equations, whereas first-order spatial discretization was used for the turbulence equations. Time integration was performed using a first-order implicit scheme, with a variable time step controlled by the local convective Courant number. Turbulence was modeled using the Re-Normalization Group (RNG) - model [26,27], which is widely employed for RANS simulations of internal combustion engines. The computational domain reproduced the geometry of the University of Perugia single-cylinder research engine, as shown in Figure 3, including the intake and exhaust ports, four valves, pent-roof combustion chamber, and centrally located spark plug. The engine speed was set to 1000 rpm, consistently with experimental conditions.
Figure 3.
Computational geometry of the UniPG single-cylinder research engine.
The simulations were initialized from a quiescent flow field and ran for five consecutive engine cycles. This allowed the initial numerical transient to be progressively removed as the cylinder was filled with the prescribed mixture and the in-cylinder flow field developed towards a periodically repeatable RANS solution. Cycle-to-cycle repeatability of the numerical results was verified, and the fifth simulated cycle was therefore selected for the subsequent analysis. Previous studies by the same research group provide further details on the development and validation of the numerical engine model [28,29,30,31].
Time-dependent pressure, temperature, and species boundary conditions were imposed at the inlet and outlet using information derived from experimental measurements and one-dimensional engine simulations. Since the hydrogen injector is located upstream of the computational domain, the injection process was not explicitly simulated. Instead, hydrogen and air were prescribed as a premixed charge at the inlet, with the mixture composition adjusted to reproduce the experimental relative air–fuel ratio for each operating condition. The adoption of a premixed boundary condition was considered appropriate because the injector location provides a relatively long mixing length before the intake valves, while the high diffusivity of hydrogen promotes rapid fuel–air homogenization within the intake system. Therefore, the mixture entering the computational domain is expected to be reasonably uniform under the investigated operating conditions. The present modelling approach is intended to reproduce the in-cylinder mixture composition and combustion process rather than the details of fuel injection and intake-port mixing. It should be noted that this assumption does not allow the prediction of phenomena directly related to the injection process, such as local fuel-concentration gradients, intake-runner mixture non-uniformities, or backfire propensity. Investigation of such effects would require extending the computational domain upstream to include the injector location and performing a fully coupled simulation of hydrogen injection, transport, and mixing. These aspects are beyond the scope of the present work, which focuses on the in-cylinder combustion process.
Constant wall temperatures were prescribed using a law-of-the-wall heat-transfer treatment: 450 K for the piston, cylinder liner and head, 480–600 K for the valves and spark plug components, and 300 K and 500 K for the intake and exhaust ports, respectively. Time-dependent inlet total pressure (0.670–0.988 bar range) and outlet static pressure (0.831–1.212 bar range) profiles were imposed from experiments, together with an inlet temperature of 293 K. The same pressure profiles and wall thermal conditions were adopted for all three operating conditions, with the relative air–fuel ratio varied solely by adjusting the hydrogen mass fraction of the premixed inlet charge. A variable time-step strategy was employed, with prescribed limits of 10−8–10−4 s. The maximum convective Courant number was adjusted between 1 and 5 as a function of crank angle and computational region, with more restrictive limits (CFL ≤ 1) imposed in the combustion chamber during the compression and combustion phases and in the intake port during the intake process, to improve the temporal resolution of these critical phases.
The computational grid was generated using the Cartesian cut-cell approach available in CONVERGE. A combination of fixed embedding and adaptive mesh refinement (AMR) was employed to resolve the relevant flow and combustion structures while limiting the overall computational cost. The maximum cell size inside the cylinder was 1 mm, with a resolution of 0.5 mm in the valve regions. Velocity-based AMR was employed to refine regions characterized by significant flow structures, whereas temperature-based AMR was activated during combustion to improve the spatial resolution of the propagating flame front. Two concentric spherical refinement regions were additionally defined around the spark-plug electrodes to resolve the early flame-kernel development, resulting in a minimum local cell size of 0.125 mm. The maximum cell count was approximately 1.5 million. The mesh refinement strategy adopted in the present work builds upon previous numerical investigations performed on the same optical-access engine. In particular, Battistoni et al. [29] conducted a mesh sensitivity analysis using a RANS approach, while Zembi et al. [30] further investigated the influence of spatial resolution within a LES framework. More recently, Gammaidoni et al. [23] performed a mesh sensitivity assessment for hydrogen combustion simulations of the same engine. The main grid parameters are summarized in Table 3.
Table 3.
Computational mesh details.
Premixed hydrogen combustion was modeled using the G-equation approach. Within this framework, the flame front is represented by an iso-surface of the transported scalar and propagates through the unburned mixture according to the prescribed turbulent flame speed. Ignition was initiated by locally imposing the field within a spherical region of 0.5 mm radius located between the spark-plug electrodes.
The laminar flame speed, , required by the combustion model, was supplied through a tabulated approach. The table was generated using the one-dimensional chemistry solver available in CONVERGE and the detailed hydrogen oxidation mechanism proposed by O’Conaire et al. [32]. The table was generated assuming zero external EGR, consistently with experimental engine configuration. The resulting laminar flame-speed predictions are assessed against experimental measurements from the literature in Section 4.1 before being employed in the three-dimensional engine simulations.
The turbulent flame speed, , was calculated according to the Peters formulation [33]:
where is the root-mean-square turbulent velocity fluctuation, is the Damköhler number and the remaining coefficients are model constants defined within the turbulent flame-speed formulation. The Damköhler number is defined as the ratio between the turbulent and chemical characteristic time scales:
where is the turbulent integral length scale, is the turbulent velocity fluctuation, is the laminar flame speed, and is the laminar flame thickness.
Attention was devoted to the model constant , which influences the predicted turbulent flame propagation rate. Different values of were preliminarily assessed over the complete set of operating conditions. A value of provided the best overall compromise and was therefore retained unchanged for all simulations. It is worth noting that the standard value of in the Peters formulation is 2.0. The higher value adopted here increases the modeled turbulent flame speed and may partly compensate for the absence of a dedicated treatment of thermo-diffusive instabilities, which are known to enhance flame propagation in lean hydrogen mixtures. This common calibration was deliberately adopted to assess the capability of the combustion model to reproduce the effect of progressively leaner mixtures without condition-specific adjustment of the turbulent flame-speed parameter. No dedicated correction for thermo-diffusive instabilities or explicit flame-wall quenching model was included in the adopted G-equation framework.
NOx formation was modeled using the Thermal NOx model available in CONVERGE, based on the extended Zeldovich mechanism. This approach accounts for the temperature-dependent formation of nitrogen oxides through the thermal NO pathway and was applied consistently to all investigated operating conditions.
4. Results and Discussion
The numerical methodology is assessed at two different levels. First, the laminar flame-speed values generated using the adopted hydrogen kinetic mechanism are compared with experimental measurements available in the literature. The complete three-dimensional CFD framework is then evaluated against the experimental engine data, with particular attention to the capability of the combustion model to reproduce the effect of increasing mixture dilution while retaining the same model calibration.
4.1. Assessment of the Hydrogen Laminar Flame-Speed Table
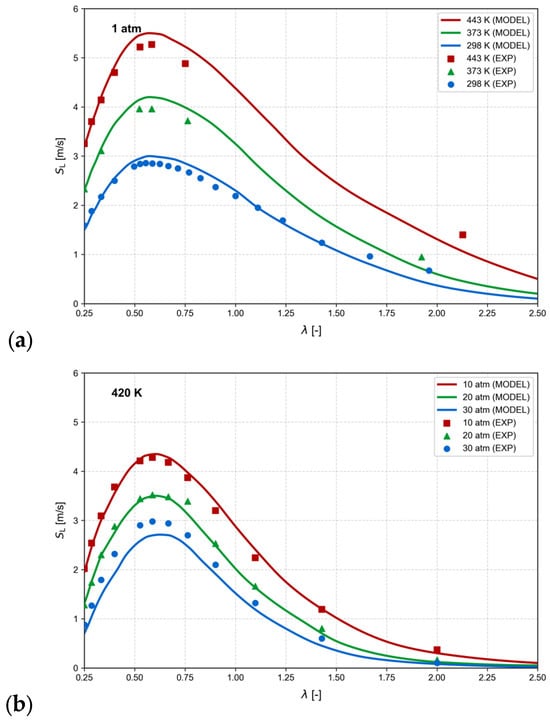
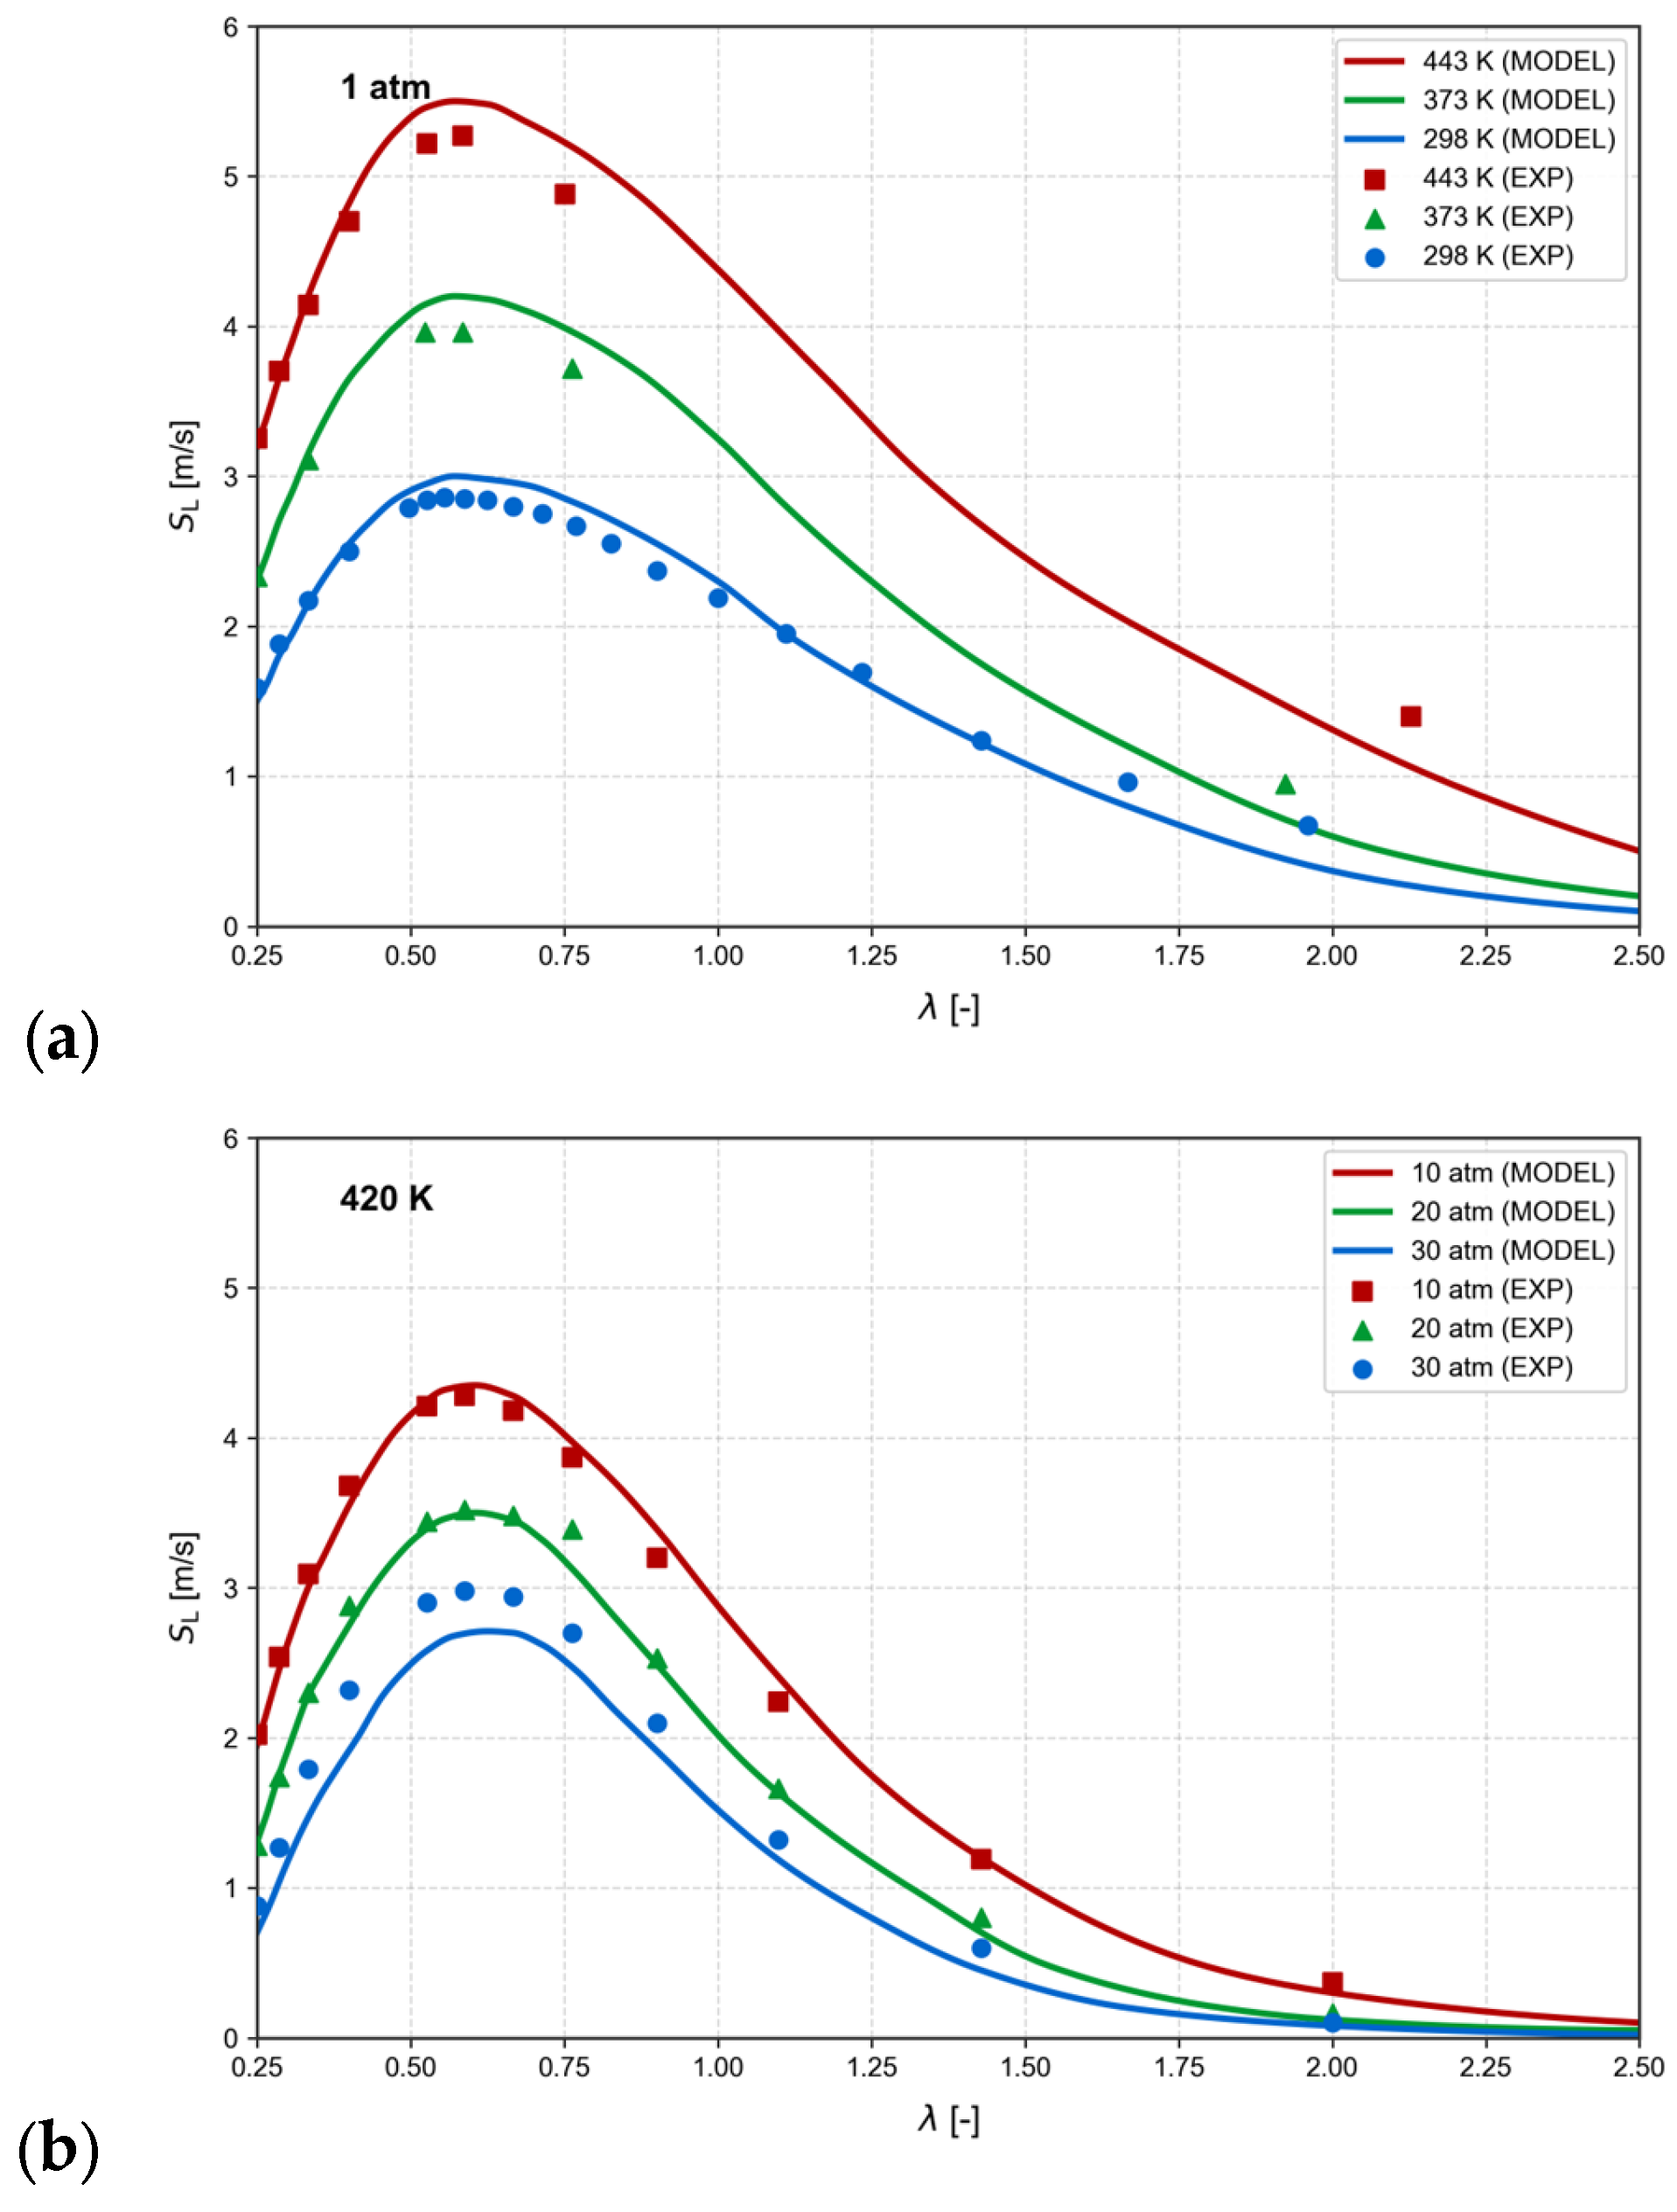
Figure 4 compares the laminar flame speed, , predicted using the O’Conaire et al. [32] hydrogen oxidation mechanism with the experimental measurements reported by Ravi et al. [34]. The comparison is performed over different air–fuel equivalence ratios () and thermodynamic conditions to assess the capability of the adopted kinetic mechanism to reproduce the main dependence of hydrogen laminar flame propagation on temperature and pressure.
Figure 4.
Comparison between calculated hydrogen laminar flame speeds and experimental measurements from Ravi et al. [34] as a function of , at different (a) unburned-gas temperatures and (b) pressures.
At ambient pressure, Figure 4a, increases substantially with increasing unburned-gas temperature over the investigated range. The kinetic mechanism reproduces both the magnitude and the temperature dependence of the experimental measurements with satisfactory agreement. When the unburned-gas temperature is kept constant and pressure is increased, as shown in Figure 4b, the laminar flame speed progressively decreases. The numerical predictions reproduce this pressure dependence, although an increasing underestimation of the experimental values is observed at the highest investigated pressure, particularly at 30 atm.
Overall, the comparison indicates that the adopted kinetic mechanism provides a satisfactory representation of the experimentally observed temperature and pressure dependence of hydrogen laminar flame speed within the range covered by the available measurements. The resulting table was therefore employed as input to the G-equation combustion model. Since experimental laminar flame-speed measurements at the high-temperature and high-pressure conditions representative of the in-cylinder environment remain limited, the table was extended beyond the conditions shown in Figure 4 to cover the thermodynamic range encountered during the engine simulations.
4.2. CFD Simulation Results
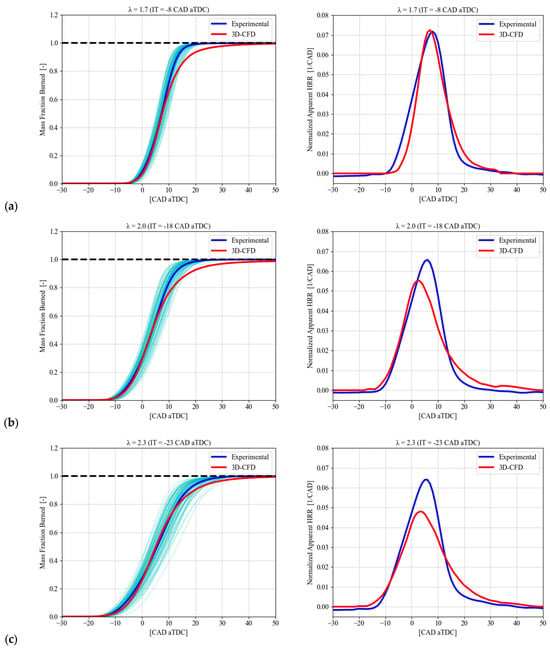
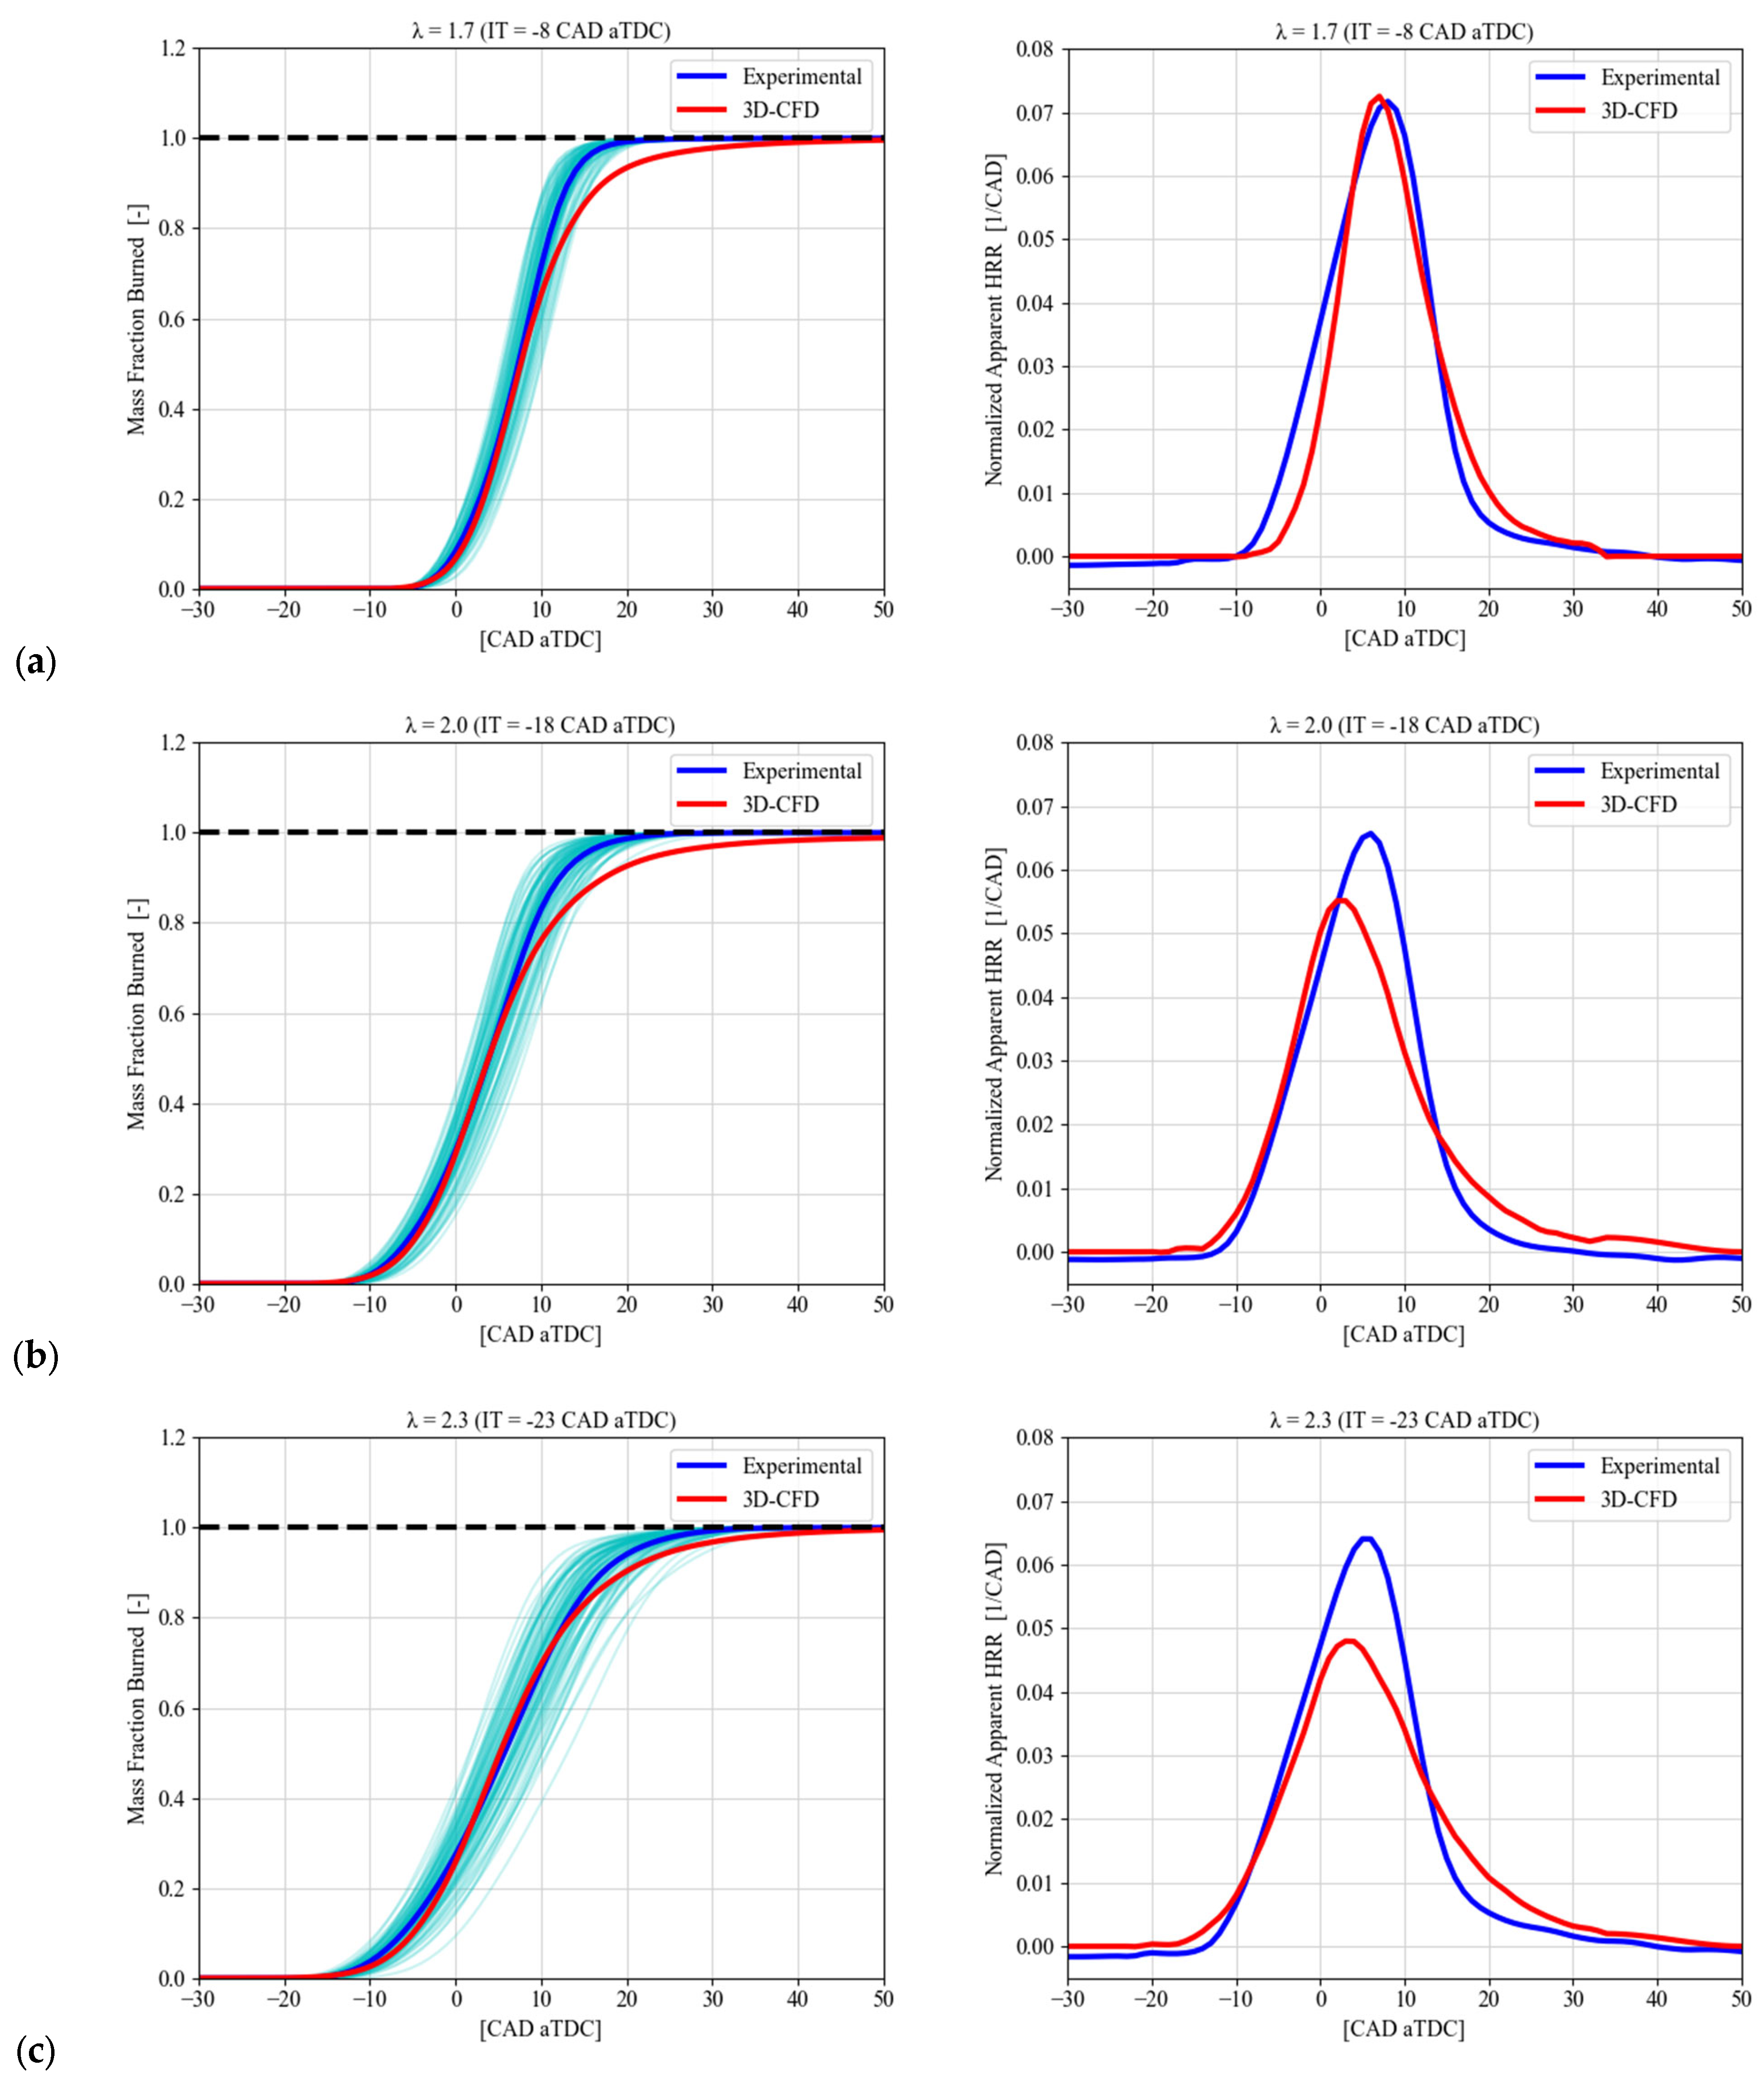
Figure 5 compares the experimental and numerical combustion evolution for the three investigated mixture conditions in terms of burned mass fraction, , and normalized apparent heat release rate. The 103 individual experimental curves are shown in cyan, together with the ensemble-averaged experimental curve in blue, while the 3D-CFD result is reported in red. The experimental data show an increasing cycle-to-cycle variability as the mixture becomes leaner.
Figure 5.
Comparison between experimental and numerical combustion evolution for the three investigated mixture conditions: (a) , (b) , and (c) . (Left): Burned mass fraction, , including the 103 individual experimental cycles (cyan), the ensemble-averaged experimental curve (blue), and the 3D-CFD result (red). (Right): Normalized apparent heat release rate obtained from the ensemble-averaged experimental data (blue) and the corresponding 3D-CFD result (red).
At , the numerical model provides a good representation of the combustion evolution. The experimental and numerical normalized apparent heat release rates reach very similar peak values, approximately 0.072 and 0.073 1/CAD, respectively. A small difference in the peak phasing is observed, while the corresponding curves remain close throughout the main combustion stage. During the late combustion phase, the numerical solution exhibits a slightly longer tail, resulting in a slower approach to complete combustion.
At , the central combustion phasing remains well reproduced, with the experimental and numerical curves showing close agreement around the middle of the combustion process. However, differences become more evident in the normalized apparent heat release rate. The experimental peak is approximately 0.066 1/CAD, whereas the numerical peak is lower, approximately 0.055 1/CAD. The numerical profile is also broader and decays more slowly after the peak, leading to a longer late-combustion phase.
This behavior becomes more pronounced at . The experimental peak normalized apparent heat release rate remains approximately 0.064 1/CAD, while the numerical value decreases to approximately 0.048 1/CAD. Despite this difference in peak combustion rate, the CFD still provides a reasonable representation of the main combustion phasing, as also indicated by the close correspondence of the curves through the central part of the combustion process. The numerical heat-release-rate profile is nevertheless broader and exhibits a slower decay, resulting in a longer predicted late-combustion phase.
Overall, the numerical model correctly reproduces the progressive effect of mixture dilution on the combustion process while retaining the same combustion-model calibration for all three operating conditions. The agreement is particularly good at , where both the combustion phasing and the peak normalized apparent heat release rate are closely reproduced. As the mixture becomes leaner, the main combustion phasing remains reasonably captured, but the numerical model predicts progressively lower peak combustion rates and broader heat-release-rate profiles. These differences indicate an increasing discrepancy in the modeled combustion-rate evolution under the leanest conditions, particularly during the late combustion stage.
The value of was selected as a common compromise over the complete set of investigated conditions and was retained unchanged as varied. The increasing differences in the combustion-rate profiles observed at the leaner conditions therefore reflect the response of the common model formulation to changes in mixture composition rather than condition-specific parameter tuning. Although an independent adjustment of at each operating point could improve the agreement with the corresponding experimental data, this would reduce the usefulness of the model for predicting conditions for which experimental combustion data are not available.
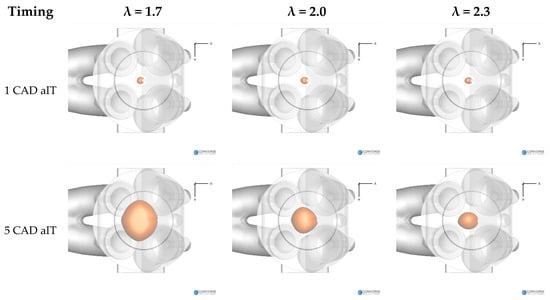
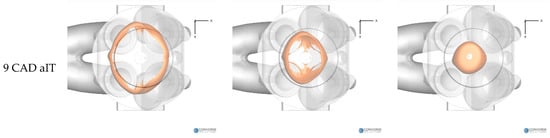
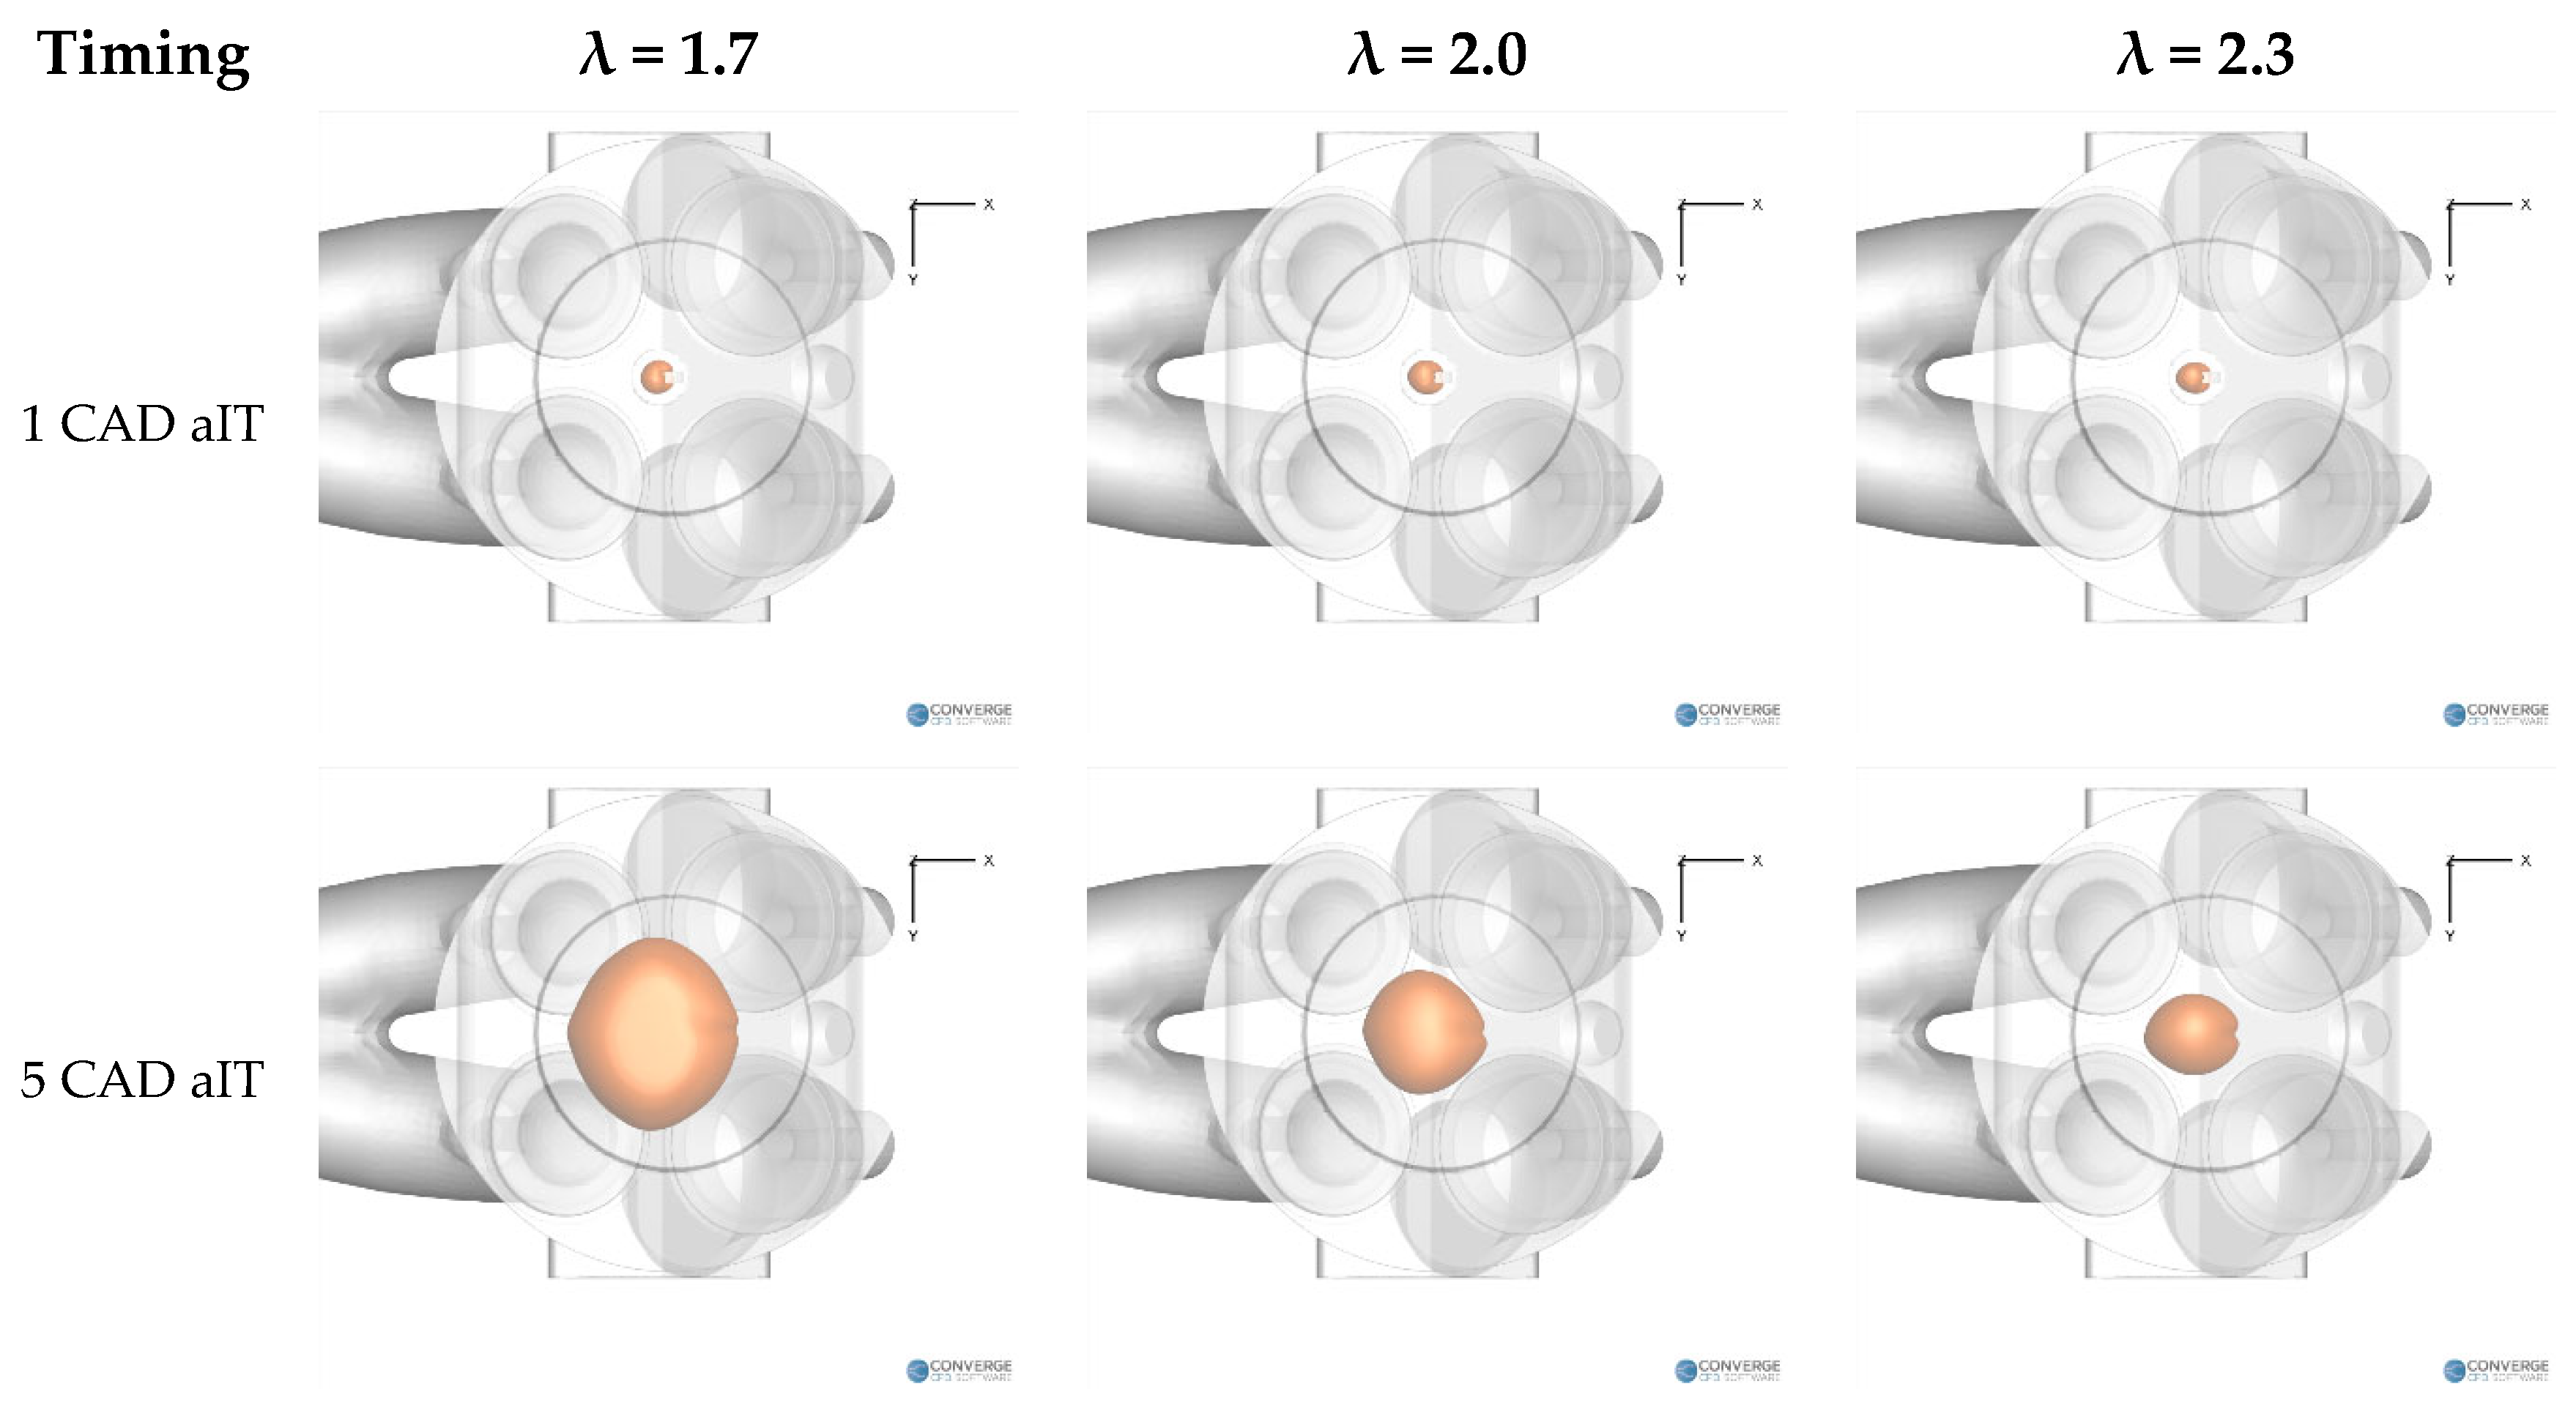
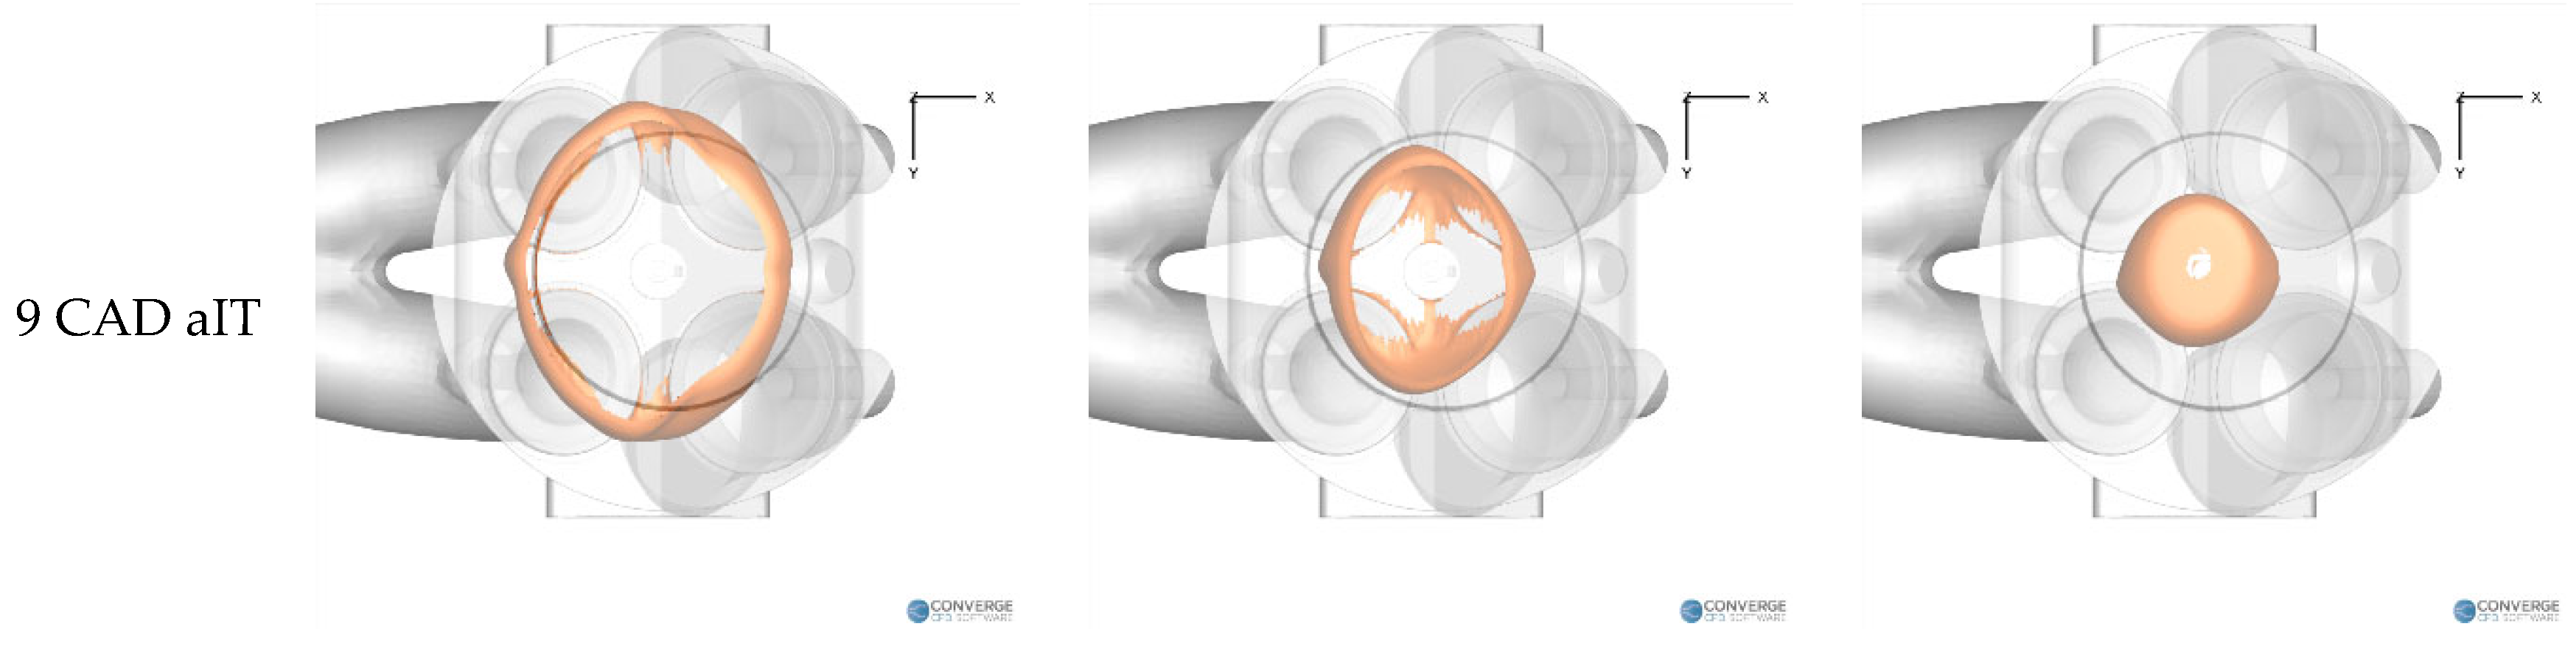
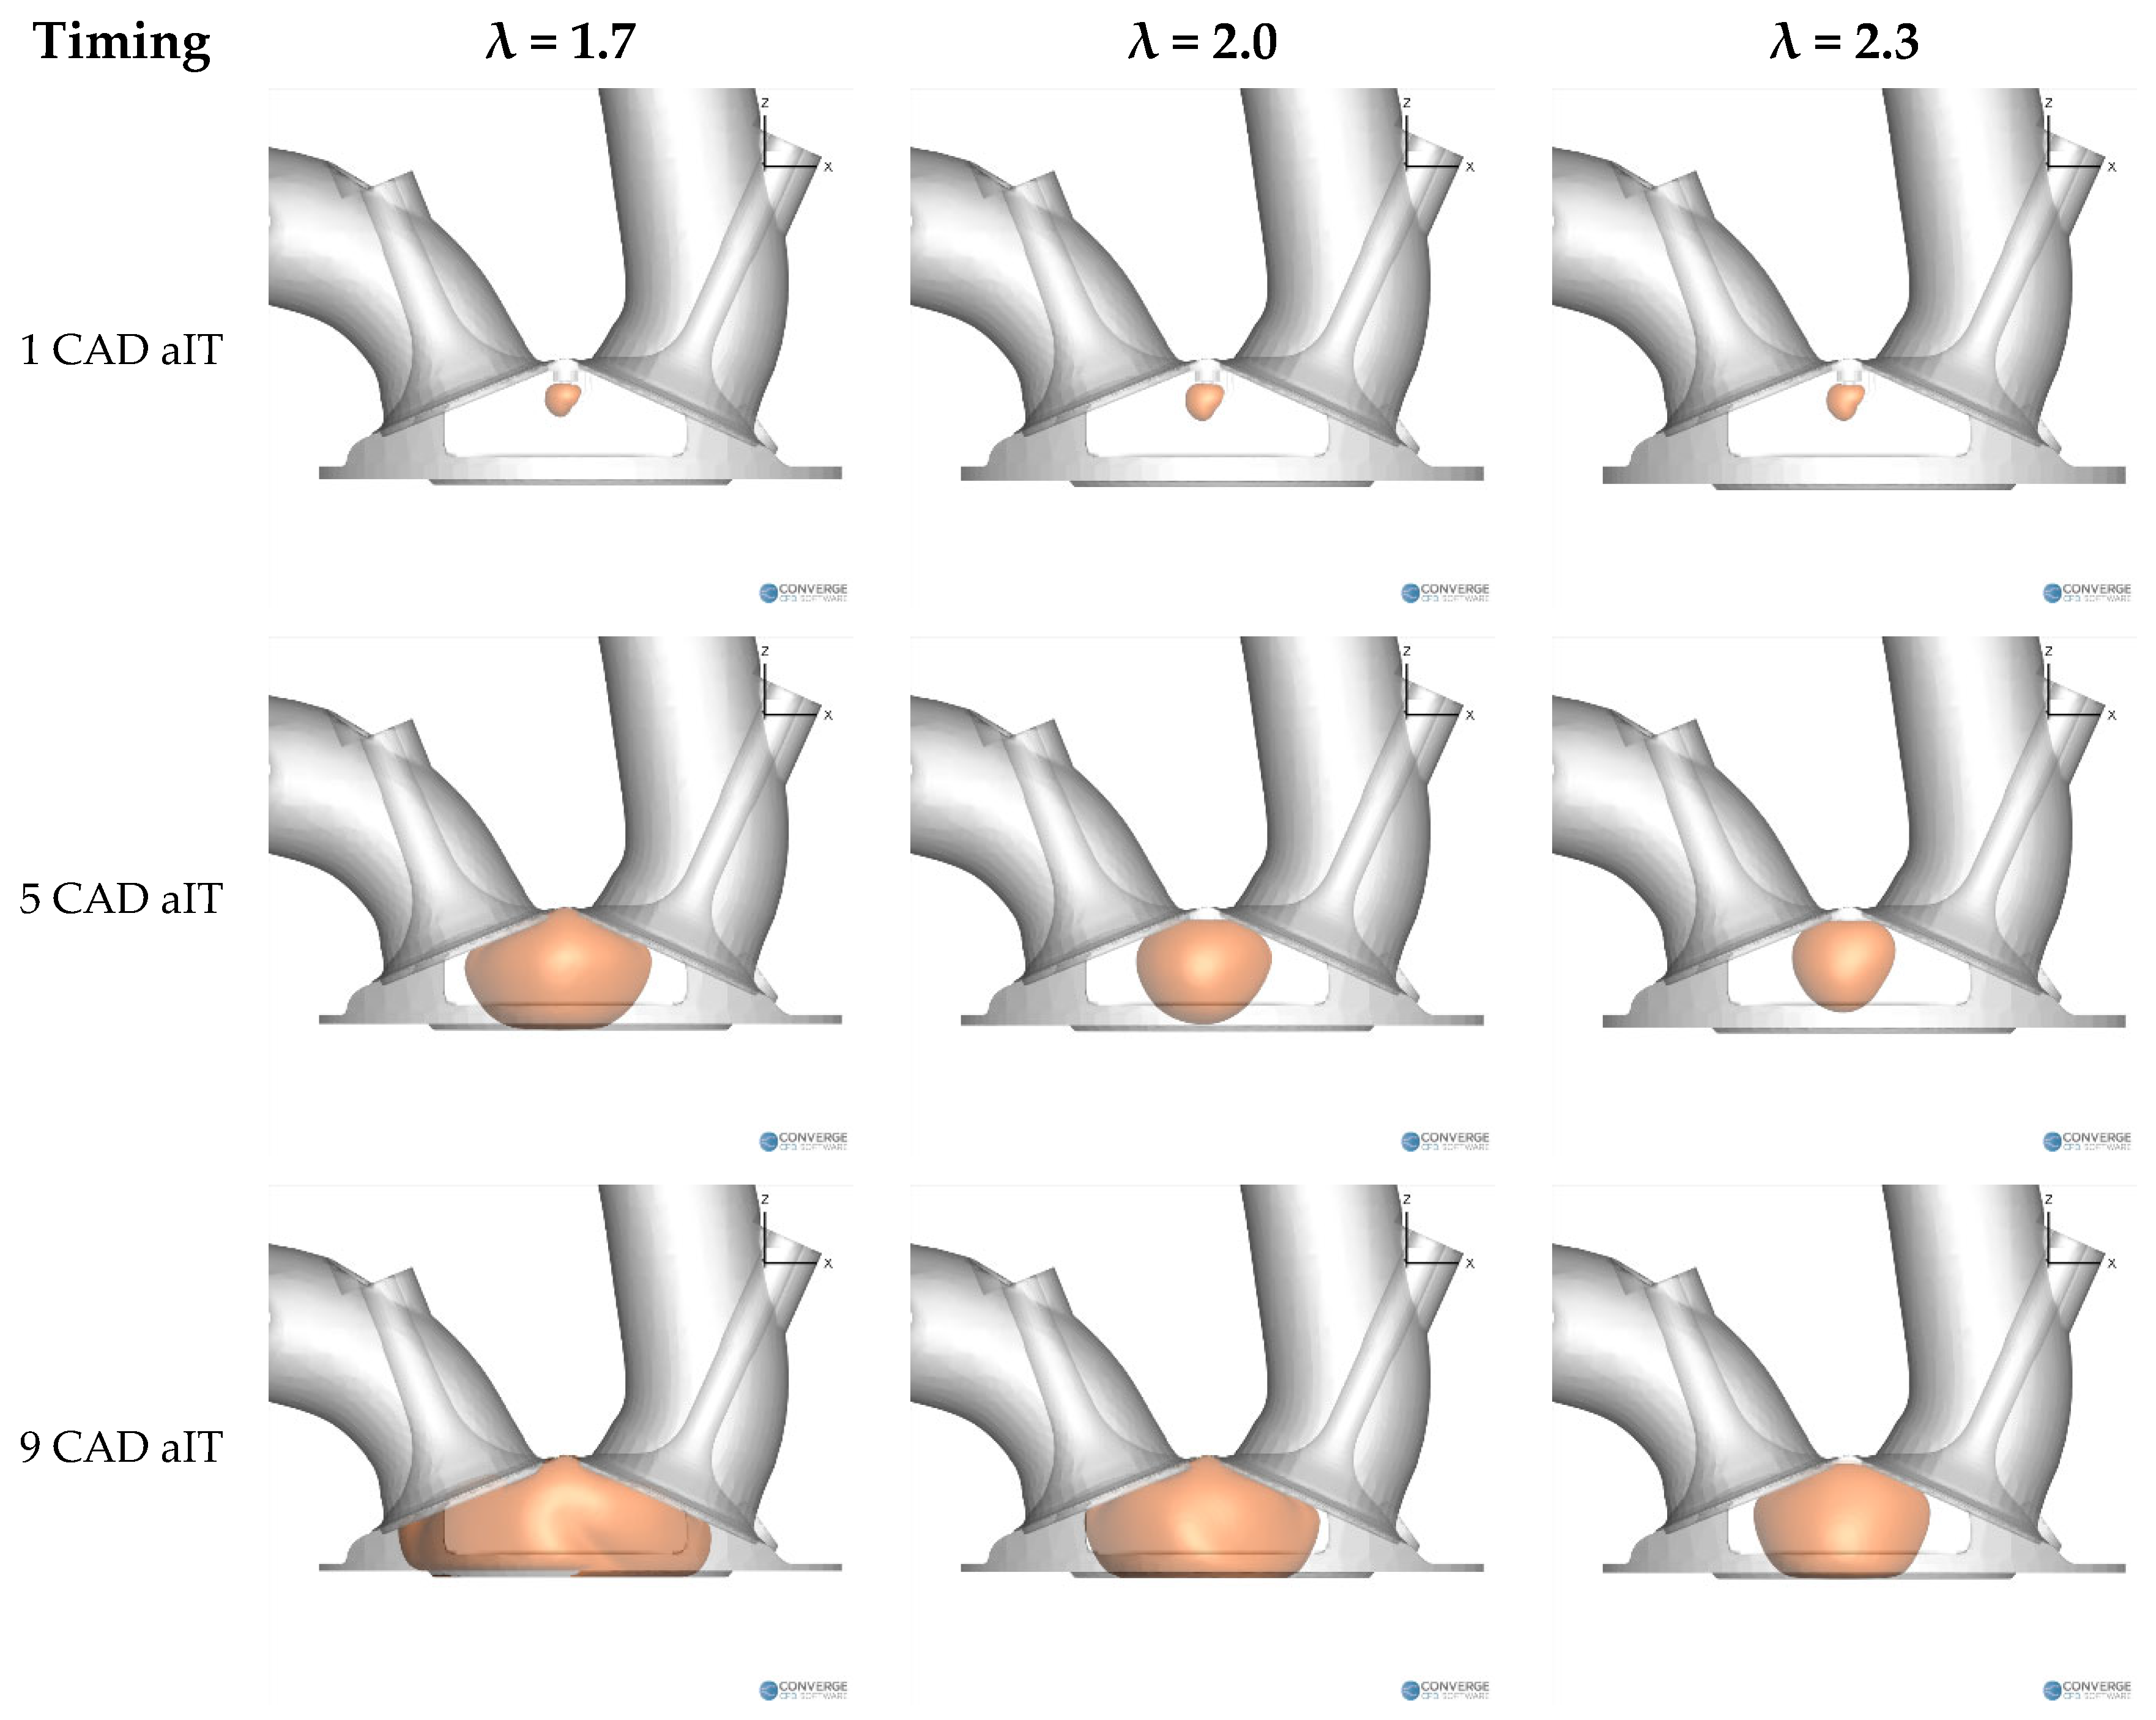
The effect of mixture dilution on the simulated flame propagation is further illustrated in Figure 6 and Figure 7, which show the iso-surface from bottom and side views, respectively, at 1, 5, and 9 CAD after ignition timing (aIT). Since the iso-surface identifies the modeled flame front, these visualizations provide a direct representation of its spatial evolution within the combustion chamber.
Figure 6.
Numerical flame-front evolution at 1, 5, and 9 CAD aIT for the three investigated mixture conditions: bottom view.
Figure 7.
Numerical flame-front evolution at 1, 5, and 9 CAD aIT for the three investigated mixture conditions: side view.
At 1 CAD aIT, the flame kernels are very similar for all three operating conditions, as their early development is primarily determined by the imposed ignition initialization. Differences become evident during the subsequent propagation phase. At a given time after ignition, the flame front covers a progressively smaller portion of the combustion chamber as increases, consistently with the reduction in laminar and turbulent flame propagation rates predicted for leaner mixtures.
At 5 CAD aIT, the flame front for has already reached the piston surface and has propagated over a substantial portion of the chamber, whereas flame development is progressively slower at and 2.3. For the leanest condition, , contact between the modeled flame front and the piston surface occurs only at approximately 9 CAD aIT. The spatial flame evolution therefore confirms the trend observed in the curves and illustrates how the common combustion-model calibration responds to the change in mixture composition.
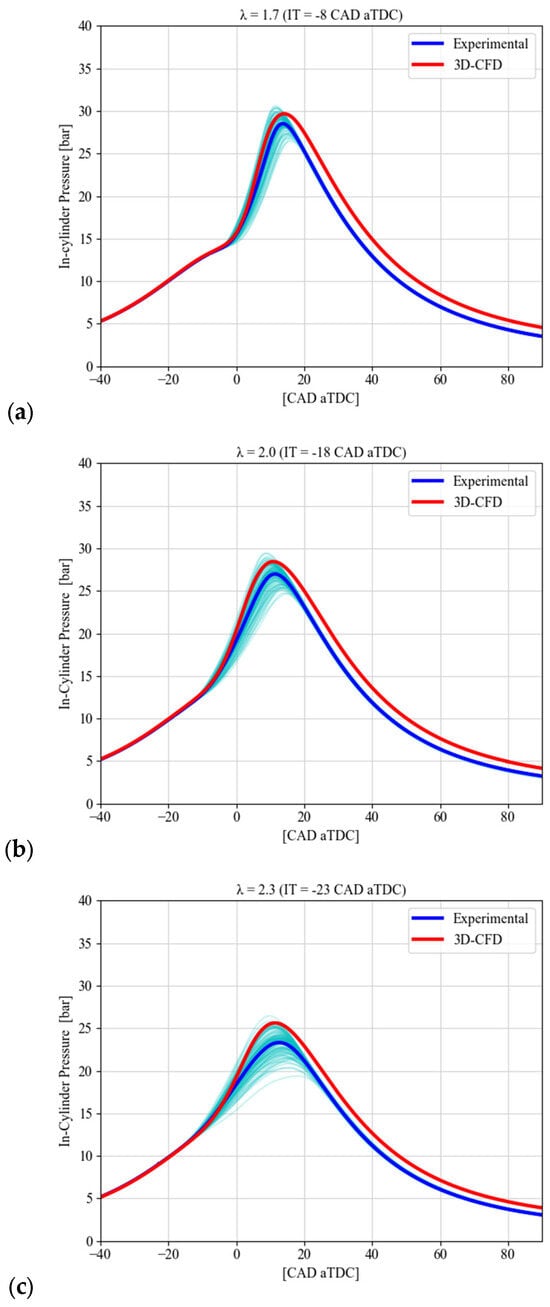
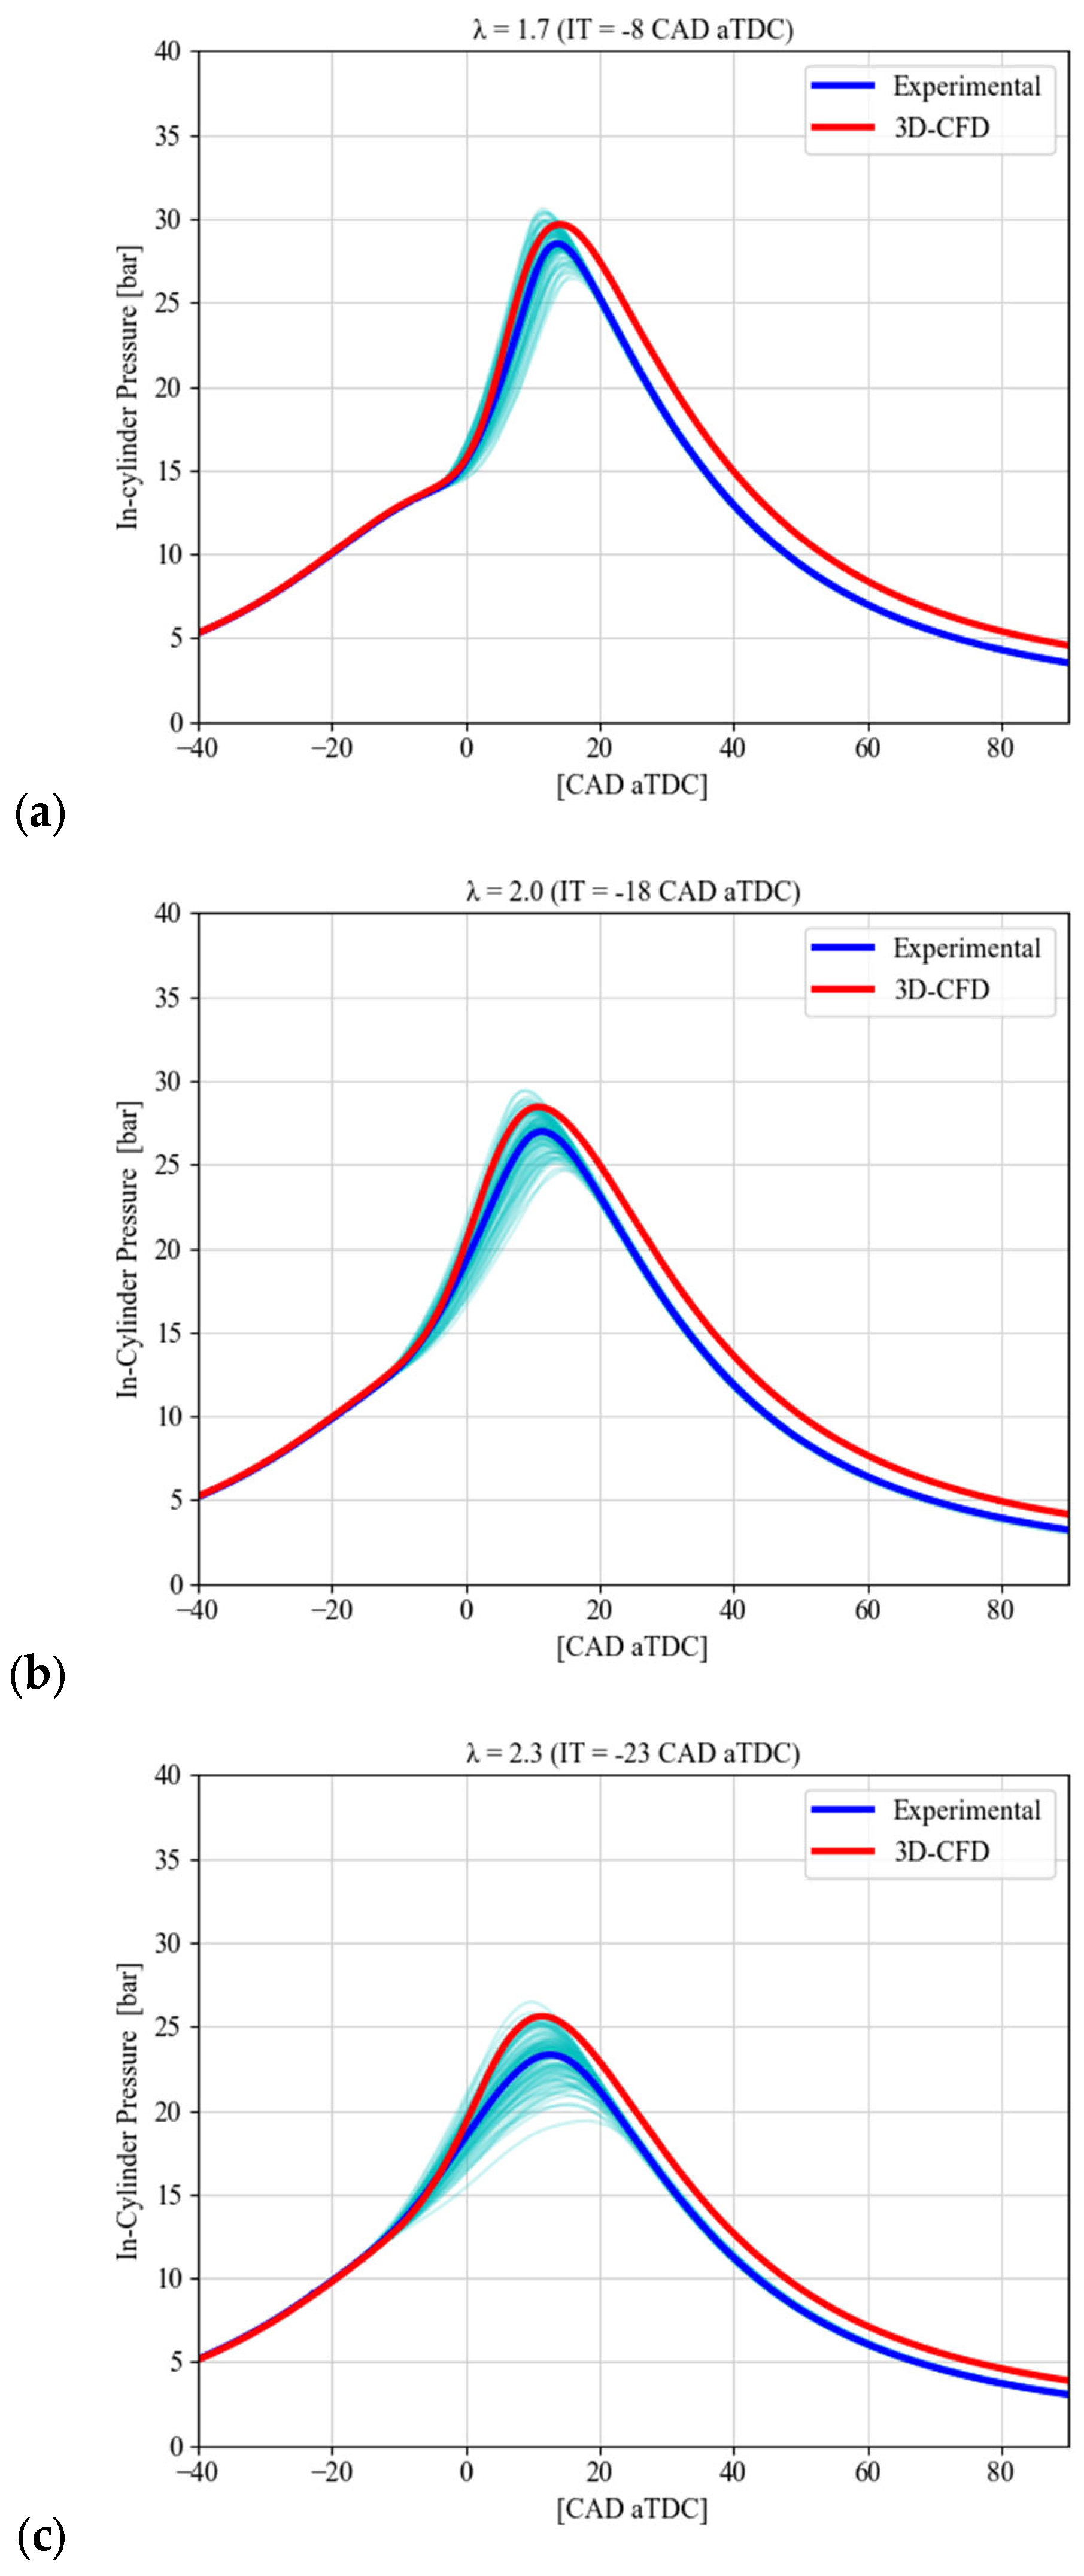
Figure 8 compares the measured and computed in-cylinder pressure traces for the three investigated mixture conditions, while the corresponding maximum pressure, , and its crank-angle location, , are summarized in Table 4. The CFD simulations reproduce the overall pressure evolution and the progressive decrease in peak cylinder pressure as the mixture becomes leaner.
Figure 8.
Comparison between experimental and numerical in-cylinder pressure traces including the 103 individual experimental cycles (cyan), the ensemble-averaged experimental curve (blue), and the 3D-CFD result (red), for the three investigated mixture conditions: (a) , (b) , and (c) .
Table 4.
Comparison between experimental and numerical maximum in-cylinder pressure (Pmax) and its location (APmax).
The numerical model slightly overpredicts for all three conditions. The experimental peak pressures are 28.51, 26.98, and 23.32 bar at , 2.0, and 2.3, respectively, compared with corresponding CFD values of 29.67, 28.44, and 25.63 bar. These differences correspond to overpredictions of approximately 4.1%, 5.4%, and 9.9%, respectively.
Taking the condition as reference, the experimentally measured decreases by approximately 5.4% at and 18.2% at . The corresponding reductions predicted by CFD are 4.1% and 13.6%, respectively. Thus, the model correctly captures the qualitative and quantitative tendency toward lower peak pressure with increasing mixture dilution, although the reduction is somewhat underestimated for the leanest condition. Some differences in the absolute pressure level can also be attributed to the non-negligible blow-by of the experimental research engine, associated with its graphite piston-ring and dry-running configuration. This effect results in a loss of in-cylinder mass during engine operation and is not explicitly represented in the CFD model.
Very good agreement is obtained for the crank-angle location of the pressure peak. The difference between CFD and experiments is 0.35 CAD for , 0.53 CAD for , and 1.23 CAD for . It should be noted that , expressed relative to TDC, does not vary monotonically with mixture dilution because the spark timing was progressively advanced from 8 CAD bTDCf at to 18 and 23 CAD bTDCf at and 2.3, respectively. Therefore, the absolute location of should be interpreted together with the corresponding ignition timing rather than as a direct indication of combustion duration.
When referenced with the corresponding ignition timing, however, the pressure peak occurs progressively later as the mixture becomes leaner. Experimentally, the interval between ignition and increases from approximately 21.7 CAD at to 29.4 and 35.6 CAD at and 2.3, respectively. The CFD simulations reproduce this trend closely, with corresponding values of 22.1, 28.9, and 34.4 CAD. This behavior is consistent with the progressive reduction in combustion rate already observed from the analysis.
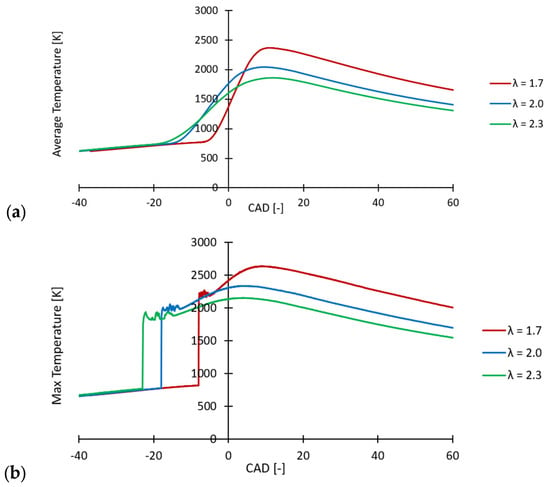
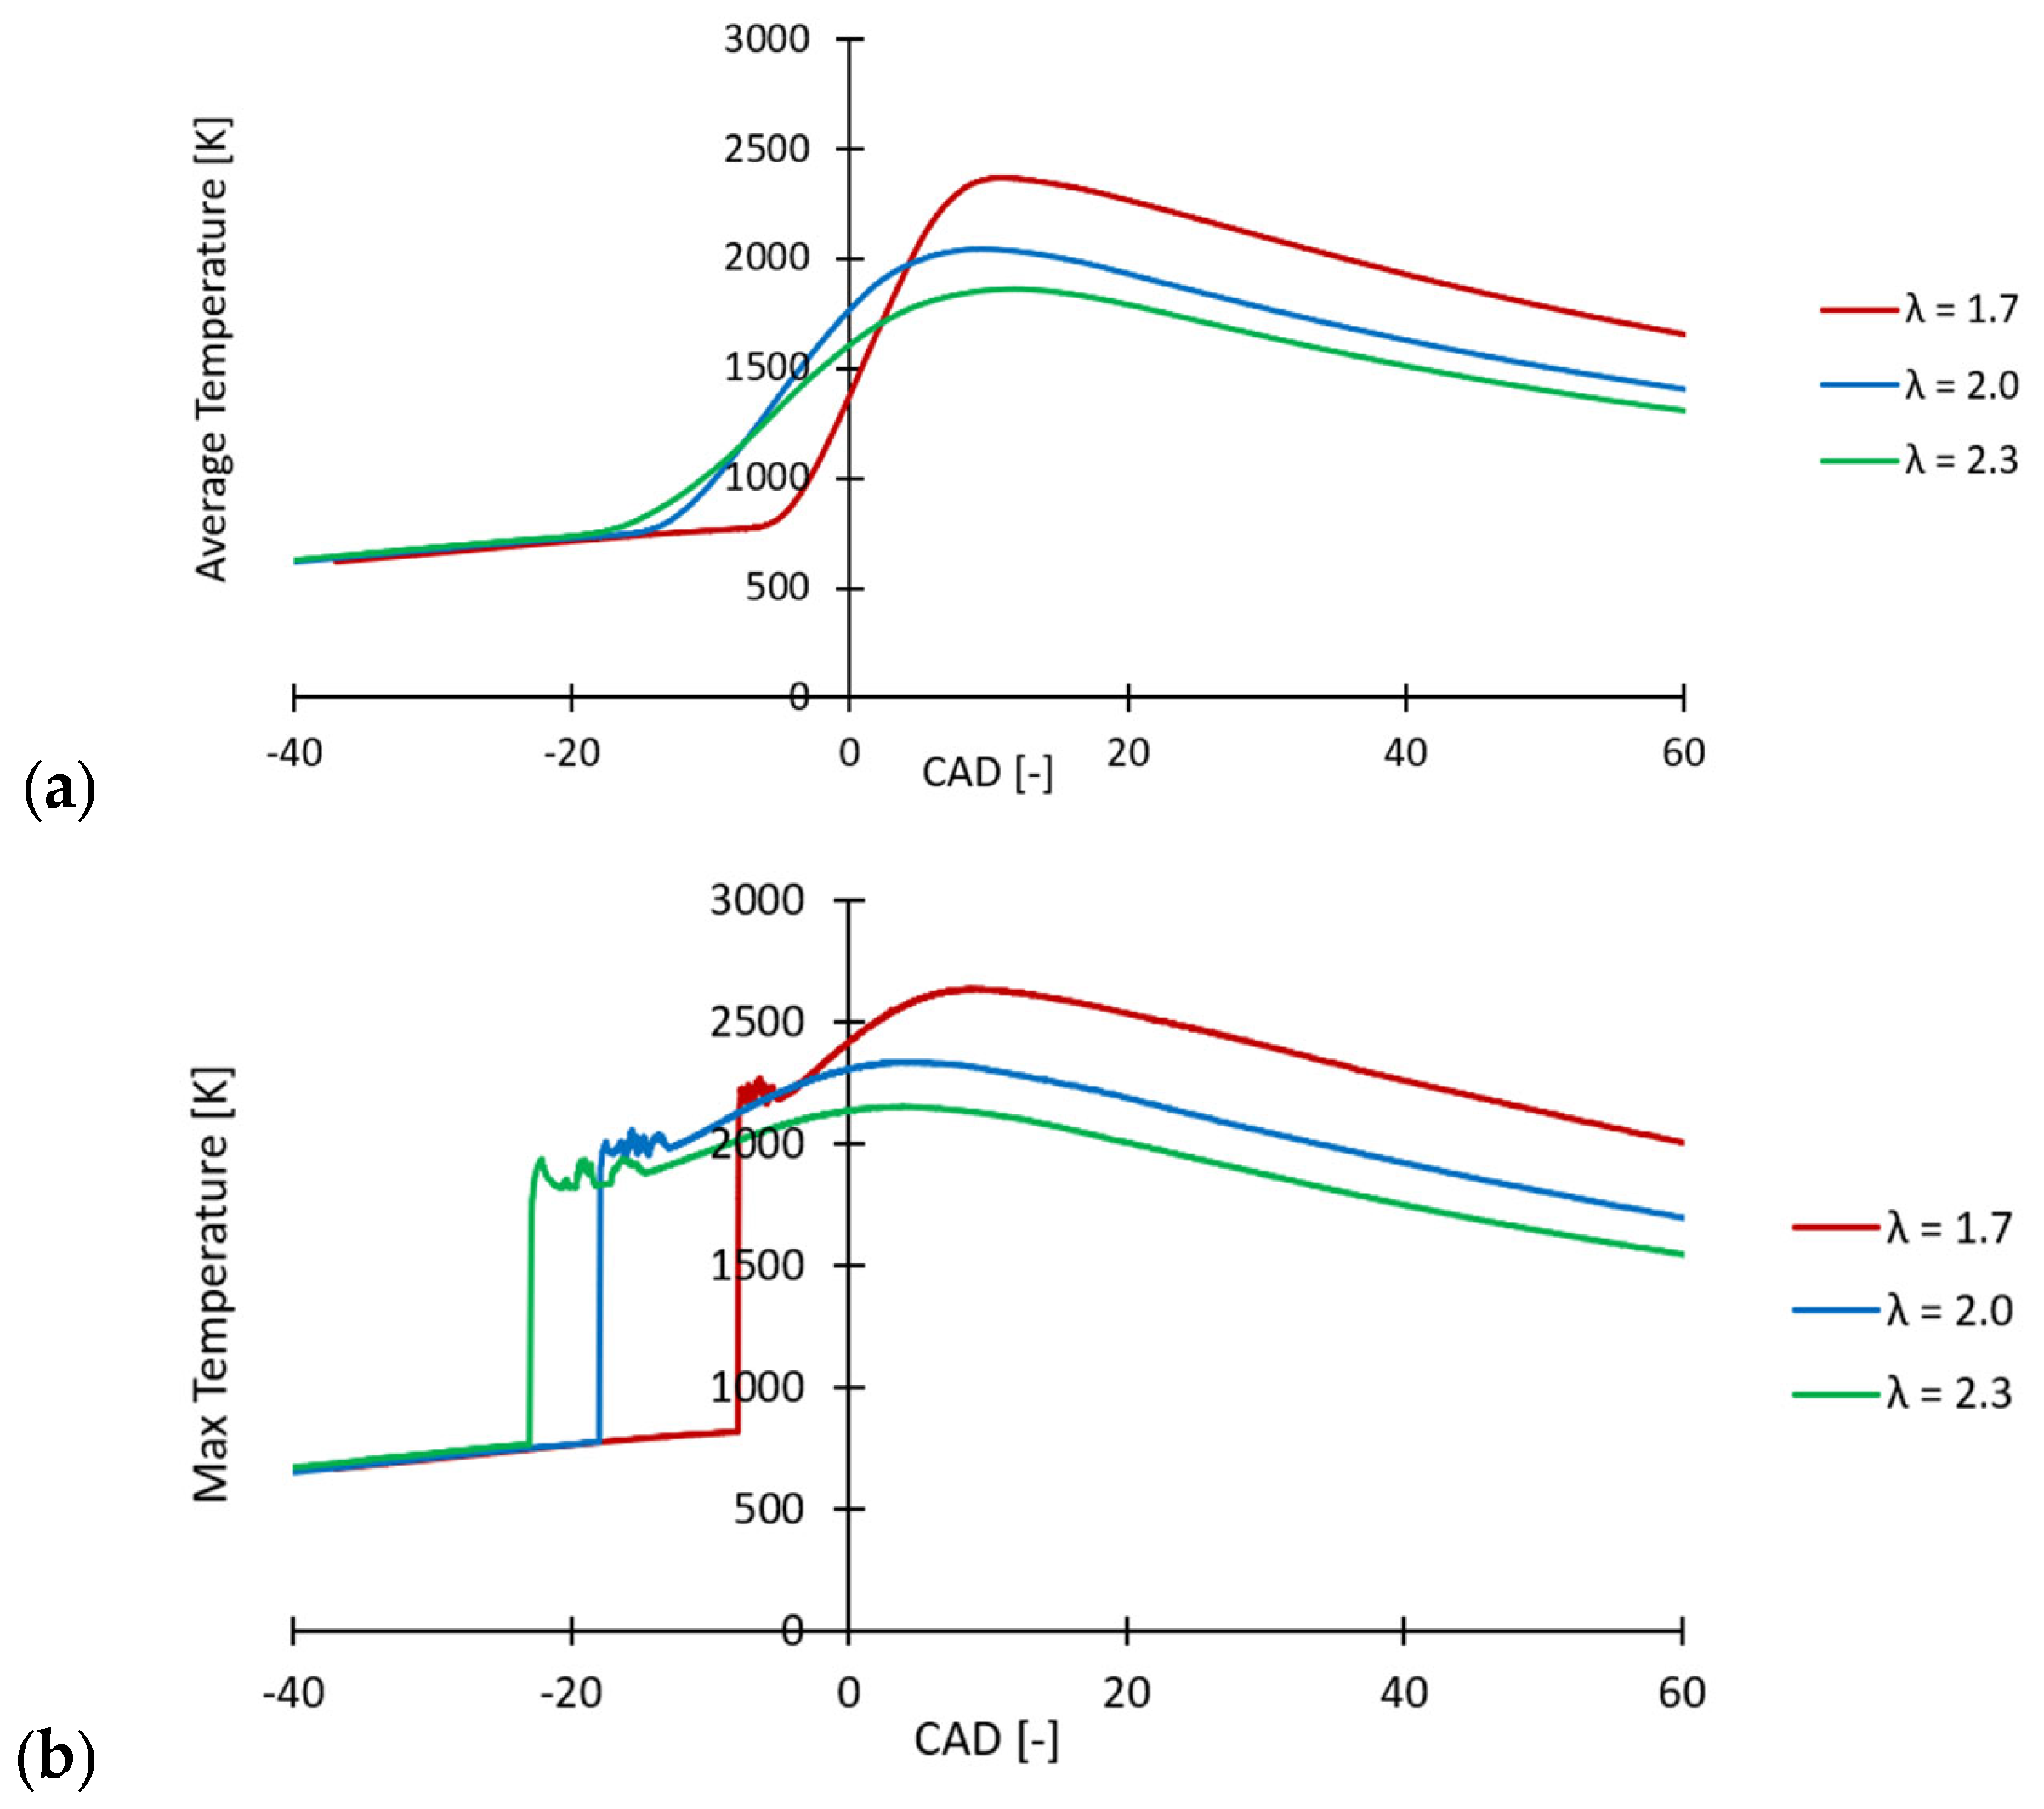
Leaning the mixture leads to a substantial reduction in the in-cylinder temperature, as shown in Figure 9. Figure 9a reports the spatially averaged in-cylinder temperature, which decreases progressively as increases. The peak average temperature is approximately 2345 K for , 2040 K for , and 1860 K for . This trend is consistent with the lower fuel energy input and increased mixture dilution associated with increasing .
Figure 9.
Comparison of numerical in-cylinder temperature for the three investigated mixture conditions: (a) spatially averaged temperature and (b) maximum local temperature. Red: ; blue: ; green: .
Figure 9b reports the instantaneous maximum local temperature within the computational domain. A sharp increase is observed immediately after ignition, which is associated with the local initialization of the flame kernel in the spark region. Following this initial localized increase, the maximum temperature evolves according to the subsequent flame propagation and remains systematically lower as the mixture becomes leaner. Maximum values of approximately 2620 K, 2340 K, and 2150 K are obtained for , 2.0, and 2.3, respectively.
The reduction in both average and maximum local temperatures with increasing is particularly relevant to NOx formation, since the thermal NO mechanism is strongly temperature dependent. The temperature trends therefore provide a direct physical basis for the substantial decrease in NOx emissions observed under leaner operating conditions.
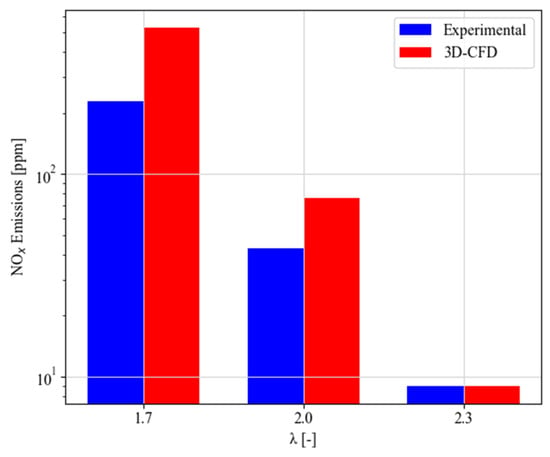
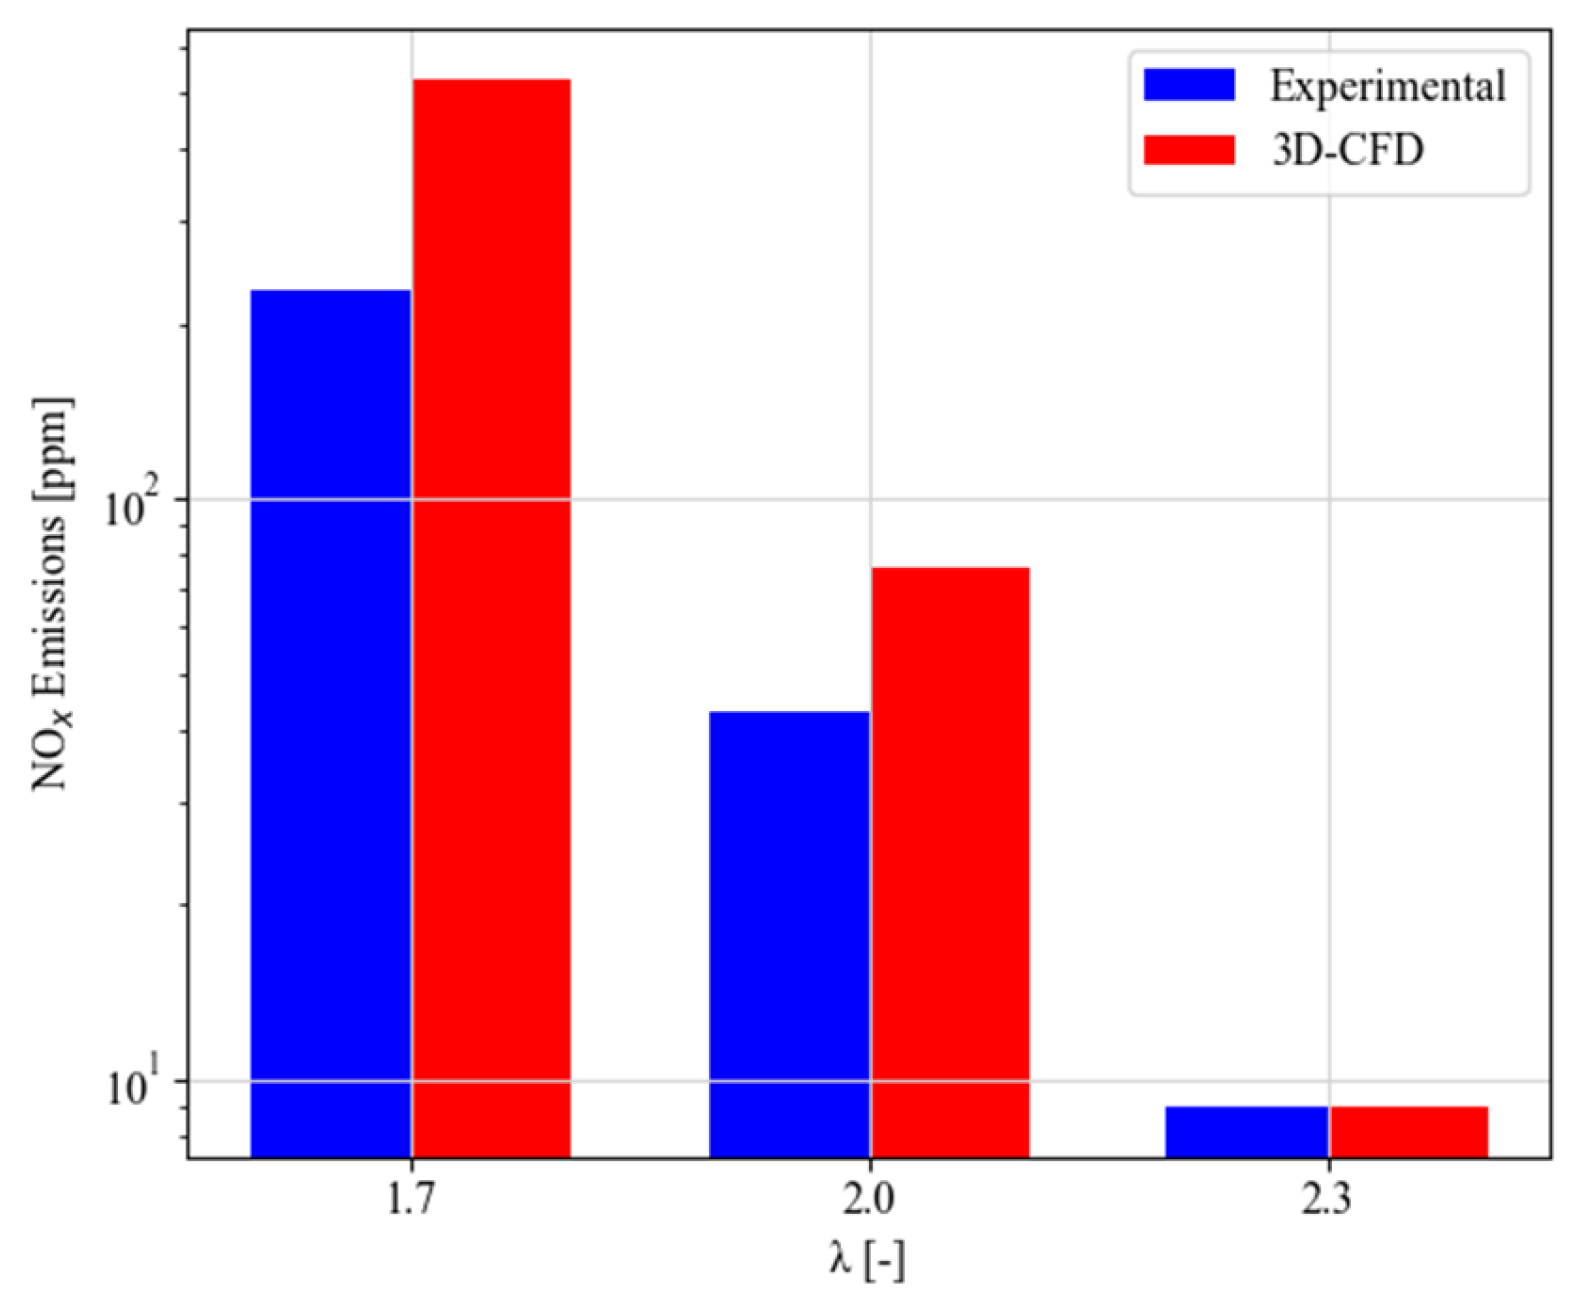
The progressive reduction in in-cylinder temperature with increasing has a direct impact on NOx formation. Figure 10 compares the experimentally measured NOx emissions with the corresponding numerical predictions obtained using the Thermal NOx model based on the extended Zeldovich mechanism.
Figure 10.
Comparison between experimental (blue) and numerical (red) NOx emissions for , 2.0, and 2.3.
The numerical results reproduce the strong reduction in NOx emissions observed experimentally as the mixture becomes leaner. Experimentally, NOx emissions decrease from approximately 230 ppm at to about 43 ppm at , corresponding to a reduction of approximately 81%. At , the measured NOx concentration falls below 10 ppm and, considering the measurement accuracy of the analyzer at such low concentrations, should be interpreted as indicating very low NOx emissions rather than as an accurate quantitative value. A similar relative trend is predicted by the 3D-CFD simulations, with NOx decreasing from approximately 500 ppm at to about 80 ppm at and below 10 ppm at , corresponding to reductions of approximately 84% and about 98%, respectively.
Although the numerical model overpredicts the absolute NOx levels at and , it correctly captures the strong relative decrease in NOx emissions with increasing mixture dilution. The higher numerical values may also be partly related to the non-negligible blow-by of the experimental engine, associated with its graphite piston rings and dry-running configuration, which is not represented in the CFD model. The resulting mass loss reduces the amount of charge retained in the cylinder and may consequently contribute to lower in-cylinder temperatures and NOx formation in the experiments. This effect may therefore account for part of the difference between the measured and predicted absolute NOx levels.
5. Conclusions
This study presented a combined experimental and numerical investigation of lean hydrogen combustion in the University of Perugia single-cylinder research engine. Three PFI operating conditions at 1000 rpm, corresponding to , 2.0, and 2.3, were investigated using a RANS G-equation combustion framework. A single value of the turbulent flame-speed model constant, , was selected as the best overall compromise across the complete set of operating conditions and remained unchanged for all simulations.
The main findings can be summarized as follows:
- The adopted hydrogen kinetic mechanism satisfactorily reproduced the experimentally observed dependence of laminar flame speed on temperature, pressure, and mixture composition, supporting its use for the generation of the table employed by the G-equation model.
- Using a common calibration, the CFD model reproduced the progressive slowing of combustion with increasing . At , both the combustion phasing and the peak normalized apparent heat release rate were closely reproduced. As the mixture became leaner, the main combustion phasing remained reasonably captured, while progressively lower peak combustion rates and broader heat-release-rate profiles were predicted.
- The reduction in peak in-cylinder pressure with increasing mixture dilution was correctly reproduced. The CFD overpredicted by approximately 4.1%, 5.4%, and 9.9% for , 2.0, and 2.3, respectively, while its crank-angle location was predicted within approximately 1.2 CAD for all conditions.
- Increasing produced a substantial reduction in in-cylinder temperature and NOx formation. The simulations predicted NOx reductions of approximately 84% and 98% at and 2.3 relative to , respectively. Experimentally, an approximately 81% reduction was measured at , while NOx emissions fell below 10 ppm at . Thus, the CFD reproduced the strong relative decrease observed experimentally, despite overpredicting the absolute NOx levels at the two less-lean conditions.
Overall, the results indicate that a single G-equation calibration can provide a consistent description of the main changes in hydrogen combustion behavior across the investigated lean operating range, without requiring condition-specific adjustment of the turbulent flame-speed parameter. These findings are limited to the investigated single-cylinder engine and the three lean operating conditions considered at 1000 rpm. Although the use of a common G-equation calibration provides encouraging results in reproducing the main combustion trends within this range, its predictive capability under different engine speeds, loads, mixture conditions, or engine configurations remains to be established through further experimental validation.
Future work will focus on further improving the physical description of lean hydrogen combustion by introducing dedicated modeling of thermo-diffusive effects and flame-wall quenching. Their implementation and systematic assessment over a wider range of operating conditions will allow the robustness of the numerical methodology and of the common calibration strategy to be further assessed.
Author Contributions
Conceptualization, J.Z. and M.B.; methodology, J.Z., M.A. and M.B.; software, J.Z., T.G. and Y.Y.; validation, J.Z. and M.A.; formal analysis, J.Z.; investigation, J.Z. and M.A.; resources, M.B.; data curation, J.Z., M.A. and M.B.; writing—original draft preparation, J.Z. and M.A.; writing—review and editing, J.Z., M.A., T.G., Y.Y. and M.B.; visualization, J.Z.; supervision, M.B.; project administration, M.B. All authors have read and agreed to the published version of the manuscript.
Funding
This research was carried out in the context of the Horizon Europe Marie Skłodowska-Curie Actions Doctoral Networks programme, project “DT-HATS—Digital-Twins for Hydrogen and Ammonia injection and ignition in engines for Transport Systems”, Grant Agreement No. 101227540.
Data Availability Statement
Dataset available on request from the authors.
Conflicts of Interest
The authors declare no conflicts of interest.
Abbreviations
The following abbreviations are used in this manuscript:
| aIT | After Ignition Timing |
| AMR | Adaptive Mesh Refinement |
| APmax | Location of Maximum In-Cylinder Pressure |
| aTDC | After Top Dead Center |
| AFR | Air–Fuel Ratio |
| bTDCf | Before Top Dead Center Firing |
| CAD | Crank Angle Degree |
| CFD | Computational Fluid Dynamics |
| CO2 | Carbon Dioxide |
| CoVIMEP | Coefficient of Variance of IMEP |
| CR | Compression Ratio |
| Damköhler Number | |
| DI | Direct Injection |
| EGR | Exhaust Gas Recirculation |
| ICE | Internal Combustion Engine |
| IMEP | Indicated Mean Effective Pressure |
| IT | Ignition Timing |
| NOx | Nitrogen Oxides |
| PFI | Port Fuel Injection |
| PISO | Pressure-Implicit with Splitting of Operators |
| Pmax | Maximum In-Cylinder Pressure |
| RANS | Reynolds-Averaged Navier–Stokes |
| RNG | Re-Normalization Group |
| SI | Spark Ignition |
| Laminar Flame Speed | |
| Turbulent Flame Speed | |
| TDI | Thermo-Diffusive Instabilities |
| TVO | Throttle Valve Opening |
| Burned Mass Fraction | |
| Relative Air–Fuel Ratio |
References
- Sun, Z.; Hong, J.; Zhang, T.; Sun, B.; Yang, B.; Lu, L.; Li, L.; Wu, K. Hydrogen engine operation strategies: Recent progress, industrialization challenges, and perspectives. Int. J. Hydrogen Energy 2023, 48, 366–392. [Google Scholar] [CrossRef] [Scilit]
- Joshi, A. Review of vehicle engine efficiency and emissions. SAE Int. J. Adv. Curr. Pract. Mobil. 2020, 2, 2479–2507. [Google Scholar] [CrossRef] [Scilit]
- Wallington, T.J.; Anderson, J.E.; Dolan, R.H.; Winkler, S.L. Vehicle emissions and urban air quality: 60 years of progress. Atmosphere 2022, 13, 650. [Google Scholar] [CrossRef] [Scilit]
- Ahmadi, P.; Torabi, S.H.; Afsaneh, H.; Sadegheih, Y.; Ganjehsarabi, H.; Ashjaee, M. The effects of driving patterns and PEM fuel cell degradation on the lifecycle assessment of hydrogen fuel cell vehicles. Int. J. Hydrogen Energy 2020, 45, 3595–3608. [Google Scholar] [CrossRef] [Scilit]
- Balli, O.; Caliskan, H. Energy, exergy, environmental and sustainability assessments of jet and hydrogen fueled military turbojet engine. Int. J. Hydrogen Energy 2022, 47, 26728–26745. [Google Scholar] [CrossRef] [Scilit]
- Qian, S.; Li, L. A comparison of well-to-wheels energy use and emissions of hydrogen fuel cell, electric, LNG, and diesel-powered logistics vehicles in China. Energies 2023, 16, 5101. [Google Scholar] [CrossRef] [Scilit]
- Onorati, A.; Payri, R.; Vaglieco, B.M.; Agarwal, A.K.; Bae, C.; Bruneaux, G.; Canakci, M.; Gavaises, M.; Günthner, M.; Hasse, C.; et al. The role of hydrogen for future internal combustion engines. Int. J. Engine Res. 2022, 23, 529–540. [Google Scholar] [CrossRef] [Scilit]
- Duan, X.; Xu, L.; Xu, L.; Jiang, P.; Gan, T.; Liu, H.; Ye, S.; Sun, Z. Performance analysis and comparison of the spark ignition engine fuelled with industrial by-product hydrogen and gasoline. J. Clean. Prod. 2023, 424, 138899. [Google Scholar] [CrossRef] [Scilit]
- Du, H.; Chai, W.S.; Wei, H.; Zhou, L. Status and challenges for realizing low emission with hydrogen ultra-lean combustion. Int. J. Hydrogen Energy 2024, 57, 1419–1436. [Google Scholar] [CrossRef] [Scilit]
- Gao, J.; Wang, X.; Song, P.; Tian, G.; Ma, C. Review of the backfire occurrences and control strategies for port hydrogen injection internal combustion engines. Fuel 2022, 307, 121553. [Google Scholar] [CrossRef] [Scilit]
- Garmsiri, S. Study of an Internal Combustion Engine to Burn Hydrogen Fuel and Backfire Elimination Using a Carburetor Fuel Delivery Method. Ph.D. Thesis, University of Ontario Institute of Technology (UOIT), Oshawa, ON, Canada, 2010. [Google Scholar]
- Ye, Y.; Gao, W.; Li, Y.; Zhang, P.; Cao, X. Numerical study of the effect of injection timing on the knock combustion in a direct-injection hydrogen engine. Int. J. Hydrogen Energy 2020, 45, 27904–27919. [Google Scholar] [CrossRef] [Scilit]
- Ceschini, L.; Morri, A.; Balducci, E.; Cavina, N.; Rojo, N.; Calogero, L.; Poggio, L. Experimental observations of engine piston damage induced by knocking combustion. Mater. Des. 2017, 114, 312–325. [Google Scholar] [CrossRef] [Scilit]
- Sfriso, S.; Berni, F.; Breda, S.; Leite, C.R.; Foucher, F.; Bréquigny, P.; Borée, J.; Fontanesi, S. On the influence of the H2 flame thermo-diffusive instability at engine-like conditions: A CFD-driven study. Energy Convers. Manag. 2025, 345, 120394. [Google Scholar] [CrossRef] [Scilit]
- Novella, R.; Gómez-Soriano, J.; González-Domínguez, D.; Olaciregui-Fontalvo, O.M. Understanding the role of thermo-diffusive instabilities in hydrogen combustion for lean-burn spark-ignition engine operation. Energy Convers. Manag. 2025, 334, 119801. [Google Scholar] [CrossRef] [Scilit]
- Ge, H.; Lee, B.; Parameswaran, S.; Zhao, P. Combustion, knock and emissions in a port-fueled spark-ignition hydrogen engine: A CFD study. Presented at the 12th U.S. National Combustion Meeting, College Station, TX, USA, 24–26 May 2021. [Google Scholar]
- Aljabri, H.; Silva, M.; Ben Houidi, M.; Liu, X.; Allehaibi, M.; Almatrafi, F.; AlRamadan, A.S.; Mohan, B.; Cenker, E.; Im, H.G. Comparative study of spark-ignited and pre-chamber hydrogen-fueled engine: A computational approach. Energies 2022, 15, 8951. [Google Scholar] [CrossRef] [Scilit]
- Teodosio, L.; Berni, F.; Lanotte, A.; Malfi, E. 1D/3D simulation procedure to investigate the potential of a lean burn hydrogen fuelled engine. J. Phys. Conf. Ser. 2022, 2385, 012085. [Google Scholar] [CrossRef] [Scilit]
- Babayev, R.; Andersson, A.; Dalmau, A.S.; Im, H.G.; Johansson, B. Computational characterization of hydrogen direct injection and nonpremixed combustion in a compression-ignition engine. Int. J. Hydrogen Energy 2021, 46, 18678–18696. [Google Scholar] [CrossRef] [Scilit]
- Rouleau, L.; Duffour, F.; Walter, B.; Kumar, R.; Nowak, L. Experimental and numerical investigation on hydrogen internal combustion engine. In Proceedings of the 15th International Conference on Engines & Vehicles, Capri, Italy, 12 September 2021. [Google Scholar] [CrossRef] [Scilit]
- Sfriso, S.; Berni, F.; Leite, C.R.; Breda, S.; Foucher, F.; Bréquigny, P.; Borée, J.; Fontanesi, S. Hydrogen and ICEs: Validation of a 3D-CFD approach for in-cylinder combustion simulations of ultra-lean mixtures with a focus on the combustion regime. Int. J. Hydrogen Energy 2025, 175, 151347. [Google Scholar] [CrossRef] [Scilit]
- Sfriso, S.; Berni, F.; Fontanesi, S.; D’Adamo, A.; Breda, S.; Teodosio, L.; Frigo, S.; Antonelli, M. Combination of G-Equation and detailed chemistry: An application to 3D-CFD hydrogen combustion simulations to predict NOx emissions in reciprocating internal combustion engines. Int. J. Hydrogen Energy 2024, 89, 161–176. [Google Scholar] [CrossRef] [Scilit]
- Gammaidoni, T.; Miliozzi, A.; Zembi, J.; Battistoni, M. Hydrogen mixing and combustion in an SI internal combustion engine: CFD evaluation of premixed and DI strategies. Case Stud. Therm. Eng. 2024, 55, 104072. [Google Scholar] [CrossRef] [Scilit]
- Avana, M.; Ricci, F.; Papi, S.; Zembi, J.; Battistoni, M.; Grimaldi, C.N. Performance analysis of hydrogen combustion under ultra lean conditions in a spark ignition research engine using a barrier discharge igniter. SAE Int. J. Adv. Curr. Pract. Mobil. 2025, 7, 1424–1436. [Google Scholar] [CrossRef] [Scilit]
- Richards, K.J.; Senecal, P.K.; Pomraning, E. CONVERGE, version 3.1; Convergent Science: Madison, WI, USA, 2022.
- Yakhot, V.; Orszag, S.A. Renormalization group analysis of turbulence. I. Basic theory. J. Sci. Comput. 1986, 1, 3–51. [Google Scholar] [CrossRef] [Scilit]
- Han, Z.; Reitz, R.D. Turbulence modeling of internal combustion engines using RNG κ–ε models. Combust. Sci. Technol. 1995, 106, 267–295. [Google Scholar] [CrossRef] [Scilit]
- Zembi, J.; Cruccolini, V.; Mariani, F.; Scarcelli, R.; Battistoni, M. Modeling of thermal and kinetic processes in non-equilibrium plasma ignition applied to a lean combustion engine. Appl. Therm. Eng. 2021, 197, 117377. [Google Scholar] [CrossRef] [Scilit]
- Battistoni, M.; Mariani, F.; Risi, F.; Poggiani, C. Combustion CFD modeling of a spark ignited optical access engine fueled with gasoline and ethanol. Energy Procedia 2015, 82, 424–431. [Google Scholar] [CrossRef] [Scilit]
- Zembi, J.; Mariani, F.; Battistoni, M. Large eddy simulation of ignition and combustion stability in a lean SI optical access engine. In Proceedings of the 14th International Conference on Engines & Vehicles, Capri, Italy, 15 September 2019. [Google Scholar] [CrossRef] [Scilit]
- Zembi, J.; Battistoni, M.; Mariani, F.; Irimescu, A.; Vaglieco, B.M.; Merola, S.S. Investigations on the impact of port water injection on soot formation in a DISI engine through CFD simulations and optical methods. Fuel 2023, 337, 127170. [Google Scholar] [CrossRef] [Scilit]
- Conaire, M.Ó.; Curran, H.J.; Simmie, J.M.; Pitz, W.J.; Westbrook, C.K. A comprehensive modeling study of hydrogen oxidation. Int. J. Chem. Kinet. 2004, 36, 603–622. [Google Scholar] [CrossRef] [Scilit]
- Peters, N. Turbulent Combustion; Cambridge University Press: Cambridge, UK, 2000. [Google Scholar] [CrossRef] [Scilit]
- Ravi, S.; Petersen, E.L. Laminar flame speed correlations for pure-hydrogen and high-hydrogen content syngas blends with various diluents. Int. J. Hydrogen Energy 2012, 37, 19177–19189. [Google Scholar] [CrossRef] [Scilit]

Disclaimer/Publisher’s Note: The statements, opinions and data contained in all publications are solely those of the individual author(s) and contributor(s) and not of MDPI and/or the editor(s). MDPI and/or the editor(s) disclaim responsibility for any injury to people or property resulting from any ideas, methods, instructions or products referred to in the content. |
© 2026 by the authors. Licensee MDPI, Basel, Switzerland. This article is an open access article distributed under the terms and conditions of the Creative Commons Attribution (CC BY) license.