


Abstract
Large-scale energy storage has become critical for the integration of renewable energy. Compressed air energy storage (CAES) imposes urgent demands on the precise evaluation and efficient exploitation of high-quality salt cavern resources. The Dawenkou Basin is a typical continental layered rock salt distribution area in North China, and the assessment of its salt cavern energy storage potential is vital for regional energy storage layout planning. Taking the continental layered salt deposits in the Dawenkou Basin as the research target, this study integrates 3D seismic surveys, borehole data interpretation, and machine learning algorithms to establish a 10-indicator evaluation system tailored to the energy storage potential of continental layered rock salt. By adopting a coupled weighting method that combines random forest and the analytic hierarchy process, three primary controlling factors are identified: the number of salt layers, thickness of salt layers and depth of salt layers. Quantitative zoning of energy storage potential and optimal zone selection are completed at the basin scale. The results reveal that the high-potential zone for salt cavern energy storage in the Dawenkou Basin covers an area of 12.8 km2 and is capable of generating 11,542~14,333 × 104 m3 of salt cavern volume; the medium-potential zone spans 15.87 km2, with a feasible salt cavern volume of 5773~7169 × 104 m3; and the low-potential zone occupies 25.15 km2, corresponding to a salt cavern volume of 7764~9642 × 104 m3. The evaluation method for the energy storage potential of continental layered rock salt developed in this research fills the gap in evaluation frameworks for thin interbedded rock salt and provides a standardized technical paradigm for the exploitation of salt cavern energy storage resources in analogous salt basins across North China. The evaluation findings can offer scientific support for regional novel energy storage industrial planning and engineering site selection.
1. Introduction
Against the background of greenhouse gas emissions and global warming, finding renewable clean energy sources to replace conventional fossil fuels for energy conservation and emission reduction, and achieving carbon peaking and carbon neutrality have become critical challenges for humanity in the 21st century. Energy sources such as wind and solar power inherently lack a continuous and stable supply, posing a series of challenges to grid stability and constraining the rapid development of clean energy [1,2,3,4,5,6].
China’s energy production and consumption revolution urgently requires solutions to major challenges, such as the large-scale integration of renewable energy [2,7,8,9,10]. Energy storage is an important technological solution for enabling the widespread utilization and stable output of renewable energy. Converting clean energy sources such as wind and solar power into compressed air potential energy and utilizing deep underground spaces (artificial caverns, tunnels, salt caverns, etc.) for large-scale energy storage are among the internationally proven effective approaches for overcoming the intermittent nature of the clean energy supply.
Additionally, deep underground spaces can be utilized to store strategic resources such as petroleum, natural gas, hydrogen, and helium within deep salt formations [2]. Salt caverns offer advantages such as high injection-production rates and large short-term throughput capacities. In many countries’ energy reserves, salt cavern storage constitutes a significant proportion [11,12,13,14].
The Dawenkou Basin in Shandong Province, China, has abundant salt cavern resources [10]. The favorable geological conditions of the Dawenkou Basin in Shandong Province have attracted numerous salt enterprises to engage in brine extraction. The study area boasts a long history of rock salt mining, with the earliest extraction wells dating back more than 30 years. The primary extraction method employs horizontal connecting wells to access brine, with the initial mining layer being the 7th layer, which progresses upward from the bottom. More than 10 salt enterprises have established operations in the study area (in Taian), with registered mining rights covering a total area of 20.25 km2, accounting for approximately 45% of the total rock salt deposit area. A total of 62 pairs of connecting wells are in operation. The annual salt production reaches 7.95 million tons, which translates to more than 3 million m3 of salt cavern space being formed annually. On the basis of the 3D seismic exploration results, the study area has formed more than 70 groups of salt caverns with diverse morphologies, making them excellent sites for compressed air energy storage and natural gas storage.
The construction of salt cavern gas storage facilities represents a comprehensive and complex systems-engineering endeavor. Site selection, as the initial critical step in reservoir development, is constrained by numerous factors [5]. How to systematically and precisely characterize the morphology of these abundant salt caverns, select geological sites and evaluate their usability, optimize high-potential salt caverns for energy storage reservoirs, and ensure their safe operation are critical technological challenges that demand urgent resolution. Considerations extend beyond geological conditions within the mining area to encompass transportation logistics, environmental protection, and national strategic planning.
Current research on salt cavern storage facilities focuses primarily on construction techniques, cavern stability, and the mechanical properties of salt rock [15,16,17]. While site selection has been addressed in numerous publications, specialized studies evaluating storage site suitability remain scarce. Among the evaluation methods, the analytic hierarchy process (AHP) and gray theory, both originating from risk assessment fields, are the most commonly employed [18,19,20].
North America and Europe have developed evaluation indicator systems applicable to salt domes and bedded salt rocks, respectively [15,16,17]. However, these systems cannot be directly transferred to continental bedded salt rocks in China. At present, most domestic and international assessments of salt cavern energy storage potential focus on single geological or engineering factors. Comprehensive evaluation systems integrating multi-indicator coupling, machine learning and traditional methods remain scarce, and they show poor adaptability to the characteristics of continental bedded salt rocks in China, such as multi-layer interbedding, strong heterogeneity and well-developed interlayers. The evaluation accuracy and engineering practicality need further improvement. China is rich in rock salt resources, where continental bedded salt rocks account for an absolute majority. Nevertheless, the thin salt beds, abundant interlayers and strong lateral heterogeneity, together with inadequate evaluation methods and inconsistent standards, restrict the efficient utilization of such resources.
In this paper, the AHP is employed to establish a comprehensive evaluation system for potential salt cavern energy storage zones. By integrating machine learning methods, the weights assigned to 10 fundamental geological parameters within this model across the entire evaluation framework were determined. By integrating expert opinions and relevant theoretical research, this study proposes grading criteria for each fundamental indicator within the evaluation system, along with potential grading standards for salt cavern storage. By combining the weighted calculation results of all the indicators, classification criteria for energy storage potential zones in the Dawenkou Basin are established, providing a feasible methodology and theoretical basis for site selection and optimization in Shandong Province’s salt cavern energy storage projects.
2. Regional Geological Background of the Dawenkou Basin
2.1. Regional Tectonics
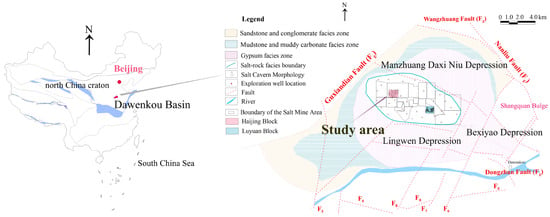
The Dawenkou Basin–Wenkou Depression is located in the central-western part of the North China Plate (I) within the West Shandong Uplift Zone (II) and Central Shandong Uplift (III). It borders the Bushan Uplift (V) to the northeast; to the northwest, it borders the Dongping Uplift (V); to the southeast, it connects with the Mengshan Uplift (V); and to the east, it is connected to the Wendoing Depression (V), forming a north-fractured, south-overhanging, scoop-shaped basin (see Figure 1).
Figure 1.
Comprehensive Geological Map of the Dawenkou Basin.
2.2. Regional Stratigraphy
The regional stratigraphy primarily comprises the Neoproterozoic Taishan Group (Ar3T), the Paleozoic Cambrian Changqing Formation (∈2-3ĉ), the Cambrian–Ordovician Jiulong Group (∈3-O1J), the Ordovician Majiagou Group (O2-3M), the Carboniferous–Permian Yuemengou Group (C2-P2Y), the Permian Shihezi Group (P2-3 ŝ), the Mesozoic Triassic Shiquanfeng Group (T1ŝ), the Jurassic Zibo Group (J2-K1z), the Cretaceous Qingshan Group (K1Q) and Laiyang Group (K1L), the Cenozoic Paleogene Guan Zhuang Group (K2-EG), the Neogene Huanghua Group (NH), the Linqu Group (NL), and the Quaternary Group (Q).
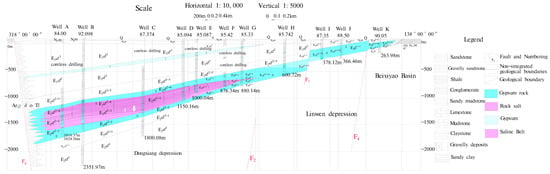
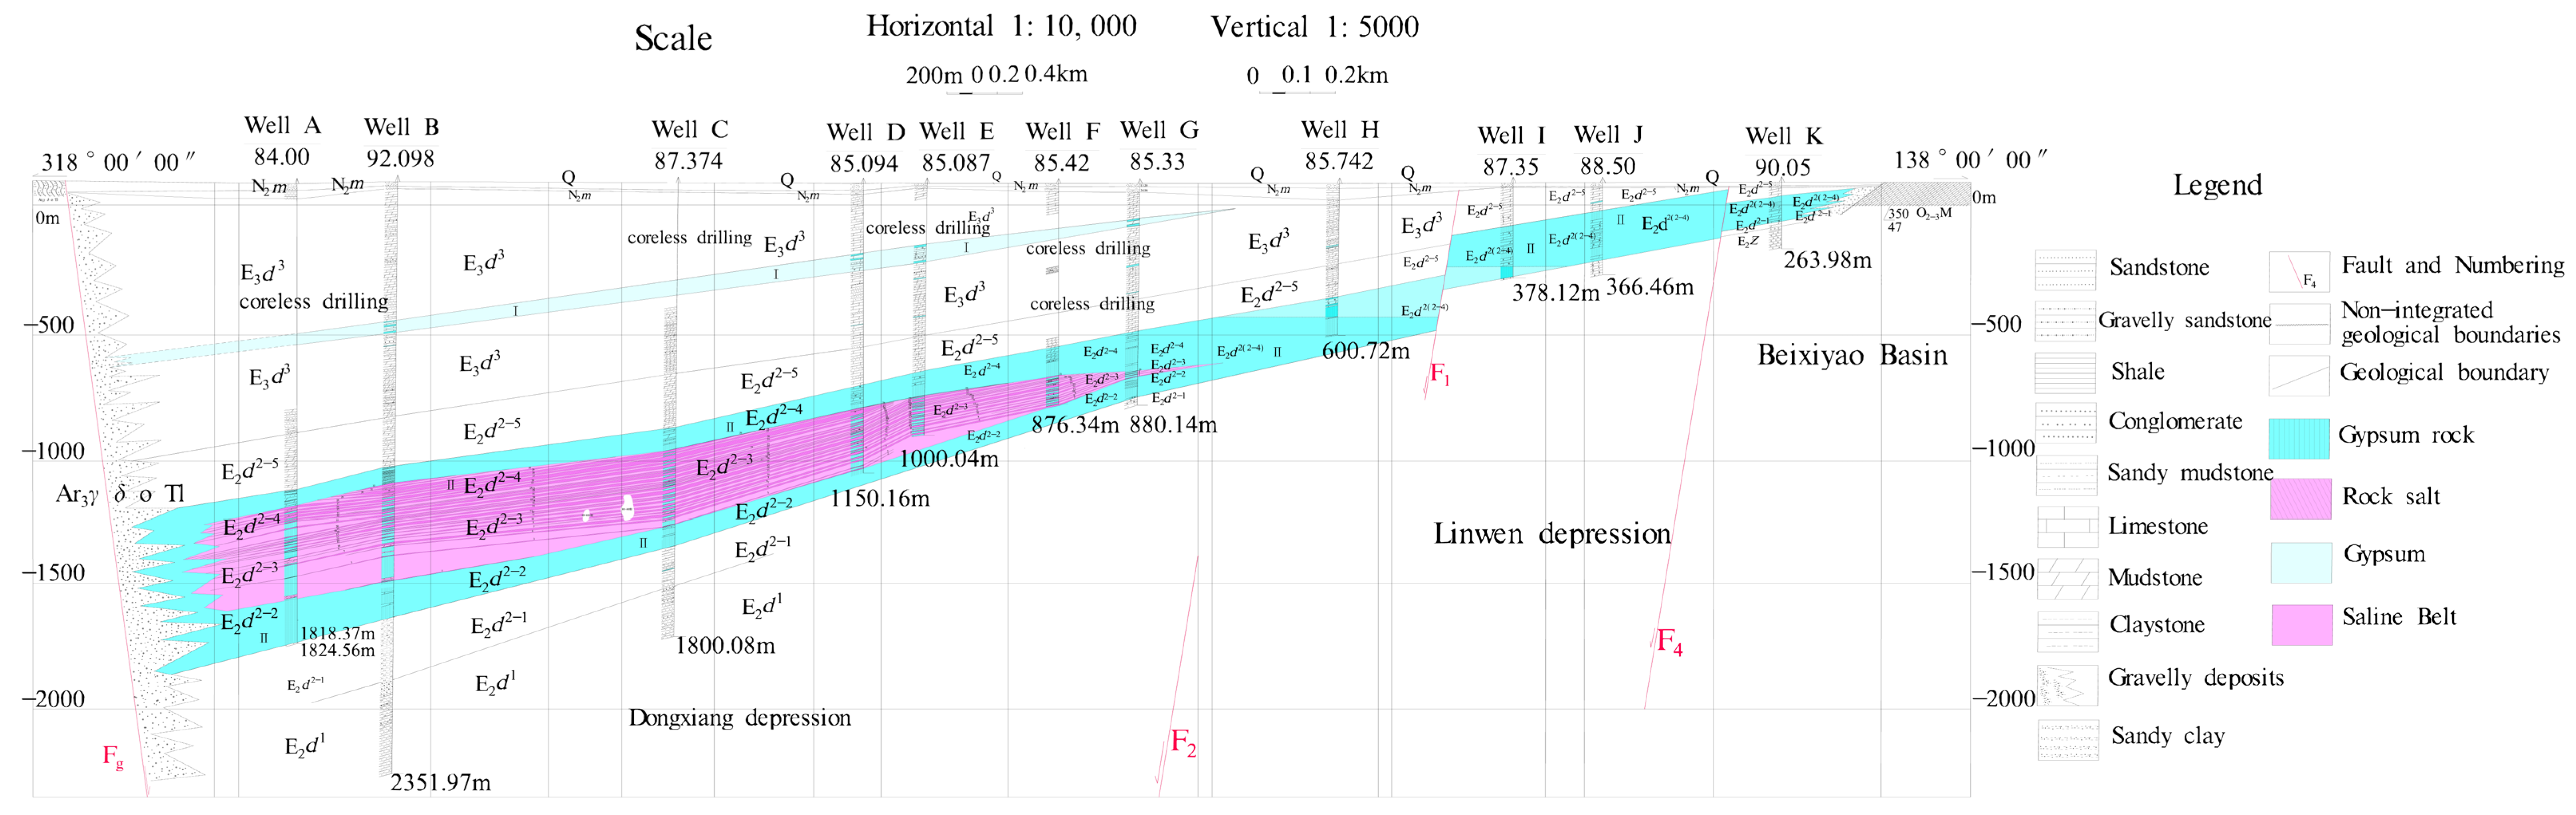
The Dawenkou Formation of the Paleogene Guanzhuang Group is a fluvio-lacustrine sedimentary succession consisting of clastic rocks and chemical rocks. It is divided into three members from bottom to top. The middle member hosts the salt ore beds and comprises a sequence of grey, thick-bedded marl and evaporite deposits. Based on lithological characteristics, this member can be further subdivided into five lithological intervals in ascending order: sub-gypsum mudstone, pre-salt gypsum, salt-bearing, post-salt gypsum and supra-gypsum marl. The stratigraphic sequence is fully developed in the basin center, with thickness ranging from 50 to 1000 m, as shown in Figure 2.
Figure 2.
Lithological and Facies Profile of the Dawenkou Basin, Shandong Province.
2.3. Salt Phase Classification and Distribution in the Dawenkou Basin
Evaporite deposits from the late Eocene to early Oligocene in the Dawenkou Basin cover an area of approximately 190 km2, accounting for approximately 60% of the basin’s total area. The basin exhibits distinct lithofacies variations, with clear horizontal zoning of different lithofacies. Six facies zones were delineated horizontally from the basin margin toward the center. These zones are described as follows.
Sandstone and Conglomerate Facies Zone: Located along the basin margins, this zone exhibits a narrow, discontinuous annular distribution except in the western part. Its width ranges from 0.2 to 4.6 km, covering an area of approximately 76 km2. The lithology primarily consists of purplish-red and light gray sandstones, sandy conglomerates, and conglomerates, representing foothill deposits or fluvial coarse clastic sediments, as shown in Figure 1.
Mudstone and Muddy Carbonate Facies Zone: This zone forms a ring-shaped belt within the inner part of the sandstone and conglomerate zone, which gradually transitions to Zone I. The belt width ranges from 0.2 to 7.0 km, covering an area of approximately 53 km2. The lithology primarily consists of purplish-red and gray fine sandstone, mudstone, and mudstone-limestone, representing shallow lacustrine or fluvial mechanical fine clastic-carbonate deposits, as shown in Figure 1.
Gypsum-Salt Phase Zone: This zone has an irregular sac-shaped distribution within the mudstone and muddy carbonate phase zone, with diameters ranging from 11 to 18 km and a distribution area of approximately 190 km2. This zone is relatively open from east to southeast. Its lithology primarily consists of mudstone, marl, gypsum rock, and hard gypsum rock. It overlaps with the rock salt, sodium-magnesium salt, and potassium-magnesium salt zones toward the basin center, forming subsalt, mid-salt, and supersalt gypsum layers. These constitute the primary desalination layers within the salt-bearing system’s rock salt layer. They represent early evaporite deposits from a saline lake environment, as shown in Figure 1.
Rock Salt Phase Zone: This zone exhibits an elliptical cap-shaped distribution within the inner part of the gypsum–salt phase zone. It has a diameter of 8–11 km and a distribution area of approximately 53 km2. The lithology primarily consists of gypsum rock and rock salt interbedded with mudstone, overlapping with the sodium–magnesium salt and potassium–magnesium salt facies toward the basin center. This zone represents mid-stage evaporite deposits from a saline lake environment.
Sodium-Magnesium Salt Phase Zone: This elliptical zone lies within the rock salt phase zone and is oriented approximately east–west with a major axis. It is approximately 8 km in diameter and 3 km wide, covering approximately 20 km2. The lithology primarily consists of gypsum rock, rock salt, and mudstone interbedded with sodium–magnesium salts, overlapping with the potassium–magnesium salt phase zone toward the basin center. Within this zone, the thickness and stratigraphic complexity of the sodium–magnesium salt layers tend to increase from the periphery toward the central area. This zone represents a later stage of salt deposition within the basin.
Potassium-Magnesium Salt Phase Zone: This spindle-shaped zone lies within the sodium–magnesium salt phase zone and is oriented approximately east–west. It is approximately 3.5 km in length and 1 km in width and covers an area of approximately 4 km2. In vertical sections, the potassium–magnesium salt layer is interbedded within the sodium–magnesium salt layer. It has a thickness of 1.18 m and an average K2O content of 10.92%. This layer represents the late stage of salt deposition in the basin.
As shown in Table 1, the salt-bearing zone in the study area can be divided into 3 sedimentary rhythms with a total of 32 salt beds. The progressively decreasing distribution areas of each facies zone reflect the characteristics of gradually concentrating saline water bodies and decreasing high-concentration brine areas during the salt formation period, as shown in Figure 1 and Figure 2. The strike of the mineralized layers aligns with the stratigraphic strike, with both dipping gently from the depression margins toward the depression center. On the basis of a comparative analysis of the drilling data, the rock salt deposit covers an area of approximately 53 km2. The average thickness of the mineralized zone in the profile exceeds 180 m, with the maximum thickness reaching 355.10 m.
Table 1.
Rhythmic Division Table for Grade I and Grade II Evaporite Structures in the Dawenkou Basin.
3. Materials and Methods
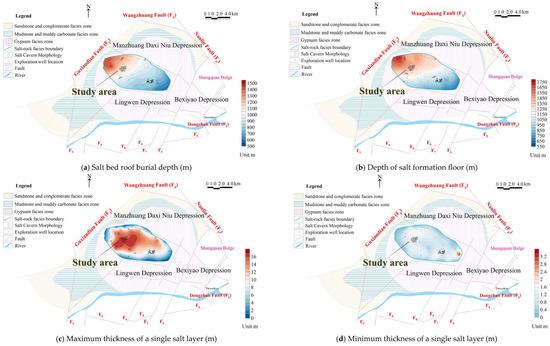
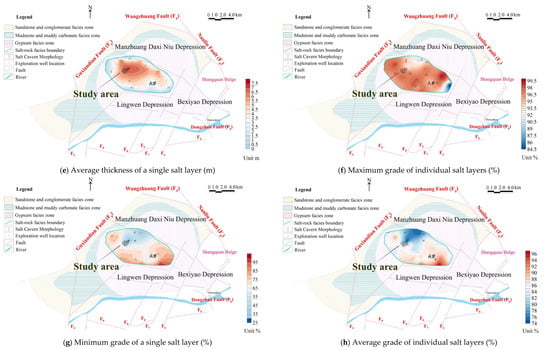
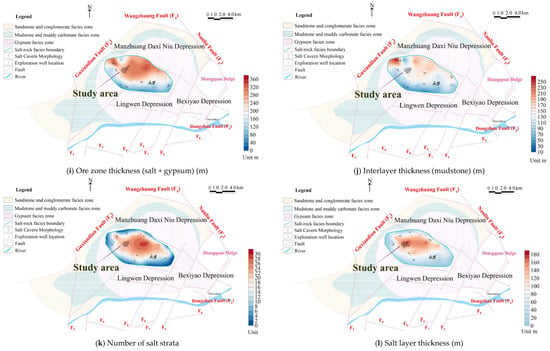
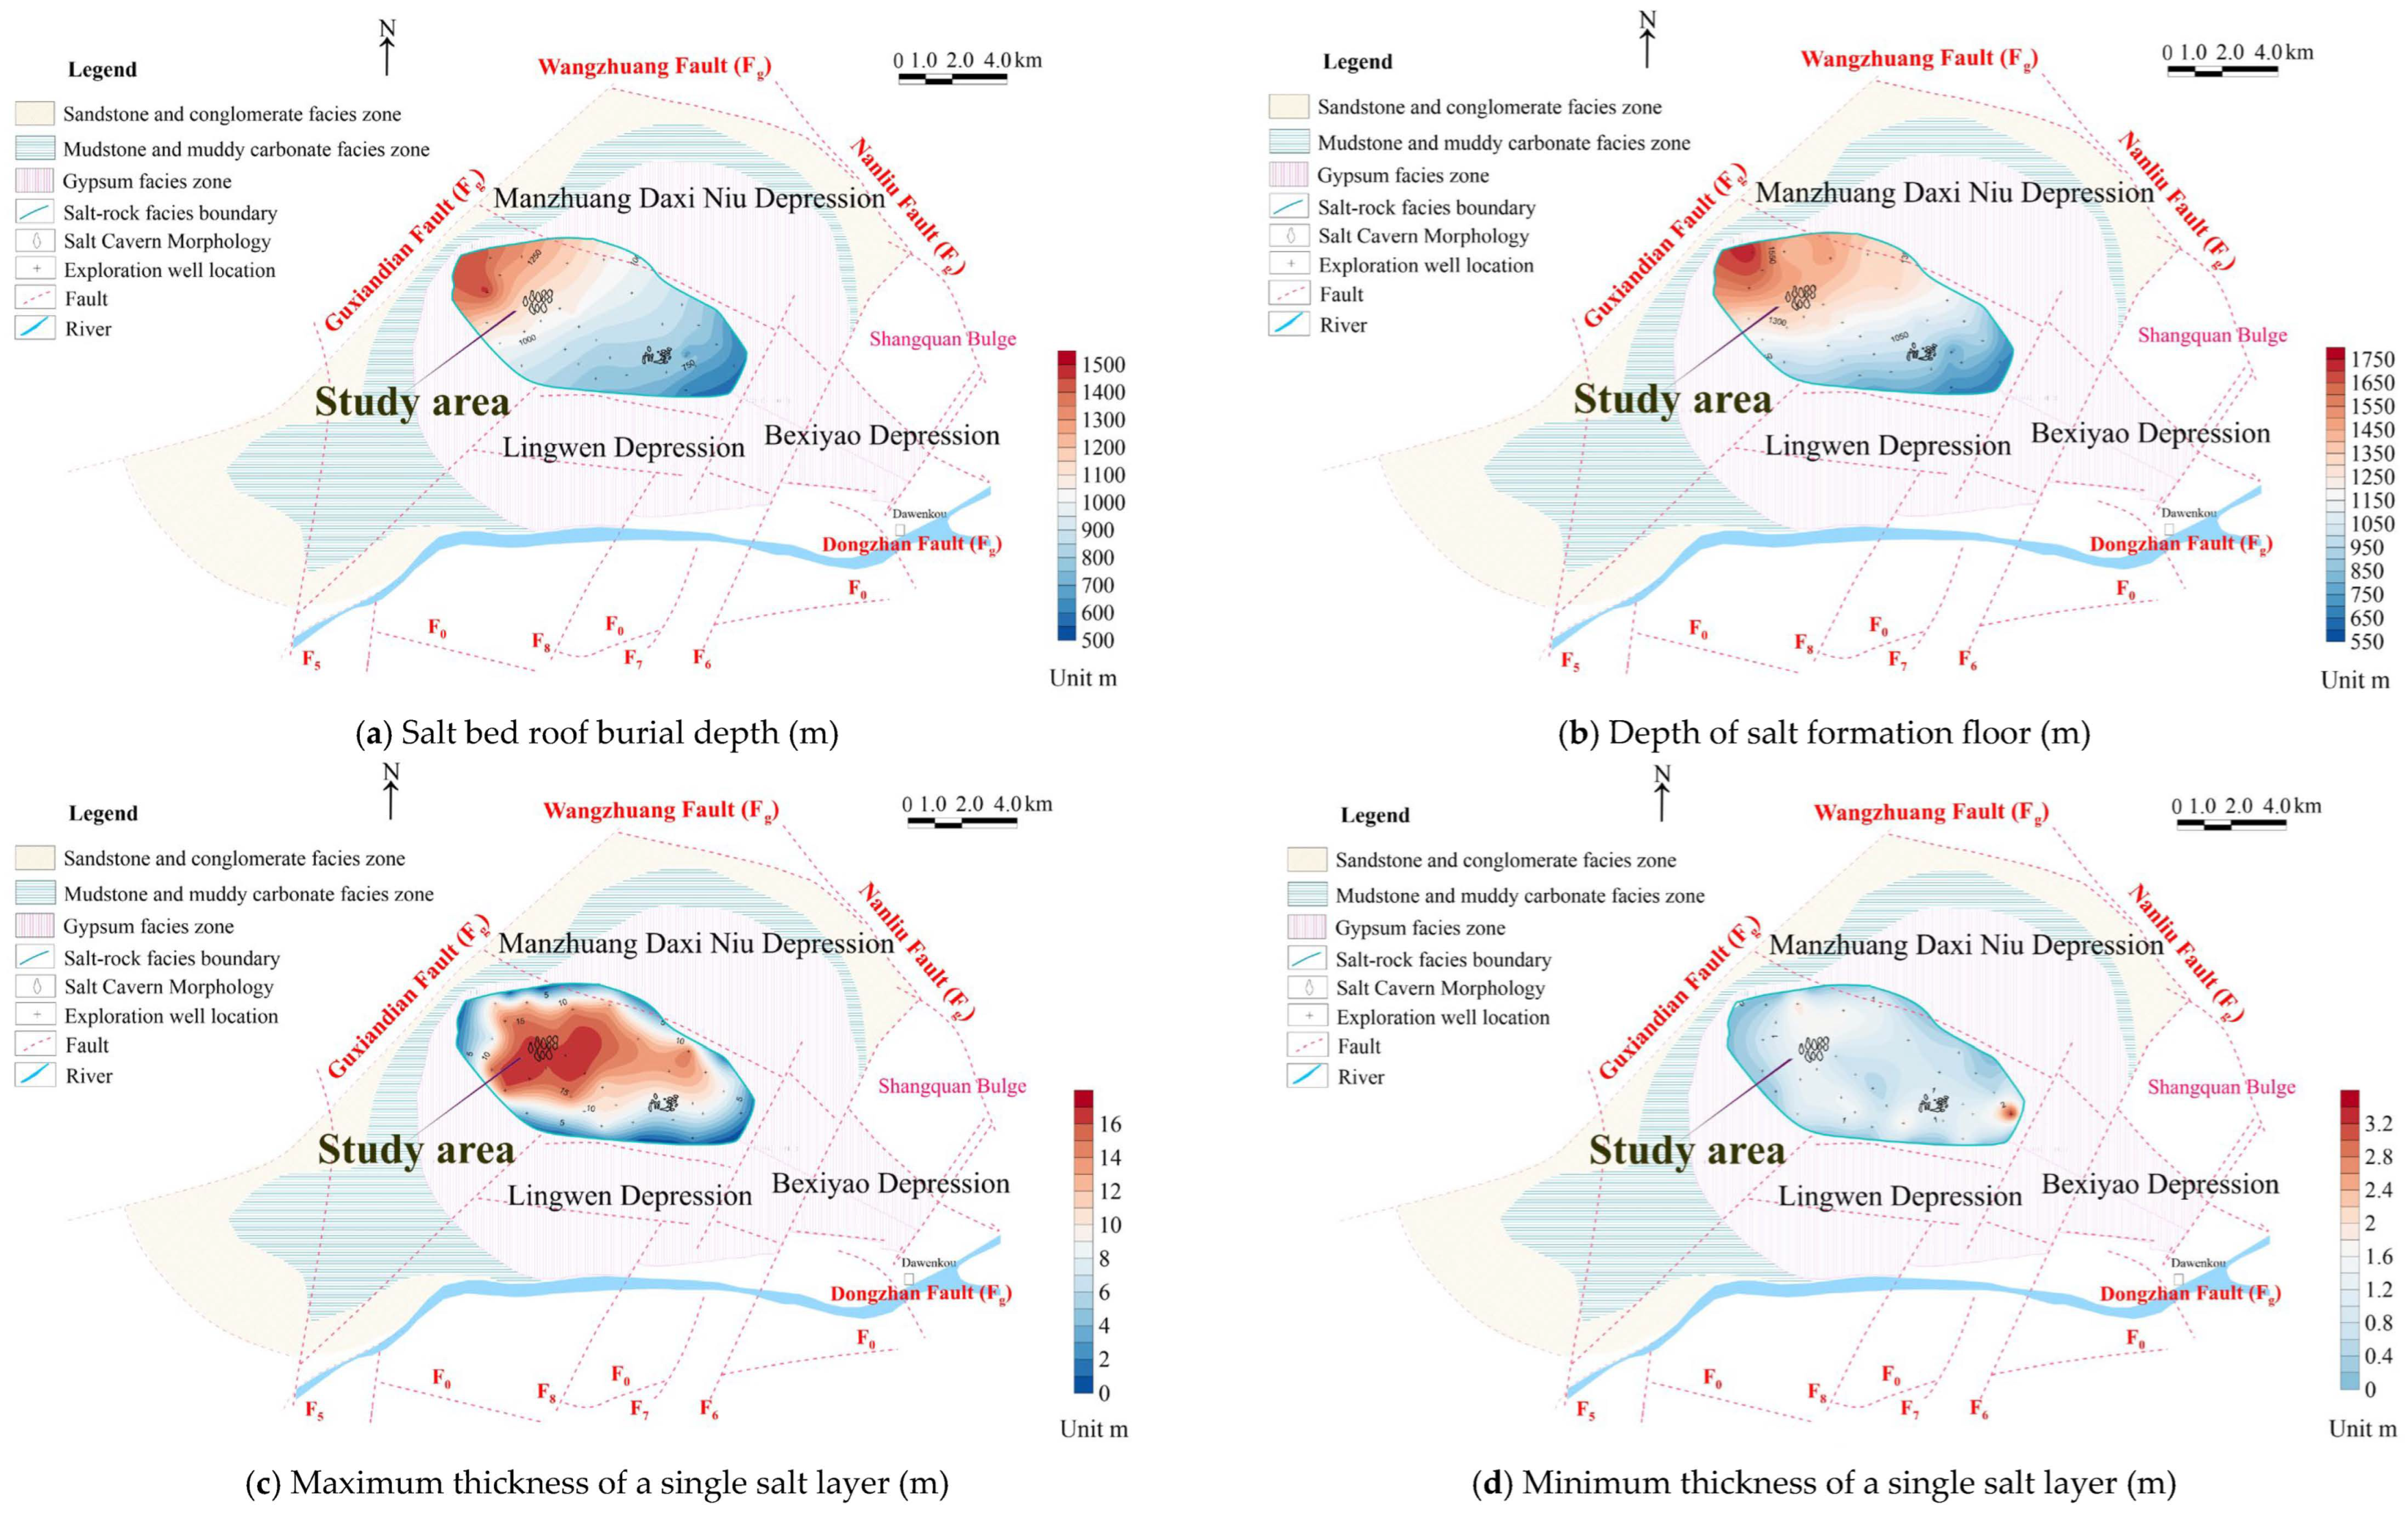
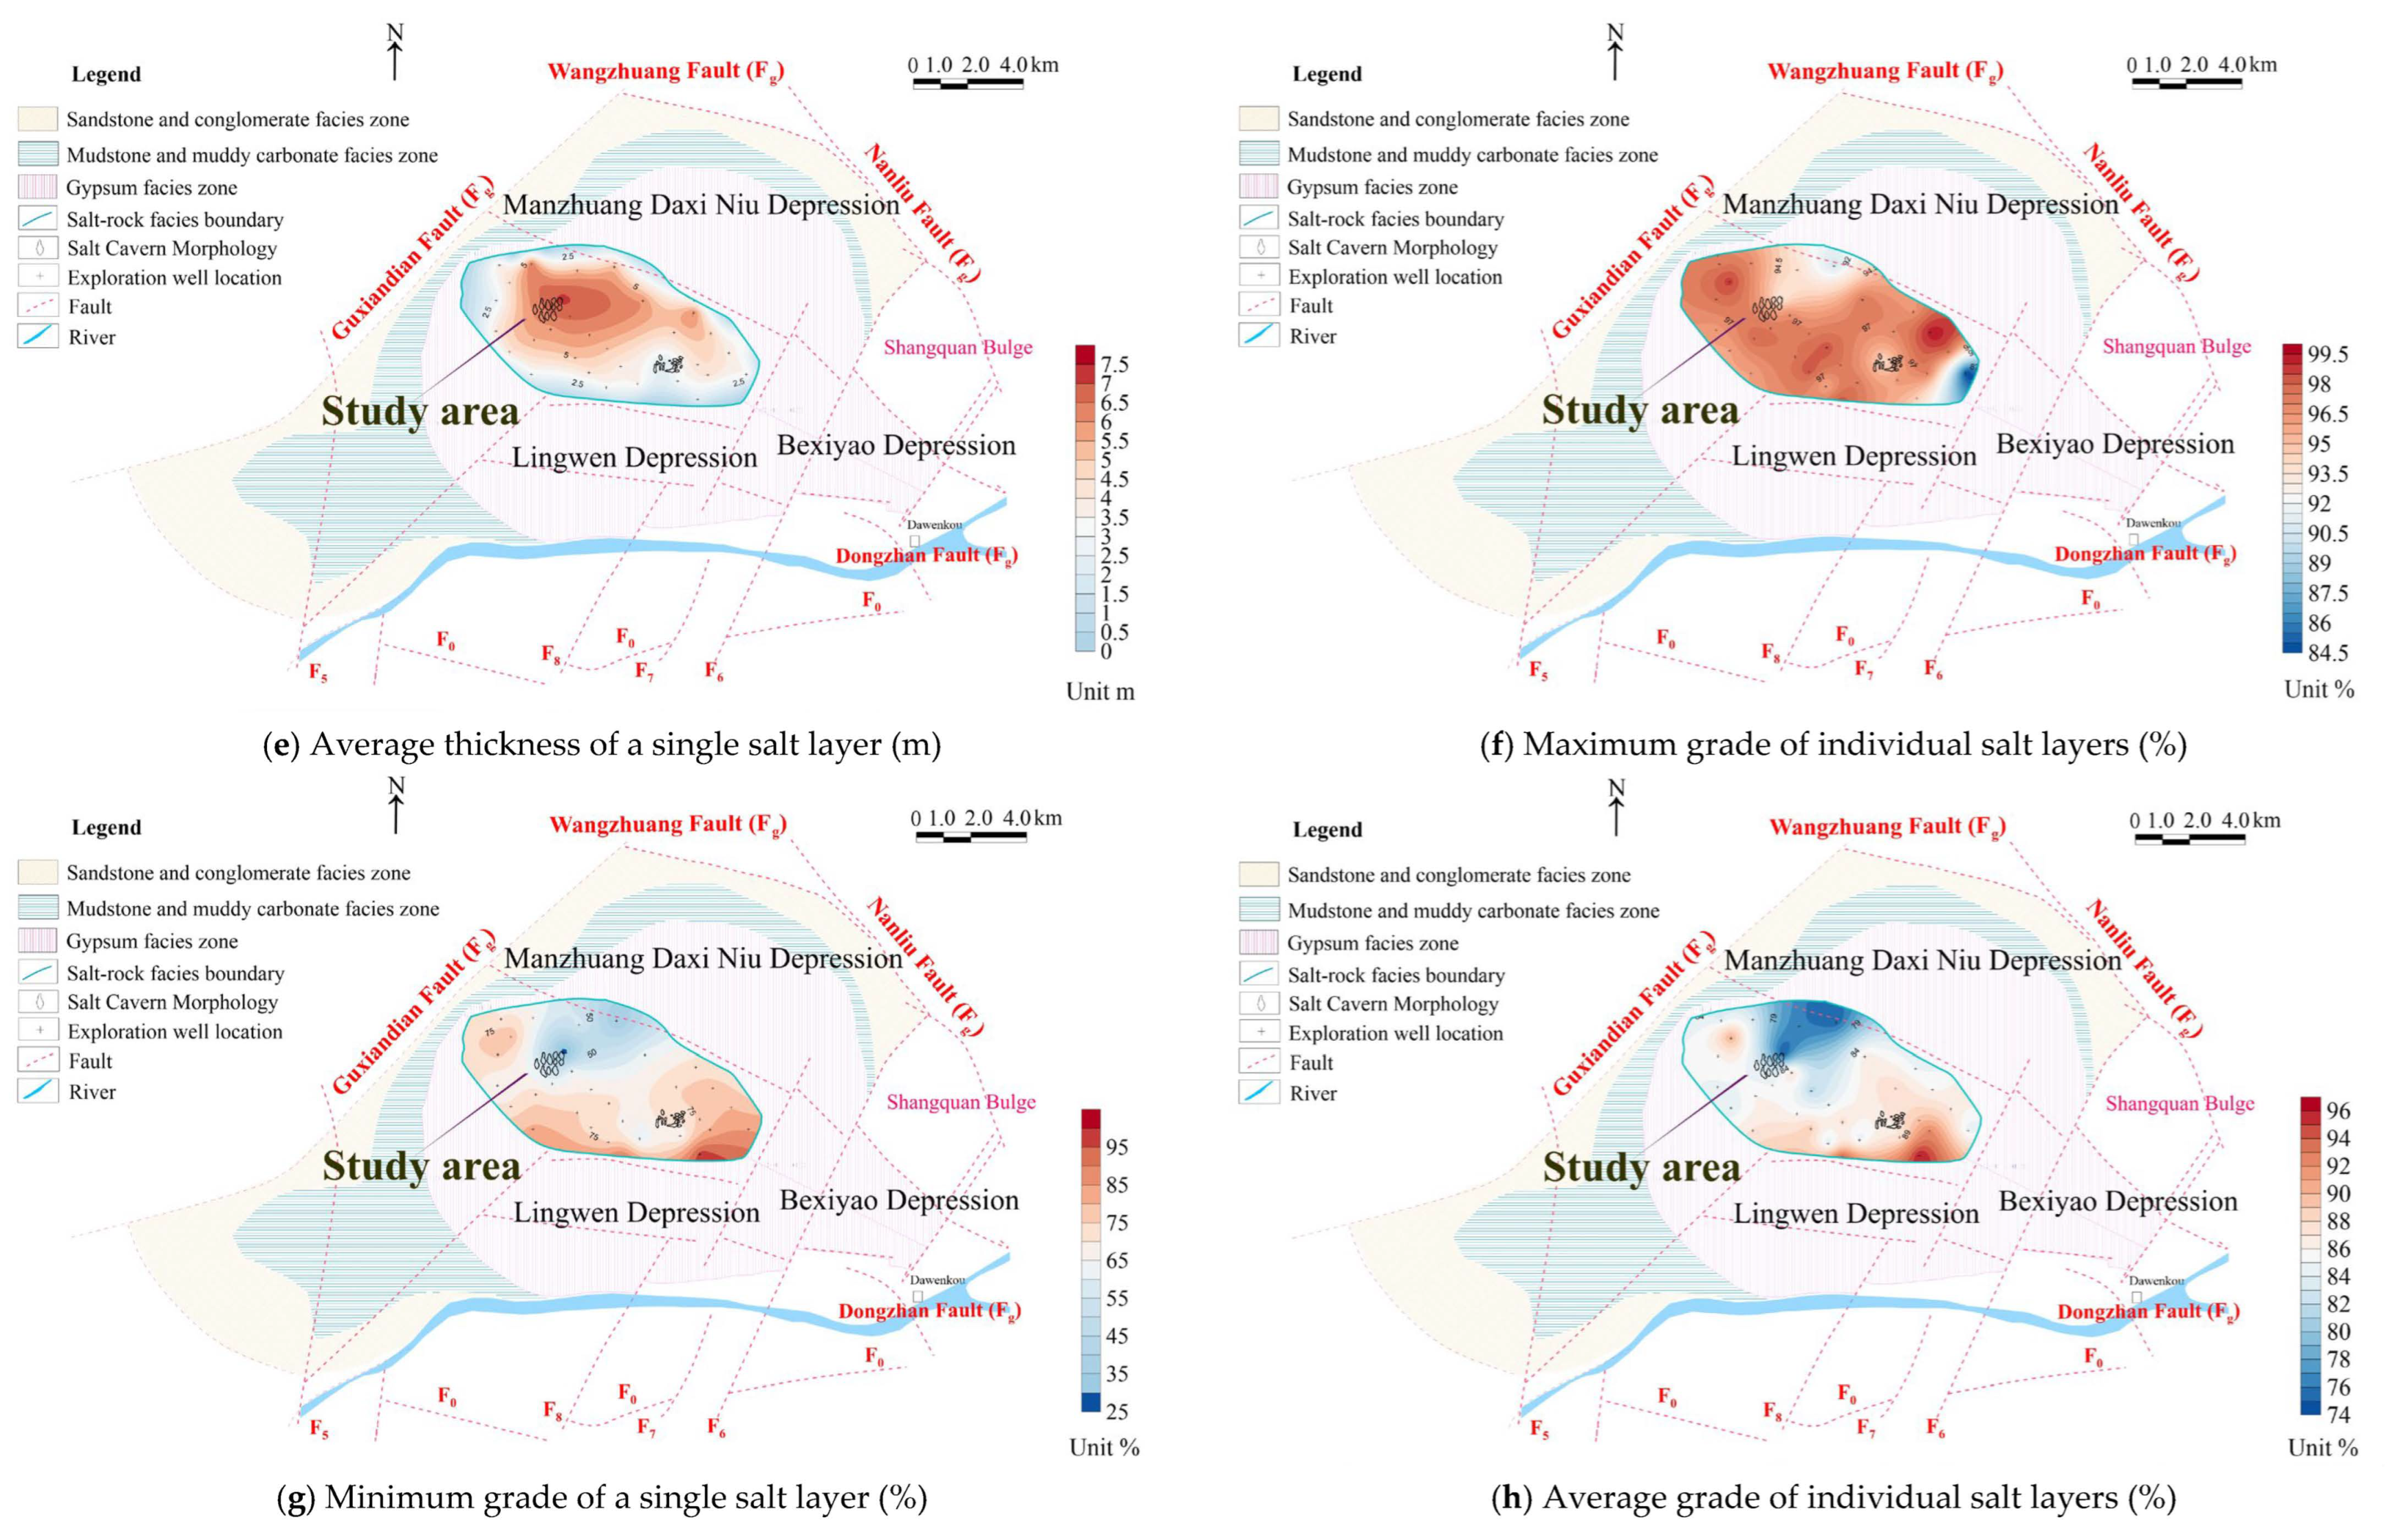
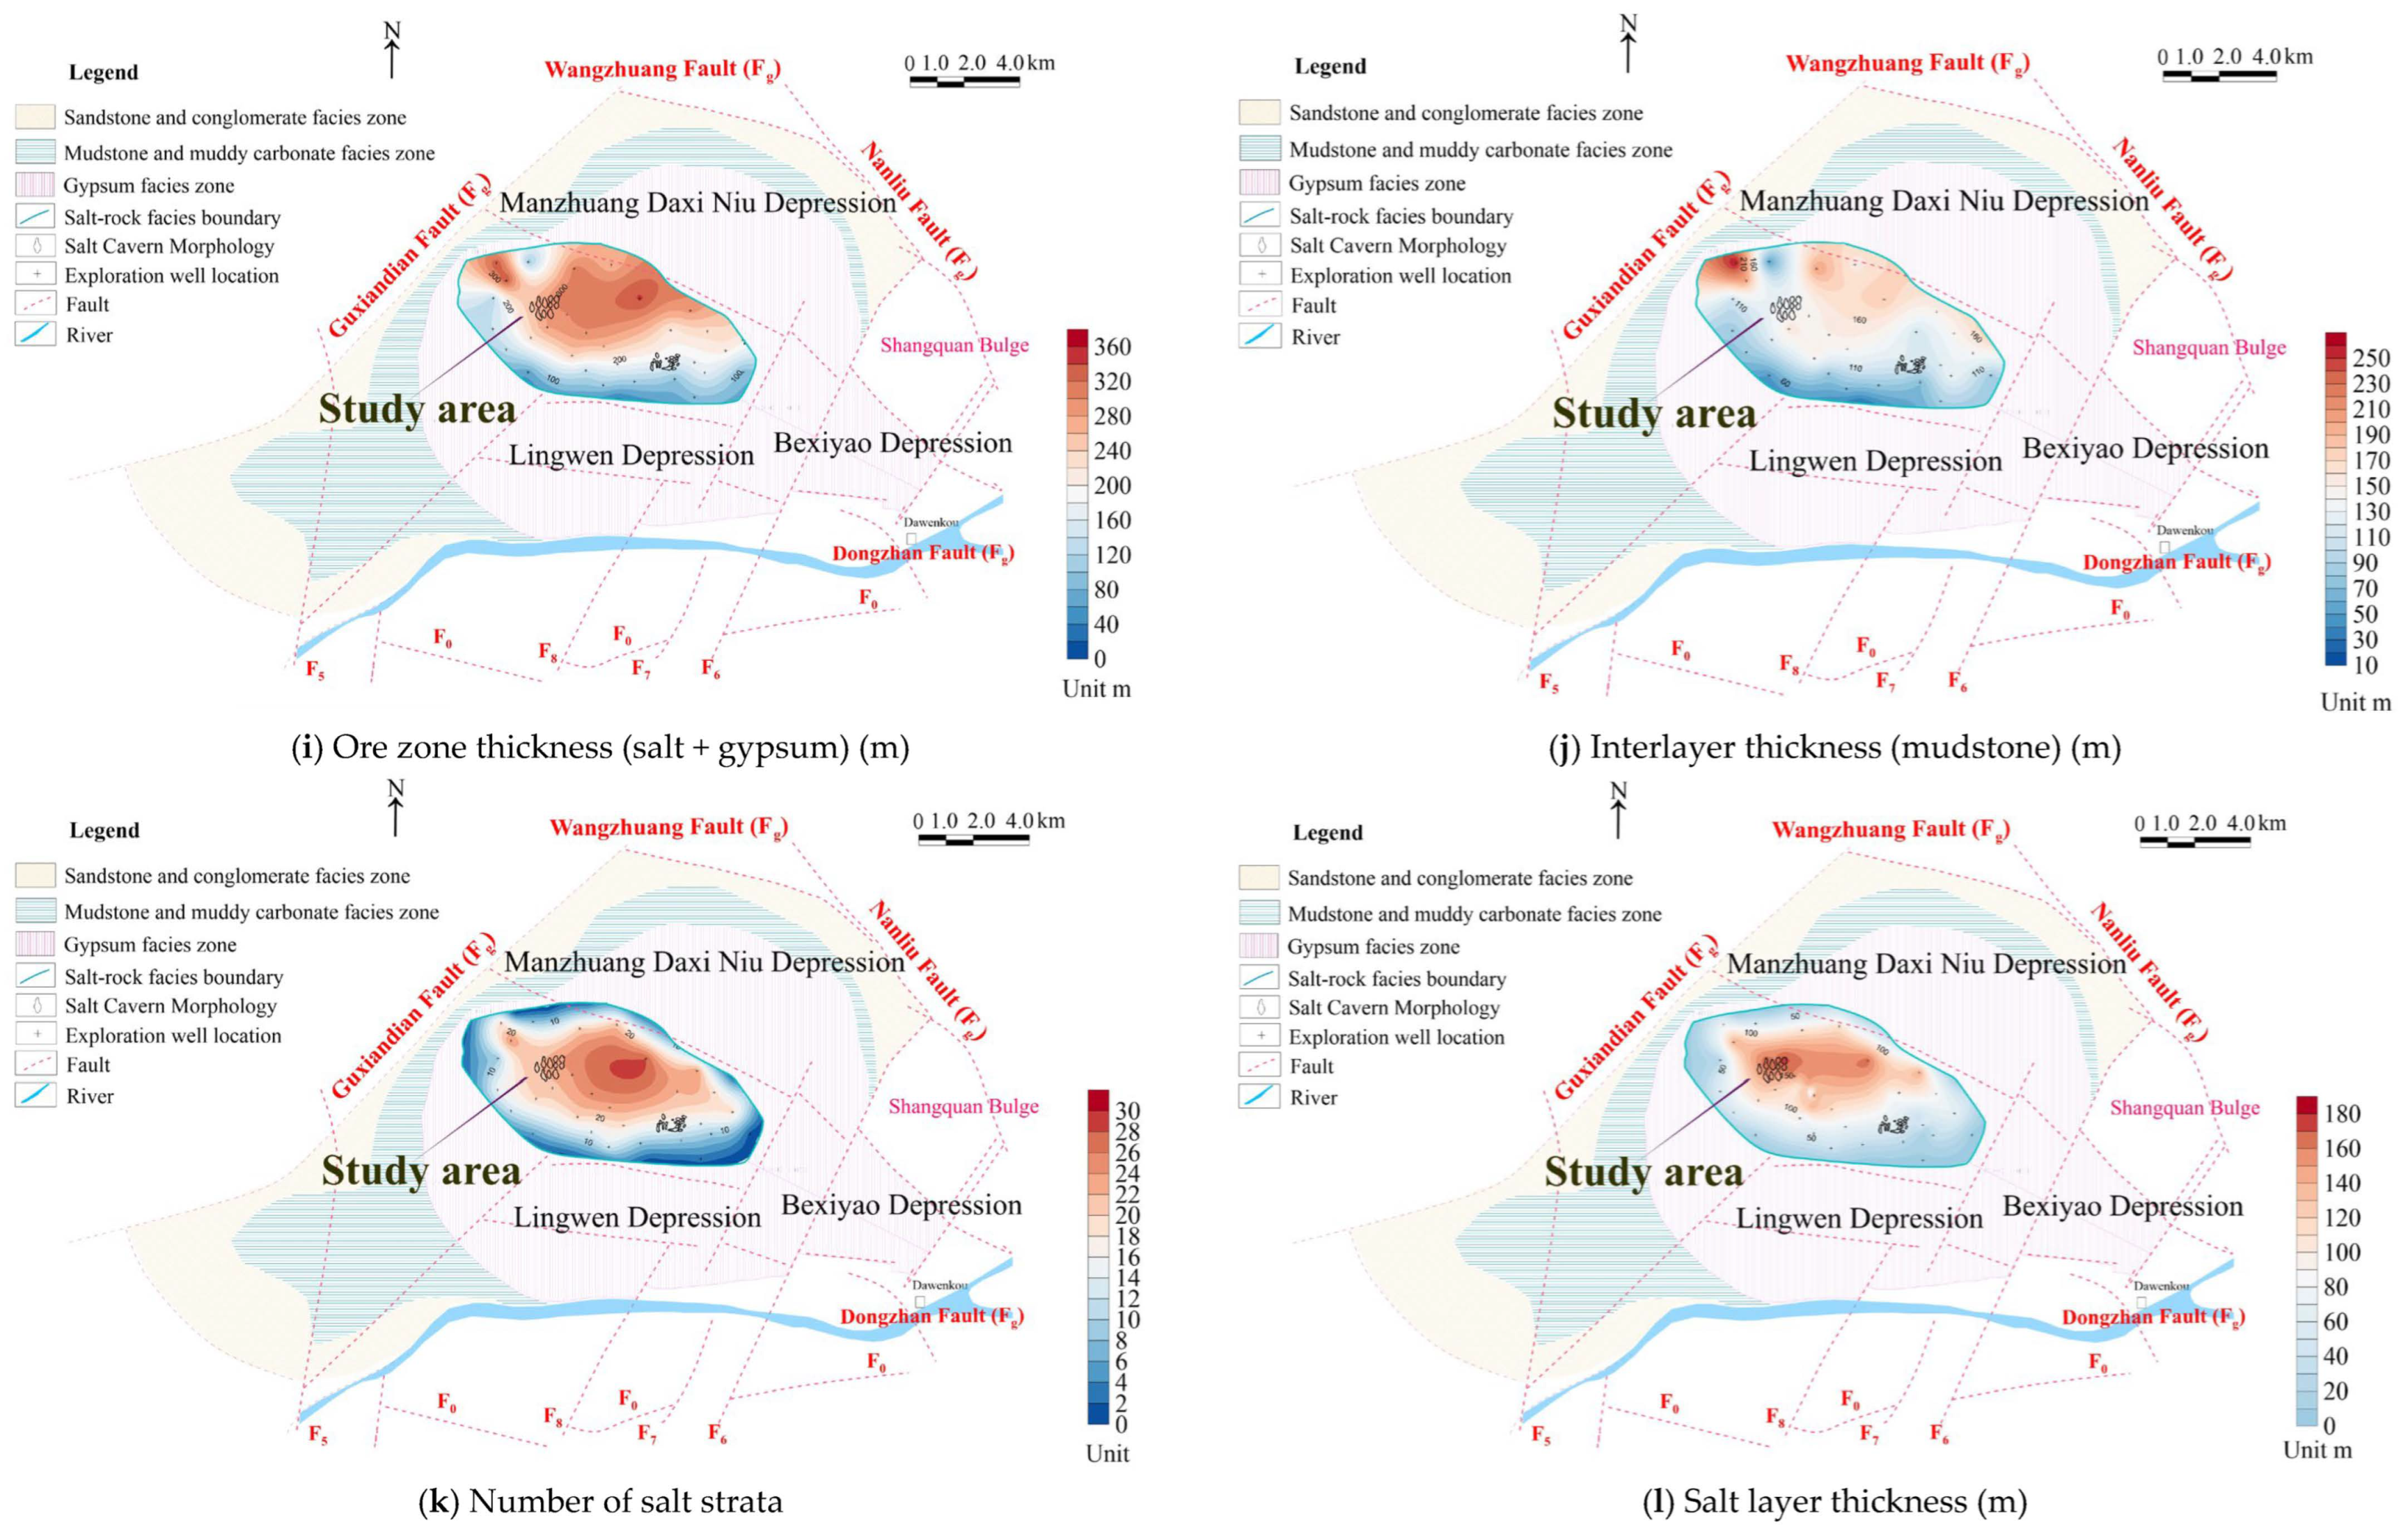
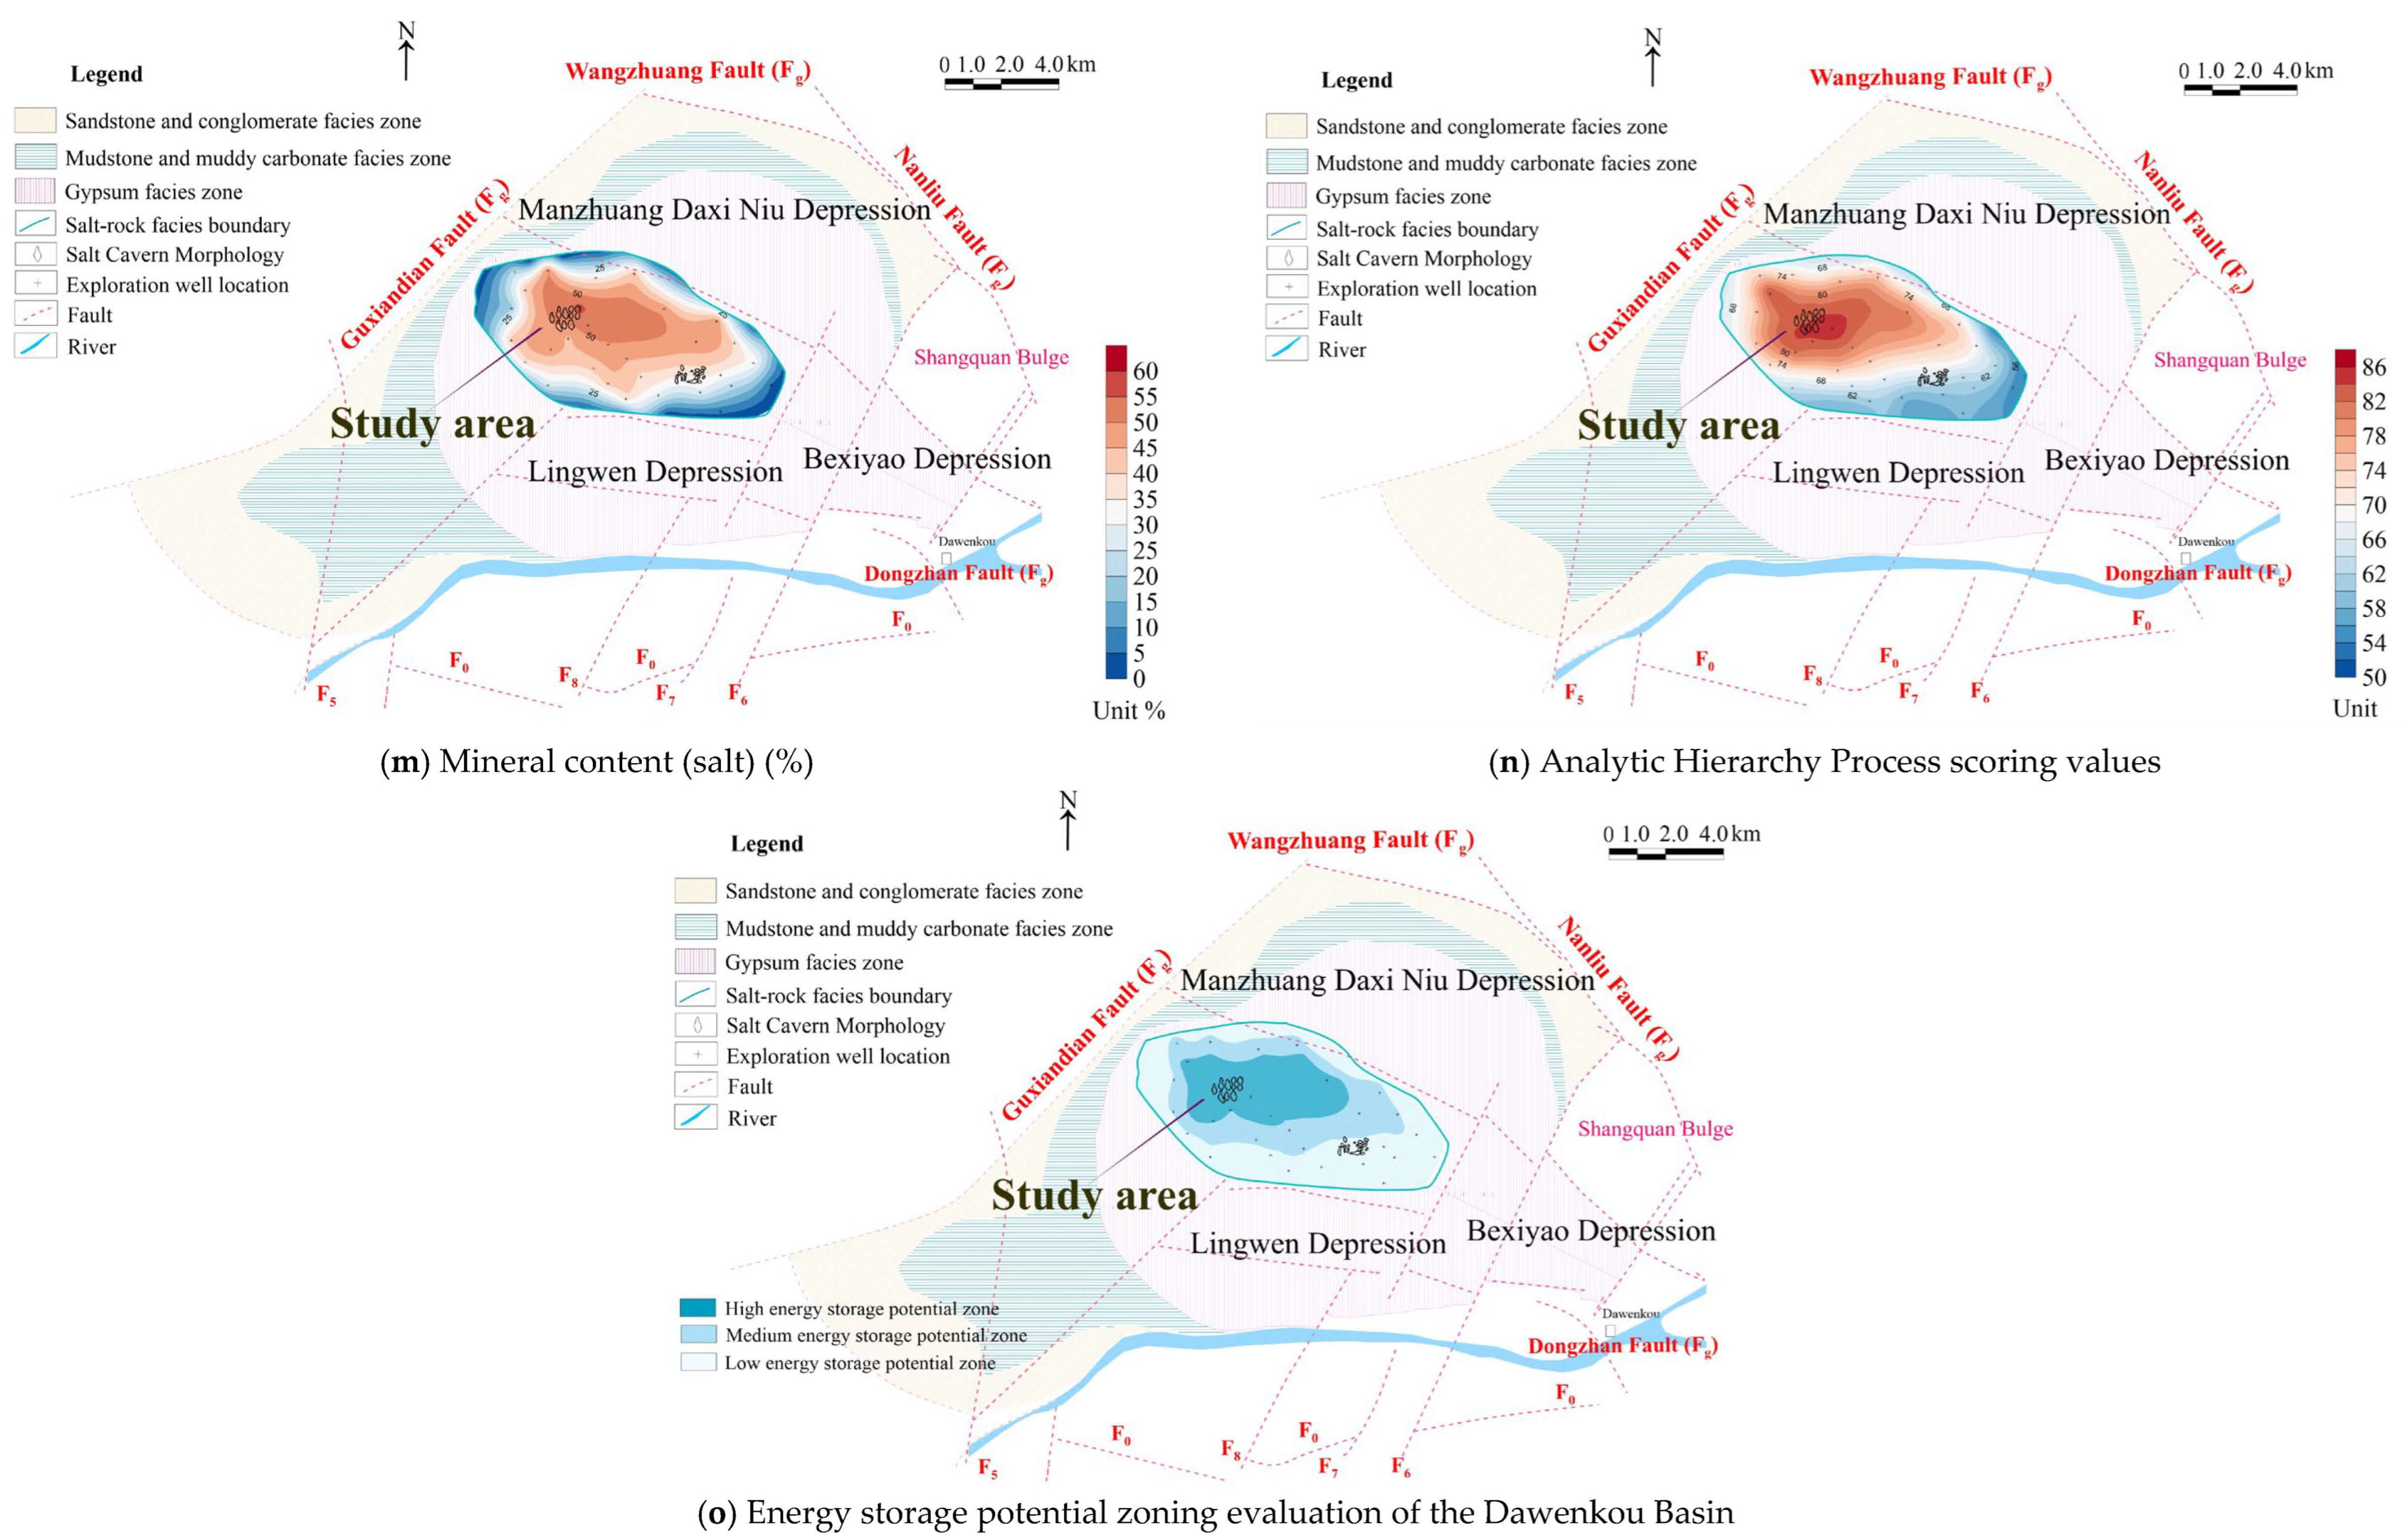
Given the poorly developed faults and well-sealed aquifers within the rock salt facies zone of the Dawenkou Basin, three-dimensional seismic data were used to delineate the salt cavern morphology. The primary factors governing the energy storage potential of salt caverns are the characteristics of the salt layers. Therefore, 10 parameters were comprehensively evaluated in this study: salt depth, salt grade (maximum, minimum, and average), salt layer thickness (maximum, minimum), interlayer thickness, and number of salt layers. In this study, data from 32 parameter wells were collected to statistically analyze these 10 stratigraphic parameters, and contour maps were generated, as shown in Figure 3.
Figure 3.
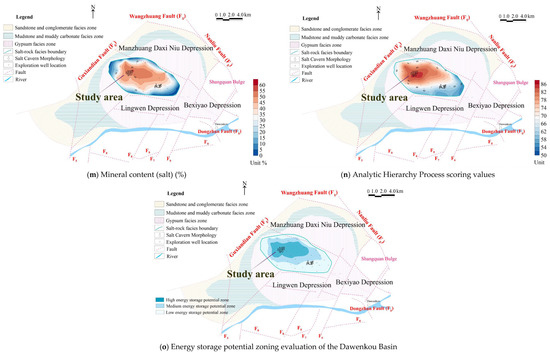
Geologic Factor Contour Map of Energy Storage Potential in the Rock Salt Facies Zone of the Dawenkou Basin.
The Dawenkou Basin hosts terrestrially deposited salt deposits. As shown in Figure 3a,b, the salt cap burial depth in the rock salt facies ranges from 500 to 1500 m, whereas the salt floor burial depth spans 550 to 1750 m. As shown in Figure 2, the burial depth of the salt layer gradually increases from the southeast to the northwest of the basin. The vertical profile in Figure 1 also illustrates the distribution pattern of the salt layer. As shown in Figure 3c, the maximum thickness of individual salt layers decreases gradually from the center of the rock salt phase zone outward, ranging between 1 and 16 m. As shown in Figure 3e, the average thickness of individual salt layers also decreases gradually from the center outward, ranging between 1 and 7 m. As shown in Figure 3f,g, the salt layers in the study area are of high quality, with an average grade exceeding 75%. As shown in Figure 3k–m, the total thickness, total number of layers, and mineral content of the salt layer reflect the rock salt resource potential. These parameters gradually decrease from the sedimentary center of the rock salt phase zone outward. The total thickness of the salt layer exceeds 160 m at the sedimentary center, with 32 mineralized layers and a mineral content exceeding 40%, constituting the primary distribution area of the salt deposit. After contour maps for 10 stratigraphic parameters were plotted, a comprehensive evaluation and scoring were conducted using the analytic hierarchy process (AHP) to delineate favorable energy storage zones.
3.1. Analysis of Regional Geological Conditions for Salt Cavern Energy Storage in the Dawenkou Basin
Referring to the literature of Jing et al., salt cavern energy storage follows the principles of safety, economy and proximity [21]. As shown in Table S3, at the basin scale, fault development, hydrogeological factors and surface factors were selected to conduct a preliminary qualitative evaluation of the suitability for salt cavern gas storage in the Dawenkou Basin. The Dawenkou Basin possesses favorable engineering conditions for salt cavern energy storage construction. Within the rock salt facies area of the study region, faults are poorly developed, historical seismic activity is limited, surface water resources are sufficient, the population and building density is low, and transportation conditions are advantageous. The study area is close to national highways and expressway networks, enabling convenient transportation of large equipment and building materials. The power grid connection condition is favorable: the site can be connected to the 220 kV regional backbone power grid nearby, satisfying the grid connection and power delivery requirements of large-capacity compressed air energy storage power stations.
3.2. Introduction to the Analytic Hierarchy Process
The analytic hierarchy process (AHP) is a systematic analysis method combining qualitative and quantitative approaches, proposed by Thomas L. Saaty of the University of Pittsburgh in the mid-1970s. In recent years, this method has found preliminary applications in stability assessment and risk analysis within geotechnical engineering. The fundamental principle of the AHP involves decomposing complex problems into constituent factors, grouping these factors into an ordered hierarchical structure on the basis of their dominance relationships, determining the relative importance of factors within each level through pairwise comparisons, and then synthesizing human judgment to establish the order of relative importance among decision factors. This method is characterized by its clear logic, simplicity, and strong systematic nature. The analytic hierarchy process (AHP) has been widely applied in geological site selection studies for oil-gas, mineral and geothermal resources [22,23,24,25,26,27,28,29].
3.3. Calculation of the Weighting Factors for Each Indicator in the Model
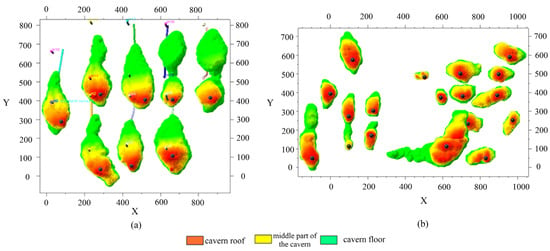
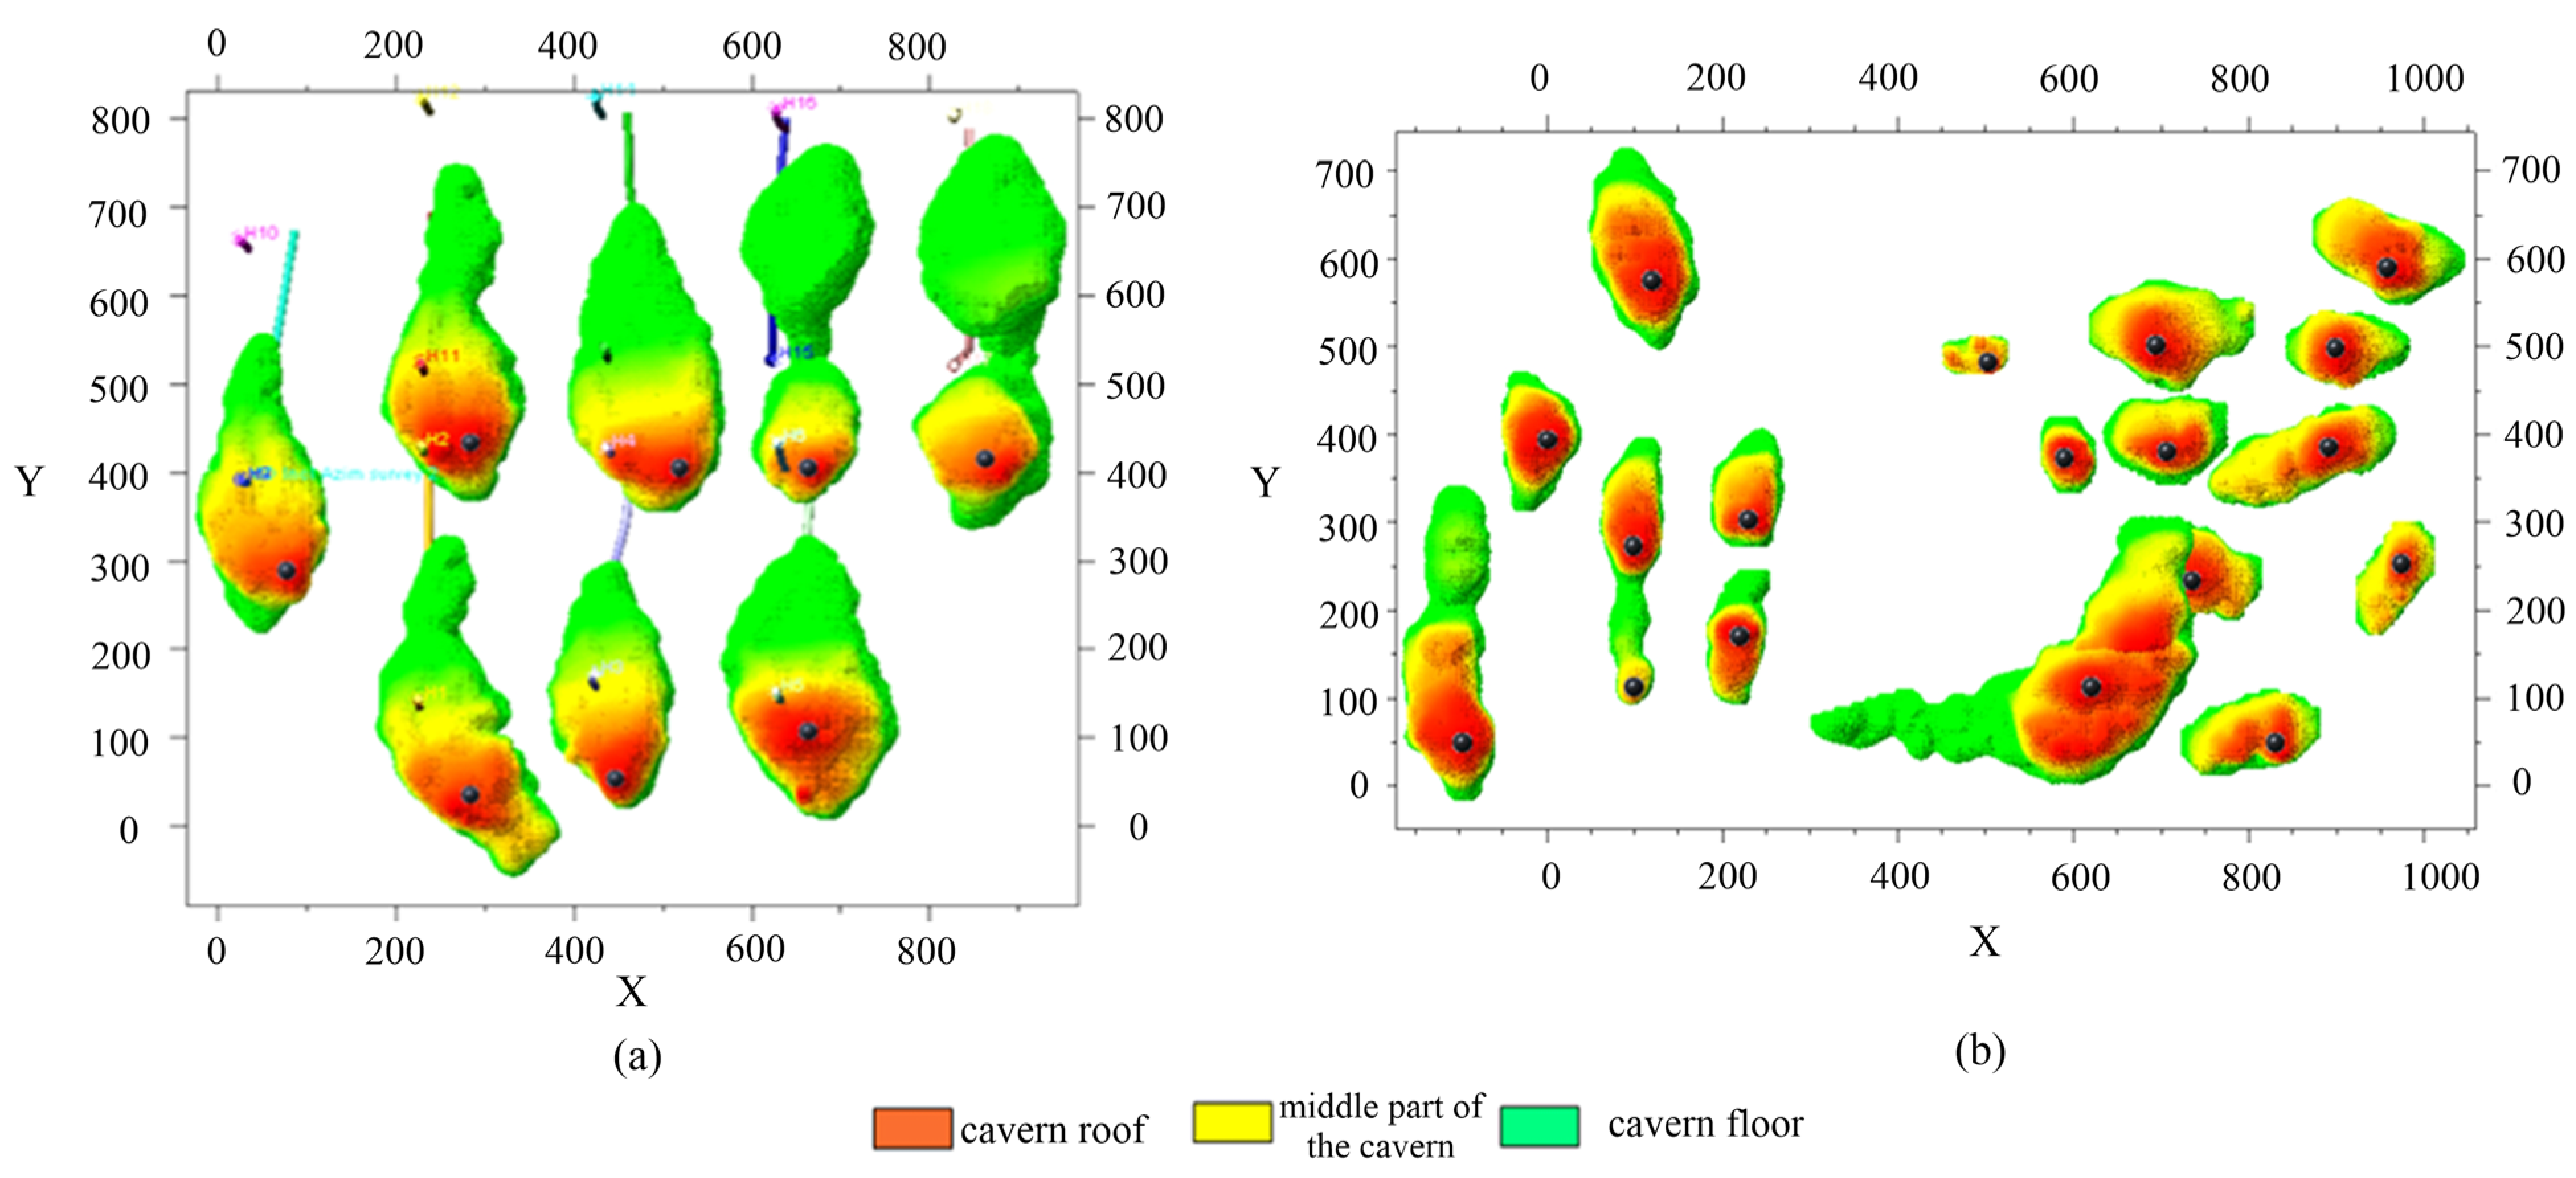
Stratigraphic parameters in the saline facies zone of the Dawenkou Basin exhibit gradual transitions from the basin margin to the basin center. In this study, based on the rating classification of salt cavern energy storage potential of salt caverns in different basin positions, machine learning algorithms were applied to rank the importance of the 10 geological site-selection parameters for salt caverns of different categories and then determine the weights of these parameters. 3D seismic exploration and sonar cavern surveys were employed to select the Luyuan Block at the basin margin and the Haijing Block at the basin center, and the salt cavern geometries of the two blocks are shown in Figure 4. Twenty salt cavern morphologies were precisely characterized across both blocks, and cavern energy storage potential ratings were obtained.
Figure 4.
(a) Salt cavern morphology in the sedimentary center of the Dawenkou Basin. (b) Salt cavern morphology at the sedimentary margin of the Dawenkou Basin, Shandong Province.
Currently, no fixed standards exist for salt caverns used in compressed air energy storage. On the basis of the operational mechanisms, efficiency, safety, and other factors of energy storage, salt caverns are comprehensively evaluated on the basis of the following aspects [5], as shown in Table 2.
Table 2.
Classification Criteria for Salt Caverns in the Dawenkou Basin.
- (1)
- Cavern Scale
The effective volume of a salt cavern is the most critical parameter for its utilization, determining the scale of energy storage. Large-scale storage requires a theoretically usable volume exceeding 450,000 m3.
- (2)
- Cavern Aspect Ratio
This aspect refers to the ratio of the cavern height to the lateral width. On the basis of geotechnical engineering experience, an aspect ratio of 1:1 is relatively optimal. A ratio that is too low compromises cavern stability, whereas a ratio that is too high may cause excessive vertical stress on the formation, hindering utilization. An empirical range of 0.7 to 1.3 is recommended.
- (3)
- Top Rock Formation Properties
Generally, salt caverns where the cavern top is located within the salt formation (with an appropriate thickness of salt layer retained above the cavern top) exhibit better sealing properties and are more suitable for utilization.
- (4)
- Development of Fractures Around the Cavern
The degree of fracture development around the cavern and in the overlying strata of the salt formation significantly affects the utilization of the salt cavern.
- (5)
- Distance Between the Cavern and Adjacent Salt Caverns
A certain safety distance must be maintained between salt caverns. An empirical value of 40 m is adopted.
On the basis of the above criteria, the caverns are classified in Table 2.
3.3.1. Random Forest Classification Training
The random forest algorithm in machine learning can rank the importance of influencing factors of the research object, thereby assisting experts in determining the weights [21].
To implement machine-learning classification more accurately at the basin scale, 3D seismic technology was adopted to collect salt cavern data from different locations across the basin. In this study, a total of 46 salt caverns were characterized precisely for model training: 8 caverns in the Haijing Block and 11 caverns in the Luyin Block at the basin center; 18 caverns in the Dongyue Block within the transition zone from the basin center to the basin margin; and 10 caverns in the Luyuan Block at the basin margin. Combined with the borehole data corresponding to these 46 salt caverns, datasets of ten influencing factors were acquired. Thirty-five of these salt cavern samples were selected for the random forest classification to calculate the importance ranking of the ten factors, so as to identify the dominant factors controlling salt cavern energy storage potential in the study area. In addition, the remaining 11 salt cavern samples were used for classification prediction, and the model accuracy exceeds 87%.
As shown in Table 3 and Table 4, the rating reveals that salt caverns located at the basin margin exhibit lower energy storage potential, whereas those in the basin center demonstrate greater potential. Therefore, drilling data corresponding to these 46 salt cavern groups can be collected to obtain data on 10 influencing factors. Applying the random forest classification method in machine learning to calculate the predictive importance of these 10 factors will identify the primary controlling factors affecting the energy storage potential of salt caverns in the study area, providing reference data for experts. As shown in Table 5, the random forest classification model reveals that the number of salt layers, thickness of salt layers and depth of salt layers are the primary controlling factors influencing salt cavern storage potential. Consequently, higher weight values should be assigned to these factors within the hierarchical analysis evaluation model.
Table 3.
Classification of Salt Caverns in the Sedimentary Centers of the Dawenkou Basin (Haijing: 8 salt caverns).
Table 4.
Classification of Salt Caverns at the Sedimentary Margin of the Dawenkou Basin (Luyuan: 10 salt caverns).
Table 5.
Summary of Weight Values Calculated Using Machine Learning.
The importance scores of the ten indicators output by the random forest were normalized to obtain the objective weights :
where IMi denotes the random-forest predictive importance value of the i-th indicator.
3.3.2. Determination of Weights by AHP
On the basis of the aforementioned hierarchical structure model for the comprehensive evaluation system of salt cavern storage site selection, combined with survey results from experts and engineers with relevant research experience in salt cavern storage site selection, pairwise comparisons using a 1–9 scale were employed to generate judgment matrices for each layer. The 1–9 comparative scale employs a scoring system for pairwise comparisons of elements within each layer, for instance, when comparing Element A with Element B.
Table 6 presents a pairwise comparison survey table for factors based on the following criteria: salt rock layer top/bottom depth, salt layer single-layer thickness (maximum, minimum, and average), salt layer grade (maximum, minimum, and average), mineral zone thickness, interlayer thickness, mineral content rate, and number of salt layers. The resulting decimal values were approximated to the nearest Saaty rational fractions; the full-precision raw matrix is provided in Supplementary Table S5.
Table 6.
Pairwise Comparison Table of Factors Affecting Energy Storage Potential in the Rock Salt Facies Zone of the Dawenkou Basin.
From Table 7, the judgment matrix Bn×n for a specific criterion’s basic indicators by a particular expert can be obtained. The eigenvectors of this Bn×n judgment matrix are then calculated using the sum-product method, with the specific calculation steps as follows.
Table 7.
Suitability Grading Table for Site Selection Criteria of Salt Cavern Energy Storage Reservoirs in the Dawenkou Basin (1).
Table 8.
Suitability Grading Table for Site Selection Criteria of Salt Cavern Energy Storage Reservoirs in the Dawenkou Basin (2).
- (1)
- Normalize each column of the decision matrix.
- (2)
- Add the elements in each rows of the normalized matrix.
- (3)
- Normalize the resulting vector.
In the formula, WiAHP denotes the relative importance weight of the i-th factor under a specific criterion.
The resulting W = [W1, W2,…, Wn]T constitutes the desired eigenvector.
- (4)
- To avoid high inconsistency arising from pairwise-comparison judgments, the eigenvalue method is adopted in this study to verify the final ranking of indicators and ensure that the weights of each indicator fall within an acceptable range. The maximum eigenvalue λmax of the judgment matrix is calculated as follows:
In the formula, (BW)i represents the i-th element of vector, WiAHP is the i-th element of eigenvector W, and n denotes the order of the judgment matrix.
- (5)
- Calculate the consistency index (CI):
- (6)
- Calculate the consistency ratio (CR), where n = 10 and RI = 1.49:
The judgment matrix passes the consistency test when CR < 0.1. All judgment matrices in this study satisfy this criterion. If CR ≥ 0.1, logical inconsistencies exist within the judgment matrix, and experts are required to readjust the pairwise-comparison values until the test is satisfied [18,19,20]. Similarly, the relative weights of other indicators and their corresponding consistency tests can be obtained following the above procedures, and the relative importance weights of each indicator reflecting expert cognition are finally acquired.
A panel of 15 experts in the field of salt cavern compressed air energy storage provided their integrated judgments on the weights of all influencing factors. Under the scenario of minor inconsistency caused by expert subjective judgment, λmax = 10.042, CI = 0.0047, CR = 0.0032. The rank order of indicator weights is not reversed, and the fluctuation range of weights is small, which demonstrates that the AHP weight results are robust.
3.3.3. Calculation of Coupled Weights from Random Forest and AHP
The random forest model can derive objective importance weights of indicators from sample data, while the analytic hierarchy process (AHP) can reflect engineering experience and expert judgment for salt cavern gas storage site selection [18,19,20]. To balance the objectivity of data-driven modelling and the rationality of geological engineering practice, this study adopts the RF–AHP coupled weighting framework. The multiplicative normalization coupling method is used to integrate the two sets of weights, forming a comprehensive weight system suitable for continental bedded salt rock. The combined weights are calculated by the multiplicative synthesis method and then normalized to obtain the final comprehensive weights:
This method can effectively integrate subjective experience and objective data patterns to improve the rationality of weight allocation and the reliability of evaluation results. The coupled weight system highlights the controlling effects of three major dominant factors, namely the number of salt layers, thickness of salt layers and depth of salt layers, as shown in Table 5. Meanwhile, it conforms to the geological characteristics of continental bedded salt rock, including multi-layer thin interbeds and strong heterogeneity. Consistent with the practical requirements of salt cavern gas storage site selection, this weighting scheme enables evaluation results to better match engineering practice. The technical roadmap developed in this study is shown in Figure S1.
3.3.4. Monte Carlo Simulation
To quantitatively assess the uncertainty of salt cavern energy storage suitability evaluation, Monte Carlo simulation was adopted for uncertainty propagation analysis. First, the study area was delineated and regular rectangular grids of 500 m × 500 m were established, with grid centroids selected as evaluation units. Based on data from 32 boreholes, spatial interpolation was performed separately for ten evaluation indicators, and the interpolated values at each grid centroid were extracted. Second, leave-one-out cross-validation was applied to quantify the spatial interpolation error of each indicator, and the interpolation error standard deviations of the ten indicators were calculated using the measured datasets of the 32 boreholes. The Pearson correlation matrix of the ten measured borehole parameters was computed and then converted into a covariance matrix. A total of 2000 Monte Carlo iterations were carried out. For each grid cell, multivariate normal joint sampling was implemented based on the indicator means, standard deviations and covariance matrix. As shown in Figure S2, after iteration, the probabilities PI, PII and PIII of each grid classified as Grade I (High energy storage potential zone), II (Medium energy storage potential zone) and III (Low energy storage potential zone) were calculated from the 2000 realizations. Grids with one of these probabilities greater than 0.9 were defined as stable zones.
4. Results
4.1. Classification of Basic Indicator Suitability Levels
On the basis of the analysis of salt cavern storage site selection factors and primarily through consultation with domain experts while referencing relevant theoretical research and construction experience, the following preliminary suitability classification standards for storage site selection indicators are proposed (see Table 8). This facilitates quantitative analysis of relevant indicators for specific sites. Integrating expert opinions and theoretical research, a grading table for the suitability levels of fundamental indicators within the site selection system is proposed. The suitability levels are categorized into high-potential storage zones (score 100), medium-potential storage zones (score 80), and low-potential storage zones (score 60). The values of 100, 80, and 60 represent the reference benchmarks for the integrated evaluation rather than individual parameter scores.
4.2. Comprehensive Suitability Rating Evaluation of Storage Sites
On the basis of the suitability rating classifications for each site indicator in Table 7, the evaluation values pi (i = 1, 2, …, 10) for each indicator of a target storage site are obtained. Combining these values with the weight values Wi* (i = 1, 2, …, 10) assigned to each indicator within the overall salt cavern storage reservoir site evaluation system using the analytic hierarchy process (AHP), the comprehensive suitability value P for the target site is calculated using the following formula:
The comprehensive reservoir suitability value P for the target site, calculated using the above formula, is substituted into Table 8 for comparison. This calculation yields the suitability grade for the site. On the basis of the corresponding countermeasures, the feasibility of the reservoir construction project should be considered.
The scores of each indicator and the corresponding weight values calculated from Table 6 are substituted into the formula to obtain the comprehensive suitability value P for the candidate reservoir site, as shown in Figure 3n. Refer to Table 8 to determine the energy storage potential for different regions, as illustrated in Figure 3o. This study completed the zoning of salt cavern energy storage potential in the Dawenkou Basin. The core area of the basin was classified into high-potential energy storage zones, medium-potential energy storage zones and low-potential energy storage zones. The number of salt layers and total thickness of salt formations, which have high weights determined by the random forest and expert scoring, serve as the dominant factors controlling the suitability classification results. As can be observed from the maps, the final high-, medium-, and low-potential zones show strong spatial correlation with the distribution of these parameters.
On the basis of the AHP scoring results, high-potential energy storage zones (scores exceeding 80 points) are distributed at the center of the rock salt phase area. Compared with the Luyuan Block, the Haijing Block is located within a high-potential energy storage zone and has significantly larger salt cavern volumes. These findings demonstrate higher energy storage potential and evaluation grades, indirectly validating the applicability of the established energy storage potential evaluation model in the Dawenkou Basin. Well groups such as H9–H10 and H11–H12 were subsequently located in high-potential storage zones for salt cavern usability analysis and evaluation.
4.3. Theoretical Energy Storage Potential Prediction for the Dawenkou Basin
On the basis of the established energy storage potential zoning, similar geological conditions within the same zone were assumed. The area analogy method was employed to estimate the basin-scale theoretical energy storage capacity. This method has been widely applied in salt cavern resource evaluation and cavern volume prediction, and the formula is expressed as follows:
where V is total salt cavern storage volume of the target area; m3 is S: area of the target area (km2); V0/S0 is cavern construction volume per unit area of the analog block (m3/km2); η is the correction coefficient of cavern dissolution rate, accounting for interlayers, insoluble substances and cavern shape loss, ranging from 0.85 to 0.95; k is the correction coefficient for production and brine extraction period, converted uniformly for a 20-year service life, ranging from 1.8 to 2.0.
As shown in Table S6, the Haijing Block, which is located within a high-potential energy storage zone, spans 0.83 km2, with wells constructed in 2015 and a production lifespan of 10 years, and has a salt cavern space of 4,891,802 m3. Taking the standard 20-year production period of brine wells as the unified calculation benchmark, combined with the planar distribution area of 12.8 km2 for the high-potential zone, the areal analogy method was adopted for estimation. The high-potential energy storage zone in the Dawenkou Basin can form salt cavern energy storage space of 11,542~14,333 × 104 m3. This zone represents the primary priority area for salt cavern energy storage development within the basin, featuring the best resource endowment and the highest development value.
The Luyin Block, situated in a medium-potential zone, covers 1.57 km2 with wells constructed between 1988 and 2006. It has over a 20-year production period and a salt cavern space of 7,465,731 m3. Based on the distribution area of 15.87 km2 for the medium-potential zone and the standard 20-year production period of brine wells, the analogous calculation shows that the available salt cavern energy storage volume reaches 5773~7169 × 104 m3. This zone serves as the secondary replacement area for salt cavern energy storage development in the basin and has certain development potential and economic feasibility.
The Luyuan Block is situated in a low-potential energy storage zone, covering 0.88 km2. Wells were constructed in 2006, with a production lifespan of 20 years, and the block has a salt cavern space of 3,551,529 m3. Combined with the distribution area of 25.15 km2 for the low-potential zone and the standard 20-year brine well production period, analogous estimation yields an available salt cavern energy storage volume of 7764~9642 × 104 m3. Although this zone has the largest areal extent, its overall economic performance and long-term stability are relatively limited due to constraints from salt rock resource endowment, geological stability and engineering adaptability. It can only be regarded as a supplementary development area in the long term.
The estimation errors of salt cavern energy storage volume in this study mainly originate from three sources. First, the areal analogy method introduces a geometric error. Second, interlayer development and heterogeneity of salt grade within salt formations lead to variations in cavern construction efficiency, generating an engineering error. This error characteristic is consistent with the general law of water-solution cavern construction in continental bedded salt rock. Third, parameter errors arise from the conversion of production periods and the selection of key parameters.
Compatible development of multiple energy storage types: the salt caverns in the study area exhibit favorable tightness and stability, enabling multi-functional applications including compressed air energy storage, hydrogen storage, natural gas storage and petroleum reserve [30]. The site has the potential to construct an integrated underground energy reserve repository. At present, a pilot project testing natural gas storage in sediment-filled salt caverns with multiple interlayers is underway in the Luyin Block of the Dawenkou Basin. In the long term, phased and tiered development is recommended. High-potential zones should be prioritized for near-term development; medium-potential zones can be developed in a rolling manner during the medium term; and low-potential zones can be regarded as strategic reserve resources in the long term to realize the orderly and efficient utilization of resources.
5. Analysis and Evaluation of Utilization Conditions for Salt Caverns in High-Potential Areas
5.1. Water Seal Testing of Salt Caverns in High-Potential Areas
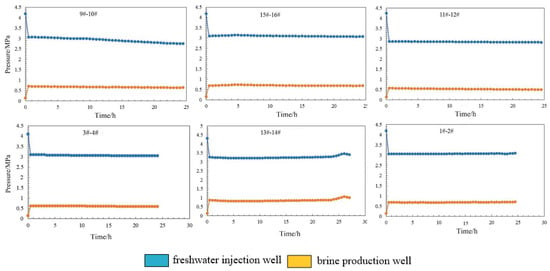
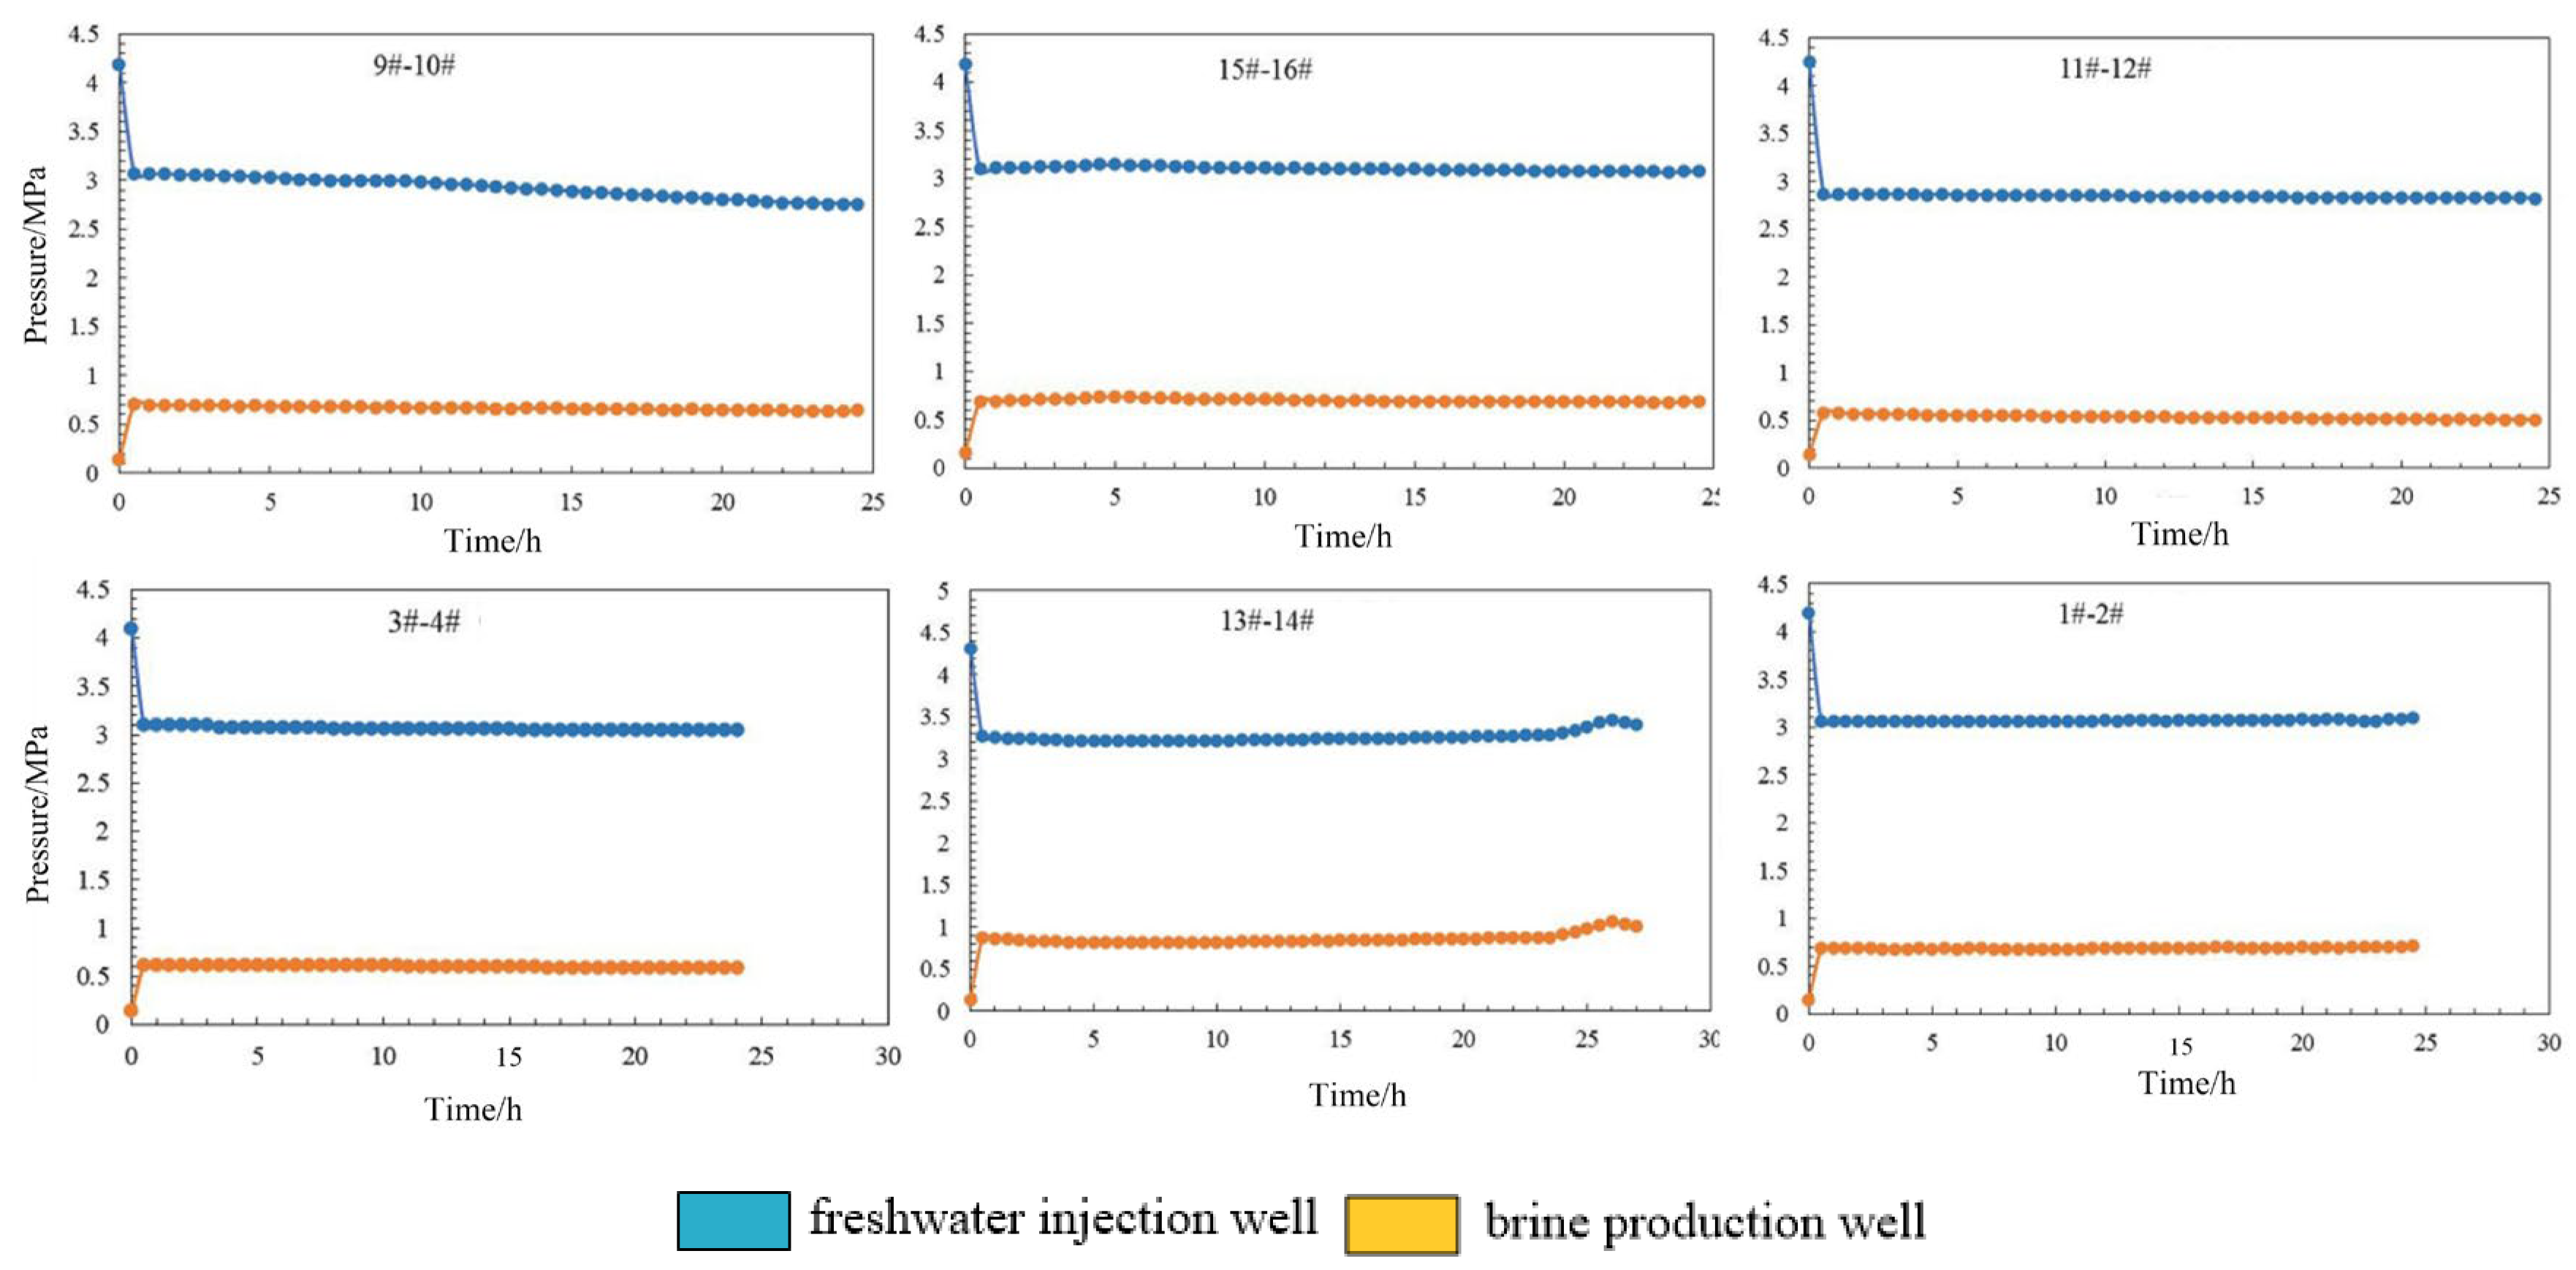
To further validate the sealing integrity of salt caverns for energy storage in the study area, sealability tests were conducted on selected salt caverns on the basis of prior data analysis and 3D seismic interpretation results. Water seal tests were performed on eight well groups in the Haijing Block by closing valves on the existing injection and discharge pipelines at the brine production station. The pressure and leakage rate were monitored over time. If the pressure drop gradually decreased below the acceptable threshold and the leakage rate steadily diminished to a stable value below the acceptable limit, the cavern was deemed well sealed. Conversely, persistent pressure drops and leakage rates exceeding acceptable thresholds indicated poor sealing. The acceptable leakage rate is typically set at one ten-thousandth of the cavern volume, while the acceptable pressure drop should not exceed 0.5 MPa/day.
As shown in Figure 5, during the water seal test, the pressure drop curve over time for the Haijing Block well group stabilized and remained below the acceptable value of 0.5 MPa/day. This result indicates good water-sealing performance of the caverns in the high-potential zone, meeting the sealing evaluation criteria.
Figure 5.
Sealing Performance Test of Type I Salt Caverns in the Dawenkou Basin.
5.2. Evaluation of Rock Mechanical Stability in High-Potential Salt Cavern Areas
- (1)
- Elasto-Plastic Computational Model
Previous studies have shown that the failure modes of salt rock mainly include shear failure and tensile failure, related to different confining pressures. The Mohr-Coulomb criterion can account for plastic failure in rock masses satisfactorily. Numerous studies have used this criterion as an index, which has proven to be accurate and reliable. Therefore, this approach was used to evaluate whether plastic failure occurs in rock masses around the cavern.
This elasto-plastic analysis employed the classical Mohr-Coulomb strength theory. This theory is generally recognized as a shear stress strength theory, and it comprehensively reflects rock strength characteristics. Applicable to both plastic rocks and brittle salt formations undergoing shear failure, it accounts for scenarios in which rock tensile strength is significantly lower than compressive strength. This theory is currently widely adopted in geotechnical engineering practices.
Assuming that the compressive stress is negative, the yield function under the Mohr-Coulomb strength conditions is as follows:
where c represents cohesion and φ denotes the friction angle. The tensile failure yield function is as follows:
σ represents the tensile strength of salt rock. The maximum tensile strength σt max does not exceed the value calculated using the following formula.
ft = σ3 − σt
The constitutive model parameters are listed in Table S4.
- (2)
- Creep constitutive model and rock properties
The Norton power creep constitutive law was used to model the steady creep of salt. This viscoplastic model combines the behavior of the viscoelastic two-component power model and elastoplastic Mohr-Coulomb model. The constitutive creep model is expressed as follows:
where σ1 and σ3 are the maximum and minimum principal stresses, respectively; εcr is the creep rate; A and n are material properties; and σ∗ is the unit stress (1 MPa). Three types of materials were used in the numerical model: rock salt, mudstone, and gypsum. According to our previous studies, A and n can be obtained from step-loading creep tests. The temperature was maintained at 25° during the experiments. The mechanical parameters are listed in Table S4.
A 3D geomechanical model of the H11–H12 salt cavern in the Dawenkou Basin was established using the finite difference program FLAC3D (Figure S3). The stability of rock masses around the cavern at different internal gas pressures and cycle frequencies was analyzed. Three evaluation criteria were proposed to predict the feasibility and stability of the cavern, including deformation, volume shrinkage, and the plastic zone.
The in situ stress field employed a triaxial isostatic self-weight stress field. The lower surface of the model was simply supported with vertical displacement constraints, while the four longitudinal surfaces were simply supported in the respective normal directions. This configuration assumed that geological bodies outside the model’s front, rear, left, right, and lower surfaces were rigid bodies, prohibiting any normal displacement. During calculations, the normal displacement was constrained on all five surfaces except the top surface. Overburden pressure was applied to the top surface, with a ground stress gradient of 23 kPa/m.
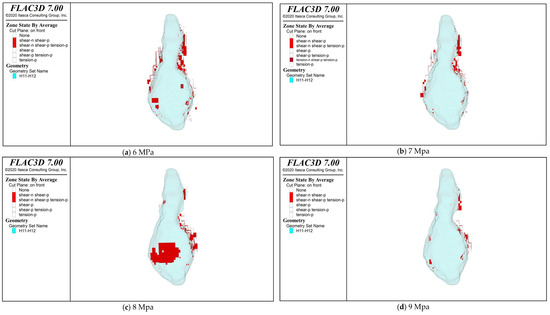
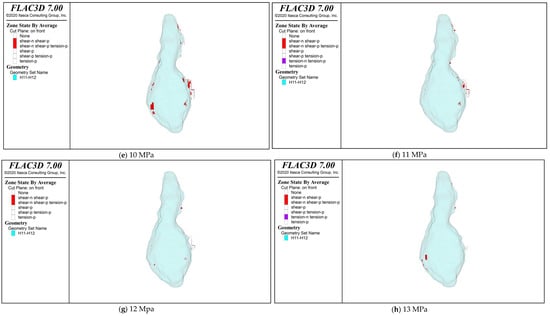
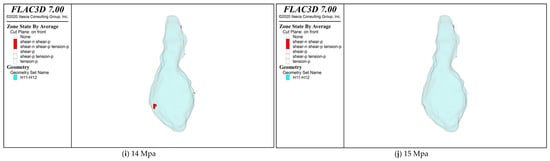
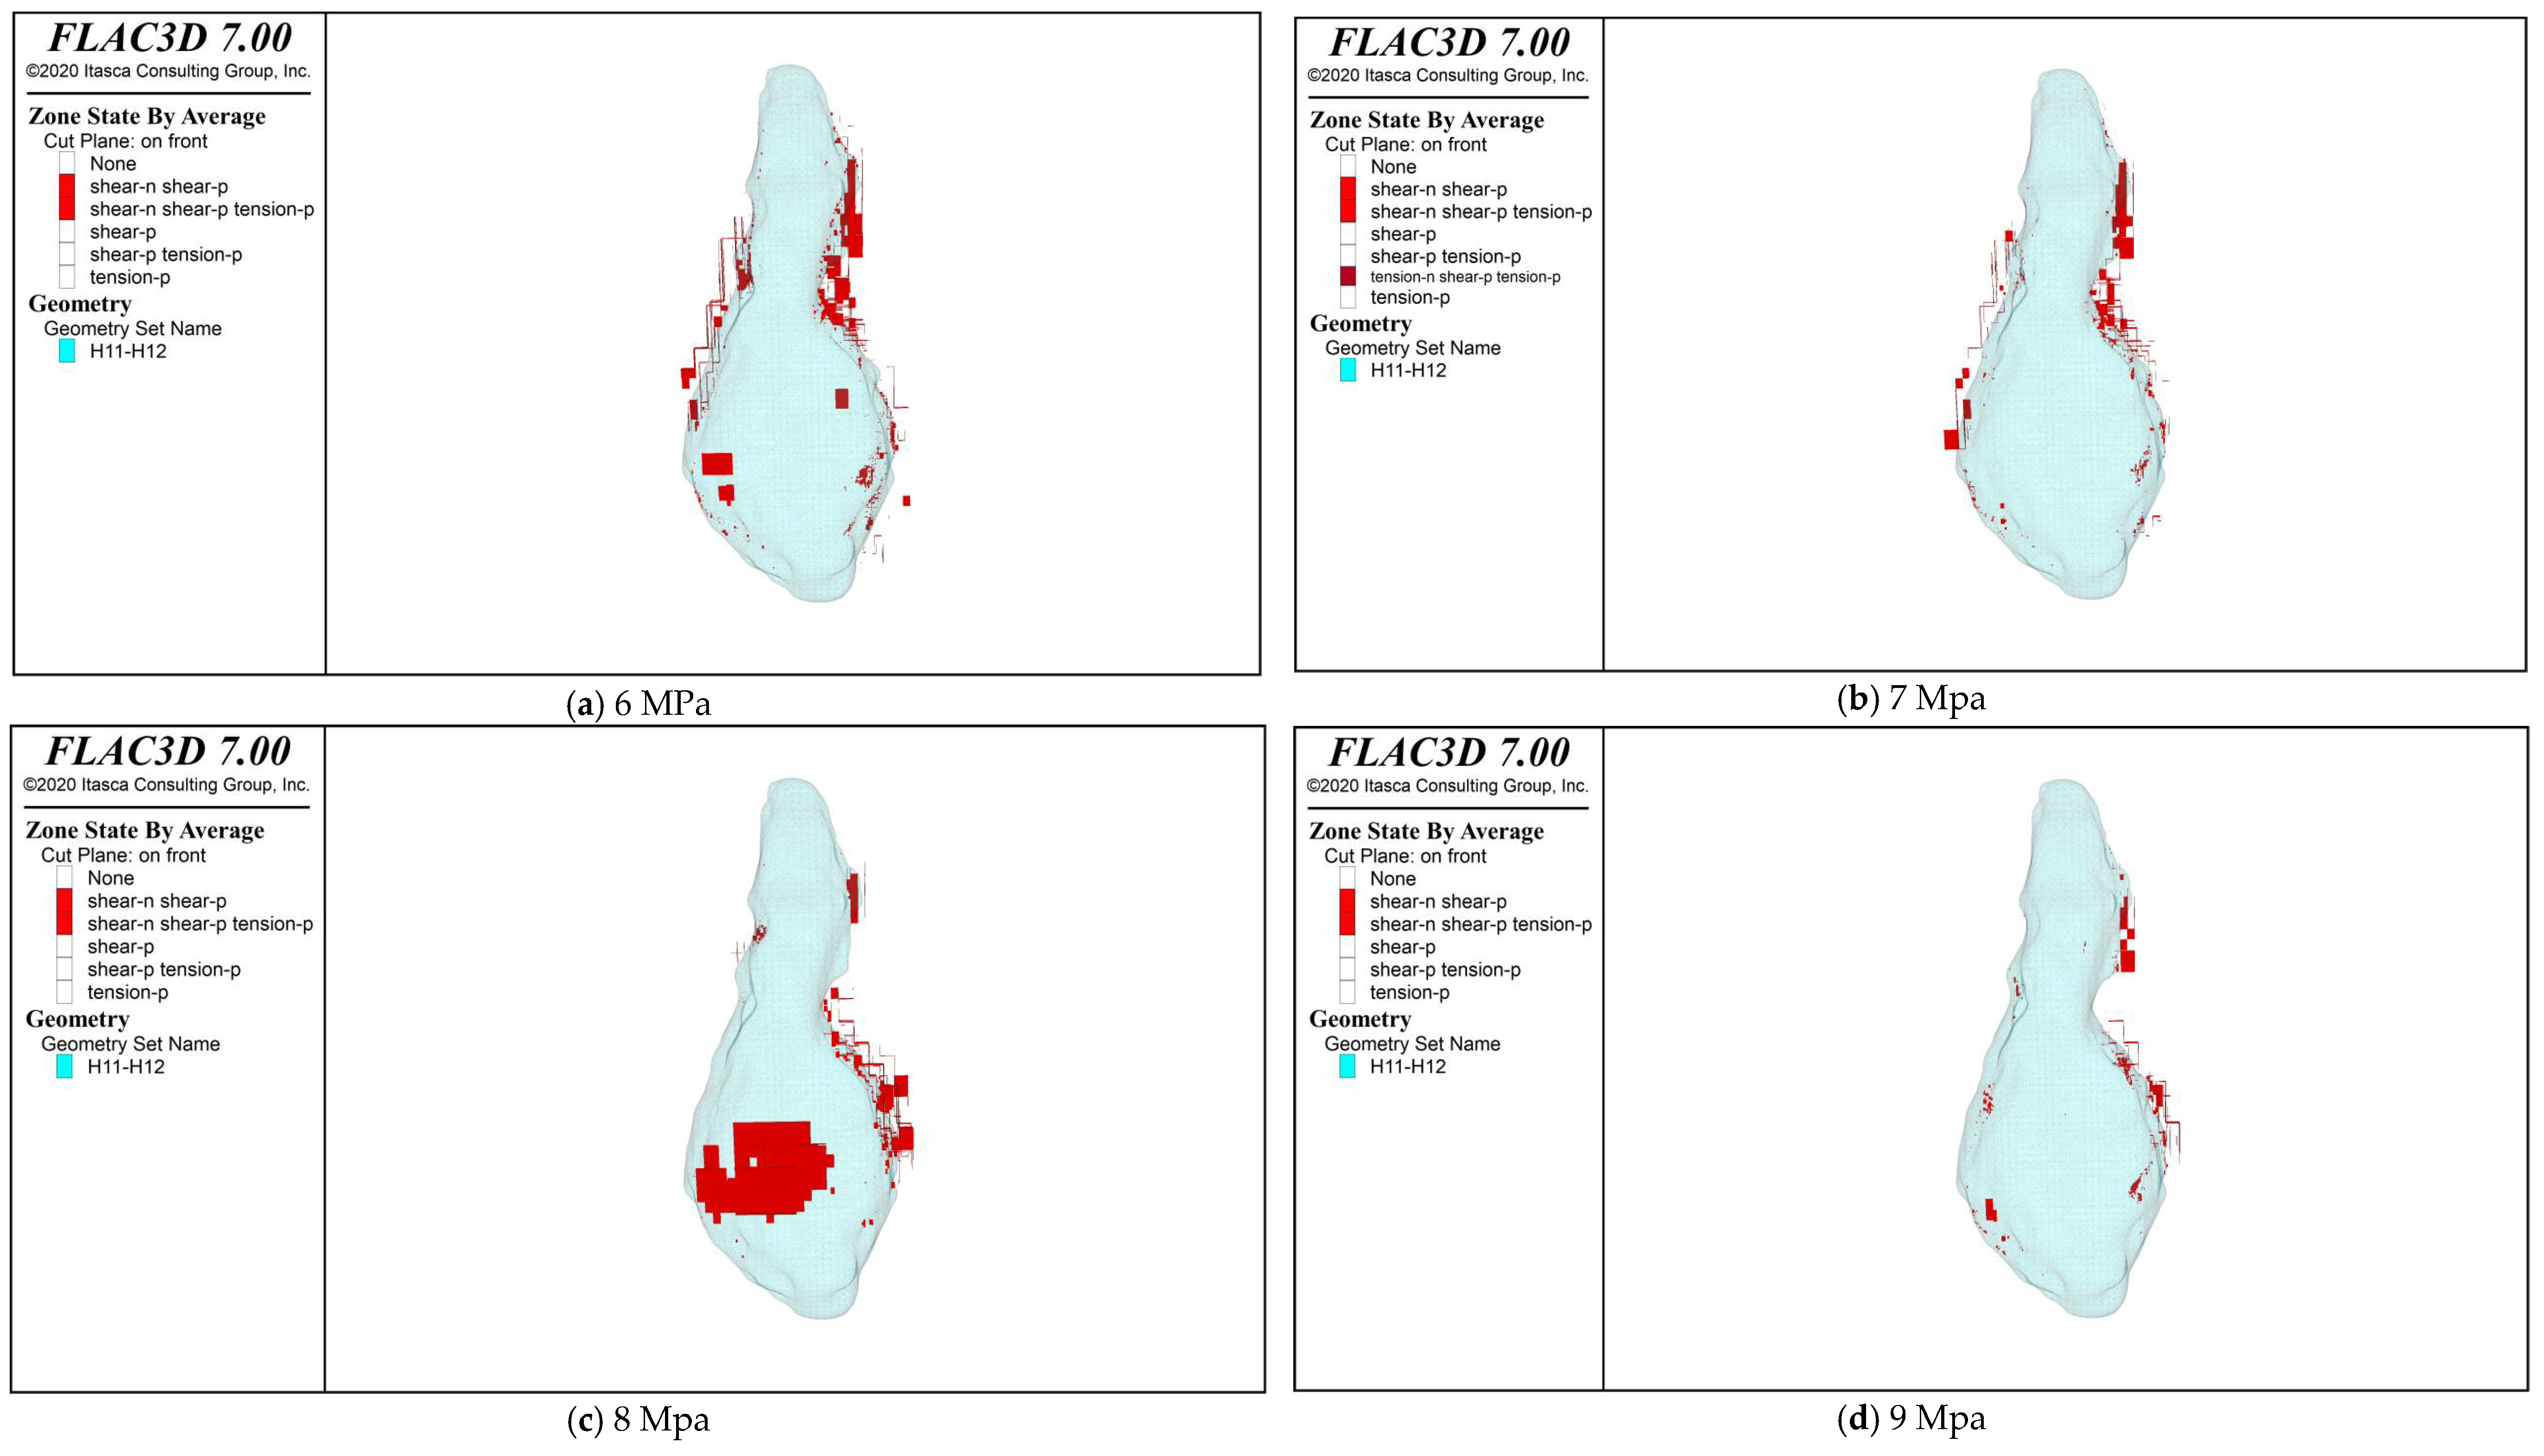
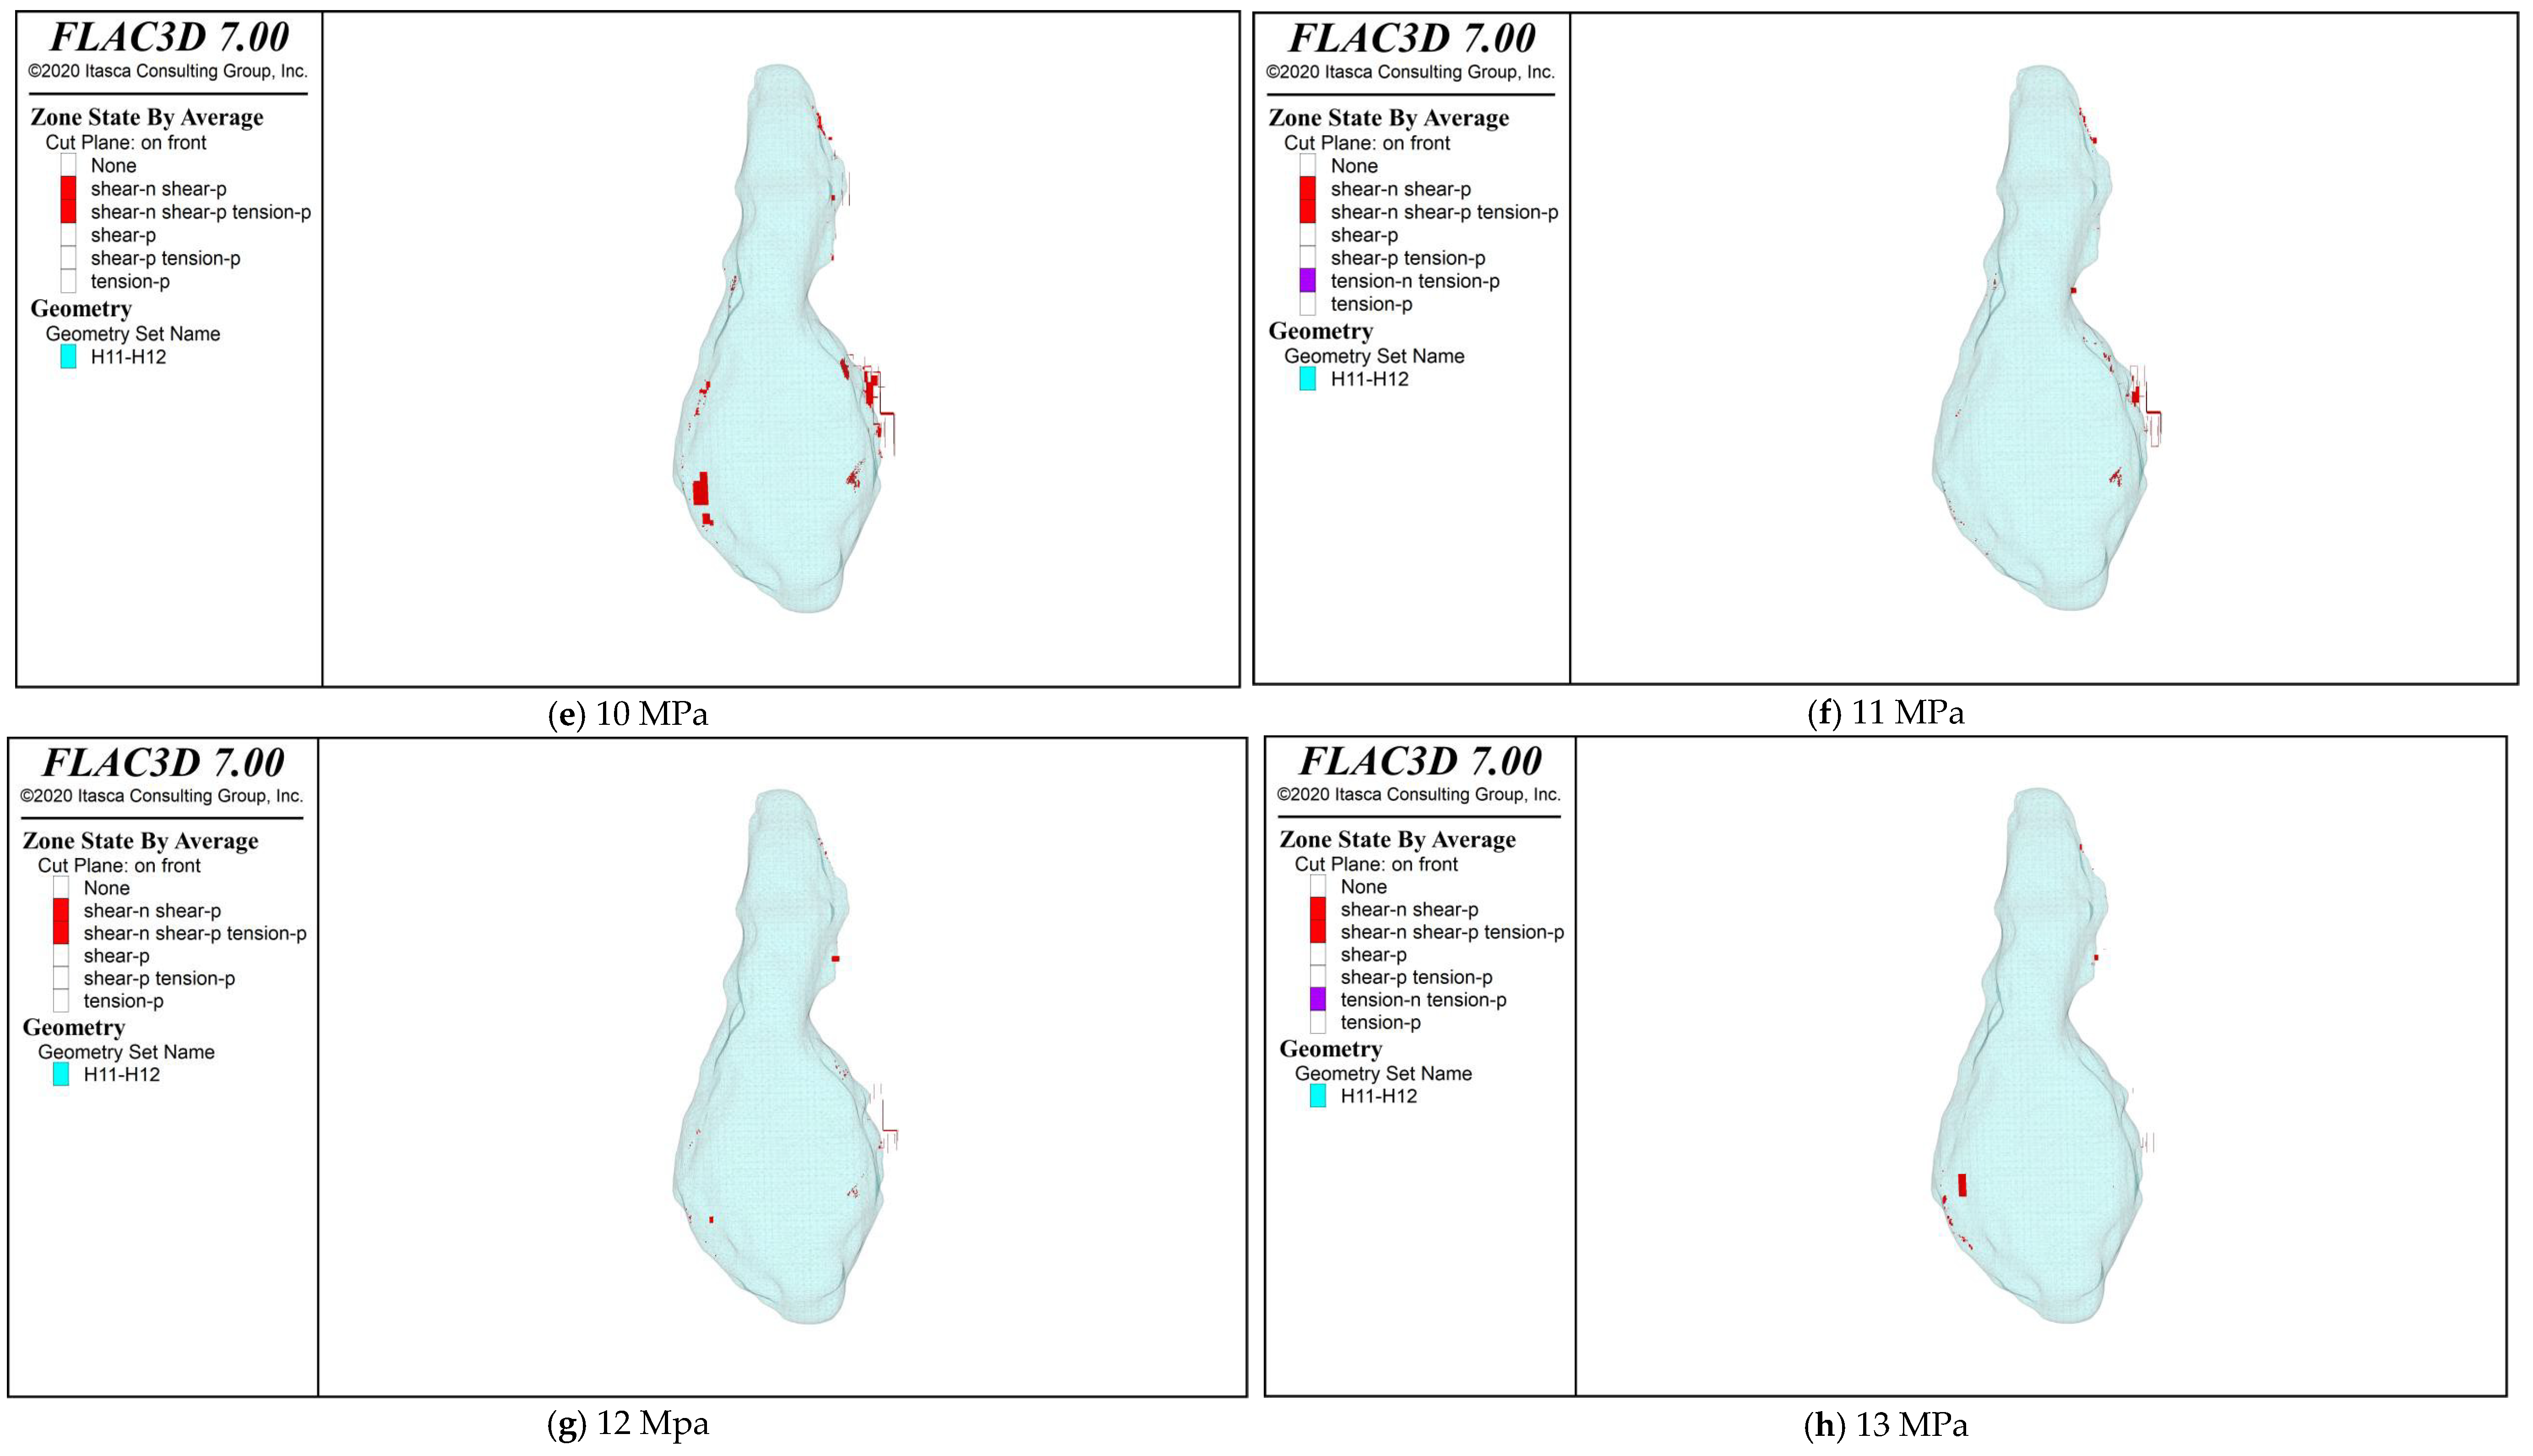
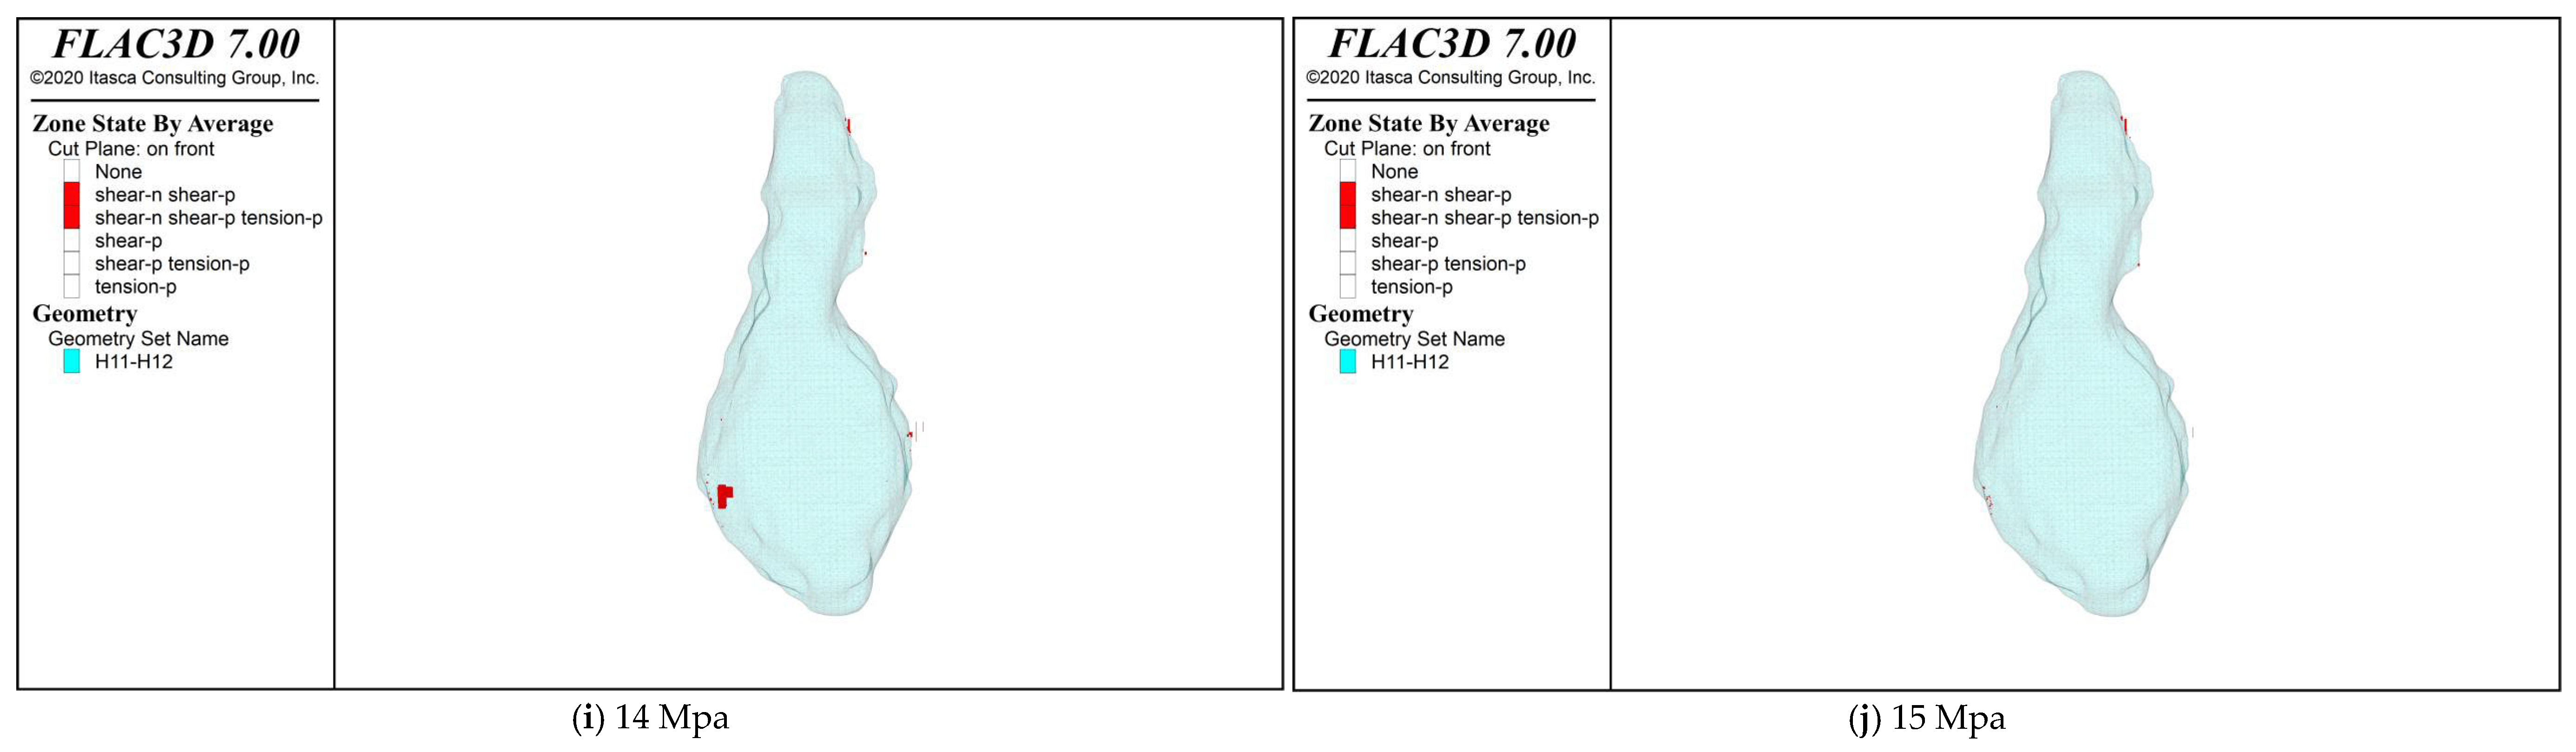
Using classical Mohr-Coulomb strength theory and a creep constitutive equation suitable for salt rock in the Dawenkou Basin, numerical simulations of rock mechanical stability were conducted. As shown in Figure 6, the distribution of plastic zones indicates that these zones are primarily located on both sides of the cavern, with only scattered plastic zones present on the roof and floor. Element failure occurs at internal pressures of 6–10 MPa. When the internal pressure exceeds 11 MPa, plastic zones become extremely rare, appearing only sporadically along the cavern walls, with their number decreasing as the pressure increases. At an internal pressure of 15 MPa, element failure nearly disappears. Rock mechanical simulations indicate that salt caverns in the high-potential zone exhibit favorable stability under appropriate operating pressures.
Figure 6.
Pericavitary Plastic Zone and Cavern Perspective View at H11–H12.
According to Canada’s Salt Cavern Safety Specification “Storage of Hydrocarbons in Underground Formations,” the maximum safe pressure gradient for salt caverns is 18.1 kPa/m, and the minimum safe pressure gradient is 3.4 kPa/m. Therefore, the maximum operating pressure for a 1247–1290 m deep salt cavern should be 22.5 MPa. The roof of Salt Cavern No. 1 at the Moss Bluff Storage Facility in the United States is buried at a depth of 792 m, with a maximum operating pressure of 14.96 MPa. Referencing the pressure design of the Moss Bluff Storage Facility, the maximum and minimum operating pressure range for the 1247–1290 m salt caverns is approximately 15.5–23.5 MPa. Using an engineering analogy approach and comprehensively considering Canadian salt cavern storage standards alongside operational experience from U.S. and domestic salt cavern storage facilities, an operational pressure range of 15–23 MPa is recommended.
It is recommended that the internal pressure at the cavern roof of energy storage caverns in the Dawenkou Basin, Shandong Province, be maintained between 15 and 23 MPa. If surface equipment cannot meet the pressure requirements, the pressure may be appropriately reduced, but a pressure below 12 MPa is not recommended. Therefore, for this study, an internal pressure of 15 MPa and a temperature of 46 °C (as interpreted from logging data) are adopted as the temperature and pressure conditions for CH4/CO2 storage in the working zone salt caverns.
5.3. Long-Term Stability Analysis
The H9–H10 underground cavern model was derived from the 3D seismic results. The original data consisted of point data, enabling cavern modeling through point clouds, as shown in Figure S4. The dimensions of the H9–H10 cavern are 151 m in the X-direction, 330 m in the Y-direction, and 107 m in the Z-direction (1275.75–1382.41 m). The cavern was meshed as shown in Figure S5. The H9–H10 cavern comprised 2,518,241 elements, 3,099,446 nodes, and 1,101,293 connections.
The top stratum of the geological model was buried at a depth of 1000 m. Based on in situ stress calculations, the stress should be 23 MPa. The horizontal and vertical components of the in situ stress are shown below. Figure S6 shows that the in situ stress calculations are accurate. The constitutive model parameters are listed in Table S4.
The bottom surface of the model was constrained by simply supported conditions for the vertical displacement. The four longitudinal surfaces were constrained by simply supported conditions in the corresponding normal directions. This means that geological bodies outside the model’s front, rear, left, right, and bottom surfaces were treated as rigid bodies and were not permitted to undergo normal displacement. The displacement boundary conditions were applied, as shown in Figure S7.
A long-term operational stability assessment of compressed air energy storage was conducted for the H9–H10 well group, and the results are presented in Figure S8. The injection-production cycle operates 365 times annually within a pressure range of 15.8–22.3 MPa, simulating 30 years of operation. The operational cycle consisted of 8 h charging and 6 h discharging phases, and the details are provided below.
0:00–8:00, operated for 8 h from a minimum pressure of 15.8 MPa to a maximum pressure of 22.3 MPa; 8:00–9:00, maintained the maximum pressure for 1 h; 9:00–11:00, operated for 2 h from a maximum pressure of 22.3 MPa to an intermediate pressure of 20.1 MPa; 11:00–15:00, operated at an intermediate pressure of 20.1 MPa for 4 h; 15:00–17:00, operated from an intermediate pressure of 20.1 to 18.0 MPa for 2 h; 17:00–19:00, maintained an intermediate pressure of 18.0 MPa for 2 h; 19:00–21:00, operated from an intermediate pressure of 18.0 MPa to a minimum pressure of 15.8 MPa for 2 h; and 21:00–24:00, operated at a minimum pressure of 15.8 MPa for 3 h.
Figure S9 shows the displacement contour map from the long-term stability analysis of the H9–H10 cavern, revealing upward uplift at the cave floor and downward subsidence at the cave roof, with the maximum displacement observed at the cavern roof. The displacement around the cavern periphery gradually increases with increasing operating time. After 30 years of operation, the maximum displacement of the cave roof reaches 0.413 m. This demonstrates that salt caverns in high-potential zones maintain favorable operational capacity even under long-term operation.
6. Conclusions
(1) The rock salt deposits in the Dawenkou Basin are hosted within the middle section of the Paleogene Dawenkou Formation, Guan Zhuang Group, Eocene series. The strike of the mineralized layers aligns with the stratigraphic strike, with both dipping gently from the basin margins toward the basin center. The salt cap burial depth ranges from 500 to 1500 m, with burial depth increasing from the southeast to the northwest. The rock salt facies cover an area of approximately 53 km2 and contain 32 salt layers. The salt thickness increases from the periphery toward the center, reaching a total thickness of 160 m at the sedimentary center, with an average single-layer thickness of 6 m. The study area exhibits overall substantial salt thickness, relatively high soluble content, and long-term stable production, meeting the volume requirements for salt caverns in energy storage applications.
(2) Using the random forest classification algorithm in machine learning, the importance of various parameters affecting the energy storage potential of salt caverns was ranked. The primary geological factors influencing salt cavern energy storage potential were determined to be, in order, the number of salt layers, thickness of salt layers and depth of salt layers. Using the analytic hierarchy process (AHP), evaluation parameters, including salt layer burial depth, salt layer thickness, interlayer thickness, salt layer grade, and salt content, were selected as assessment indicators. On the basis of the 3D seismic classification interpretation results for salt caverns across various blocks in the Dawenkou Basin, machine learning was employed to determine the weights of these indicators. Through comprehensive evaluation scoring, high-potential energy storage zones within the Dawenkou Basin were identified and prioritized.
(3) The high-potential energy storage area spans 12.8 km2 and is capable of forming 11,542~14,333 × 104 m3 of salt cavern storage space. The medium-potential area covers 15.87 km2 and is capable of forming 5773~7169 × 104 m3 of salt cavern storage space. The low-potential area spans 25.15 km2 and is capable of forming 7764~9642 × 104 m3 of salt cavern storage space. Salt caverns in the high-potential area possess favorable sealing performance and stability.
(4) Salt cavern storage reservoirs have a design service life of over 30 years, with robust long-term operational stability and low maintenance costs. Supported by policies for new energy storage, they demonstrate favorable commercial development and investment value. Salt caverns in the study area exhibit excellent tightness and stability and can support multi-functional utilization including compressed air energy storage, hydrogen storage, natural gas storage and petroleum reserve. The study area therefore holds the potential for constructing a comprehensive underground energy storage repository.
Supplementary Materials
The following supporting information can be downloaded at: https://www.mdpi.com/article/10.3390/en19215061/s1. Figure S1: Technical Roadmap for Site Selection and Potential Evaluation of Salt Cavern Energy Storage in the Dawenkou Basin; Figure S2: Monte Carlo Analysis Results; Figure S3: Grid Division Diagram of H11–H12 Grids; Figure S4: H9-H10 Cavern Mesh Partition Diagram; Figure S5: 3D Diagram and Mesh Partitioning of the Cavern; Figure S6: Stresses in Different Directions; Figure S7: Displacement Boundary Conditions; Figure S8: Long-Term Stability Analysis of Salt Caverns under Operational Conditions; Figure S9: Pericavitary Displacement Contour Map. Table S1: Classification of Salt Caverns in the Sedimentary Center–Margin Transition Zone of the Dawenkou Basin (Dongyue:17 Salt Caverns); Table S2: Classification of Salt Caverns in the Sedimentary Center of the Dawenkou Basin (Luyin:11 Salt Caverns); Table S3: Basin Scale Regional Condition Evaluation of Salt Cavern Energy Storage; Table S4: Parameters of Rock Mechanical Constitutive Models; Table S5: Raw Group Pairwise-Comparison Judgment Matrix Obtained by Element-Wise Geometric Averaging of Experts’ Scores; Table S6: Prediction of Cavern Storage Volume for Energy Storage Potential Zones in the Dawenkou Basin.
Author Contributions
Conceptualization, W.S., J.Z., M.W. and Q.L.; methodology, W.S. and X.S.; formal analysis, W.S., J.Z. and M.W.; writing—original draft preparation, R.X., W.S., J.Z. and L.L.; writing—review and editing, W.S. and Q.L.; validation, M.W.; investigation, R.X., L.L., X.S. and X.C.; resources, R.X. and X.C.; data curation, M.W., X.S., L.L. and X.C.; visualization, X.S. and X.C.; project administration, R.X. All authors have read and agreed to the published version of the manuscript.
Funding
This research was funded by [Shandong Provincial Coalfield Geological Bureau Key Scientific Research Project: Research on Key Technologies for Evaluating Deep Ground Salt cavern Gas Storage Reservoirs] grant number [MTDZKY-2025-08], [Shandong Provincial Coalfield Geological Bureau Key Scientific Research Project: Study on Intelligent Simulation Technology of Gas Injection and Brine Discharge for Sediment-filled Salt Caverns in Dawenkou Basin] grant number [MTDZKY-2026-10] and [Powerchina Renewable Energy Co., Ltd. Scientific Research Project: Study on Construction and Economy of Salt Cavern Compressed Air Energy Storage Gas Reservoir].
Data Availability Statement
Some data supporting the conclusions of this study are restricted by legal and confidentiality clauses and are not publicly available.
Conflicts of Interest
Authors Ronghui Xu, Xiaomeng Sun and Xincheng Cui were employed by the company Powerchina Renewable Energy Co., Ltd., Shandong Branch, Jinan 250102, China and Powerchina (Feicheng), Renewable Energy Co., Ltd., Feicheng 271600, China. Author Longfei Li was employed by the company Powerchina Renewable Energy Co., Ltd., Beijing 110025, China. The remaining authors declare that the research was conducted in the absence of any commercial or financial relationships that could be construed as a potential conflict of interest.
References
- Zhao, K.; Liu, Y.; Li, Y.; Ma, H.; Hou, W.; Yu, C.; Liu, H.; Feng, C.; Yang, C. Feasibility analysis of salt cavern gas storage in extremely deep formation: A case study in China. J. Energy Storage 2022, 47, 103649. [Google Scholar] [CrossRef] [Scilit]
- Wei, X.; Shi, X.; Li, Y.; Li, P.; Ban, S.; Zhao, K.; Ma, H.; Liu, H.; Yang, C. A comprehensive feasibility evaluation of salt cavern oil energy storage system in China. Appl. Energy 2023, 351, 121807. [Google Scholar] [CrossRef] [Scilit]
- Li, W.; Ma, H.; Zhao, K.; Li, H.; Zeng, Z.; Wang, X.; Liang, R.; Yang, C. Stability and settlement analysis of salt cavern groups for compressed air energy storage: A case study in China. J. Energy Storage 2025, 122, 116626. [Google Scholar] [CrossRef] [Scilit]
- Li, H.; Yang, C.; Ma, H.; Li, Z.; Liang, X.; Cai, R.; Wang, X.; Fang, J.; Wang, Z. Feasibility analysis of gas storage salt caverns in ultra-deep strata with thick interlayers. Geoenergy Sci. Eng. 2025, 254, 213994. [Google Scholar] [CrossRef] [Scilit]
- Ma, H.; Wei, X.; Shi, X.; Liang, X.; Bai, W.; Ge, L. Evaluation Methods of Salt Pillar Stability of Salt Cavern Energy Storage. Energies 2022, 15, 7570. [Google Scholar] [CrossRef] [Scilit]
- Wu, Y.; Wang, H.; Zhang, B.; Wang, W.; Du, Q.; Sun, D.; Zhang, J. Novel concept and stability analysis of pipe layout type abandoned mine compressed air energy storage technology. Tunn. Undergr. Space Technol. 2026, 167, 107080. [Google Scholar] [CrossRef] [Scilit]
- Li, H.; Ma, H.; Zhao, K.; Zhu, S.; Yang, K.; Zeng, Z.; Zheng, Z.; Yang, C. Parameter design of the compressed air energy storage salt cavern in highly impure rock salt formations. Energy 2024, 286, 129520. [Google Scholar] [CrossRef] [Scilit]
- Yu, H.; Liu, Y.; Ma, H.; Zhao, K.; Liu, J. Pillar safety in shallow salt caverns by using numerical simulations. J. Energy Storage 2022, 55, 105881. [Google Scholar] [CrossRef] [Scilit]
- Liu, S.; Xia, C.; Xu, Y.; Xu, C. Physical model test and numerical simulation for the stability of a lined rock cavern for compressed air energy storage. Energy 2025, 335, 137853. [Google Scholar] [CrossRef] [Scilit]
- Wang, M.; Shi, W.; Huang, X.; Lan, Z.; Lü, Y.; Jiang, X.; Yang, X.; Xu, X.; Wang, D. A Key Technical System for the Construction of Energy Storage Caverns in Bedded Salt Rock—A Case Study of the Dawenkou Basin. Energies 2026, 19, 2518. [Google Scholar] [CrossRef] [Scilit]
- Hou, R.; Cui, Q.; Guo, Y.; Shi, Y.; Fu, J. A new elasto-visco-plastic damage model and numerical simulation method used for time-dependent behavior prediction of deep tunnel. Comput. Geotech. 2024, 168, 106129. [Google Scholar] [CrossRef] [Scilit]
- Fu, L.; Fan, J.; Shi, X.; Zhu, S.; Wei, X.; Tian, H. Concealed morphology construction and stability evaluation of two butted-well horizontal salt caverns gas storage. Energy 2025, 317, 134499. [Google Scholar] [CrossRef] [Scilit]
- Ge, X.; Huang, J.; Zhou, K.; Su, K.; Wang, W.; Li, Y.; Shi, X. Research of interlayer dip angle effect on stability of salt cavern energy and carbon storages in bedded salt rock. Geoenergy Sci. Eng. 2024, 243, 213291. [Google Scholar] [CrossRef] [Scilit]
- Li, P.; Kang, H.; Zhu, Q.; Wu, Y.; Zhang, J.; Fan, L.; Wang, Z. Numerical and experimental investigations of concrete lined compressed air energy storage system. J. Clean. Prod. 2023, 390, 136153. [Google Scholar] [CrossRef] [Scilit]
- Li, D.-P.; Liu, W.; Fu, P.; Li, L.; Ban, F.-S.; Li, Q.-H.; Fan, J.-Y.; Jiang, D.-Y.; Zhang, Z.-X. Stability evaluation of salt cavern hydrogen storage and optimization of operating parameters under high frequency injection production. Gas Sci. Eng. 2023, 119, 205119. [Google Scholar] [CrossRef] [Scilit]
- Wang, T.; Ding, Z.; He, T.; Xie, D.; Liao, Y.; Chen, J.; Zhu, K. Stability of the horizontal salt cavern used for different energy storage under varying geological conditions. J. Energy Storage 2024, 84, 110817. [Google Scholar] [CrossRef] [Scilit]
- Zhang, H.; Zhang, G.; Liu, K.; Fu, X.; Li, Y.; Liu, Y. Schemes comparation of layered and continuous solution mining in bedded salt formations by horizontal interconnected wells. Int. J. Min. Sci. Technol. 2025, 35, 2213–2229. [Google Scholar] [CrossRef] [Scilit]
- Breiman, L. Random forests. Mach. Learn. 2001, 45, 5–32. [Google Scholar] [CrossRef] [Scilit]
- Bao, H.L.; Liu, N.N.; Peng, H. Improving the site selection accuracy of salt cavern gas storage by considering macro and micro geological body properties. Oil Drill. Prod. Technol. 2025, 47, 489–499. [Google Scholar]
- Jing, W.J.; Yang, C.H.; Li, Y.P.; Yang, C.L. Study on site selection evaluation method for salt cavern gas storage based on analytic hierarchy process. Rock Soil Mech. 2012, 33, 2683–2690. [Google Scholar]
- Shi, W.; Tang, S.; Huang, W.; Zhang, S.; Li, Z. Distribution Characteristics of C-N-S Microorganism Genes in Different Hydraulic Zones of High-Rank Coal Reservoirs in Southern Qinshui Basin. ACS Omega 2021, 6, 21395–21409. [Google Scholar] [CrossRef] [Scilit] [PubMed]
- Huang, L.; Fang, Y.; Hou, Z.; Xie, Y.; Wu, L.; Luo, J.; Wang, Q.; Guo, Y.; Sun, W. A preliminary site selection system for underground hydrogen storage in salt caverns and its application in Pingdingshan, China. Deep Undergr. Sci. Eng. 2023, 3, 117–128. [Google Scholar] [CrossRef] [Scilit]
- Tagiyev, A.; Karagozov, E.; Ismayilova, M.; Abdullayeva, L.; Tahirova, S.; Mansurova, S.; Mangushev, R.; Habibullayeva, S.; Hashimov, S.; Bayraktutan, M.; et al. GIS-Based Geothermal Favorability Mapping and Geological Consistency Assessment in the Lower Kura Basin. Energies 2026, 19, 4061. [Google Scholar] [CrossRef] [Scilit]
- Fu, Y.; Lu, D.; Xiao, X.; Zhao, R.; Xiong, J.; Yuan, W.; Yang, C.; Wang, L.; Liu, J. Review on Integrated Reassessment of China’s CO2 Geological Storage Potential Based on AHP Weighting and Multi-Source Indicator Synthesis. Energies 2026, 19, 4234. [Google Scholar] [CrossRef] [Scilit]
- Lv, T.; Wan, J.; Zheng, Y.; He, L.; Yi, L. Optimization of CO2 geological storage sites based on regional stability evaluation—A case study on geological storage in Tianjin, China. Front. Earth Sci. 2022, 10, 955455. [Google Scholar] [CrossRef] [Scilit]
- Xiang, H.; Yao, Y.; Gai, S.; Song, J.; Song, W.; Liu, J.; Feng, Z. The target selection and quantitative evaluation for deep geothermal resource zoning of typical geothermal fields in central Hebei of North China plain. Front. Earth Sci. 2023, 11, 1264652. [Google Scholar] [CrossRef] [Scilit]
- Shabani, A.; Ziaii, M.; Monfared, M.; Shirazy, A.; Shirazi, A. Multi-Dimensional Data Fusion for Mineral Prospectivity Mapping (MPM) Using Fuzzy-AHP Decision-Making Method, Kodegan-Basiran Region, East Iran. Minerals 2022, 12, 1629. [Google Scholar] [CrossRef] [Scilit]
- Xi, Y.; Li, Y.; Liu, J.; Wu, S.; Lu, N.; Liao, G.; Wang, Q. Application of Analytic Hierarchy Process in Mineral Prospecting Prediction Based on an Integrated Geology-Aerogeophysics-Geochemistry Model. Minerals 2023, 13, 978. [Google Scholar] [CrossRef] [Scilit]
- Lang, L.; Fu-bao, Z. A comprehensive hazard evaluation system for spontaneous combustion of coal in underground mining. Int. J. Coal Geol. 2010, 82, 27–36. [Google Scholar] [CrossRef] [Scilit]
- AlAhmad, H.A.; Liu, S.; Li, X.; Jia, C. Critical Review of Subsurface Processes Governing CO2 Leakage Mechanisms. Adv. Colloid Interface Sci. 2025, 349, 103770. [Google Scholar] [CrossRef] [Scilit] [PubMed]

Disclaimer/Publisher’s Note: The statements, opinions and data contained in all publications are solely those of the individual author(s) and contributor(s) and not of MDPI and/or the editor(s). MDPI and/or the editor(s) disclaim responsibility for any injury to people or property resulting from any ideas, methods, instructions or products referred to in the content. |
© 2026 by the authors. Licensee MDPI, Basel, Switzerland. This article is an open access article distributed under the terms and conditions of the Creative Commons Attribution (CC BY) license.