


Abstract
Ice shedding from transmission conductors may induce severe vertical jumps and sudden tension variations, threatening the electrical clearance and structural safety of transmission lines in heavy ice areas. To investigate the coupled effects of wind load, ice accretion distribution, and ice-shedding mode, this paper establishes a dynamic model for the ice-shedding jump of an iced quad-bundled conductor considering wind action. The conductor is discretized into cable elements and nodes, and the aerodynamic forces are updated in real time according to the relative wind speed, attack angle, and wind-tunnel-based force coefficients. The model is verified by mesh, time step and damping sensitivity analyses, compared with published numerical results without wind, and checked for consistency with wind-tunnel-based trends under wind load. Based on the proposed numerical model, the effects of wind speed, attack angle, ice accretion pattern, and ice-shedding mode on the maximum jump height Hmax and its spanwise location Pmax are analyzed. Neglecting non-uniform ice accretion underestimates the jump after whole-span shedding by a factor of 2.4–6.8, whereas the response to half-span shedding is insensitive to the ice distribution (within ±10%). The amplification at high wind speed results from the sudden reduction in the downward aerodynamic load on the shed section, which grows with U2 and outweighs the aerodynamic damping of the vertical motion. For a 500 kV vertical arrangement, half-span shedding reduces the phase-to-phase clearance to 3.5–4.5 m, which satisfies the power frequency requirement but not the switching overvoltage requirement of GB 50545-2010.
1. Introduction
Ice accretion threatens the external insulation of transmission systems, for example by causing the flashover of iced insulator strings [1], and it also alters the physical state of the conductor itself [2] by changing its self-weight, equivalent outer diameter, and aerodynamic profile.
Early studies on ice-shedding jumps focused on the effects of ice thickness, shedding ratio, span length and shedding position, and simplified or theoretical formulas for the jump height were proposed [3,4,5,6]. These formulas are mainly limited to uniform ice and whole-span shedding and cannot predict where the maximum jump occurs. With the development of numerical techniques, finite element and multibody models have been applied to multi-span lines [7,8,9,10], bundled conductors [11], and tension insulator strings [12]. However, most of these models consider only the sudden release of the ice load, and wind is either neglected or represented by a static lateral load. Experimental studies, including reduced-scale model tests [13,14,15] and natural field experiments [16], have provided valuable data, but they were mostly conducted without wind.
In practice, ice shedding often occurs under wind, which couples with sudden ice release. Since ice accretion turns the conductor cross-section from nearly circular into an asymmetric aerodynamic profile, the aerodynamic forces change significantly. Wind load can markedly affect the post-shedding response, and design methods based solely on static wind and ice loads may not capture it under specific ice–wind conditions [17]. Moreover, wind speed, wind direction, and line orientation jointly determine the actual attack angle on a tower-line system, and ignoring them may bias the evaluation of wind-induced responses and flashover risk [18]. Wind speed, attack angle, and the aerodynamic characteristics of the iced cross-section should therefore be incorporated into the analysis.
Existing studies on this coupling remain fragmented. Lou et al. [19] obtained the aerodynamic coefficients of crescent-shaped iced quad-bundled conductors from wind tunnel tests and analyzed the jump height under ice–wind coupling, showing that the wind effect is closely related to the attack angle and that ignoring wind load may underestimate the maximum jump height in some angle ranges. However, only uniformly iced conductors were considered. Yang et al. [20] developed a cable element model with torsional degrees of freedom and wind-tunnel-based aerodynamic coefficients for a single conductor, proposed an amplification factor for the jump height under ice–wind coupling and verified it by field tests; however, only uniform ice and whole-span shedding were considered. Experimental studies on non-uniform ice shedding, such as Huang et al. [13], showed that partial ice shedding can be more critical for electrical clearance than whole-span shedding, and that the peak jump position may deviate from the mid-span to about two-fifths of the span, but these reduced-scale tests were conducted on single conductors under essentially no-wind conditions. Other recent works addressed non-uniform ice accretion after ice shedding without wind [21], the bouncing process under strong wind for approximately uniform ice [22], or combined icing and wind effects at the tower-line level [23]. Consequently, the simultaneous coupling of wind load, non-uniform ice accretion, and non-uniform ice shedding has not been systematically investigated, particularly for quad-bundled conductors whose aerodynamic forces depend on the attack angle and are updated in real time. The scope of the closest previous studies is compared with the present work in Table 1.
Table 1.
Comparison of the closest previous studies.
To address these issues, this study establishes a dynamic model for the ice-shedding jump of an iced quad-bundled conductor considering wind load. The main contributions are threefold. (1) The nodal aerodynamic forces are updated at every time step from the relative wind velocity and the instantaneous attack angle, so that wind load, non-uniform ice accretion, and non-uniform ice shedding are analyzed within one framework, and the numerical convergence of the model is verified. (2) The coupled effects of wind speed, attack angle, ice distribution, and shedding mode on the jump height and its location are quantified, including the error introduced when the non-uniformity of ice accretion is neglected. (3) The mechanism by which wind suppresses the jump at low speed and amplifies it at high speed is explained from the aerodynamic load and work histories, and the engineering consequence is assessed in terms of the phase-to-phase clearance required by GB 50545-2010.
2. Numerical Model
2.1. Dynamic Model of Iced Quad-Bundled Conductor
In this study, a dynamic model of the ice-shedding jump of an iced conductor, accounting for wind action, was developed in C++. The object under investigation is a single-span quad-bundled conductor system. The conductor type is LGJ-630/45, with an outer diameter of 33.6 mm. The span length is taken as 300 m, and the supports at both ends are treated as fixed constraints.
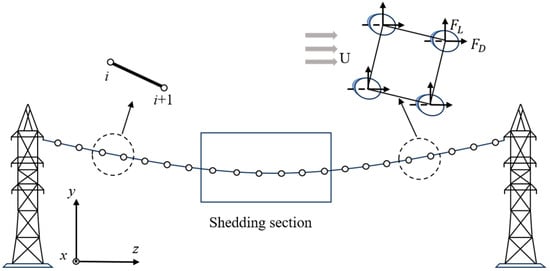
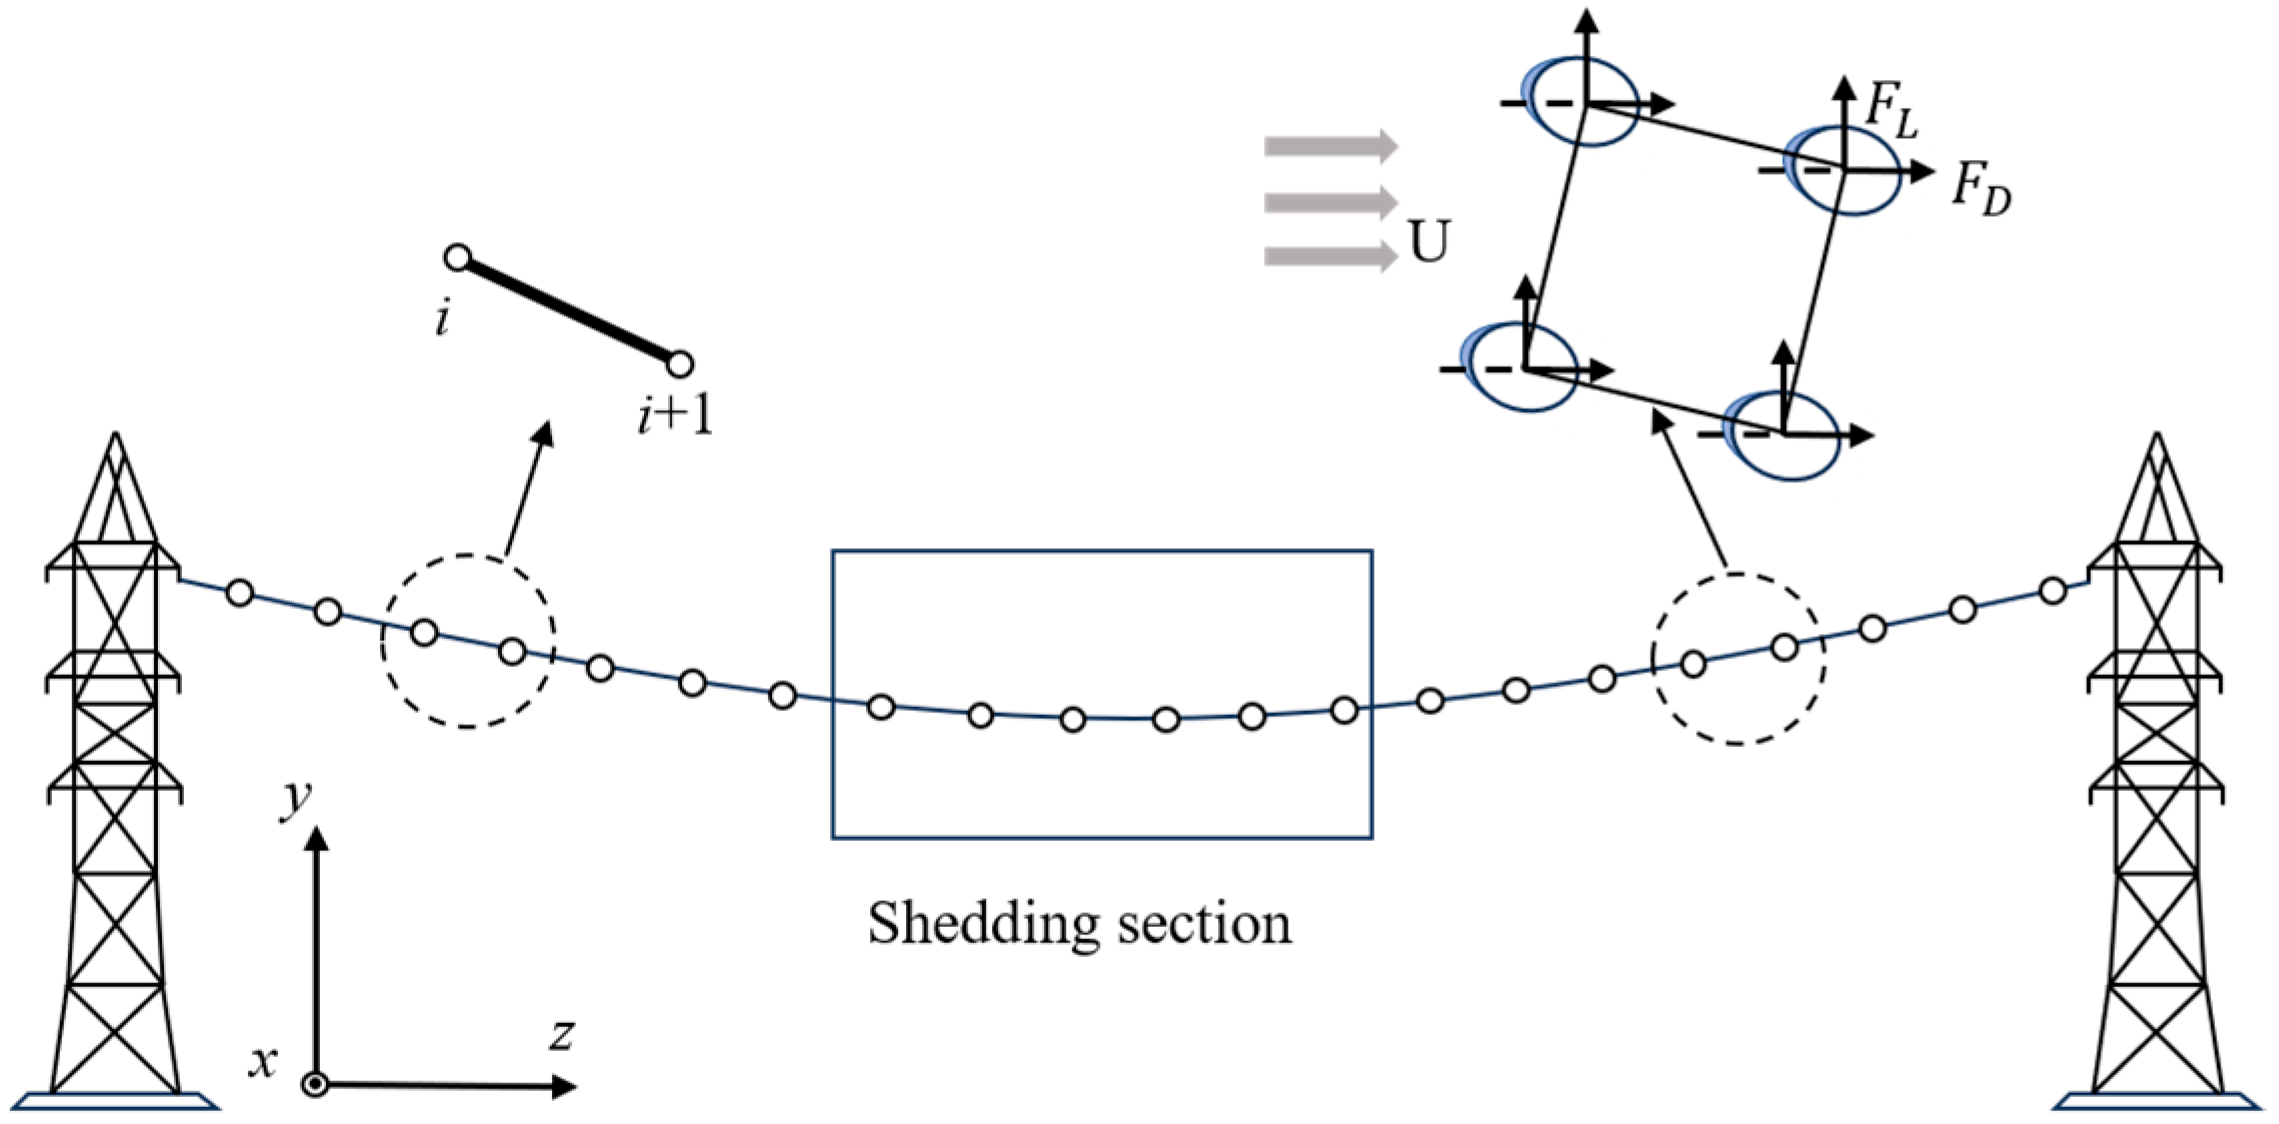
To characterize the large flexibility, large displacement, and transient response of the conductor during ice shedding, the conductor is discretized along the span direction into a number of nodes and cable elements, as shown in Figure 1. The four sub-conductors are represented by an equivalent single cable whose axial stiffness and mass are four times those of one sub-conductor; the relative motion of the sub-conductors, the spacers, and the torsion of the bundle are not modeled. The suspension insulator strings and towers are not included. The nodal mass consists of the mass of the bare conductor and the additional local ice mass, while the external nodal loads include gravity and wind loads.
Figure 1.
Schematic of the numerical model.
The conductor is discretized into 300 two-node cable elements (301 nodes) per span; all model parameters and numerical settings are listed in Table 2 and justified in Section 3.1.
Table 2.
Main parameters of the conductor, ice accretion, and numerical model.
The ice-shedding jump of an iced conductor is a typical geometrically nonlinear dynamic problem, and its governing equation can be expressed as:
where M is the mass matrix (kg), C is the damping matrix (N·s/m), R(u) denotes the structural internal force term considering geometric nonlinearity (N), Fg is the gravity load vector (N), Fa is the aerodynamic force vector (N), and u, , and are the displacement (m), velocity (m/s), and acceleration (m/s2) vectors, respectively. The internal force of element e is Te = Ke (le − l0,e), acting along the line connecting its two nodes, with Ke = n·EA/l0,e, where n = 4 is the number of sub-conductors, le (m) is the current element length, and l0,e = EA/(EA + Ts,e)·le(0) is the unstressed length obtained from the initial catenary configuration with element tension Ts,e (N). Geometric nonlinearity is included because le and the element direction are updated from the current nodal coordinates. With lumped masses, Equation (1) is written for each node i as:
where Ri is the sum of the element forces (N) acting on node i and ci = β mi (mass-proportional damping, N·s/m). Because Fa,i depends on the nodal velocity through the relative wind speed, Equation (2) represents a coupled wind–structure dynamic system. Equation (2) is integrated with the explicit central difference scheme:
where Fin is the right-hand side of Equation (2) at step n. The scheme is conditionally stable, requiring . For the element length of 1.0 m, the critical time step is about 3.5 × 10⁻⁴ s for the iced conductor and 2.2 × 10⁻⁴ s for the bare conductor; Δt = 1.0 × 10⁻⁴ s is adopted.
In the computational procedure, the initial catenary configuration under the iced load is first relaxed with a large damping coefficient (5.0 s−1), including the aerodynamic loads updated at every step, until the maximum nodal velocity falls below 1.0 × 10⁻⁵ m/s or the relaxation time reaches 2 s. The velocities are then reset to zero, and the configuration y0(x) is recorded. At t = 0, the ice mass and the corresponding gravity load of the nodes in the shedding section are removed, the damping coefficient is reduced to 0.10 s−1, and the response is computed by explicit integration for 2.0 s, during which the aerodynamic forces are updated at every time step. The maximum jump height and its location are then extracted.
To characterize wind-load coupling, aerodynamic parameters based on the relative wind speed and attack angle are introduced. For an arbitrary node, the relative wind speed is computed from the incoming wind speed and the instantaneous nodal velocity, the attack angle is determined, and the corresponding wind tunnel drag and lift coefficients CD and CL are applied to the node. Let the incoming wind speed be U (m/s) and the nodal velocity components along the wind and vertical directions be vx (m/s) and vy (m/s). The relative wind speed is then:
The direction of the relative wind is θ = arctan(−vy/(U − vx)), so the instantaneous attack angle is αeff = α0 − θ, where α0 is the attack angle of the incoming wind on the iced section. The coefficients CD and CL are evaluated at αeff and Ur.
The corresponding drag force FD and lift force FL can be expressed as:
where ρ is the air density (kg/m3), li is the conductor length associated with node i (m), and Deff is the windward width (m).
In this study, the aerodynamic forces are updated in real time at each time step during both the static relaxation stage and the dynamic response stage. In this way, the effects of relative wind speed and variations in attack angle on the nodal aerodynamic forces can be considered simultaneously. For nodes that remain ice-accreted, the windward area is determined according to the enveloping dimension of the iced cross-section. For nodes where ice shedding has occurred, the windward area is switched to that based on the outer diameter of the bare conductor, so as to reflect the variation in aerodynamic effects before and after ice shedding.
2.2. Aerodynamic Parameters
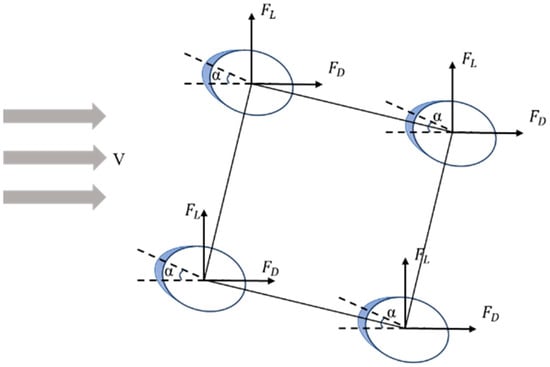
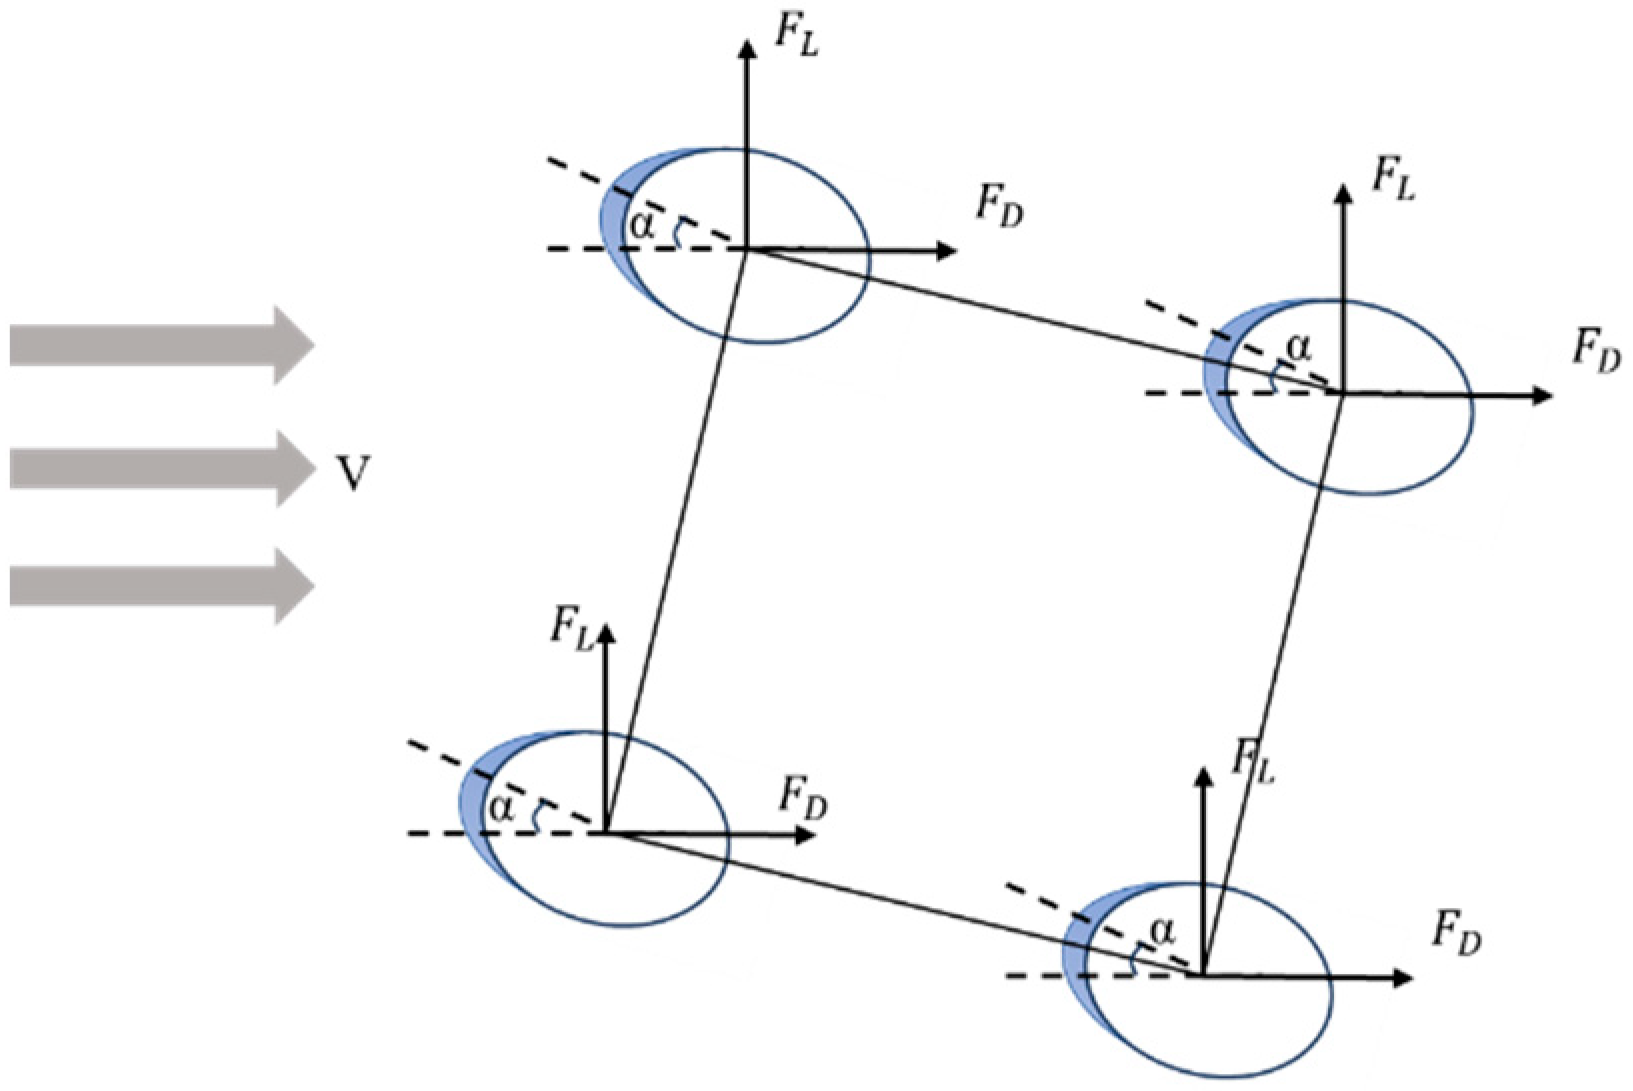
The aerodynamic parameters used in this study are obtained from wind tunnel test data for iced quad-bundled conductors [25]. Taking a crescent-shaped iced quad-bundled conductor as the object, the drag coefficient CD and lift coefficient CL under different parameter combinations were obtained through wind tunnel tests, and the aerodynamic characteristics of the quad-bundled conductor are shown in Figure 2. The main input variables in the tests included bundle spacing, attack angle, wind speed, ice thickness, and conductor outer diameter. In the following analysis, the data subset with a bundle spacing of 450 mm and a conductor outer diameter of 33.6 mm is mainly adopted. Within this subset, the attack angle covers 0–180° at 5° intervals, and the ice thickness covers 1–25 mm. During the computation, the nearest tested values of bundle spacing, ice thickness, and diameter are selected, and the coefficients are linearly interpolated with respect to the attack angle and the wind speed. For the 20 mm ice thickness, the coefficients were measured at 10 m/s only and are applied to all wind speeds, i.e., Reynolds number independence is assumed; the data for 10 mm ice show that CL at 130° varies by about ±20% between 5 and 20 m/s. For shed nodes, the 1 mm entry is used as a proxy for the bare conductor. For local ice thicknesses above 25 mm (Section 4.5), the coefficients for 25 mm are used.
Figure 2.
Aerodynamic characteristics of the quad-bundled conductor.
Although traditional wind load models often include the aerodynamic moment coefficient CM, in addition to CD and CL, the vertical jump height of iced conductors is predominantly governed by vertical lift and horizontal drag forces [19].
The aerodynamic moment mainly acts on the torsional degree of freedom, where its coupling with the vertical motion may trigger the self-excited torsional or coupled galloping of iced conductors [25]. This mechanism is most pronounced for bundled conductors, whose torsional and vertical natural frequencies are close, and becomes significant mainly at large ice thicknesses and near specific attack angles [25]. Ice shedding, by contrast, is a transient response excited by the sudden release of ice load rather than a self-excited instability, and its peak vertical amplitude is dominated by the unbalanced vertical excitation. Therefore, in this study, only CD and CL are included to characterize wind load, thereby simplifying the model without significantly affecting the predictions of maximum jump height Hmax and its spanwise location Pmax. It should be noted that this simplification is most suitable for evaluating transient vertical jump responses; cases dominated by large ice thicknesses, torsional–vertical frequency coincidence, or self-excited torsional instability would require a more detailed model including CM [26]. The omission of CM is further supported by the nature of the response considered here: the jump height is evaluated during the transient response immediately after shedding, whereas coupled torsional–vertical instability (galloping) is a self-excited process that requires many oscillation cycles to develop. In addition, the four sub-conductors connected by spacers provide considerable torsional restraint to the bundle. The present model is therefore restricted to (i) ice thicknesses within the range of the aerodynamic database (≤25 mm), (ii) the transient response during the first oscillation cycles after shedding, and (iii) wind conditions outside the galloping-prone range of [25], where the Den Hartog coefficient is negative near α = 60°, 130°, and 180° only for U ≥ 15 m/s (Re > 36,321). The principal cases (U = 10 m/s, α = 130°) therefore lie outside this range. For the high-wind cases at 130° (U = 15–20 m/s), the results represent only the transient jump before galloping could develop. Thick ice and long-duration responses require CM and the torsional degree of freedom.
2.3. Simulation of Ice Accretion and Ice Shedding
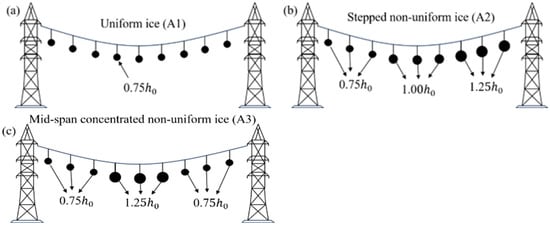
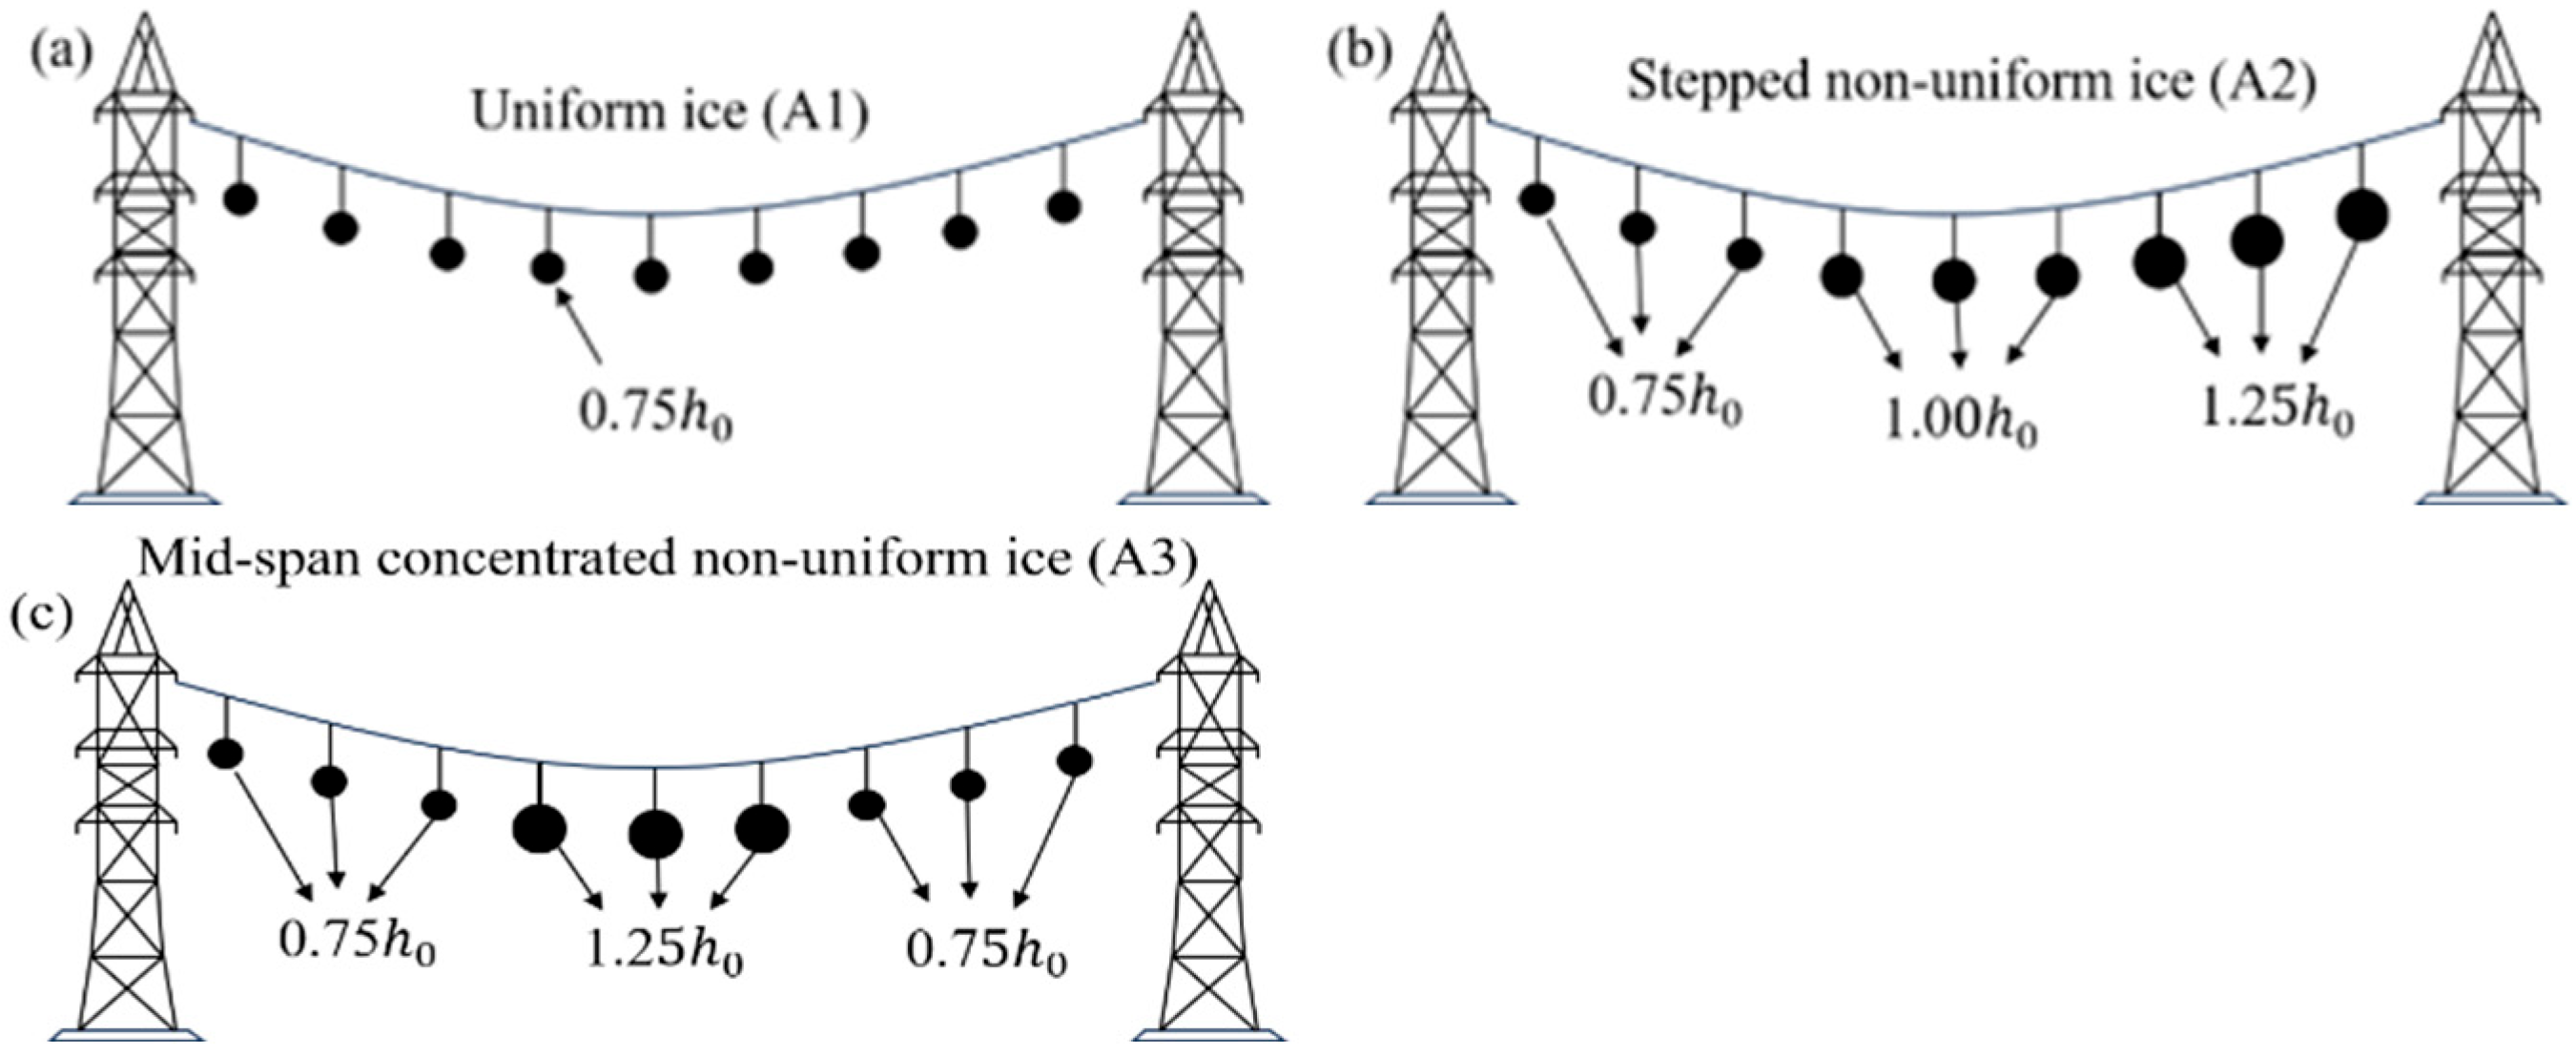
In terms of ice accretion patterns, three typical cases are considered, namely uniform ice (A1), stepwise non-uniform ice (A2), and mid-span concentrated non-uniform ice (A3), as shown in Figure 3.
Figure 3.
Ice accretion patterns: (a) uniform ice (A1), (b) stepwise non-uniform ice (A2), (c) mid-span concentrated non-uniform ice (A3).
A1 refers to the case where the ice thickness remains constant over the whole span.
For A2, the span is divided into three equal sections with ice thicknesses of (1 − δ)h0, h0 and (1 + δ)h0. For A3, the ice thickness is (1 + δ)h0 in the middle section from 0.25 L to 0.75 L and (1 − δ)h0 in the two end sections. δ is the degree of non-uniformity; δ = 0.25 is used unless otherwise stated, and δ = 0.50 and 0.75 are examined in Section 4.5.
Here, h0 denotes the reference ice thickness (mm), and L is the span length (m). The above non-uniform ice patterns are defined under the premise of maintaining the same total ice mass, so as to characterize the influence of ice distribution on the ice-shedding jump response process of the conductor. The ice mass is scaled linearly with the thickness factor, so the total ice mass of A1–A3 is identical; evaluating the annular ice area at the local thickness would increase the total mass of A2 and A3 by only 1.6% and 2.3%, respectively.
In terms of ice-shedding modes, five cases are defined, including whole-span ice shedding (M1), middle-section ice shedding (M2), left half-span ice shedding (M3), right half-span ice shedding (M4), and two-side ice shedding (M5).
M1 corresponds to the simultaneous shedding of ice over the entire span.
M2 corresponds to ice shedding in the section from 0.25 L to 0.75 L.
M3 and M4 correspond to ice shedding in the sections from 0 to 0.5 L and from 0.5 L to 1.0 L, respectively.
M5 corresponds to simultaneous ice shedding in the sections from 0 to 0.25 L and from 0.75 L to 1.0 L.
LGJ-630/45 is a conductor type widely used in 500 kV lines in China; the bundle spacing of 450 mm is the same as in the wind tunnel tests [25], 300 m is a typical span length, and h0 = 20 mm corresponds to the design ice thickness of heavy ice areas. The effect of the span length is examined in Section 4.6.
2.4. Model Parameters and Numerical Settings
To ensure that the simulations can be reproduced, the main parameters of the conductor, the ice accretion, the initial state, and the numerical model are listed in Table 2. The ice mass per unit length of each sub-conductor is calculated from the annular ice cross-section π·b·(d + b), and the initial horizontal tension is determined from the sag-to-span ratio f/L as T0 = wL/(8f/L), where w is the iced load per unit length of a sub-conductor (N/m). Unless otherwise stated, the analyses in Section 4 use the values in Table 2.
The element number and the time step are selected on the basis of the convergence study in Section 3.1, and the time step also satisfies the stability limit of the explicit scheme (Section 2.1). Static relaxation damping is only a numerical device for obtaining the initial equilibrium configuration; Section 3.1 shows that changing it from 2.5 to 10 s−1 alters Hmax by less than 0.5%. The dynamic damping coefficient of 0.10 s−1 represents the low structural damping of the conductor during the transient response, and its influence on the results is quantified in Section 3.1.
Symbols that are used but not defined elsewhere in the text are listed in Table 3.
Table 3.
Nomenclature.
2.5. Response Indices
To uniformly evaluate the dynamic response of ice shedding under different cases, the following response indices are defined in this study. The maximum jump height, Hmax, is defined as the maximum vertical displacement of the conductor over the entire span during the whole dynamic process, namely:
where y0(x) is the initial coordinate (m) in the equilibrium state before ice shedding.
The location of the maximum jump height, Pmax, is defined as the ratio of the position corresponding to Hmax to the span length L, namely:
3. Model Verification and Validation
The numerical model is examined in three steps. First, the convergence of the results with respect to mesh size and time step and their sensitivity to the damping parameters are checked (Section 3.1). Second, the model is compared with published numerical results for non-uniform ice accretion and shedding without wind (Section 3.2). Third, the response under wind load is checked for consistency with published wind-tunnel-based results and an empirical formula (Section 3.3). Although the parametric study is conducted on a single-span quad-bundled conductor, the numerical framework can be configured for multi-span systems; therefore, both single-span and multi-span reference cases are used.
3.1. Numerical Convergence and Sensitivity
Two representative cases are used to check the numerical settings: left half-span shedding without wind (A2-M3, U = 0), which produces the largest jump, and middle-section shedding under wind (A2-M2, U = 10 m/s, α = 130°). The number of elements per span, the time step, and the damping coefficients are varied one at a time while the other settings are kept at the values in Table 2. When the number of elements exceeds 300, the time step is reduced in proportion to the element length to satisfy the stability limit of the explicit scheme. The results are listed in Table 4.
Table 4.
Convergence and sensitivity of Hmax to the numerical settings.
The jump height obtained with 300 elements differs from that with 1200 elements by less than 0.3%, and Pmax changes by less than 0.005 (1.5 m); the mesh of 300 elements is therefore converged. The results are insensitive to the time step (differences below 0.01%), indicating that Δt = 1.0 × 10⁻⁴ s is governed by stability rather than accuracy. The static relaxation damping affects Hmax by less than 0.5%, confirming that it only serves to obtain the initial equilibrium; it shifts Pmax between 0.47 and 0.50, which reflects the flatness of the jump envelope near its peak. Changing the dynamic damping from 0.02 to 0.20 s−1 changes Hmax by −5.4% to +4.8%, and the relative ranking of the cases is not affected; its effect on the clearance assessment is discussed in Section 4.7. These settings are adopted in all subsequent analyses.
3.2. No-Wind Condition
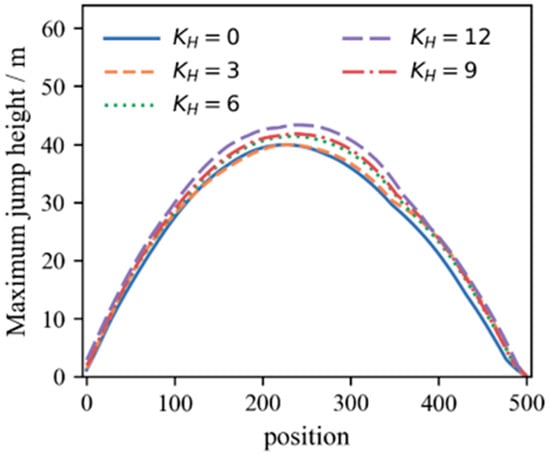
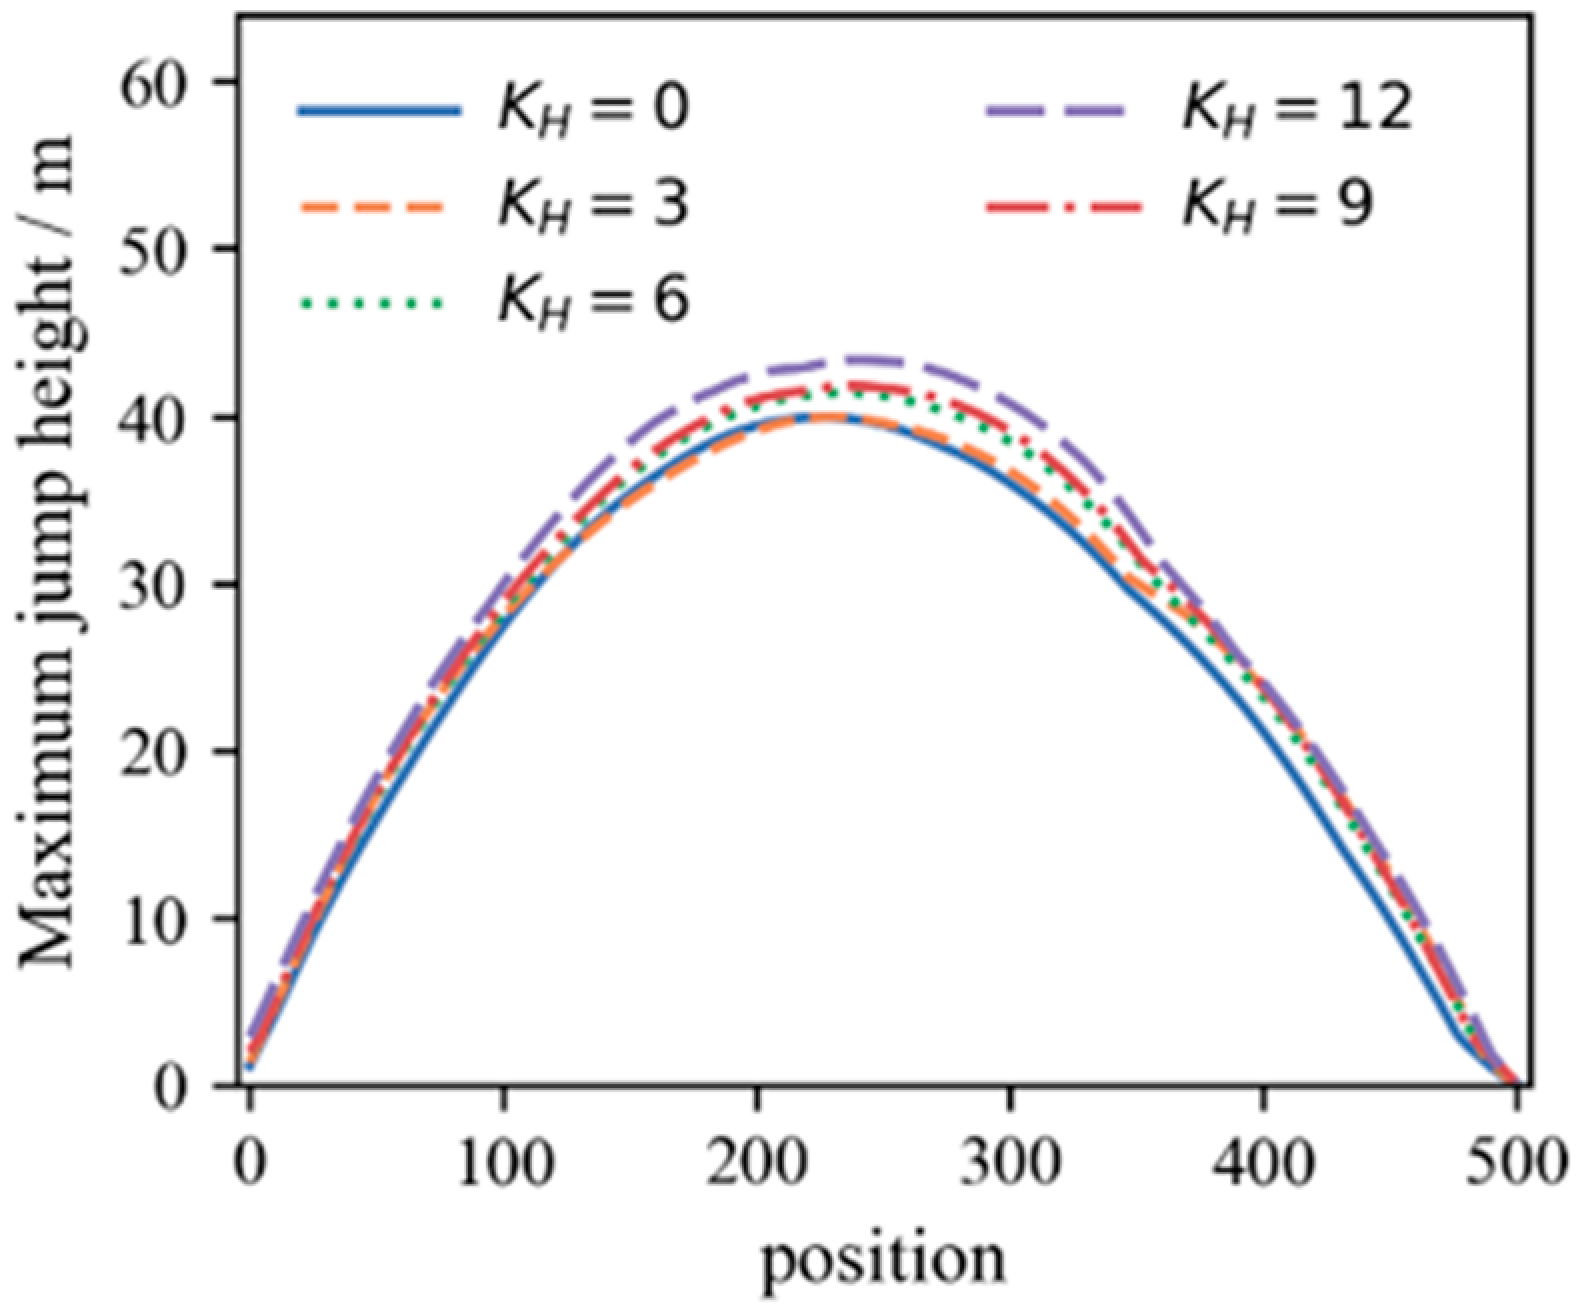
To verify the model under no-wind conditions with non-uniform ice accretion and shedding, the case from [24] is adopted. The reference system is a continuous five-span line (span lengths 300/300/500/300/300 m, 300 m elevation difference in the ice-shedding span, reference ice thickness h0 = 40 mm), with the non-uniform ice accretion coefficient KH characterizing the ice distribution across elevation differences. Both whole-span and partial-section ice-shedding cases are considered.
Figure 4 shows the envelopes of the maximum ice-shedding jump height under different KH values. The peak value of the envelope generally increases with increasing KH, indicating that the ice-shedding jump response is intensified by enhanced non-uniform ice accretion. In the present model, Hmax increases from 39.93 m at KH = 0 to 43.34 m at KH = 12, corresponding to an amplification factor of 1.085. This is close to the amplification factor of approximately 1.10 reported in [24], indicating that the proposed model can reasonably reproduce the influence of non-uniform ice accretion on the ice-shedding jump response.
Figure 4.
Maximum ice-shedding jump height envelopes under different KH values.
To further examine the peak position, Table 5 compares Pmax under different KH values. Pmax increases from 0.453 to 0.480 with KH while remaining near the mid-span, differing from the reference by at most 0.057 and confirming that the model reflects the peak position variation under non-uniform ice accretion.
Table 5.
Comparison of Pmax under non-uniform ice.
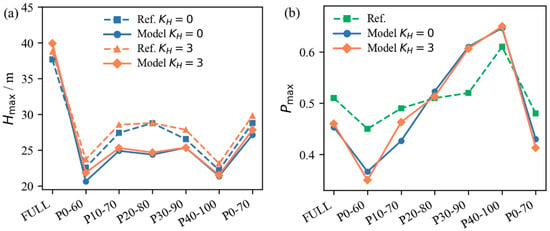
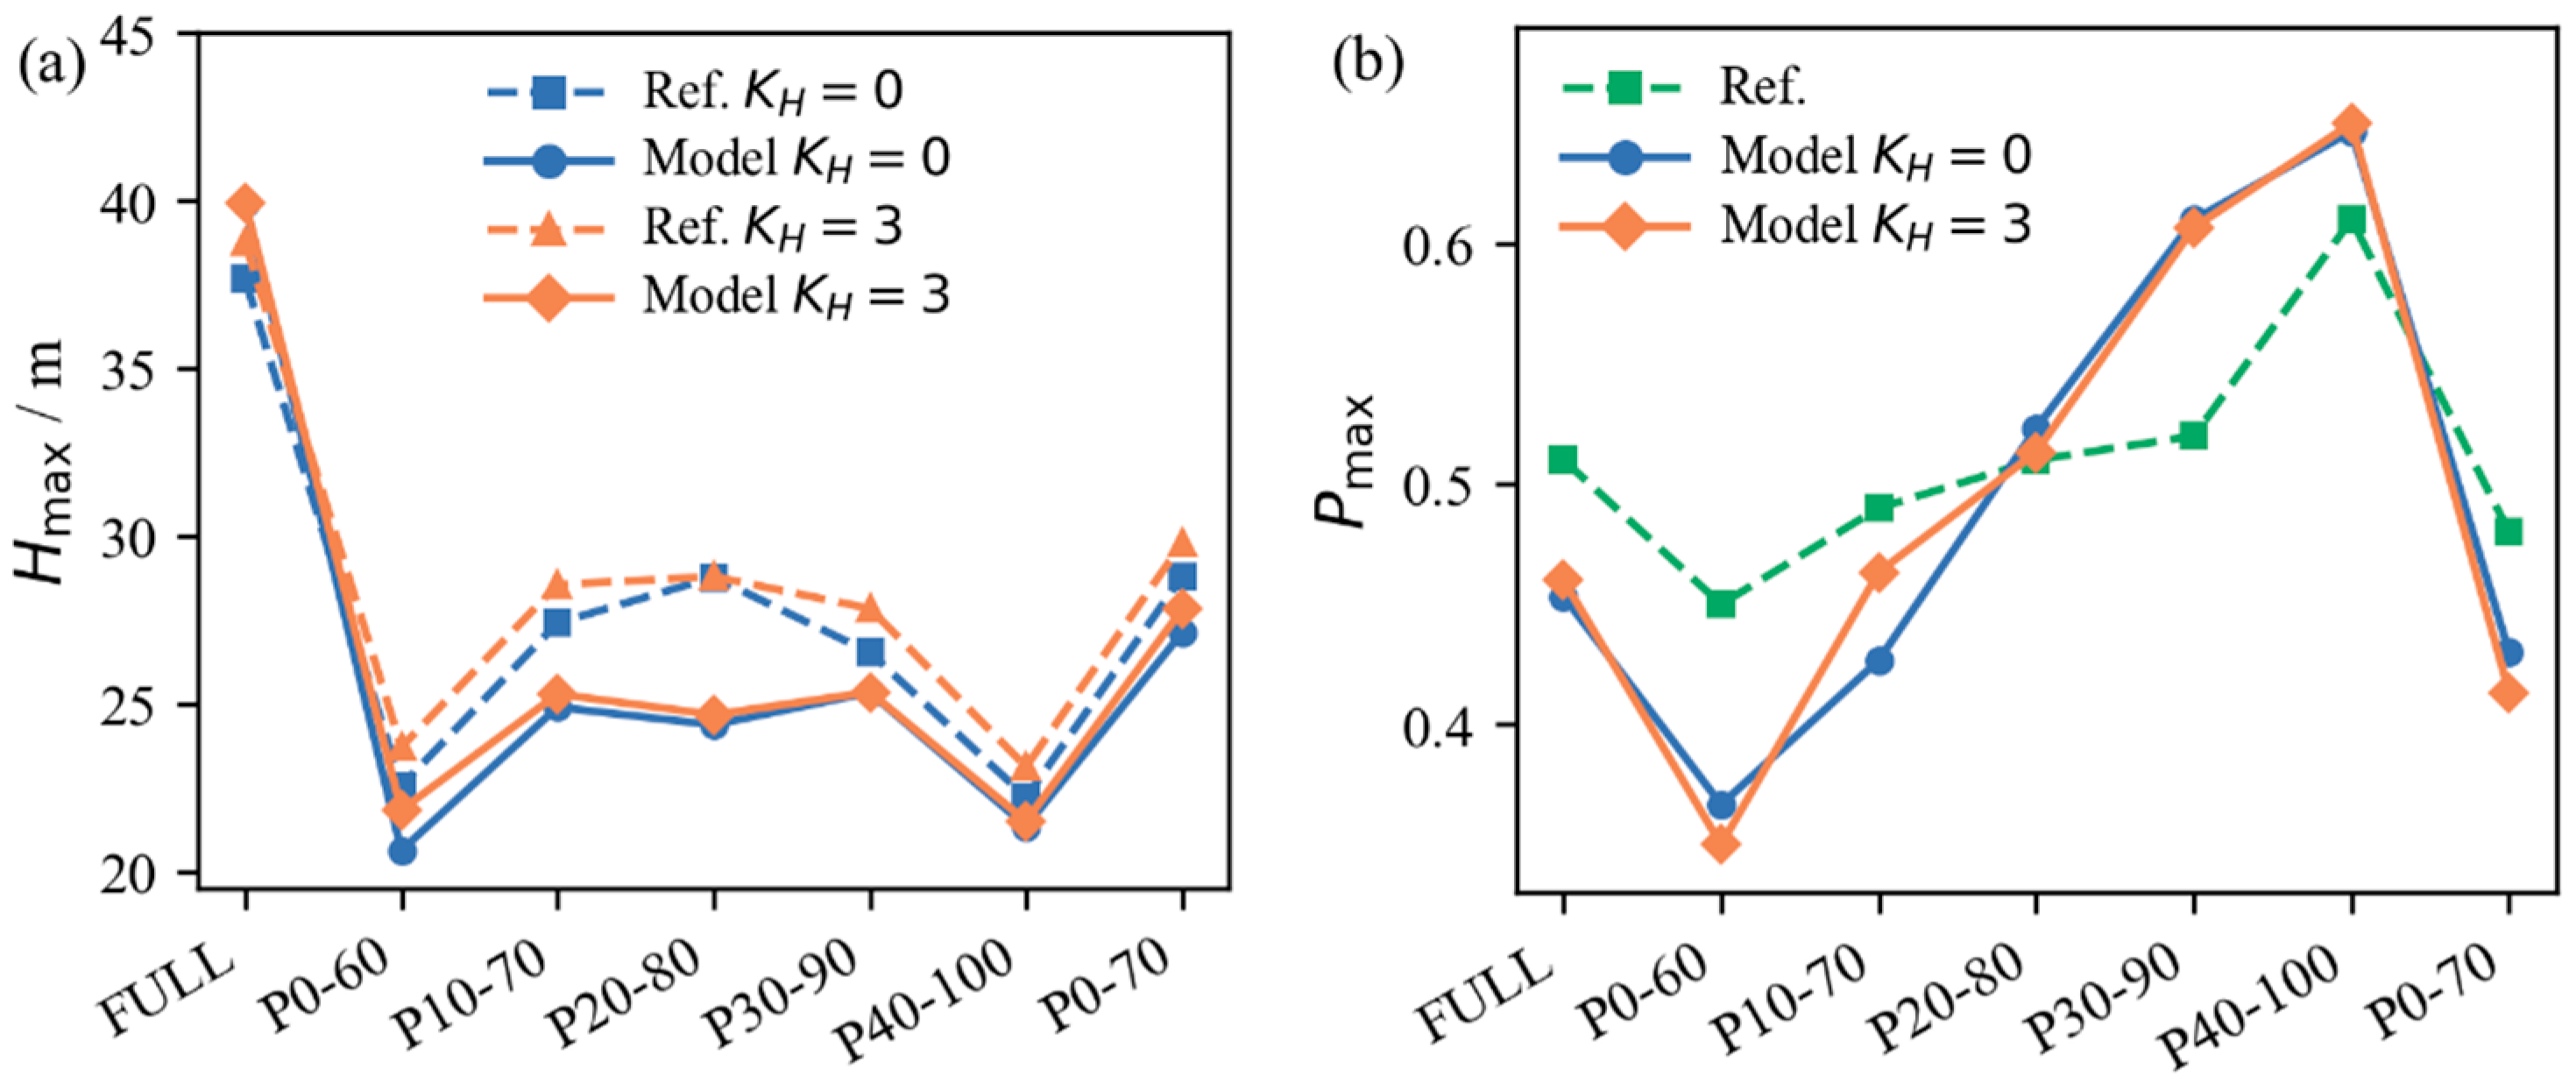
The model’s capability under non-uniform ice-shedding conditions is examined using partial-section shedding cases. As shown in Figure 5, Hmax reaches a relatively high level under whole-span shedding, whereas partial-section shedding significantly changes the peak position: as the shedding section extends from the high to the low suspension point, the peak shifts toward the low suspension point, consistent with [24]. Quantitatively, the mean absolute errors of Hmax are 7.59% and 8.44% for KH = 0 and 3, and those of Pmax are 0.056 and 0.053. A difference of 0.05 in Pmax corresponds to about 25 m in the 500 m shedding span, which is not negligible in absolute terms. However, the jump envelope is flat around its peak: at the reference Pmax location, the jump height predicted by the present model is 94.4–99.99% (98.0% on average) of the predicted Hmax, and the region where the jump exceeds 97% of Hmax extends over 57–108 m. Therefore, the difference in Pmax changes the jump height relevant to clearance checking by less than 6% (2% on average). The difference is mainly attributed to this flatness, which makes the peak location sensitive to modeling details such as treatment of the bundle, damping, and the relaxation procedure. Considering both Hmax and Pmax, the model reproduces the response to non-uniform ice shedding with reasonable accuracy for engineering purposes.
Figure 5.
Comparison results of Hmax and Pmax under non-uniform ice-shedding conditions: (a) Hmax; (b) Pmax.
3.3. Consistency Check Under Wind Loading
To examine the model’s capability to characterize ice–wind coupling during ice shedding, two consistency checks are conducted: a comparison of the response at representative attack angles with [19], and a comparison with the empirical formula of [19]. It should be emphasized that these comparisons are trend-level consistency checks against published results and an empirical formula; they do not constitute a direct experimental validation of the fully coupled ice–wind model, which remains to be performed (Section 5).
For the first check, the reference case is a four-span continuous line with span lengths 275/300/548/217 m and suspension point heights 36/45/45/45/36 m, a conductor diameter of 26.82 mm, ice thickness of 10 mm, incoming wind speed of 10 m/s, and middle-section ice shedding (M2). Three representative attack angles, namely α = 20°, 70°, and 130°, are selected, where 20° represents a low-response angle, 70° a transition angle, and 130° a high-response angle. The corresponding results are listed in Table 6.
Table 6.
Comparison of Hmax under wind load conditions.
When the wind speed is 10 m/s, the Hmax values at α = 20°, 70°, and 130° are 11.63 m, 11.54 m, and 12.10 m, respectively. Although the wind load slightly reduces the jump height in these three cases compared with the no-wind condition, the response at α = 130° is clearly higher than those at 20° and 70°. Specifically, Hmax at α = 130° is approximately 4.0% and 4.9% higher than those at α = 20° and 70°, respectively. Among the three representative angles, the highest response is obtained at 130°, consistent with the unfavorable angle reported in [19]. Here η stays below 1.0 at all three angles, so the wind slightly suppresses the jump throughout, with 130° showing the least suppression. This differs from the thicker ice case in Table 7, where η exceeds 1.0. The sign of the wind contribution thus depends on ice thickness and span configuration, while the unfavorable angle trend near 130° is reproduced in both.
Table 7.
Comparison of Hmax and η.
In the empirical approach, the reference jump height is first obtained from the no-wind formula and the maximum ice-shedding jump height under wind action is then calculated using the wind influence coefficient η [19]:
where η is mainly related to the ice thickness, incoming wind speed, and attack angle.
The empirical formula distinguishes dangerous from non-dangerous attack angle ranges [19]: for 100° ≤ α ≤ 150°, wind load significantly amplifies the ice-shedding jump, whereas elsewhere η ≈ 1.0. The consistency check therefore focuses on whether the proposed model identifies this unfavorable range and reproduces the same trend in the wind influence coefficient. Here the conductor diameter is 33.6 mm, ice thickness 20 mm, and wind speed 10 m/s, giving a no-wind of 0.3875 m. Note that this second check uses a different single-span case from the four-span case in Table 6, so absolute Hmax values differ in magnitude and are not directly comparable; the check here concerns only the trend of η with attack angle.
As shown in Table 7, η0 rises from 0.994 at α = 20° (close to the empirical 1.0 for the non-dangerous range) to 1.081 at 70° and 1.136 at 130°, indicating a clear amplification. Hmax stays at a relatively high level within 100–150°, peaking at about 0.4416 m with η0 = 1.140. The unfavorable attack angle range identified by the model is thus consistent in trend with the empirical formula of [19], which supports the use of the model for the comparative parametric analysis in Section 4.
4. Parameter Analysis
Based on the verified and partially validated numerical model (Section 3), a parameter analysis is conducted to investigate the effects of wind speed, attack angle, ice accretion pattern, and ice-shedding mode on the conductor’s ice-shedding jump response. The cases considered in this section are listed in Table 8; unless otherwise stated, δ = 0.25 and L = 300 m. Hmax and Pmax are adopted as the main response indices.
Table 8.
Case settings.
4.1. Effect of Wind Speed
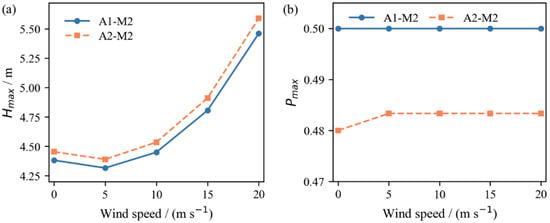
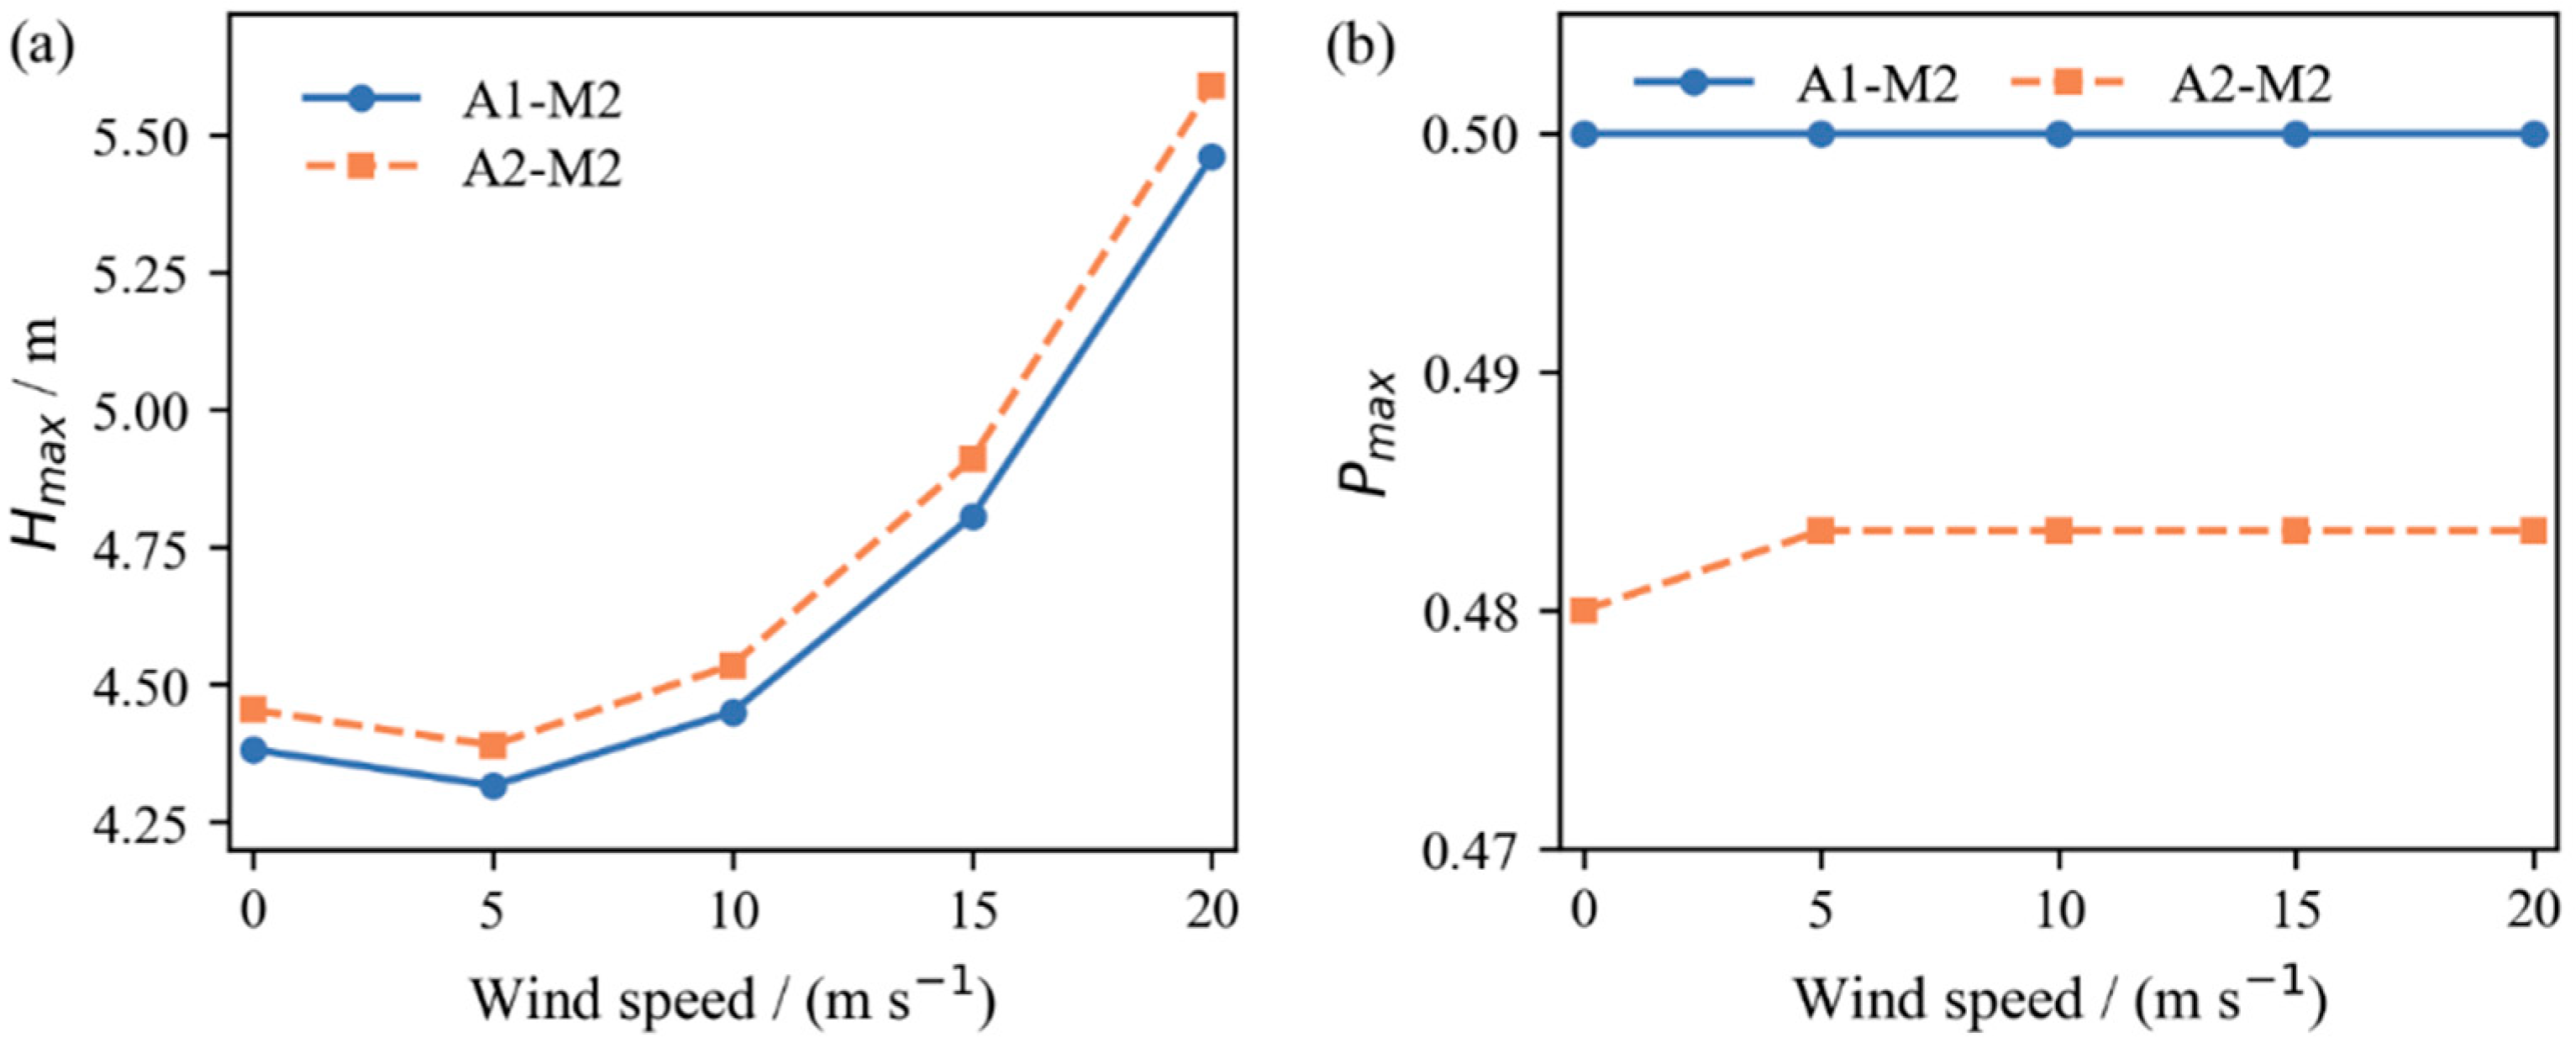
Figure 6 shows the influence of wind speed on Hmax and Pmax under M2. For both A1-M2 and A2-M2, Hmax follows a similar non-monotonic trend: it decreases slightly at low wind speed relative to the no-wind condition, then rises with clear amplification at high speeds, reaching about a 25% increase at U = 20 m/s.
Figure 6.
Effect of wind speed on Hmax and Pmax: (a) Hmax; (b) Pmax.
To clarify this behavior, the aerodynamic load acting on the shedding span was recorded during the response (Table 9). At α = 130°, the crescent-shaped iced section produces a downward (negative) lift, so that before shedding the span carries an additional downward aerodynamic load of 0.70 kN at U = 5 m/s and 10.8 kN at U = 20 m/s. After shedding, the shed section changes to the bare conductor profile and windward width, and the upward motion rotates the instantaneous attack angle at mid-span from 130° towards 150–180°; consequently, the downward aerodynamic load is reduced by 0.41 kN (U = 5 m/s) and 5.5 kN (U = 20 m/s) on average before the peak. This reduction acts as an additional sudden unloading superimposed on the release of the ice weight, and it scales with U2. At the same time, the vertical aerodynamic force does negative work on the upward motion in all cases, i.e., it resists the upward motion. At low wind speed, the unloading is small, and this resisting effect dominates, so Hmax decreases slightly; at high wind speed, the unloading dominates and Hmax increases.
Table 9.
Aerodynamic load on the shedding span and its work up to the time of the maximum mid-span jump (α = 130°).
By contrast, Pmax is much less sensitive to wind speed, remaining near the mid-span for all speeds under M2. Wind speed thus mainly changes the jump amplitude, while the peak location is controlled by the ice-shedding section; high wind speed should therefore be treated as an amplification factor for clearance checking rather than a factor controlling the most unfavorable spanwise location.
4.2. Effect of Attack Angle and Ice Accretion Pattern
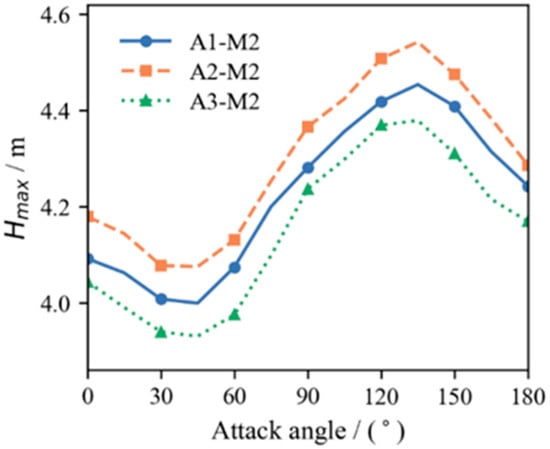
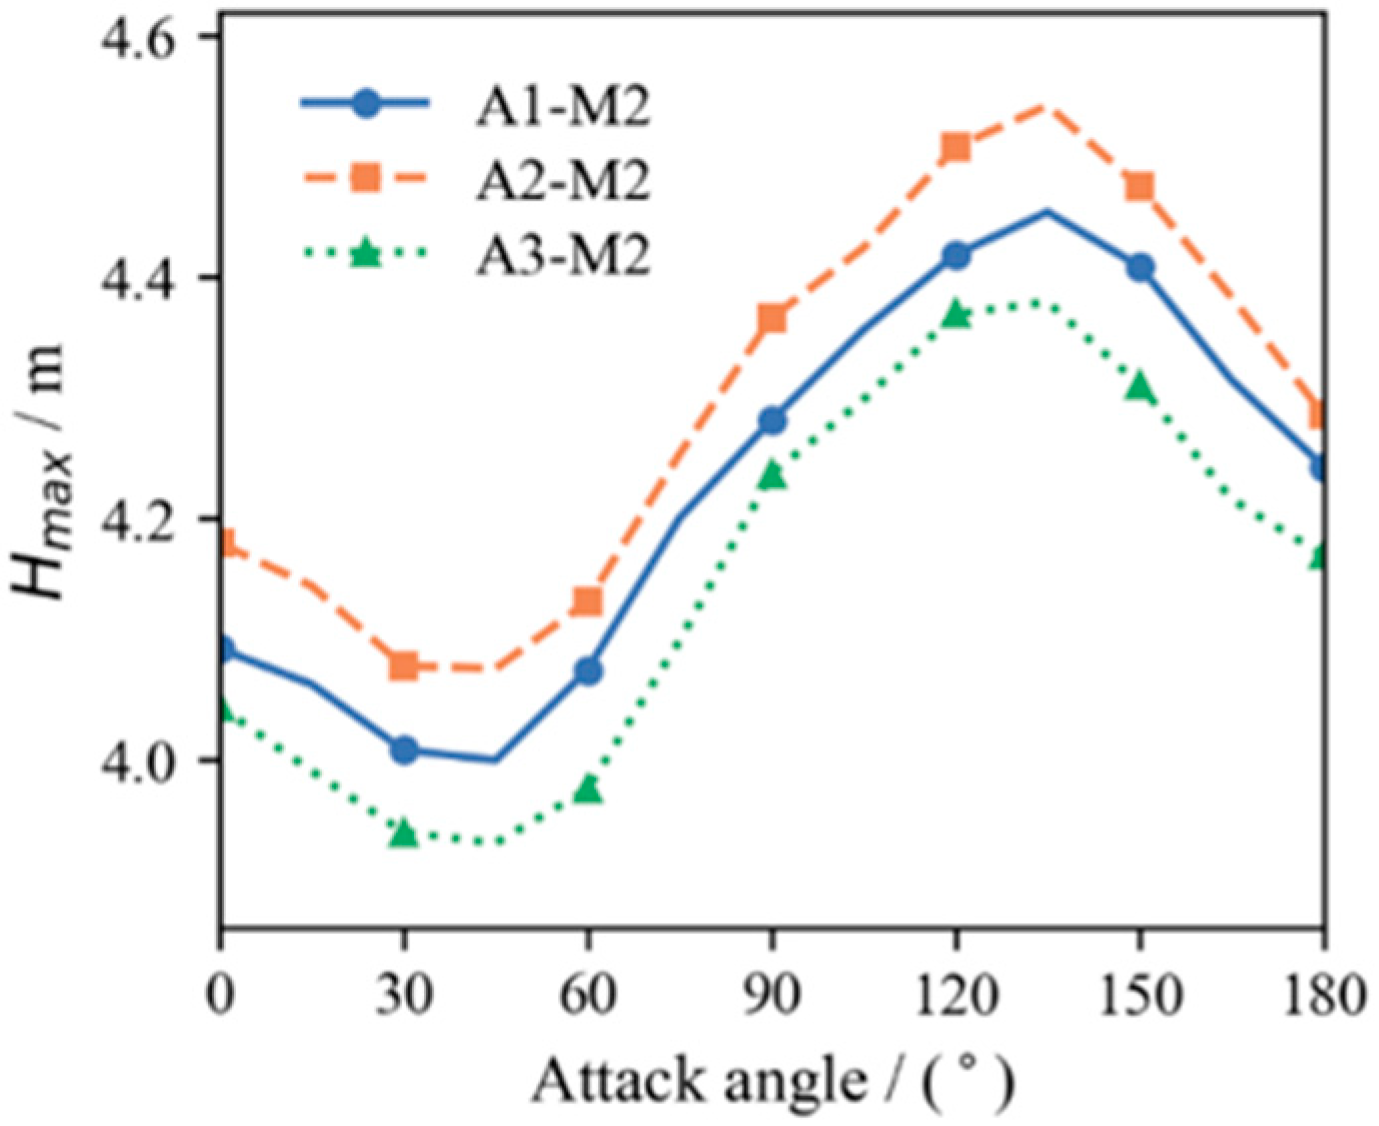
Figure 7 shows the variation in Hmax with attack angle under different ice accretion patterns. At U = 10 m/s and M2, the three cases A1-M2, A2-M2, and A3-M2 give similar Hmax–α curves: Hmax decreases gradually as α increases from 0° to about 45°, then rises again to a relatively high level near 135°. This trend arises from the redistribution of the lift and drag components in the vertical and lateral directions: as the attack angle changes, the resultant aerodynamic force changes direction and may either suppress or promote the upward jump. Around α = 45°, the vertical component contributes little to the jump, giving a smaller Hmax, whereas near the unfavorable range around 135°, it promotes an upward jump, increasing Hmax. This dependence is consistent with Lou et al. [19], who found from wind tunnel tests on crescent-shaped iced quad-bundled conductors that the wind effect on jump height is closely related to the attack angle, so that neglecting wind load underestimates the maximum jump height in certain ranges. The present model reproduces this trend for the uniformly iced case and further extends it to non-uniform ice accretion and shedding with real-time aerodynamic updating, not considered in [19].
Figure 7.
Variation in Hmax with attack angle under different cases.
Compared with the attack angle, the influence of the ice accretion pattern is relatively limited under M2 with δ = 0.25; stronger non-uniformity and other shedding modes are examined in Section 4.5. Among the three cases, A2-M2 generally gives a slightly larger Hmax, while A3-M2 gives a slightly smaller value. In addition, as shown in Table 10, Pmax remains nearly unchanged with varying attack angle and stays around the middle of the span, indicating that the peak position is still dominated by M2 rather than by the aerodynamic direction.
Table 10.
Comparison of responses under different α.
4.3. Effect of Ice-Shedding Mode
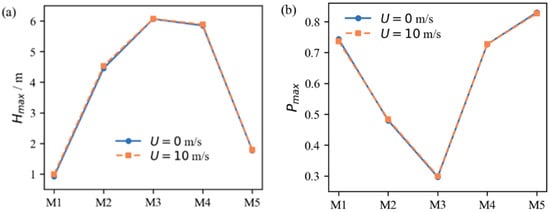
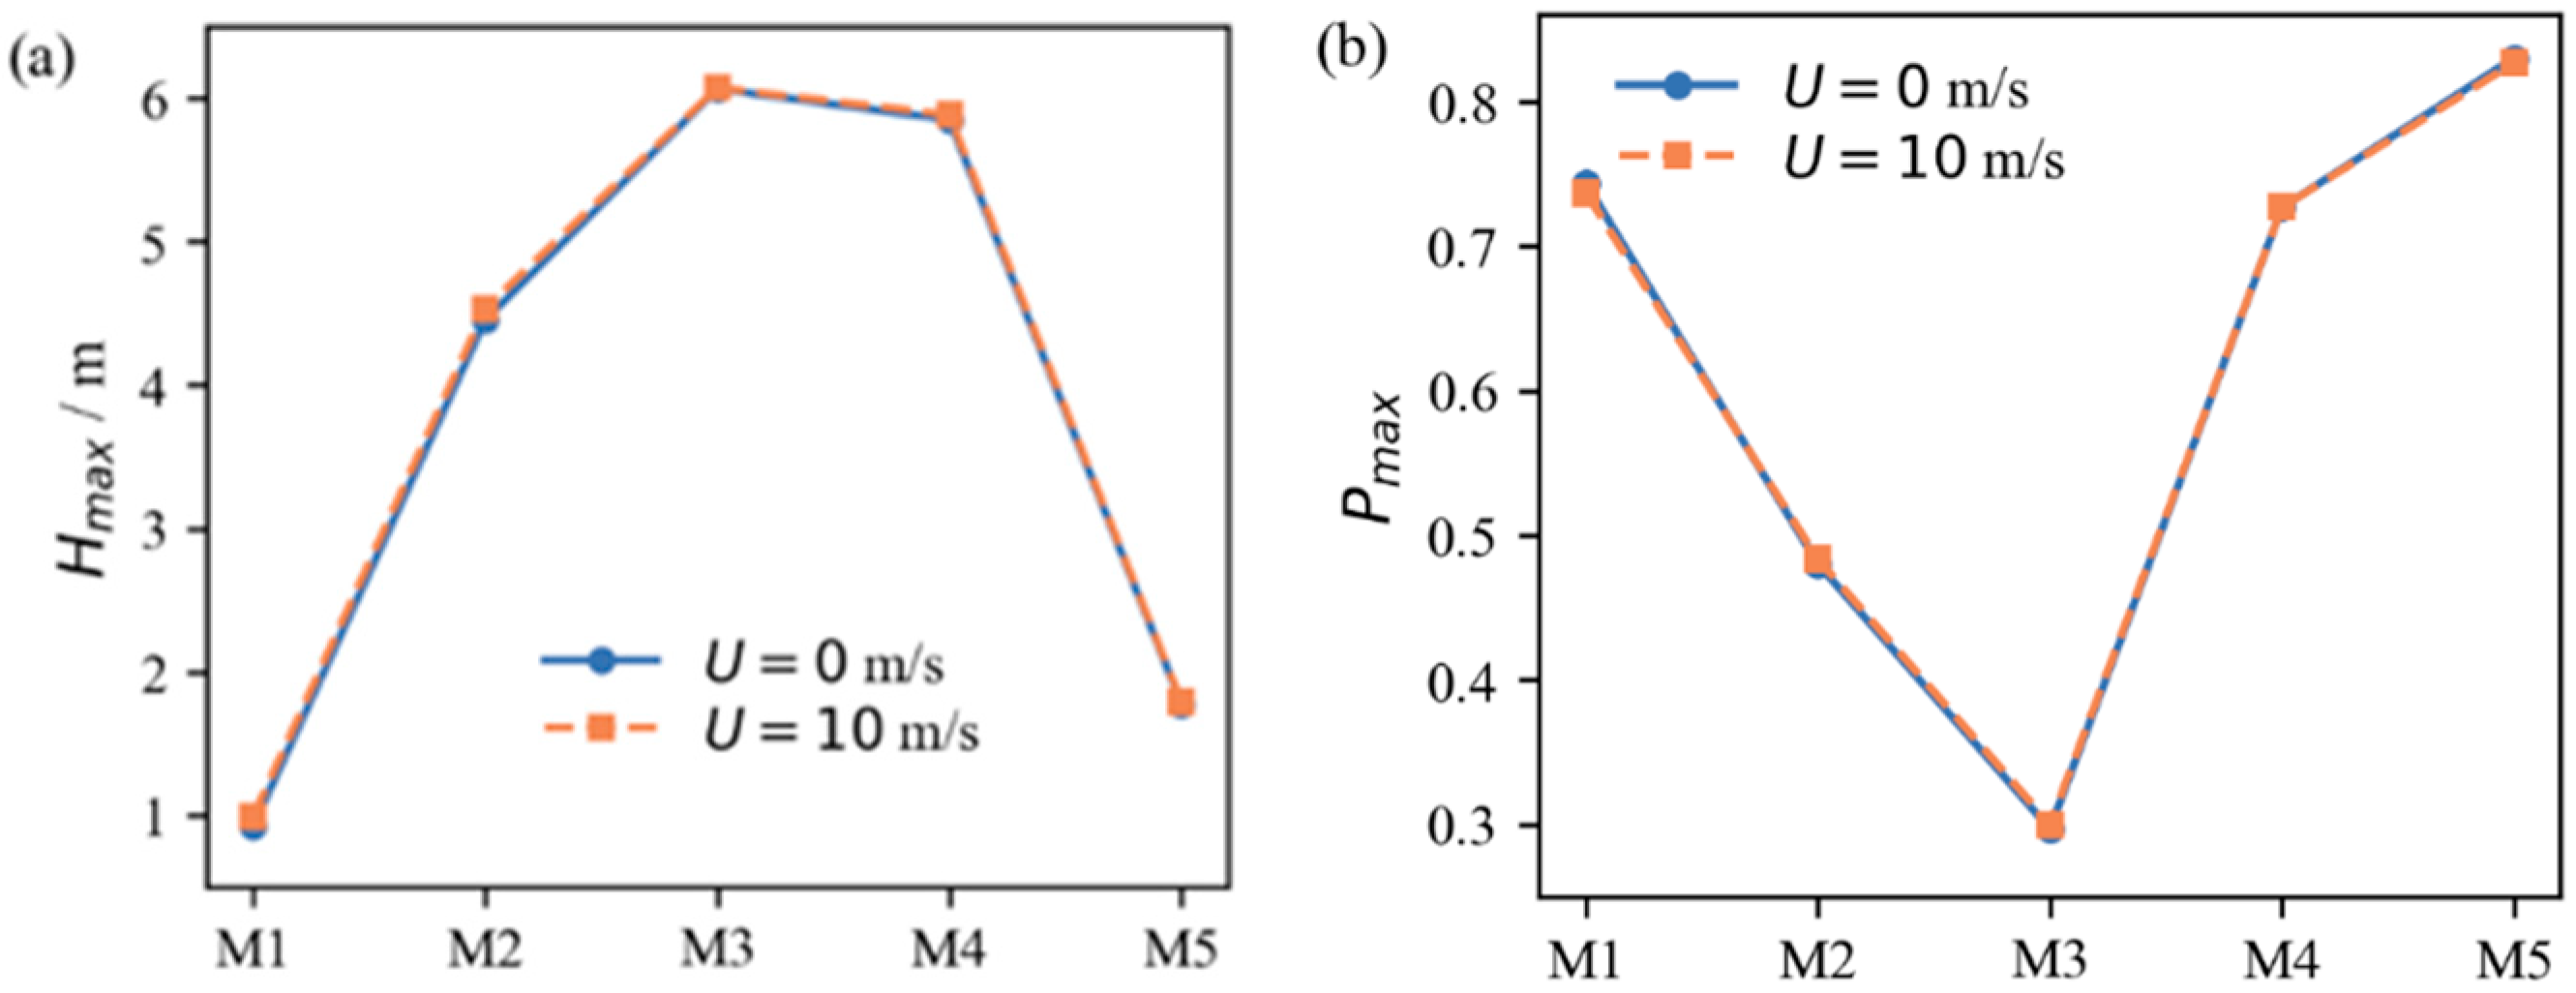
Figure 8 compares the effects of M1–M5 on Hmax and Pmax under A2. Ice-shedding mode has a much stronger influence on the response than the ice accretion pattern. Under the no-wind condition, M3 and M4 induce the most severe jump responses, with Hmax reaching about 6 m. M2 gives a secondary response level, whereas M1 and M5 result in much smaller jump heights.
Figure 8.
Comparison of Hmax and Pmax under different ice-shedding modes: (a) Hmax; (b) Pmax.
This difference is closely related to the spatial distribution of the released ice load. For M3 and M4, the strongly asymmetric release produces a large, unbalanced deformation and a more pronounced upward rebound. For M1, although the released ice mass is large, the release is relatively symmetric and the jump response is less concentrated, while for M5 the retained central iced section limits the upward motion and reduces Hmax.
As shown in Table 11, shedding mode also controls the peak position: Pmax shifts toward the high suspension point side under M3, toward the low suspension point side under M4 and M5, and remains near the mid-span under M2. The location and range of the ice-shedding section thus affect both the jump amplitude and the position of the most unfavorable response, suggesting that local asymmetric ice shedding should be treated as a more critical condition than whole-span shedding in clearance design. The implication for the phase-to-phase clearance is quantified in Section 4.7.
Table 11.
Comparison of responses under different ice-shedding modes (A2, α = 130°).
4.4. Effect of Wind Speed and Ice-Shedding Mode
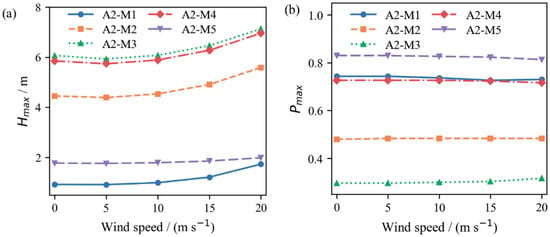
Figure 9 further compares the wind-speed response curves for A2-M1 and A2-M5 when α = 130°. The results show that the amplification effect of wind speed is strongly dependent on ice-shedding mode. The largest relative increase appears in A2-M1, where Hmax increases by approximately 88% as the wind speed increases from 0 to 20 m/s. However, this large percentage increase is partly due to the small no-wind reference value for A2-M1. In addition, under whole-span shedding, the entire span changes from the iced to the bare profile, so the reduction in the downward aerodynamic load reaches 10.4 kN at 20 m/s (Table 9), nearly twice that under middle-section shedding. In terms of absolute jump height, A2-M3 and A2-M4 remain more critical.
Figure 9.
Wind speed response curves of Hmax and Pmax under different ice-shedding modes: (a) Hmax; (b) Pmax.
For A2-M2 to A2-M5, Hmax generally decreases slightly at low wind speeds and then increases as wind speed further increases, consistent with the trend discussed in Section 4.1. The amplification effect is more evident for A2-M1 and A2-M2, while it is relatively weak for A2-M5. This demonstrates that wind load and ice-shedding mode are not independent factors. Instead, their coupling determines the final jump amplitude.
As shown in Figure 9, wind speed has only a limited influence on the peak position under different ice-shedding modes. The peak location remains mainly associated with the position of the ice-shedding section. Therefore, the coupling between wind load and ice-shedding mode primarily affects Hmax, whereas its effect on Pmax is relatively minor.
4.5. Influence of the Degree of Non-Uniform Ice Accretion
To examine whether stronger non-uniformity changes the conclusions, the degree of non-uniformity δ of A2 and A3 is increased from 0.25 to 0.50 and 0.75, while total ice mass is kept unchanged. The values of δ are chosen with reference to [24], where the non-uniform ice accretion coefficient KH = 3–12 corresponds to δ ≈ 0.11–0.45. Thus, δ = 0.25 represents a moderate non-uniformity, δ = 0.50 is comparable to the strongest case of [24], and δ = 0.75 serves as an upper bound for sensitivity analysis. Table 12 compares Hmax with that for uniform ice (A1) under the same shedding mode.
Table 12.
Hmax of non-uniform ice accretion relative to uniform ice (A1) under the same shedding mode.
The influence of the ice distribution depends strongly on shedding mode. Under whole-span shedding (M1), the uniform ice assumption gives the smallest jump (0.39 m) because the release is symmetric, whereas non-uniform accretion creates an unbalanced release and increases Hmax to 0.92–2.63 m, i.e., by a factor of 2.4–6.8; Pmax also moves from mid-span to about 0.71–0.74 for A2. Under middle-section shedding (M2), the effect grows from less than 2% (δ = 0.25) to 13–15% (δ = 0.75), and its sign depends on whether the shed section carries more (A2) or less (A3) ice than average. Under half-span shedding (M3/M4), which gives the largest jumps, Hmax changes by less than 10% for all distributions. The trends are essentially unchanged at U = 10 m/s. Therefore, neglecting the non-uniformity of ice accretion mainly leads to a severe underestimation of the response to whole-span shedding and to moderate errors for middle-section and two-side shedding, whereas the worst case (half-span shedding) is governed by shedding mode rather than by ice distribution.
4.6. Influence of Span Length
To examine how span length affects the results, A2-M2 is computed for L = 200, 300, 400, and 500 m with the same sag-to-span ratio (Table 13).
Table 13.
Effect of span length (A2-M2).
For a constant sag-to-span ratio, Hmax increases almost linearly with span length while Pmax remains unchanged; thus the conclusions drawn for the 300 m span can be scaled to other spans with the same sag ratio. The relative effect of a 10 m/s wind decreases with increasing span length.
4.7. Engineering Implication: Phase-to-Phase Clearance
To translate the jump response into an electrical safety criterion, a representative 500 kV vertical arrangement is considered following GB 50545-2010 [27]: the vertical distance between adjacent phases is Dv = 10.0 m, and the horizontal offset between upper and lower phases in ice areas is Dh = 1.75 m. The upper phase is assumed to remain in its iced static position, and the minimum clearance along the span is estimated as:
where H(x) and S(x) are the envelopes of the jump and the lateral swing (m), and 0.45 m accounts for the bundle height. Because the two envelopes are not necessarily reached at the same instant, this estimate is conservative. Cmin is compared with the minimum phase-to-phase gaps of 2.20 m for power frequency voltage and 4.60 m for switching overvoltage at mid-span specified in GB 50545-2010.
As shown in Table 14, all cases satisfy the power frequency requirement. However, half-span shedding (M3/M4) reduces the clearance to 3.51–4.47 m for all ice distributions, below the 4.60 m switching overvoltage requirement, whereas whole-span and two-side shedding keep the clearance above 7 m. A 10 m/s wind at 130° further reduces the clearance under half-span shedding by about 0.3 m through lateral swing. Non-uniform accretion changes the minimum clearance by up to 0.6 m under middle-section shedding and by up to 0.5 m under half-span shedding. Hence, a check based on uniform ice and whole-span shedding indicates a comfortable clearance, whereas the combination of non-uniform accretion and partial shedding approaches or violates the switching overvoltage requirement.
Table 14.
Minimum phase-to-phase clearance Cmin (m) for a 500 kV vertical arrangement.
Recomputing the borderline cases (|Cmin − 4.60 m| < 0.6 m) with dynamic damping of 0.02 and 0.20 s−1 changes Cmin by −0.25 to +0.29 m. Only one case (A2, δ = 0.75, M4, U = 0) changes classification, from 4.47 m to 4.74 m at 0.20 s−1. The other half-span cases remain below 4.60 m, and the middle-section cases remain above it, so the main conclusion is robust. Cases within about 0.3 m of the criterion should nevertheless be regarded as marginal.
5. Discussion
In this paper, a dynamic model for the ice-shedding jump of an iced quad-bundled conductor considering wind action was established, in which relative wind speed and attack angle are updated in real time from the nodal motion state. Considering that existing studies have treated wind load, non-uniform ice accretion, and non-uniform ice shedding largely in isolation, the model presented here has the potential for application in the coupled analysis of these factors. The attack angle dependence obtained by the model, with an unfavorable range near 100–150°, is consistent with the wind-tunnel-based results of Lou et al. [19], and the present work extends this behavior to non-uniform ice accretion and shedding.
The three factors examined are not of equal importance. Under middle-section shedding with δ = 0.25, changing the ice accretion pattern alters Hmax by less than 4%, whereas changing shedding mode from whole-span to half-span raises Hmax from 0.92 m to 6.06 m; wind load falls between these two, modifying Hmax by −9% to +25%. The influence of ice distribution is, however, much larger under whole-span shedding, where neglecting the non-uniformity underestimates Hmax by a factor of 2.4–6.8. Moreover, Pmax varies by at most 0.01 with wind speed and is unchanged with attack angle, indicating that wind governs only the jump amplitude while the shed section governs the location of the most unfavorable response. Since Pmax reaches 0.29 under M3, clearance verification and spacer placement should not be restricted to the mid-span, and local asymmetric shedding rather than whole-span shedding should be treated as the controlling condition. For a 500 kV vertical arrangement, this controlling condition reduces the phase-to-phase clearance below the switching overvoltage requirement of GB 50545-2010, although the power frequency requirement is still satisfied.
The present model has several limitations. (1) The four sub-conductors are represented by an equivalent single cable, so the spacers, the relative motion of the sub-conductors, and the torsion of the bundle are not modeled; the results therefore apply to quad-bundled conductors and should not be directly extended to single conductors. (2) The aerodynamic moment coefficient and the torsional degree of freedom are neglected, which restricts the model to the transient response after shedding and to ice thicknesses within the aerodynamic database; the results for U ≥ 15 m/s at α = 130° lie in the galloping-prone range of [25] and represent the transient jump only. (3) The aerodynamic coefficients for 20 mm ice are available at 10 m/s only and are assumed to be independent of the Reynolds number. (4) The incoming wind is uniform and steady; turbulence is not considered. (5) A single span with fixed ends is analyzed, so insulator string swing, coupling with adjacent spans, and the effect of dampers are not included. (6) Ice is assumed to shed instantaneously. (7) Most importantly, although the model has been verified numerically and checked against published results, a direct experimental validation of the coupled ice–wind response is still lacking, because field records of bundled conductors that simultaneously provide wind speed, wind direction, ice distribution, and jump height are still scarce, although field tests on single conductors have recently been reported [16,20].
It should also be noted that factors such as conductor temperature, which depends on the load current, mainly determine whether and when ice is shed [16], i.e., they determine shedding mode, which is an input of the present model, rather than a dynamic response after shedding. The conductor type enters the model through its axial rigidity, mass, and diameter, and Section 4.6 shows how the response scales with the span length.
6. Conclusions
In this paper, a dynamic model for the ice-shedding jump of an iced quad-bundled conductor considering wind action is established, and the effects of wind speed, attack angle, ice accretion pattern, and ice-shedding mode are investigated. The main conclusions are as follows:
- (1)
- The model converges with respect to mesh size and time step. It reproduces published no-wind results for non-uniform ice accretion and shedding with mean Hmax errors of 7.6–8.4% and Pmax differences of about 0.05, which lie on the flat part of the jump envelope, and it is consistent with wind-tunnel-based trends of the attack angle effect. A direct experimental validation of the coupled ice–wind response is still required.
- (2)
- Wind load has an obvious influence on the ice-shedding jump response. Under middle-section ice-shedding conditions, Hmax first decreases slightly and then increases significantly with increasing wind speed, because the sudden reduction in the downward aerodynamic load on the shed section grows with U2 and outweighs the aerodynamic damping of the vertical motion at high wind speed, while Pmax remains mainly controlled by the ice-shedding section.
- (3)
- The attack angle affects the response by changing the vertical and lateral components of aerodynamic forces. In the cases studied, Hmax reaches a relatively high level near 135°, indicating that unfavorable attack angles may amplify the ice-shedding jump response.
- (4)
- Ice-shedding mode is a key factor affecting both jump amplitude and peak location. Half-span ice-shedding induces more severe responses, and Pmax shifts with the position of the ice-shedding section.
- (5)
- The importance of non-uniform ice accretion depends on shedding mode. Under whole-span shedding, the uniform ice assumption underestimates Hmax by a factor of 2.4–6.8, whereas under half-span shedding, the most critical mode, Hmax changes by less than 10% for degrees of non-uniformity up to δ = 0.75.
- (6)
- For a 500 kV vertical arrangement designed according to GB 50545-2010, half-span shedding reduces the minimum phase-to-phase clearance to 3.5–4.5 m, which satisfies the power frequency requirement but not the switching overvoltage requirement; a lateral wind further reduces the clearance by about 0.3 m. Clearance checks should therefore consider partial, asymmetric shedding of non-uniformly iced conductors rather than only uniform ice and whole-span shedding.
Author Contributions
Conceptualization, investigation, F.Y. (Fang Yang); writing—original draft preparation, investigation, X.Z.; data curation, formal analysis, W.Z.; methodology, visualization, Y.Z. (Yabing Zhou); project administration and visualization, Y.Z. (Yongbin Zeng); funding acquisition and writing—review and editing, F.Y. (Fanghui Yin). All authors have read and agreed to the published version of the manuscript.
Funding
This research was funded by the Science and Technology Project of China Southern Power Grid Corporation (Project No. 031800KC24110013).
Data Availability Statement
All the data are included in the paper.
Conflicts of Interest
Authors Fang Yang, Yongbin Zeng and Yabing Zhou were employed by the Qingyuan Power Supply Bureau, China Southern Power Grid Corporation. The remaining authors declare that the research was conducted in the absence of any commercial or financial relationships that could be construed as a potential conflict of interest. The authors declare that this study received funding from the Science and Technology Project of China Southern Power Grid Corporation. The funder was not involved in the study design, collection, analysis, interpretation of data, the writing of this article or the decision to submit it for publication.
References
- Xu, J.; Yin, F.; Li, L.; Wen, Q.; Wang, H.; Liu, S.; Jia, Z.; Farzaneh, M. Wet snow flashover characteristics of 500-kV AC insulator strings with different arrangements. Appl. Sci. 2019, 9, 930. [Google Scholar] [CrossRef] [Scilit]
- Yin, F.; Farzaneh, M.; Jiang, X. Influence of AC electric field on conductor icing. IEEE Trans. Dielectr. Electr. Insul. 2016, 23, 2134–2144. [Google Scholar] [CrossRef] [Scilit]
- Morgan, V.T.; Swift, D.A. Jump height of overhead line conductors after the sudden release of ice loads. Proc. Inst. Electr. Eng. 1964, 111, 1736–1746. [Google Scholar] [CrossRef] [Scilit]
- Wu, C.; Yan, B.; Zhang, L.; Zhang, B.; Li, Q. A method to calculate jump height of iced transmission lines after ice-shedding. Cold Reg. Sci. Technol. 2016, 125, 40–47. [Google Scholar] [CrossRef] [Scilit]
- Wang, D.; Yan, B.; Huang, G.; Huang, X.; Li, M. Simplified formula for jump height of transmission lines after ice-shedding. J. Chongqing Univ. 2020, 43, 60–67. [Google Scholar]
- Fu, X.; Yan, Z.; Li, H.-N.; Li, H.; Zhu, D.-J. Theoretical solution of the maximum jump height for multi-span transmission lines after ice shedding. IEEE Trans. Power Deliv. 2025, 40, 2820–2831. [Google Scholar] [CrossRef] [Scilit]
- Jamaleddine, A.; McClure, G.; Rousselet, J.; Beauchemin, R. Simulation of ice-shedding on electrical transmission lines using ADINA. Comput. Struct. 1993, 47, 523–536. [Google Scholar] [CrossRef] [Scilit]
- Fekr, M.R.; McClure, G. Numerical modelling of the dynamic response of ice-shedding on electrical transmission lines. Atmos. Res. 1998, 46, 1–11. [Google Scholar] [CrossRef] [Scilit]
- Yan, B.; Chen, K.; Guo, Y.; Liang, M.; Yuan, Q. Numerical simulation study on jump height of iced transmission lines after ice shedding. IEEE Trans. Power Deliv. 2013, 28, 216–225. [Google Scholar] [CrossRef] [Scilit]
- Wu, K.; Yan, B.; Yang, H.; Liu, Q.; Lu, J.; Liang, M. Characteristics of multi-span transmission lines following ice-shedding. Cold Reg. Sci. Technol. 2024, 218, 104082. [Google Scholar] [CrossRef] [Scilit]
- Teng, Y.; Yan, B.; Zhou, X.; Yang, H.; Gao, Y.; Wu, K.; Deng, H. Response characteristic parameters of six-bundle conductor lines in ultra-heavy ice zones following ice-shedding. Cold Reg. Sci. Technol. 2025, 231, 104396. [Google Scholar] [CrossRef] [Scilit]
- Lv, Z.; Liu, X.; Zhang, B.; Tao, Y.; Li, F.; Li, Q.; Yan, B. Dynamic characteristic of conductor after ice-shedding and simulation analysis of the tension insulator string. IEEE Access 2022, 10, 118484–118497. [Google Scholar] [CrossRef] [Scilit]
- Huang, G.; Yan, B.; Guo, Y.; Zhang, B.; Wu, G. Experimental study on dynamic response characteristics of isolated span transmission lines after ice-shedding. High Volt. 2023, 8, 196–208. [Google Scholar] [CrossRef] [Scilit]
- Zhang, Y.; Guo, Y.; Lou, W.; Zhou, W.; Huang, M. Dynamic response of a transmission conductor following delayed ice shedding by reduced-scale model test. Cold Reg. Sci. Technol. 2024, 226, 104288. [Google Scholar] [CrossRef] [Scilit]
- Yan, B.; Zhou, X.; Zong, W.; Deng, H.; Li, J.; Hua, M.; Ma, X. Reduced-scale test method for dynamic responses of bundle conductor line following ice-shedding. IEEE Trans. Power Deliv. 2026, 41, 2584–2595. [Google Scholar] [CrossRef] [Scilit]
- Wang, L.; Yang, G.; Li, Y.; Jiang, X.; Han, X.; Zhong, J.; Xu, S.; Zhang, Z.; Hu, J.; Hu, Q. Study of jump height of transmission lines after ice-shedding: Simulation and natural experimental verification of inhibition by load current cycling transferred ice melting. IEEE Trans. Power Deliv. 2025, 40, 1769–1776. [Google Scholar] [CrossRef] [Scilit]
- Rossi, A.; Jubayer, C.; Koss, H.; Arriaga, D.; Hangan, H. Combined effects of wind and atmospheric icing on overhead transmission lines. J. Wind Eng. Ind. Aerodyn. 2020, 204, 104271. [Google Scholar] [CrossRef] [Scilit]
- Bi, W.; Tian, L.; Li, C.; Ma, Z.; Pan, H. Wind induced failure analysis of a transmission tower line system with long term measured data and orientation effect. Reliab. Eng. Syst. Saf. 2023, 229, 108875. [Google Scholar] [CrossRef] [Scilit]
- Lou, W.; Zhang, Y.; Xu, H.; Huang, M. Jump height of an iced transmission conductor considering joint action of ice-shedding and wind. Cold Reg. Sci. Technol. 2022, 199, 103576. [Google Scholar] [CrossRef] [Scilit]
- Yang, G.; Wang, L.; Jiang, X.; Zhang, Z.; Hu, J.; Li, Y. Study on the amplification factor of ice-shedding jump height of transmission lines under ice–wind coupling. High Volt. 2026. early view. [Google Scholar] [CrossRef] [Scilit]
- Liu, J.; Gan, G.; Liu, Z.; Liang, M.; Zhu, H.; Huang, G. Study on dynamic characteristics of transmission lines under non-uniform ice after ice-shedding. In The Proceedings of the 11th Frontier Academic Forum of Electrical Engineering (FAFEE2024); Springer Nature: Singapore, 2025; pp. 633–642. [Google Scholar]
- Dong, X.; Zhao, M.; Li, M.; Zhu, Y. Study on the bouncing process induced by ice shedding on overhead conductors under strong wind conditions. Appl. Sci. 2024, 14, 4285. [Google Scholar] [CrossRef] [Scilit]
- Chen, Y.; Cai, Y.; Xie, Q.; Wan, J.; Sun, Q. Combined effects of icing and wind on transmission lines in mountainous areas. J. Constr. Steel Res. 2024, 223, 109042. [Google Scholar] [CrossRef] [Scilit]
- Guo, Y.; Zhu, H.; Huang, G.; Gan, G.; Li, Z.; Wu, G. Dynamic response characteristics of non-uniform ice-shedding from conductors with non-uniform ice accretion on large height difference lines. J. Vib. Shock 2025, 44, 11–21. (In Chinese) [Google Scholar]
- Lu, J.; Wang, Q.; Wang, L.; Mei, H.; Yang, L.; Xu, X.; Li, L. Study on wind tunnel test and galloping of iced quad bundle conductor. Cold Reg. Sci. Technol. 2019, 160, 273–287. [Google Scholar] [CrossRef] [Scilit]
- Lilien, J.L. State of the Art of Conductor Galloping; Technical Brochure No. 322; CIGRE: Paris, France, 2007. [Google Scholar]
- GB 50545-2010; Code for Design of 110 kV~750 kV Overhead Transmission Line. China Planning Press: Beijing, China, 2010. (In Chinese)

Disclaimer/Publisher’s Note: The statements, opinions and data contained in all publications are solely those of the individual author(s) and contributor(s) and not of MDPI and/or the editor(s). MDPI and/or the editor(s) disclaim responsibility for any injury to people or property resulting from any ideas, methods, instructions or products referred to in the content. |
© 2026 by the authors. Licensee MDPI, Basel, Switzerland. This article is an open access article distributed under the terms and conditions of the Creative Commons Attribution (CC BY) license.