


Abstract
Cyberattacks such as DoS and DDoS can block or delay data communications in microgrid networks, thereby impairing the control of power electronic converters. These attacks motivate the measurement of heavy hitters and super-spreaders in microgrid network traffic. Both measurement tasks commonly rely on sketches, a class of probabilistic data structures. The two tasks nevertheless impose conflicting requirements: super-spreader detection ignores duplicate items in data stream statistics, while heavy hitter detection retains flows with many duplicate items. Consequently, an existing sketch-based scheme generally specializes in one task even though a data stream may contain both traffic classes. DualMeasure Sketch (DMS) is proposed to resolve this conflict. DMS distinguishes super-spreaders from heavy hitters dynamically and maintains them separately, allowing both to be detected accurately at the same time. CPU and OVS platform implementations are used for performance evaluation. Experimental comparison with the state-of-the-art sketches shows concurrent support for both tasks. On CAIDA19 with 1 MB memory, DMS improves super-spreader F1-score by up to 40% and reduces heavy-hitter error by up to 80% compared with dedicated state-of-the-art sketches. In joint deployment on CAIDA19 with 1 MB total memory, DMS improves throughput by about 12% over Combine Sketch.
1. Introduction
Microgrids are used to improve the reliability and resilience of electrical grids, facilitate the integration of distributed renewable resources, and provide electricity in areas not served by centralized infrastructure [1]. However, cyberattacks such as DoS and DDoS can block or delay data communications in microgrid networks, thereby impairing the control of power electronic converters [2].
These cybersecurity concerns motivate the measurement of heavy hitters and super-spreaders in microgrid network traffic. Heavy hitter detection isolates flows with abnormally high packet volumes, a capability that supports Denial of Service (DoS) attack detection [3]. Super-spreader detection identifies source addresses contacting numerous distinct destination addresses, therefore assists network administrators in recognizing Distributed Denial of Service (DDoS) attacks [4,5].
High accuracy, fast processing speed and small memory usage have made probabilistic data structures known as sketches common in approximate stream processing [6,7,8]. Many sketch-based schemes now address the two detection tasks. For heavy hitter detection, representative high-performing schemes are MV Sketch [9], Elastic Sketch [10], and Spacesaving [11]; accurate and efficient super-spreader detection is provided by Spread Sketch [12], Vector Bloom Filter [13], and FastSketch [14].
A single data stream may contain both super-spreaders and heavy hitters. For instance, the network nodes (e.g., end-host and switches) may simultaneously suffer from DoS and DDoS attacks (i.e., prone to be heavy hitters and super-spreaders) [15]. Sketch data structures, as a promising type of traffic measurement method, is often used for detecting heavy hitters and super-spreaders, which are statistical traffic features. These features though cannot by themselves determine whether a source is malicious but plays crucial role in assisting security analysis, such as DoS/DDoS investigation. However, accommodating both measurement objectives within one existing sketch-based scheme remains challenging. The key challenges are as follows:
Firstly, consider a network stream in which a source with high destination cardinality is treated as a super-spreader. Super-spreader measurement generally discards repeated source-destination pairs, for example through a Bloom filter, because only distinct destinations contribute to this cardinality. Heavy hitter detection instead identifies flows with large packet counts and therefore must retain repeated pairs. A sketch optimized for either task may consequently discard evidence required by the other. Running a dedicated sketch for each task avoids this conflict but increases switch memory consumption and computation overhead.
Secondly, real-world streams exhibit highly skewed and time-varying distributions of flow sizes and destination cardinalities [12,16]. Low-cardinality sources and small flows dominate the traffic, whereas super-spreaders and heavy hitters account for only a small fraction. Hash collisions introduced by numerous low-cardinality sources can bias super-spreader cardinality estimates and reduce detection accuracy. Similarly, numerous small flows also reduce heavy hitter detection accuracy.
To meet these challenges, this paper introduces a new sketch called DualMeasure Sketch (DMS), which can simultaneously detect super-spreaders and heavy hitters with high accuracy, throughput, and memory efficiency. DMS maintains the two traffic classes separately and distinguishes them dynamically during updates, thereby limiting interference from low-cardinality sources and small flows. Consequently, DMS performs both detection tasks while mitigating the effect of skewed traffic on measurement accuracy. The main contributions are listed below:
- We introduce DualMeasure Sketch (DMS), which stores super-spreaders and heavy hitters separately and supports both detection tasks without deploying a dedicated sketch for each.
- We design update algorithms that distinguish super-spreaders from heavy hitters while suppressing interference from low-cardinality sources and small flows. This mechanism enables accurate detection of both traffic classes with limited memory.
- We analyze DMS theoretically with respect to space complexity, update time complexity, the probability of hash collisions and error bounds.
- We implement DMS on CPU and OVS platform, where detection accuracy and throughput are evaluated. The resulting system performs both tasks and, relative to state-of-the-art dedicated sketch-based schemes, improves F1-score by 10% for heavy hitter detection and 22% for super-spreader detection while raising throughput by more than 50%.
The paper proceeds with the problem definitions and related work in Section 2. Section 3 then describes the DMS design, and Section 4 establishes its theoretical properties. Section 5 presents the performance evaluation and discussion; DMS performance in OVS platform is examined separately in Section 6. Section 7 closes with conclusions and future work.
2. Backgrounds and Related Works
Formal definitions of the considered problems are given first, followed by a survey of existing super-spreader and heavy hitter detection schemes.
2.1. Problem Statement
Data Stream: An ordered sequence of N items defines data stream S, where N is the total item count and the same item may appear repeatedly in S. A flow comprises every item sharing an identical value. Each item is written as , where the flow label is x and the element is y. When the stream carries packets, one packet forms an item, with its source address mapped to x and destination address mapped to y.
Super-Spreaders Detection: The connection associated with flow label x equals the count of distinct elements y paired with x. If that count exceeds , x is classified as a super-spreader, where denotes a predefined threshold.
Heavy Hitters Detection: For an item , classification as a heavy hitter occurs when the stream frequency is greater than ; is defined in advance.
2.2. Super-Spreader Detection
Sketch-based super-spreader detectors combine measurement accuracy with high throughput and low memory consumption. Representative designs include Fast Sketch (FAST) [14], Vector Bloom Filter (VBF) [13], Open Sketch (OPEN) [17], Count Degree Sketch (CDS) [18], The Random Aging Streaming Filters (RASF) [19], Spread Sketch (SS) [12], Super kJoin Sketch (SKS) [20], Extended Sketch (ES) [16]. FAST formulates super-spreader detection as channel coding and compresses the encoded flow labels of candidate super-spreaders. VBF partitions each flow label into eight components and accelerates updates with bit-extraction hash functions. OPEN couples CM sketch with a bitmap to improve super-spreader detection accuracy. CDS maps super-spreaders with hash functions derived from the Chinese Remainder Theorem (CRT) and reconstructs their flow labels through CRT. RASF randomly initialize columns when a block is nearly full [19], allowing super hosts to be identified without excessive memory use, though with reduced accuracy. SS estimates flow label connections from binary hash strings and gives retention priority to labels with high element cardinality. SS is proposed for network-wide super-spreader detection. The structure consumes considerable memory resources because each block needs to maintain a counter. The concept of generalized sketch families for network traffic measurement offers a flexible framework for analyzing traffic patterns, but requires further optimization for anomaly detection in super host scenarios [21]. Based on this, SKS was proposed for flow spread estimation, offering improved accuracy and efficiency for cardinality estimation. ES expands its structure as flow label connections increase, allowing the sketch size to adapt dynamically.
2.3. Heavy Hitter Detection
Accurate heavy hitter detection can likewise be achieved with sketches. The relevant methods considered here are Count-min Sketch with a min-heap (CMH) [22], UnivMon (UM) [23], Spacesaving [11], HashPipe (HP) [24], Elastic Sketch (ES) [10], MV Sketch (MV) [9], Pyramid Sketch (PS) [25], Bloom Sketch (BS) [26], Diamond Sketch (DS) [27], One Sketch (OS) [28], Funnel Sketch (FS) [29]. CMH combines Count-min Sketch for flow-size estimation with a min-heap that retains heavy hitters, thereby improving detection accuracy. UM partitions the input through universal sampling and uses multiple sketches to track heavy hitters in the resulting sub-streams. Within a fixed-size structure, Spacesaving associates estimators with candidate heavy hitters and applies adaptive replacement to remove infrequent items, thereby maintaining detection accuracy. HP uses a two-stage update mechanism to retain heavy hitters within the pipeline and improve heavy-hitter detection accuracy. ES places heavy hitters and infrequent items in separate structures, reducing interference from infrequent items during detection. High accuracy and throughput are obtained in MV Sketch by tracking heavy hitters with the Boyer–Moore majority vote algorithm (MJRTY). PS sets two flag bits in the parent counter to record the overflow information of the left or right child counter. BS consists of L counter array and L-1 bloom filter. Each counter array stores a portion of flow size. DS is composed of three parts, which are increment part, carry part and deletion part. Increment part contains multiple layers for recording flows with different sizes, carry part records the depth of overflow, and deletion part supports the delete operation. OS replaces the CM in ES with TowerCU and modifies the replacement strategy, thereby improving the measurement accuracy. FS utilizes a funnel-shaped architecture to enable fine grained classification of elephant and mouse flows.
2.4. Summary
Existing sketch-based schemes perform well, but each is designed for only one of the two detection tasks. Because a stream may contain both super-spreaders and heavy hitters, a single existing sketch cannot readily cover both cases, as discussed in Section 1. Running separate sketches for the two tasks incurs additional memory and computation overhead.
DMS addresses this limitation by dynamically separating the two traffic classes and maintaining them independently. The resulting structure supports accurate joint detection of super-spreaders and heavy hitters under a small memory budget.
3. DualMeasure Sketch Design
The presentation begins with the DMS design goals and data structure, then turns to the update and query operations. Table 1 summarizes the principal notation for the subsequent discussion.
Table 1.
Notation in this paper.
DMS aims for the following design goals:
- Dual detection: A single DMS instance performs both super-spreader and heavy hitter detection, eliminating separate dedicated sketches.
- High detection accuracy: DMS preserves accurate estimates for both super-spreaders and heavy hitters.
- Fast processing speed: DMS limits hash computation and memory accesses to process incoming items efficiently.
- Small and static memory usage: A compact static structure avoids the management overhead associated with dynamic memory allocation.
3.1. Data Structure
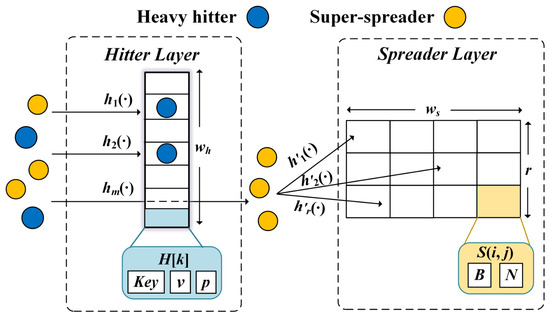
Figure 1 depicts the two components of the DMS data structure: a hitter layer and a spreader layer. A total of buckets form the hitter layer. For , bucket k is represented by , and three fields are carried by : (1) the candidate heavy hitter flow ID in ; (2) , representing the candidate heavy hitter size; and (3) for that candidate’s eviction weight. Pairwise independence is required among the m hash functions used by hitter layer, with .
Figure 1.
The data structure of DualMeasure Sketch.
The spreader layer contains r rows, each comprising buckets. Bucket occupies column j of row i, with and . Every bucket provides the following two fields: (1) serves as the flow label connections bitmap. The value corresponds to bit t in , with ; (2) , a size counter for heavy hitters involved in hash collisions in hitter layer. The spreader layer additionally uses r pairwise-independent hash functions , indexed by .
3.2. Basic Operation
Two operations define DMS behavior: (1) an incoming item is incorporated through Update; and (2) at epoch completion, Query returns the estimated super-spreaders and heavy hitters.
Update Operation: The processing steps for a DMS update are specified in Algorithm 1. Every counter begins an epoch at 0. For an incoming item , the hash functions map it to m buckets in hitter layer, and each is examined sequentially, where , . The subsequent action depends on one of three cases.
Case 1: and . This match indicates that contains item e; the update therefore adds 1 to (Line 1–9).
Case 2: . An available empty bucket receives e in , followed by an addition of 1 to (Line 10–16).
Case 3: and . Here, e collides in every mapped bucket . DMS identifies the minimum counter value among the m mapped entries and increments the associated with the smallest (Line 17–26). The replacement strategy in Algorithm 2 prioritizes retaining heavy hitters in hitter layer to preserve detection accuracy.
| Algorithm 1 Update Procedure |
|
- Replacement Strategy Design: Three conditions govern the replacement strategy.
Case 1: If ( is a predefined threshold), DMS first hashes e into spreader layer and obtains the minimum value among the r mapped , where , . Suppose the bucket with stores , then set the bucket to and evict item to spreader layer: increment the mapped r by (Line 1–11).
Case 2: If , DMS hashes e into r buckets in spreader layer by , where . Then, each bitmap maps e into by . In this case, for the bucket where , is increased by 1, and set the mapped bit 0 in other to 1 (Line 12–18).
Case 3: If and all the mapped are 1, DMS compares and . If , the bucket storing is set to and all in mapped are set to 0 (Line 19–27).
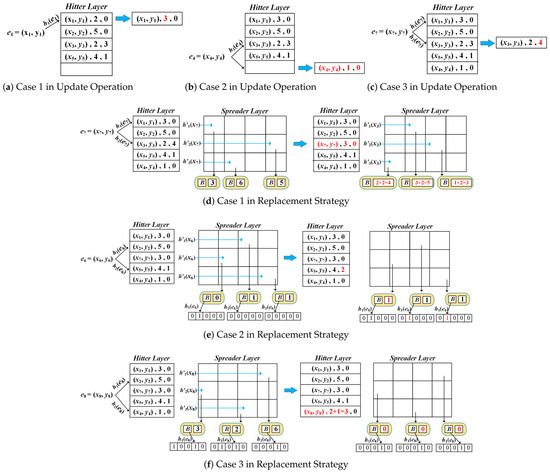
Every update and replacement case is visualized in Figure 2. The associated example fixes = 2, m = 2, 3, 5 and 4.
| Algorithm 2 Replace Procedure |
|
Figure 2.
The update operation and replacement strategy of DMS.
Case 1: Figure 2a depicts the arrival of . Within hitter layer, matches , leading to an addition of 1 to .
Case 2: In Figure 2b, item matches neither nor . Because is empty, is inserted into .
Case 3: In Figure 2c, the arriving item is absent from and , and neither bucket is empty. The minimum is obtained from , after which is incremented by 1. After that, DMS implements the replacement strategy.
- Examples of Replacement Strategy:
Case 1: As shown in Figure 2d, at this moment, . DMS inserts into , and , obtains , and replaces with . Then hash the item into spreader layer and increase , and by .
Case 2: The arrival of item is depicted in Figure 2e, . DMS hashes into , and and each bucket independently update its bitmap: , then set it to 1; , then increase by 1; , then set it to 1.
Case 3: The arrival of item appears in Figure 2f, all mapped bits in bitmap are 1 and , then set the bucket to and set , and to 0.
Query Operation:DMS provides separate query procedures for super-spreaders and heavy hitters.
- Super-spreader Query: Algorithm 3 gives the super-spreader query procedure. At epoch end, assigns flow label x to r spreader-layer buckets , where . Linear counting estimates the connections recorded by every [30], and the smallest estimate is selected. Flow label x is reported as a super-spreader when this value is greater than , with M denoting the total item count and a predefined threshold.
- Heavy hitter Query: Algorithm 4 defines this query procedure. Once an epoch finishes, every hitter-layer bucket is scanned. An item is reported when the examined is greater than ; the comparison uses the item total M and predefined threshold , while the corresponding supplies the estimated size.
| Algorithm 3 Super-spreaders Query Procedure |
|
| Algorithm 4 Heavy Hitters Query Procedure |
|
4. Theoretical Analysis
The analysis covers four properties: storage complexity, update/query time, hitter layer hash collisions, and the estimation-error bounds for flow label connections.
4.1. Space Complexity and Time Complexity
For the DMS hitter layer, specifies how many buckets are available and m specifies how many hash functions are used. In the spreader layer, r gives the row count, gives the column count, and every bucket contains the n-bit bitmap .
Theorem 1.
The space complexity of DMS is .
Proof.
Every hitter-layer bucket allocates one -bit candidate heavy hitter together with two counters; all such buckets therefore occupy space. A spreader-layer bucket instead contains the n-bit bitmap and one counter, giving space over that layer. Combining the layers yields the DMS bound . □
Theorem 2.
Processing an item has update time complexity . Heavy hitter and super-spreader queries require and time, respectively.
Proof.
Updating one item requires at most hash operations (i.e., m hash operations in hitter layer and r hash operations in spreader layer). A heavy hitter query scans all buckets in hitter layer, resulting in time. A super-spreader query performs r hash operations to obtain flow label connections from spreader layer, and therefore requires time. □
4.2. Heavy Hitter Collision Rate in Hitter Layer
Consider an epoch containing H heavy hitters in the data stream.
Theorem 3.
The probability that no hash conflicts occur between all heavy hitters of hitter layer is:
Proof.
Each hash function is assumed to map every heavy hitter independently and uniformly across the buckets. Consequently, an item is assigned to any particular bucket with probability . Each heavy hitter consequently has possible bucket combinations. With , the H frequent items admit assignments, of which are collision-free, therefore, the probability of no hash collision is:
When the hitter-layer bucket count is much larger than the heavy hitter count H, so that , the no-collision probability admits the approximation:
taking the logarithm yields:
Applying for , which holds here when , gives:
The remaining finite sum is:
Substituting this sum into Formula (3) yields the following no-collision probability for the heavy hitters in hitter layer:
□
4.3. Error Bounds of Connection Estimation in Spreader Layer
Consider one fixed flow. Its actual connection value is c, whereas is the final estimate. The r mapped buckets individually produce ; the approximation parameter is , and the sketch error probability is .
Theorem 4.
For any flow label, the estimated connection value satisfies the condition with a probability of at least :
Proof.
Let the bitmap length n be sufficiently large. In a bucket bitmap, describes the probability of an unoccupied position; its binomial distribution has the expectation and variance below:
This distribution gives the following expectation and relative bias for :
The corresponding variance of is:
where .
A normal approximation bounds the tail probability as follows:
where .
The per-bucket connection estimates are independent and identically distributed. Because their minimum has an asymmetric error distribution, the two tails satisfy:
The sum of these tail bounds provides the overall error probability:
When t is less than 0.1, , substitute K and simplify the expression:
setting allows us to solve for , which gives . Therefore, it can be concluded that:
□
The analysis provides conservative upper bounds on the estimation error under hash collisions. The collision probability in Theorem 3 is the probability that all heavy-hitter hash placements are collision-free. Algorithms 1 and 2 explicitly handle collisions and perform replacement, which further reduce the actual error. Therefore, the derived bounds are interpreted as worst-case bounds, and the actual error is expected to be lower.
5. Experimental Results
This section reports measurements obtained from real-world data streams. Even when memory is limited, DMS attains higher accuracy in super-spreader and heavy hitter detection than state-of-the-art sketch-based schemes.
5.1. Experimental Setup
Testbed:Experiments run under Ubuntu 18.04.6 LTS on a workstation containing 64 GB RAM and an Intel (R) Core (TM) i9-10920X CPU clocked at 3.50 GHz.
Datasets:CAIDA16, CAIDA18, and CAIDA19 [31] serve as the evaluation datasets. CAIDA captured them on 10 GigE backbone links in 2016, 2018, and 2019, respectively; CAIDA19 has the greatest skewness, whereas CAIDA16 has the least. CAIDA traces are highly skewed, and contain mixed small/low-cardinality flows and a few heavy hitters and super-spreaders, similar to microgrid traffic. Since no public microgrid dataset is available, CAIDA traces serve as representative datasets. Each dataset contains 60 one-second intervals. For each experiment, 10 intervals were randomly selected, and this random selection was independently repeated three times. The reported results are the average over the three independent repetitions.
Metrics:Performance is quantified using the following metrics.
- Precision Rate (PR): Among all reported super-spreaders/heavy hitters , the share corresponding to correct detections , namely
- Recall Rate (RR): Correct detections expressed as a fraction of all actual super-spreaders/heavy hitters , namely
- F1-score: One measure formed by taking the harmonic mean of Precision and Recall,
- Average Relative Error (ARE): The mean of the relative errors separating estimated flow label connections/item sizes from the actual quantities:Here, n counts the flow labels/items, is the estimated flow label connections/item size, and is its actual counterpart.
- Throughput: The number of incoming items processed each second (Mpps).
Measurement Tasks:DMS versatility is assessed through two tasks on the datasets described above.
- Super-spreader Detection: For total item count M and threshold , an epoch-end flow label is classified as a super-spreader if its estimated connections are greater than . The baselines used to evaluate DMS on this task are OPEN, Fast, CDS, VBF, and SS.
- Heavy hitter Detection: Classification occurs at epoch completion: an estimated item size above identifies a heavy hitter, with serving as the threshold. For this task, the baselines for DMS performance are Spacesaving, MV, UM, HP, and CMH.
Methodology:Every evaluated scheme shares a C++ implementation basis. The DMS configuration sets m = 2, r = 3, and n = 284 bits for the bitmap, while allocating as one-half of .
Following the parameter recommendations in the original papers, OPEN uses 3, 1, and 5 hash functions for Count-min Sketch, bitmap, and reversible Sketch, respectively, with a 98-bit bitmap. SS uses a 438-bit bitmap and 4 rows. UM is configured with 14 levels, CMH with a heap capacity of 4096, MV with 4 rows, and HP with 6 table stages. A source-destination address pair constitutes one item. The super-spreader and heavy hitter thresholds and are 0.01% and 0.05%, respectively. All schemes use BoBhash [32] as their hash function.
5.2. Results
The parameters and are selected through experiments on CAIDA19. CAIDA16 and CAIDA18 then serve as independent test sets. The parameter was selected based on a trade-off between the performance of super-spreader and heavy hitter detection.
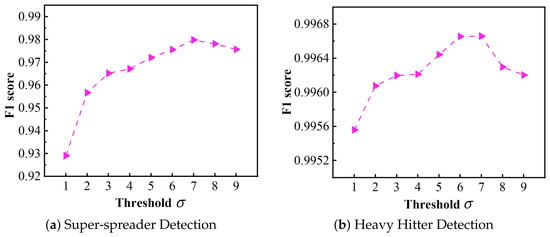
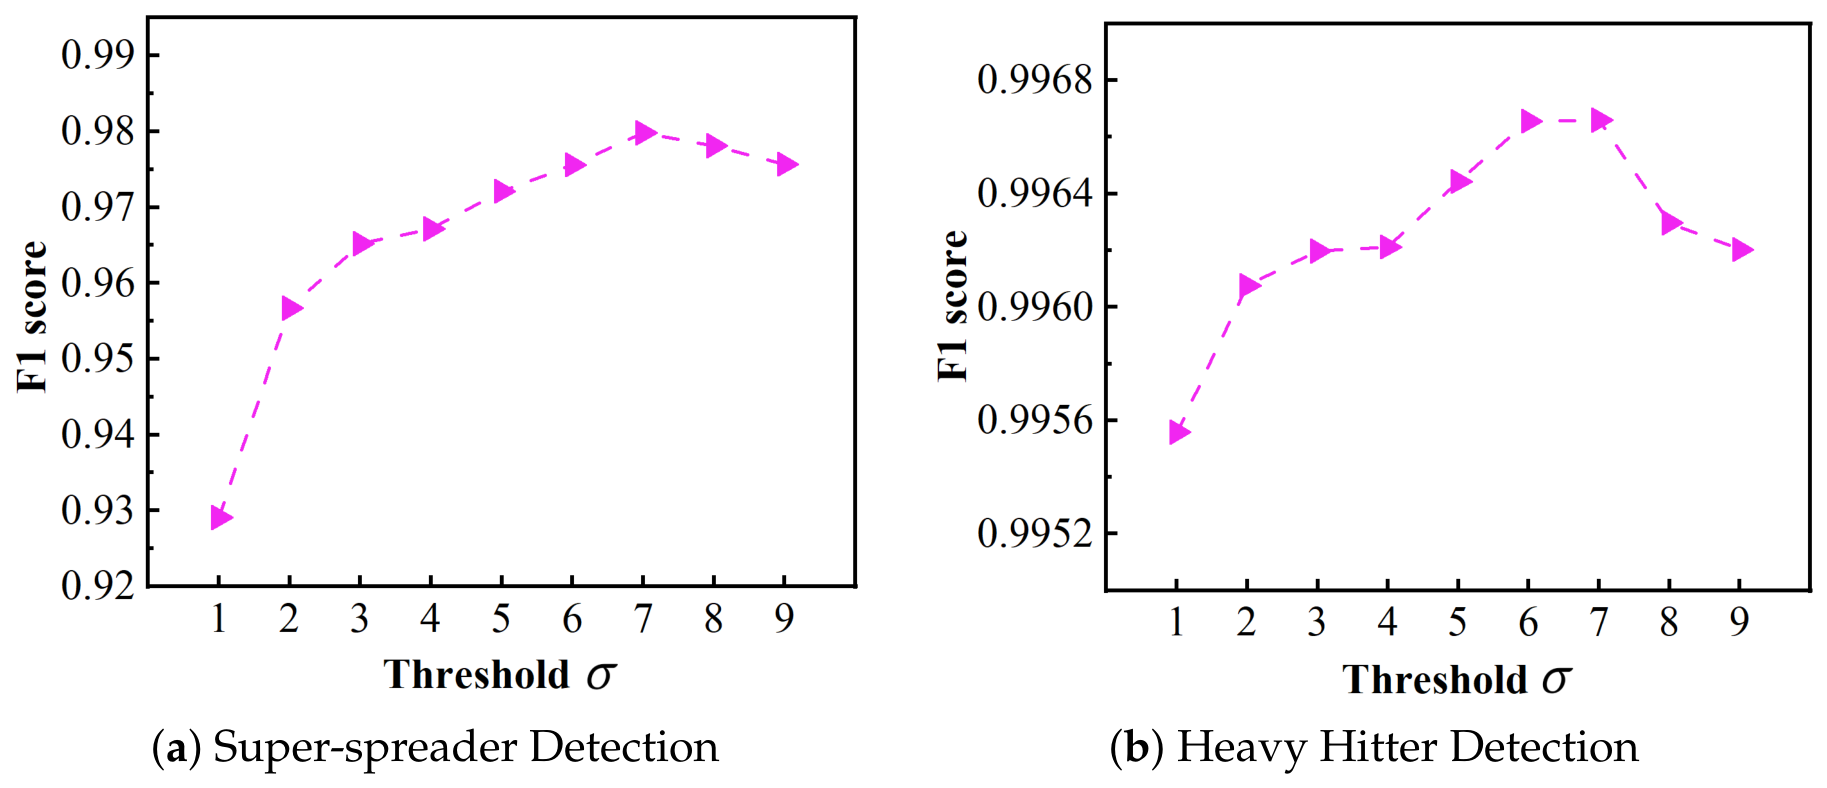
Impact of replacement threshold : In hitter layer, controls heavy hitter replacement and therefore affects detection accuracy. Selecting an appropriate is therefore important for DMS. The sensitivity study varies from 1 to 9 and measures the F1-score for each on CAIDA19 with the total DMS memory fixed at 1 MB.
Figure 3a shows that the F1-score increases over values from 1 to 7, attaining its maximum at = 7. Further growth in causes the F1-score to decline. Thus, = 7 is optimal for super-spreader detection.
Figure 3.
F1-score at different thresholds .
Figure 3b shows how affects heavy hitter detection. The F1-score increases as changes from 1 to 6, remains at its maximum as varies from 6 to 7, and then drops sharply as increases from 7 to 9. A larger raises the barrier for heavy hitters to replace small items, thereby reducing F1-score. Based on these results, the replacement threshold is set to 7.
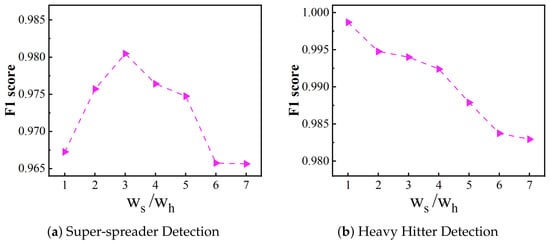
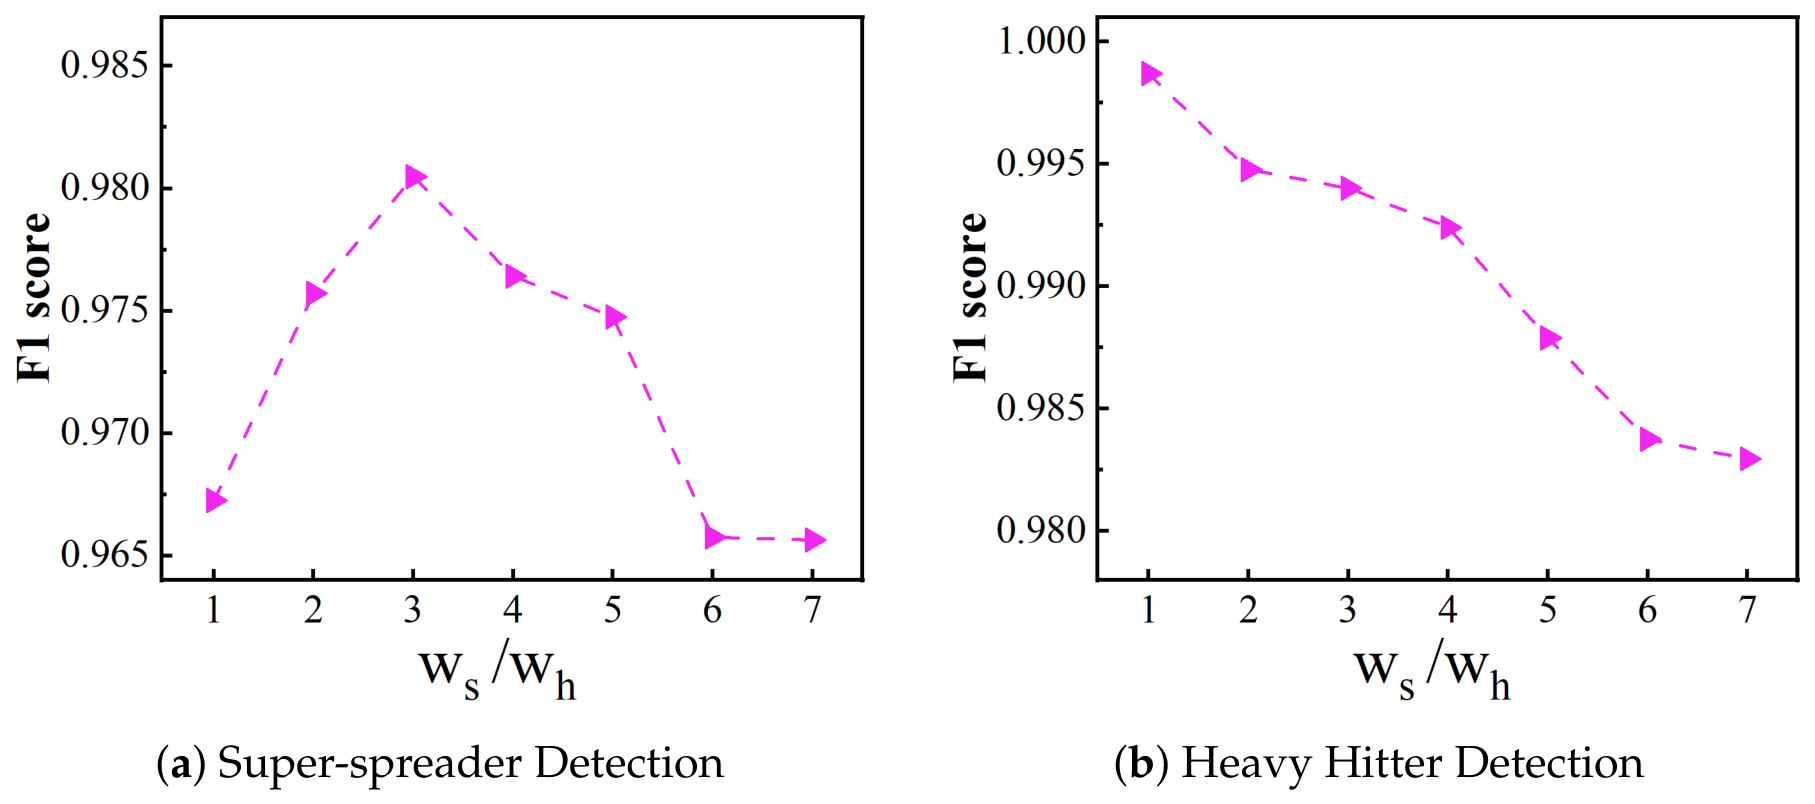
Impact of :The quantities and denote the buckets per spreader-layer row and the hitter-layer bucket count, respectively. The ratio controls the bucket allocation between the two layers and therefore affects both detection tasks. Selecting an appropriate is therefore important. Its sensitivity is evaluated by varying from 1 to 7 on CAIDA19, measuring the DMS F1 score for each , and fixing the total memory at 1 MB.
Figure 4a indicates a rising F1-score while moves from 1 to 3, with the peak occurring at = 3. Further increases in produce a continuing decline in F1-score. Hence, 3 is the optimal value for super-spreader detection.
Figure 4.
F1-score at different .
The heavy hitter F1 score for is shown in Figure 4b. As increases, the F1 score decreases overall. When is 1, the F1 score reaches its maximum; for values of 2 or 3, it remains high. Therefore, the suitable range of is 1-3. Considering both detection tasks, is set to 3, and the observed robustness supports using this ratio across different datasets.
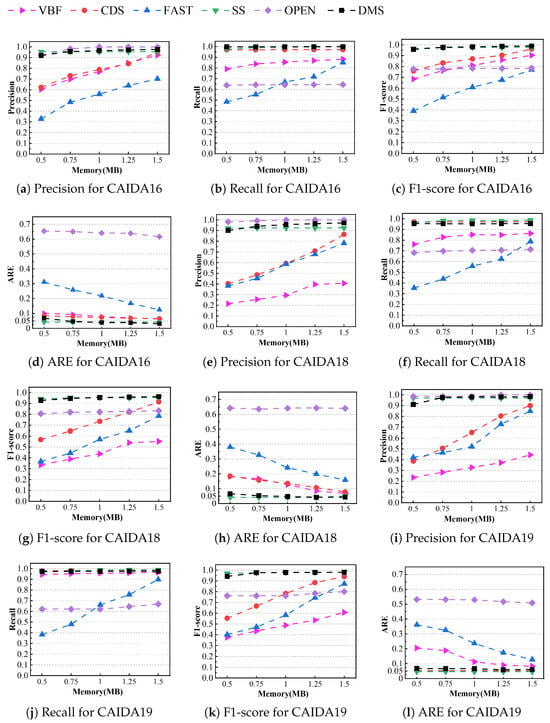
Super-spreader Detection: Across all datasets in Figure 5, OPEN attains the highest precision, whereas its recall stays below 70%. Its bitmap improves precision by filtering low-cardinality flow labels and thereby constraining overestimation. However, probabilistic item sampling prevents complete capture and recording of super-spreader information, thereby lowering recall. The DMS replacement strategy instead yields a recall rate near 100% on CAIDA16 with 0.5 MB memory; Figure 5b shows that this value is 29% above OPEN.
Figure 5.
The accuracy of super-spreader detection on CAIDA datasets.
VBF, CDS, and FAST keep flow labels regardless of whether their element cardinalities are low or high; collisions between low-cardinality labels and super-spreaders therefore become more frequent. Precision falls when these labels are incorrectly reported as super-spreaders in Figure 5a,e,i. Through dynamic separation of super-spreaders and heavy hitters, DMS suppresses the collisions and produces the much lower ARE observed in Figure 5d,h,l. At 1 MB memory, Figure 5l specifically gives a 50.15% ARE reduction relative to OPEN.
VBF and CDS attain substantially lower precision on CAIDA18 and CAIDA19 than on CAIDA16. The larger number of distinct items in CAIDA18 and CAIDA19 produces more hash collisions under the same memory budget, thereby reducing precision. On CAIDA19, DMS precision is 25% higher than that of CDS.
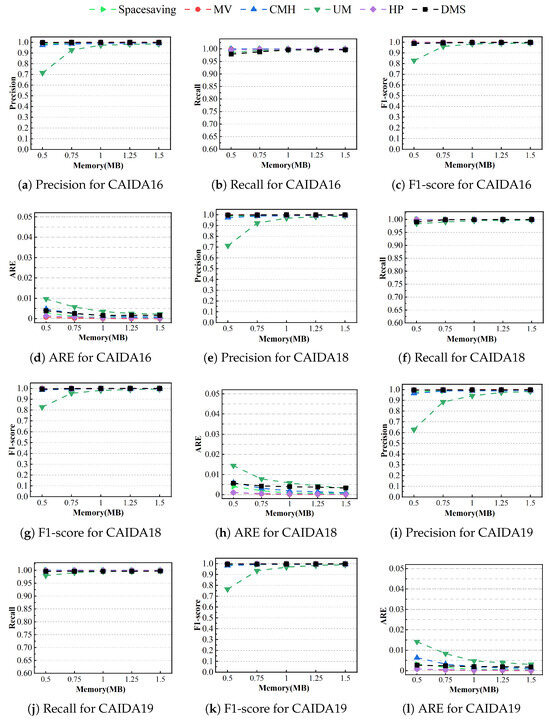
Heavy hitter Detection: The highest precision on every dataset belongs to DMS in Figure 6. Figure 6a shows that, with 1 MB memory, this precision is close to 100% and higher than UM. Recall also approaches 100% for all datasets, confirming robustness across different stream distributions. In Figure 6d,h,l, ARE stays under 1%; the CAIDA19 value is 4.6% lower than UM.
Figure 6.
The accuracy of heavy hitter detection on CAIDA datasets.
This heavy hitter detection accuracy results from separating the two traffic classes dynamically and storing them independently, thereby reducing mutual interference. By contrast, the multi-stream sampling mechanism of UM overestimates flow sizes and lowers precision, as seen in Figure 6a,e,i,k shows that DMS exceeds the UM F1-score by 23%, 6%, and 3% when memory is 0.5 MB, 0.75 MB and 1 MB, respectively.
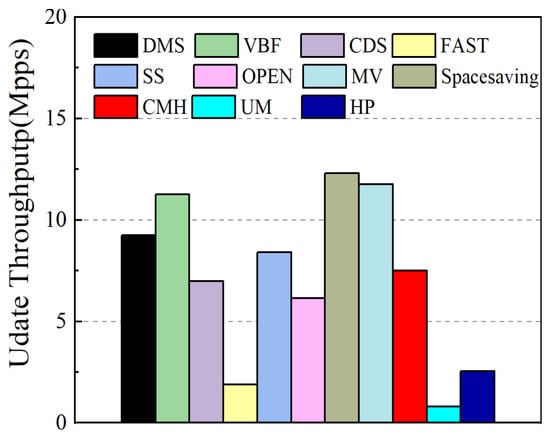
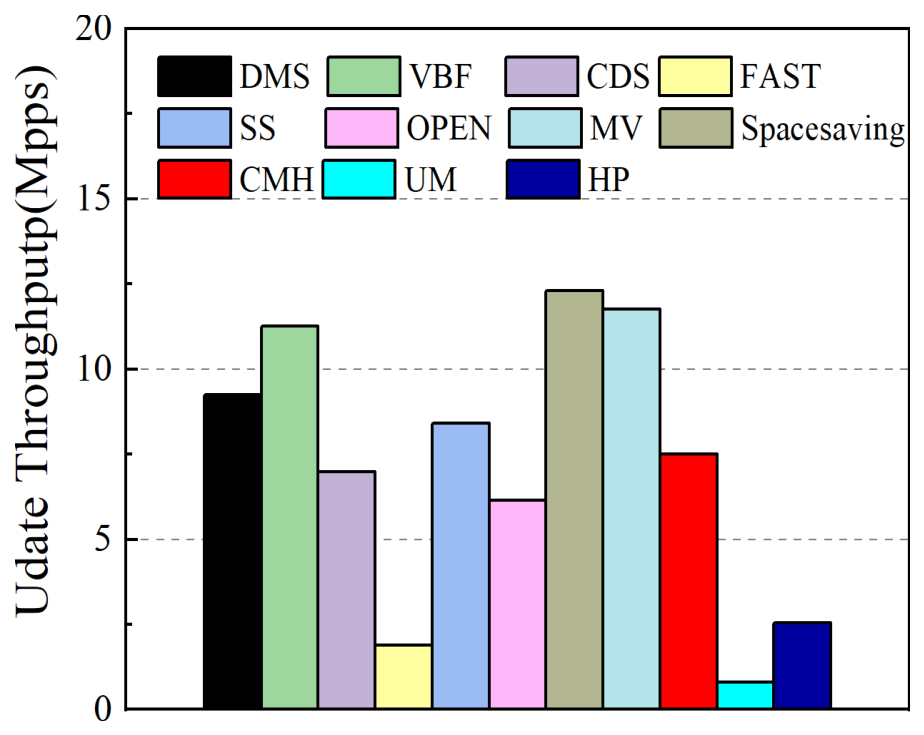
Update Throughput: Figure 7 shows the update throughput of DMS on CAIDA19 dataset. The update throughput of DMS has surpassed that of the vast majority of sketches. Particularly, the throughput of DMS is 4.92 and 11.71 times higher than that of FAST and UM, respectively. The reason is that the update operation of DMS only involves a few simple operations, such as shifting, addition and hash operations. VBF, MV Sketch and Spacesaving have higher update throughput. This is because when an item arrives, VBF divides the flow label into eight parts during the update and finds the corresponding bucket through bit extraction of the hash function, thus avoiding spending a lot of time on hashing. Spacesaving maintains a fixed-length array and only needs to traverse the array to find the corresponding bucket and update the counter therein to complete the update operation. In contrast, the throughput of FAST and UM is relatively low, the reason is that FAST requires multiple hashing during updates, and for each hash result, multiple bits need to be checked, causing a large number of judgment branches. UM adopts a hierarchical recursive structure, which leads to multiple layers of hashing during updates, thereby reducing the throughput. DMS preserves throughput comparable to VBF, MV and Spacesaving while performing super-spreader and heavy hitter detection simultaneously.
Figure 7.
Update throughput.
Performance Comparison of Joint Deployment: To more clearly contrast the performance differences between DMS and the deployment of multiple independent sketch schemes simultaneously, this section compares DMS with a joint detection scheme composed of two specialized sketches. This joint detection scheme is made up of the sketches with the best performance in each of the two measurement tasks, namely Spread Sketch for super-spreader detection and Spacesaving for heavy flow detection. For ease of comparison in the following text, this joint detection scheme is named Combine Sketch in this section.
For a fair comparison, both DMS and Combine Sketch receive a total memory budget of 1 MB. Combine Sketch assigns 0.5 MB to Spread Sketch and 0.5 MB to Spacesaving. This equal split is used because the two tasks are equally important and no prior priority is assumed. It provides a fair baseline without deliberately weakening either component. Other memory splits may improve one task at the expense of the other.
Combine Sketch is composed of two independent sketches, Spread Sketch for super-spreader detection and Spacesaving for heavy-hitter detection. In the throughput evaluation, each sketch is allocated with equal and separate processor and memory resources. Under this execution architecture, the two sketches run in parallel, processing every incoming packet to perform both measurement tasks simultaneously. Under this parallel execution model, the combined throughput is determined by the slower of the two sketches.
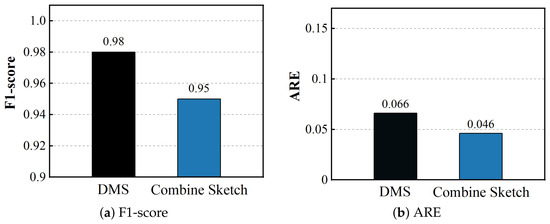
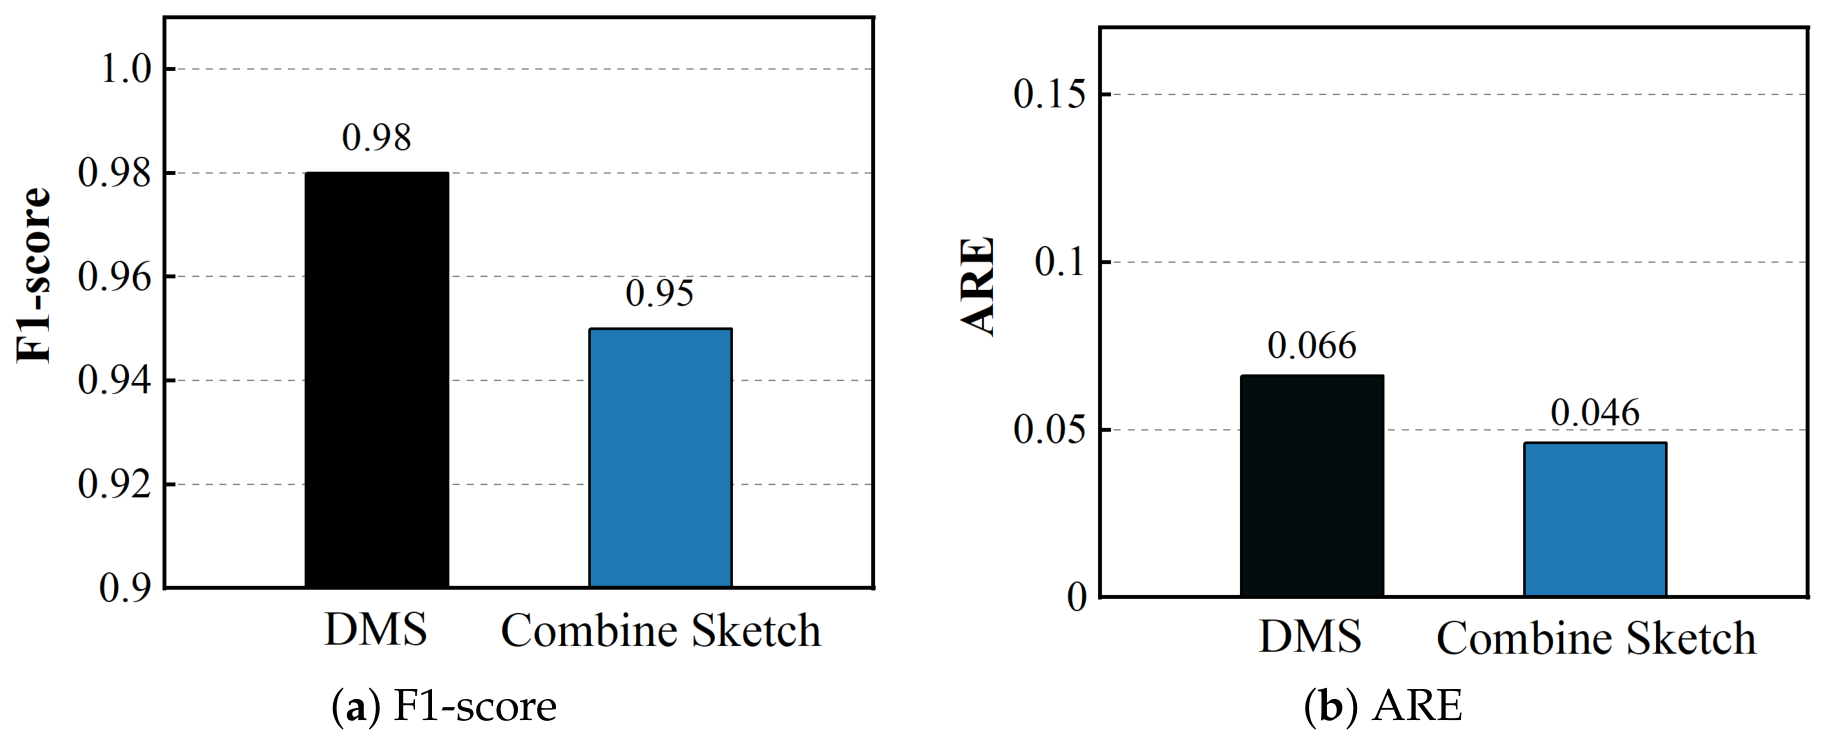
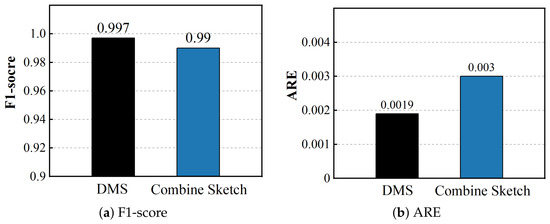
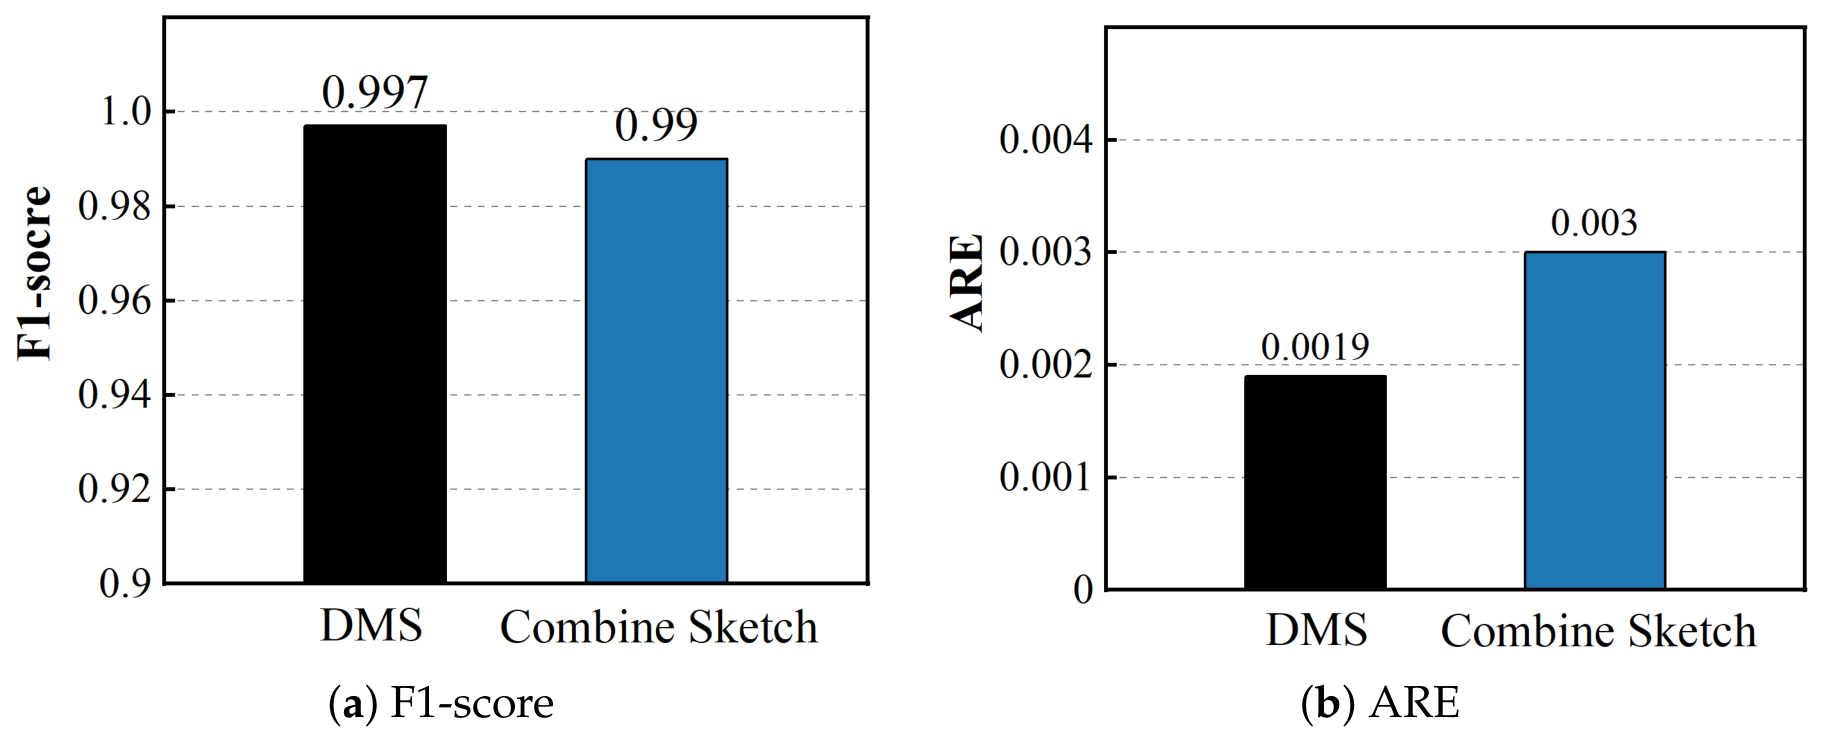
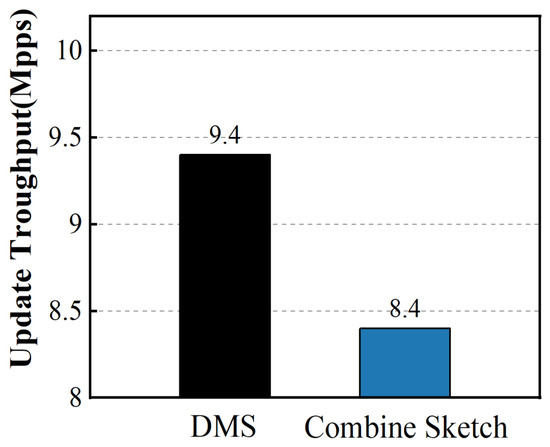
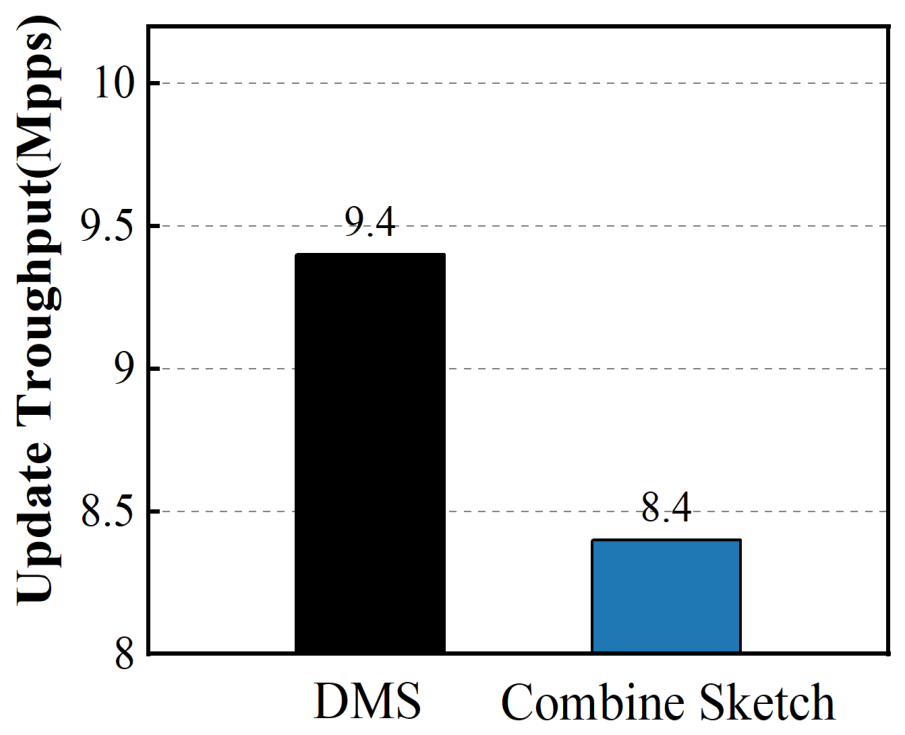
The experimental results are shown in Figure 8, Figure 9 and Figure 10. DMS outperforms Combine Sketch on most metrics: in super-spreader detection, DMS achieves an F1-score as high as 0.98, surpassing Combine Sketch’s 0.95; meanwhile, DMS achieves a very low average relative error of only 0.066. The high F1-score is consistent with the spreader layer’s bitmap representation, which records connection diversity without increasing bitmap occupancy for repeated items. Taking the minimum estimate across the mapped rows also helps limit overestimation caused by collisions with other flow labels. In heavy flow detection, DMS achieves an F1 score as high as 0.997, outperforming Combine Sketch’s 0.99; at the same time, its average relative error is also controlled at an extremely low 0.0019, far lower than the 0.003 of Combine Sketch. DMS updates retained items directly in the hitter layer and uses a counter-dependent replacement threshold to favor the retention of frequent items. Its auxiliary counters also retain frequency information when candidates are displaced, providing a mechanism consistent with the high F1-score and low counting error observed. Additionally, the update throughput of Combine Sketch is determined by the sketch with the lowest throughput among them. As shown in Figure 10, DMS not only demonstrates superior performance in super-spreader detection and heavy flow detection but also achieves a higher update throughput, approximately 12% higher than that of Combine Sketch, showcasing a clear advantage.
Figure 8.
Comparison of super-spreader detection.
Figure 9.
Comparison of heavy hitter detection.
Figure 10.
Comparison of throughput.
5.3. Discussion
The three datasets differ in traffic volume and distribution. By distinguishing super-spreaders from heavy hitters and storing them separately during updates, DMS detects both classes robustly under variable and skewed traffic. On CAIDA19 with 1 MB memory, DMS improves super-spreader F1-score by up to 40% and reduces heavy-hitter error by up to 80% compared with dedicated state-of-the-art sketches. These results demonstrate accurate joint detection without sacrificing throughput. In the microgrid network, the hash conflicts, highly skewed traffic and the memory cost of separated sketches are the challenges of sketch-based schemes. DMS addresses them jointly. It separates super-spreaders and heavy hitters dynamically through ignoring duplicate flows for cardinality estimation and keeping them for flow size estimation. This reduces influence from low-cardinality sources and mouse flows, making higher F1-score and lower errors. DMS also achieves super-spreader and heavy hitter detection in one insertion, avoiding the memory and time consumption of two dedicated sketches.
6. OVS Implementation
This section measures DMS packet-processing performance on the OVS platform. Experiments integrate OVS 2.12.1 and DPDK 18.11.10 in the platform configuration. The OVS-DPDK is configured to process 64-byte packets and is allocated of one RxQ and one TxQ for each port, running on a 12-core Intel i9-10920X platform. Fast user-space packet handling is supplied by the dpif-netdev module; consequently, the CPU can combine data packet forwarding with flow size measurement. In microgrid communication, DMS is evaluated as a traffic measurement component in the data-plane, whose stored traffic statistics can further support control-plane functions. This experiment focuses on the evaluation of the processing rate in the data-plane.
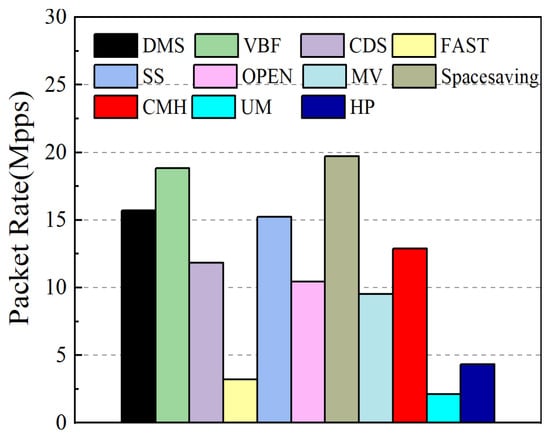
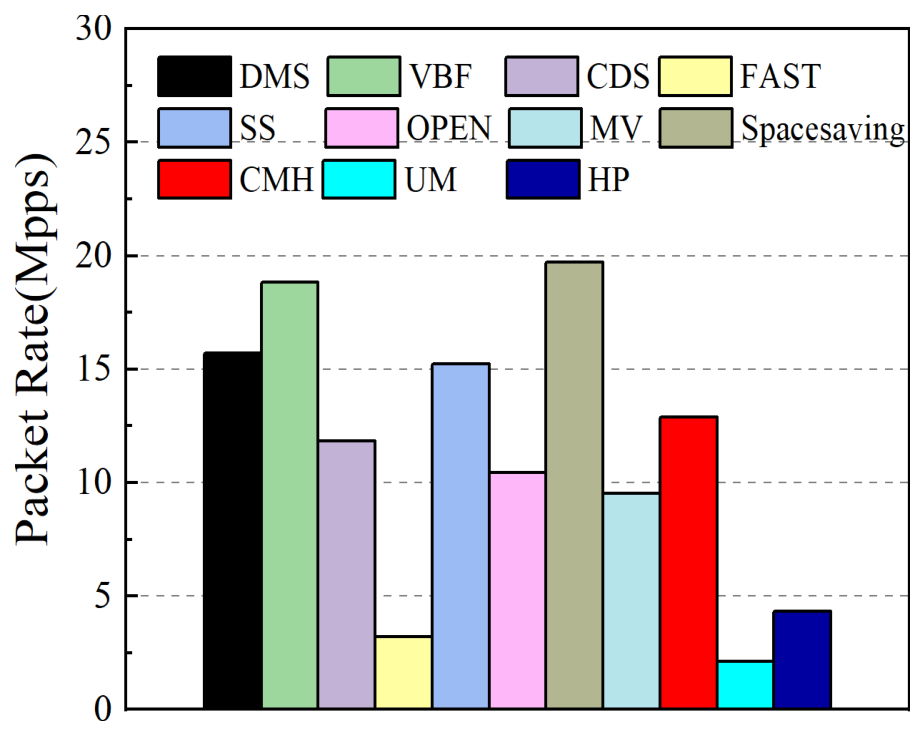
Figure 11 reports packet processing rate. DMS processes packets quickly and passes them to the control plane for congestion control, scheduling, and load balancing. Latency, jitter, and loss are mainly control-plane concerns, not sketch concerns. DMS reaches 15.71 Mpps, comparable to SS and higher than MV and UM. VBF and Spacesaving are faster but do not support both tasks. This shows DMS can provide joint measurement with practical data-plane throughput.
Figure 11.
Packet rate on OVS platform.
7. Conclusions
DualMeasure Sketch provides a single sketch structure for concurrent heavy-hitter and super-spreader measurement. Its update process dynamically separates the two traffic classes and stores them independently, reducing interference under skewed traffic. On CAIDA with 0.5–1.5 MB memory, compared with state-of-the-art sketches, DMS improves about 10% in heavy hitter detection F1-score, 22% in super-spreader detection F1-score, and more than 50% in update throughput. In a joint deployment on CAIDA19 with 1 MB total memory, compared with Combine Sketch, DMS improves about 12% in throughput. These results address the challenges raised in the Introduction: conflicting measurement requirements, skewed traffic, and the overhead of separate sketches. These results support DMS as an effective sketch-based solution for detecting heavy hitters and super-spreaders simultaneously in microgrid network traffic.
Author Contributions
Conceptualization, R.W., W.L., S.X., and Z.L.; methodology, R.W., W.L., and R.M.; software, R.W., W.L., and R.M.; validation, R.W. and W.L.; formal analysis, R.W., W.L., and S.X.; investigation, R.W., W.L., X.H., S.X., R.M., H.X., and Z.L.; resources, X.H. and R.M.; data curation, R.W., W.L., S.X., and R.M.; writing—original draft preparation, R.W., W.L., X.H., S.X., R.M., H.X., and Z.L.; writing—review and editing, R.W., W.L., X.H., S.X., R.M., H.X., and Z.L.; visualization, R.W., W.L., and H.X.; supervision, X.H. and Z.L.; project administration, X.H. and Z.L.; funding acquisition, X.H. All authors agree to be accountable for all aspects of the work and to ensure that questions about its accuracy or integrity are investigated and resolved. All authors have read and agreed to the published version of the manuscript.
Funding
This work was supported by the Science and Technology Project of State Grid Corporation of China under Contract kj2025-090.
Data Availability Statement
The datasets presented in this article are not readily available because the data are part of an ongoing study. Requests to access the datasets should be directed to the corresponding author (Zhuo Li). The raw data supporting the conclusions of this article will be made available by the corresponding author (Zhuo Li) on request.
Conflicts of Interest
The funding sponsors had no role in the design of the study; in the collection, analyses, or interpretation of data; in the writing of the manuscript; or in the decision to publish the results. Authors Ruofei Wang, Xuekai Hu, Shiwei Xue, and Rui Ma are employed by the company State Grid Hebei Electric Power Research Institute. The research was conducted in the absence of any commercial or financial relationships that could be construed as a potential conflict of interest. The authors declare no conflicts of interest.
References
- Hirsch, A.; Parag, Y.; Guerrero, J. Microgrids: A review of technologies, key drivers, and outstanding issues. Renew. Sustain. Energy Rev. 2018, 90, 402–411. [Google Scholar] [CrossRef] [Scilit]
- Nejabatkhah, F.; Li, Y.W.; Liang, H.; Ahrabi, R.R. Cyber-Security of Smart Microgrids: A Survey. Energies 2021, 14, 27. [Google Scholar] [CrossRef] [Scilit]
- Gu, S. Identifying network connection: Benign vs. DoS attack-A comparative analysis of binary classifiers. Appl. Comput. Eng. 2024, 34, 147–152. [Google Scholar] [CrossRef] [Scilit]
- Adedeji, K.B.; Abu-Mahfouz, A.M.; Kurien, A.M. DDoS attack and detection methods in internet-enabled networks: Concept, research perspectives, and challenges. J. Sens. Actuator Netw. 2023, 12, 51. [Google Scholar] [CrossRef] [Scilit]
- Zhao, Z.; Li, Z.; Zhou, Z.; Yu, J.; Song, Z.; Xie, X.; Zhang, F.; Zhang, R. DDoS family: A novel perspective for massive types of DDoS attacks. Comput. Secur. 2024, 138, 103663. [Google Scholar] [CrossRef] [Scilit]
- Kandula, S.; Sengupta, S.; Greenberg, A.; Patel, P.; Chaiken, R. The nature of data center traffic: Measurements & analysis. In Proceedings of the 9th ACM SIGCOMM Conference on Internet Measurement, IMC ’09; ACM: New York, NY, USA, 2009; pp. 202–208. [Google Scholar]
- Li, W.; Patras, P. Stable-Sketch: A Versatile Sketch for Accurate, Fast, Web-Scale Data Stream Processing. In Proceedings of the ACM Web Conference 2024, WWW ’24; ACM: New York, NY, USA, 2024; pp. 4227–4238. [Google Scholar]
- Qi, Y.; Li, R.; Wang, P.; Sun, Y.; Xing, R. QSketch: An Efficient Sketch for Weighted Cardinality Estimation in Streams. In Proceedings of the 30th ACM SIGKDD Conference on Knowledge Discovery and Data Mining, KDD ’24; ACM: New York, NY, USA, 2024; pp. 2432–2443. [Google Scholar]
- Tang, L.; Huang, Q.; Lee, P.P.C. MV-Sketch: A Fast and Compact Invertible Sketch for Heavy Flow Detection in Network Data Streams. In Proceedings of the IEEE INFOCOM 2019–IEEE Conference on Computer Communications; IEEE: Piscataway, NJ, USA, 2019; pp. 2026–2034. [Google Scholar]
- Yang, T.; Jiang, J.; Liu, P.; Huang, Q.; Gong, J.; Zhou, Y.; Miao, R.; Li, X.; Uhlig, S. Elastic sketch: Adaptive and fast network-wide measurements. In Proceedings of the 2018 Conference of the ACM Special Interest Group on Data Communication, SIGCOMM ’18; ACM: New York, NY, USA, 2018; pp. 561–575. [Google Scholar]
- Metwally, A.; Agrawal, D.; El Abbadi, A. Efficient computation of frequent and top-k elements in data streams. In Proceedings of the International Conference on Database Theory; Springer: Berlin/Heidelberg, Germany, 2005; pp. 398–412. [Google Scholar]
- Tang, L.; Xiao, Y.; Huang, Q.; Lee, P.P.C. A High-Performance Invertible Sketch for Network-Wide Superspreader Detection. IEEE/ACM Trans. Netw. 2023, 31, 724–737. [Google Scholar] [CrossRef] [Scilit]
- Liu, W.; Qu, W.; Gong, J.; Li, K. Detection of Superpoints Using a Vector Bloom Filter. IEEE Trans. Inf. Forensics Secur. 2016, 11, 514–527. [Google Scholar] [CrossRef] [Scilit]
- Liu, Y.; Chen, W.; Guan, Y. A fast sketch for aggregate queries over high-speed network traffic. In Proceedings of the 2012 Proceedings IEEE INFOCOM; IEEE: Piscataway, NJ, USA, 2012; pp. 2741–2745. [Google Scholar]
- Peng, T.; Leckie, C.; Ramamohanarao, K. Survey of network-based defense mechanisms countering the DoS and DDoS problems. ACM Comput. Surv. 2007, 39, 3-es. [Google Scholar] [CrossRef] [Scilit]
- Jing, X.; Yan, Z.; Han, H.; Pedrycz, W. ExtendedSketch: Fusing Network Traffic for Super Host Identification With a Memory Efficient Sketch. IEEE Trans. Dependable Secur. Comput. 2022, 19, 3913–3924. [Google Scholar] [CrossRef] [Scilit]
- Yu, M.; Jose, L.; Miao, R. Software Defined Traffic Measurement with OpenSketch. In Proceedings of the 10th USENIX Symposium on Networked Systems Design and Implementation (NSDI 13); USENIX Association: Berkeley, CA, USA, 2013; pp. 29–42. [Google Scholar]
- Wang, P.; Guan, X.; Qin, T.; Huang, Q. A Data Streaming Method for Monitoring Host Connection Degrees of High-Speed Links. IEEE Trans. Inf. Forensics Secur. 2011, 6, 1086–1098. [Google Scholar] [CrossRef] [Scilit]
- Yoon, M.; Chen, S. Detecting stealthy spreaders by random aging streaming filters. IEICE Trans. Commun. 2011, 94, 2274–2281. [Google Scholar] [CrossRef] [Scilit]
- Ma, C.; Odegbile, O.O.; Melissourgos, D.; Wang, H.; Chen, S. From countmin to super kjoin sketches for flow spread estimation. IEEE Trans. Netw. Sci. Eng. 2023, 11, 2353–2370. [Google Scholar] [CrossRef] [Scilit]
- Zhou, Y.; Zhang, Y.; Ma, C.; Chen, S.; Odegbile, O.O. Generalized sketch families for network traffic measurement. Proc. ACM Meas. Anal. Comput. Syst. 2019, 3, 51. [Google Scholar] [CrossRef] [Scilit]
- Cormode, G.; Muthukrishnan, S. An improved data stream summary: The count-min sketch and its applications. J. Algorithms 2005, 55, 58–75. [Google Scholar] [CrossRef] [Scilit]
- Liu, Z.; Manousis, A.; Vorsanger, G.; Sekar, V.; Braverman, V. One Sketch to Rule Them All: Rethinking Network Flow Monitoring with UnivMon. In Proceedings of the 2016 ACM SIGCOMM Conference, SIGCOMM ’16; ACM: New York, NY, USA, 2016; pp. 101–114. [Google Scholar]
- Sivaraman, V.; Narayana, S.; Rottenstreich, O.; Muthukrishnan, S.; Rexford, J. Heavy-Hitter Detection Entirely in the Data Plane. In Proceedings of the Symposium on SDN Research, SOSR ’17; ACM: New York, NY, USA, 2017; pp. 164–176. [Google Scholar]
- Li, Y.; Yu, X.; Yang, Y.; Zhou, Y.; Yang, T.; Ma, Z.; Chen, S. Pyramid family: Generic frameworks for accurate and fast flow size measurement. IEEE/ACM Trans. Netw. 2021, 30, 586–600. [Google Scholar] [CrossRef] [Scilit]
- Zhou, Y.; Jin, H.; Liu, P.; Zhang, H.; Yang, T.; Li, X. Accurate per-flow measurement with bloom sketch. In Proceedings of the IEEE INFOCOM 2018-IEEE Conference on Computer Communications Workshops (INFOCOM WKSHPS); IEEE: Piscataway, NJ, USA, 2018; pp. 1–2. [Google Scholar]
- Yang, T.; Gao, S.; Sun, Z.; Wang, Y.; Shen, Y.; Li, X. Diamond sketch: Accurate per-flow measurement for big streaming data. IEEE Trans. Parallel Distrib. Syst. 2019, 30, 2650–2662. [Google Scholar] [CrossRef] [Scilit]
- Fan, Z.; Wang, R.; Cai, Y.; Zhang, R.; Yang, T.; Wu, Y.; Cui, B.; Uhlig, S. Onesketch: A generic and accurate sketch for data streams. IEEE Trans. Knowl. Data Eng. 2023, 35, 12887–12901. [Google Scholar] [CrossRef] [Scilit]
- Liu, J.; Li, Z.; Du, H.; Zhou, H.; Li, L.; An, Y.; Zhang, Y.; Liu, K.; Li, Q. An effective and accurate flow size measurement using funnel-shaped sketch. Comput. Netw. 2024, 247, 110467. [Google Scholar] [CrossRef] [Scilit]
- Landau-Feibish, S.; Liu, Z.; Rexford, J. Compact Data Structures for Network Telemetry. ACM Comput. Surv. 2025, 57, 191. [Google Scholar] [CrossRef] [Scilit]
- CAIDA. The CAIDA UCSD Anonymized Internet Traces—2016, 2018, and 2019. Available online: https://www.caida.org/catalog/datasets/passive_dataset/ (accessed on 14 October 2026).
- Shi, Q.; Jia, C.; Li, W.; Liu, Z.; Yang, T.; Ji, J.; Xie, G.; Zhang, W.; Yu, M. BitMatcher: Bit-level Counter Adjustment for Sketches. In Proceedings of the 2024 IEEE 40th International Conference on Data Engineering (ICDE); IEEE: Piscataway, NJ, USA, 2024; pp. 4815–4827. [Google Scholar]

Disclaimer/Publisher’s Note: The statements, opinions and data contained in all publications are solely those of the individual author(s) and contributor(s) and not of MDPI and/or the editor(s). MDPI and/or the editor(s) disclaim responsibility for any injury to people or property resulting from any ideas, methods, instructions or products referred to in the content. |
© 2026 by the authors. Licensee MDPI, Basel, Switzerland. This article is an open access article distributed under the terms and conditions of the Creative Commons Attribution (CC BY) license.