


Abstract
In this study, thermogravimetric experiments combined with kinetic and thermodynamic analyses were performed to investigate the pyrolysis and co-pyrolysis mechanisms of four typical medical wastes, including swab sticks, polypropylene (PP), textiles, and paper. The results indicated a distinct difference in pyrolysis behaviors between biomass-based and plastic medical wastes. Biomass samples exhibited a wide pyrolysis temperature range and high char yield, while PP presented concentrated and complete thermal decomposition. When the heating rate increased from 10 °C/min to 40 °C/min, the characteristic pyrolysis temperature rose and the reaction rate accelerated, whereas the inherent pyrolysis mechanism of each material remained unchanged. Kinetic analysis demonstrated that swab sticks and paper had activation energies of 110–208 kJ/mol and 42.7–194.0 kJ/mol, respectively, and their experimental data were best fitted by the first-order reaction model. Textiles possessed activation energies of 121–135 kJ/mol, and their pyrolysis process was well described by the three-dimensional diffusion control model. PP showed the highest activation energy of 204–240 kJ/mol with favorable reaction homogeneity. The co-pyrolysis of mixed medical wastes was a multi-stage reaction, and its mechanism transformed sequentially from the three-dimensional diffusion model to the first-order reaction and then to the three-dimensional diffusion model with the increase in conversion rate. Radical interactions between biomass and plastic components exerted an obvious inhibitory effect on the co-pyrolysis process. Thermodynamic analysis verified that the pyrolysis of all tested samples was an endothermic process. Different from single-component systems, the mixed system exhibited stepwise abrupt changes in thermodynamic parameters, indicating that the thermodynamic characteristics of individual components cannot accurately reflect the coupled reaction behaviors of mixed medical waste systems. Therefore, the optimization of medical waste pyrolysis processes should be based on the intrinsic laws of co-pyrolysis rather than the pyrolysis properties of single components.
1. Introduction
With the rapid development of the global healthcare industry, medical waste generation has been continuously rising [1]. Medical waste is classified into infectious, pathological, sharps, pharmaceutical and chemical wastes. Infectious waste accounts for 60–80% of the total and has a high calorific value [2,3]. As medical waste carries pathogenic microorganisms or toxic chemicals, improper disposal may cause cross-infection and environmental pollution, threatening public health and ecosystems [4]. Developing safe, efficient, low-carbon and sustainable disposal and resource recovery technologies is therefore an urgent research priority in solid waste management.
Conventional medical waste disposal technologies include incineration [5], landfilling [6], chemical disinfection [7], microwave sterilization [8] and pyrolysis [9]. Incineration produces highly toxic persistent organic pollutants such as dioxins and polychlorinated dibenzofurans, while landfilling poses long-term soil and groundwater contamination risks due to slow waste degradation. As an alternative, pyrolysis enables controlled thermochemical conversion of organics under oxygen-deficient or inert atmospheres. It features flexible operation, high treatment efficiency, low secondary pollution and energy recovery potential [10,11,12]. Pyrolysis breaks organic macromolecules into gas, pyrolysis oil and biochar, achieving waste reduction, harmless treatment and resource recovery simultaneously [13,14,15], making it a promising route for green medical waste disposal.
Feedstock composition dominates pyrolysis behavior, reaction pathways and product distribution. Medical waste mainly contains plastics [16,17], cellulose-based materials [18,19] and textiles [20,21], each with distinct thermal degradation pathways. For instance, polyvinyl chloride (PVC) undergoes two-stage decomposition: sequential dechlorination and dehydration, followed by polyene backbone scission [22,23]. Although the pyrolysis mechanisms of single-component wastes are well documented, complex multi-component interactions in real medical waste can substantially alter pyrolysis behavior and product distribution, and such coupling mechanisms remain unclear.
Pyrolysis temperature, heating rate, residence time and particle size strongly affect pyrolysis processes and product quality. Zolfagharpour et al. [24] reported significant interactive effects of temperature and residence time on polycyclic aromatic hydrocarbon (PAH) formation during hazardous medical waste pyrolysis. Yang et al. [25] found that high temperatures increase ASR gas yield. Wang et al. [26] observed peak aromatic and olefin yields at 600 °C in WCO and TR co-pyrolysis. George et al. [27] demonstrated that heating rate mainly governs total product yield at high temperatures, whereas it controls condensable product composition at low temperatures. Overall, high temperatures favor gaseous products and extended residence time accelerates secondary reactions and reduces liquid yield. Nevertheless, parameter effects are highly feedstock-dependent. Systematic investigations of mixed medical waste remain limited, and how component interactions regulate product formation requires deeper exploration.
Co-pyrolysis and catalytic pyrolysis are widely adopted to improve conversion efficiency and product quality. Hou et al. [28] found that co-pyrolysis of bamboo residues and disposable masks accelerates polymer decomposition and reduces activation energy. Similar synergies were confirmed for bamboo blended with general-purpose plastics [29], polypropylen, linear low-density polyethylene [30], high-density polyethylene and polystyrene [31].
Despite extensive studies on solid waste pyrolysis and catalysis, key research gaps still exist: (1) most work focuses on single biomass or plastic feedstocks. Few studies address co-pyrolysis of multi-component medical waste (swab sticks, paper, textiles and PP plastics), and the synergistic/inhibitory interactions between components are poorly understood. (2) Mixed medical waste co-pyrolysis is a multi-stage, variable-mechanism coupled reaction. Single kinetic models are insufficient to capture its dynamic evolution, and systematic interpretation of kinetic and thermodynamic characteristics is lacking. (3) Parameter effects are strongly feedstock-specific. There is a lack of research on coupled parameter effects for mixed medical waste, and universal optimal pyrolysis strategies to achieve targeted product regulation are absent.
Against this background, this study investigates single-component pyrolysis and co-pyrolysis of four typical medical wastes and their mixtures using thermogravimetric analysis (TGA) together with kinetic and thermodynamic modeling. The physicochemical properties of the raw materials were characterized. Thermogravimetric behavior and component interactions at different heating rates were explored. Kinetic models were applied to reveal pyrolysis mechanisms and thermodynamic evolution. This study aims to uncover the intrinsic co-pyrolysis mechanisms of mixed medical waste and provide theoretical foundations and technical support for resource recovery and parameter optimization of medical waste pyrolysis.
2. Materials and Methods
2.1. Materials
The mixed experimental materials employed in this study were supplied by Henan Liying Environmental Protection Technology Co., Ltd. (Shangqiu, China). The medical wastes collected from hospitals by the company underwent ultrasonic disinfection, manual sorting and weighing to determine their component ratios.
To investigate the thermogravimetric, kinetic and thermodynamic characteristics of swab sticks, polypropylene (PP) plastic, textiles (bandages) and paper under individual and co-pyrolysis conditions, the samples were first crushed and pre-treated. After sieving through a 120-mesh sieve, the obtained materials were stored in sealed sample vials, as shown in Figure 1.
Figure 1.
Medical Waste Experimental Samples.
After crushing, the experimental materials exhibit improved heat-transfer efficiency and uniform heat distribution. The specific surface area of the reaction system is increased, which enables more accurate evaluation of interactions during co-pyrolysis, reduces experimental errors caused by particle size differences, and enhances the accuracy and repeatability of experimental results. Table 1 lists the types and mass fractions of the four typical medical wastes used in this study.
Table 1.
Mass fractions of each component and mass of experimental materials in mixed samples.
To better elucidate the pyrolysis mechanism, kinetic and thermodynamic characteristics of typical medical wastes and their mixtures, proximate and ultimate analyses were performed on the four medical waste components used in this study, and the results are presented in Table 2.
Table 2.
Ultimate analysis and proximate analysis of mixed medical waste (wt.%).
Since the total mass of the mixed feedstock in each thermogravimetric test is only 3 mg, weighing the four individual medical waste components separately (0.5, 0.8, 0.7 and 1.0 mg) prior to mixing leads to poor weighing accuracy. Therefore, before the TGA experiments, a precision balance with a resolution of 0.1 g was used to weigh the crushed raw materials: 14.87 g cotton swabs, 26.56 g waste paper, 23.91 g textile (bandage), and 34.66 g plastic (PP). These four materials were thoroughly blended to prepare a homogeneous feedstock matching the target mixing ratio. During TGA measurement, approximately 3 mg of the well-mixed sample was weighed using the built-in thermobalance of the TGA instrument. The thermobalance achieves a resolution of 0.1 μg, which enables accurate weighing of the ~3 mg microscale sample. In contrast, conventional balances cannot guarantee reliable weighing of individual components below 1 mg.
2.2. Experimental Apparatus and Methods
Table 3 summarizes the models and manufacturers of experimental instruments adopted in this study. A photograph of the thermogravimetric analyzer is presented in Figure 2.
Table 3.
Experimental instruments and equipment.
Figure 2.
Photo of the thermogravimetric analyzer.
2.3. Thermogravimetric Experimental Method
The thermogravimetric analyzer shown in Figure 2 was employed in this study to investigate the thermal weight loss characteristics, pyrolysis kinetics and thermodynamics of single-component and mixed medical waste. The procedures of the thermogravimetric test are described as follows:
- (1)
- The sample chamber of the thermogravimetric analyzer was purged with nitrogen for 10 min at a flow rate of 200–300 mL/min.
- (2)
- After zeroing the thermogravimetric analyzer, the sample was weighed. The sample was spread evenly on the bottom of the crucible to ensure good contact with the crucible, and the sample mass was recorded by the analyzer.
- (3)
- Experimental parameters were set via the TA-60WS Collection Monitor software. The test was initiated after the instrument baseline became stable.
- (4)
- Data were retrieved using TA60 upon completion of the experiment.
The basic parameters of the TGA tests in this study are as follows: sample mass of 3 mg; nitrogen carrier gas with a purity of 99.99%; carrier gas flow rate of 100 mL/min; final pyrolysis temperature of 800 °C with a holding time of 30 min; and heating rates of 10, 20, 30 and 40 °C/min. A blank test was conducted for each run to reduce the influence of instrumental error on experimental results. Each test was repeated three times to minimize random errors.
2.4. Methods for Pyrolysis Kinetic and Thermodynamic Analysis
Chemical reaction kinetics is mostly used to determine the reaction rate equation and evaluate the effect of temperature on the reaction rate. In the reaction rate equation, temperature significantly affects the rate constant k. This temperature dependence is usually quantitatively described by the Arrhenius equation [32]:
where is the rate constant; is the pre-exponential factor, s−1; is the activation energy, J/mol; is the ideal gas constant, 8.314 ; and is the temperature, K.
For a solid-state reaction under isothermal conditions, the reaction rate can generally be described by Equation (2):
where f(α) is the reaction mechanism function, and α represents the conversion degree. Based on the data obtained from thermogravimetric experiments, α can be defined by Equation (3):
where is the initial mass at the onset of reaction, g; is the mass at time t; and is the final mass upon completion of reaction, g.
For experimental data acquired from non-isothermal tests, Equation (4) can be rearranged to obtain the expression for reaction rate as a function of temperature under a constant heating rate.
where dα/dT is the non-isothermal reaction rate, dα/dt is the isothermal reaction rate, and dT/dt is the constant heating rate, typically denoted by β.
Substituting Equation (4) into Equation (2), the differential form of the non-isothermal rate equation at a constant heating rate is obtained:
By separating variables and integrating, the integral form of the rate equation under non-isothermal conditions is derived as shown in Equation (6):
where is the mechanism function in integral form.
Table 4 summarizes the most commonly used mechanism models and kinetic equations for solid-state pyrolysis reactions.
Table 4.
Most frequently used kinetic equations of solid-state reactions.
In this study, the KAS, FWO and Friedman methods are adopted to calculate the activation energy and pre-exponential factor of the reaction.
The FWO method is an isoconversional method based on multiple heating rate scanning, and its expression is shown in Equation (8):
According to Akahira [33], Kissinger [34], Akahira and Sunose [35], the KAS method is also an isoconversional method based on multiple heating rate scanning, and its expression is shown in Equation (9):
The slope of the plot of versus is .
The expression of the Friedman method [36] is shown in Equation (10):
For the above equations, linear fittings of , and versus are performed, respectively. The activation energy and pre-exponential factor of the reaction can be calculated from the slope and intercept of the fitted curves.
In addition to investigating the pyrolysis reaction kinetics of mixed medical waste in this study, the thermodynamic parameters of the reaction were also calculated. Thermodynamic parameters including enthalpy change (ΔH), Gibbs free energy change (ΔG) and entropy change (ΔS) involved in the pyrolysis process were obtained. These parameters facilitate the accurate calculation of heat absorption/release and process efficiency during pyrolysis. Among them, ΔH represents the energy difference between the activated complex and reactants, ΔG indicates the spontaneity of the reaction process, and ΔS describes the randomness of the sample during the reaction. These three thermodynamic parameters are calculated by Equations (11), (12) and (13), respectively:
where is the Boltzmann constant, 1.381 × 10⁻²³ J/K; h is the Planck constant, 6.626 × 1034 J⋅s; is the absolute temperature at a given conversion, K; Tmax is the peak temperature corresponding to the DTG curve, K; and a single Tmax parameter was adopted in the calculations of and .
In this study, the DTG peak temperature is used as the characteristic temperature (Tmax) and substituted into the thermodynamic equations for calculation. This approximation is based on the fact that the reaction is most intense and representative at the peak. Furthermore, it satisfies the simplification condition of Eα ≫ RTmax, making it a common practice in the field of thermal analysis.
3. Pyrolysis Kinetics and Thermodynamic Analysis of Medical Waste
3.1. Pyrolysis Kinetics Analysis of Medical Waste
In this study, pyrolysis experiments of four types of medical waste (swab stick, plastics, textiles and paper) and their co-pyrolysis of mixtures were carried out under a high-purity nitrogen inert atmosphere, with a final pyrolysis temperature of 800 °C and heating rates β of 10, 20, 30 and 40 °C/min. Kinetic analysis was subsequently performed. The TG-DTG curves obtained from thermogravimetric tests are shown in Figure 3 and Figure 4 below.
Figure 3.
TG and DTG curves for individual pyrolysis of four typical medical wastes.
Figure 4.
TG and DTG curves of experimental and theoretical values for mixed components.
It can be observed from Figure 3a that the main pyrolysis temperature range of swab sticks is 240–390 °C. With the increase in heating rate, the mass-loss peak shifts toward higher temperatures. When the heating rate increases from 10 °C/min to 20, 30 and 40 °C/min, the peak temperature Tmax gradually rises from 354 °C to 370, 380 and 388 °C.
It can be observed from Figure 3b that the main pyrolysis zone of plastics is concentrated between 430 and 540 °C. Only one mass-loss peak appears in the DTG curve. When the heating rate increases from 10 °C/min to 40 °C/min, the main peak of the DTG curve obviously shifts toward higher temperatures, and the peak height increases continuously.
It can be observed from Figure 3c that the main pyrolysis zone of textiles is concentrated between 260 and 390 °C, with only one mass-loss peak on the DTG curve. The peak temperature Tmax of the main peak shifts toward higher temperatures as the heating rate increases. The DTG peak is broader at the low heating rate of 10 °C/min, indicating a wider reaction range, while a sharper peak shape and more concentrated reaction are obtained at the high heating rate of 40 °C/min.
It can be observed from Figure 3d that the main pyrolysis interval ranges of paper from 270 to 410 °C, with only one peak on the DTG curve. As the heating rate increases, the mass-loss peak shifts toward higher temperatures and the peak height rises slightly.
To analyze the co-pyrolysis characteristics of mixed medical waste, swab sticks, plastics, textiles and paper were blended at mass fractions of 14.87%, 34.66%, 23.91% and 26.56%, respectively. The TG and DTG curves during pyrolysis were measured and compared with the theoretically calculated values, as shown in Figure 4.
It can be observed from Figure 4 that the major mass loss of mixed medical waste occurs in the temperature ranges of 260–410 °C and 470–560 °C, and two distinct mass-loss peaks are identified on the DTG curve. The first mass-loss region mainly corresponds to the synergistic pyrolysis of textiles, paper and swab sticks, while the second one is attributed to the mass loss of plastics.
With the increase in heating rate, both the low-temperature peak of biomass fractions and the high-temperature peak of plastics shift toward higher temperatures. The valley between the two peaks rises, leading to a partial overlap between the low- and high-temperature decomposition intervals.
Based on the TG and DTG curves obtained from thermogravimetric experiments, information including the peak temperature, initial pyrolysis temperature and residual mass fraction of the four typical medical wastes and their mixture can be determined, as summarized in Table 5.
Table 5.
Peak temperature, initial pyrolysis temperature and residual mass of four typical medical wastes and their mixture.
As can be seen from Figure 4 and Table 5, the calculated pyrolysis residue mass of the mixed medical waste, based on the blending ratio under the four heating rates, is lower than the experimentally measured value. This indicates that an inhibitory effect exists during the co-pyrolysis process of the mixed waste.
3.2. Pyrolysis Kinetic Analysis of Medical Waste
Three isoconversional methods, namely, KAS, FWO and Friedman, were adopted to calculate the activation energy () and pre-exponential factor () during the individual pyrolysis and co-pyrolysis of typical medical waste. For the FWO method, is plotted against 1/T, and the is obtained from the slope of the fitted straight line. For the KAS method, is plotted against 1/T, and the is calculated using the fitted slope . For the Friedman differential method, is plotted against 1/T, and the is determined from the fitted slope. On this basis, the Criado master plot method was used to compare the experimental master plot with the theoretical master plots corresponding to various solid-state reaction mechanisms, so as to deduce the most probable reaction mechanism of pyrolysis and solve the pre-exponential factor .
3.2.1. Kinetic Analysis of Individual Pyrolysis of Typical Medical Waste
Kinetic analysis on the individual pyrolysis of four medical waste fractions (swab stick, plastics, textiles and paper) was performed using thermogravimetric measurements. The experiments were conducted from room temperature (25 °C) to 800 °C at heating rates of 10, 20, 30 and 40 °C/min.
- (a)
- Kin etic characteristic analysis of individual pyrolysis of swab stick
Thermogravimetric experiments of swab sticks were carried out using a thermogravimetric analyzer. The KAS, FWO and Friedman methods were adopted to calculate the and of the pyrolysis reaction. Figure 5 presents the results obtained from the thermogravimetric tests of swab stick.
Figure 5.
Determination of for swab sticks using the KAS, FWO and Friedman methods.
Figure 5a–c shows the fitted lines corresponding to different conversions (α) of swab sticks obtained from the KAS, FWO and Friedman models, respectively, and Figure 5d presents the variation of the activation energy calculated by the three methods as a function of conversion (α).
It can be observed from Figure 5 that the experimental data points are closely distributed around the fitted dashed lines when the conversion α ranges from 0.1 to 0.8. The minimum values of the coefficient of determination for the KAS, FWO and Friedman methods are 0.972, 0.976 and 0.961, respectively, indicating an overall good quality of linear fitting. However, obvious deviations of data points occur at high conversions. This phenomenon suggests that the reaction mechanism maintains favorable continuity from the early to middle stage of pyrolysis. In the late pyrolysis stage, massive release of volatiles leads to the reforming, cross-linking and secondary cracking of residual char. The shift in reaction pathways breaks the single volatilization-decomposition mechanism, which consequently induces drastic fluctuations in the apparent activation energy.
As can be seen from the variation of the apparent activation energy with conversion α in Figure 5d, the results obtained from the KAS, FWO and Friedman methods are in good agreement with each other. In the conversion range of 0.1–0.8, the apparent activation energy falls within 110–140 kJ/mol and exhibits a slowly increasing trend with rising conversion. This stage mainly corresponds to the sequential pyrolysis of hemicellulose and cellulose in swab sticks, during which glycosidic bonds are cleaved and macromolecules are depolymerized with the release of volatiles. Meanwhile, lignin undergoes partial decomposition with the cleavage of side chains on the benzene rings, which leads to a gradual increase in the apparent activation energy as the reaction proceeds.
When α > 0.8, the apparent activation energies calculated by the three methods rise rapidly. At this stage, cellulose and hemicellulose have been almost completely pyrolyzed, and the reaction shifts to the reforming, aromatization and secondary cracking of the lignin residual char skeleton. Breaking the stable aromatic ring structure is required, which markedly increases the reaction energy barrier. The increase in activation energy obtained by the Friedman differential method at high conversions is much larger than the increases obtained by the KAS and FWO methods. Due to the inherent error of the differential algorithm, the Friedman results for α > 0.8 are only for reference.
To identify the kinetic model governing the pyrolysis process of swab sticks, the Criado master plot method was adopted in this study. On the basis of the derived from the model-free isoconversional method, normalized experimental master plots were constructed and compared with various theoretical mechanism master plots to screen the reaction model with the best matching performance. Figure 6 shows the comparison between normalized experimental master plots of cotton swab stick pyrolysis under different heating rates and various theoretical mechanism master plots obtained via the Criado method.
Figure 6.
Comparison between normalized experimental and theoretical master plots for swab sticks.
It can be seen from Figure 6 that swab sticks are mainly composed of cellulose, hemicellulose and lignin. The pyrolysis temperature ranges of these three components overlap with each other, and the pyrolysis process is a parallel coupled multi-component reaction, which fails to satisfy the basic assumption of a single-step solid-state reaction underlying the Criado master plot method. Accordingly, the experimental master plots cannot be perfectly matched with any standard mechanism function. To avoid curve distortion caused by secondary reactions such as cross-linking and carbonization of residual char at high conversions, α = 0.7 was selected as the cutoff point for discussion.
Within the valid range of α < 0.7, the overall trends of experimental master plots of swab sticks at different heating rates show good consistency, and the variation in heating rate only leads to slight shifts of the curves. At α = 0.1–0.5, hemicellulose decomposes preferentially while cellulose gradually participates in pyrolysis, and the experimental master plots lie between the nth-order reaction and diffusion-type mechanism curves. In the main mass-loss range of α = 0.5–0.7, cellulose undergoes extensive cracking, and lignin degrades continuously over a wide temperature range. Due to the coupling of multiple reactions, although the overall profile of the experimental master plot is closest to the first-order reaction model F1 (An), obvious deviations still exist. Such deviations originate from the superposition effect of parallel pyrolysis of hemicellulose, cellulose and lignin in swab sticks. The obtained F1 (An) merely represents the apparent equivalent mechanism of cotton swab stick pyrolysis rather than the intrinsic reaction mechanism of a single component. When α > 0.7, cellulose and hemicellulose are almost completely pyrolyzed. The residues are dominated by slowly degraded lignin products and pyrolytic char. Further secondary reactions, including aromatization and cross-linking, occur on residual char, violating the fundamental premise of the Criado master plot method. Hence, kinetic mechanism identification cannot be performed in this conversion range. In summary, as a multi-component composite biomass, only the equivalent apparent mechanism can be obtained for swab sticks, and its kinetic parameters represent the weighted average contributions from the pyrolysis of individual components.
Based on the kinetic characterization of swab stick pyrolysis using the KAS method, the , and of the sample at various are summarized in Table 6.
Table 6.
, and of swab stick pyrolysis at various using the KAS method.
According to the and r at different for swab stick pyrolysis obtained by the KAS method in Table 6, the 95% confidence intervals and coefficient of determination R2 of the regression equations for different conversion ranges can be acquired via segmented fitting and global fitting, as listed in Table 7.
Table 7.
Linear regression equations between and , 95% confidence intervals and R2 for swab stick.
- (b)
- Kinetic characteristic analysis of individual pyrolysis of PP
Thermogravimetric experiments of PP were carried out using a thermogravimetric analyzer. The KAS, FWO and Friedman methods were adopted to calculate the and of the pyrolysis reaction. Figure 7 presents the results obtained from the thermogravimetric tests of PP.
Figure 7.
Determination of for PP by KAS, FWO and Friedman methods.
Figure 7a–c shows the fitted lines corresponding to different conversions (α) of PP obtained from the KAS, FWO and Friedman models, respectively, and Figure 5d presents the variation of the activation energy calculated by the three methods as a function of conversion (α).
It can be observed from Figure 7a–c that when the conversion α ranges from 0.1 to 0.9, the discrete fitting points at each conversion are well distributed around the fitted dashed lines, indicating favorable linear fitting quality. The minimum values of the coefficient of determination R2 for the three methods are 0.964, 0.967 and 0.956, respectively. This demonstrates that the KAS, FWO and Friedman models exhibit good applicability for solving kinetic parameters within this conversion range. The fitted straight lines for different conversions are parallel to one another and shift sequentially along the abscissa (1/T). As the conversion α increases, the fitted lines move toward lower 1/T values (i.e., higher temperature), which is consistent with the pyrolysis principle that the cleavage of polypropylene macromolecular chains requires elevated reaction temperatures. The Friedman method shows relatively poorer linear fitting performance, because the differential method is more sensitive to experimental noise, which is an inherent characteristic of the Friedman approach.
Figure 7d presents the variation of apparent activation energy with conversion calculated by the three methods. The apparent activation energy values obtained by KAS and FWO are generally close to each other and share highly consistent trends. The apparent activation energy of PP pyrolysis ranges from 205 to 239 kJ/mol. In the range of α = 0.1–0.6, the activation energy fluctuates slightly and remains at a high level of 230–239 kJ/mol. This stage corresponds to the random scission of polypropylene main chains. A large number of C–C bonds are cleaved, and macromolecules gradually decompose into small-molecule hydrocarbon volatiles. This is the primary thermal decomposition stage of PP, which requires overcoming high bond dissociation energy. When α > 0.6, the activation energies from KAS and FWO decrease continuously and drop to approximately 205 kJ/mol at α = 0.9. Numerous small-molecule free radicals are formed in the system at the late pyrolysis stage, and chain scission reactions dominate, reducing the required reaction energy barrier. The apparent activation energy obtained by the Friedman method is generally lower than those from KAS and FWO. The activation energy is about 224 kJ/mol at α = 0.1, and stabilizes at 202–205 kJ/mol for α = 0.2–0.6. It decreases rapidly after α > 0.6 and reaches 170 kJ/mol at α = 0.9.
Combining the results from the three isoconversional methods, the two integral methods KAS and FWO are less susceptible to experimental noise and yield more reliable results. Hence, the results of KAS and FWO are preferentially adopted in the subsequent kinetic parameter analysis. The overall apparent activation energy of PP pyrolysis remains at a relatively high level, indicating that the pyrolysis of pure PP requires greater energy input. In addition, the range rate of the activation energy for PP pyrolysis is 14.23%, less than 15%, so the pyrolysis can be regarded as a single reaction. This provides a baseline reference for analyzing the regulation of PP activation energy and synergistic effects by other components during the co-pyrolysis of mixed medical waste.
To identify the kinetic model governing the PP pyrolysis process, the Criado master plot method was used in this study. Based on the obtained from model-free isoconversional methods (FWO/KAS/Friedman), normalized experimental master plots were constructed and compared with various theoretical mechanism master plots to select the best-matched reaction model. Figure 8 shows the comparison of normalized experimental master plots and different theoretical mechanism master plots obtained via the Criado method for PP pyrolysis at heating rates of 10, 20, 30 and 40 °C/min.
Figure 8.
Comparison between normalized experimental and theoretical master plots for PP pyrolysis.
It can be observed from Figure 8 that the experimental master plots of PP at four heating rates overlap well, indicating that the heating rate exerts a limited effect on the type of PP pyrolysis reaction mechanism. The kinetic mechanism does not undergo essential changes with heating rate and only exhibits slight curve shifts. The experimental master plot of PP fits best with the theoretical curve of F1(An) (nth-order reaction, n ≈ 1, first-order reaction). This phenomenon originates from the fact that PP is a polyolefin polymer whose pyrolysis is dominated by free-radical reactions via random chain scission. This finding is also consistent with the characteristic single symmetric mass-loss peak observed in the DTG curve of PP thermogravimetric analysis. The increase in heating rate only induces minor shifts of data points and cannot alter the controlling mechanism of PP pyrolysis. The model deviation at high conversions is an inherent phenomenon caused by free-radical chain termination and nearly complete vaporization of materials in the late-stage pyrolysis of polymers.
From the kinetic characterization of PP pyrolysis, the , and of the sample at various using the KAS method are summarized in Table 8.
Table 8.
Eα, Aα and f(α) of PP pyrolysis at various α using the KAS method.
According to the Eα and Aα at different α for PP pyrolysis obtained by the KAS method in Table 8, the 95% confidence intervals and coefficient of determination R2 of the regression equations for different conversion ranges can be acquired via segmented fitting and global fitting, as listed in Table 9.
Table 9.
Linear regression equations between Eα and Aα, 95% confidence intervals and R2 for PP.
- (c)
- Kinetic characteristic analysis of individual pyrolysis of textile
Thermogravimetric experiments on textiles were carried out using a thermogravimetric analyzer. The KAS, FWO and Friedman methods were adopted to calculate the Ea and Aα of the pyrolysis reaction. Figure 9 presents the results obtained from the thermogravimetric tests of textiles.
Figure 9.
Determination of for textiles by the KAS, FWO and Friedman methods.
Figure 9a–c shows the fitted lines corresponding to different conversions (α) of textiles obtained using the KAS, FWO and Friedman models, respectively, and Figure 9d presents the variation of the activation energy calculated by the three methods as a function of conversion (α).
It can be seen from Figure 9a,b that, for the KAS and FWO integral methods within the conversion range of α = 0.1–0.9, the experimental points at each conversion are distributed around the fitted dashed lines. The minimum coefficient of determination R2 for both methods is 0.908, showing good linear fitting performance, which demonstrates that these two integral models are suitable for describing the pyrolysis of cellulose in textiles. During cellulose pyrolysis, low conversion corresponds to the cleavage of glycosidic bonds, while high conversion involves deep cracking of macromolecules and carbonization reactions that require higher reaction temperatures. The shift rule of the fitted lines agrees well with the cellulose pyrolysis mechanism. For the Friedman differential method results shown in Figure 9c, R2 = 0.864 at α = 0.9, and the minimum R2 value reaches 0.947 excluding this point.
As shown in the activation energy variation curve in Figure 9d, the results calculated by the KAS and FWO methods exhibit good consistency in trends, and the apparent activation energy obtained by FWO is slightly higher than that obtained by KAS. In the range of α = 0.1–0.3, the activation energy increases slightly. The activation energy of FWO rises from approximately 133 kJ/mol to a peak of 138 kJ/mol, while the peak value from KAS is about 134 kJ/mol. This stage is dominated by the cleavage of glycosidic bonds in cellulose macromolecules. Depolymerization occurs to form volatile intermediates such as levoglucosan, and energy is required to overcome the bond energy of glycosidic bonds. When α > 0.3, the activation energies of KAS and FWO decrease slowly and continuously, reaching 121 kJ/mol for KAS and 126 kJ/mol for FWO at α = 0.9. In the middle and late pyrolysis stages, abundant active radicals accumulate in the system to promote cracking reactions, accompanied by the release of small-molecule volatiles and the formation of char skeleton, which gradually reduces the reaction energy barrier.
The apparent activation energy calculated by the Friedman differential method is obviously lower than those obtained using the two integral methods. The activation energy remains at 130–136 kJ/mol for α = 0.1–0.2, which is close to the results obtained through the integral methods. It decreases rapidly when α > 0.25, stabilizes near 110 kJ/mol in the range of α = 0.5–0.7, and rises slightly in the late stage. The differential method is susceptible to interference from the experimental baseline and differential noise of thermogravimetric curves, leading to underestimated activation energy at moderate and high conversions.
The apparent activation energy of textile pyrolysis is relatively low and mainly falls within the range of 120–140 kJ/mol, because cellulose preferentially cleaves glycosidic bonds with relatively lower bond energy. Meanwhile, the range rate of activation energy for textiles is 9.99%, less than 15%, so its pyrolysis can be regarded as a single reaction. This set of kinetic results can serve as the baseline parameters for the cellulose component in the subsequent co-pyrolysis system to evaluate the synergistic or inhibitory interactions during co-pyrolysis.
To identify the kinetic model governing the pyrolysis process of textiles, the Criado master plot method was adopted in this study. On the basis of the apparent activation energy obtained using model-free isoconversional methods, normalized experimental master plots were constructed and compared with various theoretical mechanism master plots to screen the best-matched reaction model. Figure 10 shows the comparison between normalized experimental master plots and theoretical mechanism master plots of textile pyrolysis obtained via the Criado method at four heating rates of 10, 20, 30 and 40 °C/min.
Figure 10.
Comparison between normalized experimental and theoretical master plots for textiles.
By comparing the experimental data in Figure 10 with the theoretical curves of various solid-state reaction mechanisms, it can be seen that the three-dimensional diffusion-controlled mechanism ZH (Zhuravlev–Lesovich) can adequately describe the mechanism controlling the kinetics of textile pyrolysis.
The experimental master plots of textiles at four heating rates overlap well overall, and the heating rate only induces slight shifts of the curves, indicating that the heating rate cannot alter the dominant kinetic mechanism of textile pyrolysis. The profile of the experimental master plots shows the best agreement with the theoretical curve of the ZH three-dimensional diffusion model. Textiles are mainly composed of cellulose. During pyrolysis, the molecular chains of cellulose are cleaved, and a large number of volatile small-molecule products are generated inside solid particles. The diffusion and mass transfer of volatiles outward becomes a critical limiting step at this stage, which is consistent with the physical essence of the ZH three-dimensional diffusion model.
From the kinetic characterization of textile pyrolysis, the , and of the sample at various using the KAS method are summarized in Table 10.
Table 10.
, and of textile pyrolysis at various via the KAS method.
According to the and at different for textile pyrolysis obtained by the KAS method in Table 10, the 95% confidence intervals and coefficient of determination R2 of the regression equations for different conversion ranges can be acquired via segmented fitting and global fitting, as listed in Table 11.
Table 11.
Linear regression equations between and , 95% confidence intervals and R2 for textiles.
- (d)
- Kinetic characteristic analysis of individual pyrolysis of paper
Thermogravimetric experiments on paper were carried out using a thermogravimetric analyzer. The KAS, FWO and Friedman methods were adopted to calculate the and of the pyrolysis reaction. Figure 11 presents the results obtained from the thermogravimetric tests of paper.
Figure 11.
Determination of for paper by the KAS, FWO and Friedman methods.
Figure 11a–c shows the fitted lines corresponding to different conversions (α) of paper obtained from the KAS, FWO and Friedman models, respectively, and Figure 11d presents the variation of the activation energy calculated by the three methods as a function of conversion (α).
It can be seen from Figure 11a,b that within the conversion range of α = 0.9, the experimental points for the KAS and FWO integral methods are distributed around the fitted dashed lines, and the minimum values of coefficient of determination R2 are 0.989 and 0.990, respectively, showing favorable linear fitting performance. Nevertheless, the data point at a high conversion of α = 0.9 clearly deviates from the main fitting cluster and shifts substantially toward lower abscissa (1/T) values. This phenomenon indicates that the reaction mechanism changes markedly in the late pyrolysis stage of paper, and the pyrolysis process no longer follows the previous reaction pathway. According to the mass-loss characteristics of the sample, low-to-moderate conversions are dominated by the cleavage of glycosidic bonds, depolymerization and volatilization of cellulose and hemicellulose. When α > 0.7, volatile components are almost completely pyrolyzed, and secondary cracking of residual char and rearrangement reactions of the carbon skeleton become dominant. Such a transformation in the reaction mechanism results in the separation of fitted lines at high conversions from those at moderate and low conversions.
Figure 11c shows the fitting results of the Friedman differential method. The data dispersion of the Friedman method is also relatively high at α = 0.7–0.9. Excluding this range, the minimum R2 value is 0.967, which further verifies that the differential algorithm is more sensitive to the noise of thermogravimetric curves and residual char reactions in the late pyrolysis stage.
According to the activation energy evolution curve in Figure 11d, the results from the two integral methods KAS and FWO share consistent variation trends. Within α = 0.1–0.7, the apparent activation energy remains at 125–149 kJ/mol, with mild fluctuations. This range corresponds to the main pyrolysis region of cellulose and hemicellulose in paper, dominated by glycosidic bond cleavage and depolymerization to form volatiles. The magnitude of activation energy is comparable to that of cellulose pyrolysis, and the preferential decomposition of hemicellulose slightly alters the overall energy barrier. After α > 0.7, the activation energy oscillates drastically and exhibits a peak–valley–peak mutation feature: the activation energy drops rapidly to an extremely low value near α = 0.75, then rises sharply to form a peak and falls again at α = 0.9. This behavior arises from the massive release of volatiles in the late pyrolysis stage. Reactions including rearrangement, cross-linking and secondary cracking occur on residual char, the reaction pathway transforms, and the system no longer follows a single volatilization-decomposition reaction, leading to violent fluctuations in activation energy.
The obtained using the Friedman differential method is generally consistent with that obtained using the integral methods at α = 0.1–0.3. The activation energy decreases continuously for α > 0.3 and reaches a minimum value at α = 0.6–0.7. In the high-conversion range, the activation energy from Friedman increases dramatically and is markedly higher than the results of KAS and FWO. The differential method is strongly affected by baseline drift at the tail of DTG curves, and the calculation error is amplified at high conversions.
To identify the kinetic model governing the pyrolysis process of paper, the Criado master plot method was adopted in this study. Based on the obtained using the model-free isoconversional methods, normalized experimental master plots were constructed and compared with various theoretical mechanism master plots to select the best-matched reaction model. Figure 12 presents the comparison of normalized experimental master plots and theoretical mechanism master plots for paper pyrolysis obtained via the Criado method at four heating rates of 10, 20, 30 and 40 °C/min.
Figure 12.
Comparison between normalized experimental and theoretical master plots for paper.
As shown in Figure 12, to avoid curve distortion induced by lignin pyrolysis and secondary reactions of residual char in paper at high conversions (which violates the assumption of single-step solid-state reaction required by the Criado method), α < 0.7 was selected as the valid calculation range for mechanism identification, and α was renormalized accordingly. Within the core mass-loss range, the experimental curves at heating rates of 20–40 °C/min exhibit essentially consistent trends with only slight curve shifts caused by heating rate. The experimental curves are in good agreement with the F1(An) first-order reaction model. The experimental curve shifts upward at 10 °C/min, showing the mass-transfer-limited characteristics of three-dimensional diffusion for D3 and R3, which is consistent with thermogravimetric experimental results. Mechanisms including D1, D2, R2, G–B and ZH deviate markedly from the experimental curves and are therefore excluded. In summary, the most probable mechanism for the main mass-loss stage of paper pyrolysis is the F1 first-order chemical reaction, while an additional three-dimensional diffusion mass-transfer effect exists under low heating rates.
From the kinetic characterization of paper pyrolysis, the , and of the sample at various using the KAS method are summarized in Table 12.
Table 12.
, and of paper pyrolysis at various via the KAS method.
According to the and at different for paper pyrolysis obtained by the KAS method in Table 12, the 95% confidence intervals and coefficient of determination R2 of the regression equations for different conversion ranges can be acquired via segmented fitting and global fitting, as listed in Table 13.
Table 13.
Linear regression equations between and , 95% confidence intervals and R2 for paper.
- (e)
- Kinetic characteristic analysis of co-pyrolysis of mixed medical waste
Thermogravimetric experiments of mixed medical waste were carried out using a thermogravimetric analyzer. The KAS, FWO and Friedman methods were adopted to calculate the and of the pyrolysis reaction. Figure 13 presents the results obtained from the thermogravimetric tests of mixed medical waste.
Figure 13.
Determination of for mixed medical waste using the KAS, FWO and Friedman methods.
Figure 13a–c shows the fitted lines corresponding to different conversions (α) of mixed medical waste obtained using the KAS, FWO and Friedman models, respectively, and Figure 13d presents the variation of the activation energy calculated by the three methods as a function of conversion (α).
Figure 13a–c presents the fitted straight lines for the three isoconversional methods of KAS, FWO and Friedman, respectively. The experimental data points at different conversion α values fit well with the fitted lines, demonstrating the reliability of solving kinetic parameters using these three isoconversional models. The fitted lines for different conversions are separated from one another, indicating that the apparent activation energy of the mixed sample during co-pyrolysis varies significantly with conversion, which is a typical characteristic of complex multi-step reactions.
Figure 13d shows the variation of Eα with conversion α obtained by the three methods. The KAS and FWO integral methods yield results with generally consistent trends and close numerical values. The results from the Friedman differential method fluctuate more drastically, yet its overall evolution trend agrees with those of the two integral methods.
Within the low-to-moderate conversion range of α = 0.1–0.5, the apparent activation energy of the mixed sample stabilizes at 110–150 kJ/mol. This stage is dominated by thermal decomposition of cellulose and hemicellulose in textile, paper and cotton swabs, with the gradual initiation of PP pyrolysis. Independent pyrolysis of individual components and inter-component interactions coexist, and bond cleavage dominates the reactions with relatively low activation energy. The activation energy rises sharply in α = 0.5–0.7 and peaks at α > 0.7, corresponding to the core co-pyrolysis stage. The major decomposition of cellulose is nearly complete, PP undergoes extensive cracking, and lignin from cotton swabs participates in the reactions. Complex free-radical interactions between plastic and biomass char produce prominent co-pyrolysis coupling effects and raise the reaction energy barrier. The Friedman differential method shows larger fluctuations here owing to its higher sensitivity to TGA noise. When α > 0.7, activation energy gradually declines from the peak. Most pyrolyzable materials have been consumed, and residual lignin and char undergo slow cracking and secondary aromatization, lowering the energy barrier. Compared with the results of the four individual components, the activation energy of the mixture is not a simple weighted superposition, demonstrating remarkable inter-component interactions during co-pyrolysis of PP, textile, paper and cotton swabs, which modify the overall energy barrier of the system. The KAS and FWO integral methods are less susceptible to experimental noise and provide more stable fitting than the Friedman differential method; thus, KAS and FWO results serve as the primary basis for subsequent kinetic analysis.
To identify the kinetic model governing the pyrolysis of mixed medical waste, the Criado master plot method was used in this study. Normalized experimental master plots were constructed based on the apparent activation energy obtained using model-free isoconversional methods and compared with various theoretical mechanism curves to select the best-matched reaction model. Figure 14 presents the comparison between normalized experimental master plots and the full set of theoretical mechanism curves for mixed medical waste pyrolysis obtained by the Criado method at four heating rates of 10, 20, 30 and 40 °C/min.
Figure 14.
Comparison of normalized experimental master plots with various theoretical mechanism curves for the pyrolysis of mixed medical waste.
As shown in Figure 14, the overall evolution trends of experimental master plots at four heating rates are consistent, indicating that heating rate does not alter the pyrolysis reaction pathway of the mixed system. Distinct from the unimodal master plots of single-component samples, the normalized master plot of the mixed sample exhibits a bimodal structure with peaks at α = 0.35–0.40 and α = 0.60, respectively. This bimodal feature reveals that the co-pyrolysis of the PP–textile–paper–cotton swab mixture does not follow a single-step reaction mechanism; instead, it is a complex reaction system with parallel and sequential coupling of multiple components. The first peak mainly originates from the thermal degradation of biomass components, i.e., cellulose and hemicellulose in textile, paper and cotton swabs. The second peak emerging after the valley corresponds primarily to intensive thermal cracking of polypropylene, superimposed by co-pyrolysis interactions such as radical transfer, hydrogen donation and hydrogen abstraction between biomass and plastic.
Comparison between the experimental master plots and standard solid-state reaction mechanism functions shows that no single-step mechanism function can achieve satisfactory agreement with the experimental results over the entire conversion range. This finding further confirms that the co-pyrolysis of mixed medical waste arises from the coupling of multiple physicochemical processes, including cracking of biomass macromolecules, scission of plastic molecular chains, and radical interactions at component interfaces. Consequently, conventional single-step solid-state reaction mechanisms cannot describe the whole pyrolysis process.
It can be observed from Figure 14 that the co-pyrolysis of mixed medical waste exhibits multi-stage reaction characteristics. Accordingly, the conversion is divided into two ranges, α ≤ 0.65 and α ≥ 0.65, for separate mechanism identification to more accurately reveal the evolution of reaction mechanisms during co-pyrolysis, as shown in Figure 15a,b.
Figure 15.
Comparison of normalized experimental master plots and various theoretical mechanism curves for mixed medical waste at different pyrolysis stages.
As observed from Figure 14, the co-pyrolysis of mixed medical waste presents multi-stage reaction characteristics. Therefore, the conversion is divided into two intervals, α ≤ 0.65 andα ≥ 0.65, for separate mechanism identification, to more accurately reveal the evolution of reaction mechanisms during co-pyrolysis, as illustrated in Figure 15a,b.
As shown in Figure 15, for α ≤ 0.325, the experimental curve achieves the best agreement with the three-dimensional diffusion model theoretical master plot. This stage is dominated by the pyrolysis of cellulose in textile and paper, and the reaction is mainly controlled by the nucleation-growth mechanism.
When the conversion increases to 0.325 ≤ α ≤ 0.65, the experimental curve approaches the F1(An) first-order reaction model. Within this range, PP undergoes initial chain scission and produces abundant volatile radical intermediates, and inter-component co-pyrolysis interactions are governed primarily by the first-order reaction. Such mechanism transition from three-dimensional diffusion model to F1(An) directly reflects the evolution of reaction pathway within α ≤ 0.65, where the dominant process shifts from biomass pyrolysis to coupled co-pyrolysis of the mixture.
At high conversions of (α ≥ 0.65) (Figure 15b), cellulose and hemicellulose in the mixture are fully decomposed, and the major cracking of PP gradually proceeds. Meanwhile, slow decomposition of lignin from cotton swabs, secondary cracking of heavy tar, as well as aromatization and cross-linking of pyrolytic residual char occur. The experimental master plots in this range generally approach the ZH three-dimensional diffusion theoretical model, indicating a second transformation in the reaction control mechanism. At this stage, macromolecular cracking products need to diffuse outward through the well-developed pore structure inside solid residual char. The diffusion mass-transfer resistance of volatiles within particles becomes the rate-limiting step, which conforms to the physical essence of the ZH three-dimensional diffusion model.
From the kinetic characterization of mixed medical waste pyrolysis, the , and of the sample at various using the KAS method are summarized in Table 14.
Table 14.
, and of mixed medical waste pyrolysis at various via the KAS method.
According to the and at different for mixed medical waste pyrolysis obtained by the KAS method in Table 14, the 95% confidence intervals and coefficient of determination R2 of the regression equations for different conversion ranges can be acquired via segmented fitting and global fitting, as listed in Table 15.
Table 15.
Linear regression equations between and , 95% confidence intervals and R2 for mixed medical waste.
3.2.2. Comparison Between Individual Component Pyrolysis and Co-Pyrolysis of Mixed Materials
Figure 16 shows the apparent activation energies for separate pyrolysis of PP, textile, paper and cotton swabs, as well as the evolution of experimental co-pyrolysis activation energy and theoretically weighted activation energy of the four-component mixed medical waste sample with conversion α.
Figure 16.
Comparison of activation energy between individual pyrolysis and co-pyrolysis.
The theoretical activation energy of the mixture in Figure 16 is calculated by weighting the activation energies of individual components according to their mass fractions, which represents the ideal kinetic parameter under the assumption that components undergo independent pyrolysis without mutual interactions. The experimental activation energy of the mixture is derived from co-pyrolysis data using the KAS method. The deviation between experimental values and theoretical weighted values can be used to qualitatively identify synergistic or inhibitory interactions during co-pyrolysis.
It can be seen that the experimental activation energy of mixed medical waste is slightly lower than the theoretical weighted value within the low conversion range of α = 0.1–0.4. This stage is dominated by thermal degradation of biomass components; macromolecular cracking occurs in textile, paper and cotton swabs, while PP has not yet undergone large-scale pyrolysis. Inter-component interactions are weak in this interval, and each component is mainly pyrolyzed independently. Thus, the experimental activation energy is close to the theoretical value, with minor discrepancies.
Within the conversion range of α = 0.5–0.9, the theoretically weighted activation energy of the mixed sample decreases markedly, while the experimental activation energy continues to rise. The experimental values are markedly higher than the theoretical weighted values, indicating an inhibitory effect. At this stage, biomass components are gradually consumed and PP begins to pyrolyze. Radical intermediates generated from biomass pyrolysis interact with plastic macromolecules and modify the reaction pathway, leading to a higher reaction energy barrier than the theoretical prediction without inter-component interactions.
For α > 0.6, the experimental activation energy of the mixture rises rapidly and reaches a peak near α = 0.7. The theoretically weighted activation energy also increases sharply, yet the experimental values remain higher, which further highlights the inhibitory effect. This interval corresponds to the core co-pyrolysis stage of the mixed system. Intensive thermal cracking of PP occurs with massive scission of macromolecular chains. Meanwhile, complex reactions such as hydrogen abstraction and radical recombination take place between biomass char, small-molecule radicals and PP-derived radicals. Inter-component interactions are fully activated and raise the overall reaction energy barrier. This peak in activation energy is consistent with the position of the second reaction peak obtained from Criado master plots. It dynamically verifies the existence of chemical interactions between components during co-pyrolysis, rather than merely simple physical mixing of individual constituents.
As conversion further increases to α > 0.75, most decomposable substances have completed pyrolysis. The residues mainly consist of lignin and pyrolytic char, the inter-component interactions weaken, and the kinetic behavior reverts to that of char pyrolysis of individual components.
The comparison demonstrates that the apparent activation energy of the mixed sample during co-pyrolysis cannot be reproduced by mass-weighted results of single components over the whole conversion range. This directly proves remarkable inter-component interactions in the co-pyrolysis of PP, textile, paper and cotton swabs. Therefore, the pyrolysis of mixed medical waste cannot be characterized simply using weighted kinetic parameters of individual constituents.
3.3. Thermodynamic Analysis of Medical Waste Pyrolysis
Thermodynamic analysis of medical waste pyrolysis is performed by calculating enthalpy change (ΔH), entropy change (ΔS) and Gibbs free energy change (ΔG), to provide theoretical support for practical pyrolysis process optimization. The enthalpy change characterizes the energy requirement of reactions and guides the selection of heating strategies in practical production. The entropy change reflects the variation in system disorder, which can predict the reaction tendency combined with temperature. Gibbs free energy change represents the spontaneity and feasibility of reactions, and helps identify the optimal temperature range to balance conversion efficiency and energy consumption. Hence, thermodynamic analysis constitutes an essential part of pyrolysis research.
The best fitting performance is achieved at a heating rate of 10 °C/min, which mitigates the influence of overlapping reactions and other factors on pyrolysis. Accordingly, the pyrolysis experimental data obtained at 10 °C/min are adopted in this study. Equations (12)–(14) are used to calculate thermodynamic parameters including enthalpy change, Gibbs free energy change and entropy change for individual and co-pyrolysis of medical waste for thermodynamic analysis.
∆H indicates an endothermic reaction. ΔH > 0 indicates an endothermic reaction, and ΔH < 0 indicates an exothermic reaction. Since external energy is required to break chemical bonds during pyrolysis, ∆H generally takes positive values. Figure 17 shows the comparison of enthalpy change between separate pyrolysis of four types of medical waste (cotton swabs, plastic, textile and paper) and co-pyrolysis of their mixture.
Figure 17.
Comparison of ΔH for medical waste during individual pyrolysis and co-pyrolysis.
Gibbs free energy change ΔG is mainly used to judge the spontaneity of reactions under isothermal and isobaric conditions. When ΔG < 0, the reaction proceeds spontaneously; when ΔG = 0, the reaction reaches equilibrium; when ΔG > 0, the reaction cannot occur spontaneously and requires additional external energy input. Figure 18 presents the comparison of Gibbs free energy change for separate pyrolysis of four kinds of medical waste (cotton swabs, plastic, textile and paper) and their co-pyrolysis.
Figure 18.
Comparison of ΔG for medical waste during individual pyrolysis and co-pyrolysis.
As can be observed from Figure 18, the ΔG of individual PP remains stable at approximately 195–201 kJ/mol throughout the whole conversion range, showing only a slight decreasing trend. The ΔG of the textile decreases steadily from about 195 kJ/mol at α = 0.1 to roughly 170 kJ/mol at α = 0.9. Paper exhibits a pronounced jump at low conversion, rising from approximately 130 kJ/mol at α = 0.1 to about 162 kJ/mol and then leveling off until α ≈ 0.8, after which it climbs sharply to nearly 195 kJ/mol at α = 0.9. The swab stick shows a gradual, monotonic increase from about 155 to 173 kJ/mol. The abnormal low initial value of paper and its sharp upturn at high conversion, together with the persistent rise of the swab stick, can be attributed to complex secondary reactions involving the solid residual constituents.
MMW exhibits distinct thermodynamic behaviors that differ from any single component. At α < 0.3, its ΔG lies between those of PP and textile, approaching the PP level. With a further increase in conversion, however, the ΔG of the mixture drops sharply to about 166 kJ/mol at α ≈ 0.35 and remains nearly constant at this level—close to that of paper—until α ≈ 0.6. When α > 0.6, the ΔG of the mixture rises abruptly, reaching approximately 198–200 kJ/mol at α ≈ 0.7–0.85, which is slightly above the PP curve and clearly exceeds the values for the textile, paper and swab stick. This pronounced later-stage rise indicates that the co-pyrolysis reaction becomes more non-spontaneous as conversion proceeds, requiring higher energy input.
Entropy change ΔS is a thermodynamic parameter describing the variation in system disorder, which reflects the evolution of molecular degrees of freedom or randomness during the reaction. ΔS > 0 means increased molecular mobility and degrees of freedom, while ΔS < 0 indicates a more ordered molecular arrangement. Figure 19 presents the comparison of entropy change for separate pyrolysis of four typical medical wastes (plastic, cotton swabs, textile and paper) and their co-pyrolysis.
Figure 19.
Comparison of ΔS between individual pyrolysis and co-pyrolysis.
As shown in Figure 19, the ΔS of PP remains slightly above zero and decreases slowly and slightly with increasing conversion, showing a mild variation in system disorder. The ΔS of textile and cotton swabs remains negative throughout the pyrolysis, indicating that the pyrolysis of cellulose-rich materials tends to form solid residues with higher ordering. Paper exhibits high entropy at low conversions and violent fluctuations at high conversions, which mainly arise from the strong disturbance of system disorder caused by the competition between secondary cracking and polycondensation of residual constituents in the later stage.
The ΔS of mixed medical waste shows obvious stage-dependent characteristics. At α < 0.65, ΔS remains stably negative. Within 0.65 < α < 0.75, ΔS decreases markedly and forms an obvious trough, revealing intensive carbonization via polycondensation in this co-pyrolysis interval, which greatly increases the ordering degree of the system. Afterwards, the entropy value rises again. The abrupt change in entropy of mixed medical waste indicates obvious chemical interactions between components and altered reaction pathways. It further demonstrates that the system involves multi-step coupled reactions and cannot be described by a single mechanism function, which is consistent with the conclusions from Criado master plots.
Based on the above results, the activation energy (), natural logarithm of the pre-exponential factor (), characteristic temperature (or , K), enthalpy change (), Gibbs free energy change (), and entropy change () at various conversion rates () and a heating rate of 10 °C/min for each sample, derived from the KAS method parameters, are summarized in Table 16, Table 17, Table 18, Table 19 and Table 20.
Table 16.
Summary of thermodynamic and kinetic parameters of swab sticks.
Table 17.
Summary of thermodynamic and kinetic parameters of PP.
Table 18.
Summary of thermodynamic and kinetic parameters of textiles.
Table 19.
Summary of thermodynamic and kinetic parameters of paper.
Table 20.
Summary of thermodynamic and kinetic parameters of mixed medical waste.
As shown in Table 20, the DTG curve of mixed waste exhibits two peaks, corresponding to two peak temperatures. In this study, a single Tmax is used to calculate and , while different peak temperatures are adopted for different conversion ranges. When α ≤ 0.65, the first peak temperature Tmax1 = 361.0 °C is used for calculation; when α = 0.7–0.9, the second peak temperature Tmax2 = 488.0 °C is adopted.
4. Conclusions
In this study, four typical medical waste components (cotton swabs, paper, textiles, and plastics) were subjected to individual and co-pyrolysis thermogravimetric tests. The pyrolysis characteristics and reaction mechanisms were systematically investigated using model-free kinetic methods (Friedman, KAS, FWO) and the Criado master plot method. Meanwhile, the thermodynamic evolution and inter-component interaction mechanisms during pyrolysis were clarified. The main conclusions are summarized as follows:
- (1)
- The four types of medical waste possess distinct pyrolysis behaviors. Biomass medical waste (cotton swabs, paper, and textiles) is characterized by wide pyrolysis temperature ranges and high char yields via stepwise cellulose and hemicellulose cracking, while PP presents concentrated and thorough pyrolysis with negligible residues. With the heating rate increasing from 10 °C/min to 40 °C/min, the initial and peak pyrolysis temperatures shift upward and the reaction rate accelerates, whereas the intrinsic pyrolysis mechanism remains unchanged. The mixed medical waste exhibits a two-stage thermal mass-loss feature, with coupled and overlapped pyrolysis intervals of biomass and PP components.
- (2)
- Single-component medical wastes exhibit stable pyrolysis kinetic characteristics. Cotton swabs and paper have activation energies of 110–208 kJ/mol and 42.7–194.0 kJ/mol, respectively, and their experimental data fit best with the first-order reaction mechanism model. Secondary cracking of residual char at high conversion leads to a sharp rise in activation energy. Textiles possess activation energies of 121–135 kJ/mol, and their pyrolysis process is dominated by the three-dimensional diffusion mechanism. Polypropylene (PP) has the highest activation energy of 204–240 kJ/mol, which is mainly governed by random chain scission first-order reactions, and its reaction homogeneity is markedly superior to that of biomass-based medical wastes.
- (3)
- Co-pyrolysis of mixed medical waste is a multi-stage coupled reaction with variable mechanisms. As conversion increases, the reaction sequentially follows the three-dimensional diffusion model, first-order reaction, and three-dimensional diffusion control. The mechanism evolves dynamically and cannot be fully described by a single kinetic model.
- (4)
- A significant component inhibition effect occurs during medical waste co-pyrolysis. Each component pyrolyzes independently at low conversions, with activation energies consistent with theoretical weighted values. At medium and high conversions, free-radical interactions between biomass and PP increase the reaction energy barrier, leading to higher experimental activation energies. The co-pyrolysis system presents chemical coupling rather than simple physical superposition of individual components.
- (5)
- The pyrolysis of all medical waste is endothermic. Different from the stable thermodynamic parameters of single-component pyrolysis, the mixed system presents staged mutations of enthalpy, entropy and Gibbs free energy in the middle and later reaction stages. The reduced reaction spontaneity is accompanied by intense polycondensation carbonization and secondary reactions. The thermodynamic rules of individual components cannot characterize the coupling reaction behaviors of mixed systems. Accordingly, the optimization of medical waste pyrolysis processes should be based on the co-pyrolysis interaction mechanism.
Author Contributions
Methodology, S.Y.; validation, S.M., Z.Z. (Zhipeng Zhou), Z.Z. (Zhongshun Zhao) and Y.W.; Data curation, Z.Z. (Zhipeng Zhou); investigation, Z.Z. (Zhongshun Zhao) and Y.W.; writing—original draft, S.Y.; writing—review and editing, S.M. and H.M.; supervision, Resources, project administration, H.M. All authors have read and agreed to the published version of the manuscript.
Funding
The authors wish to thank the financial support of the National Key Research and Development Program of China (No. 2022YFC3902302).
Data Availability Statement
The original contributions presented in this study are included in the article. Further inquiries can be directed to the corresponding authors.
Conflicts of Interest
The authors declare that they have no conflicts of interest related to this work, and that they do not have any commercial or associative interest that represents a conflict of interest in connection with the work submitted.
References
- Thiagarajan, C.; Yuvarajan, D.; Channappagoudra, M.; Bhanot, D.; Upadhye, V.J.; Choudhury, S.; Shukla, K.K. Advancing sustainable medical waste management: The role of pyrolysis in resource recovery and environmental protection. Results Chem. 2025, 17, 102639. [Google Scholar] [CrossRef] [Scilit]
- Fang, S.; Jiang, L.; Li, P.; Bai, J.; Chang, C. Study on pyrolysis products characteristics of medical waste and fractional condensation of the pyrolysis oil. Energy 2020, 195, 116969. [Google Scholar] [CrossRef] [Scilit]
- Purnomo, C.W.; Kurniawan, W.; Aziz, M. Technological review on thermochemical conversion of COVID-19-related medical wastes. Resour. Conserv. Recycl. 2021, 167, 105429. [Google Scholar] [CrossRef] [Scilit] [PubMed]
- Rai, P.K.; Sonne, C.; Song, H.; Kim, K.H. Plastic wastes in the time of COVID-19: Their environmental hazards and implications for sustainable energy resilience and circular bio-economies. Sci. Total Environ. 2023, 858, 159880. [Google Scholar] [CrossRef] [Scilit] [PubMed]
- Singh, N.; Ogunseitan, O.A.; Tang, Y. Medical waste: Current challenges and future opportunities for sustainable management. Crit. Rev. Environ. Sci. Technol. 2022, 52, 2000–2022. [Google Scholar] [CrossRef] [Scilit]
- Zabihollahi, S.; Rahmani, A.; Sinegani, A.A.S.; Samadi, M.T.; Aghadadashi, V.; Khazaei, M.; Leili, M.; Afshar, S.; Karami, P.; Zafari, D. Assessing microbial soil community dynamics in a municipal solid waste landfill: Impacts of waste type and disposal timing. Case Stud. Chem. Environ. Eng. 2024, 10, 100918. [Google Scholar] [CrossRef] [Scilit]
- Wang, J.; Shen, J.; Ye, D.; Yan, X.; Zhang, Y.; Yang, W.; Li, X.; Wang, J.; Zhang, L.; Pan, L. Disinfection technology of hospital wastes and wastewater: Suggestions for disinfection strategy during coronavirus Disease 2019 (COVID-19) pandemic in China. Environ. Pollut. 2020, 262, 114665. [Google Scholar] [CrossRef] [Scilit] [PubMed]
- Fu, W.; Sun, J.; Luo, J.; Tao, J.; Liu, R.; Luo, J.; Liu, Y.; Sun, S.; Ji, F.; Zhang, W.; et al. Low-temperature microwave co-pyrolysis of medical waste and walnut shells: Effective regulation of organic chlorine to inorganic chlorine conversion in pyrolyzed char. Energy 2025, 334, 137759. [Google Scholar] [CrossRef] [Scilit]
- Li, S.; Chen, H.; Yuan, X.; Pan, P.; Xu, G.; Wang, X.; Wu, L. Energy, exergy and economic analysis of a poly-generation system combining sludge pyrolysis and medical waste plasma gasification. Energy 2024, 295, 130806. [Google Scholar] [CrossRef] [Scilit]
- Li, S.; Zhang, Y.; Zhao, L.; Qin, J.; Liu, H. Comprehensive evaluation of e-waste plastic pyrolysis technology: Research status, technical challenges and prospects. J. Anal. Appl. Pyrolysis 2026, 193, 107458. [Google Scholar] [CrossRef] [Scilit]
- Wang, H.; Deng, S.; Yang, J.; Liu, X.; Si, G.; Jin, H.; Yang, Z.; Gao, K.; Ti, S. Analysis and techno-economic evaluation of co-pyrolysis of medical protective clothing and biomass. J. Environ. Manag. 2025, 377, 124567. [Google Scholar] [CrossRef] [Scilit] [PubMed]
- Qin, Y.; Wang, Z.; Yang, F.; Wang, D.; Liu, W.; Hanikai, D.; Liu, J.; Zhou, J.; Liu, D. Research progress on pyrolysis and resource utilisation of waste plastics: Methods, mechanisms, influencing factors, and future prospects. J. Anal. Appl. Pyrolysis 2026, 193, 107459. [Google Scholar] [CrossRef] [Scilit]
- Yu, T.; Li, T.; Li, J.; Rajput, M.I.; Yan, B.; Chen, G. Investigation on chlorine migration during pyrolysis of medical waste. Waste Manag. 2026, 210, 115248. [Google Scholar] [CrossRef] [Scilit] [PubMed]
- Zheng, Y.; Zhang, T.; Li, A.; Huang, Y.; Usman, M.; Deng, Q.; Liao, C.; Huang, Y.; Yao, H. Valorisation of medical waste through the staged pyrolysis: Effect of pyrolysis conditions on chlorine removal and product formation. Fuel 2026, 405, 136623. [Google Scholar] [CrossRef] [Scilit]
- Zhou, Z.; Ma, H.; Ma, S.; Zhang, L.; Wang, K. Heat transfer and parameter optimization for medical waste pyrolysis in an indirectly heated rotary kiln. Waste Manag. 2025, 207, 115093. [Google Scholar] [CrossRef] [Scilit] [PubMed]
- Bassyouni, M.; Nasser, R.; El-Bagoury, M.; Shaker, I.; Attia, A.M.; Elhenawy, Y.; Aboelela, D. Integrating medical plastic waste pyrolysis and circular economy for environmental sustainability. Renew. Sustain. Energy Rev. 2025, 209, 115062. [Google Scholar] [CrossRef] [Scilit]
- Chen, T.; Liang, A.; Chen, X.; Zhang, B. Pyrolysis behavior of polypropylene and PVC medical waste: Multi-scale analysis via TGA, FTIR, GC–MS and kinetic modeling. Therm. Sci. Eng. Prog. 2025, 68, 104324. [Google Scholar] [CrossRef] [Scilit]
- Li, Y.; Liu, S.; Yin, F.; Liang, D. Pyrolysis kinetics and reaction mechanism of waste medical masks by sectional heating process. Therm. Sci. Eng. Prog. 2024, 56, 103065. [Google Scholar] [CrossRef] [Scilit]
- Liu, C.; Zhang, B.; Bian, Y.; Wang, J.; Fang, J.; Xu, Z.; Zhang, H. Synergistic effect and kinetic analysis of catalytic co-pyrolysis of waste cotton swabs and non-woven masks. J. Anal. Appl. Pyrolysis 2022, 167, 105677. [Google Scholar] [CrossRef] [Scilit]
- Ding, Z.; Liu, J.; Chen, H.; Huang, S.; Evrendilek, F.; He, Y.; Zheng, L. Co-pyrolysis performances, synergistic mechanisms, and products of textile dyeing sludge and medical plastic wastes. Sci. Total Environ. 2021, 799, 149397. [Google Scholar] [CrossRef] [Scilit] [PubMed]
- Chen, J.; Zhou, Y.; Yan, Z.; Li, Q. Moxa combustion waste and its bio activities on cotton—A facile and green finishing process towards a sustainable and value adding application for medical textile. J. Clean. Prod. 2024, 483, 144259. [Google Scholar] [CrossRef] [Scilit]
- Ji, G.; Liu, B.; Luo, G.; Yuwen, C.; Peng, F.; Gong, S.; Chen, W.; Hou, K.; Yang, Z.; Jin, Y. PVC dechlorination-microwave catalysed pyrolysis for the preparation of carbon nanocomposites: Dechlorination kinetics, process and mechanism. J. Anal. Appl. Pyrolysis 2026, 194, 107576. [Google Scholar] [CrossRef] [Scilit]
- Hu, B.; Zhou, G.-Z.; Wei, S.-G.; Cheng, Z.-J.; Liu, J.; Li, K.; Zhang, Z.-X.; Lu, Q. Investigation into the impact of cold plasma pretreatment on the pyrolysis reaction characteristics of cellulose. Fuel 2026, 407, 137473. [Google Scholar] [CrossRef] [Scilit]
- Zolfagharpour, H.; Nowrouz, P.; Mohseni-Bandpei, A.; Majlesi, M.; Rafiee, M.; Khalili, F. Influences of temperature, waste size and residence time on the generation of polycyclic aromatic hydrocarbons during the fast pyrolysis of medical waste. Casp. J. Environ. Sci. 2020, 18, 47–57. [Google Scholar] [CrossRef] [Scilit]
- Yang, B.; Chen, M. Py–FTIR–GC/MS Analysis of Volatile Products of Automobile Shredder Residue Pyrolysis. Polymers 2020, 12, 2734. [Google Scholar] [CrossRef] [Scilit]
- Wang, J.; Zhong, Z.; Zhang, B.; Ding, K.; Xue, Z.; Deng, A.; Ruan, R. Upgraded bio-oil production via catalytic fast co-pyrolysis of waste cooking oil and tea residual. Waste Manag. 2017, 60, 357–362. [Google Scholar] [CrossRef] [Scilit] [PubMed]
- Parku, G.K.; Collard, F.-X.; Görgens, J.F. Pyrolysis of waste polypropylene plastics for energy recovery: Influence of heating rate and vacuum conditions on composition of fuel product. Fuel Process. Technol. 2020, 209, 106522. [Google Scholar] [CrossRef] [Scilit]
- Hou, Y.; Feng, Z.; He, Y.; Gao, Q.; Ni, L.; Su, M.; Ren, H.; Liu, Z.; Hu, W. Co-pyrolysis characteristics and synergistic interaction of bamboo residues and disposable face mask. Renew. Energy 2022, 194, 415–425. [Google Scholar] [CrossRef] [Scilit]
- Wang, J.; Zhong, Z.; Ding, K.; Zhang, B.; Deng, A.; Min, M.; Chen, P.; Ruan, R. Co-pyrolysis of bamboo residual with waste tire over dual catalytic stage of CaO and co-modified HZSM-5. Energy 2017, 133, 90–98. [Google Scholar] [CrossRef] [Scilit]
- Alam, M.; Bhavanam, A.; Jana, A.; Viroja, J.K.S.; Peela, N.R. Co-pyrolysis of bamboo sawdust and plastic: Synergistic effects and kinetics. Renew. Energy 2020, 149, 1133–1145. [Google Scholar] [CrossRef] [Scilit]
- Oyedun, A.O.; Tee, C.Z.; Hanson, S.; Hui, D. Thermogravimetric analysis of the pyrolysis characteristics and kinetics of plastics and biomass blends. Fuel Process. Technol. 2014, 128, 471–481. [Google Scholar] [CrossRef] [Scilit]
- Vyazovkin, S.; Burnham, A.K.; Criado, J.M.; Pérez-Maqueda, L.A.; Popescu, C.; Sbirrazzuoli, N. ICTAC Kinetics Committee recommendations for performing kinetic computations on thermal analysis data. Thermochim. Acta 2011, 520, 1–19. [Google Scholar] [CrossRef] [Scilit]
- Akahira, T.; Sunose, T. Joint Convention of Four Electrical Institutes; Research Report; Chiba Institute of Technology: Chiba, Japan, 1971; Volume 16, pp. 22–31. [Google Scholar]
- Kissinger, H.E. Reaction Kinetics in Differential Thermal Analysis. Anal. Chem. 1957, 29, 1702–1706. [Google Scholar] [CrossRef] [Scilit]
- Akahira, T.; Sunose, T. Residual method of thermal analysis. J. Fac. Sci. Hokkaido Univ. Ser. III Chem. 1971, 14, 213–221. [Google Scholar] [CrossRef] [Scilit]
- Friedman, H.L. Kinetics of thermal degradation of char-forming plastics from thermogravimetry. Application to a phenolic plastic. J. Polym. Sci. Part C Polym. Symp. 1964, 6, 183–195. [Google Scholar] [CrossRef] [Scilit]
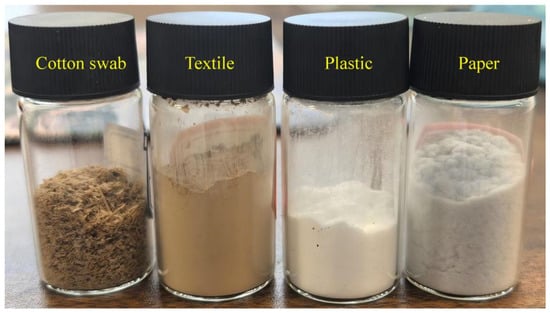
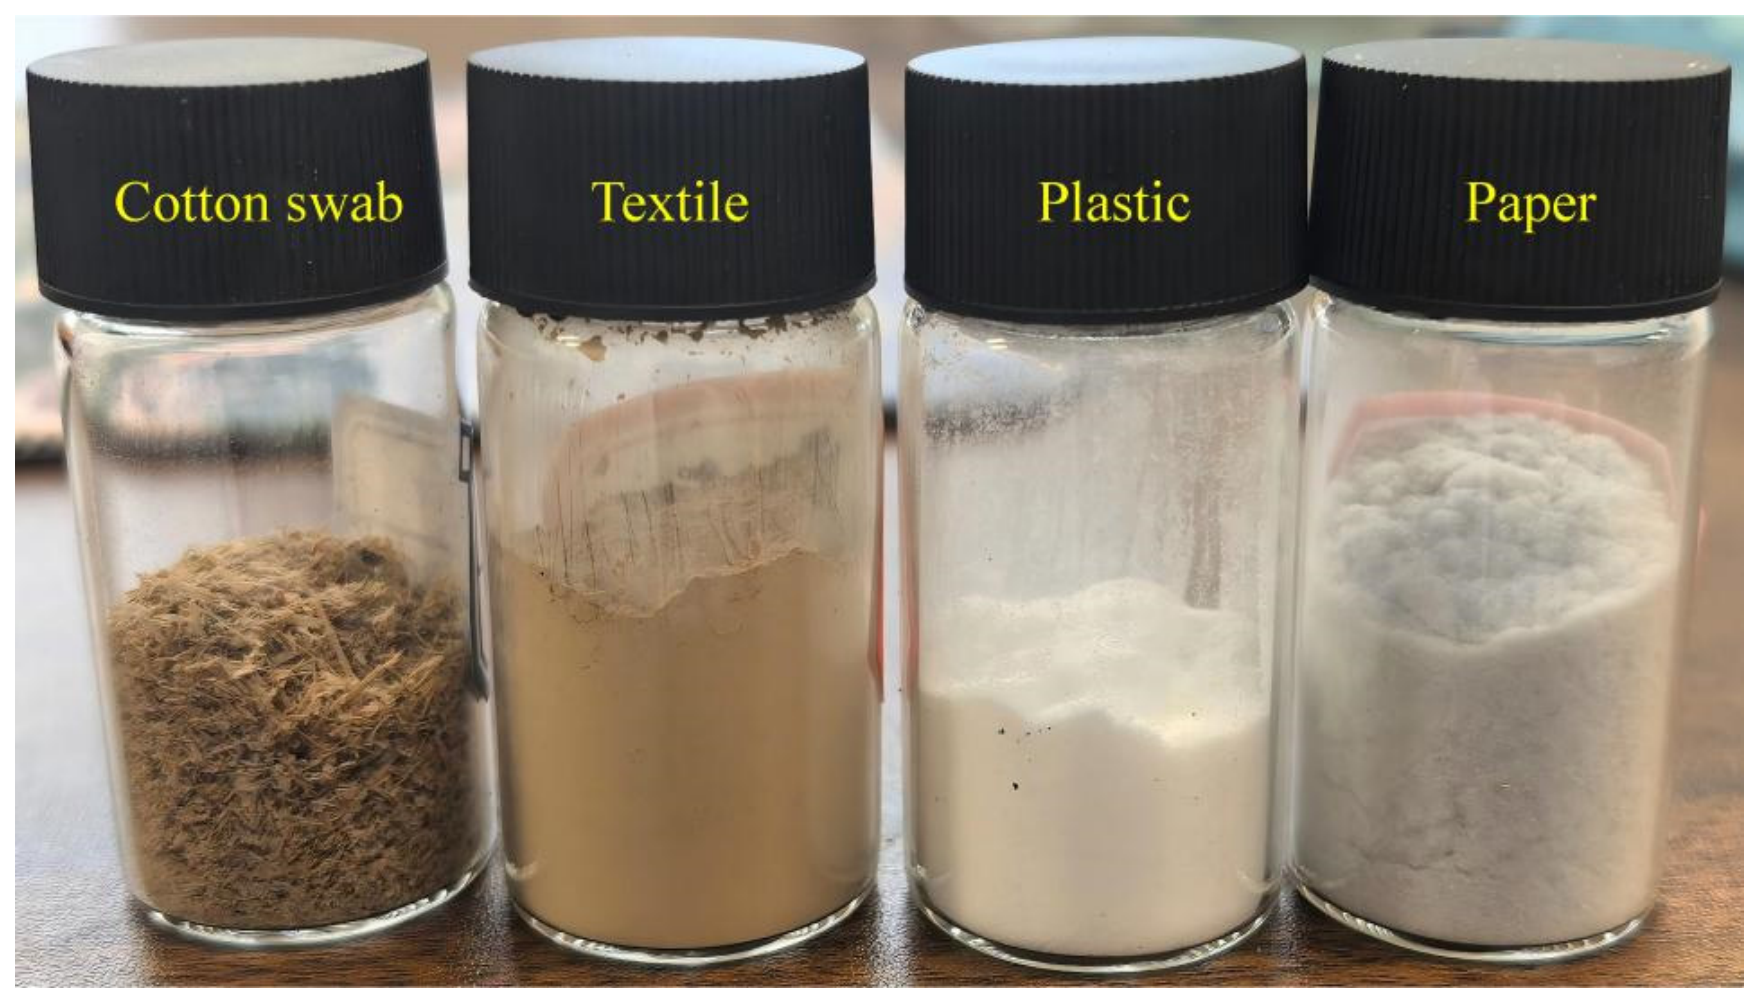
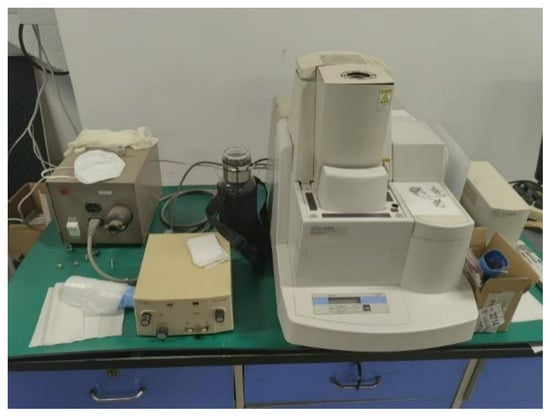
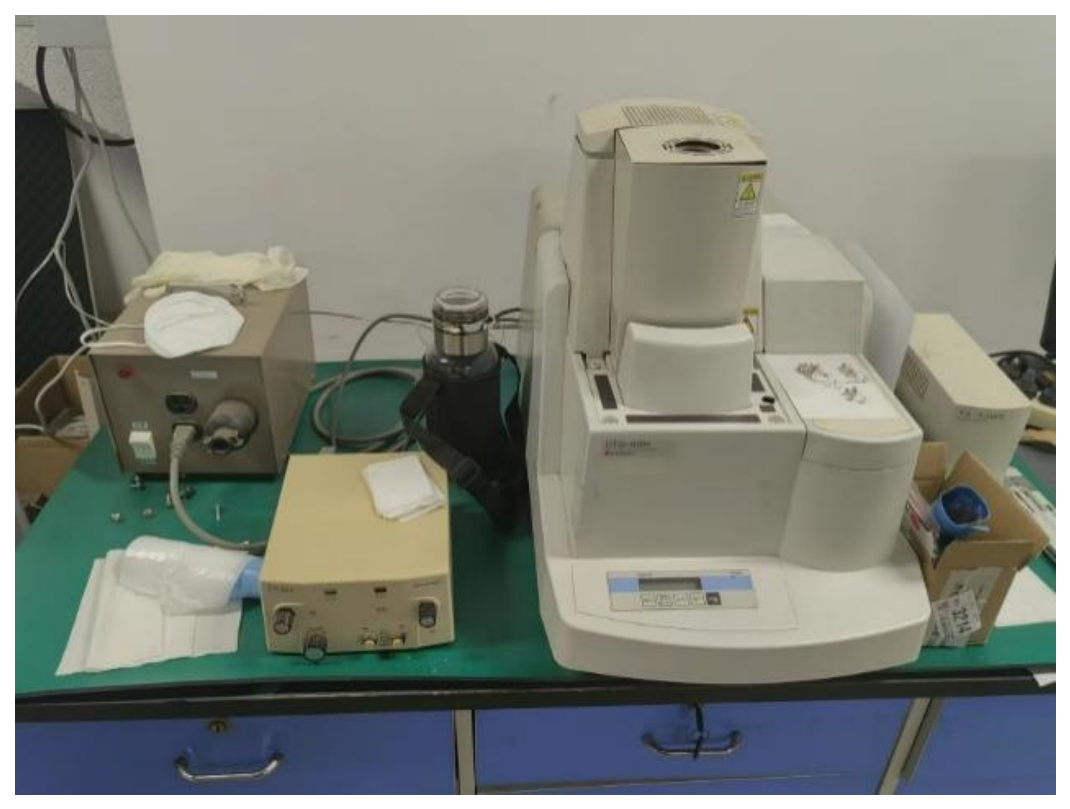
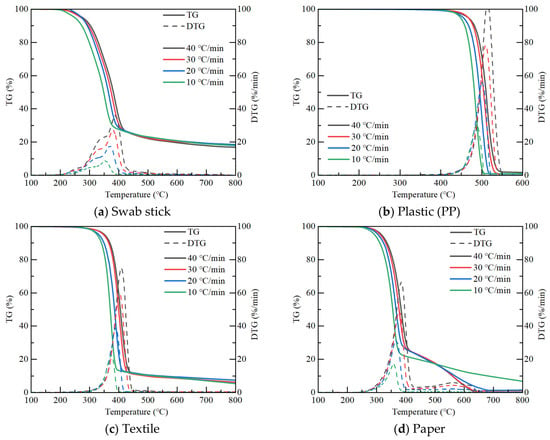
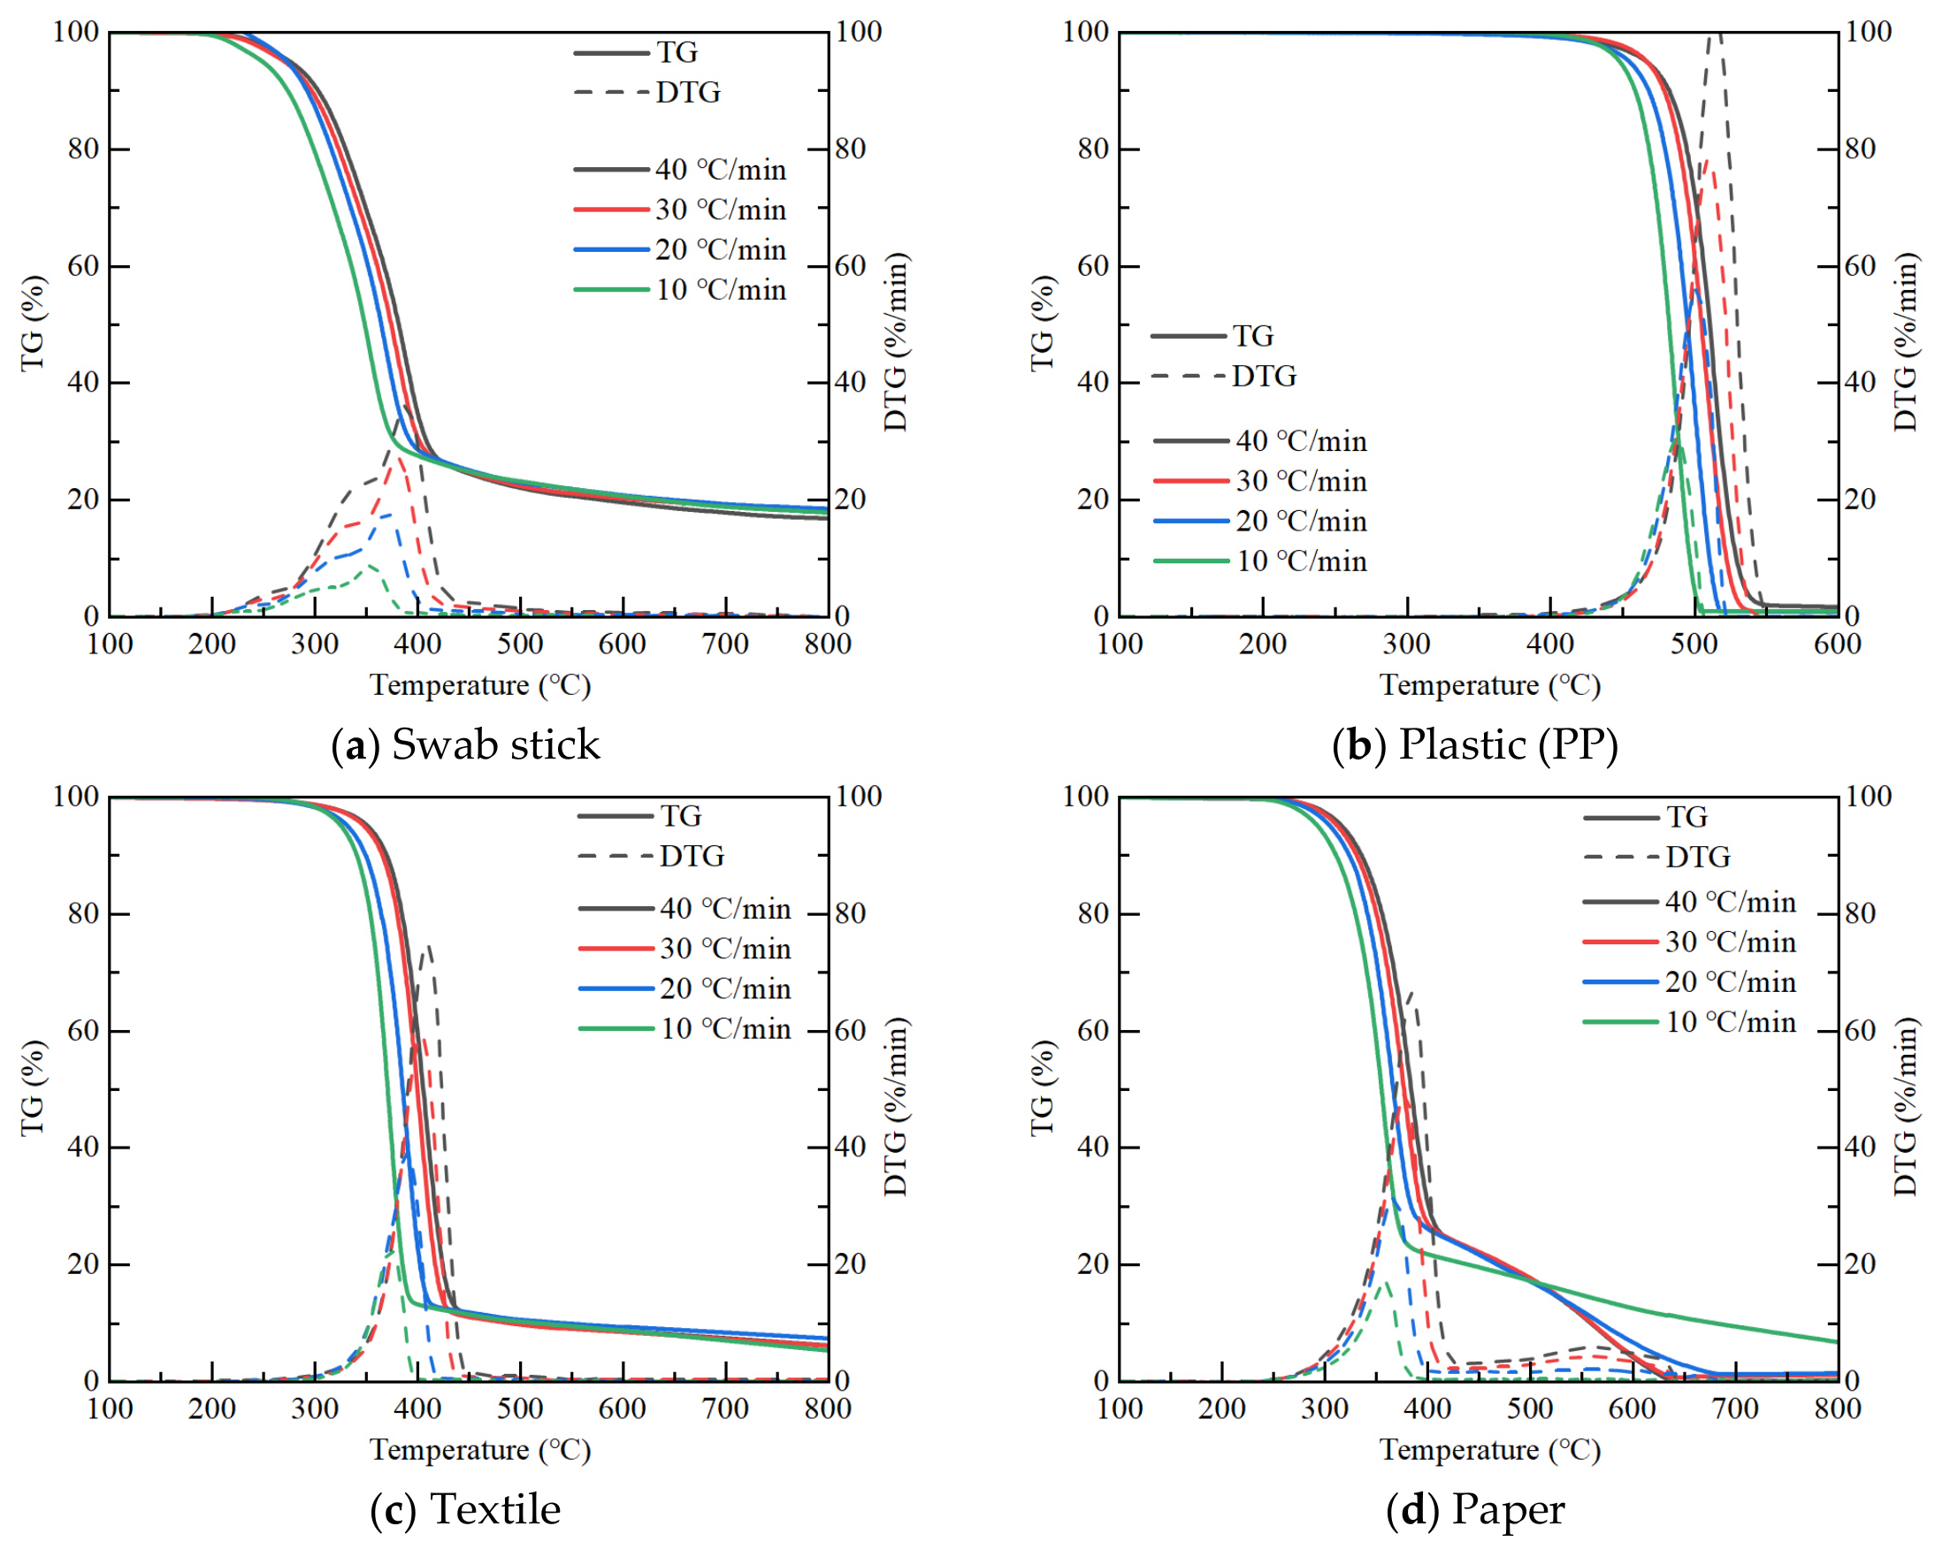
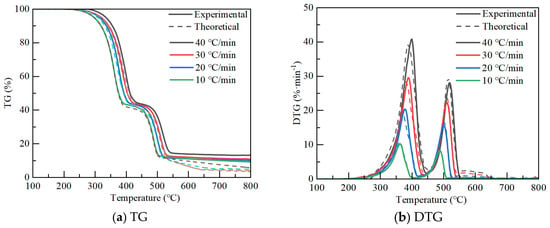
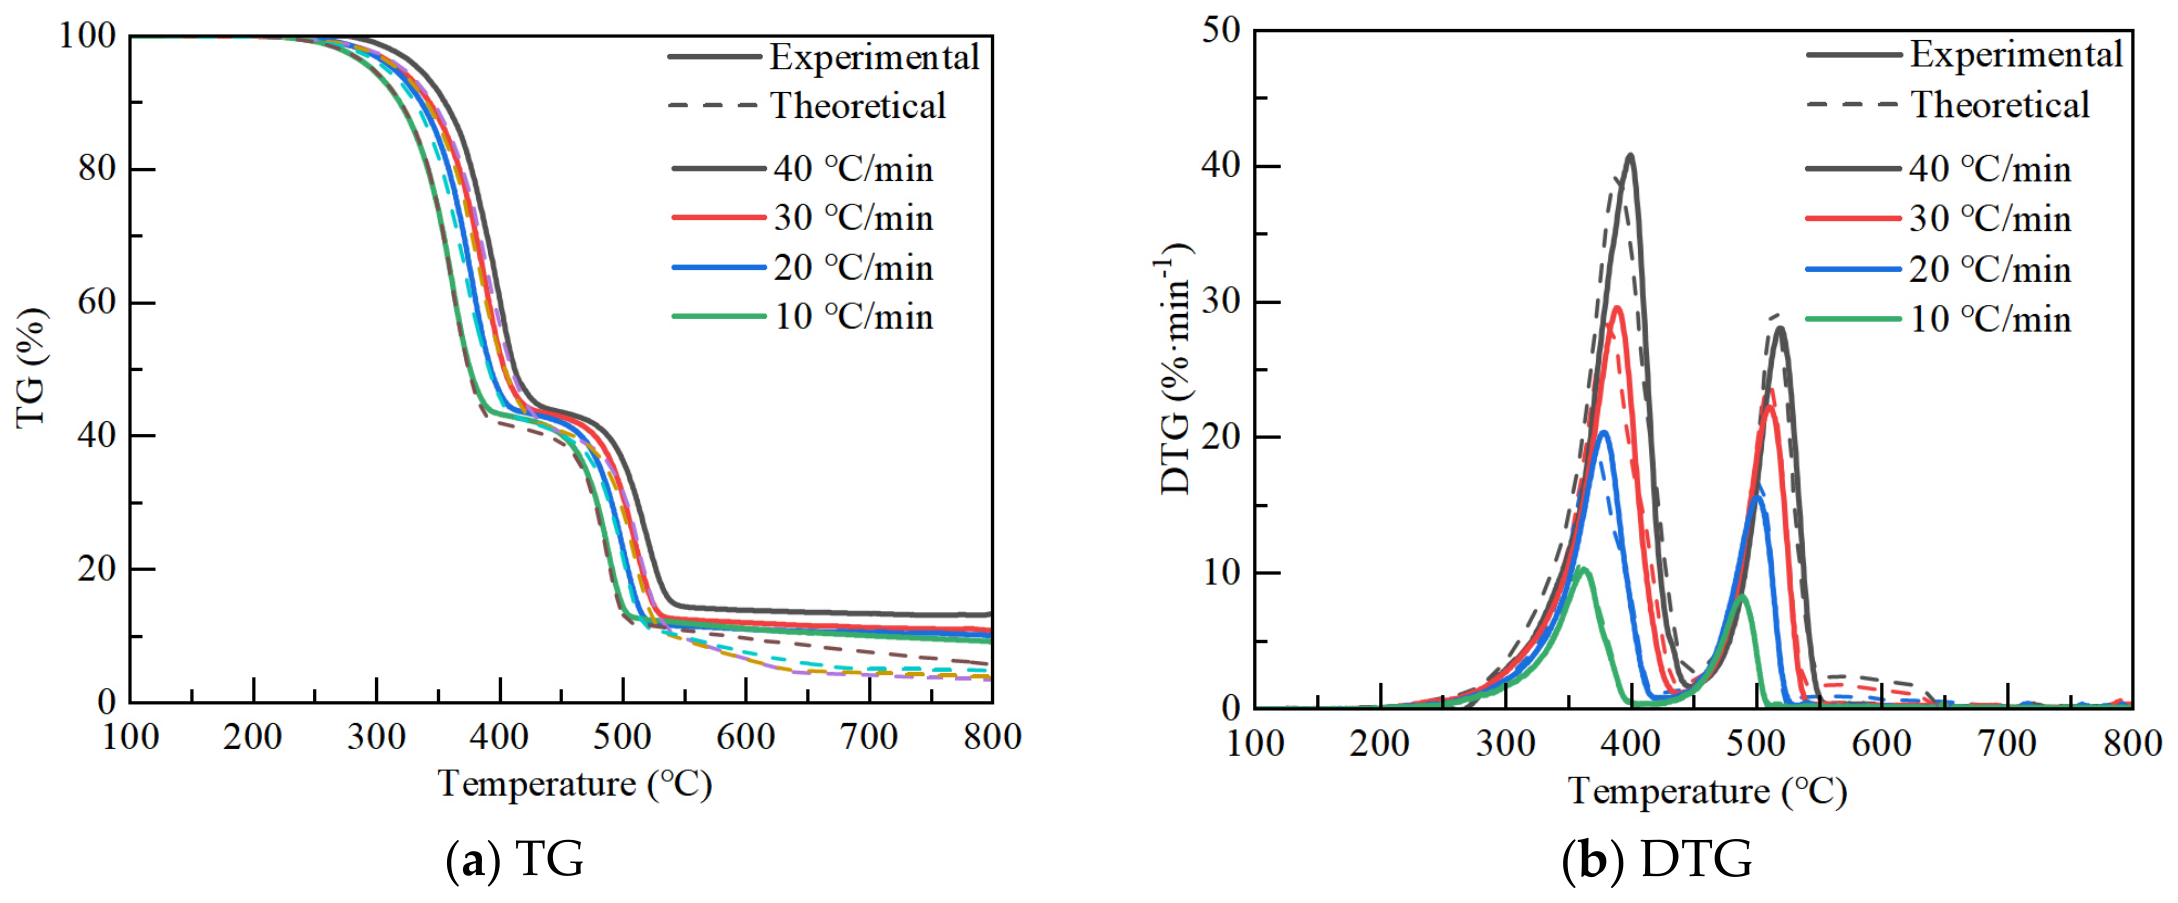
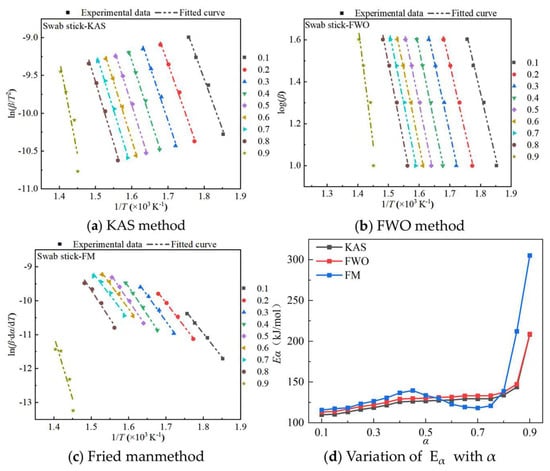
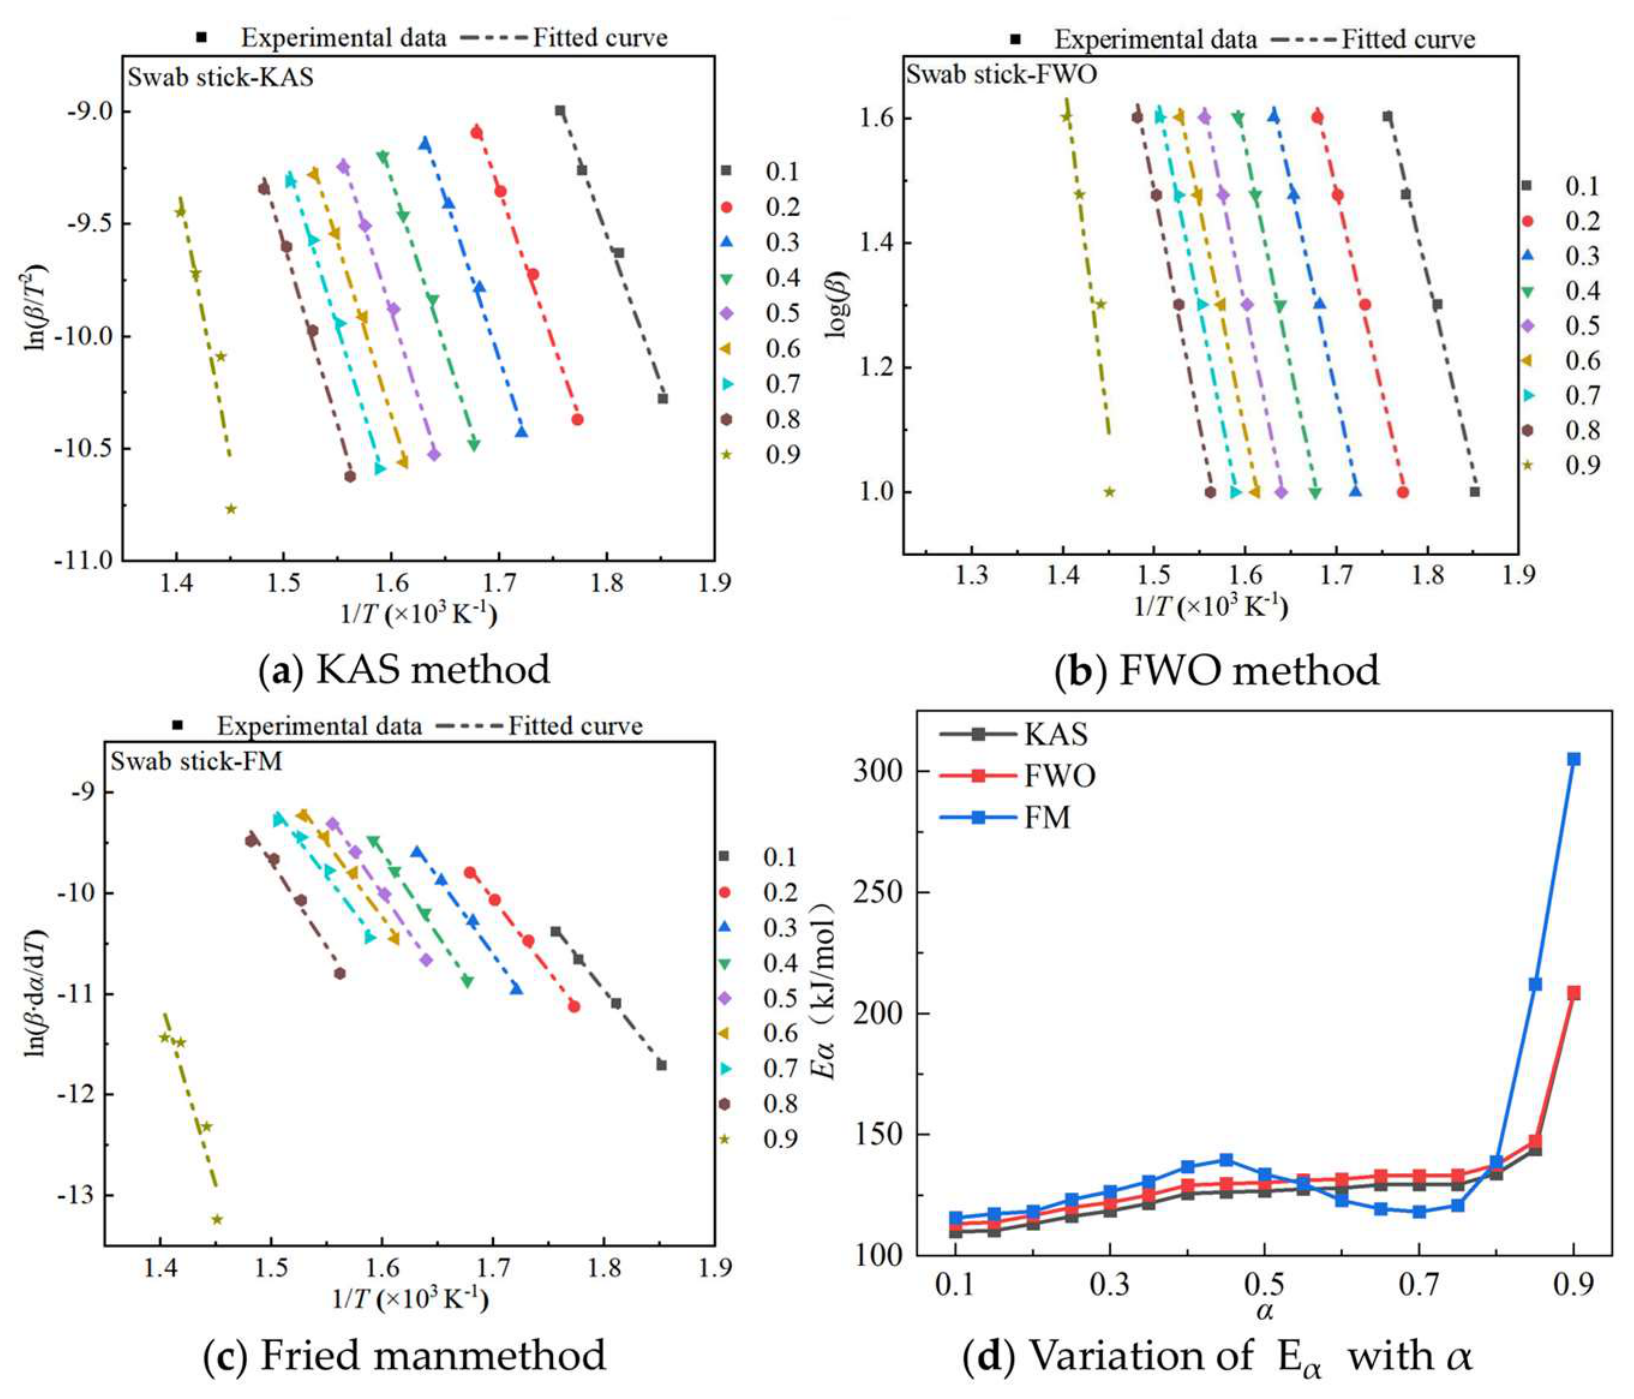
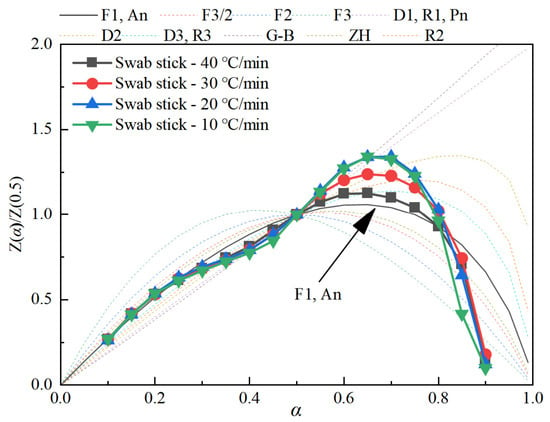
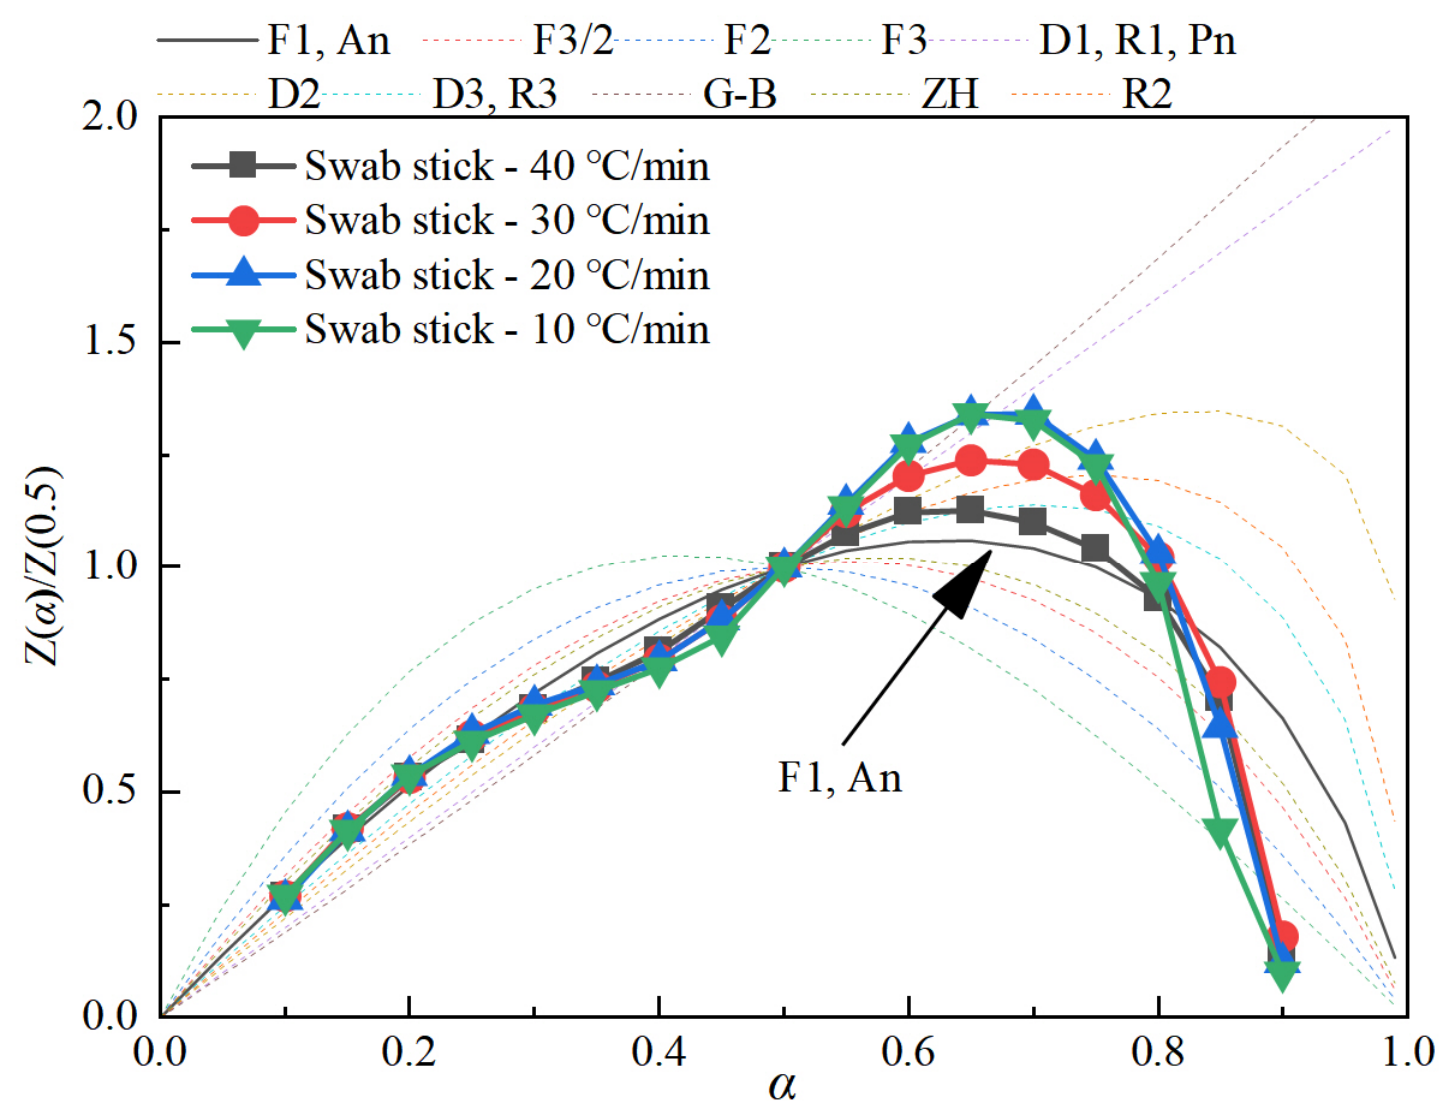
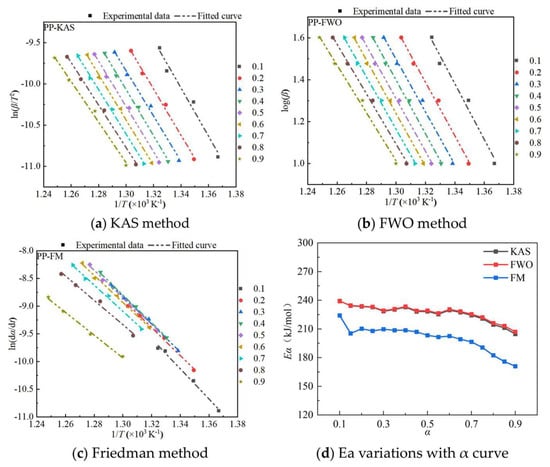
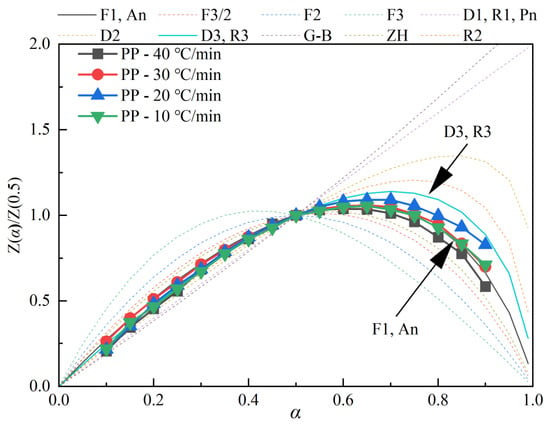
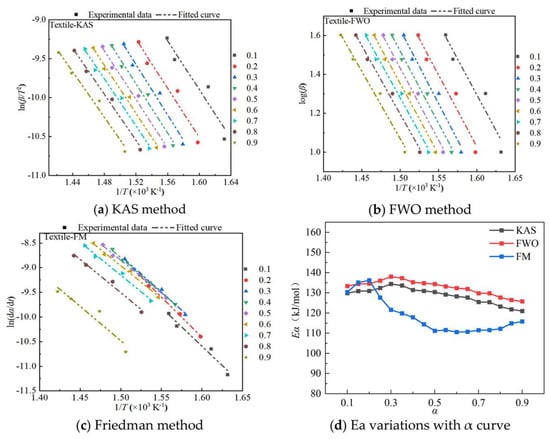
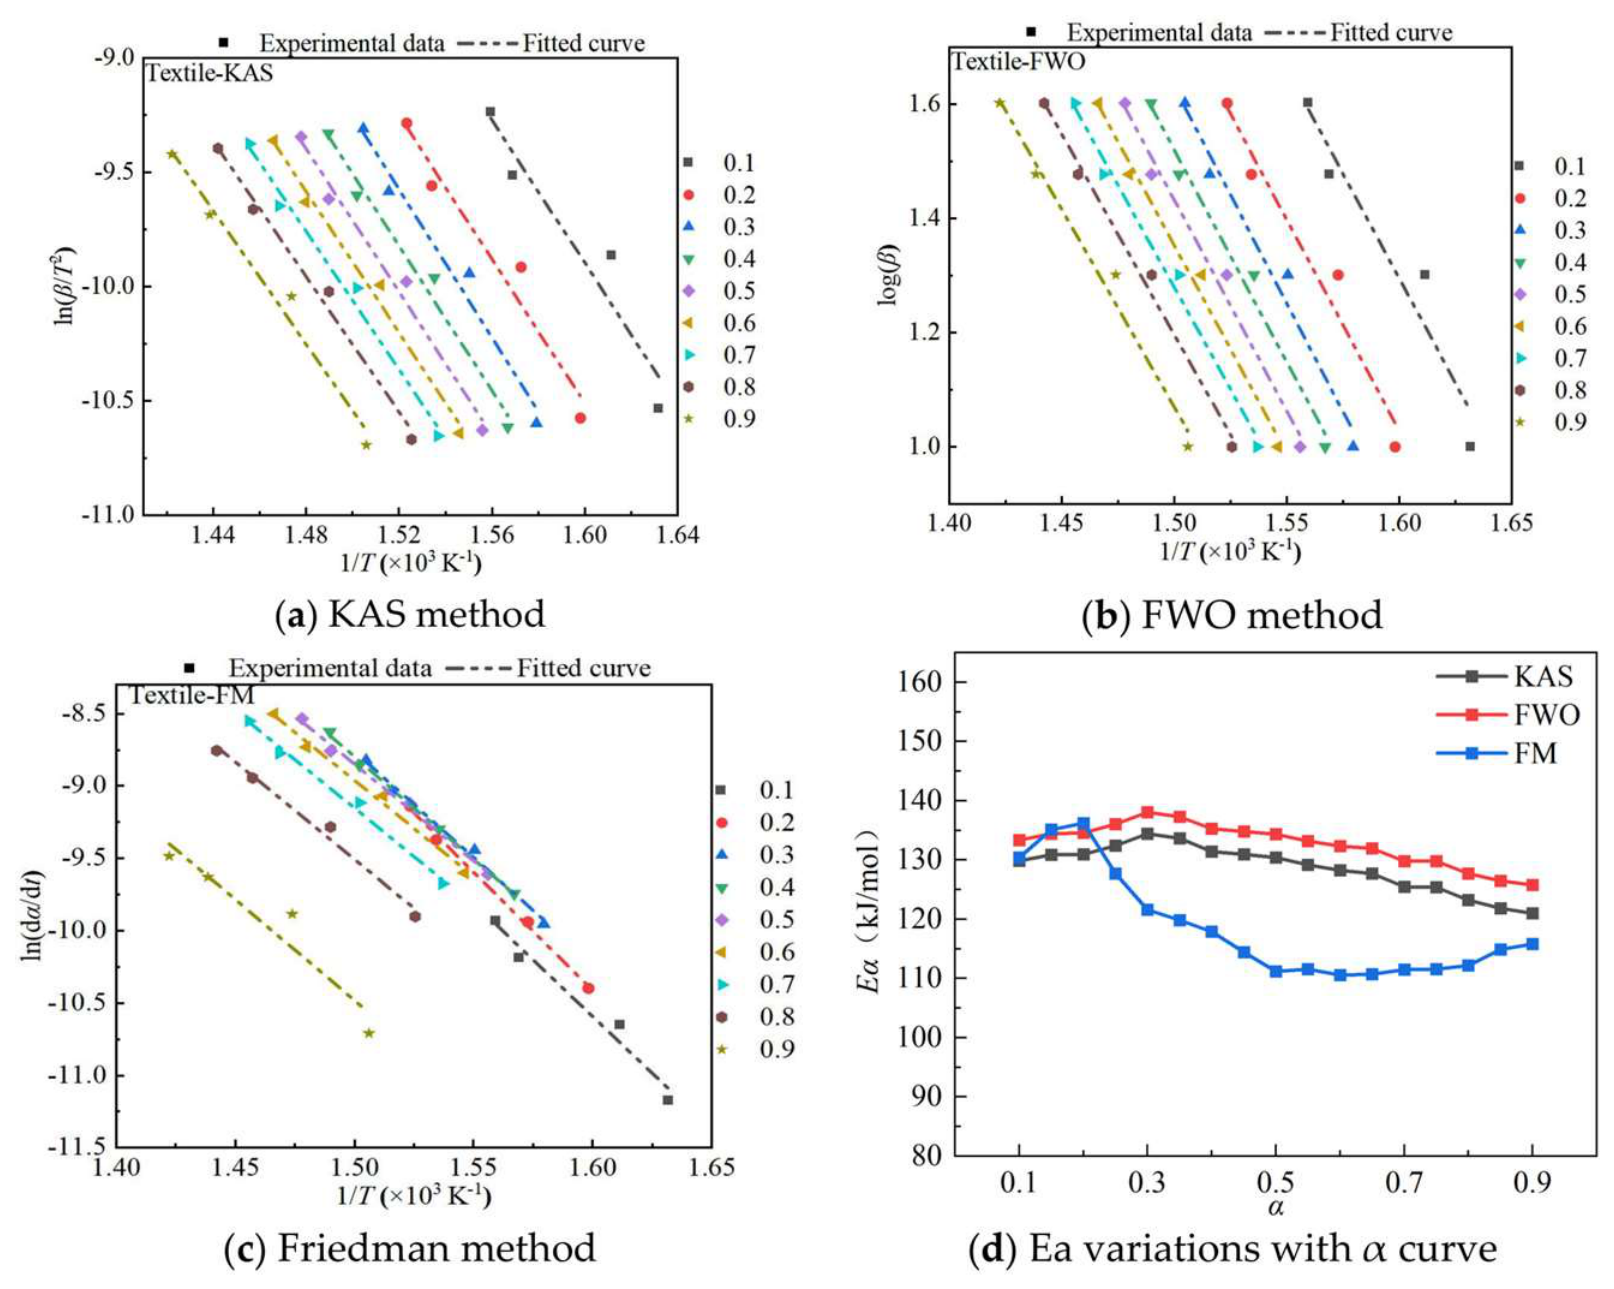
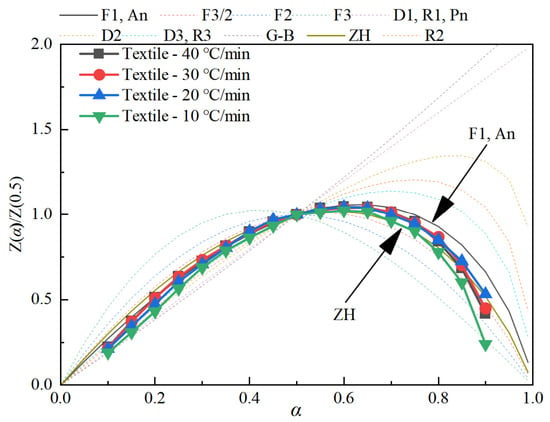
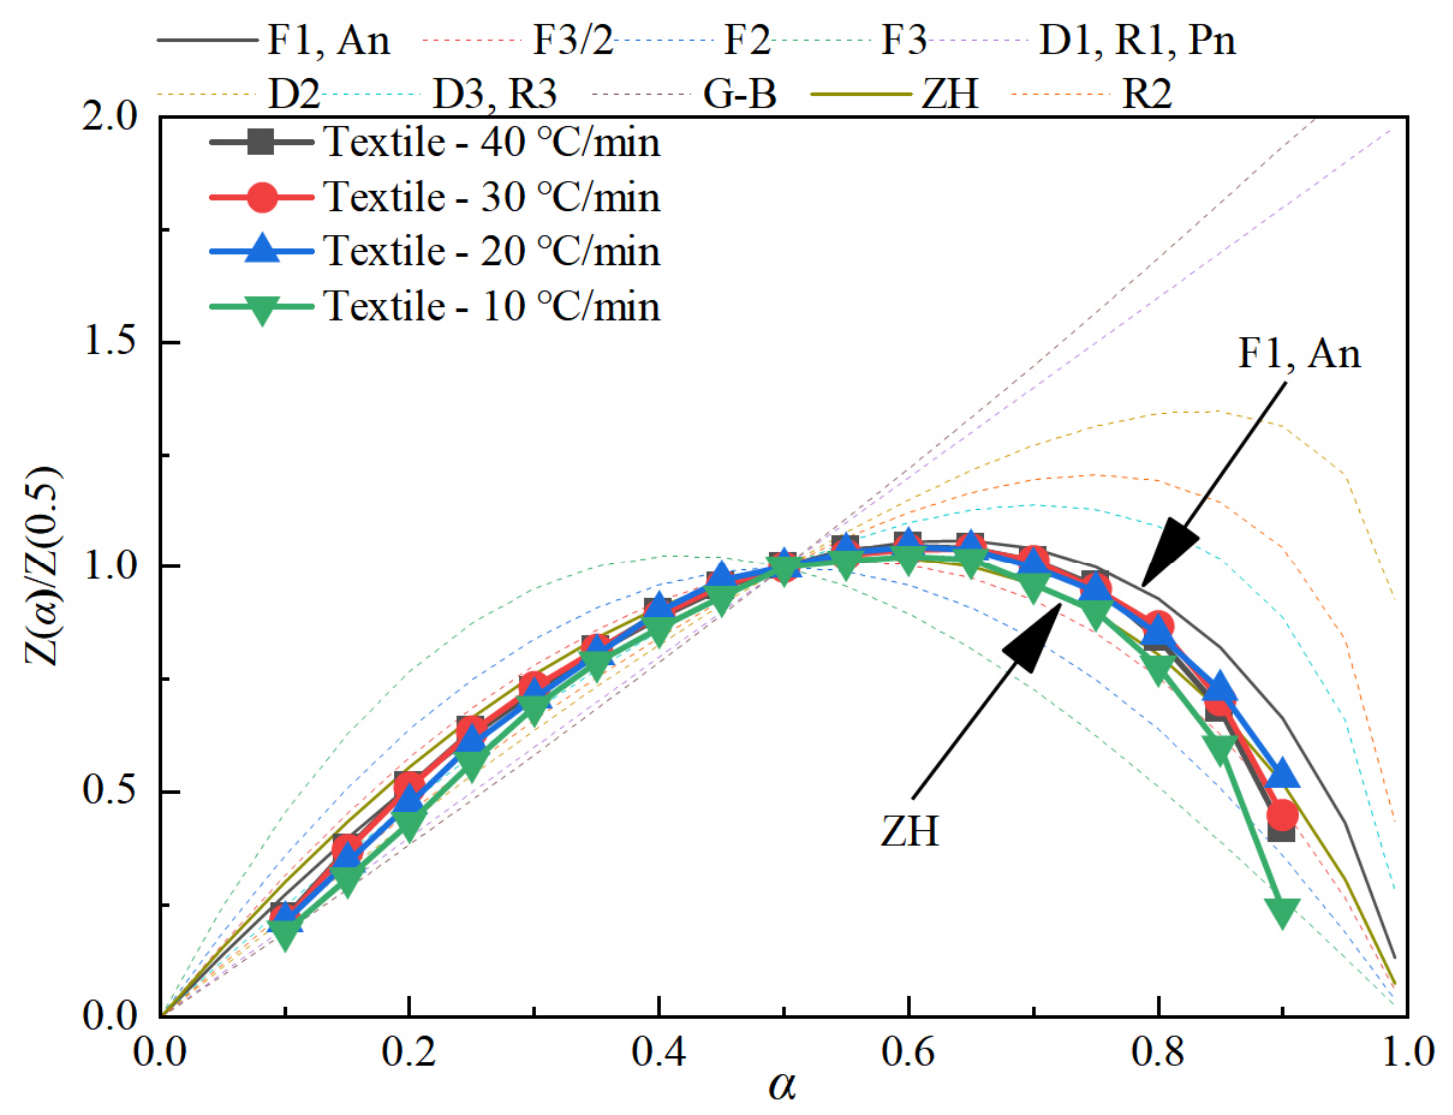
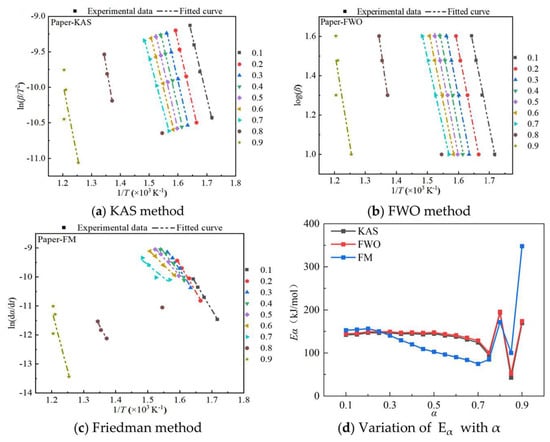
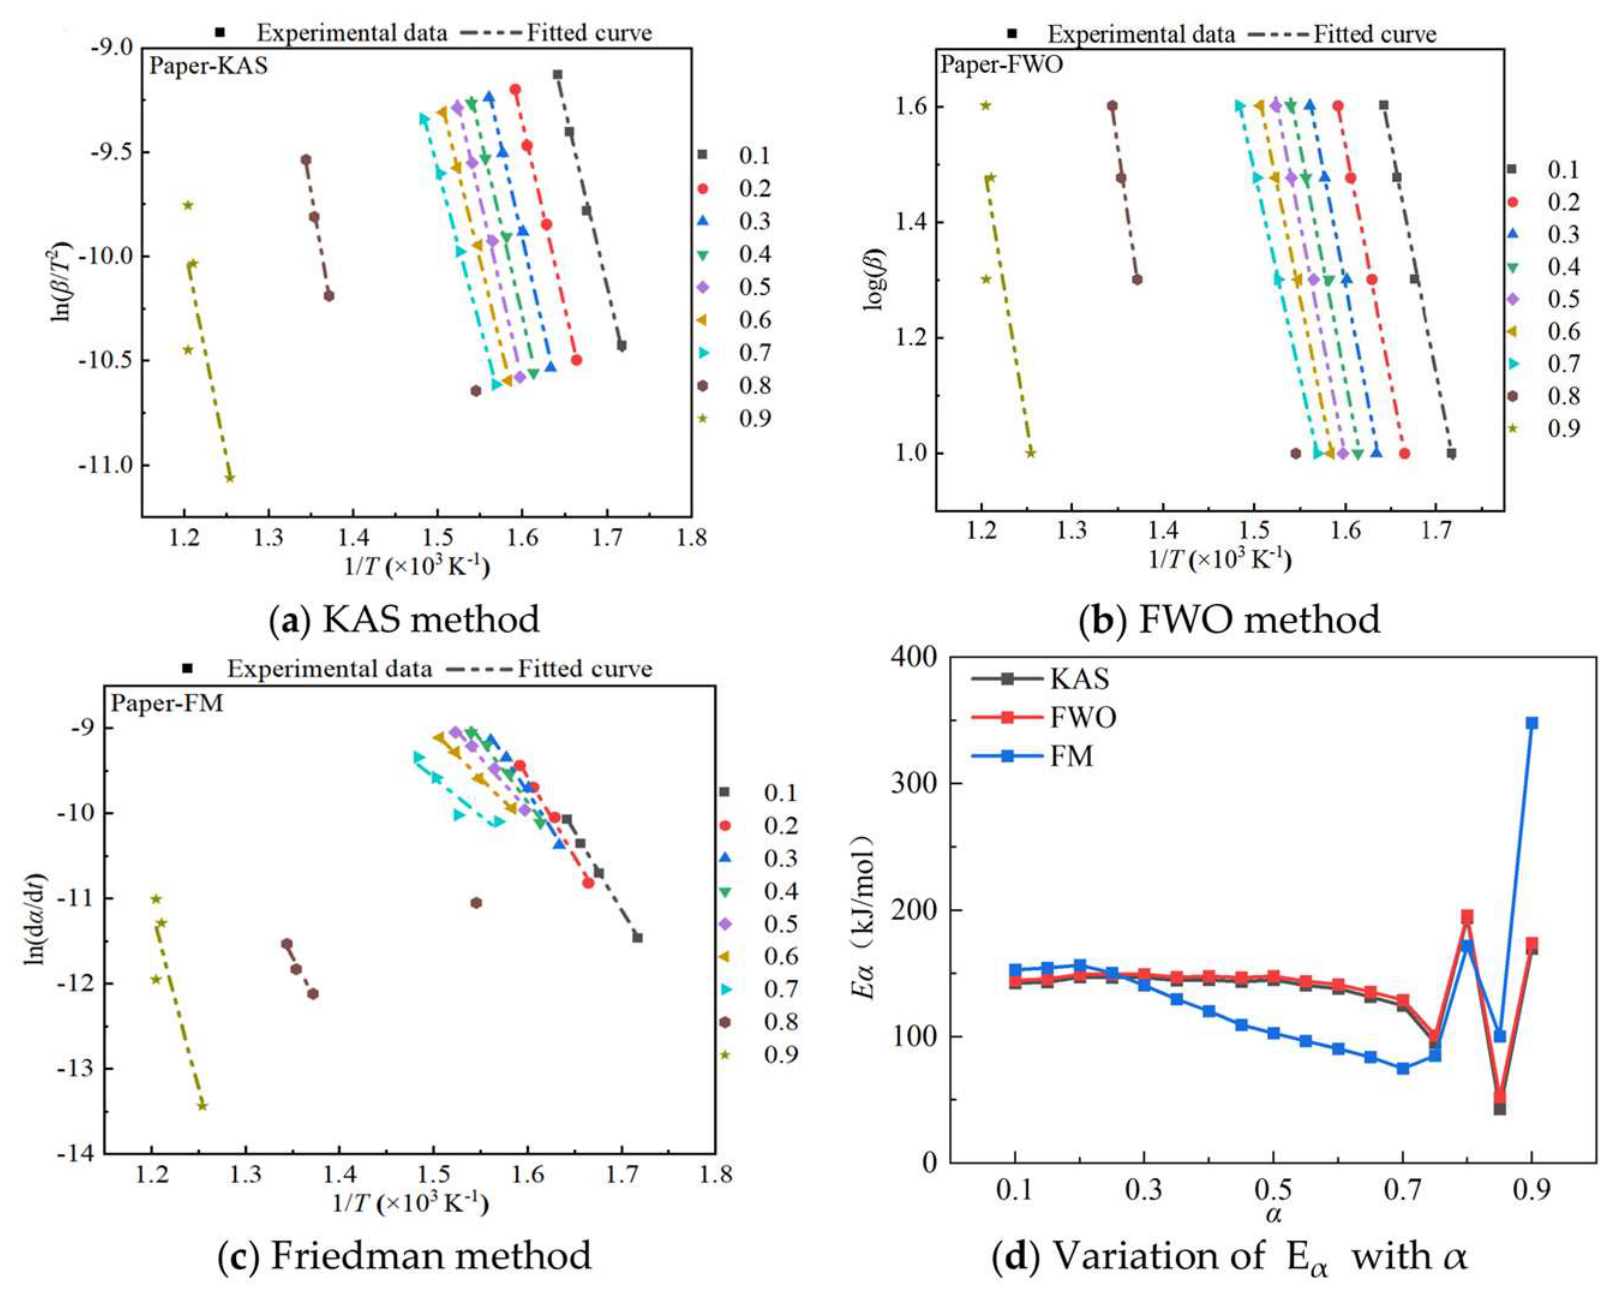
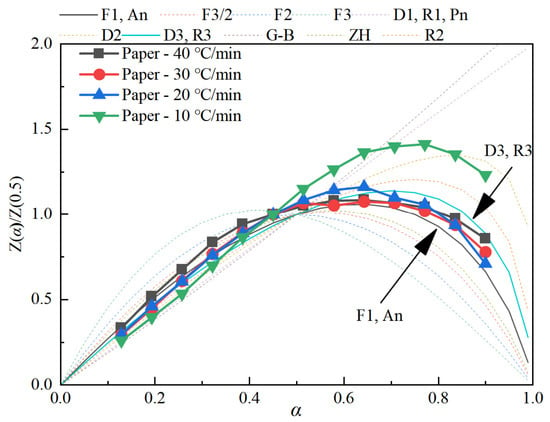
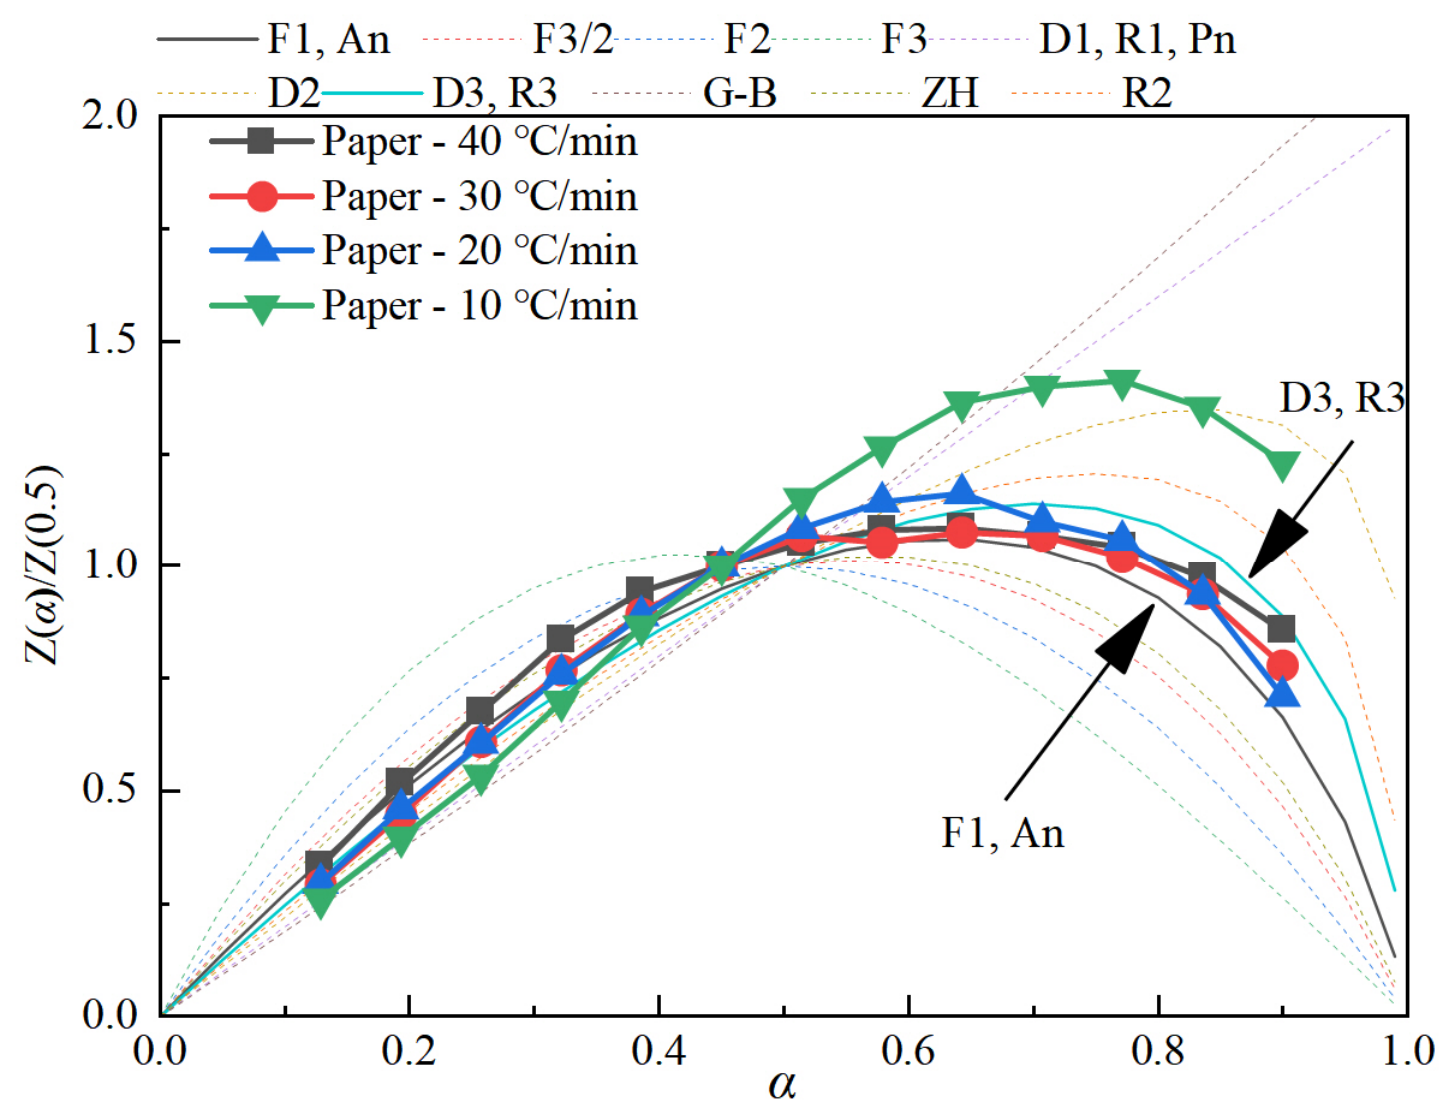
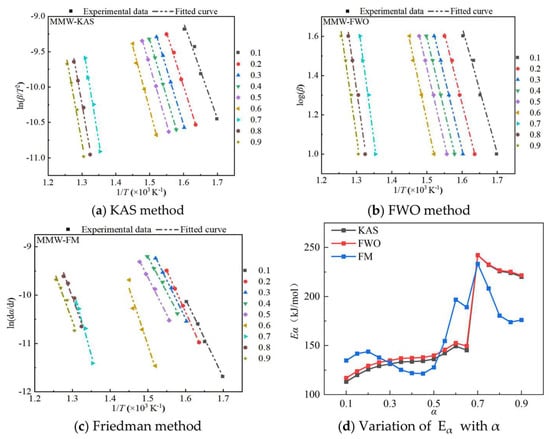
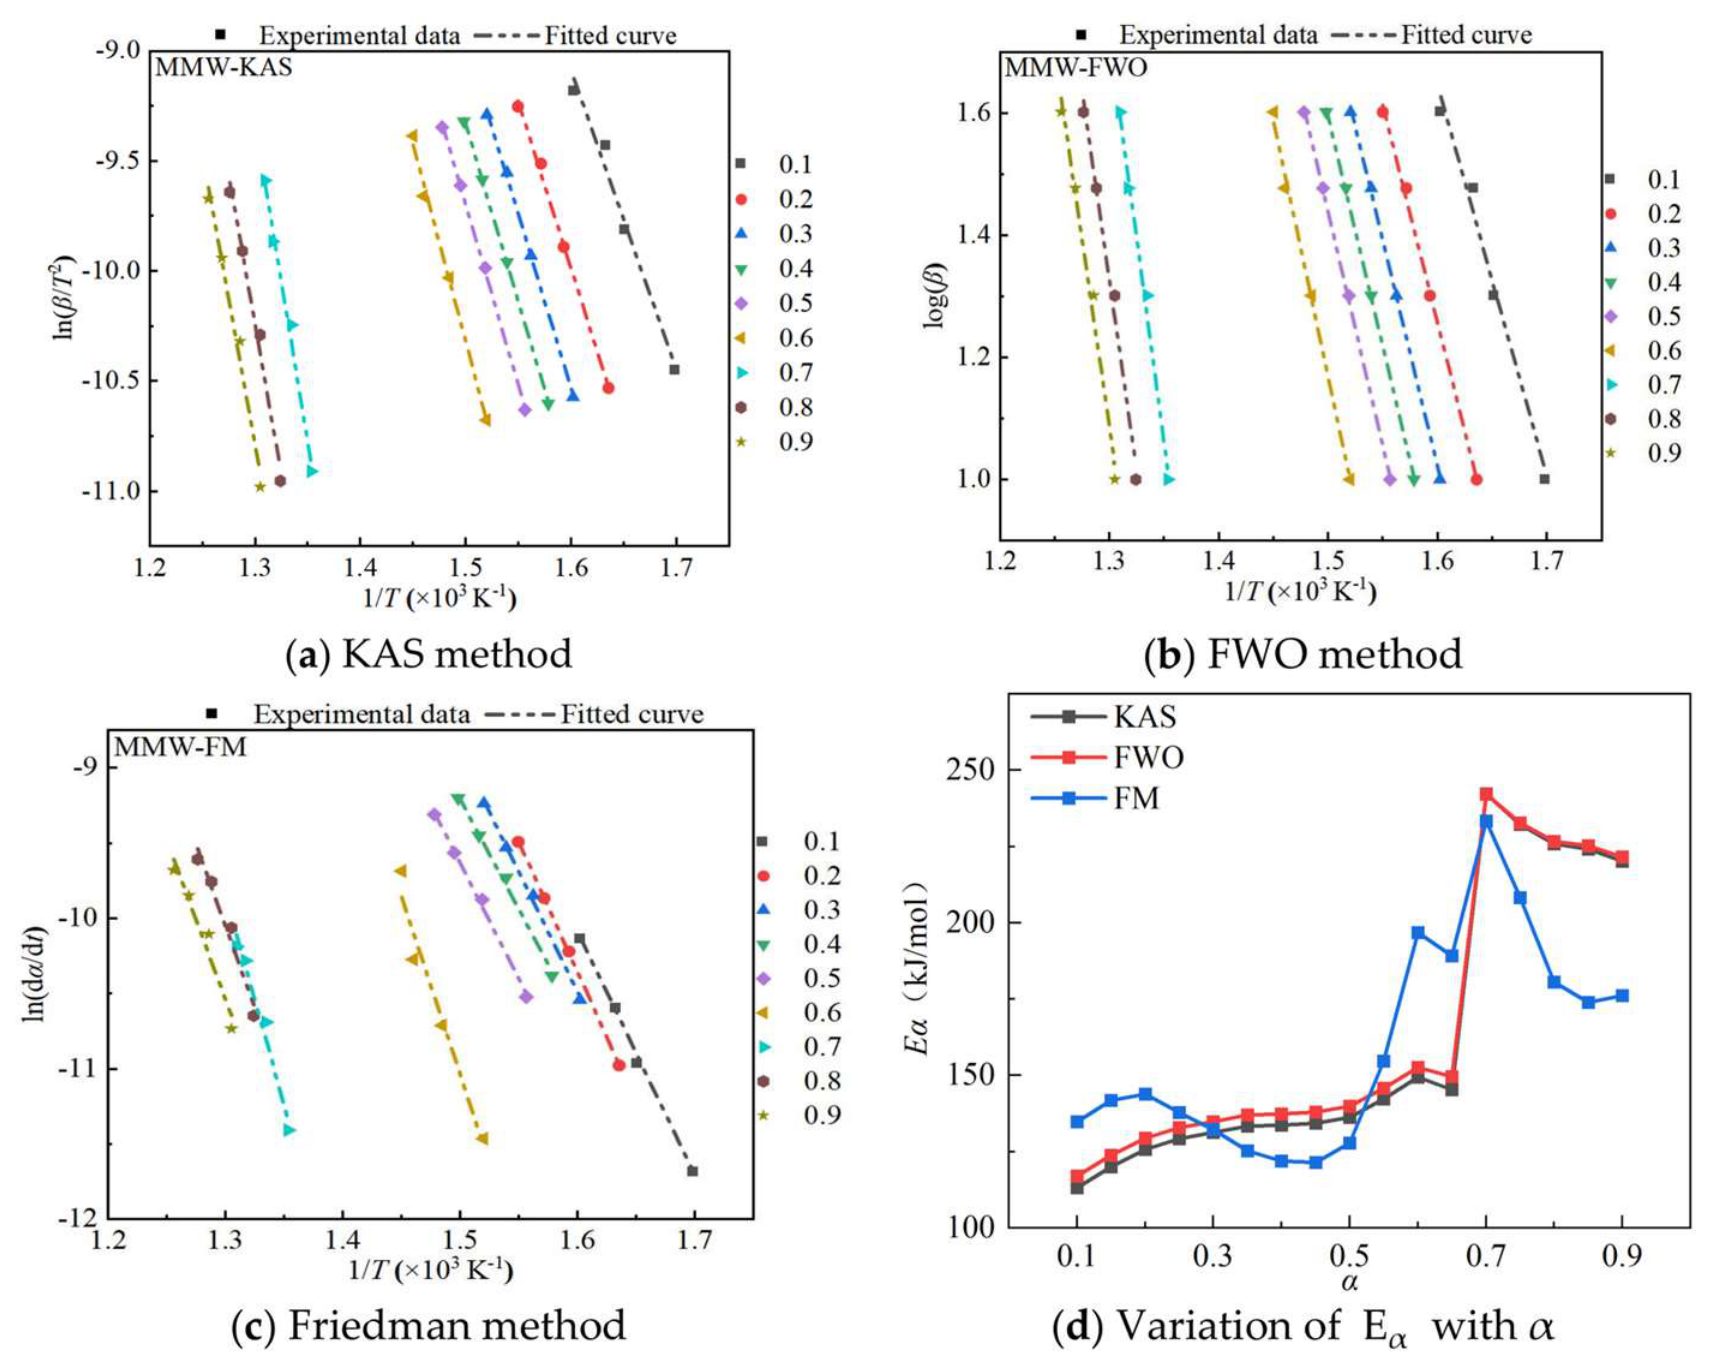
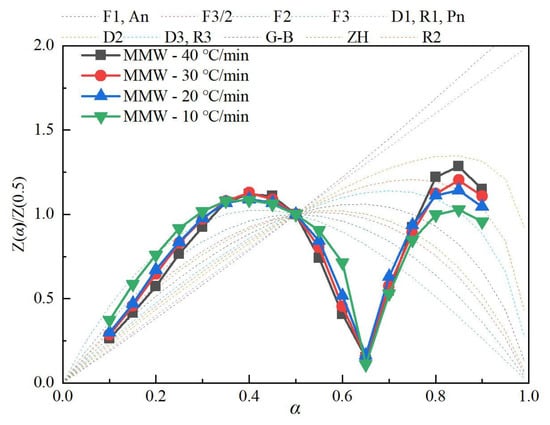
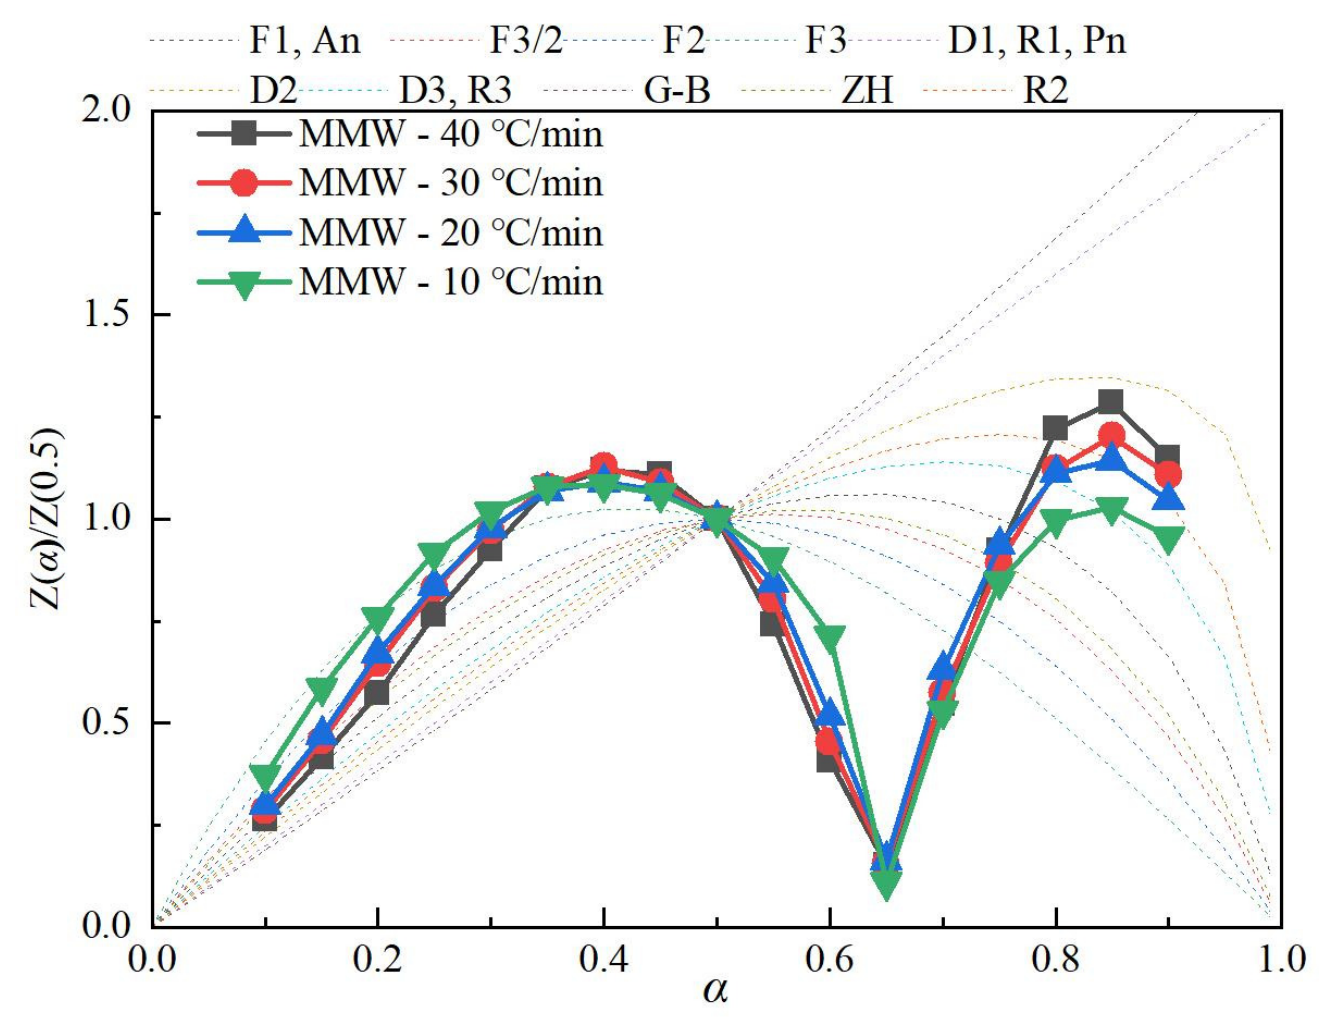
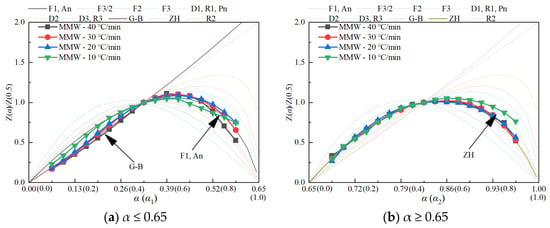
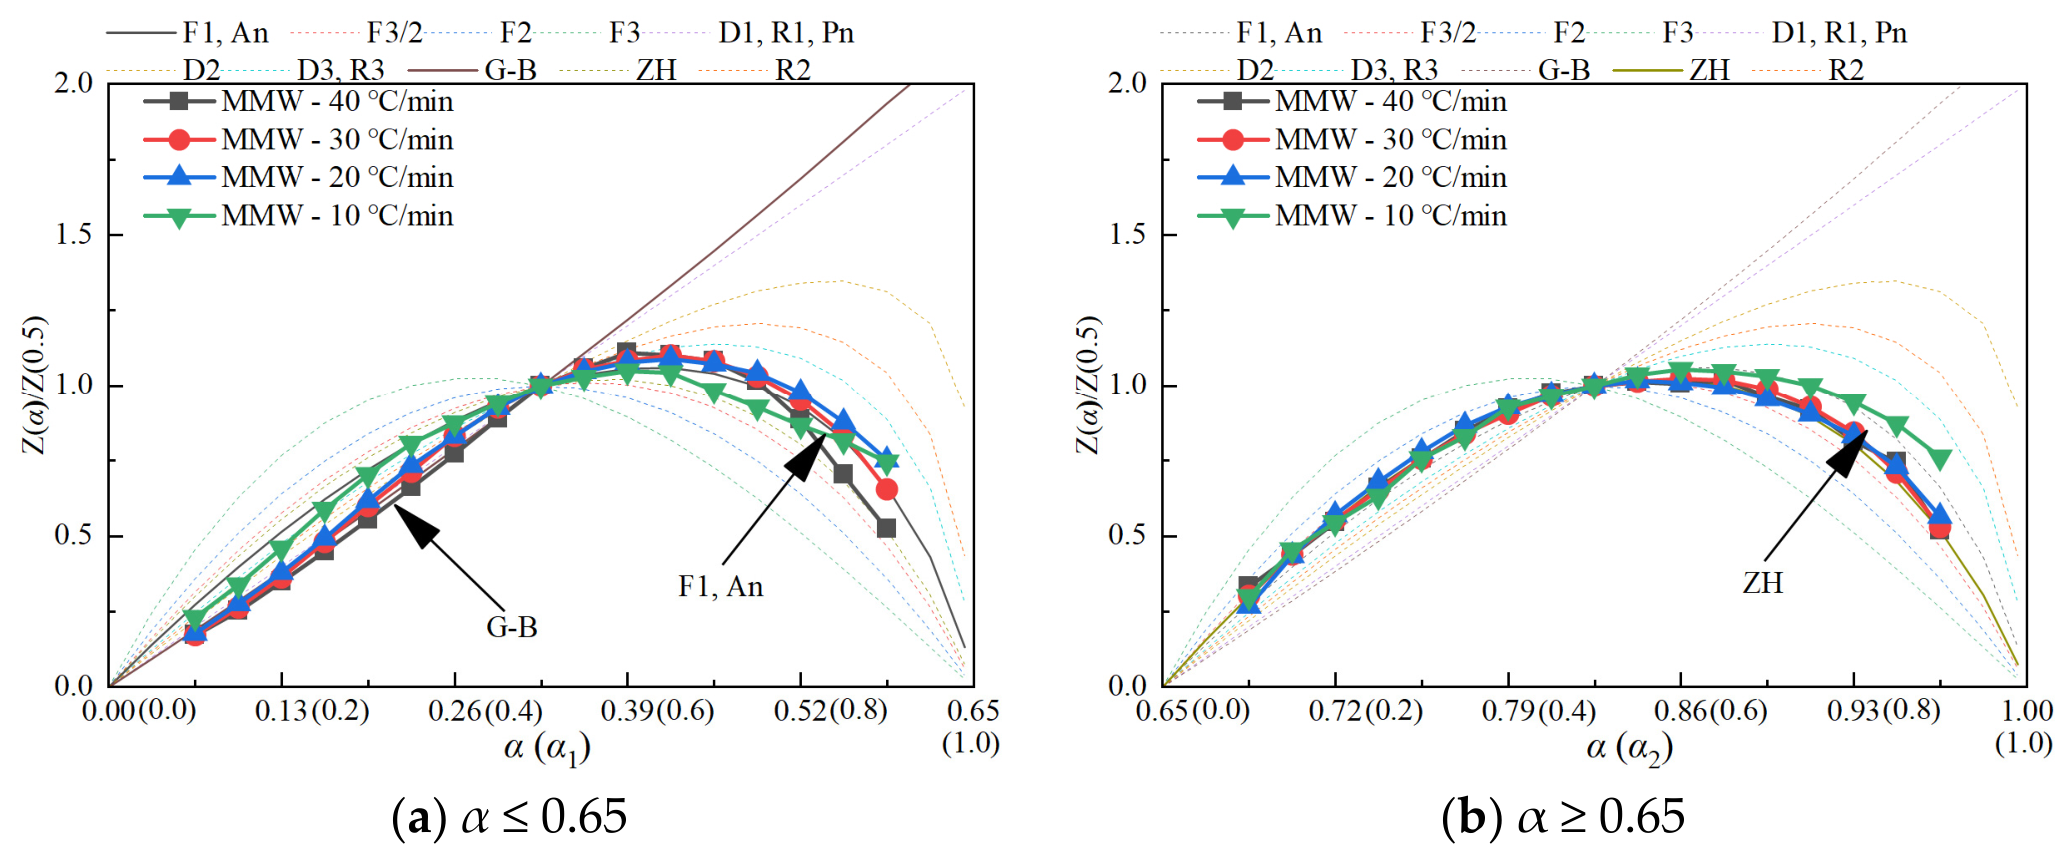
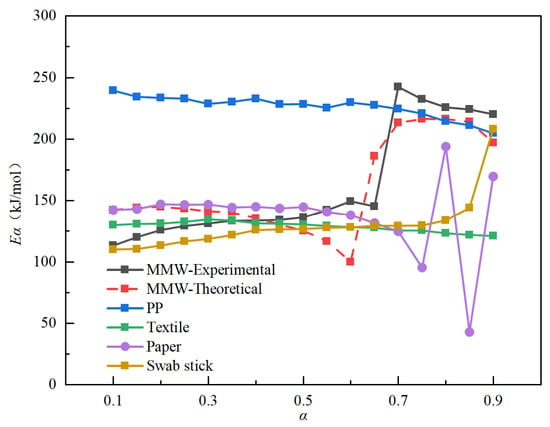
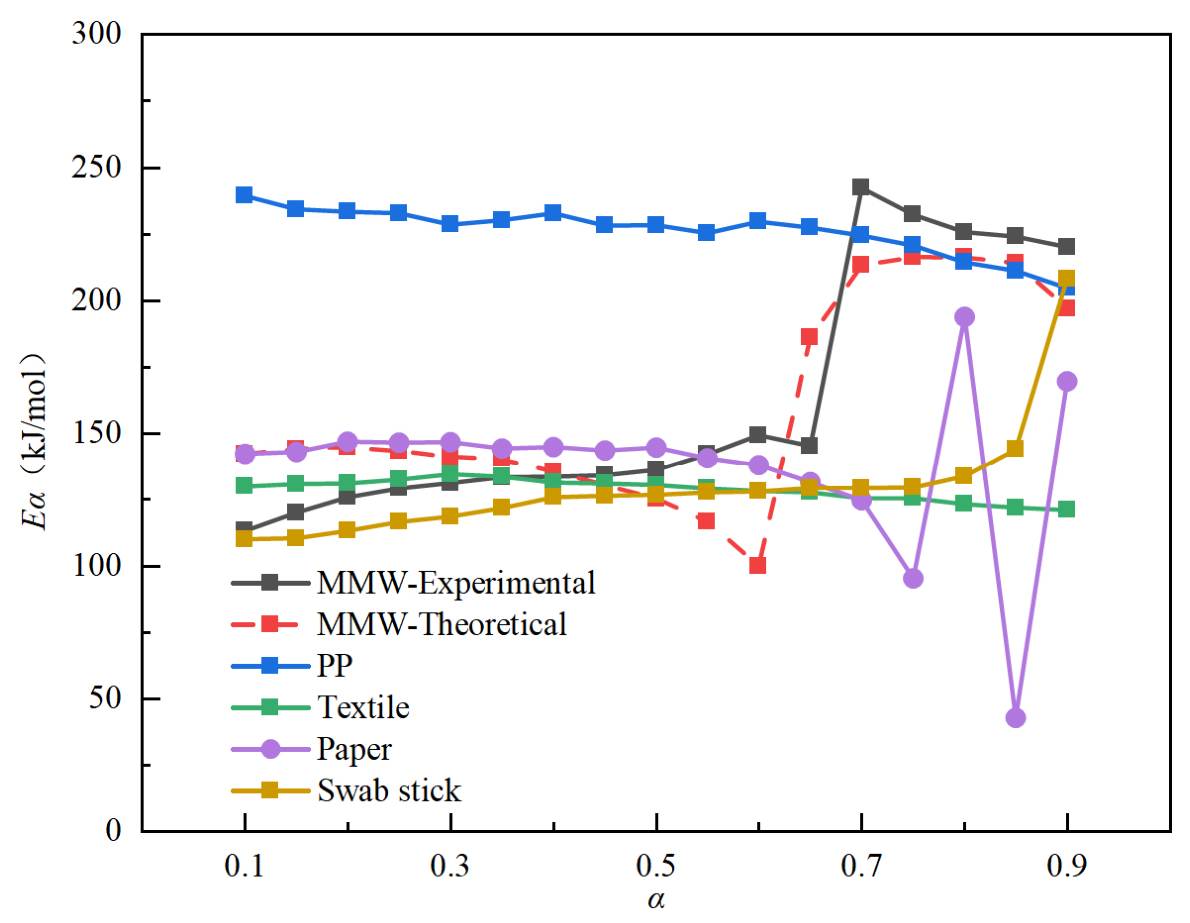
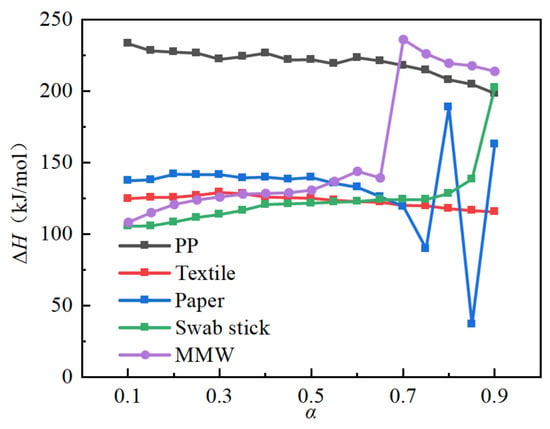
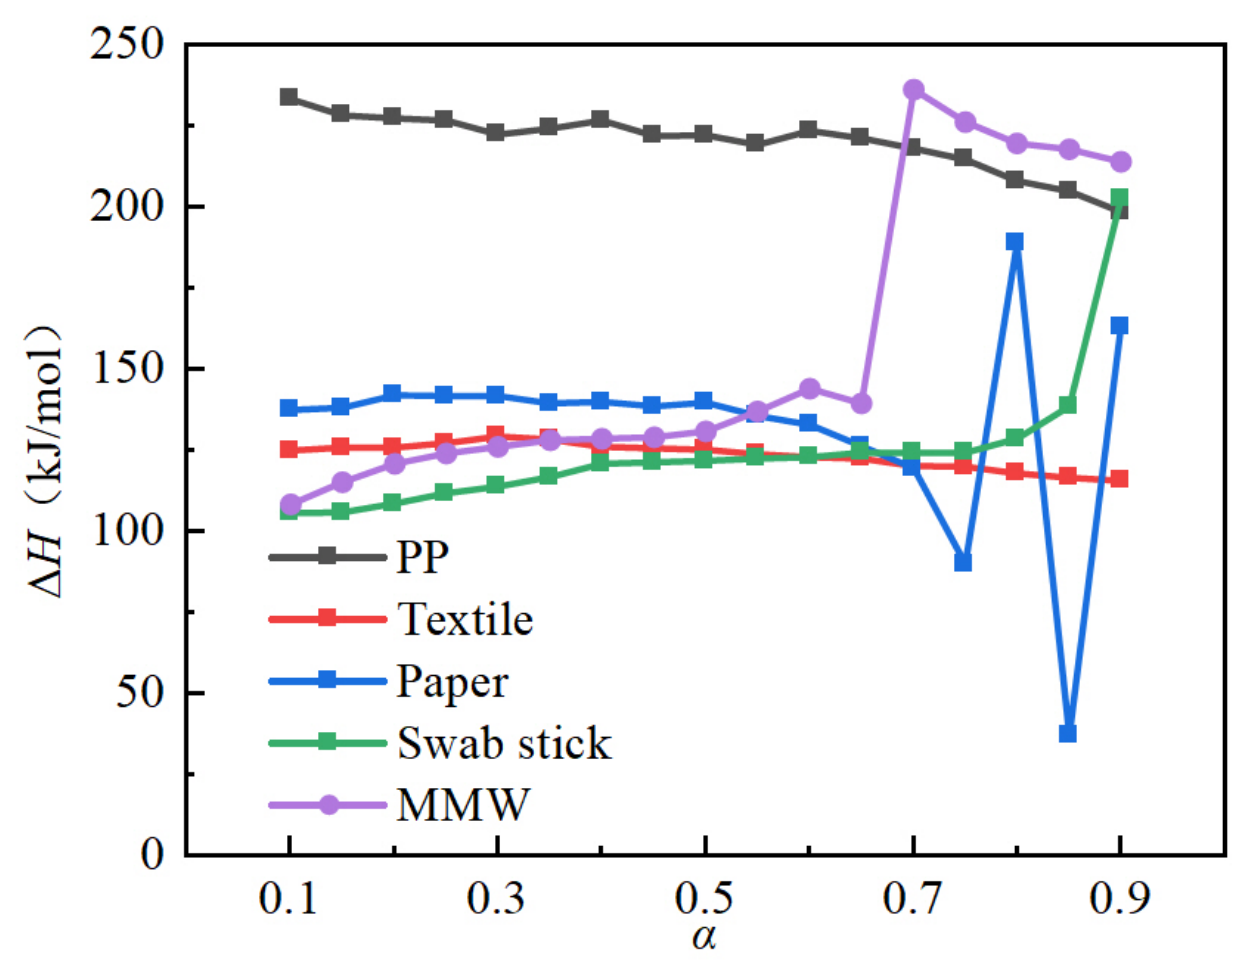
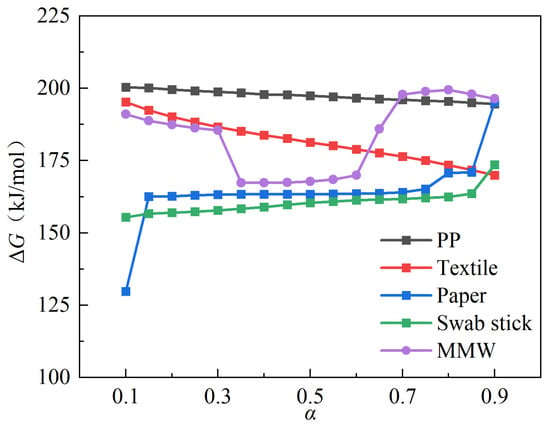
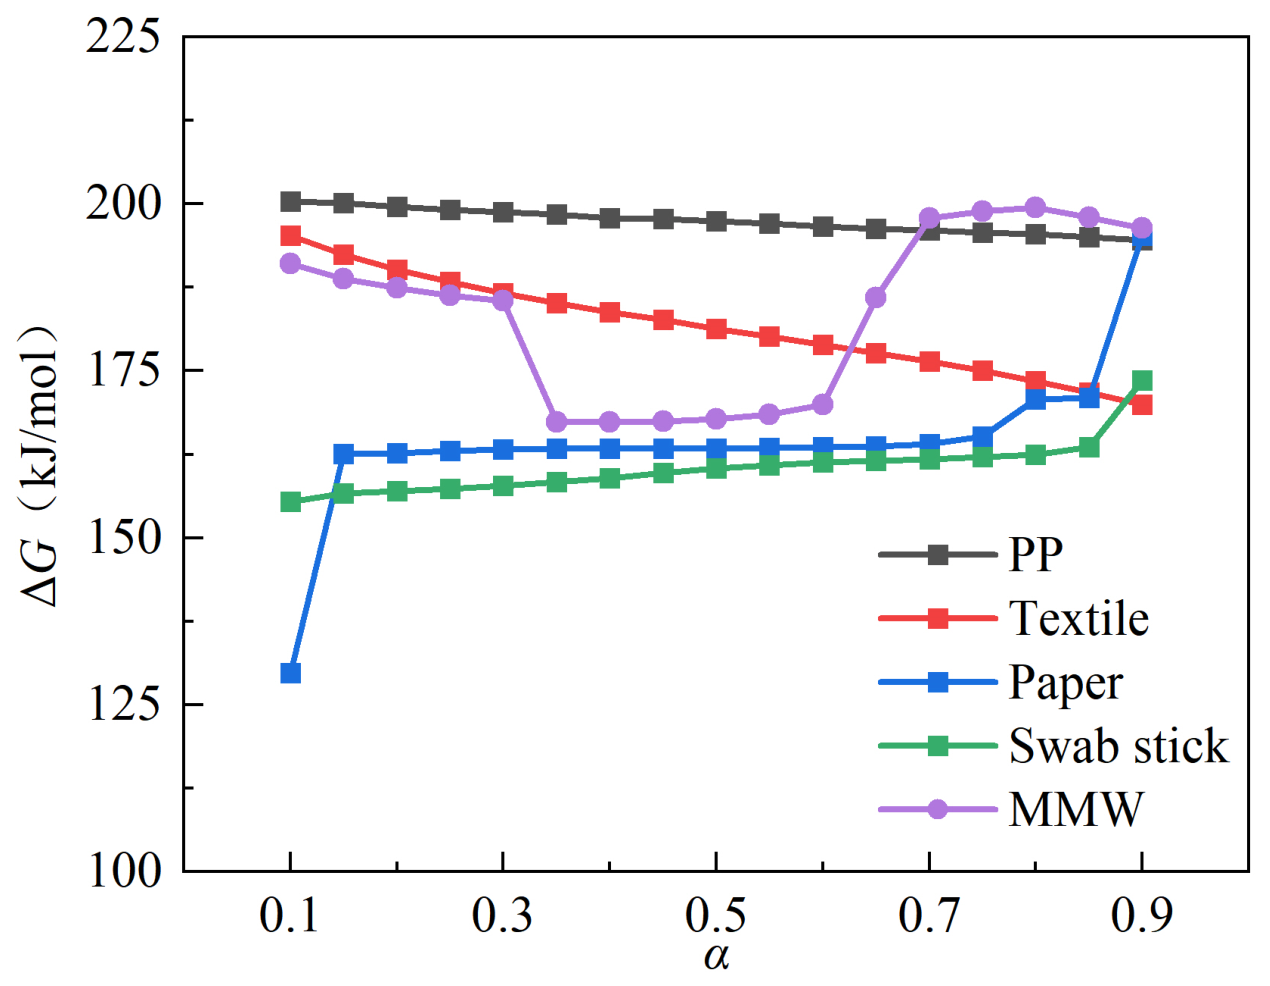
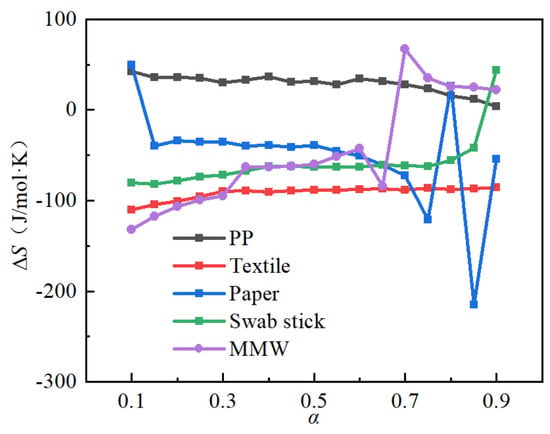
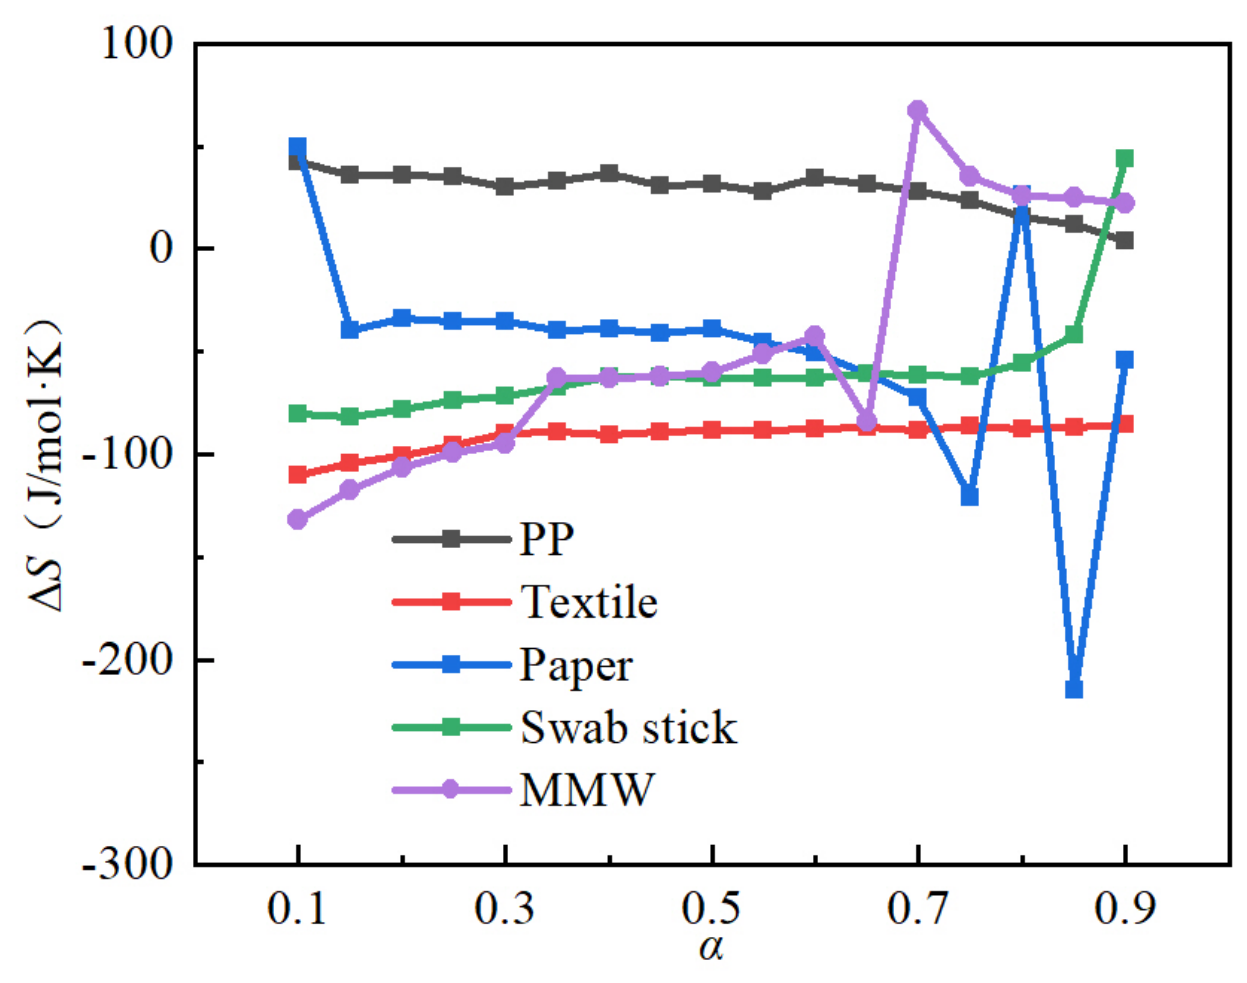

Disclaimer/Publisher’s Note: The statements, opinions and data contained in all publications are solely those of the individual author(s) and contributor(s) and not of MDPI and/or the editor(s). MDPI and/or the editor(s) disclaim responsibility for any injury to people or property resulting from any ideas, methods, instructions or products referred to in the content. |
© 2026 by the authors. Licensee MDPI, Basel, Switzerland. This article is an open access article distributed under the terms and conditions of the Creative Commons Attribution (CC BY) license.