


Abstract
Community energy management is a key enabler for integrating on-site renewable generation, coordinating demand, and decarbonizing energy systems at the community level. While most studies focus on residential and commercial energy communities, maritime ports remain largely underexplored despite their high energy demand and ongoing electrification. This paper proposes a transactive energy community framework for maritime ports that integrates a pool-based local electricity market with battery energy storage. The market operates as a double-sided auction with a uniform clearing price, while battery storage follows a dispatch strategy that prioritizes self-consumption and exploits the remaining capacity for energy arbitrage. Market clearing and storage scheduling are coordinated through an iterative process that progressively adapts battery operation according to market outcomes. The framework is demonstrated using measured electricity demand, simulated photovoltaic generation, and measurement-based wind generation profiles from the Port of Sines, one of Europe’s largest deep-water ports. It achieves MWh of internal energy trading, covering of the daily community demand through local generation and storage. Compared with full grid supply, consumer electricity costs are reduced by an average of , while battery storage provides an additional of savings beyond those achieved by the market alone. Furthermore, renewable self-consumption increases by when storage is active. The results demonstrate that coordinated market and storage operation can increase renewable energy utilization, reduce electricity costs, and enhance the value of shared flexibility resources in maritime energy communities. Compared with a centralized MILP benchmark, the proposed framework clears 64.5% of the MILP volume with only 31.6% of its battery throughput, and achieves a 42.4% higher net benefit per MWh after accounting for battery degradation.
1. Introduction
The electrification of port operations is being accelerated by regulatory initiatives, particularly the FuelEU Maritime Regulation (EU) 2023/1805, which mandates the use of onshore power supply (OPS) for container and passenger ships at berth in EU ports from 2030 onwards [1]. Consequently, maritime ports are undergoing a rapid transformation driven by decarbonization targets, the integration of renewable energy sources, and the increasing deployment of electric infrastructure. As energy-intensive systems with highly heterogeneous and dynamic demand profiles, ports pose significant challenges for coordinating local generation, storage, and consumption while simultaneously minimizing costs, ensuring reliable operation, and reducing emissions [2,3].
A systematic review of energy efficiency in ports identifies operational strategies (e.g., peak shaving and operations optimization), technologies (e.g., equipment electrification, cold ironing and energy storage), renewable energy, alternative fuels and energy management systems as the main levers for improving the energy efficiency and environmental performance of ports and terminals. It also highlights energy management in smart grids with renewable generation as a topic with significant research potential [4]. For seaports operating as smart grids, a mixed-integer linear programming model has been proposed to jointly plan terminal operations (quay cranes, yard equipment, berthing durations) and energy management under uncertain renewable generation. The results show that port microgrids and energy storage systems yield significant cost savings, with quay cranes, cold ironing and reefer containers dominating energy consumption [5]. However, this approach is centralized and cost-driven, optimizing the port as a single decision maker. It does not address how different port participants, with their own generation, consumption and storage assets, can exchange energy through a local market.
Energy communities provide a suitable framework for addressing these challenges by enabling groups of co-located participants to exchange energy locally, reduce peak grid demand, improve renewable energy utilization, and increase energy self-sufficiency [6]. Their internal coordination can rely on centralized energy management systems, which optimize community operation from a global perspective, or on decentralized local electricity markets, where participants interact through market mechanisms [7]. Transactive Energy (TE) extends this concept by coordinating distributed energy resources through economic signals [8]. However, despite the growing interest in energy communities, most existing studies focus on residential or small commercial applications, whereas large industrial infrastructures such as maritime ports remain largely unexplored [9,10].
Within energy communities, generation assets can be broadly classified as dispatchable, such as combined heat and power units or controllable generators, and non-dispatchable, such as photovoltaic and wind generation, whose output depends on environmental conditions [11]. While dispatchable resources can be scheduled to follow demand, non-dispatchable generation introduces temporal mismatches between production and consumption, reducing renewable self-consumption and increasing reliance on the external grid [12]. Energy Storage Units (ESUs) play a key role in mitigating these effects by shifting renewable generation over time and smoothing the variability of photovoltaic and wind resources [13,14]. At the prosumer level, a stochastic-robust day-ahead scheduling model combining robust formulations for predictable parameters with scenarios for highly volatile ones showed that storage assets can reduce the electricity bill by 86% and increase the exportable capacity of a dwelling by 84% [15]. Such day-ahead approaches optimize each prosumer’s schedule under uncertainty, but take community interactions and peer-to-peer transactions as given rather than modelling how storage operation can reshape market outcomes.
An important challenge in storage-integrated energy communities is balancing self-consumption maximization with inter-temporal energy arbitrage [16]. Coordinating storage scheduling with a local electricity market further increases this complexity, since storage operation both influences and is influenced by market outcomes [17]. Despite these advances, an important research gap remains. Existing studies have not addressed the integration of a local electricity market with iterative storage scheduling for large-scale maritime port energy communities comprising heterogeneous participants [18,19].
This paper proposes a Transactive Energy Community framework for the Port of Sines, Portugal, integrating a pool-based local electricity market with a two-phase battery dispatch strategy. The proposed framework separates self-consumption from market participation and iteratively couples storage scheduling with market-clearing outcomes through an Early Stopping Algorithm. The main contributions of this work are: (i) a local electricity market framework for heterogeneous port participants, including consumers, renewable generators, and prosumers; (ii) a two-phase ESU dispatch strategy based on separate state variables for self-consumption and market arbitrage; and (iii) an iterative storage-market coordination mechanism that progressively aligns storage operation with market conditions while remaining computationally suitable for real-time deployment.
2. Materials and Methods
2.1. Proposed Framework
The proposed framework addresses the joint operation of a Transactive Energy Community (TEC) local market and Energy Storage Units (ESUs) through an iterative, feedback-driven architecture (the source code is available in the Supplementary Materials). Market outcomes and storage operation are inherently interdependent: market prices influence storage charging and discharging decisions, while storage operation modifies the net load submitted to the market and consequently affects future clearing outcomes. Port demand is treated as exogenous and remains unchanged by market outcomes. The net load submitted to the market, however, is adjusted according to the forecast demand and the ESU charging and discharging actions. It therefore represents the demand presented to the market rather than the actual demand that will be realized on the following day. Solving these two problems independently therefore requires assumptions about variables that are simultaneously determined by both processes. To overcome this dependency, the proposed framework couples market clearing and storage management within a unified iterative procedure, allowing storage assets to progressively adapt their operation according to observed market outcomes. The overall objective is to increase the utilization of locally available renewable energy while reducing electricity costs for community participants.
This interaction is implemented through two nested feedback loops. Within each market round, the market clears one time step h at a time, and each participant observes the realized outcome, namely the accepted quantity and, for those equipped with an ESU, the resulting state of charge before submitting a proposal for the subsequent time step . This hourly market operation loop ensures that every storage offer is based on the actual state of charge of the ESU. A market round is completed once all hourly clearings over the scheduling horizon have been performed. At that point, the market round convergence loop becomes active: the clearing-price profile obtained over the full horizon is used as an updated expectation of future prices, which the ESU management system exploits to identify the most favourable opportunities for market participation in the following round. Through successive market rounds, storage schedules and market outcomes progressively adapt to one another, leading to the convergence of both price expectations and storage operation. The two feedback loops are described in detail in the following subsections.
2.2. Hourly Market Operation
Figure 1 illustrates the hourly market operation layer governing the interactions within each market round. At each time step h, every participant forms and submits a bid, the market pool clears the available offers, and each ESU management system observes the realised outcome before determining its action for the subsequent time step. This sequential and causal process, illustrated by the ellipses in Figure 1 to indicate the repetition of the loop, ensures that every storage commitment is based on the actual state of charge of the ESU rather than on a planned value, thereby preventing the submission of offers that cannot be physically fulfilled.
Figure 1.
Hourly Market Operation loop: at each time step h, every participant submits a bid, the market pool clears the available offers, and each ESU updates its proposal for time step based on the realised outcome.
2.2.1. Bid Formation
Each community participant submits a price-quantity proposal to the local market at every time step h. Its role (buyer or seller) is determined by the sign of its net load , defined as the difference between local consumption and local energy supply. The positive and negative components of the net load are given by Equations (1) and (2), respectively.
Since the net load is updated at every market round, a participant’s role is not fixed. For the same time step h, a participant may act as either a buyer or a seller depending on the storage actions determined in previous rounds. In the first market round (), the net load corresponds to the original forecast because no storage decisions have yet been made. From the second round onward, the storage schedule obtained in the previous round is incorporated into the net load calculation, as defined in Equation (3).
The proposed price, , represents the participant’s willingness to pay (buyer) or willingness to accept (seller). It is derived from the corresponding grid tariff, , and a negotiation margin, , which reflects the participant’s preference for trading within the community rather than exchanging energy with the external grid. The buyer and seller price formulations are defined in Equations (4) and (5), respectively.
By enforcing and , buyers submit bids below their corresponding grid import tariffs, whereas sellers submit offers above their corresponding grid export tariffs. Consequently, both buyers and sellers retain an economic incentive to trade within the community rather than directly with the external grid.
2.2.2. Market Pool
The local market operates as a double-sided pool auction in which all buy and sell proposals submitted at time step h are ranked according to a merit-order criterion: sell orders in ascending order of price and buy orders in descending order. A transaction can only occur when the buyer’s proposed price, , is greater than or equal to the seller’s proposed price, , as defined in Equation (6). Here, and denote the matched buyer and seller, respectively.
The quantity traded in each match is limited by the minimum of the remaining quantity offered by the seller, , and requested by the buyer, . The matching procedure continues until no additional feasible transactions can be established. The total cleared quantity at time step h is then determined according to Equation (7).
The uniform clearing price is defined in Equation (8) as the midpoint between the marginal accepted seller price, , and the marginal accepted buyer price, .
The midpoint rule splits the bid–ask spread equally between the two marginal participants, distributing the trading surplus symmetrically across both sides. This property is particularly attractive in cooperative TECs, where the objective is to share the benefits of internal trading equitably among participants. Since all accepted transactions are settled at the same uniform clearing price, the mechanism is budget-balanced, meaning that the total payments made by buyers equal the total revenues received by sellers without requiring external subsidies. The clearing price condition is formalized in Equation (9), where the community clearing price is bounded between the grid export tariff and the grid import tariff .
Consequently, every internal transaction is economically preferable to a direct exchange with the external grid for both buyers and sellers. Sellers whose proposed price exceeds and buyers whose proposed price falls below are rejected. Participants whose orders are only partially matched are partially accepted, transacting only the quantity required to reach .
2.2.3. Energy Storage Unit Management System
The ESU management system governs how each storage asset reacts to the clearing outcome of the current time step and forms its proposal for the subsequent one. At each time step h, the ESU observes the accepted quantity and the resulting state of charge before committing its offer for time step . Consequently, the state of charge propagated throughout a market round always corresponds to the realized operating state of the ESU. Furthermore, the ESU operates in a single direction at each time step, either charging or discharging, since a single inverter cannot perform both actions simultaneously. The dispatch strategy is organized around two priorities that share the same state of charge: (i) self-consumption and (ii) market participation.
Self-consumption is assigned the highest operational priority. For participant , the self-consumption energy is defined by Equation (10): the ESU discharges when and charges when .
is defined in Equation (11) that is dependent of: (i) maximum inverter power of ESU of player : ; (ii) forecasted net load of player at step h: ; and (iii) the available capacity of the ESU to discharge , defined in Equation (12).
is defined in Equation (13) that is dependent of: (i) maximum inverter power of ESU of player : ; (ii) forecasted net load of player at step h: ; and (iii) the available capacity of the ESU to charge , defined in Equation (14).
Market participation is subsequently performed using the remaining power and energy capacity available after self-consumption. In this stage, the ESU may increase the energy exchanged in the same direction established by self-consumption to exploit arbitrage opportunities, since reversing the operating direction within the same time step is not permitted.
If self-consumption is inactive, either because or because the ESU has reached a state-of-charge limit, the operating direction is determined exclusively by the market participation strategy. Consequently, self-consumption and market participation may coexist within the same time step provided that both actions remain aligned in the same operating direction. This formulation preserves the priority of local energy balancing while allowing the remaining storage flexibility to participate in the market.
The evolution of the ESU state of charge is determined by the self-consumption energy, , and the market energy, . The state-of-charge update is given by Equation (15). In this equation, denotes the total energy exchanged by the ESU during time step h, represents the ESU energy capacity, and denotes the one-way conversion efficiency. The operators and represent the positive and negative parts of a variable, respectively.
The total net energy exchanged by the ESU, , is obtained as the sum of the self-consumption energy, , and the market energy, , as defined in Equation (16).
The ESU dispatch is constrained by the inverter power limit, , which is shared between self-consumption and market participation. Furthermore, the state of charge must remain within its physical operating limits, as defined in Equation (17).
For market participation, the ESU uses the clearing-price profile obtained in the previous market round to identify arbitrage opportunities. This constitutes a heuristic based on observed outcomes rather than a price forecasting mechanism, since no statistical or model-based prediction is performed and the previous-round profile is taken directly as the expectation for the current round. This choice keeps the ESU management system free of exogenous forecasting models, with the accuracy of the expectation improved endogenously as successive rounds progressively align the expected and realized price profiles. At each time step h, the current clearing price, , is compared with the clearing prices expected for subsequent time steps, . Subject to the power and state-of-charge headroom remaining after self-consumption, the ESU charges when prices are expected to increase and discharges when prices are expected to decrease.
Since charging and discharging incur conversion losses, arbitrage is only economically viable when the expected price spread compensates for the round-trip efficiency penalty. Considering the ESU one-way efficiency, , the charging and discharging conditions are defined by Equations (18) and (19), respectively. When neither Equation (18) nor Equation (19) is satisfied, the ESU remains idle.
The resulting market energy, , is considered positive when charging and negative when discharging. This energy is incorporated into the participant’s net load and used to form the bid submitted in the subsequent market round. Any portion of a market offer that is not matched is discarded and therefore does not contribute to the state-of-charge update.
2.3. Market Round Convergence
Figure 2 illustrates the market round convergence layer. In the first round , no ESU schedules are yet available, and the market clears using only the forecasted net load , yielding the initial clearing-price profile and cleared quantities .
Figure 2.
Market round convergence process. The clearing price obtained in round is used as the price expectation for round m. ESU schedules are iteratively updated until the stopping criterion is satisfied.
From the second round onward (), the updated net load , which incorporates the ESU schedules from the previous round, is submitted to the Hourly Market Operation layer. This process generates updated clearing-price and cleared-quantity profiles, namely and .
The resulting market outcomes are then evaluated through the objective function , which quantifies the amount of energy traded within the community. Whenever an improved solution is identified, the incumbent objective value is updated according to . The Stopping Algorithm subsequently determines whether an additional market round should be executed or whether convergence has been achieved. The objective function and stopping procedure are described in the following subsections.
The cleared quantity serves as an observable measure of internal market activity, and the fitness function therefore quantifies the total amount of energy cleared within the community during market round m. By construction, energy transiting through an energy storage unit is counted twice (once when the storage unit procures energy from the market and again when that energy is subsequently discharged and traded). This double counting is intentional, as the objective function is designed to capture both direct renewable energy trading and the additional internal market activity enabled by storage flexibility. To restrict non-viable arbitrage, the round-trip efficiency constraints in Equations (18) and (19) limit storage participation to price spreads that compensate for conversion losses. Consequently, the fitness function should not be interpreted as a direct measure of physical renewable energy utilization or community self-sufficiency. These physical indicators are assessed separately in Section 3.3, where the fraction of community load covered by local generation and storage discharge is reported.
Stopping Algorithm
The iterative optimization process is terminated when one of two stopping criteria is satisfied. The first criterion is based on the maximum number of market rounds, denoted by . Once the round index m exceeds this predefined limit, the optimization procedure is terminated regardless of the recent evolution of the fitness value.
The second criterion is implemented through the Early Stopping Algorithm (ESA), which monitors the patience counter . After each market round, the value of is updated according to the rule defined in Equation (20). The counter is reset whenever the current fitness value exceeds the incumbent fitness value . Otherwise, the counter is incremented to record an additional round without improvement.
The optimization process is terminated when the patience counter exceeds the predefined patience threshold . Consequently, the overall stopping condition is defined by Equation (21), which combines the maximum-round criterion and the early-stopping criterion.
This termination strategy promotes computational efficiency while maintaining solution quality. The search process continues while improvements in the fitness value are identified and terminates when no further progress is observed for a sufficient number of consecutive rounds. As a result, unnecessary evaluations are avoided once the optimization procedure has effectively converged.
Upon termination, the storage schedules corresponding to the best solution identified throughout the iterative process are reinstated, and a final market clearing and pool settlement are performed. The resulting cleared quantities and settlement outcomes therefore correspond to the best fitness value obtained across all market rounds.
2.4. Centralized Benchmark: Mixed-Integer Linear Program
To assess the performance of the proposed causal, decentralized mechanism against centralized coordination, a centralized benchmark is formulated as a mixed-integer linear program (MILP) over the entire scheduling horizon. The benchmark retains the main market rules described in Section 2.1, including the bid prices defined in Equations (4) and (5), the bid-matching condition of Equation (6), the midpoint clearing-price rule of Equation (8), and the objective of maximizing the cleared energy. The objective function and all constraints are linear in the decision variables. The bid prices and , as well as the efficiencies, are parameters, while the binary variables , and appear only in products with constant coefficients, such as the big-M term and the power limits. The clearing price is computed after optimization and is not part of the optimization model. The problem is therefore a mixed-integer linear program, which was solved once per scenario with the COIN-OR Branch-and-Cut (CBC) solver, implemented in Python 3.10.18 using PuLP 2.8.0 and run with its default settings, without imposing a time limit or an optimality-gap tolerance.
In comparison with the proposed causal framework, the centralized benchmark differs in three main aspects: (i) all time steps are optimized jointly, assuming full knowledge of forecasts, tariffs, and negotiation margins, rather than sequentially, hour by hour and round by round; (ii) ESU dispatch is optimized directly as a decision variable, without imposing the self-consumption priority defined in Equation (10) or the arbitrage conditions specified in Equations (18) and (19); and (iii) the market pool is represented through feasibility constraints rather than explicit merit-order matching. Since the benchmark is solved once over the entire scheduling horizon, the market rounds described in Section 2.3 and the stopping algorithm presented in Section Stopping Algorithm.
2.4.1. Storage Model and Net Position
For each ESU, charging and discharging energies at time step h are represented by the non-negative variables and , respectively, as defined in Equations (22) and (23). As in the causal framework, simultaneous charging and discharging is prevented by the binary variable . The net energy exchange of each ESU is given by Equation (24). The SoC dynamics and limits remain unchanged, as defined in Equations (16) and (17), and the initial SoC is the same as in the causal framework. Since self-consumption and market transactions are not explicitly distinguished in the MILP formulation, the contribution of storage to self-consumption is determined a posteriori from the optimized dispatch.
The net load after storage dispatch is defined by Equation (25), which extends Equation (3) by using a single storage term and reduces to the forecasted net load for participants without an ESU. The net load is decomposed into the non-negative quantities to buy, , and to sell, , as defined in Equation (26). The binary variable determines whether participant acts as a buyer or a seller at time step h, while sets the upper bound on the energy that can be exchanged by a participant in a single time step. The constraints ensure that the quantity associated with the non-selected role is zero.
2.4.2. Pool Representation and Objective
Bid prices and are defined by Equations (4) and (5). Since tariffs and negotiation margins are known, these prices are parameters rather than decision variables. Without explicit merit-order sorting, the bid-matching condition in Equation (9) is represented using an auxiliary price and a binary eligibility variable . A participant’s bid is eligible for trading only if it is compatible with . The auxiliary price is optimized jointly with the other decision variables to maximize the total cleared energy at each time step h.
The cleared quantity is constrained by the total eligible buying and selling volumes in the community, replacing the pairwise clearing formulation of Equation (7).
The objective is consistent with the fitness function defined in Section 2.3, enabling a direct comparison with a single market round of the proposed framework. The MILP, defined by the constraints in Equations (22) and (23) and the objective function in Equation (29), is solved once per scenario using the CBC solver via Python. The solution provides the storage schedules and cleared quantities for all time steps simultaneously.
2.4.3. Break-Even Price
Since is introduced solely to enforce the matching feasibility conditions, it has no direct economic interpretation. The clearing price is therefore calculated after optimization by applying the midpoint rule in Equation (8) to the marginal bids in the optimal allocation, namely, the lowest buying price and the highest selling price among participants with strictly positive traded quantities, as defined in Equation (30). This post-processing step does not affect the optimal allocation or the objective value; it assigns a clearing price according to the same midpoint convention used in the causal framework.
3. Results
3.1. Maritime Port Case Study
The proposed framework is evaluated using a case study based on the Port of Sines, Portugal, one of the largest deep-water ports in Europe. The energy community comprises thirteen consumers, two renewable generation assets, and two Energy Storage Units (ESUs). Although the available dataset covers the entire month of August, the analysis focuses on a representative day, 22 August 2025, selected because its renewable generation and electricity demand profiles are close to the monthly average.
Electricity demand is represented by real metering data from thirteen independent consumers, recorded as average active power at a fifteen-minute resolution and aggregated into hourly values. The consumers are highly heterogeneous, ranging from small tertiary buildings to a dominant industrial facility, with a total daily demand of MWh. Photovoltaic generation is obtained from a MWp system simulated in PVSyst for the Port of Sines, whereas wind generation is derived from an available set of real wind power measurements collected in 2021 and scaled to represent a MW installation. The installed renewable capacity is selected so that the total daily renewable generation is approximately times the community demand, ensuring the presence of renewable energy surplus periods that allow the proposed market and storage management strategy to be meaningfully evaluated. Since demand, photovoltaic generation, and wind generation originate from different sources, all time series are synchronized to a common hourly resolution. The main characteristics of the case study are summarized in Table 1.
Table 1.
Case study setup for the Port of Sines community.
Two ESUs are considered, each representing a different ownership and operational model. The first is a community-owned battery located at the aggregator node, rated at MW and 6 MWh. Its power rating is selected according to the coincident peak community renewable surplus, while its energy capacity is sized to absorb most of the daily renewable surplus and shift it to periods of higher demand. Since this storage system does not currently exist at the Port of Sines, it is modelled as a hypothetical community asset. Without an associated local load, it operates exclusively through market participation, charging during low-price periods and discharging during high-price periods.
The second ESU belongs to the largest consumer, which accounts for approximately of the community’s daily electricity demand. As this participant has no local renewable generation, its battery combines self-consumption with market arbitrage. It primarily discharges to supply the participant’s own demand and uses any remaining flexibility for market participation. The storage system is rated at MW and 2 MWh. Its power rating is consistent with the participant’s average demand, while its energy capacity corresponds to approximately of its daily electricity consumption, allowing it to exploit intra-day price variations. Considering both a community-owned battery and a participant-owned battery enables the proposed framework to assess the relative merits of community-owned and participant-owned storage.
Both ESUs are assumed to have a one-way charging/discharging efficiency of , resulting in a round-trip efficiency of . They operate within a usable state-of-charge range between and . The main characteristics of both storage systems are summarized in Table 2.
Table 2.
Characteristics of the two energy storage units.
3.2. Market Operation: Pricing and Cost Reduction
The market operation is first evaluated through the hourly clearing prices and the volume of energy exchanged within the community over the representative day. In the present case study, all community members are assumed to share the same electricity retailer and tariff plan. Consequently, the grid import and export tariffs are identical for all participants, i.e., and for all . Over the representative day, the import tariff ranges from 118 to 196 €/MWh, whereas the export tariff ranges from 10 to 17 €/MWh.
Across the twenty-four hourly auctions, the clearing price always remains within the interval bounded by the export and import tariffs, in agreement with Equation (9). The clearing price ranges from to 104 €/MWh, with a daily average of €/MWh.
The observed price behaviour results directly from the proposed bidding strategy. In this case study, each participant uses a single negotiation margin for both buying and selling, independently sampled for each participant and hour from a uniform distribution over the interval . This choice introduces heterogeneous bidding behaviour while ensuring that all bid prices remain within the grid tariff interval. Consequently, the midpoint clearing rule guarantees that every clearing price also remains within these bounds, independently of the specific bid configuration.
Every cleared transaction therefore benefits both buyers and sellers. Buyers always purchase electricity below the corresponding grid import tariff, whereas sellers receive a higher remuneration than the grid export tariff. The minimum benefit for buyers reaches 14 €/MWh relative to grid imports, while sellers consistently receive prices well above the corresponding export tariff.
Figure 3 presents the hourly evolution of the clearing price together with the corresponding grid import and export tariffs. The clearing price follows the expected daily pattern, reaching its minimum of €/MWh around midday, when photovoltaic generation is highest and renewable surplus increases market competition among sellers. Conversely, the maximum price of 104 €/MWh occurs during the evening peak (hour 20), when local renewable generation decreases and demand is increasingly supplied by storage and residual grid imports. The clearing price remains within the tariff interval throughout the day, confirming the expected operation of the proposed market mechanism.
Figure 3.
Hourly clearing price over the representative day, bounded by the common grid import tariff and export tariff .
The resulting price structure translates directly into economic benefits for the community. Relative to full grid exchange under the baseline scenario ( €, comprising € in import costs and € in export revenue), the total benefit over the representative day is approximately 2285 €, corresponding to of that baseline value. Of this amount, approximately 1804€ ( of the baseline import cost), corresponds to avoided grid import costs, while € ( of the total benefit) is internally transferred between participants through the market settlement. Since the market is budget-balanced by construction, these internal payments are redistributed within the community rather than transferred to the external electricity supplier.
3.3. Management System: Increasing Local Energy Exchange
The contribution of the ESU management system is assessed through its impact on the volume of energy exchanged within the community and on its dependence on the external grid. Over the representative day, the total cleared energy reaches MWh, compared with a community demand of MWh and a renewable generation of MWh. Consequently, the cleared volume corresponds to of the community demand. Although this value exceeds unity, it does not imply that more energy is consumed than demanded. Instead, it reflects the fact that the cleared volume includes both direct renewable-to-load transactions and the additional market exchanges introduced by storage operation.
To distinguish these contributions, the cleared energy is decomposed according to its origin and destination. On the supply side, photovoltaic and wind generation contribute and MWh, respectively, resulting in MWh of renewable energy traded within the community. The community battery contributes an additional MWh through arbitrage discharge. On the demand side, the twelve pure consumers purchase MWh directly, the prosumer associated with the dominant load purchases MWh to charge its battery, and the community battery purchases MWh during its charging periods.
The cleared volume therefore exceeds the community load because each unit of energy transiting through a storage unit is counted once when the unit purchases it and again when it is discharged into the market. Storage charging alone accounts for MWh of the cleared quantity, of which the community battery represents the dominant share. This decomposition isolates the portion of market activity that originates from storage flexibility from the portion that directly serves consumption.
Figure 4 shows the hourly market-accepted power of both storage units over the representative day (the grey and white backgrounds simply distinguish time periods and do not represent additional data).. The community battery exhibits a clear arbitrage pattern, discharging during the night and early morning (–8), when the clearing price ranges from to €/MWh, and charging during the midday period (–13), when photovoltaic surplus reduces the clearing price to its daily minimum of €/MWh. This operating pattern is consistent with the proposed arbitrage strategy, where charging is favoured during low-price periods and discharging during high-price periods that compensate for storage efficiency losses. From hour 14 onward, the community battery remains idle, indicating that no further profitable arbitrage opportunities are identified.
Figure 4.
Market-accepted charge and discharge energy of the community battery and the prosumer battery in each hour of the representative day. Positive values indicate market purchases (charging) and negative values indicate market sales (discharging).
The prosumer battery appears exclusively as a buyer throughout the day, with no market sales recorded. This behaviour reflects its operating strategy: the battery purchases energy through the market and subsequently discharges to supply the participant’s own demand. Since self-consumption takes place outside the market, the discharge process is not visible in Figure 4.
Figure 5 illustrates the impact of storage on the utilization of local renewable generation. Without storage, MWh of the MWh generated is consumed within the community, while the remaining MWh is exported to the grid because the midday generation peak does not coincide with the morning and evening demand peaks.
Figure 5.
Hourly renewable generation consumed locally versus exported to the grid (upper panel), and community load covered by local generation versus imported from the grid (lower panel), for the scenarios without storage and with storage.
When storage is enabled, local renewable self-consumption increases to MWh (), while grid exports decrease to MWh (), as the batteries shift surplus renewable generation from midday to periods of higher demand. Consequently, the amount of demand supplied by local generation increases from MWh to MWh, reducing grid imports from MWh to MWh (). These results demonstrate that the principal contribution of storage is to provide temporal flexibility, improving the match between renewable generation and electricity demand rather than increasing the amount of renewable energy produced.
Table 3 summarizes the daily economic impact for each participant under the scenarios without and with storage. For the twelve pure consumers, the average cost reduction increases from to when storage is introduced. The participant equipped with a battery achieves a smaller additional benefit, from to , because part of its storage capacity is already dedicated to self-consumption. Renewable generators also benefit substantially, with revenue increases reaching up to relative to direct grid export. A more detailed discussion of these results, including the comparison between community-owned and participant-owned storage, is presented in Section 4.
Table 3.
Per-participant daily cost reduction (consumers and prosumer) and revenue increase (generators), with and without storage. The symbol † identifies the participant equipped with its own battery. Costs and revenues are in € for the representative day.
3.4. Operating Conditions Analysis
The middle scenario is considered as the reference case for the remainder of the analysis in Section 3. Its main characteristics are summarized as follows: the generation-to-demand ratio is , and two ESUs are considered, with ratings of and for the community and a single participant, respectively.
3.4.1. Renewable/Demand
To assess the impact of different renewable generation-to-demand profiles, the original dataset was synthetically modified by scaling the renewable generation and demand profiles by constant factors while preserving their temporal profiles. Two additional scenarios were defined, with generation-to-demand ratios of and , representing lower and higher renewable availability relative to demand, respectively.
The results are presented in Table 4. All scenarios were evaluated with a maximum number of market rounds of . In all three scenarios, the early stopping algorithm terminated the process before the maximum number of rounds was reached, with convergence occurring at round 2 and a total of four rounds being executed. This resulted in similar computational times across the three scenarios.
Table 4.
Sensitivity to the generation-to-demand ratio (same ESUs: community battery 1.5 MW/6 MWh, initial SoC 0.9; player battery 0.5 MW/2 MWh, initial SoC 0.1). Round 1 denotes the first market round, in which no ESU schedules are available.
The share of renewable generation traded within the community increases as the generation-to-demand ratio decreases, reaching in the low-generation scenario compared with in the high-generation scenario. This reflects the larger fraction of available renewable generation that can be absorbed by the community when renewable availability is lower relative to demand. Conversely, when renewable generation exceeds demand by a larger margin, a greater fraction of the surplus is exported to the grid, as indicated by the increase in unmatched sell volume from MWh in the low scenario to MWh in the high scenario.
Despite these differences in renewable generation traded and grid exchanges, the best fitness values remain relatively close across the three scenarios, ranging from to MWh. This indicates that the amount of energy cleared by the market is comparatively robust to changes in the generation-to-demand ratio, although the composition of the exchanged energy changes substantially. The unmatched buy volume also varies consistently with the availability of local renewable generation, decreasing from MWh in the low scenario to MWh in the high scenario.
The comparison with the first market round, in which no ESU schedules are available, further highlights the contribution of storage. The use of ESUs increases the amount of renewable energy sold in the pool by more than in all three scenarios, with gains ranging from to relative to the corresponding round without ESUs.
3.4.2. Negotiation Margins
Negotiation margins introduce participant-specific heterogeneity into the market while preserving the common tariff structure of the case study. Since all players considered in the Port of Sines case study are subject to the same baseline tariffs agreed with the Port Administration, heterogeneity in market participation is introduced through participant-defined negotiation margins. This allows each participant to adjust its effective buying and selling prices according to its preferences, energy management needs, and market participation strategy.
To assess the impact of negotiation margins on the proposed market management system, six scenarios were considered. In the first five scenarios, all participants were assigned negotiation margins within the same predefined range: 20–30%, 45–55%, 70–80%, 85–95%, and 95–99%. In the sixth scenario, denoted as the mixed scenario, different negotiation margins were assigned to different participants, introducing greater heterogeneity in their bidding behaviour. The results are presented in Figure 6, which compares the resulting clearing prices and the total cleared energy across the six scenarios.
Figure 6.
Effect of the negotiation margins on (a) the clearing price and (b) the cleared energy in the best-performing round. Bars show the mean clearing price, diamonds the volume-weighted price, and whiskers the hourly minimum and maximum. The base case (85–95%) is highlighted in dark blue and the mixed scenario (20–99%) in orange.
Table 5 shows that higher negotiation margins generally lead to higher clearing prices. The mixed scenario achieves the highest fitness value, at 18.19 MWh, corresponding to a 124.3% increase relative to the first round without ESUs. This indicates that heterogeneous negotiation margins can increase the amount of energy cleared by the market in the considered case study. However, the amount of renewable energy sold in the pool does not follow the same trend, highlighting that higher total market activity does not necessarily imply greater renewable energy trading.
Table 5.
Sensitivity to the negotiation margin N (same ESUs: community battery 1.5 MW/6 MWh, initial SoC 0.9; player battery 0.5 MW/2 MWh, initial SoC 0.1; community demand 13.33 MWh and renewable generation 17.77 MWh in all scenarios). Round 1 is the first market round, in which no ESU schedules are available. “Mixed” assigns different margin ranges to different players.
The results also illustrate the operation of the early stopping algorithm. For all scenarios, the maximum number of market rounds was set to . In the mixed scenario, the best fitness was reached at round 4, and five rounds were executed, whereas in the remaining scenarios the best fitness was reached at round 2, with four rounds executed. This shows that the algorithm allows additional iterations when improvements continue, while avoiding unnecessary computation when the solution converges earlier.
3.4.3. Energy Storage Units
Energy Storage Units (ESUs) provide flexibility to the proposed framework by enabling energy time-shifting and supporting economic savings. Although the framework is designed around the operational characteristics of the Port of Sines, this sensitivity analysis investigates how different battery configurations affect market outcomes.
The mixed negotiation-margin scenario (20–99%) was adopted as the baseline for this analysis. The initial state of charge (SoC) was set to 0.5 for both batteries, while community demand and renewable generation were kept constant at 13.33 MWh and 17.77 MWh, respectively, across all scenarios.
The first two rows of Table 6 define the ESU configurations considered. Scenario F, which includes the largest community and participant batteries, achieves the highest fitness value, at 19.80 MWh. However, the results do not establish a direct relationship between battery size and market performance. For example, scenario B, which includes only the community battery, achieves a fitness of 16.57 MWh, slightly higher than the 16.25 MWh obtained in scenario E, which includes medium-sized community and participant batteries. This suggests that market outcomes depend not only on installed storage capacity but also on how the ESU schedules interact with the market-clearing process. Since accepted orders determine the energy actually traded and influence subsequent ESU decisions, changes in battery configuration can lead to nonlinear effects on the resulting market outcomes.
Table 6.
Sensitivity to battery sizing. Round 1 is the first market round, in which no ESU schedules are available.
Table 7 provides further insight into the community battery’s market participation by comparing offered and accepted purchase and sale volumes in the incumbent round. Scenarios B and F achieve the two highest fitness values, but their acceptance patterns differ. In scenario B, 41% of both purchase and sale volumes are accepted. In scenario F, 40% of purchase volumes are accepted, while the acceptance rate for sales falls to 15%. Nevertheless, scenario F achieves the highest fitness and the largest volume of renewable energy sold in the pool, at 15.16 MWh. These results indicate that overall market performance cannot be explained by the acceptance rate of a single order direction alone; the volumes offered, the resulting accepted quantities, and their interaction with the market-clearing process must also be considered.
Table 7.
Community battery acceptance in the incumbent round for the battery sizing scenarios. Offered volumes are the sums of the community battery’s hourly orders over the 24 h, and accepted volumes are the parts of those orders cleared in the pool. Acceptance is the accepted volume divided by the offered volume for the same direction (purchase or sale).
Table 8 presents the participant battery’s purchase acceptance. Its primary contribution is to support the participant’s own consumption rather than to sell energy to the pool. Across scenarios C, D, E, and F, the battery supplies 1.41, 1.30, 0.97, and 1.19 MWh, respectively, to the participant’s own load. By comparison, its sale orders amount to 0.07, 0.00, 0.07, and 1.26 MWh, respectively, with only 0.07 MWh accepted in scenario C. This confirms that the participant battery’s role in the considered configurations is predominantly associated with self-consumption, while its direct contribution to market sales remains limited.
Table 8.
Participant battery charging acceptance in the incumbent round for the battery sizing scenarios. Offered purchases are the battery’s hourly purchases above the participant’s own net demand, and acceptance is the accepted volume divided by the offered volume.
3.4.4. Mixed-Integer Linear Program
The proposed framework is compared with the centralized MILP benchmark described in Section 2.4, which optimizes all time steps jointly. The comparison focuses on three aspects: the total cleared energy, the effect of negotiation margins, and the use of ESUs. In all cases, both approaches use the same demand (13.33 MWh), renewable generation (17.77 MWh), tariffs, and midpoint clearing-price rule.
The MILP consistently achieves a higher cleared volume than the proposed framework. In the base case, the proposed framework clears 64.5% of the MILP volume (17.07 versus 26.47 MWh), while in the mixed-margin scenario this ratio increases to 68.7% (18.19 versus 26.47 MWh). This difference is consistent with the centralized MILP optimizing all time steps jointly with full knowledge of the available information, whereas the proposed framework operates causally: ESU orders may be rejected during market clearing, and subsequent decisions depend on the outcomes of previous time steps.
Table 9 compares the effect of negotiation margins on both approaches. The MILP yields the same cleared volume across all tested margin ranges, whereas the volume obtained with the proposed framework varies from 15.00 to 17.07 MWh, a variation of approximately 12% relative to the lowest value. In the proposed framework, negotiation margins affect both order acceptance and the arbitrage conditions in Equations (18) and (19), thereby influencing the resulting market volume. By contrast, in the MILP, the tested margins affect the clearing prices but do not change the optimal cleared volume. The mean clearing prices follow similar trends in both approaches, reflecting their dependence on the tariffs and negotiation margins. Thus, negotiation margins influence both market participation and the resulting cleared volume in the proposed framework, whereas their effect in the MILP is limited to the price outcome under the tested scenarios.
Table 9.
Effect of the negotiation margins on the proposed framework and on the centralized MILP. The proposed framework values are those of the incumbent round, and the volume ratio is the cleared energy of the proposed framework divided by that of the MILP.
Regarding ESU operation, Table 10 shows that the higher cleared volume achieved by the MILP is accompanied by more intensive battery cycling. The total battery throughput is approximately 3.2 times that of the proposed framework, with up to 3.15 equivalent full cycles per day. The MILP also exhibits 12 and 16 charge/discharge reversals for the community and participant batteries, respectively, compared with 1 and 9 in the proposed framework. These results indicate that the additional market volume achieved by the MILP comes at the cost of greater battery utilization and, consequently, higher estimated degradation.
Table 10.
Proposed market versus the centralized MILP benchmark in the base case (85–95% margins). The no-storage case clears 8.11 MWh under both approaches. Battery indicators are computed from the hourly SoC trajectories of the community battery (6 MWh) and the participant battery (2 MWh) in the incumbent round.
Figure 7 shows distinct SoC trajectories for the two approaches. Under the proposed framework, the community battery discharges overnight and charges around the midday renewable generation peak, resulting in comparatively smooth trajectories. In contrast, the MILP exhibits more frequent SoC variations throughout the day, consistent with its more intensive battery cycling. The community battery also ends the day at an SoC of 0.29, compared with its initial value of 0.90, because no terminal SoC constraint is imposed in the MILP.
Figure 7.
Hourly state of charge of the community battery (upper panel) and the participant battery (lower panel) in the base case, for the proposed framework and the centralized MILP. Dotted lines mark the SoC limits (0.1 and 0.9).
The economic performance of the two approaches is compared using the net benefit per MWh of cleared energy. The gross benefit associated with the energy cleared over the 24-h period is calculated using Equation (31), and the net benefit per MWh is obtained using Equation (32).
The total energy throughput of ESU e over the 24-h period is calculated using Equation (33), where denotes its energy capacity and its state of charge at the end of hour h, with representing the initial state of charge.
The energy cycled by each ESU is expressed in equivalent full cycles by Equation (34).
The degradation cost is estimated using the throughput-based model proposed in [20], with cycle-aging coefficients taken from [21]. The capacity loss of ESU e is calculated using Equation (35), and the corresponding degradation cost is obtained from Equation (36). Here, denotes the capacity loss of ESU e over the day (%), is its energy throughput in kWh, as defined in Equation (33), is its energy capacity in kWh, and is its maximum C-rate (0.25 h−1 for both ESUs). The coefficients and are taken from [20] and were obtained for a reference battery with a capacity of kWh. Accordingly, the throughput is scaled by to apply the model to ESUs of different capacities. The end of battery life is defined as the point at which the battery retains of its initial capacity; thus, represents the fraction of battery life consumed. The installed battery cost, , is set to 100 €/kWh, the lowest value considered in [20]. This assumption minimizes the estimated degradation cost and is therefore the most favorable of the tested cost assumptions for the MILP.
Applying Equation (31) to the base case, the proposed framework achieves a gross benefit of € for 17.07 MWh cleared, corresponding to 133.83 €/MWh. The MILP achieves € for 26.47 MWh, corresponding to 139.80 €/MWh. The higher gross benefit per MWh obtained by the MILP reflects the additional energy cleared during hours with larger spreads between and , averaging 150.7 €/MWh for the additional 9.39 MWh. However, this higher cleared volume is accompanied by substantially more intensive battery cycling. Based on the throughputs reported in Table 10, Equation (35) yields capacity losses of 0.0164% and 0.0092% for the community and participant ESUs, respectively, under the proposed framework, compared with 0.0444% and 0.0515% under the MILP. Applying Equation (36) gives degradation costs of € for the proposed framework and € for the MILP, equivalent to 34.14 and 69.78 €/MWh cleared, respectively. Substituting these values into Equation (32) yields net benefits of €/MWh for the proposed framework and €/MWh for the MILP, as reported in Table 11.
Table 11.
Net benefit per MWh cleared, given by Equation (32), with €/kWh. B is the gross benefit, the degradation cost, and the difference is , i.e., relative to the MILP value.
The proposed framework achieves a 42.4% higher net benefit per MWh than the MILP in the base case and a 37.5% higher value in the mixed-margin scenario. However, this indicator measures the net benefit per unit of cleared energy, not the total net benefit, which remains higher for the MILP in absolute terms at 100 €/kWh (1853.2 versus 1701.9 €). The ranking depends on the assumed battery cost, as shown in Table 12. At 200 €/kWh, the MILP net benefit falls to zero, whereas the proposed framework remains positive up to a battery cost of 392 €/kWh. Above aproximately 112 €/kWh, the proposed framework also achieves a higher total net benefit than the MILP.
Table 12.
Sensitivity of the net benefit per MWh (base case) to the installed battery cost . The three values are those considered in [20].
4. Discussion
The results presented in Section 3 confirm the working hypotheses underlying the proposed framework and reveal implications that extend beyond the specific case of the Port of Sines.
4.1. Economic Benefit and Market Design
The first hypothesis, namely that a pool-based double-sided auction with a midpoint clearing price structurally guarantees economic benefits for all participants in every cleared transaction, is confirmed across all twenty-four hours of the representative day. The clearing price remains strictly within the grid tariff band throughout the day, ensuring that every buyer pays less than the corresponding grid import tariff and every seller receives more than the corresponding grid export tariff, regardless of the hour or the balance between supply and demand. This result extends the theoretical properties of midpoint pricing to a heterogeneous industrial setting with time-varying tariffs and asymmetric participant roles.
The average consumer cost reduction of relative to full grid supply places the framework within the range reported for residential and commercial energy communities, where reductions between and are commonly observed depending on community size, generation mix, and tariff structure [7]. The maritime port context, however, introduces distinctive characteristics that are uncommon in residential communities. The largest participant accounts for approximately of the community demand, creating a markedly asymmetric market structure, while the generation-to-demand ratio of creates recurring periods of renewable energy surplus over the representative day. Examining how these structural characteristics evolve across seasons, as wind and solar profiles vary and port demand follows operational cycles, is a natural extension of the present work, which is based on a single representative day.
The finding that centralized optimization is not required to achieve these reductions is consistent with the decentralized market literature, although it contrasts with the results reported by Gasca et al. [7], who found that centralized frameworks can achieve bill savings up to higher than market-based alternatives. In the proposed framework, this performance gap is likely reduced by the combination of the midpoint pricing rule, which guarantees mutually beneficial transactions, and the iterative storage-market coupling, which progressively aligns storage schedules with market conditions without requiring access to participants’ private cost functions. Whether the remaining performance gap is acceptable in practice ultimately depends on the community’s governance preferences and the computational requirements associated with real-time operation in large-scale port environments.
4.2. Storage Dispatch and Renewable Utilization
The second hypothesis, namely that the proposed causal dispatch strategy improves renewable energy utilization relative to the no-storage scenario, is supported by the results. Local self-consumption of renewable generation increases from MWh to MWh (), while grid import decreases from MWh to MWh () when the storage units are active. These improvements are consistent with the role commonly attributed to battery storage in the microgrid literature, namely bridging the temporal mismatch between non-dispatchable renewable generation and demand [22,23]. Furthermore, the round-trip efficiency criterion effectively prevents uneconomic cycling, as illustrated by the operating profile of the community battery, which charges during the low-price midday period and discharges during higher-price morning hours.
The causal intra-round loop, which propagates the realised state of charge hour by hour within each market round, ensures that storage operation always remains physically feasible without requiring centralized scheduling or perfect knowledge of future market outcomes. This makes the proposed framework particularly suitable for iterative market environments in which the final accepted quantities are not known in advance.
The market is cleared through a single pool, without explicitly modelling internal line capacities, transformer limits, voltage constraints, network losses, or the locations of individual participants. The analysis therefore adopts a copper-plate network assumption, under which internal network constraints and their impact on market clearing are not represented. Consequently, congestion management and nodal pricing are outside the scope of the present framework. For the Port of Sines case study, the available capacity of the existing electrical infrastructure provides a margin relative to the power flows considered, suggesting that congestion is unlikely under the conditions analysed. However, in other ports, or under higher levels of local trading and storage dispatch, network constraints may restrict energy transactions and require location-dependent prices. Integrating the proposed market and storage framework with a detailed electrical network model of the Port of Sines is therefore an important direction for future work.
4.3. Community Versus Individual Storage Ownership
The third hypothesis, namely that community-owned storage distributes benefits more broadly than participant-owned storage, is supported by the results. The twelve pure consumers, which own no storage assets, achieve an average additional cost reduction of percentage points when the community battery is introduced, whereas the prosumer equipped with its own battery gains only percentage points. This asymmetry arises because the community battery reduces the clearing price during its discharge hours (–8) through arbitrage, and this benefit is shared among all buyers regardless of storage ownership. By contrast, the flexibility provided by the prosumer battery primarily benefits its owner through self-consumption, with a more limited influence on the market price.
These findings suggest that, for the case study considered, community-owned storage provides broader and more evenly distributed benefits than an equivalent storage asset owned by an individual participant. However, this conclusion should be interpreted in the context of the highly asymmetric demand distribution of the Port of Sines, where a single participant accounts for approximately three-quarters of the community demand.
The results also reveal different effects of storage on the revenues of the two renewable generators. In the base case of Table 3 (middle scenario, negotiation margins of 85–95%, initial SoC of 0.9 for the community battery and 0.1 for the participant battery), the revenue increase of the photovoltaic generator relative to direct grid export rises from to () when storage is introduced. By comparison, the increase for the wind generator rises only from to (). The photovoltaic generator benefits from the temporal alignment between its production and the charging of the community battery, which increases its midday sales (hours 9–13) from to MWh. Conversely, the community battery discharges during hours 0–8, reducing the wind generator’s night-time sales from to MWh. This reduction is partly offset by an increase in its midday sales, from to MWh. These results suggest that storage dispatch strategies explicitly accounting for the temporal characteristics of different renewable generation technologies could further improve the overall performance of the community.
4.4. Cleared Volume, Battery Utilization and Net Benefit
The comparison with the centralized benchmark in Section 2.4 shows that the three indicators of interest, namely cleared volume, battery utilization, and economic benefit, do not rank the two approaches in the same way. Table 13 summarizes this trade-off, using the centralized MILP as the basis of comparison.
Table 13.
Trade-off between cleared volume, battery utilization, and economic benefit (base case, margins of 85–95%, initial SoC values of 0.9 and 0.1 for the community and participant batteries, respectively, and €/kWh). The last column reports the ratio of the proposed framework to the centralized MILP, except for the net benefit per MWh, which reports the relative difference with respect to the MILP.
The proposed framework clears 64.5% of the energy cleared by the centralized MILP (17.07 versus 26.47 MWh), while requiring only 31.6% of its battery throughput (11.40 versus 36.13 MWh). The ratio of cleared energy to battery throughput is 1.5 for the proposed framework and 0.73 for the MILP. These ratios describe the relationship between market activity and battery utilization and should not be interpreted as physical battery efficiencies. The additional 9.40 MWh cleared by the MILP are associated with 24.73 MWh of additional throughput, corresponding to approximately 0.38 MWh of additional cleared energy per MWh of additional throughput, or about one quarter of the corresponding ratio for the proposed framework.
This difference has two main explanations. First, the fitness function counts an MWh of energy that is bought to charge a battery and subsequently sold after discharge in two separate market transactions. A volume-maximizing objective can therefore reward battery cycling without an equivalent increase in renewable energy delivered to final demand. The MILP does not include degradation costs in its optimization objective, an explicit profitability screen, or a terminal SoC constraint. Consequently, it can schedule battery cycles whenever the market-matching constraints permit them. The community battery also ends the day at an SoC of 0.29, compared with its initial SoC of 0.9. The absence of a terminal SoC constraint allows this difference in stored energy to contribute to the resulting market volume, although its precise contribution would require a separate energy balance. Second, the proposed framework schedules a battery action only when the arbitrage conditions in Equations (18) and (19) are satisfied, accounting for round-trip efficiency through . Cycles with insufficient price spreads are therefore excluded. The additional volume cleared by the MILP occurs in hours with an average spread of 150.7 €/MWh. This indicates a positive gross spread before accounting for battery degradation, but does not establish that every additional cycle remains economically advantageous once degradation is included.
Negotiation margins also affect the two approaches differently. The cleared volume of the proposed framework varies between 15 and 17.07 MWh across the tested margin ranges and reaches 18.19 MWh in the mixed-margin scenario (Table 9), whereas the MILP consistently clears 26.47 MWh across the tested scenarios. Thus, under the scenarios considered, changes in negotiation margins affect the clearing prices but do not alter the optimal cleared volume obtained by the MILP. In the proposed framework, margins influence both order acceptance and the arbitrage conditions, thereby affecting the resulting market volume. Negotiation margins consequently provide a means of influencing the decentralized market outcome, whereas their effect on the centralized benchmark is limited to the price outcome under the tested conditions.
The economic ranking depends on the assumed battery cost. Here, denotes the gross benefit calculated using Equation (31), while is estimated using Equations (35) and (36), based on the hourly SoC trajectories of each method (Table 10). Since the gross benefit does not depend on and the degradation cost varies linearly with it, the total net benefit of each method can be expressed as in Equation (37), where represents the estimated battery capacity loss over the day. This amounts to 5.829 kWh for the proposed framework and 18.469 kWh for the MILP. Equating the net benefit expressions for the two methods yields the crossover battery cost given by Equation (38), where and denote their respective gross benefits.
Figure 8a shows that below the MILP yields the higher total net benefit, whereas above this value the proposed framework yields the higher total net benefit. Dividing Equation (37) by the corresponding cleared energy gives the net benefit per MWh, , which is plotted in Figure 8b. Because the proposed framework clears less energy but incurs substantially lower estimated degradation, its net benefit per MWh decreases more slowly as battery cost increases. The two approaches yield approximately equal net benefits per MWh at a battery cost of 17 €/kWh; above this value, the proposed framework achieves the higher net benefit per MWh. At €/kWh, the total net benefits are relatively close (1853.2 versus 1701.9 €), while the proposed framework achieves a 42.4% higher net benefit per MWh. At €/kWh, the MILP net benefit falls to 6.3 €, whereas the proposed framework still yields 1119.0 €. The proposed framework reaches break-even at approximately 392 €/kWh, making it more robust to the higher battery-cost assumptions considered in Table 12.
Figure 8.
Net benefit as a function of the installed battery cost : (a) total net benefit per day; (b) net benefit per MWh cleared. The dot marks the crossover cost €/kWh, and the dotted vertical lines mark and 290 €/kWh. The lines are computed analytically from the values in Table 13; no additional simulations were run.
In summary, maximizing cleared volume and maximizing the economic value delivered to the community are different objectives. In the base case, the centralized MILP clears more energy, but does so with substantially higher battery throughput and estimated degradation. The proposed framework clears 35.5% less energy while achieving 91.8% of the MILP’s total net benefit at 100 €/kWh, with 68.4% lower battery throughput. Above a battery cost of approximately 112 €/kWh, it also yields the higher total net benefit. These results are based on a single representative day, hourly resolution, and a throughput-based degradation model whose coefficients were fitted to nickel–manganese–cobalt lithium-ion cells. For other chemistries, such as lithium iron phosphate, degradation per MWh of throughput may differ. The estimated crossover cost should therefore be interpreted as indicative of the assumptions and case study considered, rather than as a general threshold.
5. Conclusions
This paper proposed and evaluated a Transactive Energy Community framework for maritime ports that couples a pool-based local electricity market with battery energy storage through an iterative two-loop coordination process and evaluates its performance against a centralized MILP benchmark. The framework was demonstrated using a real-world case study of the Port of Sines based on measured photovoltaic generation, wind generation, and electricity consumption data, considering two battery storage systems representative of different ownership models.
Four main conclusions can be drawn from this study. First, the proposed double-sided pool auction with midpoint pricing consistently produces clearing prices within the grid import and export tariff interval, ensuring that every internal transaction remains economically beneficial for both buyers and sellers without requiring centralized optimization or access to participants’ private cost functions.
Second, the proposed storage dispatch strategy significantly improves the utilization of local renewable generation. Relative to the no-storage scenario, renewable self-consumption increases by , while grid imports decrease by . The resulting market operation reduces consumer electricity costs by an average of , with storage contributing an additional beyond the market mechanism alone. These results highlight the value of coordinating local electricity markets and battery storage in large industrial energy communities.
Third, maximizing cleared volume and maximizing economic value are different objectives. In the base case, the centralized MILP clears 55% more energy than the proposed framework, but requires approximately 3.2 times its battery throughput. This higher utilization is associated with greater estimated degradation, which is not included in the MILP optimization objective. At the assumed battery cost of 100 €/kWh, the MILP achieves a slightly higher total net benefit, whereas the proposed framework yields a higher net benefit per MWh. The total net benefit becomes higher for the proposed framework when the battery cost exceeds approximately 112 €/kWh, and its net benefit remains positive up to approximately 392 €/kWh. These findings highlight the importance of accounting for battery degradation when comparing centralized and causal market-based approaches, although the results are based on a single representative day.
Fourth, the case study indicates that community-owned storage distributes economic benefits more broadly than participant-owned storage. The community battery benefits all consumers through lower market clearing prices, whereas the privately owned battery primarily benefits its owner through self-consumption. Although this conclusion should be interpreted in the context of the Port of Sines case study, it suggests that community-owned storage may represent an attractive ownership model for large-scale energy communities.
Several directions for future work emerge from this study. Extending the analysis to a full annual dataset would capture seasonal variations in renewable generation and demand while supporting battery sizing studies, and extending the comparison with the centralized benchmark to multiple days and including degradation costs in its objective would help assess the robustness of the observed trade-off between cleared volume, battery utilization, and net benefit. Incorporating network constraints within the port distribution system, including location-dependent prices and congestion management, modelling interactions with the external grid operator and the regulatory framework, integrating market clearing with port operational planning to enable demand-side flexibility, and allowing participants to adapt their negotiation margins dynamically would further increase the realism of the proposed framework and facilitate its practical deployment.
Supplementary Materials
The source code developed for this study is publicly available at the following GitHub repository: https://github.com/nunoagm/electrical_market_management_system_4_maritme_port.git (accessed on 20 October 2026.)
Author Contributions
N.M.: Conceptualization; investigation; methodology; resources; visualization; writing—original draft; writing—review and editing. J.M. (Jérôme Mendes): Conceptualization; investigation; methodology; supervision; resources; visualization; writing—review and editing. J.M. (Javad Mohammadi): Conceptualization; investigation; methodology; supervision; resources; visualization; writing—review and editing. P.M.: Conceptualization; investigation; methodology; supervision; resources; visualization; writing—review and editing. All authors have read and agreed to the published version of the manuscript.
Funding
This work was supported by the Agenda Mobilizadora Sines Nexus (Ref. 7113), funded by the Recovery and Resilience Plan (PRR) and the European Union through NextGenerationEU, as well as by national funds through the flexREC project (Ref. COMPETE2030-FEDER-00818200). The authors also acknowledge the support of the Fundação para a Ciência e a Tecnologia (FCT) through projects UID/00285/2025 (DOI: 10.54499/UID/00285/2025) and LA/P/0112/2020 (DOI: 10.54499/LA/P/0112/2020). Additional support was provided by the Fundação para a Ciência e a Tecnologia (FCT) through a research placement at the University of Texas at Austin under the UT Austin Portugal Program.
Data Availability Statement
The data presented in this study are not publicly available due to confidentiality agreements with the Port of Sines and other data providers. Aggregated data may be made available from the corresponding author upon reasonable request, subject to the approval of the data owners.
Acknowledgments
The authors would like to thank APS—Administração dos Portos de Sines e do Algarve, S.A.—for its collaboration and for providing the data and operational support required for the Port of Sines case study. The authors also acknowledge Bee2Solutions and the remaining partners of the Sines Nexus project for the valuable technical discussions and collaborative environment that supported the development of this work.
Conflicts of Interest
The authors declare no conflicts of interest.
Abbreviations
The following abbreviations are used in this manuscript:
| Indexes and Sets | |
| Scheduling time steps (hourly resolution) | |
| Market rounds | |
| Community players | |
| Parameters | |
| Forecasted net load of player at step h (MWh) | |
| Grid import tariff of player at step h (€/MWh) | |
| Grid export tariff of player at step h (€/MWh) | |
| Buy negotiation margin of player at step h (%) | |
| Sell negotiation margin of player at step h (%) | |
| Minimum state of charge of ESU (%) | |
| Maximum state of charge of ESU (%) | |
| Maximum inverter power of ESU (MW) | |
| Energy capacity of ESU (MWh) | |
| One-way efficiency of ESU (%) | |
| Patience threshold (ESA) | |
| Decision Variables | |
| Net load of player at step h in round m (MWh) | |
| Buyer’s bid price of player at step h (€/MWh) | |
| Seller’s bid price of player at step h (€/MWh) | |
| Community clearing price in round m at step h (€/MWh) | |
| Community cleared quantity in round m at step h (MWh) | |
| Self-consumed energy of ESU at step h (of round m) (MWh) | |
| Market energy of ESU at step h (of round m)(MWh) | |
| Total energy of ESU at step h (MWh) | |
| State of charge of ESU at step h (%) | |
| Power exported to the community by at step h (MW) | |
| Power imported from the community by at step h (MW) | |
| Power exported to the grid by at step h (MW) | |
| Power imported from the grid by at step h (MW) | |
| Fitness of round m (total cleared energy, MWh) | |
| Incumbent fitness (best found so far) | |
| Patience counter (ESA) |
References
- European Parliament and Council of the European Union. Regulation (EU) 2023/1805 on the Use of Renewable and Low-Carbon Fuels in Maritime Transport. Off. J. Eur. Union 2023, L234, 48–100. [Google Scholar]
- Fadiga, A.; Ferreira, L.M.D.; Bigotte, J.F. Decarbonising maritime ports: A systematic review of the literature and insights for new research opportunities. J. Clean. Prod. 2024, 452, 142209. [Google Scholar] [CrossRef] [Scilit]
- Sadiq, M.; Ali, S.W.; Terriche, Y.; Mutarraf, M.U.; Hassan, M.A.; Hamid, K.; Ali, Z.; Sze, J.Y.; Su, C.L.; Guerrero, J.M. Future Greener Seaports: A Review of New Infrastructure, Challenges, and Energy Efficiency Measures. IEEE Access 2021, 9, 75568–75587. [Google Scholar] [CrossRef] [Scilit]
- Iris, Ç.; Lam, J.S.L. A review of energy efficiency in ports: Operational strategies, technologies and energy management systems. Renew. Sustain. Energy Rev. 2019, 112, 170–182. [Google Scholar] [CrossRef] [Scilit]
- Iris, Ç.; Lam, J.S.L. Optimal energy management and operations planning in seaports with smart grid while harnessing renewable energy under uncertainty. Omega 2021, 103, 102445. [Google Scholar] [CrossRef] [Scilit]
- Herazo, J.C.M.; Castillo, A.P.P.; Eras, J.J.C.; Fierro, T.E.S.; Araújo, J.F.C.; Gatica, G. Bibliometric analysis of energy management and efficiency in the maritime industry and port terminals: Trends. Procedia Comput. Sci. 2024, 231, 514–519. [Google Scholar] [CrossRef] [Scilit]
- Gasca, M.V.; Rigo-Mariani, R.; Debusschere, V.; Sidqi, Y. Fairness in energy communities: Centralized and decentralized frameworks. Renew. Sustain. Energy Rev. 2025, 208, 115054. [Google Scholar] [CrossRef] [Scilit]
- Adeyemi, A.; Yan, M.; Shahidehpour, M.; Bahramirad, S.; Paaso, A. Transactive energy markets for managing energy exchanges in power distribution systems. Electr. J. 2020, 33, 106868. [Google Scholar] [CrossRef] [Scilit]
- Roy, A.; Auger, F.; Olivier, J.C.; Schaeffer, E.; Auvity, B. Design, Sizing, and Energy Management of Microgrids in Harbor Areas: A Review. Energies 2020, 13, 5314. [Google Scholar] [CrossRef] [Scilit]
- Bakar, N.N.A.; Guerrero, J.M.; Vasquez, J.C.; Bazmohammadi, N.; Yu, Y.; Abusorrah, A.; Al-Turki, Y.A. A Review of the Conceptualization and Operational Management of Seaport Microgrids on the Shore and Seaside. Energies 2021, 14, 7941. [Google Scholar] [CrossRef] [Scilit]
- Baroni, M. The Integration of Non-dispatchable Renewables. In The Palgrave Handbook of International Energy Economics; Hafner, M., Luciani, G., Eds.; Springer International Publishing: Cham, Switzerland, 2022; pp. 269–299. [Google Scholar] [CrossRef] [Scilit]
- Beck, T.; Kondziella, H.; Huard, G.; Bruckner, T. Assessing the influence of the temporal resolution of electrical load and PV generation profiles on self-consumption and sizing of PV-battery systems. Appl. Energy 2016, 173, 331–342. [Google Scholar] [CrossRef] [Scilit]
- Beaudin, M.; Zareipour, H.; Schellenberglabe, A.; Rosehart, W. Energy storage for mitigating the variability of renewable electricity sources: An updated review. Energy Sustain. Dev. 2010, 14, 302–314. [Google Scholar] [CrossRef] [Scilit]
- Desta, A.; George, L.; Courbin, P.; Sciandra, V. Smoothing of renewable energy generation using Gaussian-based method with power constraints. Energy Procedia 2017, 134, 171–180. [Google Scholar] [CrossRef] [Scilit]
- Tostado-Véliz, M.; Rezaee Jordehi, A.; Icaza, D.; Mansouri, S.A.; Jurado, F. Optimal participation of prosumers in energy communities through a novel stochastic-robust day-ahead scheduling model. Int. J. Electr. Power Energy Syst. 2023, 147, 108854. [Google Scholar] [CrossRef] [Scilit]
- Pasqui, M.; Gerini, F.; Jacobs, M.; Carcasci, C.; Paolone, M. Self-dispatching a renewable energy community by means of battery energy storage systems. J. Energy Storage 2025, 114, 115837. [Google Scholar] [CrossRef] [Scilit]
- Xie, D.; Xu, Y. Strategic bidding of price-maker energy storage systems in electricity markets with limited information. Appl. Energy 2025, 390, 125824. [Google Scholar] [CrossRef] [Scilit]
- Huang, W.; Yu, M.; Li, H.; Tai, N. Overview and Research Opportunities in Energy Management for Port Integrated Energy System. In Energy Management of Integrated Energy System in Large Ports; Springer Nature: Singapore, 2023; pp. 1–31. [Google Scholar] [CrossRef] [Scilit]
- Schölzel, J.D.; Henn, S.; Tings, M.; Streblow, R.; Müller, D. Comparative analysis of bidding strategies for auction-based local energy markets. Energy 2024, 291, 130211. [Google Scholar] [CrossRef] [Scilit]
- Antoniadou-Plytaria, K.; Steen, D.; Tuan, L.A.; Carlson, O.; Fotouhi Ghazvini, M.A. Market-based Energy Management Model of a Building Microgrid Considering Battery Degradation. IEEE Trans. Smart Grid 2021, 12, 1794–1804. [Google Scholar] [CrossRef] [Scilit]
- Wang, J.; Purewal, J.; Liu, P.; Hicks-Garner, J.; Soukazian, S.; Sherman, E.; Sorenson, A.; Vu, L.; Tataria, H.; Verbrugge, M.W. Degradation of lithium ion batteries employing graphite negatives and nickel-cobalt-manganese oxide + spinel manganese oxide positives: Part 1, aging mechanisms and life estimation. J. Power Sources 2014, 269, 937–948. [Google Scholar] [CrossRef] [Scilit]
- Zhao, C.; Andersen, P.B.; Træholt, C.; Hashemi, S. Grid-connected battery energy storage system: A review on application and integration. Renew. Sustain. Energy Rev. 2023, 182, 113400. [Google Scholar] [CrossRef] [Scilit]
- Zahraoui, Y.; Alhamrouni, I.; Mekhilef, S.; Basir Khan, M.R.; Seyedmahmoudian, M.; Stojcevski, A.; Horan, B. Energy Management System in Microgrids: A Comprehensive Review. Sustainability 2021, 13, 10492. [Google Scholar] [CrossRef] [Scilit]
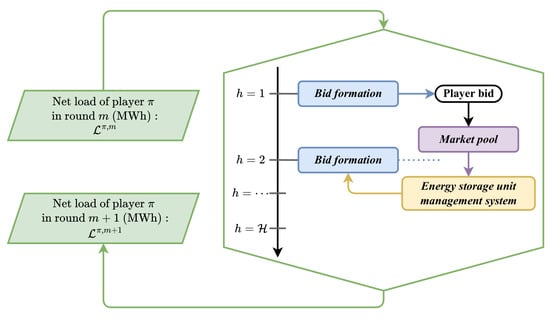
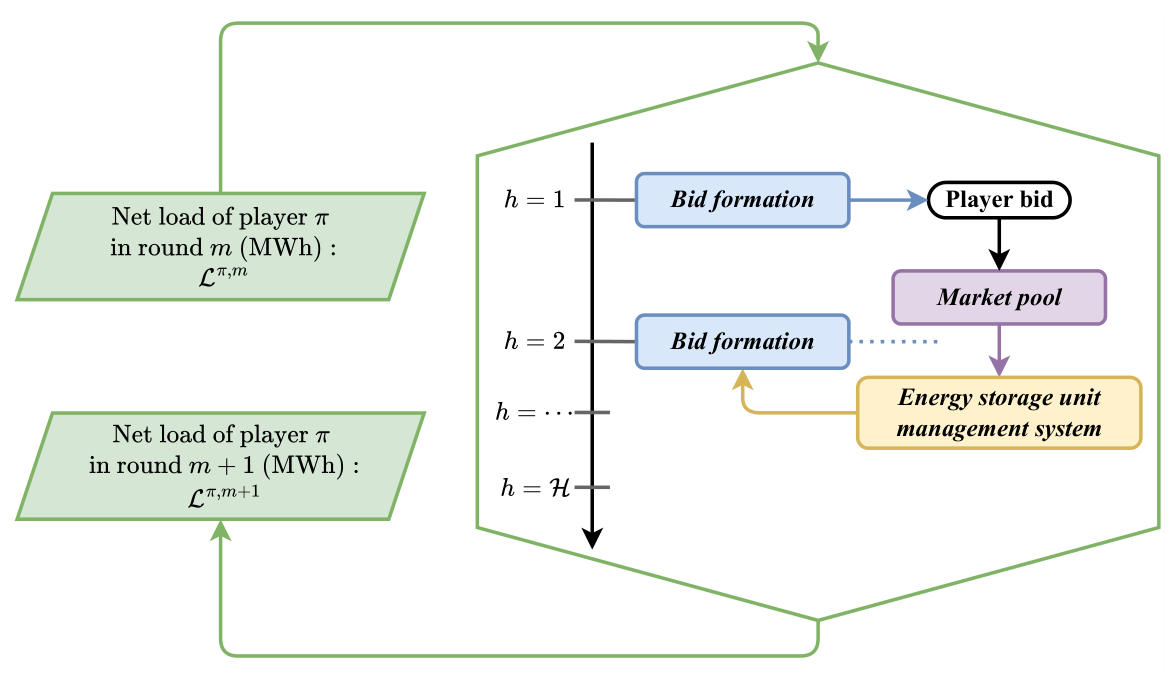
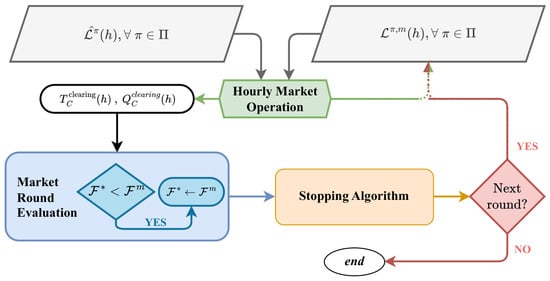
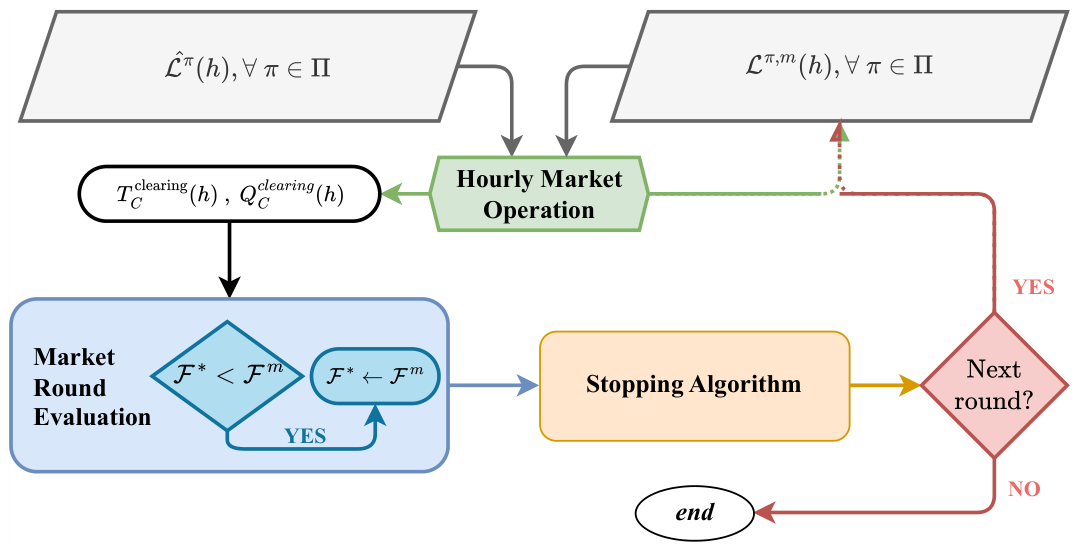
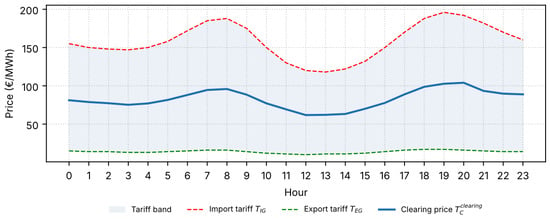
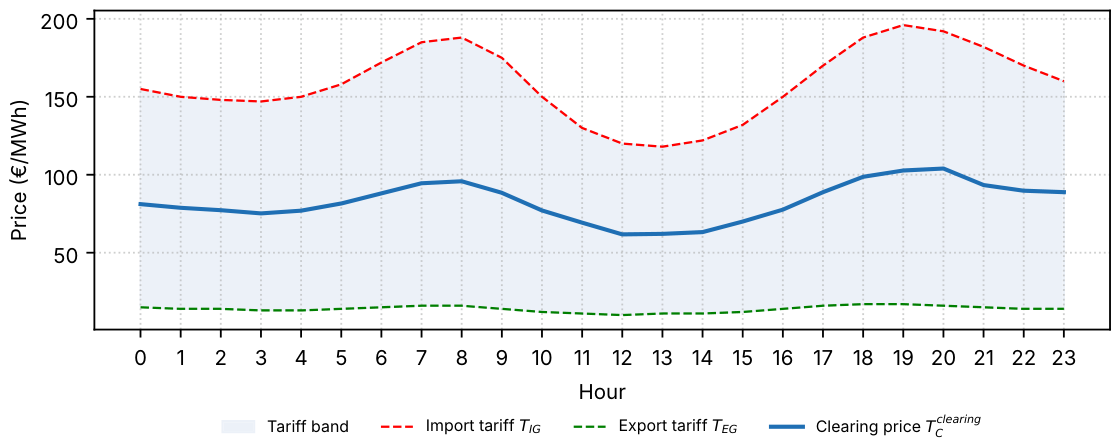
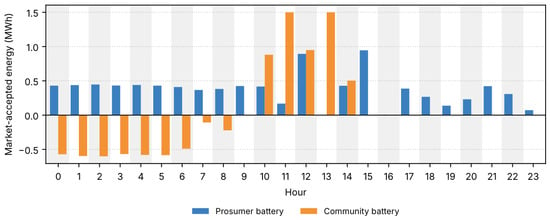
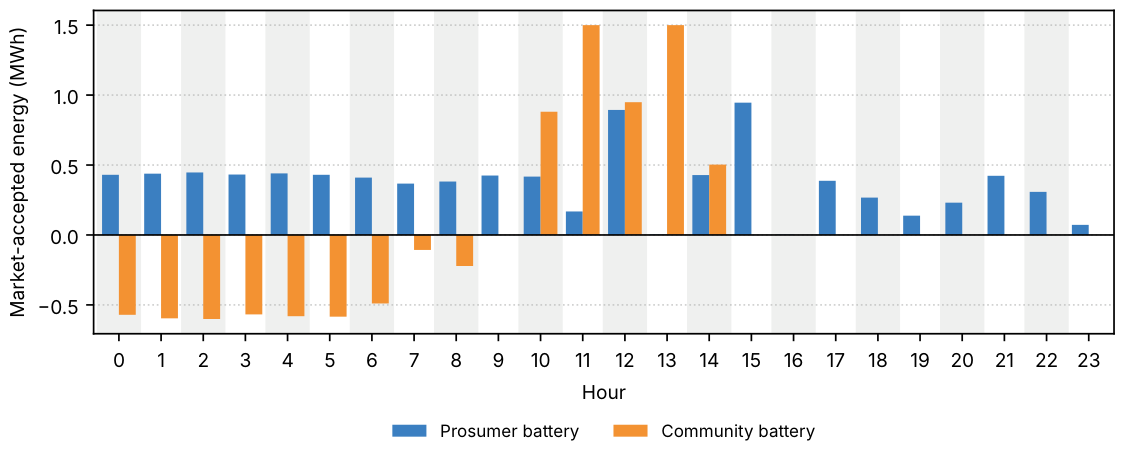
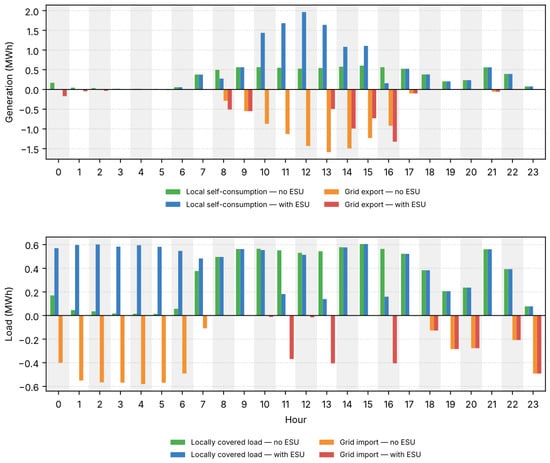
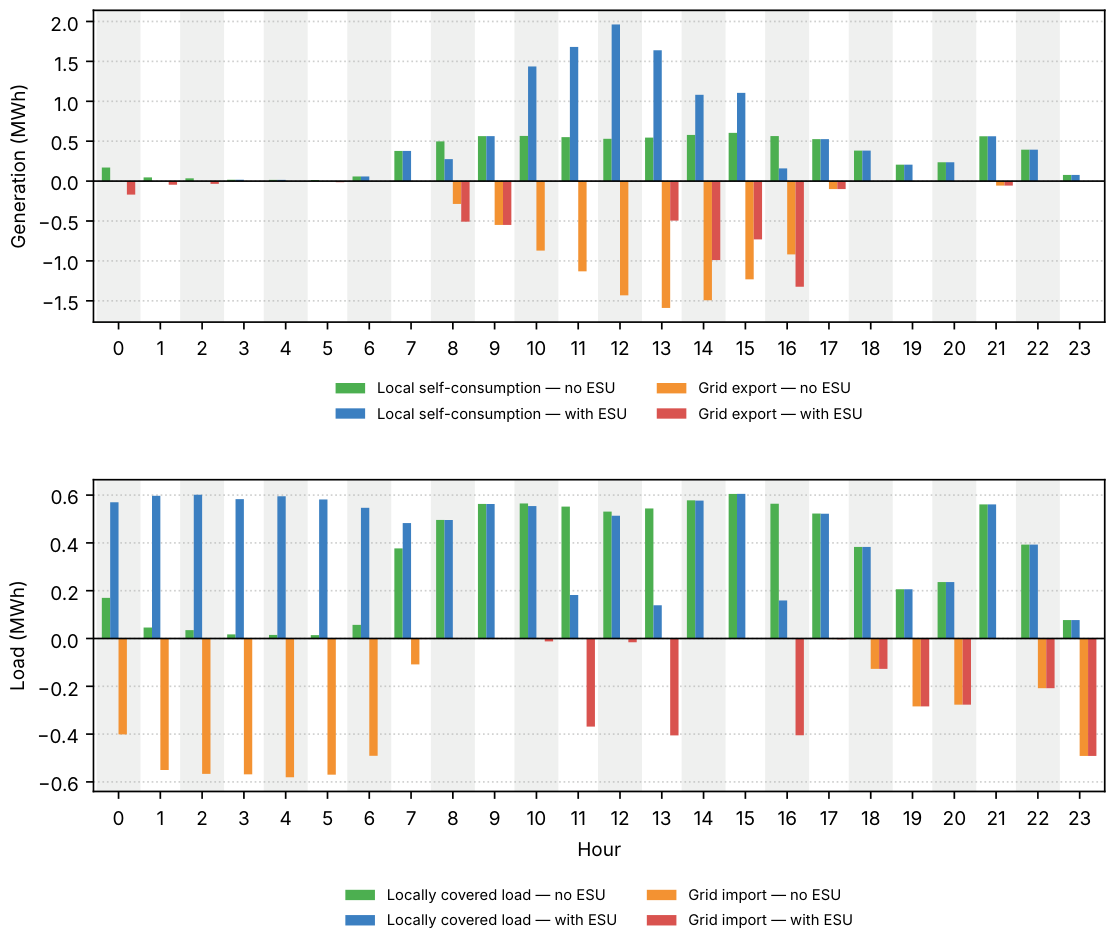
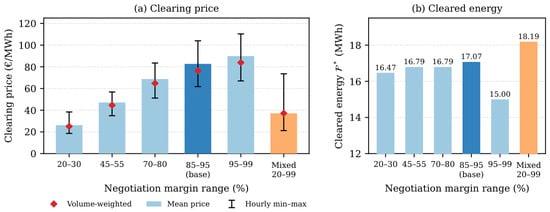
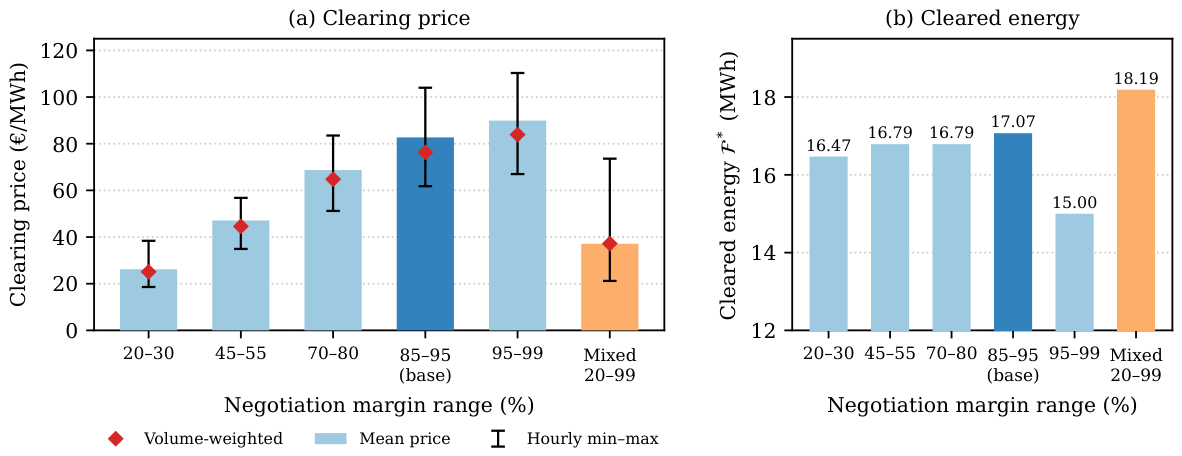
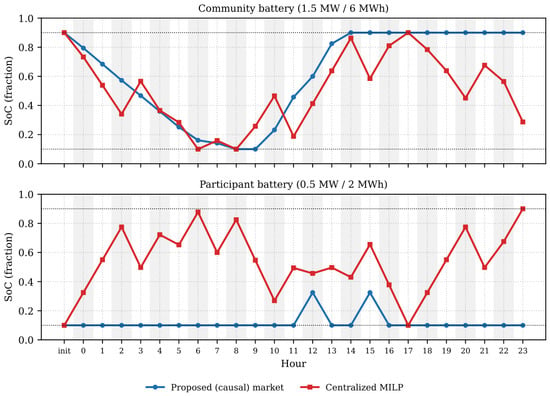
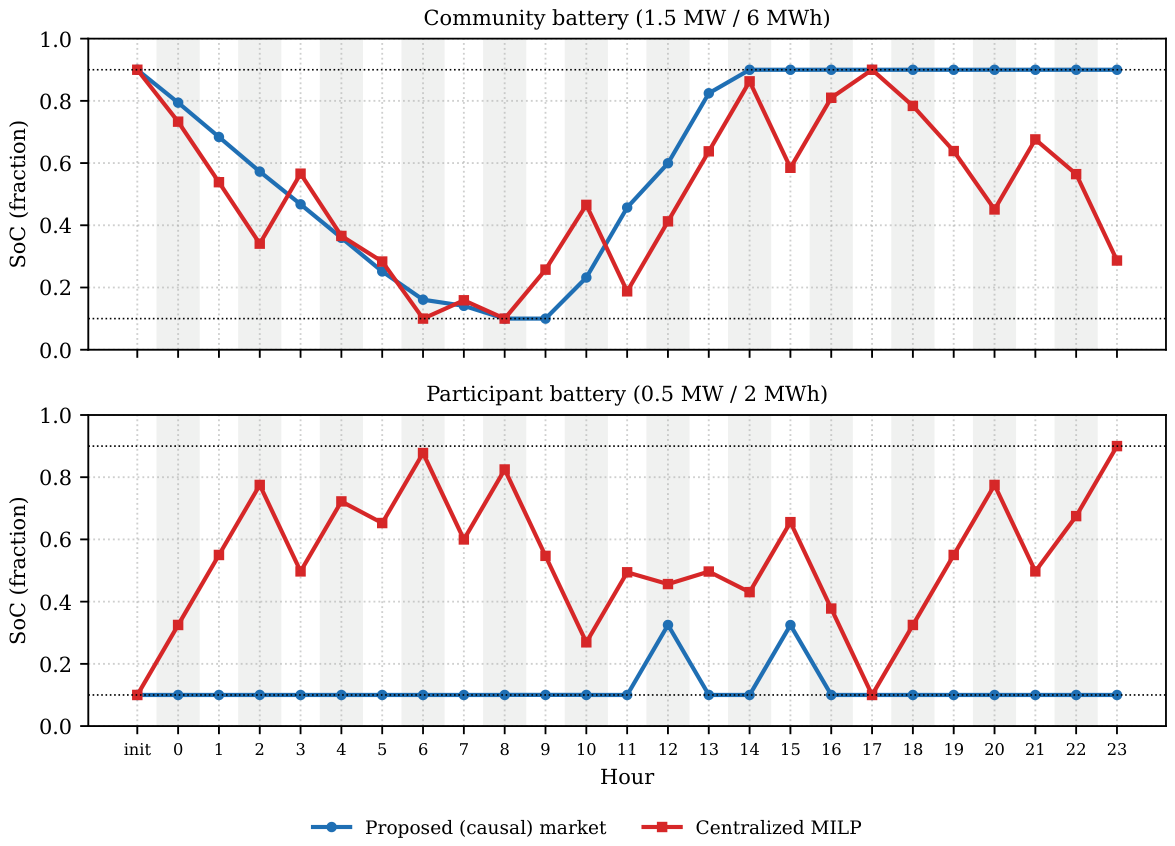
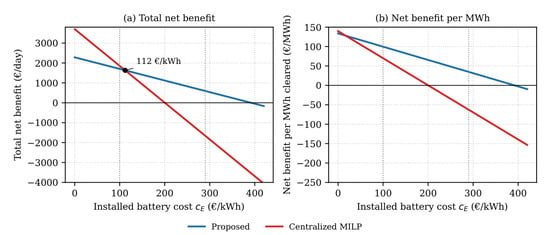
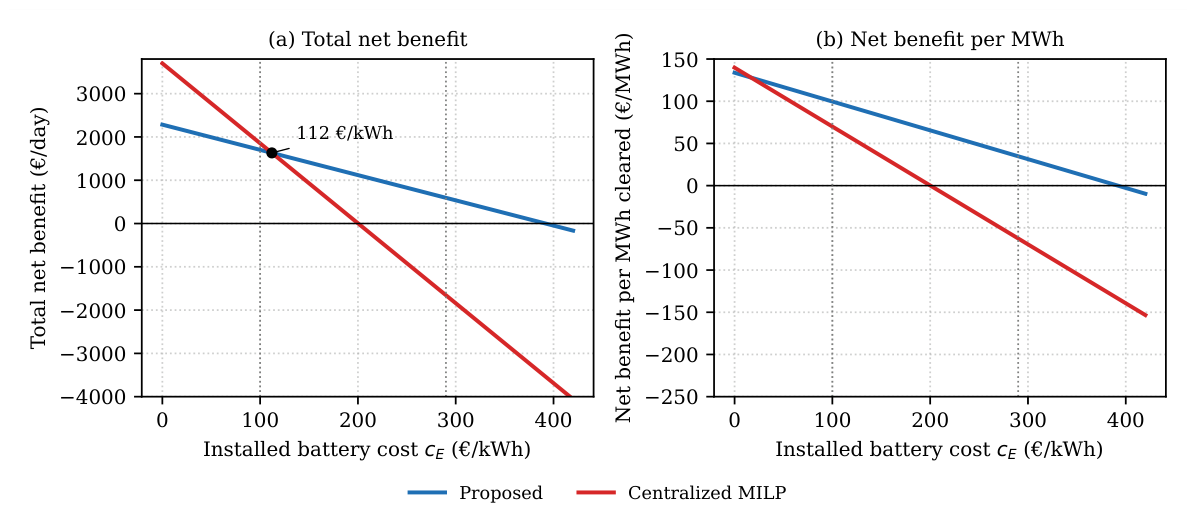

Disclaimer/Publisher’s Note: The statements, opinions and data contained in all publications are solely those of the individual author(s) and contributor(s) and not of MDPI and/or the editor(s). MDPI and/or the editor(s) disclaim responsibility for any injury to people or property resulting from any ideas, methods, instructions or products referred to in the content. |
© 2026 by the authors. Licensee MDPI, Basel, Switzerland. This article is an open access article distributed under the terms and conditions of the Creative Commons Attribution (CC BY) license.