


Abstract
Decarbonization of non-metallic mineral manufacturing requires reductions in energy use relative to output alongside changes in fuel use and production processes. This study examines associations between energy intensity, energy structure, and production-based CO2 intensity in the EU non-metallic mineral sector (NACE C23). A balanced panel of 19 Member States (2008–2023) is analyzed using static and dynamic two-way fixed-effects models complemented by additive Logarithmic Mean Divisia Index (LMDI) decomposition. Energy intensity is positively associated with CO2 intensity in the fixed-effects specifications, whereas relationships with electricity and fossil-fuel shares are less consistent. Dynamic estimates suggest positive CO2-intensity persistence, but its magnitude is sensitive to estimator choice. Across annual country-level transitions, the LMDI energy-intensity effect has the largest average downward contribution to changes in absolute CO2 emissions (−267.75 kt), followed by the fossil-fuel-share effect (−117.24 kt). Subperiod analysis reveals temporal heterogeneity: fossil-fuel share contributed more strongly in 2008–2014, whereas energy intensity dominated in 2015–2019 and 2020–2023. These findings distinguish energy-intensity adjustment from energy-carrier substitution as complementary dimensions of industrial decarbonization. Because sectoral emissions may include process-related CO2 and exclude indirect electricity emissions, the results do not establish the carbon benefits of electrification or specific technological changes.
1. Introduction
The decarbonization of energy-intensive industries is a central component of the European Union’s transition toward climate neutrality. Energy-intensive industries represent a particularly challenging area of decarbonization because their production systems combine substantial energy requirements with continued dependence on carbon-intensive energy sources [1]. Among these industries, the manufacture of non-metallic mineral products (NACE C23), including cement, glass, ceramics, and related mineral products, presents particular challenges because production relies heavily on high-temperature thermal processes and long-lived industrial assets. Recent research on EU manufacturing demonstrates substantial heterogeneity in industrial decarbonization pathways, indicating that the transition does not follow a uniform pattern across manufacturing systems [2]. Existing research identifies energy-efficiency improvement, fuel substitution, electrification, and deeper technological transformation as important pathways for reducing industrial emissions [3,4,5,6,7,8].
At the EU level, recent evidence further indicates that changes in CO2 emissions reflect the combined influence of multiple economic, energy-related, and structural factors [9]. The non-metallic mineral sector is particularly relevant in this context because its decarbonization depends on both the amount of energy required for production and the structure of the energy supply. Sector-specific studies document substantial energy requirements in cement and glass production and identify multiple technological options for reducing fossil-fuel use and CO2 emissions [4,6,10,11,12]. Electrification of industrial heat represents an important long-term option, although its feasibility varies across temperature levels, production processes, infrastructure requirements, and industrial contexts [3,8,13,14]. Fuel switching and the use of alternative fuels provide additional adjustment pathways, particularly in cement production [6,15]. Beyond energy-related measures, material innovation represents another dimension of technological transformation in the non-metallic mineral sector. Gronba-Chyła et al. [16] investigated the use of selected waste materials in the production of lightweight ceramic products, illustrating opportunities for circular material use in ceramic manufacturing.
Alongside these technological pathways, energy intensity remains an important dimension of industrial emission performance. Previous studies demonstrate substantial cross-country and sectoral heterogeneity in energy and carbon intensity [17,18,19,20,21,22]. These patterns may reflect broader economic and energy-transition conditions as well as changes in the structure and geographical distribution of industrial production [21,23]. Evidence on carbon–economic decoupling further indicates that changes in emissions do not necessarily evolve proportionally with economic activity [24]. Decomposition studies likewise show that energy intensity, economic activity, and changes in energy structure can make distinct contributions to observed emission changes, with recent applications extending this approach to sector-specific industrial decarbonization [25,26,27,28,29,30,31,32,33,34]. These findings indicate that industrial decarbonization cannot be assessed solely through the availability of individual low-carbon technologies; it also requires empirical examination of how energy use and energy structure are reflected in observed sectoral emission patterns.
A further consideration is the persistence of carbon-intensive production systems. Energy-intensive industries frequently depend on capital-intensive and long-lived infrastructure, which may slow adjustment to alternative production pathways. More generally, carbon lock-in can arise from large sunk investments, long infrastructure lifetimes, and path-dependent technological and institutional systems [35]. Evidence from energy-intensive industry further demonstrates how continued investment in incumbent installations, technological incompatibilities, and system integration can reinforce such persistence [36]. In the present study, technological lock-in is not directly measured; rather, this literature provides a conceptual context for examining whether sectoral CO2 intensity exhibits persistence over time.
Two empirical perspectives are particularly useful for examining these processes. Panel econometric models allow the associations between energy intensity, energy structure, and CO2 intensity to be evaluated while controlling for unobserved country heterogeneity and common time effects [19,20,37]. In contrast, Logarithmic Mean Divisia Index (LMDI) decomposition provides an accounting framework for attributing observed changes in emissions to predefined structural components [25,27]. LMDI has been widely applied to energy and emission analysis, including manufacturing [28,29,38], the European cement industry [30], and the non-metallic mineral sector [31]. The two approaches therefore provide complementary information: econometric models characterize conditional associations, whereas LMDI identifies the accounting contributions underlying observed changes in absolute emissions.
1.1. Research Gap and Contribution
Despite substantial progress in research on industrial decarbonization, an important empirical question remains regarding the relative importance of different adjustment pathways in energy-intensive, high-temperature industries. In particular, reductions in energy use relative to economic output and changes in the structure of energy inputs represent distinct dimensions of sectoral adjustment, while deeper process transformation may require longer investment cycles and replacement of capital-intensive production assets. Existing studies document a broad range of technological options for reducing industrial emissions, including energy-efficiency improvements, electrification, fuel substitution, and deeper process transformation [4,6,7,8,11]. In particular, recent research highlights that industrial decarbonization pathways depend not only on technological options themselves but also on infrastructure constraints, system integration, and sector-specific conditions [14,39,40]. However, this technological evidence does not by itself establish the relative empirical importance of the main observable energy-related adjustment channels for emission performance across the EU non-metallic mineral sector.
This distinction is particularly relevant in an asset-intensive sector characterized by high-temperature thermal processes and long-lived production infrastructure [10,11]. More broadly, research on industrial decarbonization emphasizes that existing technological systems and infrastructure can constrain the pace and direction of transformation [7,8]. In this context, two related questions require empirical consideration: whether differences in CO2 intensity are more consistently associated with the intensity of energy use or with the structure of final energy consumption, and whether sectoral CO2 intensity exhibits persistence over time. The latter is particularly relevant when adjustment occurs within capital-intensive production systems, although technological lock-in itself is not directly observed in the present analysis.
A further analytical issue concerns the distinction between conditional relationships and the accounting contributions underlying observed emission changes. Panel-data studies provide evidence on the relationships between energy-related factors and CO2 emissions across European countries and sectors [19,20,37,41], whereas LMDI studies decompose observed emission changes into activity, energy, structural, and related components [25,27,29,30,31,32,33,42]. Importantly, LMDI has already been applied specifically to the European cement industry [30] and to the non-metallic mineral sector across major economies [31]. The remaining research need is to examine these complementary dimensions within a common empirical framework.
Full-period average decomposition effects may conceal differences in the relative contributions of energy intensity, fossil-fuel share, and economic activity over time. Comparing annual LMDI contributions across subperiods therefore provides additional insight into temporal heterogeneity, without attributing observed changes to specific economic shocks or policy interventions.
Recent studies have also explored machine-learning approaches to industrial carbon-emission analysis. Hou et al. [38] combined LMDI decomposition with a hybrid Elman neural-network model to examine historical emission drivers and forecast future emissions in energy-intensive manufacturing. Similarly, Xia et al. [43] integrated LMDI with CNN–LSTM modeling for industrial carbon-emission prediction, while Liu et al. [44] applied an LSTM neural network to forecast CO2 emissions in the cement industry. These studies demonstrate the growing role of neural-network approaches in emission forecasting and the modeling of nonlinear relationships. However, their primary analytical objectives differ from those of the present study, which focuses on interpreting conditional associations between energy-related variables and CO2 intensity, assessing temporal persistence, and decomposing observed emission changes. Neural-network forecasting and the combined panel econometric–LMDI framework should therefore be viewed as complementary rather than interchangeable approaches.
Against this background, this study examines the EU non-metallic mineral sector across 19 Member States over the period 2008–2023. Its contribution is three-fold. First, it evaluates the relative empirical importance of energy intensity and energy structure as correlates of sectoral CO2 intensity using two-way fixed-effects models. Second, it examines the persistence of CO2 intensity using a dynamic fixed-effects specification.
Third, it applies LMDI decomposition to distinguish the contributions of economic activity, energy intensity, fossil-fuel share, and the implicit CO2-to-fossil-energy factor to observed annual changes in absolute CO2 emissions, and examines how these contributions vary across three subperiods (2008–2014, 2015–2019, and 2020–2023). By integrating these complementary perspectives, the study provides a sector-specific assessment of decarbonization patterns that distinguishes econometric associations from accounting contributions and avoids interpreting either as direct evidence of causal technological effects.
1.2. Conceptual Framework
The decarbonization of energy-intensive, high-temperature industries can proceed through several adjustment channels, including changes in the intensity of energy use, changes in the composition of energy inputs, and broader process and production-system transformations [4,6,7,8,11]. In the non-metallic mineral sector (NACE Rev. 2: C23), these adjustments take place within production systems characterized by substantial thermal energy requirements and capital-intensive equipment such as kilns and furnaces [10,11,12].
The conceptual framework adopted in this study focuses on two energy-related dimensions that can be examined consistently across EU Member States. CO2 intensity is defined as sectoral CO2 emissions per unit of gross value added (CO2/VA). Energy intensity (EI), defined as final energy consumption per unit of gross value added (FEC/VA), represents energy use relative to economic output. Energy structure is represented alternatively by the shares of electricity and fossil fuels in total final energy consumption. These variables capture distinct dimensions of the sectoral energy system: the intensity of energy use and the composition of final energy inputs.
To clarify the engineering meaning and interpretive limits of the sector-level indicators used in the empirical analysis, Table 1 links each energy-related variable to the corresponding dimension of industrial energy-system adjustment.
Table 1.
Engineering interpretation of the energy-related variables used in the empirical analysis.
The econometric component of the framework examines how these two dimensions are associated with sectoral CO2 intensity. The static specification estimates the within-country associations between energy intensity, energy structure, and CO2 intensity while accounting for country-specific and common time effects. The dynamic specification additionally incorporates lagged CO2 intensity to examine whether emission performance exhibits persistence over time. Such persistence may be consistent with gradual adjustment in capital-intensive production systems and the long service life of kilns, furnaces, and related thermal infrastructure. However, technological lock-in is not directly measured in the empirical model and is therefore treated as a conceptual interpretation of the sectoral context rather than as an independently identified causal mechanism.
The LMDI decomposition provides a complementary emission-level perspective. Total sectoral CO2 emissions are decomposed into the effects of economic activity (VA), energy intensity (FEC/VA), fossil-fuel share, and the implicit CO2-to-fossil-energy factor. Whereas the panel models examine conditional associations with CO2 intensity and its temporal persistence, the LMDI decomposition attributes observed changes in absolute CO2 emissions to these structural components. The two approaches therefore address related but distinct dimensions of industrial decarbonization and should not be interpreted as estimating the same relationship.
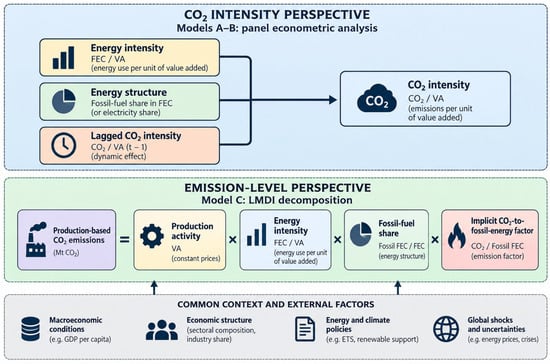
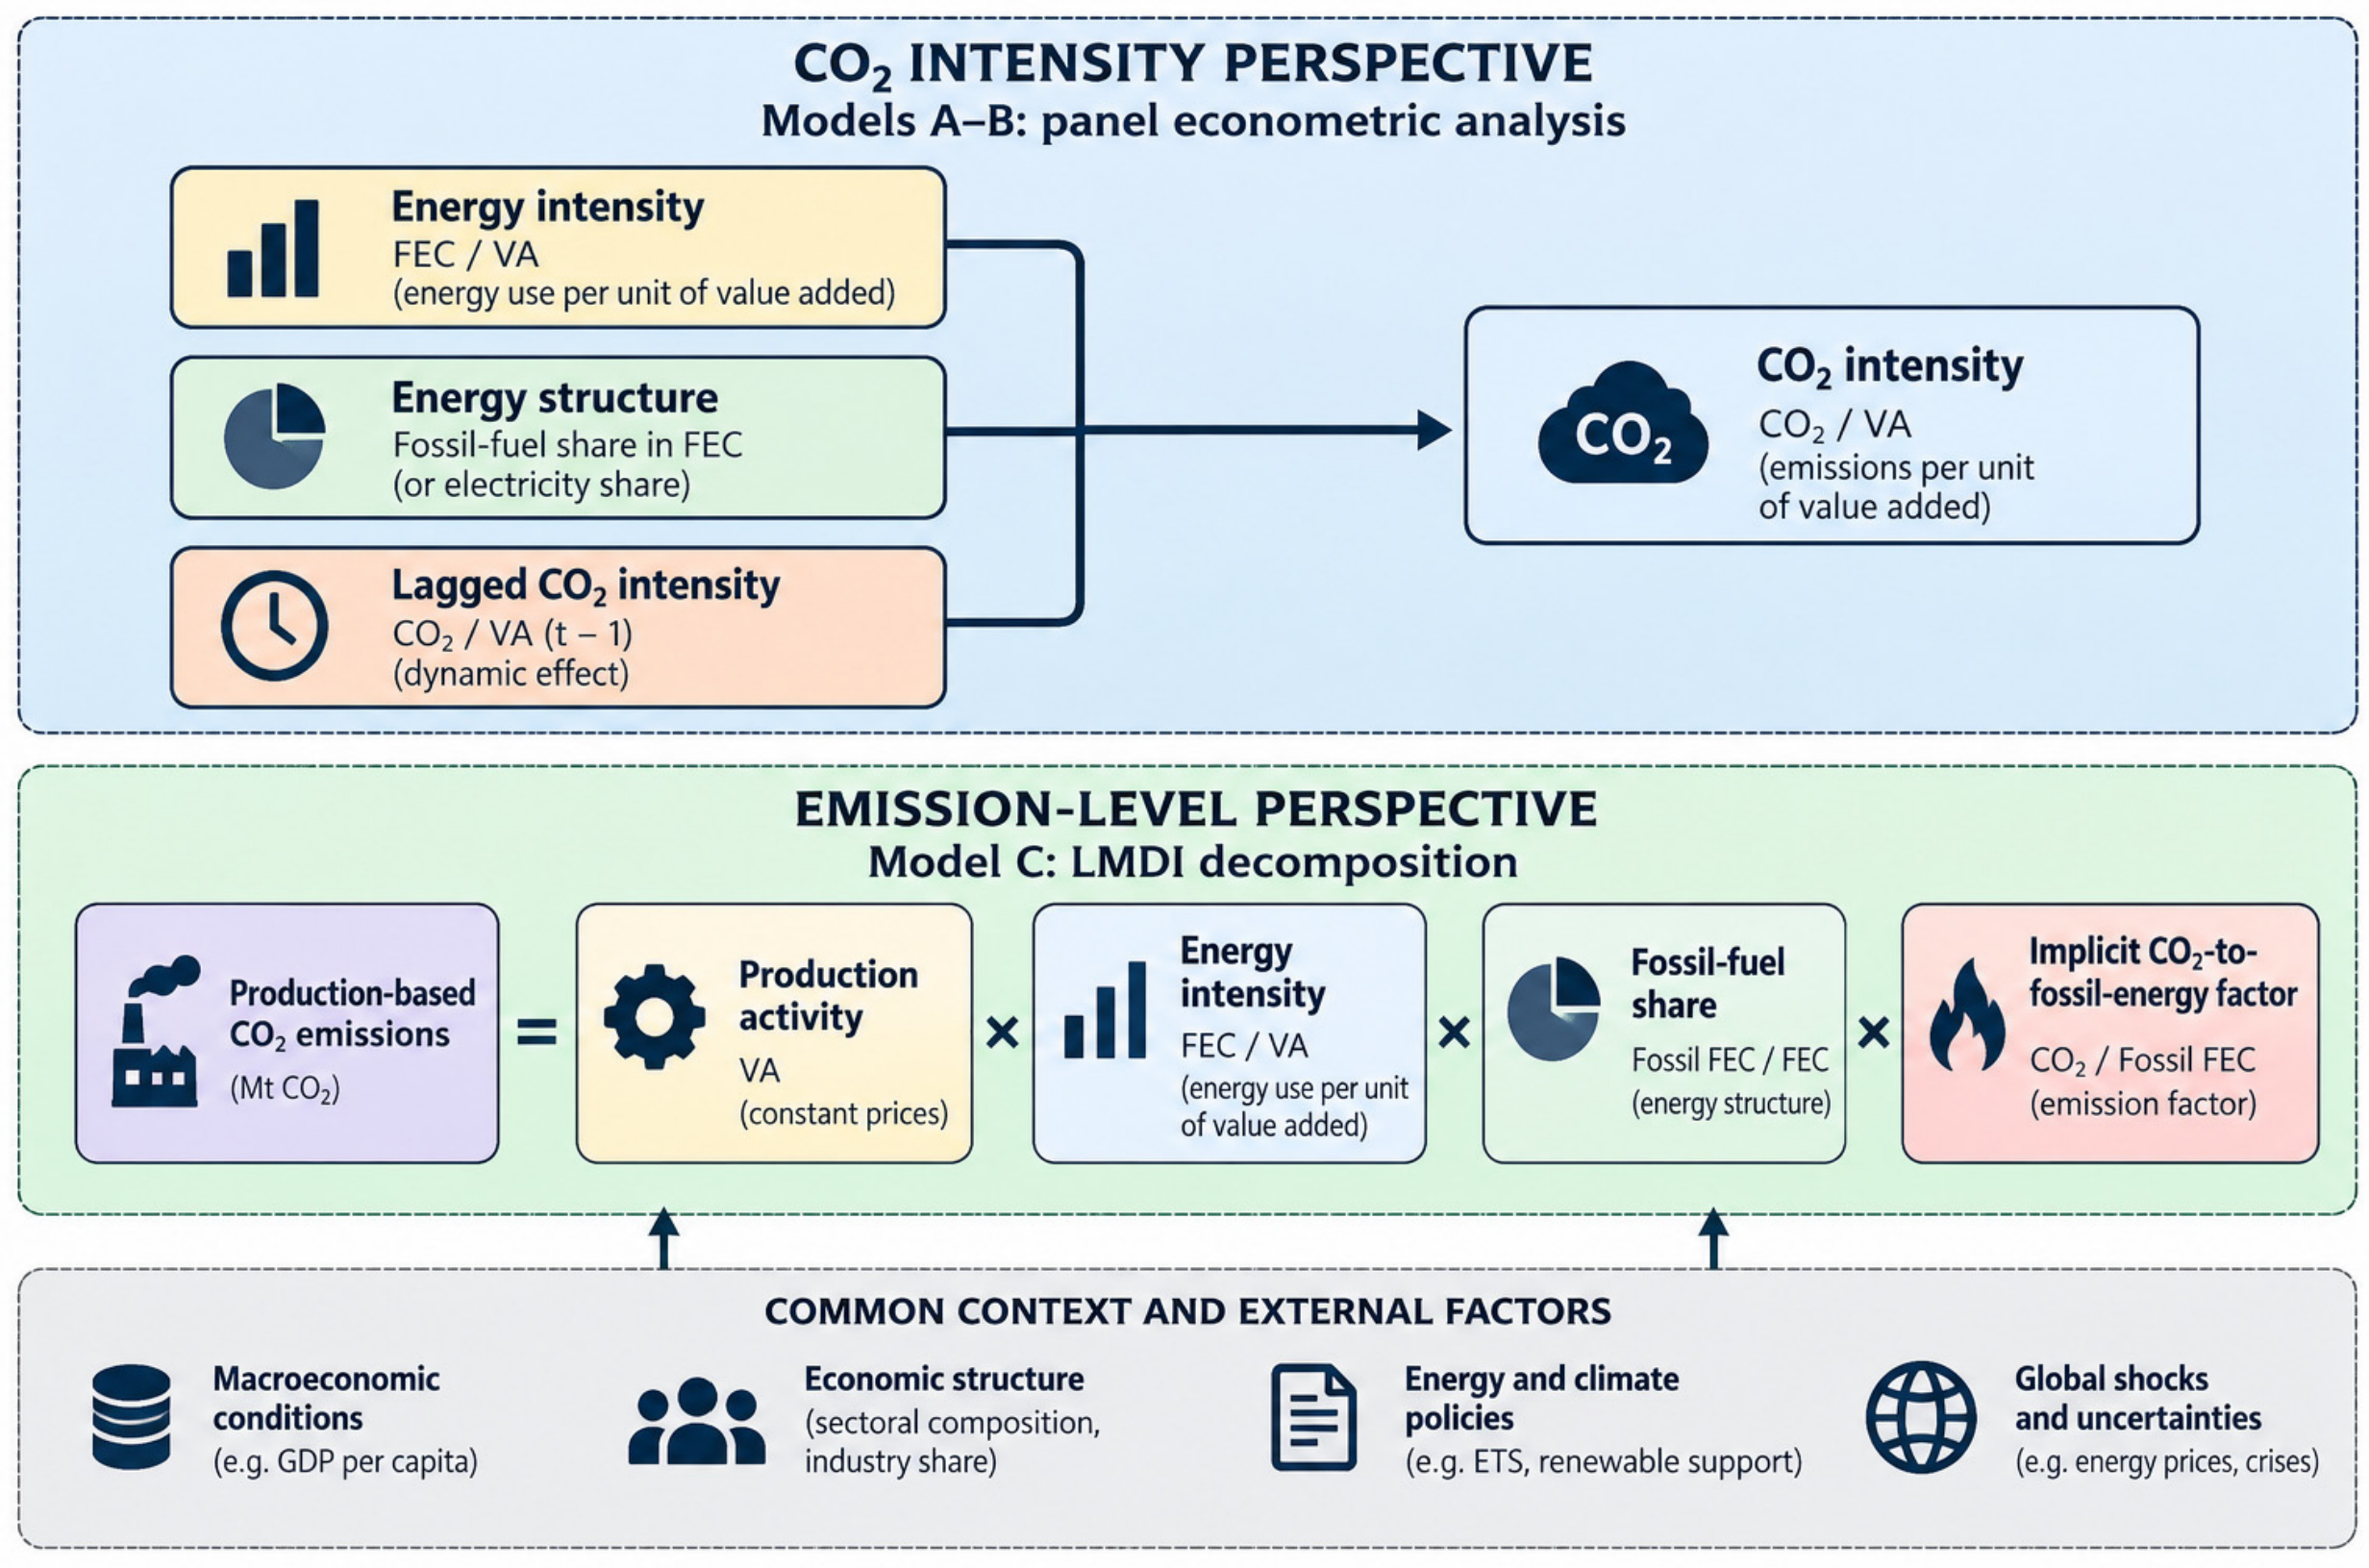
Figure 1 summarizes this analytical framework. The first component represents the CO2-intensity perspective, linking energy intensity, energy structure, and lagged CO2 intensity with current CO2 intensity. The second represents the emission-level perspective, in which changes in total CO2 emissions are decomposed into activity, energy-intensity, fossil-fuel-share, and implicit CO2-to-fossil-energy effects. Together, these two perspectives provide the basis for examining sectoral decarbonization patterns.
Figure 1.
Conceptual framework linking energy structure, energy intensity, emission persistence, and CO2 emissions in the EU non-metallic mineral sector.
2. Materials and Methods
2.1. Data and Variables
The dataset covers the period 2008–2023. The year 2023 represents the most recent observation with harmonized data across energy balances, air emission accounts, and value added statistics at the time of extraction.
In dynamic specifications including the lagged dependent variable, the effective estimation period begins in 2009, as the first observation (2008) is used to construct the lag term. Consequently, the reduction in the number of observations in Model B reflects the structure of the dynamic specification rather than data limitations.
To ensure internal consistency across variables, the sample was restricted to EU Member States with continuous observations over the full time horizon. Countries exhibiting structural gaps within the selected period were excluded to maintain panel comparability.
All variables are derived from harmonized Eurostat databases to ensure sectoral and methodological consistency.
Sectoral gross value added (VA) for the manufacturing of non-metallic mineral products (NACE Rev. 2: C23) was obtained from gross value added and income by detailed industry (NACE Rev. 2) (dataset: nama_10_a64, customized extraction: nama_10_a64__custom_20155776) and expressed in constant prices.
Final energy consumption (FEC), disaggregated by energy carrier and economic activity, was retrieved from Complete energy balances (dataset: nrg_bal_c, customized extraction: nrg_bal_c__custom_20154254). These data were used to construct total final energy consumption as well as electricity and fossil fuel shares.
Sectoral CO2 emissions were obtained from air emissions accounts by NACE Rev. 2 activity (dataset: env_ac_ainah_r2, customized extraction: env_ac_ainah_r2__custom_20156774), which provide production-based emissions consistent with environmental-economic accounting standards.
The emission measure follows a production-based accounting boundary. It therefore captures CO2 emissions attributed directly to sector C23, but it does not include upstream emissions associated with purchased electricity or heat. In addition, sectoral air-emission accounts may include both combustion-related and process-related CO2 emissions. Consequently, the emission indicator should not be interpreted as a measure of the full life-cycle or consumption-based carbon footprint of the sector.
The resulting balanced panel therefore contains 304 country-year observations (19 countries × 16 years).
Table 2 presents the definition and construction of the sectoral variables used in the analysis.
Table 2.
Definition of sectoral variables (NACE Rev. 2: C23).
2.2. Methods
The empirical methods are used as complementary diagnostic tools for examining energy-system adjustment in the C23 sector. The panel models assess whether changes in energy use relative to economic output and in the composition of final energy consumption are systematically associated with sectoral CO2 intensity. The dynamic specification additionally examines the persistence of CO2 intensity over time, while the LMDI decomposition identifies the structural contributions of activity, energy intensity, fossil-fuel share, and the implicit CO2-to-fossil-energy factor to annual changes in absolute emissions. Together, these approaches provide complementary evidence on how observable characteristics of the sectoral energy system are related to emission performance.
2.2.1. Static Panel Specification and Cross-Sectional Dependence (Model A)
To examine the associations of energy intensity and energy structure with carbon intensity in the manufacturing of non-metallic mineral products (NACE Rev. 2: C23), the analysis first applies a static panel framework. The baseline specification is estimated using a two-way fixed-effects model that controls for unobserved country-specific heterogeneity and common time effects. The empirical specification is given by:
where
- indexes countries;
- indexes years;
- captures time-invariant country characteristics;
- represents year effects controlling for common macroeconomic and energy-market shocks;
- represents the composition of final energy consumption. Because energy-carrier shares are constrained to sum to unity, their coefficients cannot be interpreted as isolated effects. A change in electricity share necessarily corresponds to a change in the share of one or more other energy carriers. The baseline models therefore estimate alternative reduced-form associations.
Cross-sectional dependence was assessed using the Pesaran CD test. Given the evidence of residual cross-sectional dependence, inference in the static fixed-effects models was based on Driscoll–Kraay standard errors, which are robust to heteroskedasticity, serial correlation, and cross-sectional dependence. A bandwidth of two lags was used in the baseline specification. Alternative bandwidths were additionally examined as a sensitivity check.
2.2.2. Dynamic Panel Estimation (Model B)
To examine persistence in CO2 intensity, the following dynamic specification is estimated:
The parameter ρ measures persistence in CO2 intensity over time. A positive coefficient indicates that previous-period carbon intensity remains associated with its current level after controlling for the remaining model components.
The dynamic analysis is based on a balanced panel of 19 EU Member States observed over 2008–2023. The specification is estimated using a two-way fixed-effects (LSDV) estimator incorporating country and year effects. The inclusion of lagged CO2 intensity reduces the effective estimation sample to 285 country-year observations. The model is intended to provide a complementary assessment of CO2-intensity persistence rather than to establish a causal relationship between energy-related variables and sectoral emission performance.
The inclusion of a lagged dependent variable in a fixed-effects model may introduce finite-T bias (Nickell bias). Given the moderate time dimension (T = 16) and relatively small cross-sectional dimension (N = 19), the estimated autoregressive coefficient is interpreted cautiously. Cross-sectional dependence was assessed using the Pesaran CD test. Since the null hypothesis of cross-sectional independence was rejected, Driscoll–Kraay standard errors with a bandwidth of two lags were employed for statistical inference. These standard errors account for specified forms of heteroskedasticity, serial correlation, and cross-sectional dependence, but they do not eliminate the finite-T bias of the dynamic fixed-effects estimator.
To assess the sensitivity of the results to estimator choice, additional two-step System GMM specifications were estimated with year effects, collapsed instruments, and a restricted instrument lag range of 2–3. Alternative assumptions concerning the endogeneity of the energy-related regressors were also examined. The estimation results and diagnostic statistics are reported in Appendix A Table A2. However, the limited cross-sectional dimension, the number of instruments relative to the number of countries, and the sensitivity of the estimated coefficients and diagnostic tests raised concerns regarding the reliability of System GMM inference in this setting. Instrument proliferation may weaken the diagnostic power of overidentification tests and lead to overfitting of endogenous variables, as discussed by Roodman [45]. Accordingly, System GMM was not adopted as the primary estimator.
An additional split-panel jackknife (SPJ) bias-correction exercise, following the approach proposed by Dhaene and Jochmans [46], was conducted to assess the sensitivity of the dynamic fixed-effects coefficients to finite-T bias. The correction was calculated using the full-panel estimates and estimates obtained from two temporal subpanels (2008–2015 and 2016–2023). The corrected point estimates are reported in Appendix A Table A1. Because the inferential properties of the SPJ estimates have not been fully validated for the present panel structure, statistical significance is not assigned to these corrected coefficients. The SPJ results are interpreted as an exploratory sensitivity analysis rather than as a definitive correction for all sources of estimation bias.
Consequently, the dynamic fixed-effects results are used primarily to examine the presence and direction of persistence, while the precise magnitude of the autoregressive coefficient remains subject to methodological uncertainty.
2.2.3. Structural Decomposition Analysis (Model C)
To complement the econometric analysis, a Logarithmic Mean Divisia Index (LMDI) decomposition is applied to quantify the contribution of underlying drivers to changes in sectoral CO2 emissions in the manufacturing of non-metallic mineral products (C23). The LMDI method is widely used due to its exact decomposition property and absence of residual terms. Since the analysis is based on production-based CO2 emissions from environmental accounts, electricity-related indirect emissions are not attributed to the sector. Therefore, structural decomposition focuses on fossil fuel use.
The decomposition is based on total production-based sectoral CO2 emissions reported in air-emission accounts. In the C23 sector, these emissions may include both fuel-combustion emissions and process-related emissions, particularly in mineral products involving calcination. The available data do not permit a fully consistent separation of these two components across all countries and years. Therefore, the decomposition should be interpreted as an accounting decomposition of total reported sectoral CO2 emissions rather than as a fuel-combustion decomposition with directly observable physical emission factors.
For accounting purposes, total reported sectoral CO2 emissions can be expressed as:
where
- —denotes gross value added (activity effect),
- —represents energy intensity,
- —captures the fossil fuel share in total final energy consumption,
- denotes the residual CO2-to-fossil-energy ratio.
Because reported sectoral CO2 may include process-related emissions and because the fossil-energy aggregate may change in composition over time, captures multiple unobserved influences. It should not be treated as a physical fuel-emission factor, a direct technological parameter, or evidence of changes in combustion efficiency.
This specification reflects a production-based emission boundary consistent with Eurostat environmental-economic accounts. Electricity-related indirect emissions are not allocated to the sector, as the analysis relies on production-based CO2 emissions reported in Eurostat air emission accounts.
Based on identity (3), the additive LMDI decomposition of emission changes between periods t−1 and t is defined as:
Each component is calculated using logarithmic mean weights:
where and the logarithmic mean function is defined as:
The residual CO2-to-fossil-energy ratio is defined as total reported production-based sectoral CO2 emissions divided by fossil final energy consumption. It is not a fuel-specific physical emission factor. Because the numerator may include process-related CO2 emissions and the denominator aggregates several fossil fuels, the corresponding LMDI effect captures the contribution of changes in an accounting residual rather than an independently identified emission factor. This component may reflect changes in process-emission intensity, fossil-fuel composition, reporting structure, or other sector-level factors not separately identified in the available data. It should therefore not be assigned a direct technological interpretation.
The decomposition is performed separately for consecutive year-to-year changes within each country. The resulting annual country-level effects are subsequently summarized across the panel to characterize their distribution and average contribution. As the first year of each country series has no preceding observation, the decomposition yields 285 country-year transitions (19 countries × 15 annual changes). To examine temporal heterogeneity, the annual LMDI contributions were additionally grouped into three subperiods: 2008–2014, 2015–2019, and 2020–2023. Each year-to-year transition was assigned to the subperiod corresponding to its ending year. This approach preserves all 285 country-year transitions and allows the structural contributions to be compared across periods using their mean annual values; the LMDI-I framework ensures exact factorization, such that the sum of all components equals the observed change in emissions.
Unlike the econometric models based on emission intensity, the LMDI framework decomposes changes in emission levels and provides structural attribution rather than causal inference.
All econometric estimations were conducted using GRETL version 2024b (Gnu Regression, Econometrics and Time-series Library). The software was employed for static and dynamic fixed-effects panel estimation and diagnostic testing. Structural decomposition calculations (LMDI) were implemented using panel-level data processing consistent with the methodological framework described above.
3. Results
3.1. Descriptive Statistics
Table 3 reports descriptive statistics for the main variables used in the econometric and decomposition analyses. The balanced panel comprises 304 country-year observations for 19 EU Member States over the period 2008–2023. The lagged carbon-intensity variable contains 285 observations because the first observation for each country is used to construct the one-period lag.
Table 3.
Descriptive statistics of the main study variables.
On average, electricity accounts for 16.9% of final energy consumption, while fossil fuels account for approximately 67.5%. The remaining share corresponds to other energy carriers. The mean logarithmic CO2 intensity is 1.026, with a standard deviation of 0.543, indicating substantial cross-country and intertemporal variation. Log energy intensity has a mean of −0.655 and a standard deviation of 0.442, likewise indicating heterogeneity in energy use relative to sectoral value added.
The descriptive statistics therefore reveal substantial variation in sectoral activity, energy use, energy structure, and emission intensity across the countries and years included in the analysis.
3.2. Static Panel Estimates (Model A)
Table 4 presents the results of the static panel estimations for CO2 intensity in the non-metallic mineral sector (C23). Columns (1) and (2) report two alternative two-way fixed-effects specifications using electricity share and fossil fuel share, respectively. Driscoll–Kraay standard errors are used to account for heteroskedasticity, serial correlation, and cross-sectional dependence.
Table 4.
Two-way fixed-effects estimates of CO2 intensity with Driscoll–Kraay standard errors.
Table 4 presents the two-way fixed-effects estimates with Driscoll–Kraay standard errors. Energy intensity is positively and statistically significantly associated with CO2 intensity in both specifications. The estimated elasticity is 0.823 in the electricity-share model and 0.779 in the fossil-fuel-share model (p < 0.01 in both cases). Thus, within countries over time, higher final energy consumption relative to gross value added is associated with higher CO2 emissions relative to gross value added. This estimate should be interpreted cautiously because both variables share gross value added as a denominator. It does not, by itself, demonstrate that changes in technical process efficiency cause changes in carbon intensity.
The electricity-share coefficient is positive (β= 1.014) and weakly significant at the 10% level in the baseline Driscoll–Kraay specification, whereas the fossil-fuel-share coefficient is statistically insignificant (β = −0.196). These coefficients require careful interpretation because energy shares are compositional: an increase in electricity share necessarily corresponds to a lower share of one or more other energy carriers. The separate specifications do not identify which energy carrier is displaced when electricity use increases. Accordingly, the electricity-share coefficient should not be interpreted as the isolated carbon effect of electricity use, electrification, or fuel substitution. Sensitivity checks using alternative Driscoll–Kraay bandwidths indicate that the statistical significance of the electricity-share coefficient is bandwidth-sensitive. Accordingly, this result should be interpreted cautiously and does not provide robust evidence of an independent association between electricity share and CO2 intensity.
By contrast, the positive association between energy intensity and CO2 intensity remains statistically significant across both energy-structure specifications and alternative bandwidth choices. The results therefore indicate that energy intensity is the more robust correlate of sectoral CO2 intensity, while the evidence for an independent association with energy composition is substantially weaker.
From an engineering-system perspective, this pattern indicates that variation in energy use relative to economic output is more closely associated with sectoral CO2 performance than the observed changes in aggregate final-energy composition. However, because energy intensity is measured as FEC/VA, this association should not be interpreted as direct evidence of improvements in the technical efficiency of individual production processes or equipment.
3.3. Dynamic Panel Results (Model B)
Table 5 reports the dynamic fixed-effects (LSDV) estimates of carbon intensity. Two specifications are presented: B1 includes the electricity share, while B2 includes the fossil fuel share as alternative measures of energy structure. Time dummies are included in both models, and Driscoll–Kraay standard errors with a bandwidth of two lags are used for statistical inference.
Table 5.
Dynamic fixed-effects estimates of CO2 intensity with Driscoll–Kraay standard errors (Model B).
The dynamic fixed-effects estimates indicate positive serial dependence in carbon intensity. The estimated coefficient on lagged carbon intensity equals 0.217 (p < 0.01) in the electricity-share specification and 0.197 (p < 0.01) in the fossil-share specification. However, because these coefficients are obtained from a fixed-effects model with a lagged dependent variable, their magnitudes may be affected by finite- Nickell bias. They should therefore be interpreted as suggestive evidence of positive persistence rather than as precise estimates of the speed or magnitude of carbon-intensity adjustment.
Energy intensity remains positive and highly significant across both specifications. The estimated elasticity equals 0.807 in B1 and 0.761 in B2 (p < 0.01 in both cases), indicating that higher energy use per unit of value added is consistently associated with higher carbon intensity. The estimated energy-intensity elasticity also remains close to that obtained from the static FE models, indicating substantial stability of this association after accounting for lagged CO2 intensity.
Regarding energy composition, the electricity-share coefficient is positive and statistically significant in B1 (β = 1.313, p < 0.01), whereas the fossil-fuel-share coefficient in B2 is statistically insignificant (β = 0.038). However, given the weaker and bandwidth-sensitive evidence obtained for electricity share in the static specification, this association should be interpreted cautiously. In particular, a higher electricity share does not by itself identify process electrification, and the estimated coefficient should not be interpreted as evidence that electrification causes higher carbon intensity.
The Pesaran CD test rejects the null hypothesis of cross-sectional independence in both dynamic specifications (p = 0.0121 and p = 0.0158, respectively). Accordingly, statistical inference is based on Driscoll–Kraay standard errors. Given the potential finite-T bias inherent in dynamic fixed-effects estimation, the magnitude of the lag coefficient should be interpreted cautiously.
From an engineering-system perspective, the observed persistence is consistent with gradual adjustment in high-temperature production systems characterized by long-lived thermal assets and investment cycles. However, the dynamic model does not directly identify technological lock-in, equipment replacement, or specific process-level changes.
Overall, the dynamic results reinforce the finding that energy intensity is the most consistent correlate of carbon intensity across the estimated specifications, whereas the evidence for an independent association with energy composition is less uniform. The subsequent LMDI decomposition (Model C) complements this analysis by examining the contributions of changes in activity, energy intensity, fossil-fuel share, and the implicit CO2-to-fossil-energy factor to observed annual changes in absolute CO2 emissions.
Additional sensitivity analyses were conducted to evaluate the robustness of the dynamic fixed-effects estimates. The split-panel jackknife correction increased the estimated coefficient on lagged CO2 intensity from 0.217 to 0.306 in the electricity-share specification and from 0.197 to 0.263 in the fossil-fuel-share specification. The corresponding energy-intensity coefficients remained positive, changing from 0.807 to 0.774 and from 0.761 to 0.705, respectively (Appendix A Table A1). These results indicate that the positive direction of the two relationships is retained after the bias-correction exercise, although their magnitudes remain estimator-dependent.
Additional two-step System GMM estimations were examined as an estimator-sensitivity analysis (Appendix A Table A2). Across the four specifications, the number of instruments ranged from 20 to 24, exceeding the number of countries (N = 19). The estimated coefficients were sensitive to the assumptions regarding regressor endogeneity, while the diagnostic results raised additional concerns about the reliability of the GMM estimates. In particular, some specifications produced Hansen test p-values close to unity, and the AR(1) and Sargan tests yielded mixed results. Consequently, these estimations did not provide sufficiently robust evidence to replace the dynamic fixed-effects results. The System GMM estimates are therefore reported for methodological transparency rather than as confirmatory robustness evidence.
3.4. Structural Decomposition Results (Model C)
The additive LMDI decomposition reproduces the observed year-to-year changes in sectoral CO2 emissions with negligible numerical deviation. The mean decomposition residual is approximately 2.9 × 10⁻¹³ kt CO2, indicating that the decomposition identity is satisfied up to numerical rounding.
Annual LMDI effects were calculated for consecutive year-to-year changes within each country. As the first year of each country series has no preceding observation, the decomposition yields 285 country-year transitions (19 countries × 15 annual changes). This reduction from the original 304 country-year observations is therefore inherent to the year-to-year decomposition rather than the result of missing data.
Table 6 reports the distribution of annual additive contributions associated with four components: the activity effect (ΔVA), energy-intensity effect (ΔEI), fossil-fuel-share effect (ΔFS), and implicit CO2-to-fossil-energy effect (ΔEF). All contributions are expressed in kt CO2.
Table 6.
Distribution of annual LMDI decomposition effects across country-year transitions.
Across the 285 country-year transitions, the energy-intensity effect (ΔEI) shows the largest negative mean contribution, at −267.75 kt CO2. Its median is also negative (−99.76 kt CO2), indicating that the energy-intensity contribution was negative in more than half of the observed annual transitions. These results identify changes in energy intensity as the largest average downward component of annual CO2 changes in the decomposition.
The fossil-fuel-share effect (ΔFS) is also negative on average (−117.24 kt CO2), with a negative median (−47.46 kt CO2). Changes in the fossil share therefore provided an additional average downward contribution to annual emission changes, although its mean magnitude was smaller than that of the energy-intensity effect.
In contrast, the activity effect (ΔVA) is positive on average (+58.90 kt CO2), indicating that changes in sectoral value added tended, on average, to exert upward pressure on emissions. The residual CO2-to-fossil-energy effect () is also positive on average (33.68 kt CO2), although its distribution includes both negative and positive annual contributions. This result should not be interpreted as evidence of a change in a physical fuel-emission factor. Instead, it reflects changes in the accounting ratio between total reported production-based sectoral CO2 emissions and aggregate fossil final energy consumption, which may include process-related emissions and changes in the composition of fossil fuels.
Taken together, the mean LMDI contributions indicate that the negative energy-intensity effect was the largest component of annual emission changes, followed by the negative fossil-fuel-share effect. These downward contributions were partly offset, on average, by the positive activity effect and the positive implicit CO2-to-fossil-energy effect. The decomposition therefore distinguishes the relative contributions of changes in production activity, energy intensity, fossil-fuel dependence, and the relationship between production-based CO2 emissions and fossil-energy use.
From an engineering-system perspective, the decomposition indicates that annual changes in emissions were more strongly associated, on average, with changes in energy use relative to economic output than with changes in the aggregate fossil-fuel share of final energy consumption. This finding should not be interpreted as direct evidence of technical efficiency improvements, because ΔEI captures changes in sectoral energy intensity rather than the performance of individual technologies or production units. Similarly, ΔFS captures changes in aggregate fossil-fuel dependence but does not identify the specific fuels, technologies, or process modifications responsible for those changes. The positive mean residual CO2-to-fossil-energy effect indicates that changes in the ratio of total reported production-based CO2 emissions to aggregate fossil final energy use partly offset the downward contributions of energy intensity and fossil-fuel share. Because this ratio may reflect process emissions, fossil-fuel composition, and other unobserved sectoral changes, it should not be interpreted as a direct measure of deterioration in fuel quality, combustion efficiency, or technology performance.
The distributions reported in Table 6 also reveal considerable heterogeneity across countries and years. For example, both the activity and energy-intensity effects include substantial negative and positive annual contributions. The 5th–95th percentile ranges show that this dispersion remains considerable even when the most extreme observations are excluded. Accordingly, the average effects should be interpreted as summaries of heterogeneous country-year transitions rather than as uniform patterns applying to every Member State and year.
A supplementary subperiod analysis was conducted to assess temporal variation in the LMDI contributions (Appendix A Table A3). The results reveal substantial differences across the three periods. During 2008–2014, the fossil-fuel-share effect provided a larger average downward contribution (−159.10 kt CO2) than the energy-intensity effect (−41.58 kt CO2), while the activity effect was also negative (−429.60 kt CO2). In 2015–2019, the energy-intensity effect became the largest average downward component (−234.83 kt CO2), partly offsetting the positive activity effect (+349.82 kt CO2). This pattern was more pronounced in 2020–2023, when the energy-intensity effect reached −648.16 kt CO2 on average, compared with a positive activity effect of +428.02 kt CO2. The fossil-fuel-share effect remained negative in all three subperiods. Overall, the findings indicate that the relative contributions of energy intensity, energy structure, and economic activity varied over time. Energy-intensity changes were particularly important over the full period, although their relative contribution varied across subperiods.
4. Discussion
The evidence points to a consistent pattern in the carbon-intensity dynamics of the EU non-metallic mineral sector, involving persistence in carbon intensity, changes in energy intensity, changes in energy composition, and production activity.
4.1. Persistence and Gradual Adjustment
The dynamic fixed-effects estimates suggest positive persistence in sectoral CO2 intensity, with lagged dependent-variable coefficients of 0.217 and 0.197 in the two baseline specifications. The split-panel jackknife correction yields somewhat higher estimates of 0.306 and 0.263, respectively (Table A1, Appendix A), while retaining the positive direction of the relationship. However, the additional System GMM estimations exhibit sensitivity to model specification, and their diagnostic results do not provide sufficiently reliable grounds for confirming the precise magnitude of persistence (Table A2, Appendix A). Taken together, these findings suggest that past CO2 intensity is positively associated with its current level, although the strength of this persistence remains uncertain. The dynamic results should therefore be interpreted as exploratory evidence of CO2-intensity persistence rather than as a precise measure of adjustment speed.
In the context of high-temperature mineral industries, this pattern is consistent with the potential role of long-lived production assets and gradual capital-stock adjustment. Kilns, furnaces, and associated thermal systems often remain in operation for extended periods, which may constrain the speed at which production technologies and energy systems can be replaced. Similar forms of infrastructural inertia and path dependence have been discussed in studies of energy-intensive industrial decarbonization [4,8,40]. More broadly, the literature on carbon lock-in emphasizes the role of long-lived infrastructure, capital intensity, and path-dependent investment in slowing technological transitions [35,36]. The present analysis does not directly measure technological lock-in or asset lifetimes. Nevertheless, the estimated positive persistence is compatible with gradual adjustment within existing production systems.
4.2. Energy Intensity as the Dominant Adjustment Dimension
Across the main econometric specifications, energy intensity is the explanatory variable that most consistently retains statistical significance. Introducing the lagged dependent variable does not materially alter this relationship. Higher final energy consumption per unit of value added remains positively associated with higher carbon intensity within countries over time. Comparable relationships between energy intensity and industrial emissions have been reported in previous empirical studies [18,19,20].
The LMDI results provide complementary evidence from an accounting-decomposition perspective. Over the full study period, the energy-intensity component (ΔEI) represents the largest average downward contribution to annual CO2 changes across the observed country-year transitions, exceeding the mean magnitude of the fossil-fuel-share effect. Similar importance of energy-intensity effects has been reported in decomposition analyses of industrial emissions [25,31,32,33]. However, the subperiod analysis reveals that this pattern was not uniform over time (Table A3, Appendix A). During 2008–2014, the fossil-fuel-share effect made a larger average negative contribution than the energy-intensity effect. In contrast, energy intensity became the dominant downward component in 2015–2019 and 2020–2023. These findings indicate that the relative importance of energy intensity and energy structure varied across the analyzed periods. Such differences may reflect changing economic and industrial conditions, although the decomposition itself does not establish the causes of these changes.
From a process-engineering perspective, reductions in sectoral energy intensity may be associated with improvements in thermal efficiency, combustion control, waste-heat recovery, process optimization, and energy management. However, because energy intensity is measured here as final energy consumption relative to value added, it should not be interpreted as a direct measure of technical process efficiency.
An additional limitation concerns the distinction between energy-related and process-related CO2 emissions. The production-based emission data used in this study may include both fuel-combustion emissions and process-related emissions, particularly those associated with calcination in cement and lime production. As these components cannot be consistently separated in the available panel, the observed association between energy intensity and CO2 intensity should not be interpreted as specific to combustion-related emissions. Similarly, the LMDI decomposition does not independently quantify changes in process emissions. Instead, their influence may be reflected in the implicit CO2-to-fossil-energy component, which represents an accounting residual rather than a directly observed physical emission factor. Consequently, the results should be interpreted as sector-level emission dynamics rather than direct evidence of changes in combustion efficiency or process-specific decarbonization.
4.3. Energy Structure and Its More Limited Empirical Role
The role of energy composition is less robust than that of energy intensity. This finding should also be read in light of the compositional nature of energy shares. Electricity, fossil fuels, and other energy carriers jointly sum to total final energy consumption; therefore, a change in one share necessarily reflects substitution away from another carrier or group of carriers. Aggregate shares do not reveal whether electricity displaces coal, natural gas, oil products, renewable fuels, waste-derived fuels, or another energy input. The estimated coefficients should therefore be interpreted as reduced-form associations with the aggregate energy mix, not as technology-specific substitution effects. The fossil-fuel-share coefficient is not statistically significant in either the static or dynamic fixed-effects specification. The electricity-share coefficient is positive and statistically significant in the dynamic model, whereas the corresponding evidence from the static model is weaker and sensitive to the choice of Driscoll–Kraay bandwidth. These results therefore do not provide a uniform econometric relationship between energy composition and carbon intensity. Importantly, the positive electricity-share coefficient should not be interpreted as evidence that electrification increases emissions. Rather, it indicates that a higher share of electricity in final energy consumption does not, by itself, correspond to lower production-based CO2 intensity in the analyzed sector.
From a technological perspective, changes in industrial energy structure may require longer adjustment horizons than changes in energy intensity. Previous studies of industrial electrification and fuel substitution emphasize the importance of capital replacement cycles, infrastructure requirements, and the technical constraints of high-temperature processes [3,8,13]. In this context, a higher electricity share may coexist with continued fossil-fuel use in thermally intensive processes and does not necessarily indicate direct substitution of fossil fuels in kilns, furnaces, or other high-temperature applications. Moreover, because the CO2 measure used in this study is production-based, it does not capture upstream emissions associated with purchased electricity. The electricity-share variable should therefore be interpreted as an indicator of final-energy composition rather than as a direct measure of low-carbon or renewable-based electrification.
The LMDI results add a different perspective. The fossil-fuel-share effect (ΔFS) is negative on average (−117.24 kt CO2) and has a negative median (−47.46 kt CO2), indicating that changes in fossil-fuel share provided an average downward contribution to annual CO2 changes across the observed country-year transitions. Its mean magnitude is nevertheless smaller than that of the energy-intensity effect. This relative pattern is broadly consistent with decomposition studies in which energy-intensity changes represent an important component of industrial emission reductions alongside changes in energy structure [31,33].
The difference between the econometric and decomposition results is not necessarily contradictory. The panel models estimate conditional associations with carbon intensity, whereas LMDI allocates observed changes in absolute CO2 emissions among accounting components. Taken together, the results suggest that changes in energy structure contributed to observed emission dynamics, but their relationship with CO2 intensity is less consistent than that of energy intensity. More broadly, the findings indicate that changes in final-energy composition and reductions in energy intensity represent distinct dimensions of sectoral decarbonization and should not be treated as interchangeable indicators of technological progress.
4.4. Scale Expansion and Decoupling Constraints
The LMDI results show that the activity effect (ΔVA) is positive on average, reflecting that increases in value added exert upward pressure on emissions. This indicates that the positive activity contribution partly offsets the average negative contributions associated with changes in energy intensity and fossil-fuel share.
The coexistence of energy-intensity-related downward contributions and activity-driven upward contributions reflects the well-documented challenge of relative versus absolute decoupling [21,33]. Even when emission intensity declines, expanding industrial output may sustain or increase absolute emission levels.
This finding illustrates the challenge of achieving absolute emission reductions while maintaining or expanding industrial output.
4.5. Integrated Interpretation
Taken together, the econometric and decomposition results distinguish between two dimensions of industrial decarbonization. First, energy intensity shows the most consistent empirical relationship with carbon intensity and represents the largest average downward component of annual emission changes in the LMDI decomposition. Second, changes in energy structure also contribute to emission dynamics, but their econometric relationship with carbon intensity is less robust. At the same time, the positive average activity effect shows that growth in sectoral value added can offset part of the downward contributions associated with energy-intensity and fuel-structure changes.
The persistence indicated by the dynamic models suggests that carbon intensity adjusts over time and remains related to its previous level. The stronger evidence for energy intensity, the less consistent role of energy structure, and the observed persistence are consistent with gradual adjustment within existing production systems, but do not by themselves identify the pace or extent of underlying technological transformation.
For capital-intensive, high-temperature industries, such adjustment may involve different time horizons for changes in energy intensity, shifts in energy carriers, and renewal of production infrastructure. Technological lock-in is not directly measured in the present analysis and is therefore treated as a contextual interpretation rather than an empirically identified mechanism.
4.6. Implications for Electrification and Low-Carbon Energy Transition
The results have implications for the role of electrification and low-carbon energy in industrial decarbonization, although renewable-energy penetration is not directly measured in the present study. The stronger and more consistent evidence for energy intensity than for energy composition suggests that changes in the energy carrier mix should not be considered in isolation from the amount of energy required relative to sectoral economic output.
In particular, the positive electricity-share coefficient should not be interpreted as evidence against electrification. Rather, it highlights an important distinction between a higher share of electricity in final energy consumption and low-carbon electrification as a technological decarbonization pathway. In high-temperature production systems, increasing electricity use does not necessarily imply that fossil fuels have been displaced from the most thermally intensive processes.
The carbon implications of industrial electrification also depend on the carbon intensity of the electricity supply. Since the dependent variable captures production-based CO2 emissions attributed directly to sector C23, indirect emissions associated with purchased electricity are outside the accounting boundary. Consequently, the estimated electricity-share coefficient cannot be interpreted as measuring the overall emission-reduction potential of electrification. Such an assessment would require information on the electricity generation mix and its carbon intensity across countries and years, alongside changes in direct industrial emissions. Furthermore, in cement and lime production, a substantial proportion of CO2 emissions may originate from calcination and other chemical processes rather than fuel combustion. These process-related emissions cannot be eliminated through fuel switching or electrification alone. Depending on the production route, deeper decarbonization may therefore require complementary measures, including process innovations, alternative raw materials, and carbon capture, utilization, and storage (CCUS). The present sector-level analysis does not directly evaluate these technological pathways, which should be considered in future research [3,4]. From a broader energy-transition perspective, renewable energy forms part of the technological, economic, and institutional mechanisms supporting the transition toward more sustainable energy systems [47]. The results suggest that reducing energy requirements per unit of economic output remains an important component of industrial decarbonization, while changes in energy carriers constitute a complementary and potentially longer-term dimension. For high-temperature mineral production, decarbonization strategies may therefore combine reductions in energy intensity with progressive substitution of fossil energy and, where technically feasible, electrification or other low-carbon heat options. The relevant policy question is therefore not simply whether industrial energy use becomes more electrified, but whether electrification effectively substitutes carbon-intensive energy inputs within the production processes responsible for sectoral emissions [48].
5. Conclusions
This study examined the relationship between carbon intensity, energy use relative to economic output, and aggregate energy composition in the EU non-metallic mineral sector (NACE C23) across 19 Member States during 2008–2023. Static and dynamic panel models were combined with an LMDI accounting decomposition to examine complementary aspects of sectoral emission dynamics.
The econometric results show that higher final energy consumption relative to gross value added is consistently associated with higher production-based CO2 emissions relative to gross value added. This relationship should not be interpreted as direct evidence of plant-level technical energy efficiency, since both indicators share gross value added as their denominator and may also reflect differences in product composition, capacity utilization, relative prices, and sectoral economic structure.
The evidence regarding energy composition is less conclusive. The fossil-fuel-share coefficient is not statistically significant in the panel models, while the association between electricity share and CO2 intensity differs between the static and dynamic specifications. Moreover, electricity and fossil-fuel shares are compositional indicators whose interpretation depends on changes in the remaining energy carriers. Since the production-based emission measure excludes indirect emissions associated with purchased electricity, a higher electricity share cannot be interpreted as evidence of either improved or deteriorated overall carbon performance resulting from electrification.
The LMDI analysis identifies the accounting contributions of changes in economic activity, energy intensity, fossil-fuel share, and the implicit CO2-to-fossil-energy ratio to annual changes in reported sectoral emissions. Although the energy-intensity effect made the largest average downward contribution over the full study period, the subperiod analysis reveals important temporal differences. In 2008–2014, the fossil-fuel-share effect provided a larger average downward contribution, whereas energy intensity became the dominant component in the subsequent periods. These results indicate that the relative importance of energy-related adjustment pathways varied over time. Moreover, the implicit CO2-to-fossil-energy component should not be interpreted as a physical fuel-emission factor, since reported sectoral emissions may include process-related CO2 that cannot be separately identified in the present dataset.
The dynamic fixed-effects results suggest positive persistence in sectoral CO2 intensity, although its magnitude remains sensitive to estimator choice. The split-panel jackknife correction retains positive autoregressive coefficients, while the System GMM sensitivity analyses provide less stable estimates and inconclusive diagnostic evidence. These findings are compatible with gradual adjustment in capital-intensive, high-temperature production systems but do not directly establish technological lock-in or quantify the speed of technological transformation.
For industrial strategy, these findings point to the need to consider energy intensity and energy-carrier substitution as related but distinct dimensions of decarbonization. Reductions in energy intensity can contribute within existing production systems, whereas deeper changes in energy supply and high-temperature processes may depend on longer investment and infrastructure cycles. The contribution of electrification to overall decarbonization depends on the carbon intensity of the electricity supply and the extent to which electricity replaces fossil fuels in industrial processes. Furthermore, in cement and lime production, reducing energy-related emissions alone is insufficient to eliminate process-related CO2 emissions. Deeper decarbonization may therefore require complementary technological pathways, including alternative raw materials, process innovations, and carbon capture, utilization, and storage (CCUS). These options were not directly evaluated in the present analysis and should be examined using more detailed technological and emissions data.
Future research should integrate sector-level analysis with plant-level process data, physical production indicators, and more detailed information on combustion-related and process-related emissions. Incorporating electricity-generation characteristics and technology-specific indicators would also support a more comprehensive assessment of renewable-based electrification and the technological pathways underlying industrial decarbonization.
Author Contributions
Conceptualization, A.D.W.; methodology, A.D.W.; software, A.D.W., P.K. and B.R.; validation, A.D.W., J.C. and P.H.; formal analysis, A.D.W. and G.L.K.; investigation, A.D.W., A.G., C.H. and J.C.; resources, A.D.W.; data curation, A.D.W., B.R. and D.D.; writing—original draft preparation, A.D.W.; writing—review and editing, A.D.W., P.H., A.G., D.D., P.K., J.C., C.H. and G.L.K.; visualization, A.D.W. and D.D.; supervision, P.H., A.G., P.K. and G.L.K.; project administration, A.D.W. All authors have read and agreed to the published version of the manuscript.
Funding
This research received no external funding.
Data Availability Statement
The data used in this study are publicly available from Eurostat databases (nama_10_a64, nrg_bal_c, env_ac_ainah_r2). Processed panel datasets and estimation codes are available from the corresponding author upon reasonable request.
Acknowledgments
Generative AI was used to assist in the graphical preparation of Figure 1 based on the conceptual framework developed by the authors. The authors reviewed and approved the final figure and take full responsibility for its content.
Conflicts of Interest
The authors declare no conflicts of interest.
Appendix A
Table A1.
Sensitivity of dynamic fixed-effects estimates to split-panel jackknife bias correction.
Table A2.
Sensitivity of dynamic panel estimates to alternative two-step System GMM specifications.
Table A3.
Subperiod comparison of annual additive LMDI contributions to sectoral CO2 emission changes.
References
- Horváth, Á.; Papp, A.T.; Lipták, K.; Musinszki, Z.; Markovics, K.S. Climate and Energy Issues of Energy-Intensive Sectors. Amfiteatru Econ. 2023, 25, 813–829. [Google Scholar] [CrossRef] [Scilit]
- Gheorghe, C.; Panazan, O.; Stelea, N. Decarbonization Pathways in EU Manufacturing: A Principal Component and Cluster Analysis. Sustainability 2025, 17, 8154. [Google Scholar] [CrossRef] [Scilit]
- Madeddu, S.; Ueckerdt, F.; Pehl, M.; Peterseim, J.; Lord, M.; Kumar, K.A.; Krüger, C.; Luderer, G. The CO2 reduction Potential for the European Industry via Direct Electrification of Heat Supply (Power-to-Heat). Environ. Res. Lett. 2020, 15, 124004. [Google Scholar] [CrossRef] [Scilit]
- Korczak, K.; Kochański, M.; Skoczkowski, T. Mitigation Options for Decarbonization of the Non-Metallic Minerals Industry and Their Impacts on Costs, Energy Consumption and GHG Emissions in the EU—Systematic Literature Review. J. Clean. Prod. 2022, 358, 132006. [Google Scholar] [CrossRef] [Scilit]
- Schüwer, D.; Schneider, C. Electrification of Industrial Process Heat: Long-Term Applications, Potentials and Impacts. In Proceedings of the ECEEE Industrial Summer Study Proceedings; European Council for an Energy Efficient Economy: Stockholm, Sweden, 2018; Volume 2018-June, pp. 411–422. [Google Scholar]
- Clark, G.; Davis, M.; Shibani; Kumar, A. Assessment of Fuel Switching as a Decarbonization Strategy in the Cement Sector. Energy Convers. Manag. 2024, 312, 118585. [Google Scholar] [CrossRef] [Scilit]
- Svensson, O.; Khan, J.; Hildingsson, R. Studying Industrial Decarbonisation: Developing an Interdisciplinary Understanding of the Conditions for Transformation in Energy-Intensive Natural Resource-Based Industry. Sustainability 2020, 12, 2129. [Google Scholar] [CrossRef] [Scilit]
- Gerres, T.; Chaves Ávila, J.P.; Llamas, P.L.; San Román, T.G. A Review of Cross-Sector Decarbonisation Potentials in the European Energy Intensive Industry. J. Clean. Prod. 2019, 210, 585–601. [Google Scholar] [CrossRef] [Scilit]
- Cámara-Aceituno, J.; Hermoso-Orzáez, M.J.; Terrados-Cepeda, J.; Rivadeneira- Zambrano, A.; Mena-Nieto, Á.; Golpe, A.A.; Garcia-Ramos, J.-E. Exploring the Driving Forces of CO2 emissions in the European Union. Open. Res. Eur. 2025, 5, 132. [Google Scholar] [CrossRef] [Scilit] [PubMed]
- Hartwell, R.; Coult, G.; Overend, M. Mapping the Flat Glass Value-Chain: A Material Flow Analysis and Energy Balance of UK Production. Glass Struct. Eng. 2023, 8, 167–192, Correction in Glass Struct. Eng. 2023, 8, 163. https://doi.org/10.1007/s40940-023-00218-z. [Google Scholar] [CrossRef] [Scilit]
- Atzori, D.; Tiozzo, S.; Vellini, M.; Gambini, M.; Mazzoni, S. Industrial Technologies for CO2 Reduction Applicable to Glass Furnaces. Thermo 2023, 3, 682–710. [Google Scholar] [CrossRef] [Scilit]
- Atzori, D.; Bassano, C.; Tiozzo, S.; Corasaniti, S.; Spena, A. Energy Efficiency Indicators About an Italian Representative Hollow Glass Plant. Energies 2025, 18, 1737. [Google Scholar] [CrossRef] [Scilit]
- Rosenow, J.; Arpagaus, C.; Lechtenböhmer, S.; Oxenaar, S.; Pusceddu, E. The Heat Is on: Policy Solutions for Industrial Electrification. Energy Res. Soc. Sci. 2025, 127, 104227. [Google Scholar] [CrossRef] [Scilit]
- Karlsson, S.; Beiron, J.; Normann, F.; Johnsson, F. The Roles of Permitting Times and Grid Expansion Capacity in Industrial Decarbonization—A Case Study of the Electrification of Swedish Industry. Energy Convers. Manag. X 2025, 26, 100962. [Google Scholar] [CrossRef] [Scilit]
- Aufderheide, D.; Di Matteo, L. Best Practice Approaches for Co-Processing of Alternative Fuels in the Cement Industry. Cem. Int. 2017, 15, 26–33. [Google Scholar]
- Gronba-Chyła, A.M.; Generowicz, A.; Kramek, A. Using Selected Types of Waste to Produce New Light Ceramic Material. Pol. J. Environ. Stud. 2021, 30, 2073–2083. [Google Scholar] [CrossRef] [Scilit]
- Gyamfi, B.A.; Kwakwa, P.A.; Adebayo, T.S. Energy Intensity among European Union Countries: The Role of Renewable Energy, Income and Trade. Int. J. Energy Sect. Manag. 2023, 17, 801–819. [Google Scholar] [CrossRef] [Scilit]
- Petrović, P.; Filipović, S.; Radovanović, M. Underlying Causal Factors of the European Union Energy Intensity: Econometric Evidence. Renew. Sustain. Energy Rev. 2018, 89, 216–227. [Google Scholar] [CrossRef] [Scilit]
- Filipović, S.; Verbič, M.; Radovanović, M. Determinants of Energy Intensity in the European Union: A Panel Data Analysis. Energy 2015, 92, 547–555. [Google Scholar] [CrossRef] [Scilit]
- Löschel, A.; Pothen, F.; Schymura, M. Peeling the Onion: Analyzing Aggregate, National and Sectoral Energy Intensity in the European Union. Energy Econ. 2015, 52, S63–S75. [Google Scholar] [CrossRef] [Scilit]
- Pappas, D.; Chalvatzis, K.J.; Guan, D.; Ioannidis, A. Energy and Carbon Intensity: A Study on the Cross-Country Industrial Shift from China to India and SE Asia. Appl. Energy 2018, 225, 183–194. [Google Scholar] [CrossRef] [Scilit]
- Beşer, N.Ö.; Çabaş, M.; Beşer, M.; Magazzino, C. Industrialization, Natural Resource Rent, and Energy Intensity: Drivers of Environmental Degradation in the EU’s Path to Sustainable Development. Energy Environ. 2025. [CrossRef] [Scilit]
- Shobande, O.A.; Ogbeifun, L.; Tiwari, A.K. Extricating the Impacts of Emissions Trading System and Energy Transition on Carbon Intensity. Appl. Energy 2024, 357, 122461. [Google Scholar] [CrossRef] [Scilit]
- Xie, Q.; Guo, S.; Cao, F. Exploring the Decoupling of Carbon Emissions and Economic Growth and Its Influencing Factors: A Comparative Study of the EU and BRICS Countries. Sustainability 2025, 17, 10637. [Google Scholar] [CrossRef] [Scilit]
- Ang, B.W. LMDI Decomposition Approach: A Guide for Implementation. Energy Policy 2015, 86, 233–238. [Google Scholar] [CrossRef] [Scilit]
- Serrano-Puente, D. Are We Moving toward an Energy-Efficient Low-Carbon Economy? An Input–Output LMDI Decomposition of CO2 Emissions for Spain and the EU28. SERIEs 2021, 12, 151–229. [Google Scholar] [CrossRef] [Scilit]
- Ang, B.W.; Wang, H. Index Decomposition Analysis with Multidimensional and Multilevel Energy Data. Energy Econ. 2015, 51, 67–76. [Google Scholar] [CrossRef] [Scilit]
- Dolge, K.; Blumberga, D. Key Factors Influencing the Achievement of Climate Neutrality Targets in the Manufacturing Industry: LMDI Decomposition Analysis. Energies 2021, 14, 8006. [Google Scholar] [CrossRef] [Scilit]
- Wang, M.; Feng, C. Using an Extended Logarithmic Mean Divisia Index Approach to Assess the Roles of Economic Factors on Industrial CO2 Emissions of China. Energy Econ. 2018, 76, 101–114. [Google Scholar] [CrossRef] [Scilit]
- Branger, F.; Quirion, P. Reaping the Carbon Rent: Abatement and Overallocation Profits in the European Cement Industry, Insights from an LMDI Decomposition Analysis. Energy Econ. 2015, 47, 189–205. [Google Scholar] [CrossRef] [Scilit]
- Wang, J.-W.; Liao, H.; Tang, B.-J.; Ke, R.-Y.; Wei, Y.-M. Is the CO2 Emissions Reduction from Scale Change, Structural Change or Technology Change? Evidence from Non-Metallic Sector of 11 Major Economies in 1995–2009. J. Clean. Prod. 2017, 148, 148–157. [Google Scholar] [CrossRef] [Scilit]
- Herbeth, S.; Coënt, L.; Lazarou, S.; Mahovsky, M. Energy Consumption Decomposition Analysis Using European Official Statistics: Methodology and Input Data. Stat. J. IAOS 2024, 40, 659–684. [Google Scholar] [CrossRef] [Scilit]
- Bianco, V.; Cascetta, F.; Nardini, S. Analysis of the Carbon Emissions Trend in European Union. A Decomposition and Decoupling Approach. Sci. Total Environ. 2024, 909, 168528. [Google Scholar] [CrossRef] [Scilit] [PubMed]
- Ibn-Mohammed, T.; Serrenho, A.C.; Fujii, H.; Acquaye, A.; Morrison-Saunders, A. Decarbonising the UK Pulp, Paper and Printing Sector: Balancing Sustainability and Global Competitiveness through Insights from LMDI and MRIO Analysis. Energy Econ. 2025, 150, 108872. [Google Scholar] [CrossRef] [Scilit]
- Seto, K.C.; Davis, S.J.; Mitchell, R.B.; Stokes, E.C.; Unruh, G.; Ürge-Vorsatz, D. Carbon Lock-In: Types, Causes, and Policy Implications. Annu. Rev. Environ. Resour. 2016, 41, 425–452. [Google Scholar] [CrossRef] [Scilit]
- Janipour, Z.; De Nooij, R.; Scholten, P.; Huijbregts, M.A.J.; De Coninck, H. What Are Sources of Carbon Lock-in in Energy-Intensive Industry? A Case Study into Dutch Chemicals Production. Energy Res. Soc. Sci. 2020, 60, 101320. [Google Scholar] [CrossRef] [Scilit]
- Škare, M.; Porada-Rochoń, M. Are We Making Progress on Decarbonization? A Panel Heterogeneous Study of the Long-Run Relationship in Selected Economies. Technol. Forecast. Soc. Change 2023, 188, 122279. [Google Scholar] [CrossRef] [Scilit]
- Hou, K.; Sun, J.; Dong, M.; Zhang, H.; Li, Q. Simulation of Carbon Peaking Process of High Energy Consuming Manufacturing Industry in Shaanxi Province: A Hybrid Model Based on Lmdi and Tentssa-Enn. Math. Biosci. Eng. 2023, 20, 18445–18467. [Google Scholar] [CrossRef] [Scilit] [PubMed]
- Wesseling, J.; Worrell, E.; Nilsson, L.J.; Åhman, M.; Lechtenböhmer, S.; Coenen, L. How to Decarbonise Energy-Intensive Processing Industries? Survey and Conceptualisation of Their Specific Innovation Systems. In Proceedings of the ECEE Industrial Summer Study Proceedings; European Council for an Energy Efficient Economy: Stockholm, Sweden, 2016; Volume 2016-September, pp. 505–518. [Google Scholar]
- Carmona-Martínez, A.A.; Rontogianni, A.; Zeneli, M.; Grammelis, P.; Birgi, O.; Janssen, R.; Di Costanzo, B.; Vis, M.; Davidis, B.; Reumerman, P.; et al. Charting the Course: Navigating Decarbonisation Pathways in Greece, Germany, The Netherlands, and Spain’s Industrial Sectors. Sustainability 2024, 16, 6176. [Google Scholar] [CrossRef] [Scilit]
- Bezić, H.; Mance, D.; Balaž, D. Panel Evidence from EU Countries on CO2 Emission Indicators during the Fourth Industrial Revolution. Sustainability 2022, 14, 12554. [Google Scholar] [CrossRef] [Scilit]
- Rivera-Niquepa, J.D.; Yusta, J.M.; De Oliveira-De Jesus, P.M. Kaya Factor Decomposition Assessment of Energy-Related Carbon Dioxide Emissions in Spain: A Multi-Period and Multi-Sector Approach. Sustain. Energy Technol. Assess. 2025, 74, 104156. [Google Scholar] [CrossRef] [Scilit]
- Xia, X.; Zhu, D.; Sha, J.; Ma, R.; Kang, W. Research on Industrial Carbon Emission Prediction Method Based on CNN–LSTM under Dual Carbon Goals. Int. J. Low-Carbon Technol. 2025, 20, 580–589. [Google Scholar] [CrossRef] [Scilit]
- Liu, Y.; Xu, Q.; Wang, Z.; Qi, L.; Lu, J. Estimation of Carbon Dioxide Emissions from the Cement Industry in Beijing-Tianjin-Hebei Using Neural Networks. PLoS Clim. 2025, 4, e0000544. [Google Scholar] [CrossRef] [Scilit]
- Roodman, D. A Note on the Theme of Too Many Instruments. Oxf. Bull. Econ. Stat. 2009, 71, 135–158. [Google Scholar] [CrossRef] [Scilit]
- Dhaene, G.; Jochmans, K. Split-Panel Jackknife Estimation of Fixed-Effect Models. Rev. Econ. Stud. 2015, 82, 991–1030. [Google Scholar] [CrossRef] [Scilit]
- Woźniak, A.D.; Ciuła, J.; Kochanek, A.; Guzal-Dec, D. Renewable Energy as a Strategic Mechanism for Achieving the Sustainable Development Goals: A Bibliometric Review. Energies 2026, 19, 1201. [Google Scholar] [CrossRef] [Scilit]
- Kyriakopoulos, G.L.; Streimikiene, D.; Baležentis, T. Addressing Challenges of Low-Carbon Energy Transition. Energies 2022, 15, 5718. [Google Scholar] [CrossRef] [Scilit]

Disclaimer/Publisher’s Note: The statements, opinions and data contained in all publications are solely those of the individual author(s) and contributor(s) and not of MDPI and/or the editor(s). MDPI and/or the editor(s) disclaim responsibility for any injury to people or property resulting from any ideas, methods, instructions or products referred to in the content. |
© 2026 by the authors. Licensee MDPI, Basel, Switzerland. This article is an open access article distributed under the terms and conditions of the Creative Commons Attribution (CC BY) license.