


Abstract
The article examines progress in the system integration of renewable energy sources in China over the period 2020–2026, focusing on the challenge of integrating rapidly expanding renewable energy capacity into the power system. The study adopts a review-based and synthetic approach, combining a structured narrative review, based on an explicit search and eligibility protocol, with the analysis of secondary quantitative data and selected case studies. The analysis covers four interrelated dimensions of system integration—temporal, spatial, technical and institutional-market—each assessed using a common framework of input/capacity, enabling-system and integration outcome indicators. Comparison of the 2020 baseline with end-2025 data, supplemented by qualitative updates to September 2026, reveals a substantial transformation in China’s power system. By the end of 2025, combined wind and solar PV capacity had reached approximately 1.84 TW, accounting for 47.3% of total installed capacity, while new-type energy storage capacity increased from approximately 3.3 GW in 2020 to approximately 136 GW in 2025. The findings reveal clearly differentiated development trajectories across the four dimensions. Rapid expansion of renewable energy capacity and energy storage was accompanied by persistent spatial integration constraints, a still limited documented scale of grid-forming deployments and gradual development of institutional and market mechanisms. The analysis indicates that rapid capacity and infrastructure growth does not necessarily translate into equally rapid progress in system integration, highlighting the importance of coordinated resource utilisation, power system stability and effective market mechanisms.
1. Introduction
In recent years, China’s power sector transformation has advanced to a stage where “integrated renewable energy systems” encompass far more than the mere coexistence of wind, solar photovoltaic (PV) and hydropower sources. Increasing emphasis is therefore being placed on how the individual components of the power system interact: generation resources are functionally integrated with transmission and distribution networks, energy storage and demand-side flexibility, while digital management systems and electricity market mechanisms support the operation of the system as a whole. This direction is reflected in China’s ongoing development of the new-type power system, envisioned as a clean, low-carbon, secure and flexible system that supports the large-scale integration of renewable energy through closer coordination of power generation, electricity networks, energy storage and demand-side resources [1].
The year 2020 provides a natural baseline for analysing China’s power sector transformation. It was in that year that its long-term direction became clearly defined: in September, China announced its goal of achieving carbon neutrality before 2060 and just a few months later, at the Climate Ambition Summit in December, translated this commitment into a more specific target for the power sector—raising the combined installed capacity of wind and solar PV to more than 1.2 TW by 2030 [2,3].
The starting point was already substantial. By the end of 2020, China had approximately 930 GW of installed renewable energy capacity, accounting for 42.4% of its total installed power generation capacity. This included approximately 370 GW of hydropower, 282 GW of wind power and 253 GW of solar PV, while renewable electricity generation accounted for 29.5% of national electricity consumption [4,5]. The following years showed, however, that the pace of transformation would be considerably faster than anticipated under the timeline established at the time. The threshold of 1.2 TW of combined wind and solar PV capacity was exceeded as early as July 2024—six years ahead of schedule [6].
The subsequent expansion proceeded at an even faster pace. By the end of 2025, total installed power generation capacity in China had reached 3.89 TW, compared with 3.35 TW a year earlier, representing an increase of approximately 540 GW in a single year [7,8,9]. Solar PV and wind power expanded particularly rapidly. Installed solar PV capacity increased to 1.20 TW—nearly five times its 2020 level—while installed wind power capacity reached 0.64 TW, more than twice its 2020 level [8]. Together, wind and solar PV therefore reached a combined installed capacity of approximately 1.84 TW by the end of 2025, accounting for 47.3% of China’s total installed power generation capacity. The significance of this rapid expansion was already evident in the first quarter of 2025, when the combined installed capacity of wind and solar PV exceeded that of thermal power for the first time in China’s history [10,11].
Energy storage expanded at a similarly rapid pace, with the installed capacity of new-type energy storage—encompassing storage technologies other than conventional pumped-storage hydropower—increasing from approximately 3.3 GW in 2020 to 136 GW by the end of 2025 according to the NEA (144.7 GW according to the China Energy Storage Alliance, CNESA, which applies a different reporting scope), representing an increase of more than fortyfold in both series [12,13,14].
However, the scale of capacity expansion does not necessarily translate into the power system’s ability to make full use of these resources. In 2025, wind and solar PV, despite accounting for 47.3% of total installed capacity, supplied approximately 22% of electricity, whereas the share of renewable electricity generation in national electricity consumption reached approximately 38.5% [11,15]. The difference between the shares of wind and solar PV in installed capacity and electricity generation primarily reflects the weather-dependent nature of these resources. As their role in the power system grows, however, challenges related to grid capacity, system flexibility and the need for periodic curtailment of available generation are also becoming increasingly apparent [16,17].
The 2020–2026 perspective further indicates that progress in system integration has not followed the same trajectory across all dimensions. While some components of the system—energy storage in particular—expanded exceptionally rapidly, other areas developed along slower or less advanced trajectories. This suggests that the central challenge of China’s power sector transformation lies not only in the continued expansion of renewable energy capacity, but increasingly in the system’s ability to make effective use of growing renewable resources and to coordinate their integration across the temporal, spatial and technical dimensions, as well as the institutional and market aspects of system integration [17].
The aim of this article is to assess progress in the system integration of renewable energy in China over the 2020–2026 period by comparing the 2020 baseline with the state of China’s power sector transformation in 2025–2026. The analysis draws on the peer-reviewed literature and data from reliable institutional and sectoral sources available up to September 2026. The quantitative comparison refers to the 2020 baseline and the end of 2025, the most recent year for which complete annual statistics were available, whereas information published between January and September 2026 is used to update the qualitative assessment of individual dimensions.
The article addresses the following three research questions:
- What processes and factors can be observed across the temporal, spatial, technical, as well as institutional and market dimensions of renewable energy system integration in China?
- How did the development trajectories of these four dimensions differ between the 2020 baseline and the state observed in 2025–2026?
- What tensions, interdependencies and research gaps emerge from comparing the trajectories of the individual dimensions of the integration?
The contribution of the article is threefold. First, it applies an integrated four-dimensional framework, whose individual dimensions are established in the international literature, to a single national power system over the same period (2020–2026), so that all four dimensions are assessed against the same baseline and with a common set of indicators. Second, it combines this assessment with an explicit qualitative protocol that distinguishes input, enabling-system and integration outcome indicators, which makes it possible to examine, rather than assume, whether capacity growth translates into integration progress. Third, it systematically maps the interdependencies between the dimensions (Section 5), which the existing literature on China typically treats separately.
2. Literature Review
In the international literature, the integration of variable renewable energy (VRE) is conceptualised as a multidimensional challenge, with the main strands of research organised around four interrelated dimensions: (I) temporal system balancing, encompassing generation variability, forecasting and flexibility, (II) spatial power flows, associated with transmission network development, congestion and interregional power transfers, (III) power system stability with an increasing share of inverter-based resources (IBRs), and (IV) market functioning and institutional frameworks, encompassing pricing mechanisms, market design and regulatory arrangements supporting renewable energy integration [17,18,19,20].
2.1. Temporal Dimension: Flexibility and Energy Storage
Li et al. [21] argue that achieving carbon neutrality in China by 2060 will require a substantial increase in power system flexibility. In this context, the authors identify several complementary areas of action: enhancing the flexibility of existing power plants, expanding transmission capacity, developing energy storage and strengthening demand response mechanisms [21]. As the share of weather-dependent sources increases, the ability of the power system to accommodate variations in supply and demand across different timescales becomes one of the fundamental prerequisites for further renewable energy integration.
More recent research has further developed this line of inquiry through empirical analysis. A 2026 study [22] demonstrates that coordinated source-grid-load-storage (SGLS) planning in Xinjiang could enable the integration of an additional 487 GW of local VRE capacity while, at the national level, reducing the need to build excess generation capacity and lowering total investment costs by approximately USD 58.2 billion. These findings indicate that increasing system flexibility depends not only on the development of energy storage but also on the coordination of generation, demand, networks and other flexibility resources.
At the same time, increasing attention is being paid to demand-side flexibility. IEA analyses point to the significant potential of aggregators, virtual power plants (VPPs) and demand response mechanisms, while also identifying persistent market and regulatory barriers that constrain the full utilisation of these resources within China’s power system [17]. The temporal dimension of integration therefore encompasses not only the expansion of physical energy storage capabilities but, more broadly, the development of the entire system’s ability to respond to fluctuations in electricity supply and demand through the coordination of flexibility across generation, transmission and distribution networks, energy storage and electricity consumption.
2.2. Spatial Dimension: Ultra-High-Voltage Transmission (UHV/HVDC)
The spatial dimension of renewable energy integration arises from the substantial geographical mismatch between the distribution of renewable energy resources and the main centres of electricity demand. A large share of China’s renewable energy resources and large-scale wind and solar capacity is concentrated in the northern and northwestern regions of the country, whereas the largest electricity consumption centres are located primarily in the eastern and southern provinces. Addressing this mismatch requires expanding the capacity to transmit large volumes of electricity over long distances, a need that China has sought to meet through the continued expansion of ultra-high-voltage (UHV) transmission infrastructure, including high-voltage direct current (HVDC) systems [23,24].
A review of the technical literature reveals an evolution of China’s HVDC systems from the dominance of conventional line-commutated converter (LCC) technology towards a more diverse technological architecture incorporating hybrid LCC/VSC configurations and voltage-source converter (VSC) technologies [24]. These solutions enhance system controllability and facilitate the integration of large-scale renewable energy resources. A prominent example of this development is the Gansu–Zhejiang transmission project, construction of which began in 2024. It is the world’s first interregional ±800 kV UHVDC project to employ VSC technology at both the sending and receiving ends, with a transmission capacity of 8 GW. The approximately 2370 km corridor is designed to transmit electricity from Gansu, a province rich in wind and solar resources, to one of the major demand centres in eastern China [25].
It should be emphasised, however, that the expansion of transmission infrastructure alone does not determine the extent of renewable energy integration. Its effectiveness also depends on the utilisation of available transmission capacity, coordination among provinces and the rules governing interregional electricity trading. The literature therefore highlights not only the importance of the physical expansion of UHV/HVDC infrastructure, but also the system’s ability to use this infrastructure to reduce the spatial mismatch between renewable electricity generation and demand [23,26].
2.3. Technical Dimension: Power System Stability and Grid-Forming Technologies
The technical dimension of renewable energy integration is associated with maintaining power system stability as the share of resources connected to the grid through power electronic converters increases. Unlike conventional synchronous generators, inverter-based resources (IBRs) do not inherently provide the same dynamic characteristics to the power system, particularly those associated with inertia and damping. As the share of IBRs increases, challenges related to frequency and voltage stability, as well as system behaviour under disturbances, become increasingly important [19,27].
One of the main approaches to these challenges is the development of grid-forming (GFM) converters. Khan et al. [27] highlight their potential role in supporting the stability of power systems with high shares of IBRs. Unlike grid-following (GFL) converters, which synchronise their operation with the existing grid voltage, GFM converters can behave as controlled voltage sources and actively regulate voltage and frequency, thereby supporting stable system operation as the share of inverter-based resources increases [19,27].
The significance of these challenges is also reflected in earlier events in China’s power system. One of the most frequently documented examples is the 2015 incident in Xinjiang, where interactions between the control systems of wind farm converters and a weak grid led to oscillations that propagated to other parts of the power system and ultimately resulted in the disconnection of neighbouring thermal generators. This case illustrates that, as the share of resources connected to the grid through power electronic converters increases, power system stability depends increasingly not only on available generation capacity and network infrastructure, but also on the dynamic characteristics and control strategies of power electronic devices [28,29,30].
In this context, GFM technologies represent an important development pathway for power systems with high shares of renewable energy. Recent reviews highlight their potential to establish voltage autonomously, provide virtual inertia and support frequency and voltage regulation. At the same time, the literature identifies several challenges associated with their broader deployment, including issues related to synchronisation and stability, performance under disturbances, coordination with energy storage systems and power system protection [31]. The technical dimension of renewable energy integration therefore encompasses not only the connection of additional generation resources to the grid, but also the development of control strategies and the dynamic characteristics of the system required to ensure safe and stable operation as the share of IBRs increases.
2.4. Institutional-Market Dimension
The fourth dimension of integration encompasses the institutional and market conditions that enable the effective utilisation of growing renewable energy resources. During the period under review, China continued to reform its electricity market, moving towards a more integrated national market framework. This process includes the development of spot markets, the expansion of interprovincial electricity trading, the harmonisation of ancillary services market rules and the creation of mechanisms enabling greater participation by flexibility resources, including energy storage, demand response, aggregators and virtual power plants. The importance of these reforms increases as the share of VRE grows, since more flexible pricing mechanisms and shorter trading timeframes allow the market to respond more effectively to changing supply and demand conditions [18,32].
Another important element in the institutionalisation of the renewable power market is the development of the Green Electricity Certificate (GEC) system. In 2023, the GEC system was established as the sole national mechanism for certifying the environmental attributes of electricity generated from renewable energy sources, while regulations adopted in 2024 further clarified the rules governing certificate issuance and trading [33,34]. At the same time, the issuance of international I-REC certificates for renewable energy installations in China was gradually phased out. This process was scheduled to be completed by 31 March 2025, reinforcing the central role of GECs in China’s domestic system for certifying the origin of renewable electricity [35].
The development of the GEC system has not, however, eliminated all challenges associated with its operation. Rapid growth in certificate supply, accompanied by slower growth in demand, exerted substantial downward pressure on prices, potentially weakening the economic incentive provided by the instrument [36]. At the same time, its international recognition increased. An important step in this direction came in 2025, when some of the earlier concerns regarding the credibility of GECs—including the risk of double counting environmental attributes—were addressed, enabling companies participating in the RE100 initiative to use Chinese certificates to substantiate progress towards meeting their renewable electricity targets [37]. The GEC case therefore demonstrates that renewable energy integration is not solely a technical issue, but also depends on the quality of institutions, the design of market incentives and the alignment of domestic mechanisms with international standards for renewable electricity reporting and accounting.
2.5. Research Gap
The review indicates that the literature on renewable energy integration in China is expanding rapidly but remains fragmented across distinct research strands, including power system stability and grid-forming technologies, flexibility and energy storage, the development of UHV/HVDC infrastructure and electricity market reforms and instruments supporting renewable energy integration. Individual studies provide in-depth insights into these areas; however, the dimensions identified in the literature are most often examined separately and are considerably less frequently considered together from a system-level perspective.
This article seeks to address this gap by applying a four-dimensional analytical framework encompassing the temporal, spatial, technical and institutional-market dimensions. The framework is intended not only to compare the progress achieved in each of these areas over the 2020–2026 period, but also to identify the interdependencies, tensions and uneven patterns of development that emerge at the intersections between the individual dimensions.
In assessing the contribution of this framework, it is important to distinguish between two possible sources of novelty: (a) the novelty of the four dimensions themselves and (b) the novelty of integrating them within a single analytical framework. The four dimensions are not new, each corresponds to an established strand of the international literature on VRE integration [17,18,19,20]. The contribution of this article lies in the second aspect, namely in the integration and comparative synthesis of evidence on all four dimensions for the same national power system over the same period, using a common set of indicators. Table 1 illustrates this point by mapping the key studies reviewed in Section 2.1, Section 2.2, Section 2.3 and Section 2.4 against the four dimensions. Most studies examine one dimension in depth and address one or two others only as secondary context. None of the reviewed studies assesses all four dimensions jointly for China’s power system over the 2020–2026 period.
Table 1.
Mapping of the key reviewed studies against the four dimensions of renewable energy system integration.
Figure 1 presents the analytical framework adopted in this study. The expansion of renewable capacity is treated as the common driver that generates a distinct integration challenge in each dimension: the variability of wind and solar output (temporal dimension), the geographical mismatch between resources and demand (spatial dimension), the stability challenge associated with the increasing share of inverter-based resources (technical dimension) and the coordination and incentive challenge (institutional-market dimension). The dimensions are not independent: responses developed in one dimension change the conditions in the others, for example when energy storage relieves transmission constraints or provides grid-forming services, or when market rules determine how storage and transmission capacity are actually used. The joint outcome of the four dimensions is the effective utilisation of renewable energy, reflected in reduced curtailment and secure power system operation. The interactions between the dimensions are analysed systematically in Section 5.
Figure 1.
Analytical framework of the study: renewable capacity expansion, the four interdependent dimensions of system integration and the integration outcome. Source: authors’ own elaboration.
3. Methodology
The study adopts a review-and-synthesis approach, combining a structured narrative review with an analysis of secondary quantitative data (desk research) and selected case studies. This approach enables insights from the existing literature to be combined with up-to-date sectoral data and empirical examples of renewable energy integration in China’s power system. It was adopted in view of the interdisciplinary nature of the research problem and the rapid pace of change in the field under investigation.
The study covers the period 2020–2026. The year 2020 was adopted as the baseline, in accordance with the rationale presented in the Introduction, while the current state of the transformation was assessed using data for 2025. Two time horizons are therefore distinguished. The quantitative comparison is based on values for the end of 2020 and the end of 2025, the latest year for which complete annual statistics were available at the time of the analysis. Information published between January and September 2026, which constitutes the data update cut-off of the study, was used only to update the qualitative assessment of individual dimensions (e.g., curtailment data published in 2026, GEC issuance data for April 2026 and the progress of the Gansu–Zhejiang project) and was not used in the calculation of growth rates. For each dimension of integration, information relating to the beginning and end of the study period was compared to assess the direction and magnitude of the changes observed.
Three groups of sources were used in the analysis. The first comprises peer-reviewed literature on renewable energy integration, power system flexibility, grid-forming technologies, UHV/HVDC infrastructure and electricity market reforms in China. The second consists of data published by national and international energy-sector institutions, particularly the National Energy Administration (NEA), China Energy Storage Alliance (CNESA) and International Energy Agency (IEA), including both current reports and official releases and historical data relating to the beginning of the study period. The third comprises independent industry and analytical sources, used as complementary sources to verify and interpret data from primary sources. Quantitative figures were drawn primarily from institutional and sectoral sources and, where possible, were cross-checked against independent secondary sources. Particular attention was paid to the consistency of indicator definitions, reporting periods and units of measurement. For materials available exclusively in Chinese, machine translation into English was used, while key numerical data and statistical categories were, where possible, compared with information available from English-language sources.
The literature review followed a structured search and selection protocol, summarised in Table 2. Peer-reviewed literature was identified through searches of the Scopus and Web of Science Core Collection databases, supplemented by Google Scholar and by backward citation searching (snowballing) of the retrieved studies. The searches were conducted between June and September 2026 and covered publications from January 2015 to September 2026. The lower bound of 2015 was adopted in order to capture the literature on the 2015 subsynchronous oscillation event in Xinjiang, an important reference point for the technical dimension, while the analytical focus of the study remains on the 2020–2026 period. Search strings combined a geographical term, a technology term and dimension-specific terms, following the general pattern (“China” OR “Chinese”) AND (“renewable energy” OR “variable renewable energy” OR “wind power” OR “solar PV”) AND (dimension-specific terms listed in Table 2).
Table 2.
Literature search and data collection protocol.
Studies were included if they (i) were published in peer-reviewed journals in English, (ii) focused on China’s power system or, in the case of the technical dimension, reviewed or analysed technologies and stability phenomena directly relevant to power systems with high shares of inverter-based resources, (iii) made a substantive, system-level contribution to at least one of the four dimensions and (iv) were published between January 2015 and September 2026. Studies were excluded if they addressed device-level control design without implications for system operation, focused on renewable energy generation without reference to its integration into the power system, or were available only as abstracts. Screening was carried out in two stages, first on the basis of titles and abstracts and then of full texts, independently by all three authors, with disagreements resolved through discussion. Because the review is narrative and the searches were refined iteratively across the four dimensions, the number of records at each screening stage was not logged systematically and is therefore not reported. The final set comprises 14 peer-reviewed studies [19,20,21,22,23,24,26,27,28,29,30,31,38,39], selected to represent the main research strands within each dimension rather than to provide an exhaustive inventory of publications. Their assignment to the dimensions is shown in Table 1. This body of literature is complemented by 50 institutional, statistical and sectoral sources, identified as described below and summarised in Table 2.
The peer-reviewed literature was limited to English-language publications, a substantial part of which was authored by researchers affiliated with Chinese institutions. Chinese-language materials were used for institutional and statistical sources (e.g., the NEA, the National Development and Reform Commission and the State Council), for which Chinese is the original language of publication. Institutional and sectoral sources were identified through targeted searches of the websites of these institutions, CNESA, the IEA and IEA-PVPS, as well as through the references cited in the retrieved studies.
The quality of non-peer-reviewed sources was assessed using a source hierarchy: (1) official statistics and regulatory documents, (2) reports of international agencies, (3) industry associations and independent analytical organisations and (4) news media and trade press, which were used only for project-level facts (e.g., commissioning dates and technical parameters) and, where possible, confirmed by a second source. Where sources reported different values for the same indicator, the value from the higher-ranked source was used in the main comparison and the alternative value was reported separately, together with an explanation of the difference in scope or methodology. Values from different sources were not combined in a single growth-rate calculation (see, e.g., the new-type energy storage data in Section 4.1). Each source was assigned to one primary dimension and, where relevant, to secondary dimensions on the basis of its research objective and main evidence (Table 1). Sources addressing the links between dimensions were additionally used to construct the interdependency matrix presented in Section 5. Indicators were selected if they (i) were available for both 2020 and 2025 from an official or equivalent source, (ii) were directly related to the integration challenge of the given dimension and (iii) were defined consistently over the study period. Indicators that did not meet criteria (i) or (iii), such as provincial curtailment rates, whose definitions and reporting practices differ across sources, were used only qualitatively.
The analysis was structured according to the four-dimensional framework of renewable energy system integration derived from the literature review. It comprises the following dimensions:
- The temporal dimension, related to balancing energy generation variability, energy storage and demand flexibility;
- The spatial dimension, related to transmission infrastructure and electricity transfers between resource-rich regions and major demand centres;
- The technical dimension, concerning power system stability with an increasing share of inverter-based resources (IBRs);
- The institutional and market dimension, encompassing electricity market rules, pricing mechanisms and instruments for certifying the origin of renewable electricity.
This framework provides a structure for the analysis and enables comparison of the direction of change and of the development trajectories of the individual dimensions.
To make the comparison across dimensions explicit and transparent, each dimension was assessed using a common three-tier indicator structure (Table 3): (i) input/capacity indicators, describing the physical or institutional resources added to the system, (ii) enabling-system indicators, describing whether the technical, regulatory and market conditions required to use these resources are in place and (iii) integration outcome indicators, describing whether renewable electricity is actually utilised by the system. This distinction is central to the argument of the article, since growth in the first tier does not by itself imply progress in the third.
Table 3.
Indicator framework for the four dimensions of renewable energy system integration.
Because the indicators are expressed in different units and are not available for all tiers and years, they were not aggregated into a composite index. Instead, each tier of each dimension was classified using an explicit ordinal protocol with three categories: rapid scale-up—a quantitative indicator at least doubled between 2020 and 2025 or the relevant conditions were established nationwide and are applied in practice, partial progress—measurable improvement is observed, but with persistent constraints, only marginal change in key values or implementation limited to parts of the system and early stage—evidence of change is limited to pilot or demonstration projects or no national-level data are available. The overall trajectory of a dimension is described by the combination of the classifications of its three tiers rather than by a single score. The classification was carried out jointly by the authors on the basis of the evidence presented in Section 4 and is summarised in Section 5. The protocol does not eliminate judgement, but it makes the basis for statements about “rapid” or “limited” progress explicit and verifiable.
The literature review and analysis of secondary quantitative data were complemented by four purposively selected illustrative case studies: the national scale-up of new-type energy storage, representing the temporal dimension, the Gansu–Zhejiang transmission corridor, representing the spatial dimension of integration, the deployment of grid-forming technology at the Baochi energy storage station, representing the technical dimension and the development of the Green Electricity Certificate (GEC) market, illustrating the institutional and market dimension. The cases were selected using four explicit criteria: (i) the case addresses the key bottleneck of the given dimension identified in the literature review, (ii) it represents a technological or institutional first-of-a-kind or frontier development in China and therefore indicates the leading edge rather than the average state of the dimension, (iii) the key decision, start of construction or commissioning took place in the second half of the study period (2023–2025) and (iv) it is documented in at least two independent sources, including at least one official or institutional source. Because the cases were selected as frontier examples, they are illustrative rather than statistically representative: they show what the most advanced solutions in each dimension look like and how far they are from system-wide scale. For the temporal dimension, no single project was selected, because temporal balancing is a system-wide property that depends on the aggregate portfolio of flexibility resources rather than on any individual facility. This dimension is therefore represented by a national-level case, namely the scale-up of new-type energy storage relative to the 14th Five-Year Plan target (Section 4.2).
The research approach adopted in this study is, however, subject to several limitations. The analysis relies on the existing literature and secondary data and does not include technical modelling of its own or power system simulations. Moreover, some sectoral indicators, particularly those relating to generation curtailment and capacity utilisation, are not defined and reported in a fully consistent manner across sources, which limits their direct comparability. In such cases, the available values were compared while accounting for differences in definitions and reporting periods. Given the rapid pace of developments in the field, some of the most recent information for 2025–2026 is also drawn from institutional, sectoral, or industry sources because corresponding peer-reviewed literature was not yet available at the time the study was finalised. In addition, the peer-reviewed literature was limited to English-language publications and Chinese-language journal literature was not systematically covered. Finally, although the assessment protocol makes the classification of trajectories explicit, it remains qualitative and involves an element of expert judgement. Its results should therefore be interpreted as a structured comparison rather than as a quantitative ranking.
4. Results
4.1. Trajectory of Change, 2020–2025: Scale and Structure of the Power System
The analysis of the results begins with a comparison of the scale and structure of China’s power system in the baseline year of 2020 and at the end of 2025. This comparison captures the magnitude of the changes that occurred over the five-year period in renewable energy capacity and in the resources supporting its integration. It covers key indicators of installed capacity, the share of renewables in total installed capacity and national electricity consumption, as well as the development of energy storage.
Table 4 presents the values for the end of 2020 and 2025, together with the magnitude of the changes that had occurred over that period. The data were compiled primarily from official statistics and releases published by the National Energy Administration (NEA), supplemented by data from the China Energy Storage Alliance (CNESA) and information published by the State Council of the People’s Republic of China. Following the framework described in Section 3, the indicators are grouped into input/capacity indicators, enabling-system indicators and integration outcome indicators.
The comparison reveals distinct differences in the scale of change across individual components of the power system. Between 2020 and 2025, installed capacity increased substantially across all renewable energy sources analysed, with solar PV experiencing by far the most rapid expansion. Solar PV capacity rose from 253 GW to 1200 GW, reaching nearly five times its 2020 level. Over the same period, wind power capacity more than doubled, from 282 GW to 640 GW, while hydropower capacity grew at a considerably slower pace. As a result, total installed renewable energy capacity increased from approximately 930 GW to 2337 GW, while its share of total installed power generation capacity rose from 42.4% to approximately 60%.
Energy storage expanded at an even faster pace. New-type energy storage capacity increased from approximately 3.3 GW in 2020 to 136 GW by the end of 2025 according to the NEA (144.7 GW according to CNESA; see the note to Table 4), representing a more than fortyfold increase in both series. Meanwhile, pumped-storage hydropower capacity rose from approximately 31.5 GW to 65.9 GW, more than doubling over the same period. The rapid expansion of these storage technologies reflects the growing importance of flexibility resources in a power system with an increasing share of variable renewable energy. This rapid growth is also reflected in the NEA’s assessment of new-type energy storage development during the 14th Five-Year Plan period, which it characterises as a transition from the initial stage of commercialisation to large-scale development [13,41].
Table 4.
Changes in selected indicators of renewable energy system integration in China, 2020–2025.
The growth in renewable energy capacity also translated into a greater contribution of renewables to the actual electricity balance, although to a lesser extent than the increase in installed capacity. The share of renewable electricity generation in national electricity consumption increased from 29.5% in 2020 to 38.5% in 2025, representing an increase of 9 percentage points.
The relationship between installed capacity and actual electricity contribution deserves closer attention, since it is where expansion and integration diverge. The gap between the share of renewables in installed capacity and their share in electricity consumption widened from 12.9 percentage points in 2020 (42.4% vs. 29.5%) to approximately 21.5 percentage points in 2025 (approximately 60% vs. 38.5%) and the ratio of the two shares declined from 0.70 to approximately 0.64 (Table 4). For wind and solar PV alone, the contrast is sharper: in 2025, they accounted for 47.3% of installed capacity but approximately 22% of electricity [11,15]. This gap should not, however, be interpreted solely as an integration deficit. At least three factors contribute to it: (i) a structural effect of the changing capacity mix, since solar PV, whose capacity factor is considerably lower than that of hydropower or wind power, accounted for the largest part of capacity growth, (ii) a timing effect, since capacity commissioned during a given year contributes only partially to that year’s generation, which is particularly relevant when annual additions are as large as in 2025 [11] and (iii) integration constraints in the strict sense, including curtailment, transmission limitations and insufficient flexibility, which are examined in Section 4.2, Section 4.3, Section 4.4 and Section 4.5. The available statistics do not allow these components to be separated quantitatively. The capacity-generation gap is therefore treated in this study as a signal requiring interpretation rather than as a direct measure of integration performance and its decomposition, for example using capacity-factor-adjusted indicators, is identified as a direction for further research.
The results therefore reveal two parallel trends: very rapid growth in renewable energy capacity—particularly solar PV and wind power—and an even faster expansion of new energy storage resources. At the same time, the increase in the share of renewables in national electricity consumption was considerably slower than the increase in their share of total installed capacity. Growth in installed capacity alone is therefore not a sufficient measure of progress in system integration. The subsequent analysis consequently examines the extent to which the expansion of renewable energy was accompanied by changes across the individual dimensions of its integration—temporal, spatial, technical and institutional-market.
4.2. Temporal Dimension: The National Scale-Up of New-Type Energy Storage
Unlike the other three dimensions, the temporal dimension is represented not by a single project but by a national-level case: the scale-up of new-type energy storage relative to the target set at the beginning of the 14th Five-Year Plan period. In July 2021, the National Development and Reform Commission and the NEA set a target of more than 30 GW of installed new-type energy storage capacity by 2025 [12,41]. By the end of 2025, installed capacity had reached 136 GW according to the NEA (144.7 GW according to CNESA), i.e., more than four times the target level [13,14]. Together with the approximate doubling of pumped-storage hydropower capacity (Table 4), this makes energy storage the fastest-growing component of the power system among all the indicators analysed.
The case also illustrates the limits of capacity-based indicators in the temporal dimension. Growth in storage capacity is an input indicator—its contribution to integration depends on how storage is operated, dispatched and remunerated. National rules adopted in 2024 and 2025 provided for the participation of energy storage, virtual power plants and aggregators in electricity and ancillary services markets [32,47,48], which constitutes an important change in enabling-system conditions. At the same time, IEA analyses point to persistent market and regulatory barriers to the full utilisation of flexibility resources, including demand-side resources, in China’s power system [17,18]. At the outcome level, the share of renewable electricity in national consumption increased by 9.0 percentage points between 2020 and 2025 (Table 4), while significant curtailment persisted in the resource-rich northwestern provinces [49,50]. The temporal dimension therefore displays the clearest divergence between the tiers of the indicator framework: a rapid scale-up of inputs, accompanied by only partial progress in enabling conditions and outcomes.
4.3. Spatial Dimension: The Case of the Gansu–Zhejiang Corridor
The Gansu–Zhejiang corridor provides an illustrative example of a new generation of infrastructure designed to support the spatial integration of renewable energy in China. Construction of the interconnection began in July 2024. The project comprises a ±800 kV VSC-UHVDC transmission line with a transmission capacity of 8 GW and a length of approximately 2370 km, connecting Wuwei in Gansu Province with Shaoxing in Zhejiang Province. Approximately 15.2 GW of generation capacity is expected to be connected to the corridor, of which around 11.2 GW will consist of newly installed renewable energy capacity. Once operational, the corridor is expected to transmit more than 36 TWh of electricity annually from Gansu to Zhejiang, with green electricity accounting for more than 50% of the transmitted energy [51,52,53].
From a technological perspective, the project reflects the ongoing evolution of HVDC systems in China from the dominance of conventional LCC-based solutions towards more diversified architectures incorporating VSC technologies. Gansu–Zhejiang is the world’s first interregional UHVDC project to employ VSC technology at both the sending and receiving ends. This solution enhances power-flow controllability and supports stable grid operation, thereby facilitating the integration of large volumes of electricity generated from variable renewable sources. This is particularly important in China, where a substantial share of wind and solar resources is located thousands of kilometres from the major demand centres in the eastern part of the country [24].
The expansion of transmission infrastructure does not, however, eliminate the barriers to the spatial integration of renewable energy. Data published in 2026 indicate that significant renewable energy curtailment continues to occur in the resource-rich northwestern provinces. Solar PV curtailment rates in Qinghai, Xinjiang and Gansu reached approximately 10–17%, while wind power curtailment rates in northern and northwestern regions were approximately 4–9%. At the same time, wind and solar PV account for approximately one-fifth of the electricity transmitted through China’s UHV lines and this share has increased only marginally since 2021 [49,50].
For context, new transmission corridors developed during the 14th Five-Year Plan period were required to ensure that at least 50% of transmitted electricity originated from renewable energy sources [54]. The two figures are however not directly comparable: the approximately one-fifth share refers to wind and solar PV across the entire existing UHV network, including corridors originally developed for coal-fired generation, whereas the 50% threshold refers to all renewable sources, including hydropower, on newly developed corridors. The comparison is therefore not used here to quantify the extent of underutilisation of UHV infrastructure. What the data do show, independently of this comparison, is that the share of wind and solar PV in UHV transmission has changed only marginally since 2021, while their installed capacity more than tripled between 2020 and 2025 (Table 4) [49,50]. This suggests that expanding physical transmission capacity alone does not guarantee the effective integration of growing renewable energy resources and that the effective utilisation of available transmission capacity, interregional coordination and the development of market-based solutions also play an important role [49,54].
Looking ahead to the next planning period, further expansion of interregional electricity transmission is expected. This direction is reflected, for example, in the plans of State Grid Corporation of China, the country’s main power grid operator, which intends to increase interprovincial and interregional electricity transmission by approximately 30% between 2026 and 2030 compared with the level recorded at the end of 2025. Planned investments are also expected to strengthen transmission links between China’s resource-rich western regions and the major electricity demand centres in the east. These developments indicate that the continued expansion of transmission infrastructure will remain an important component of the spatial integration of renewable energy in China [55].
4.4. Technical Dimension: Grid-Forming Deployments
During the period under analysis, China continued to advance the development and deployment of grid-forming (GFM) technologies, including through numerous projects integrating GFM solutions into energy storage systems. One of the most notable examples is the Baochi station in Wenshan, Yunnan Province, which was commissioned in 2025. With a total power capacity of 200 MW and an energy storage capacity of 400 MWh, the project combines lithium-ion and sodium-ion battery storage. Its sodium-ion system has been presented as the world’s first energy storage deployment of this type incorporating grid-forming technology [56,57,58].
The development of such solutions reflects broader efforts to address the stability challenges associated with the increasing share of converter-interfaced resources in power systems. Review studies indicate that GFM technologies can support system stability and provide functions that become increasingly important as system inertia declines and the share of inverter-based resources (IBRs) increases. The relevance of these challenges is also evident from the 2015 subsynchronous oscillation event in Xinjiang, discussed in Section 2.3 [31,38,39].
However, the documented scale of GFM deployments remains small relative to the size of China’s power system. Projects such as Baochi are primarily demonstrative in nature, serving to validate the technology and its system-level functions under real-world operating conditions. It should be emphasised that no comprehensive, publicly available national inventory of GFM-capable capacity in China was identified. The assessment presented here therefore relies on documented project-level deployments compiled in an international project database [58] and in project reports [56,57], as well as on the review literature [27,31]. It cannot be excluded that the actual installed GFM-capable capacity, for example in storage systems procured under provincial technical requirements, is larger than the documented projects suggest. With this caveat, the available evidence indicates that the application of GFM technologies in China’s power system remains at an early, largely demonstration-oriented stage.
4.5. Institutional and Market Dimension: Spot Markets and Green Electricity Certificates
In the institutional and market dimension, a major development during the period under analysis was the preliminary establishment of a unified national electricity market in 2025, marking further progress towards greater coordination and harmonisation across previously fragmented provincial markets. Provincial spot markets continued to expand across China, with an increasing number of provinces entering continuous settlement trial operation. Meanwhile, interprovincial and interregional electricity trading continued to develop, while the basic rules governing individual market segments were progressively standardised. In 2024, the general Basic Rules for Power Market Operation [47] were adopted, followed a year later by the Basic Rules for the Electricity Ancillary Services Market [48]. These regulations contributed to the development of a more consistent market framework and to the broader inclusion of flexibility resources, including energy storage, virtual power plants and aggregators [9,47,48].
The scale of trading indicates the continued marketisation of the sector. In 2025, the volume of electricity traded through market-based transactions reached 6.64 PWh, equivalent to 64% of total electricity consumption. Interprovincial and interregional transactions amounted to 1.59 PWh, while green electricity trading reached 328.5 TWh, an increase of 38.3% compared with the previous year [59].
At the same time, the Green Electricity Certificate (GEC) system expanded rapidly. In April 2026, the NEA issued 237 million certificates covering approximately 1.81 million renewable energy projects, of which 177 million were eligible for trading. Over the course of the same month, nationwide GEC trading volume totalled 71.1 million certificates [60]. However, the rapid expansion in certificate supply contributed to substantial oversupply and strong downward pressure on prices in late 2024 and early 2025. According to IEA-PVPS, GEC prices, which were typically around CNY 10 per certificate at the beginning of 2024 (equivalent to approximately CNY 0.01/kWh), fell to as low as CNY 0.001/kWh in early 2025. This represented an approximately tenfold decline, bringing GEC prices to a level significantly below the environmental value attributed to the certificates [36].
Market conditions did not, however, remain static. In 2025, both transaction volumes and the number of entities participating in the GEC market increased, while regulatory changes aimed at limiting the possibility of double counting environmental attributes affected the structure of supply. At the same time, some of the earlier concerns regarding the international credibility of GECs were addressed, facilitating the use of Chinese certificates by companies participating in the RE100 initiative to demonstrate progress in meeting their renewable electricity targets [37].
The findings therefore indicate that, during the period under analysis, progress in the institutional integration of renewable energy involved not only the development of mechanisms for electricity trading, but also the gradual establishment of more coherent market rules, broader market access for emerging flexibility resources and the development of a system for certifying the environmental attributes of renewable energy. At the same time, the experience of the GEC market demonstrates that rapidly expanding the scale of an instrument does not in itself guarantee an effective economic signal. The balance between supply and demand, the design of trading rules and the credibility of certificates among both domestic and international users remain important determinants of the instrument’s effectiveness.
5. Discussion
Table 5 summarises the evidence for each dimension according to the indicator framework and assessment protocol described in Section 3. The comparison of the three tiers shows that the most pronounced differences occur not only between the dimensions, but also within them, between input indicators and integration outcome indicators: in the temporal and institutional-market dimensions, inputs increased rapidly, whereas outcomes improved only partially, while in the technical dimension, both inputs and outcomes remain at an early stage.
Table 5.
Summary assessment of development trajectories across the four dimensions, 2020–2025 (with qualitative updates to September 2026).
The 2020–2026 perspective shows that the trajectories of renewable energy system integration in China differed considerably across the dimensions analysed. The most dynamic progress occurred in the expansion of the system’s physical resources—above all, new renewable generation capacity and energy storage—whereas changes in other areas proceeded more slowly or remained at an earlier stage of development. This is particularly evident in the case of new-type energy storage, as by the end of 2025 its installed capacity had reached 136 GW according to the NEA (144.7 GW according to CNESA), more than forty times the level recorded at the end of the 13th Five-Year Plan period. The NEA characterises this development as a transition from the initial stage of commercialisation to large-scale development [13,61,62]. Such rapid growth was supported by strong policy and regulatory incentives, including national energy storage development targets as well as requirements and incentives introduced at the provincial level to enhance the flexibility of new renewable energy projects.
In the temporal dimension, however, the rapid expansion of storage capacity should not be interpreted as evidence that the challenge of system flexibility has been resolved. In 2025, significant constraints on the utilisation of available wind and solar energy persisted in some regions, while analyses indicate that existing generation resources, grid infrastructure and market mechanisms did not always adapt sufficiently rapidly to the needs of a power system with an increasing share of VRE [18,50]. Energy storage development is therefore an important, but insufficient, component of enhancing system flexibility. Its contribution to system flexibility also depends on how storage facilities participate in power markets, where they are located within the power system, how they are configured and operated and how effectively they are coordinated with other flexibility resources.
A considerably more complex picture emerges in the spatial dimension. By the end of 2025, China had 45 UHV transmission lines in operation, with a combined length of approximately 52,300 km and a transmission capacity of around 300 GW. Despite the scale of these investments, wind and solar PV accounted for only approximately one-fifth of the electricity transmitted through UHV lines and this share had changed little since 2021. By comparison, during the 14th Five-Year Plan period, new transmission corridors were required to achieve a renewable energy share of at least 50% in transmitted electricity [54]. As explained in Section 4.3, the comparison is treated only as contextual information. The more robust evidence is the nearly unchanged share of wind and solar PV in UHV transmission since 2021, set against the more than threefold growth of their installed capacity between 2020 and 2025 (Table 4), which indicates that the expansion of transmission infrastructure alone does not automatically result in a proportional increase in the utilisation of growing VRE resources.
This finding suggests that barriers to the spatial integration of renewable energy do not arise solely from insufficient technical infrastructure. The utilisation of available transmission capacity, interregional coordination and the design of market mechanisms also remain important. The IEA identifies well-functioning short-term markets and interprovincial trading as important instruments for increasing system flexibility and enabling more efficient sharing of resources across regions [18,40]. An analysis by Global Energy Monitor, in turn, points out that the historical development of UHV infrastructure was partly associated with the transmission of electricity from coal-fired power plants, thereby reinforcing the role of coal in long-distance electricity flows along some corridors [50]. This phenomenon can be interpreted in terms of a risk of coal lock-in, whereby long-lived transmission infrastructure developed around coal-based generation may reinforce its role in the power system and constrain the subsequent transition towards renewable electricity. This does not mean, however, that the constraints on spatial integration are exclusively institutional in nature. Rather, it illustrates the strong interdependencies between technical, market and regulatory conditions.
In the technical dimension, the findings point to a different stage of development. The literature on grid-forming converters demonstrates a considerable degree of conceptual maturity and highlights their potential to stabilise power systems with high shares of IBRs. At the same time, documented deployments in China appear to remain predominantly at the demonstration and pilot stages, as illustrated by the Baochi project in Yunnan, although this assessment is qualified by the absence of a comprehensive national inventory of GFM-capable capacity (Section 4.4). This indicates a clear gap between the maturity of technical knowledge and the scale of practical implementation. Moreover, the literature analysed did not reveal consistent quantitative projections regarding the pace at which GFM technology could transition from demonstration projects to deployment at a scale commensurate with that of China’s power system. This issue therefore remains an important area for further research.
The institutional and market dimension also shows clear progress, although the outcomes remain uneven. The development of spot markets and the establishment of a more integrated national electricity market enhance the potential for short-term balancing and more efficient resource allocation across regions. The IEA emphasises the importance of well-designed short-term and ancillary services markets in mobilising the flexibility resources required by a power system with an increasing share of renewable energy [18]. At the same time, developments in the Green Electricity Certificate market demonstrate that the rapid expansion of a market-based instrument can also give rise to new challenges. In late 2024 and early 2025, a substantial increase in GEC supply led to oversupply and strong downward pressure on prices, potentially weakening the economic signal provided by the instrument. In the following months, however, the system continued to evolve, with further development of trading rules and growing international recognition of GECs suggesting a process of gradual market institutionalisation rather than a persistent structural weakness [36,37].
A comparison of the four dimensions therefore reveals not a uniform pace of transformation, but rather different trajectories and stages of development across the individual components of the system. In the temporal dimension, the most rapid change was observed in input indicators, notably the expansion of energy storage capacity, while progress in enabling conditions and integration outcomes was only partial. In the spatial dimension, constraints on the effective use of UHV infrastructure for wind and solar PV persisted. In the technical dimension, documented GFM deployments appeared to remain largely at the demonstration stage, whereas in the institutional and market dimension, regulatory progress and market development coexisted with challenges requiring further adjustment. As the dimensions are measured using different indicators, which are not aggregated into a composite index, the comparison should not be interpreted as a strict ranking of their respective rates of progress—the classification in Table 5 reflects the structured qualitative protocol described in Section 3. It nevertheless indicates that investment in new physical assets expanded more rapidly than the system’s capacity to fully and effectively integrate them in a coordinated manner.
The interdependencies between the dimensions, which are central to the third research question, are summarised systematically in the interdependency matrix presented in Table 6. Each cell describes how developments in the dimension in the row affect the dimension in the column, based on the evidence reviewed in Section 2 and Section 4. Three observations emerge from the matrix. First, the institutional-market dimension acts as the main link between the others: it determines how physical assets created in the temporal and spatial dimensions are actually used, for example whether storage is dispatched according to system needs and whether UHV capacity is used to transmit wind and solar electricity rather than coal-fired generation. Second, the temporal and technical dimensions are becoming increasingly coupled through energy storage, which is simultaneously the main flexibility resource and the main platform for GFM deployment, as illustrated by the Baochi project. Third, the interdependencies are asymmetric: constraints in the spatial and institutional-market dimensions can limit the returns on progress in the temporal dimension, whereas rapid progress in the temporal dimension cannot by itself compensate for these constraints. The interactions between the dimensions are therefore themselves an object requiring policy coordination, and the matrix may serve as a starting point for more formal, model-based analyses.
Table 6.
Interdependency matrix of the four dimensions (effect of the dimension in the row on the dimension in the column).
The principal conclusion emerging from the analysis is therefore that rapid growth in renewable energy capacity and supporting infrastructure does not necessarily translate into equally rapid progress in system integration. This conclusion rests on several mutually consistent pieces of evidence: the widening gap between the renewable shares in installed capacity and in electricity consumption (from 12.9 to approximately 21.5 percentage points; Table 4), the nearly unchanged share of wind and solar PV in UHV transmission despite a more than threefold increase in their installed capacity, persistent solar PV curtailment of approximately 10–17% in the resource-rich northwestern provinces and the divergence between rapid input growth and only partial progress in integration outcomes identified in Table 5. Energy storage, transmission infrastructure, technologies supporting system stability and market mechanisms are developing along different trajectories while remaining strongly interdependent. Progress in one dimension does not automatically compensate for constraints in the others. The further transformation of China’s power system will therefore depend not only on additional investment, but increasingly on the ability to coordinate existing resources across time and space, maintain system stability and develop market rules that enable their efficient utilisation.
6. Conclusions
The analysis provides answers to the three research questions formulated in this study.
First, the current state of knowledge indicates that renewable energy system integration in China encompasses four strongly interdependent dimensions that have developed as largely distinct strands of research. In the temporal dimension, particular emphasis is placed on enhancing system flexibility through energy storage, generation-source flexibility and demand response. In the spatial dimension, a key challenge remains addressing the geographical mismatch between renewable energy resources and demand centres through the development of UHV/HVDC infrastructure and improved interregional coordination. The technical dimension focuses on maintaining power system stability as the share of inverter-based resources (IBRs) increases, including through the development of grid-forming technologies. The institutional and market dimension, in turn, encompasses electricity market reform, the development of spot and ancillary services markets and mechanisms supporting renewable energy trading, including the GEC system. Taken together, the reviewed studies and analyses show that, despite the strong interdependencies among these dimensions, their interactions are relatively rarely examined within a single system-level perspective.
Second, a comparison of the 2020 baseline with data for 2025–2026 shows that the development trajectories differed across the individual dimensions, against the background of a fundamental shift in the capacity structure of China’s power system. By the end of 2025, combined wind and solar PV capacity had reached approximately 1.84 TW, accounting for 47.3% of total installed capacity, while total renewable energy capacity reached approximately 2.34 TW [8,63,64]. Particularly rapid changes were observed in new-type energy storage. By contrast, the share of wind and solar electricity transmitted through UHV infrastructure increased considerably more slowly, while documented GFM deployments—despite technological advances—appeared to remain predominantly at the demonstration stage. Meanwhile, institutional and market reforms continued to progress, including the development of spot markets, interregional electricity trading and the GEC system. The findings therefore point to clearly differentiated trajectories of change rather than the parallel development of all components of the system.
Third, a comparison of these trajectories reveals important tensions and interdependencies among the dimensions analysed. Particularly evident is the discrepancy between the rapid expansion of renewable energy capacity and storage resources, on the one hand and the slower adaptation of certain elements of transmission infrastructure, solutions supporting power system stability and market mechanisms needed for their efficient utilisation, on the other. This indicates, as summarised in the interdependency matrix (Table 6), that progress in one dimension does not automatically compensate for constraints in the others and that further renewable energy integration requires coordinated development across all four dimensions. The analysis also identifies several research gaps, particularly the lack of standardised metrics for comparing integration progress across dimensions, the limited evidence on the pace at which GFM technologies may move from demonstration projects to system-scale deployment and the need for a better understanding of the factors determining the use of UHV infrastructure for transmitting increasing volumes of wind and solar electricity.
The findings lead to the broader conclusion that rapid growth in renewable energy capacity and supporting infrastructure does not necessarily translate into equally rapid progress in their system integration. The further transformation of China’s power system will therefore depend not only on the continued expansion of generation capacity and supporting infrastructure, but increasingly on the ability to coordinate existing resources across time and space, maintain power system stability and develop market mechanisms that enable their efficient utilisation.
In terms of energy policy implications, the findings point primarily to the need to increase the utilisation of UHV infrastructure for renewable electricity transmission and to further improve interregional coordination. The findings also highlight the importance of creating conditions that support the transition of grid-forming technologies from demonstration projects to larger-scale deployment. In the institutional dimension, continued integration of the electricity market remains important, particularly through the expansion of spot markets and mechanisms enabling more efficient use of flexibility resources. This is consistent with the IEA’s emphasis on interprovincial coordination and short-term markets as key elements in enhancing the flexibility of China’s power system [40]. For the GEC market, further refinement of its operating rules could help address supply–demand imbalances and strengthen the effectiveness of the price signal provided by the instrument.
Several directions for future research should also be highlighted. Further studies could extend the present analysis by incorporating technical modelling and quantitative analysis of causal relationships, allowing for a more precise assessment of the effects of individual policy instruments and market mechanisms on the observed changes. Another important research direction is the development of standardised indicators that would enable comparisons of integration progress across the four dimensions analysed. International comparative studies could further contribute to understanding how different approaches to renewable energy integration perform under different system conditions. Finally, more in-depth research is needed to identify the factors determining the relatively low share of wind and solar electricity in UHV transmission despite the rapid expansion of both transmission infrastructure and renewable energy capacity.
Author Contributions
Conceptualization, K.Ł. (Karolina Łopacińska), K.Ł. (Karol Łopaciński) and M.L.; methodology, K.Ł. (Karolina Łopacińska), K.Ł. (Karol Łopaciński) and M.L.; investigation, K.Ł. (Karolina Łopacińska), K.Ł. (Karol Łopaciński) and M.L.; data curation, K.Ł. (Karolina Łopacińska), K.Ł. (Karol Łopaciński) and M.L.; formal analysis, K.Ł. (Karolina Łopacińska), K.Ł. (Karol Łopaciński) and M.L.; writing—original draft preparation, K.Ł. (Karolina Łopacińska), K.Ł. (Karol Łopaciński) and M.L.; writing—review and editing, K.Ł. (Karolina Łopacińska), K.Ł. (Karol Łopaciński) and M.L.. All authors have read and agreed to the published version of the manuscript.
Funding
This research received no external funding.
Data Availability Statement
The data presented in this study were derived from publicly available secondary sources, including official statistics and statistical releases, institutional databases and data releases, reports, and other materials published by the National Energy Administration of China (NEA), the China Energy Storage Alliance (CNESA), the International Energy Agency (IEA) and other sources cited in the manuscript. The relevant sources and URLs are provided in the reference list. No new primary datasets were generated as part of this study.
Conflicts of Interest
The authors declare no conflicts of interest.
Abbreviations
The following abbreviations are used in this manuscript:
| AC | alternating current |
| CNESA | China Energy Storage Alliance |
| GEC | Green Electricity Certificate |
| GFL | grid-following |
| GFM | grid-forming |
| HVDC | high-voltage direct current |
| IBRs | inverter-based resources |
| IEA | International Energy Agency |
| LCC | line-commutated converter |
| NEA | National Energy Administration |
| PMSG | permanent magnet synchronous generator |
| PV | Photovoltaic |
| SGLS | source-grid-load-storage |
| UHV | ultra-high voltage |
| UHVDC | ultra-high-voltage direct current |
| VPP | virtual power plant |
| VRE | variable renewable energy |
| VSC | voltage-source converter |
References
- State Council of the People’s Republic of China. Carbon Peaking and Carbon Neutrality: China’s Plans and Solutions. 8 November 2025. Available online: https://english.www.gov.cn/archive/whitepaper/202511/08/content_WS690ee812c6d00ca5f9a076cd.html (accessed on 14 September 2026).
- United Nations. Official Records of the General Assembly, 75th Session, 4th Plenary Meeting, 22 September 2020. Available online: https://documents.un.org/doc/undoc/gen/n20/244/56/pdf/n2024456.pdf (accessed on 14 September 2026).
- Ministry of Ecology and Environment of the People’s Republic of China. Remarks by Chinese President Xi Jinping at Climate Ambition Summit, 16 December 2020. Available online: https://english.mee.gov.cn/News_service/media_news/202012/t20201216_813364.shtml (accessed on 14 September 2026).
- National Energy Administration (NEA). Overview of National Power Industry Statistical Data for 2020, 20 January 2021. Available online: https://www.nea.gov.cn/2021-01/20/c_139683739.htm (accessed on 14 September 2026).
- National Energy Administration (NEA). The State Council Information Office Held a Press Conference on the Development of Renewable Energy in China. 30 March 2021. Available online: https://nfj.nea.gov.cn/xwzx/gjnyjdt/202308/t20230823_23450.html (accessed on 14 September 2026).
- The State Council of the People’s Republic of China. Country’s Green Drive Hits Major Milestone. 1 November 2024. Available online: https://english.www.gov.cn/news/202411/01/content_WS672444e5c6d0868f4e8ec833.html (accessed on 14 September 2026).
- National Energy Administration (NEA). The National Energy Administration Released the 2024 National Power Industry Statistics, 21 January 2025. Available online: https://www.nea.gov.cn/20250121/097bfd7c1cd3498897639857d86d5dac/c.html (accessed on 14 September 2026).
- National Energy Administration (NEA). The National Energy Administration Released the 2025 National Electricity Statistics, 29 January 2026. Available online: https://www.nea.gov.cn/20260129/6874f211acd0417eab7ac10c3061a7c2/c.html (accessed on 14 September 2026).
- National Energy Administration (NEA). The 2025 China Power Market Development Report Has Been Released—A Nationwide Unified Electricity Market System Has Been Preliminarily Established, 18 June 2026. Available online: https://www.nea.gov.cn/20260618/41e848b9ec6543998757db3864e01ab2/c.html (accessed on 14 September 2026).
- National Energy Administration (NEA). China’s Wind and Solar Installed Capacity Has Historically Surpassed Thermal Power: Wind and Photovoltaic Installations Surpassing Thermal Power Will Become the Norm. 25 April 2025. Available online: https://www.nea.gov.cn/20250425/148efd0ca61148148d285edd438912df/c.html (accessed on 14 September 2026).
- National Energy Administration (NEA). 2025, China’s Newly Installed Wind and Solar Power Capacity Exceeded 430 Million Kilowatts, Setting a New Historical Record, 12 February 2026. Available online: https://www.nea.gov.cn/20260212/d9f714e91a7f40d39282d87e384ea94a/c.html (accessed on 14 September 2026).
- National Energy Administration (NEA). Two Departments Issue Documents to Promote the Development of New Energy Storage, Aiming for an Installed Capacity of over 30 Million Kilowatts by 2025. 30 July 2021. Available online: https://hunb.nea.gov.cn/dtyw/ywdd/202309/t20230913_65191.html (accessed on 14 September 2026).
- National Energy Administration (NEA). The National Energy Administration Held a Press Conference to Introduce the Development of New Energy Storage in 2025, 30 January 2026. Available online: https://www.nea.gov.cn/20260130/50f657ce87f848e1a9a1861d1fd9aa23/c.html (accessed on 14 September 2026).
- China Energy Storage Alliance (CNESA). An Additional 66.43 GW/189.48 GWh Added! CNESA DataLink 2025 Annual Energy Storage Data Release. 23 January 2026. Available online: https://en.cnesa.org/latest-news/2026/1/23/an-additional-6643gw18948gwh-added-cnesa-datalink-2025-annual-energy-storage-data-release (accessed on 14 September 2026).
- National Energy Administration (NEA). The 2025 Renewable Energy Grid Integration Operation, 12 February 2026. Available online: https://www.nea.gov.cn/20260212/742b8c6a078347b0b39de676c05c5d58/c.html (accessed on 14 September 2026).
- International Energy Agency (IEA). Renewables 2025: Analysis and Forecasts to 2030, France, 2025. Available online: https://www.iea.org/reports/renewables-2025 (accessed on 14 September 2026).
- International Energy Agency (IEA). Integrating Distributed Energy Resources in China: Lessons from International Experience, France, 2025. Available online: https://www.iea.org/reports/integrating-distributed-energy-resources-in-china (accessed on 14 September 2026).
- International Energy Agency (IEA). Meeting Power System Flexibility Needs in China by 2030: A Market-Based Policy Toolkit for the 15th Five-Year Plan, France, 2024. Available online: https://www.iea.org/reports/meeting-power-system-flexibility-needs-in-china-by-2030 (accessed on 14 September 2026).
- Pishbahar, H.; Blaabjerg, F.; Saboori, H. Emerging grid-forming power converters for renewable energy and storage resources integration—A review. Sustain. Energy Technol. Assess. 2023, 60, 103538. [Google Scholar] [CrossRef] [Scilit]
- Mirza, Z.; Jain, H. From challenges to solutions: Review and analysis of grid-supportive technologies in sustainable power systems. Appl. Energy 2026, 403, 127111. [Google Scholar] [CrossRef] [Scilit]
- Li, J.; Ho, M.S.; Xie, C.; Stern, N. China’s flexibility challenge in achieving carbon neutrality by 2060. Renew. Sustain. Energy Rev. 2022, 158, 112112. [Google Scholar] [CrossRef] [Scilit]
- Li, Y.; You, K.; Song, A.; Li, Y.; Feng, W.; Yan, J. Coordinated source-grid-load-storage planning for power system flexibility: A case study in China. Appl. Energy 2026, 417, 128032. [Google Scholar] [CrossRef] [Scilit]
- Li, M.; Han, C.; Meng, L.; Liu, P. Spatiotemporal dynamics and factors of renewable energy mismatch in China. Renew. Sustain. Energy Rev. 2025, 212, 115424. [Google Scholar] [CrossRef] [Scilit]
- Wei, X.; Jiang, T. China’s HVDC development for large-scale renewable integration: A system-level technology roadmap. Int. J. Electr. Power Energy Syst. 2026, 178, 111932. [Google Scholar] [CrossRef] [Scilit]
- ChinaNews. Conductor Stringing Completed on Gansu Lot 4 of the Gansu-Zhejiang ±800 kV UHVDC Transmission Project, 24 August 2026. Available online: https://news.cri.cn/20260824/bc430554-b6e6-49c3-84c9-6da9ffbaae8a.html (accessed on 14 September 2026).
- Zeng, L.; Du, W.; Hong, W. An inter-provincial renewable electricity trading model under renewable portfolio standards policy. Energy 2025, 319, 135005. [Google Scholar] [CrossRef] [Scilit]
- Khan, M.; Wu, W.; Li, L. Grid-forming control for inverter-based resources in power systems: A review on its operation, system stability and prospective. IET Renew. Power Gener. 2024, 18, 887–907. [Google Scholar] [CrossRef] [Scilit]
- Xu, Y.; Cao, Y. Sub-synchronous oscillation in PMSGs based wind farms caused by amplification effect of GSC controller and PLL to harmonics. IET Renew. Power Gener. 2018, 12, 844–850. [Google Scholar] [CrossRef] [Scilit]
- Liu, H.; Xie, X.; He, J.; Xu, T.; Yu, Z.; Wang, C.; Zhang, C. Subsynchronous interaction between direct-drive PMSG based wind farms and weak AC networks. IEEE Trans. Power Syst. 2017, 32, 4708–4720. [Google Scholar] [CrossRef] [Scilit]
- Liu, W.; Xie, X. Mechanism and characteristic analyses of subsynchronous oscillations caused by the interactions between direct-drive wind turbines and weak AC power systems. J. Eng. 2017, 2017, 1651–1656. [Google Scholar] [CrossRef] [Scilit]
- Qaisar, M.W.; Fang, J. Grid-Forming Converters for Renewable Generation: A Comprehensive Review. Energies 2025, 18, 4565. [Google Scholar] [CrossRef] [Scilit]
- National Development and Reform Commission. Relevant Officials from the National Energy Administration Answered Reporters’ Questions on the “Notice on Issuing the Basic Rules for the Power Ancillary Services Market”. 29 April 2025. Available online: https://www.ndrc.gov.cn/xxgk/jd/jd/202504/t20250428_1397458.html (accessed on 14 September 2026).
- National Energy Administration (NEA). Notice from the National Development and Reform Commission, Ministry of Finance and National Energy Administration on Ensuring Full Coverage of Renewable Energy Green Power Certificates and Promoting Renewable Energy Power Consumption, Development and Reform Energy [2023] No. 1044. 25 July 2023. Available online: https://zfxxgk.nea.gov.cn/2023-07/25/c_1310735434.htm (accessed on 14 September 2026).
- National Energy Administration (NEA). Relevant Officials from the National Energy Administration Answered Reporters’ Questions on the “Rules for the Issuance and Trading of Renewable Energy Green Power Certificates”. 5 September 2024. Available online: https://www.nea.gov.cn/2024-09/05/c_1310785828.htm (accessed on 14 September 2026).
- International Tracking Standard Foundation (I-TRACK Foundation). China Introduces New EAC Policy. 13 September 2024. Available online: https://www.trackingstandard.org/china-introduces-new-eac-policy/ (accessed on 14 September 2026).
- The International Energy Agency Photovoltaic Power Systems Programme (IEA PVPS). National Survey Report of PV Power Applications in China 2024; IEA PVPS Task 1: Strategic PV Analysis and Outreach, 2025. Available online: https://www.iea-pvps.org/wp-content/uploads/2025/10/IEA-PVPS-Task-1-NSR-China-2024.pdf (accessed on 14 September 2026).
- Climate Group. China’s Energy Market ‘Open for Business’ after Support from RE100 on Certificates. 6 May 2025. Available online: https://www.theclimategroup.org/our-work/press/re100/chinas-energy-market-open-business-after-support-re100-certificates (accessed on 14 September 2026).
- Yuan, L.; Meng, K.; Huang, J.; Dong, Z.Y. Investigating subsynchronous oscillations caused by interactions between PMSG-based wind farms and weak AC systems. Int. J. Electr. Power Energy Syst. 2020, 115, 105477. [Google Scholar] [CrossRef] [Scilit]
- Wang, L.; Xie, X.; Liu, H.; Zhan, Y.; He, J.; Wang, C. Review of emerging SSR/SSO issues and their classifications. J. Eng. 2017, 2017, 1666–1670. [Google Scholar] [CrossRef] [Scilit]
- International Energy Agency (IEA). Building a Unified National Power Market System in China: Pathways for Spot Power Markets, France, 2023. Available online: https://www.iea.org/reports/building-a-unified-national-power-market-system-in-china (accessed on 14 September 2026).
- National Energy Administration (NEA). Guiding Opinions of the National Development and Reform Commission and the National Energy Administration on Accelerating the Development of New Energy Storage (NDRC Energy Regulation [2021] No. 1051). 15 July 2021. Available online: https://zfxxgk.nea.gov.cn/2021-07/15/c_1310079331.htm (accessed on 14 September 2026).
- National Energy Administration (NEA). China’s Cumulative Wind and Photovoltaic Installed Capacity Exceeded 1.8 Billion Kilowatts for the First Time, 30 January 2026. Available online: https://www.nea.gov.cn/20260130/503483f133e44016a66ddd6fad8ab695/c.html (accessed on 14 September 2026).
- National Energy Administration (NEA). The National Energy Administration Organized a Nationwide Video Conference on Renewable Energy Power Development and Construction (January). 12 February 2026; Available online: https://www.nea.gov.cn/20260212/7778cf9907bf4eabb0e73a939ff2ade2/c.html (accessed on 14 September 2026).
- China Energy Storage Alliance (CNESA). Industry News. Authoritative Interpretation | Four Highlights of the “Guiding Opinions” Anchor the Energy Storage Development Goals for the 14th Five-Year Plan. 24 April 2021. Available online: https://www.cnesa.org/information/detail/?column_id=6&id=368 (accessed on 14 September 2026).
- National Energy Administration (NEA). Response to Proposal No. 5963 of the Fourth Session of the 13th National People’s Congress, 12 July 2021. Available online: https://zfxxgk.nea.gov.cn/2021-07/12/c_1310197479.htm (accessed on 14 September 2026).
- National Energy Administration (NEA). Clean and Low-Carbon, Transforming the Energy Structure Accordingly. 9 April 2021. Available online: https://www.nea.gov.cn/2021-04/09/c_139869431.htm (accessed on 14 September 2026).
- National Development and Reform Commission. Basic Rules for the Operation of the Electricity Market, Order No. 20, 2024. Available online: https://zfxxgk.ndrc.gov.cn/web/iteminfo.jsp?id=20379 (accessed on 14 September 2026).
- National Development and Reform Commission; National Energy Administration. “Basic Principles Governing the Electricity Ancillary Services Market” in the Context of Power Plant Development. 3 April 2025. Available online: https://zfxxgk.ndrc.gov.cn/wap/iteminfo.jsp?id=20504 (accessed on 14 September 2026).
- Global Energy Monitor. China’s Clean Energy Boom Faces a Coal Test in New Five-Year Plan, July 2026. Available online: https://globalenergymonitor.org/article/chinas-clean-energy-boom-faces-coal-test-new-five-year-plan (accessed on 14 September 2026).
- Yu, A.; Huang, Y.; Shearer, C. Done Right, China’s UHV Grid Can Help Phase Out Coal Rather than Lock It In. Dialogue Earth. 25 March 2026. Available online: https://dialogue.earth/en/energy/done-right-chinas-uhv-grid-can-help-phase-out-coal-rather-than-lock-it-in/ (accessed on 14 September 2026).
- Yang, R.; Gong, N. China Energy Engineering Corporation Limited; The World’s First Flexible UHVDC Project-Gansu-Zhejiang ±800 kV UHVDC Project—Has Started Construction. 31 July 2024. Available online: https://www.ceec.net.cn/art/2024/7/31/art_11019_2532365.html (accessed on 14 September 2026).
- Ministry of Ecology and Environment of the People’s Republic of China. Approval of the Environmental Impact Report for the Gansu-Zhejiang ±800 kV UHVDC Transmission Project. 28 February 2025. Available online: https://www.mee.gov.cn/xxgk2018/xxgk/xxgk11/202503/t20250303_1103203.html (accessed on 14 September 2026).
- People’s Daily Overseas Edition. Construction Began on the ±800 kV Ultra-High Voltage DC Transmission Project from Gansu to Zhejiang. 31 July 2024. Available online: https://paper.people.com.cn/rmrbhwb/html/2024-07/31/content_26072106.htm (accessed on 14 September 2026).
- China Energy Portal. Tracking China’s Transition to Sustainable Energy. 14th Five-Year Plan for Renewable Energy Development. 1 June 2022. Available online: https://chinaenergyportal.org/en/14th-five-year-plan-for-renewable-energy-development/ (accessed on 14 September 2026).
- Reuters. China’s Power Grid Investments to Surge to Record $574 Billion in 2026–2030. 15 January 2026. Available online: https://www.reuters.com/sustainability/boards-policy-regulation/chinas-power-grid-investments-surge-record-574-billion-2026-2030-2026-01-15/ (accessed on 14 September 2026).
- Shaw, V. China Launches World’s First Grid-Forming Sodium-Ion Battery Storage Plant. pv magazine India. 4 June 2025. Available online: https://www.pv-magazine-india.com/2025/06/04/china-launches-worlds-first-grid-forming-sodium-ion-battery-storage-plant/ (accessed on 14 September 2026).
- National Center for Science and Technology Innovation. China’s First Large-Scale Lithium-Sodium Hybrid Energy Storage Station Has Been Put into Operation. 26 May 2025. Available online: https://www.ncsti.gov.cn/kjdt/kjrd/qtrd_kjrd/202505/t20250526_205837.html (accessed on 14 September 2026).
- Energy Systems Integration Group. Install. Plan. GFM Projects. 2026. Available online: https://www.esig.energy/working-groups/reliability/grid-forming-landscape/installed-and-planned-gfm-projects/ (accessed on 14 September 2026).
- National Energy Administration (NEA). Transcript of the National Energy Administration Press Conference. 30 January 2026; Available online: https://www.nea.gov.cn/20260130/b5b729cb7ad74723bcd614b663c75da6/c.html (accessed on 14 September 2026).
- National Energy Administration (NEA). The National Energy Administration Released the Nationwide Data on the Issuance and Trading of Renewable Energy Green Power Certificates for April 2026, 2 June 2026. Available online: https://www.nea.gov.cn/20260602/a7e494c0ee274b839b9febc63b74d861/c.html (accessed on 14 September 2026).
- State Council of the People’s Republic of China. New Energy Storage to See Large-Scale Development by 2025. 2 March 2022. Available online: https://english.www.gov.cn/statecouncil/ministries/202203/02/content_WS621ec4bbc6d09c94e48a5bab.html (accessed on 14 September 2026).
- National Energy Administration (NEA). Policy Interpretation of the “Quality Supervision Outline for New Energy Storage Power Station Construction Projects”. 14 May 2026. Available online: https://www.nea.gov.cn/20260514/909214e27a08460faa0e1e674e8f41cf/c.html (accessed on 14 September 2026).
- Shaw, V. China Adds 315 GW of Solar in 2025. pv magazine Global. 28 January 2026. Available online: https://www.pv-magazine.com/2026/01/28/china-adds-315-gw-of-solar-in-2025/ (accessed on 14 September 2026).
- State Council of the People’s Republic of China. Renewables Meet All Growth in China’s Electricity Demand in 2025: Report, 12 June 2026. Available online: https://english.www.gov.cn/news/202606/12/content_WS6a2c2227c6d00ca5f9a0b8f2.html (accessed on 14 September 2026).
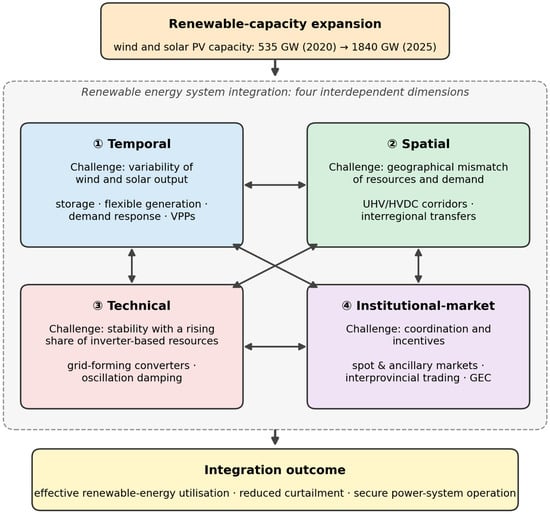
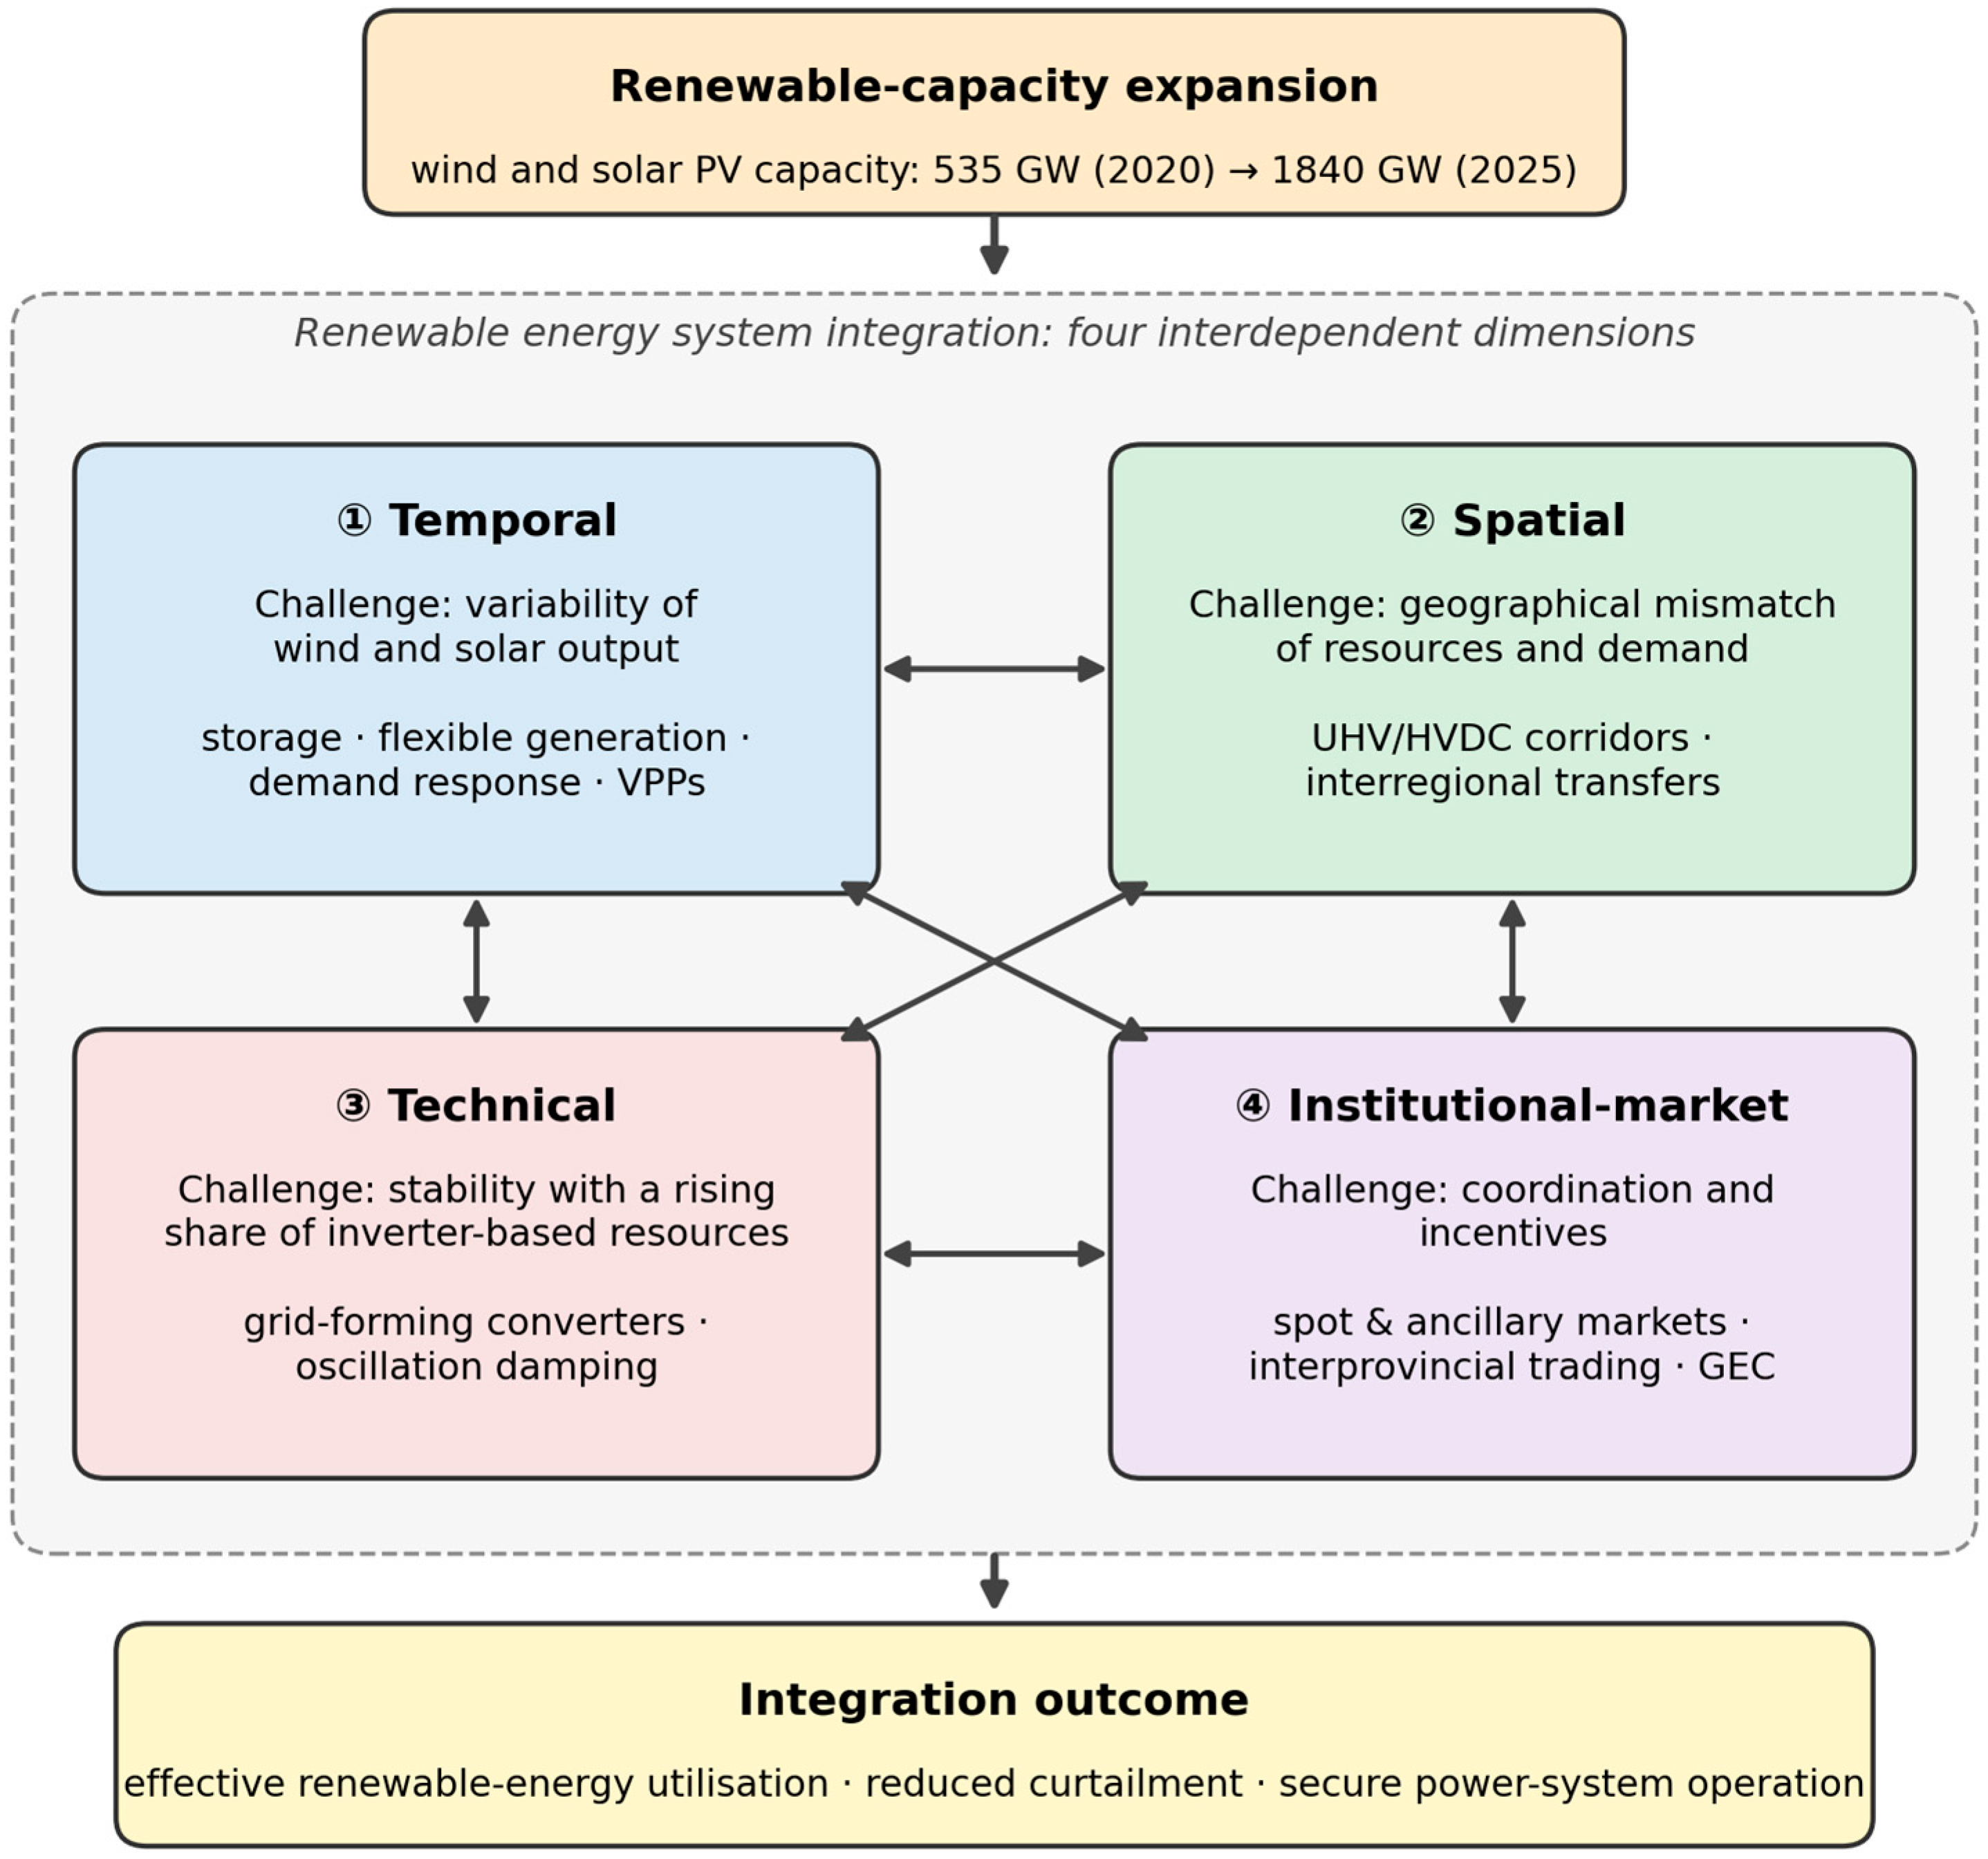

Disclaimer/Publisher’s Note: The statements, opinions and data contained in all publications are solely those of the individual author(s) and contributor(s) and not of MDPI and/or the editor(s). MDPI and/or the editor(s) disclaim responsibility for any injury to people or property resulting from any ideas, methods, instructions or products referred to in the content. |
© 2026 by the authors. Licensee MDPI, Basel, Switzerland. This article is an open access article distributed under the terms and conditions of the Creative Commons Attribution (CC BY) license.