


Abstract
High-power linear alternators (HPLAs) are key energy conversion components in free-piston Stirling generators (FPSGs), yet their output performance strongly depends on the coupled matching among the gas pressure wave, piston dynamics, and external electrical load. In this work, the electrical load-matching characteristics and loss mechanisms of a gas-coupled HPLA were investigated experimentally and numerically. A thermodynamic–dynamic–electromagnetic coupling model, validated against gas-coupled dynamic experiments, is established to account for the position-dependent electromagnetic parameters and the coupled gas mechanical–electrical interaction. The results show that load resistance mainly governs the current level and the loss composition, whereas series capacitance shifts the electrical phase and modifies the effective electromagnetic stiffness and damping acting on the piston. Consequently, the maximum power condition does not coincide with complete electrical resonance: allowing the capacitance to deviate from resonance raises the maximum output power from 13.54 kW to 14.58 kW, a gain of about 7.7%. Moreover, as the load resistance increases, the dominant loss migrates from current-dependent electromagnetic loss to mechanical damping loss, so that the maximum power point and the maximum efficiency point are clearly separated. These findings establish a coupled load-matching framework for selecting the operating point and external load according to design priority, rather than by electrical resonance alone.
1. Introduction
The free-piston Stirling generator (FPSG) features external combustion heating, high conversion efficiency, a compact structure, and the absence of a crank mechanism [1,2,3], making it a promising long-life energy conversion device [4]. These advantages enable FPSGs to be employed in advanced space power systems [5], distributed generation [6], and other applications requiring reliability and maintenance-free operation [7]. Inside an FPSG, thermal energy is converted into pressure wave power through an oscillating gas working medium, and the reciprocating motion of the piston is then transformed into electrical energy by a linear alternator [8,9]. The linear alternator is, therefore, not a passive terminal component but a core unit that directly influences the dynamic force balance and the power transmission path of the whole system [10].
Unlike conventional rotary generators, the high-power linear alternator (HPLA) in FPSGs operates under a strongly coupled gas mechanical–electrical condition [11,12]. The pressure wave produced by the thermodynamic cycle drives the power piston, while the electromagnetic reaction force induced by the external load acts back on the piston. As a result, a change in the electrical load not only affects the output current and the port power but also alters the piston stroke, the absorbed acoustic power, and the acoustic impedance on the gas side [13,14]. For large-power configurations, this coupling effect is particularly prominent, where large stroke, large current, and substantial electromagnetic losses occur simultaneously.
To address these coupling characteristics, existing research has extensively investigated the design, optimization, and dynamic characteristics of both FPSGs and linear alternators [15,16,17]. Formosa [18] proposed a coupled thermodynamic–dynamic semi-analytical model with an iterative solution strategy, providing an effective method for system-level performance prediction. However, most linear alternator models still simplify the transduction coefficient and the magnetic stiffness as constants [19]. For instance, Lewandowski and Metscher [20] assumed a constant BL in their performance simulation tool, and many load-matching analyses idealize the load as purely resistive or assume complete electrical resonance [21,22]. For gas-coupled HPLAs, such simplifications are no longer adequate [23] because the excitation originates from a finite-amplitude pressure wave generated by the engine rather than from a prescribed piston velocity and because a change in the electrical load simultaneously modifies the equivalent damping and stiffness perceived on the gas side. Jia et al. [24] further pointed out that the Stirling engine and the linear alternator are usually modeled separately, making it difficult to capture their acoustic impedance coupling. Dai et al. [25], in their study on impedance matching for a Stirling-type low-temperature cryocooler, also indicated that the acoustic-to-electrical conversion efficiency depends on the impedance matching state rather than simply the optimal electrical parameters.
Closely related to impedance matching is a second unresolved issue: how the dominant loss mechanism transitions under different operating and load conditions. Kankam et al. [21] developed a system model coupled to an electrical load and examined the stability under parameter variation and abrupt operating condition changes through state-space and frequency domain analyses, while Benvenuto et al. [22] analyzed the operational characteristics under resistive, inductive, and capacitive loads using thermodynamic and electrodynamic models. However, these steady-state analyses do not consider the redistribution of the loss composition as the load varies. Regarding control strategies, Ulusoy et al. [26] used nonlinear analysis to reveal the potential of an externally connected load for controlling piston stroke, while Kirby et al. [27] designed a closed-loop control system for a 5 kW-class FPSG. These control studies primarily focus on stroke regulation rather than loss mechanism analysis. Physically, at low load resistance, the loop current is large and additional electromagnetic losses, such as coil-end proximity effects, eddy current losses in the permanent magnets and iron cores, and end-region leakage losses, become dominant; at high load resistance or weak excitation, mechanical damping and gas-related losses become the main contributors [28,29]. Sun et al. [30] reported a similar effect for a 15 W-class FPSG, where increasing the damping coefficient markedly reduced the electric power and the system efficiency. Clarifying the switching rules of the dominant loss mechanisms is, therefore, crucial for selecting practical operating loads because the load conditions that maximize output power are not necessarily the same as those that maximize efficiency or thermal margin.
However, for gas-coupled HPLAs, the boundaries of the loss mechanism transition under changing load conditions, and their influence on the selection of the optimal load, remain unclear. Previous studies have generally examined particular electrical load types, electrical resonance, system stability, or piston stroke control as separate topics, but they have not systematically clarified how load resistance and series capacitance, acting independently and jointly, modify the performance and loss distribution of a gas-coupled high-power linear alternator. In this work, an experimental and numerical approach is adopted to investigate the electrical load-matching characteristics and loss mechanisms of a gas-coupled HPLA. A multi-domain thermodynamic–dynamic–electromagnetic model is established, including the front and back chambers, leakage through an annular sealing clearance, piston dynamics, position-dependent electromagnetic parameters, amplitude-dependent mechanical damping, and an external R-C load. The model is validated against dynamic experiments under different pressure wave amplitudes and load resistances. Based on the validated model, the effects of mean pressure, driving frequency, pressure wave amplitude, load resistance, and series capacitance are analyzed, and an R-C-coupled matching map is constructed to determine the operating conditions corresponding to maximum power and highest efficiency.
2. Model Description
2.1. Modeling Scope and Assumptions
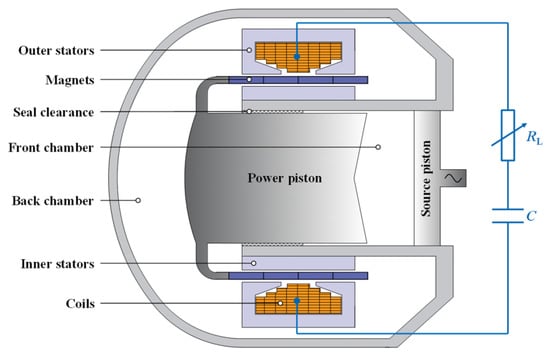
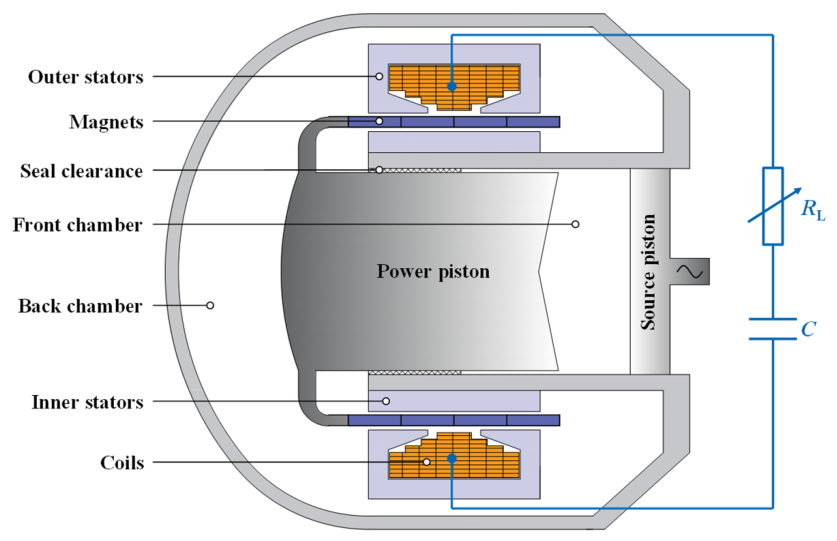
A multi-domain thermodynamic–dynamic–electromagnetic coupling model was developed to investigate the electrical load matching behavior of the HPLA. As illustrated in Figure 1, the modeled system consists of a front chamber, a back chamber, an annular seal clearance connecting the two chambers, a power piston coupled with the linear alternator, an external excitation source piston, and an external electrical load network consisting of a resistive load and a series tuning capacitor. The excitation source piston generates an oscillatory pressure wave in the front chamber, which drives the power piston to reciprocate. Meanwhile, the back chamber provides a gas spring restoring force, and the reciprocating motion of the piston induces an electromotive force in the alternator winding. The resulting electromagnetic reaction force acts on the piston and modifies the coupled gas mechanical dynamics, while the electrical load network regulates the electromechanical interaction and determines the energy conversion characteristics of the HPLA.
Figure 1.
Schematic diagram of the modeled HPLA system.
Notably, the series R-C network is used as a controllable equivalent load to separate active power extraction from reactive compensation. The resistance represents the dissipative or equivalent useful load, whereas the series capacitor compensates the winding inductance and adjusts the electrical impedance phase. This simplified network is not intended to reproduce the nonlinear switching behavior of a specific power electronic converter. The present model does not aim to reproduce the complete thermodynamic cycle of an FPSG. Instead, it focuses on the alternator-side gas domain and the electromechanical energy conversion process under a prescribed pressure wave excitation. Helium is selected as the working gas because it is commonly used in FPSGs and is also consistent with the experimental system. The following assumptions are adopted: (1) Helium is treated as an ideal gas; (2) pressure oscillations are harmonic small perturbations around the mean pressure; (3) the pressure in each chamber is spatially uniform; (4) compression and expansion in the chambers are approximately adiabatic; and (5) the piston motion is assumed to be one-dimensional harmonic oscillation around the equilibrium position.
For a harmonic variable a(t), the complex amplitude notation is used:
where is the complex phasor, ω = 2πf is the angular frequency, and f is the operating frequency.
2.2. Gas Domain Model from Conservation Equations
For each gas chamber, the mass conservation equation is expressed as:
where ρi and Vi denote the helium density and chamber volume, respectively, and represents the mass flow rate.
The energy conservation equation is
where mi is the gas mass, cv is the specific heat at constant volume, Ti is the gas temperature, pi is the chamber pressure, h is the specific enthalpy, and is the heat transfer rate.
Considering the high operating frequency and limited heat exchange during one oscillation cycle, the chamber process is assumed to be approximately adiabatic:
Combining the ideal gas equation and adiabatic relationship yields:
where p0 is the mean pressure and γ is the specific heat ratio of helium. Therefore, each chamber can be represented by an acoustic compliance:
where Ci describes the pressure change caused by a net volume flow imbalance.
For the front chamber, the volume flow balance is expressed as:
For the back chamber:
where pf and pb are the front and back chamber pressures, Qs is the volume flow generated by the source piston, Qg represents leakage flow through the annular clearance, is the effective area of the power piston, Dp denotes the piston diameter, and x represents the piston displacement.
The leakage flow through the annular seal clearance is described using oscillatory momentum conservation:
where Rg and Lg represent the viscous resistance and inertance of the clearance, respectively. For an annular gap with diameter Dg, radial clearance hg, and length lg, Rg and Lg can be calculated as:
where μ is the dynamic viscosity of helium. In the frequency domain, the leakage equation becomes:
where Yg is the complex leakage admittance of the annular seal clearance, defined as the ratio of the leakage volume flow phasor to the pressure difference phasor, and it can be expressed as:
2.3. Power Piston, Electromagnetic, and Load Coupling
The mechanical motion of the HPLA piston is governed by Newton’s second law:
where M is the moving mass, Cm represents the mechanical damping coefficient, and Km denotes the magnetic spring stiffness. Additionally, Fem represents the electromagnetic reaction force, which can be expressed using the transduction coefficient BL:
In conventional linearized models, the transduction coefficient BL and magnetic stiffness Km are usually considered constant. However, this assumption becomes inaccurate for HPLAs because the power piston experiences significant magnetic field variation during large-stroke operation. Therefore, static electromagnetic measurements were conducted to characterize the position-dependent BL and Km. The fitted expressions are given as follows:
BL(x) = 72.9 + 0.174x − 0.0543x2 − 0.00828x3
Km(x) = 84.8 − 2.08x + 0.578x2 − 0.0111x3
Since the dynamic model is solved in the frequency domain, directly introducing these nonlinear relationships into the frequency domain model would require a nonlinear transient solution, which substantially increases computational cost. Therefore, a harmonic equivalent approach is adopted. For sinusoidal piston motion x = X sin θ, where θ is the harmonic phase variable in radians, the nonlinear electromagnetic parameters are transformed into equivalent first-harmonic values through harmonic projection. The equivalent transduction coefficient is calculated as:
where X represents the displacement amplitude. Similarly, the first-harmonic equivalent magnetic stiffness is calculated as:
Over one complete centered cycle, the odd power terms in the static polynomial relations make no contribution to the retained first-harmonic coefficients. The different factors in Equations (18) and (19) arise from the projection weights: the velocity-weighted term BL(x)v gives a factor of 1/4, whereas the displacement-weighted term Km(x)x gives a factor of 3/4. In the fitted expressions, x is expressed in millimeters and Km is obtained in N/mm; the resulting stiffness is converted to N/m before substitution into the dynamic equations. The static measurements underlying Equations (16) and (17) cover −15 mm ≤ x ≤ 15 mm. Because θ spans a complete oscillation cycle, the instantaneous displacement x = X sinθ varies between −X and X. Consequently, the harmonic equivalents are based entirely on the measured displacement range when X ≤ 15 mm. For the higher-amplitude cases considered in this study, with 15 mm < X ≤ 25 mm, the portions of the cycle for which |x| > 15 mm rely on extrapolation of the fitted relations. Predictions in this extended range are, therefore, used to explore operating trends and should be interpreted with greater caution; they do not constitute experimental validation of the electromagnetic characteristics beyond the measured range.
Additionally, the mechanical damping coefficient Cm was treated as stroke amplitude-dependent to account for the transition of the gas-bearing and friction states. At low pressure wave amplitudes, the piston stroke is small, and the gas film may not be fully established, so mixed or dry friction can occur and introduce additional damping. As the stroke amplitude increases, the gas-bearing effect becomes more stable, and the additional friction-related damping gradually decreases. In the present model, this behavior is described as:
where C0 is the equivalent damping under sufficiently developed gas film support, ΔC is the additional damping associated with small-stroke mixed/dry friction, and Xc is the characteristic displacement amplitude for the transition. The experimental displacement-dependent response was used to identify the transition region, and the coupled-model prediction gave Xc = 2.71 mm.
The physical meaning of the coefficients follows from the two limiting states of Equation (20). At X = 0, Cm = C0 + ΔC, representing the additional damping before stable gas film support is established. When X is much larger than Xc, the exponential term approaches zero and Cm approaches C0, corresponding to the developed gas film state. The values used here are C0 = 197.2 N·s/m, ΔC = 454.1 N·s/m, and Xc = 2.71 mm. Equation (20), therefore, describes the change in equivalent damping between steady operating amplitudes rather than an instantaneous damping waveform within one oscillation cycle.
The external circuit consists of a load resistance and a series capacitance. In addition to the external load, the winding resistance, winding inductance, and additional electromagnetic losses should also be included in the electrical domain. These additional losses include coil-end proximity effects, eddy current losses in permanent magnets, hysteresis and eddy current losses in the stator core, and end leakage flux losses. Because these losses are difficult to separate experimentally under gas-coupled dynamic operation, they are lumped into an equivalent electromagnetic loss resistance RE. In the present model, RE is represented by a physically motivated equivalent resistance and calibrated through model validation. It is expressed as:
where I denotes the current amplitude, and kf and kI are the frequency-dependent and current-dependent electromagnetic loss coefficients, respectively. Since RE depends on the current amplitude, it is updated iteratively during the coupled model solution. These equivalent loss coefficients are difficult to measure independently during gas-coupled operation. Their functional forms were selected from the expected frequency and current dependence, and the adopted values were determined using component measurements, engineering estimates, and consistency with the measured multiresponse data over the validation conditions. The values used in the model are kf = 1.6817 × 10⁻¹⁹ Ω/Hz2 and kI = 3.1755 × 10⁻⁵ Ω/A2. The same parameter set is used for all operating conditions examined in this study.
RE = kff2 + kII2
Therefore, the total electrical impedance can be written as:
where RL is the external load resistance, RC is the coil resistance, RE is the equivalent resistance representing additional electromagnetic losses, L is the coil inductance, and C is the series capacitance.
The piston motion induces a back electromotive force in the winding. Therefore, the current phasor is determined by the induced voltage and the total electrical impedance:
where is the piston velocity phasor. The corresponding electromagnetic reaction force is:
Thus, the electromagnetic reaction can be represented as an equivalent complex stiffness:
This expression shows that the external electrical load affects the piston not only by changing the current amplitude but also by modifying the equivalent electromagnetic damping and stiffness. The resistive part of the electrical impedance mainly determines the irreversible electrical energy extraction and loss, whereas the reactive part introduced by the coil inductance and series capacitance changes the phase relationship between induced voltage, current, and piston velocity. Consequently, both the load resistance and the series capacitance can directly influence piston motion, acoustic power absorption, and electric power output.
2.4. Coupled Frequency Domain Equations and Solution Procedure
After applying harmonic transformation to the chamber conservation equations, leakage momentum equation, piston dynamics, and electromagnetic equations, the coupled system can be written as follows.
In this reduction, the chamber energy balance and ideal gas relation are first combined into the acoustic compliance equations. The leakage flow and current phasors are then eliminated using g = Yg(f − b) and Î = BL(jω)/Ze, respectively. The remaining unknowns are, therefore, the piston displacement phasor and the two chamber pressure phasors f and b.
where the unknowns are the piston displacement , front-chamber pressure , and back-chamber pressure . The complex dynamic stiffness of the moving assembly is:
Since BL(X), Km(X), Cm(X), and RE depend on the piston stroke or current amplitude, the coupled equations are solved iteratively. For each operating condition, the calculation starts with initial estimates of piston displacement and current. The electromagnetic parameters, mechanical damping, equivalent loss resistance, and electrical impedance are then updated, and the coupled matrix is solved repeatedly until the piston displacement and current converge. The converged solution is subsequently used to calculate the power flow, loss components, efficiency, and load-matching characteristics. During model validation, the measured front-chamber pressure amplitude and phase are used as the pressure wave boundary. Numerically, the coupled matrix is first solved with a unit source flow. The obtained solution is then scaled so that the calculated front-chamber pressure phasor equals the measured one. After this scaling, the model predicts the piston displacement, back-chamber pressure, output current, input acoustic power, output electric power, and acoustic-to-electrical efficiency under the same boundary condition as the experiment.
The acoustic power absorbed by the HPLA is calculated from the pressure difference across the piston and the volumetric flow rate:
For the subsequent load-matching analysis, the acoustic impedance seen by the power piston is introduced as:
The magnitude of Za represents the resistance of the gas domain and electromechanical system to piston-induced volume flow, while its phase angle describes the relationship between the pressure force and piston velocity. When the phase approaches 0°, the pressure and volume flow are more in phase and the absorbed acoustic power is larger; when the phase approaches +/−90°, the interaction becomes more reactive and less net acoustic power is converted.
The output electric power delivered to the external resistance is calculated as:
The winding copper loss is defined as:
The additional electromagnetic loss is calculated as:
The seal gap viscous loss is calculated as:
The mechanical damping loss is defined as:
By energy conservation, the input acoustic power is partitioned as:
Pin = Pout + Pc + Pe + Ps + Pm
Finally, the acoustic-to-electrical efficiency of the HPLA (i.e., alternator efficiency) is defined as:
3. Experimental Setup and Model Validation
3.1. Experimental Setup
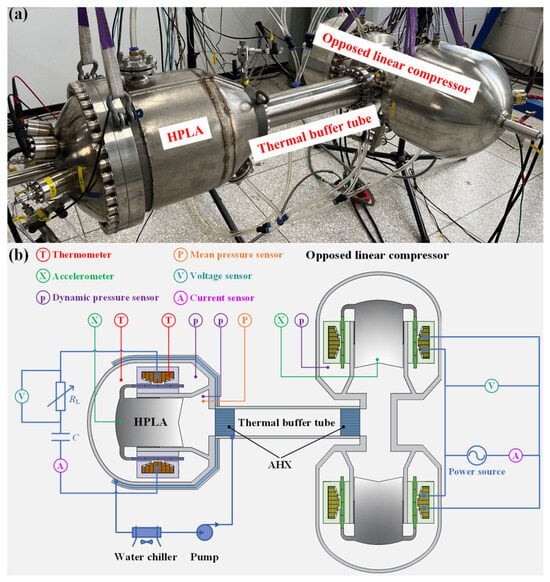
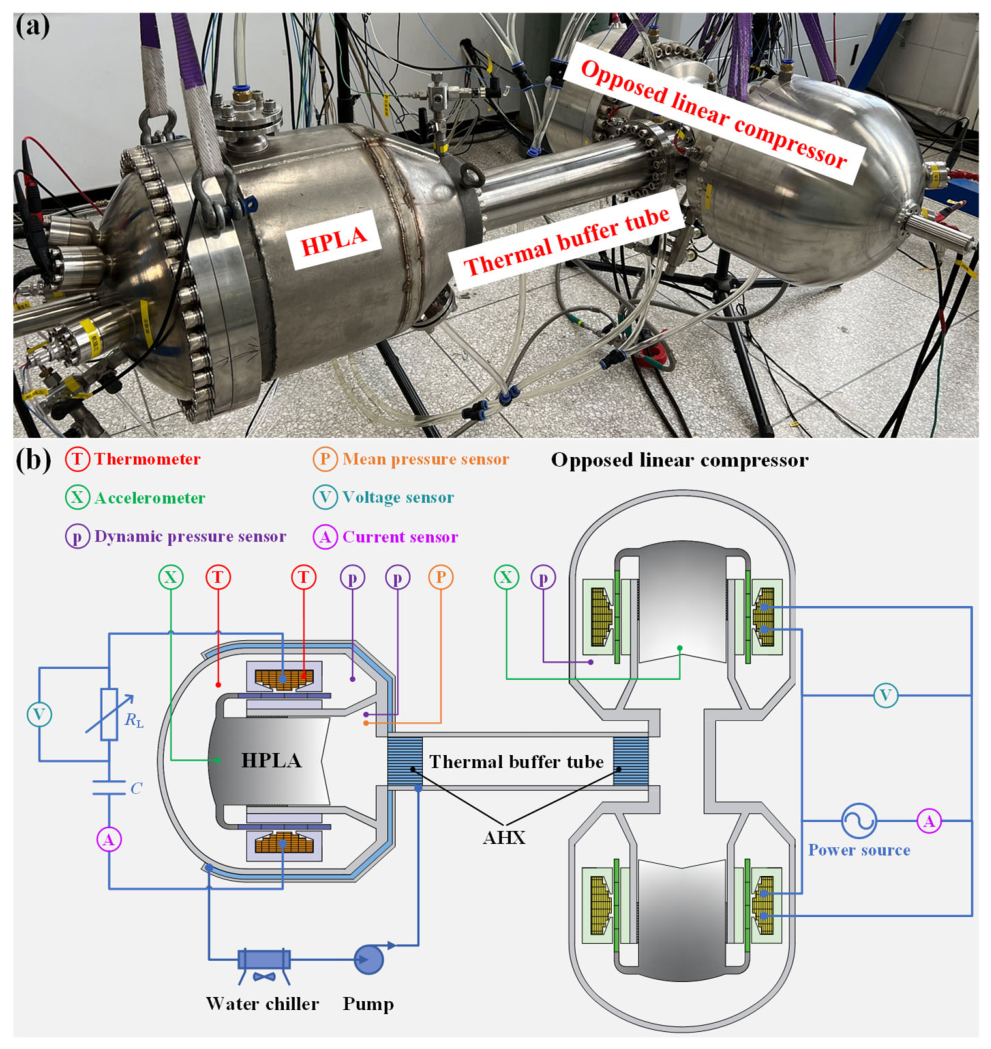
A dynamic test facility was constructed to validate the proposed coupling model and to investigate the load-matching behavior of the HPLA. As shown in Figure 2, the test facility mainly consists of the tested HPLA, an opposed linear compressor, a thermal buffer tube, an external R-C load circuit, and a synchronized measurement system. AHX in the figure denotes ambient-temperature heat exchanger.The opposed linear compressor was used as the pressure wave source. It generated an oscillatory pressure wave, which was transmitted to the HPLA through the thermal buffer tube. In this way, the HPLA could be tested under gas-coupled dynamic excitation without operating a complete FPSG. The thermal buffer tube was inherited from a facility developed for high-temperature linear alternator testing. Its function is to transmit the pressure wave while providing a thermal buffer between a potentially heated test section and the compressor maintained near room temperature. In the present water-cooled tests, no deliberate temperature gradient was imposed across the tube, and its thermal behavior was outside the scope of the load-matching study. The main structural parameters of the tested HPLA are summarized in Table 1.
Figure 2.
Dynamic test facility for the HPLA: (a) physical image, (b) instrumentation layout [31].
Table 1.
Main structural parameters of the tested HPLA.
The experimental measurements included the front- and back-chamber dynamic pressures, piston motion, terminal voltage, output current, mean pressure, and temperatures near the gas space and winding. Dynamic pressure sensors installed close to the HPLA provided the pressure amplitudes and phases required for acoustic power evaluation, while voltage and current probes measured the electrical response. Piston motion was monitored using a piezoelectric accelerometer, and the displacement was reconstructed from the steady-state harmonic acceleration component. For harmonic motion, the displacement and acceleration phasors satisfy , giving a displacement amplitude of X = A/(2πf)2, where A is the acceleration amplitude. Thus, displacement and acceleration differ in phase by 180°. The reconstructed displacement is defined relative to the cycle-mean piston position, with periodicity and zero-mean displacement and velocity providing the integration constraints. This procedure determines the oscillatory displacement but does not independently determine the static equilibrium position. The sensor specifications and nominal accuracies are summarized in Table 2.
Table 2.
Specifications of the sensors used in the dynamic test facility.
The external circuit comprised selectable load resistors and series capacitors, allowing the dissipative load and reactive compensation to be adjusted. The resistors represented the useful electrical load, whereas the capacitors compensated for the winding inductance and controlled the electrical impedance phase. All experiments were conducted with cooling water maintained at 288 K, while the gas space and winding region temperatures were monitored during operation. At each operating condition, the system was allowed to reach steady oscillation before data acquisition. The validation dataset was obtained under stable pressure amplitudes, piston motion, and electrical waveforms.
For protection of the experimental system, the piston displacement amplitude was restricted to 0–25 mm, and the current amplitude trip threshold was set to 200 A. The latter is an experimental protection setting rather than a continuous or short-time equipment rating. Although the experiments reported here were conducted under water-cooled conditions near 288 K, the tested alternator had previously been verified for continuous operation at temperatures up to 200 °C on the high-temperature test platform; 200 °C is, therefore, taken as its verified continuous thermal boundary. All reported test points remained within the displacement, current, and temperature limits. The high-temperature-oriented selection of the permanent magnets, magnet support structure, and other thermally resistant components prioritizes thermal endurance rather than maximum room temperature efficiency; this design trade-off is considered when interpreting the measured conversion efficiency.
The nominal sensor accuracies in Table 2 establish the instrument-level uncertainty basis: no more than 1% for the accelerometer, dynamic pressure, voltage, and current measurements and no more than 0.25% for mean pressure. These specifications support the electrical and displacement measurements, but they do not by themselves define the uncertainty of acoustic power or efficiency, which also depends on the measured pressure flow phase. Because the original records do not include a calibrated phase uncertainty value or repeated trials at each resistance point, a complete pointwise propagation-based uncertainty interval cannot be reconstructed. The 95% intervals reported below, therefore, quantify the variation of model data errors across the 14 resistance conditions, rather than repeatability or full measurement uncertainty at an individual operating point.
3.2. Model Validation
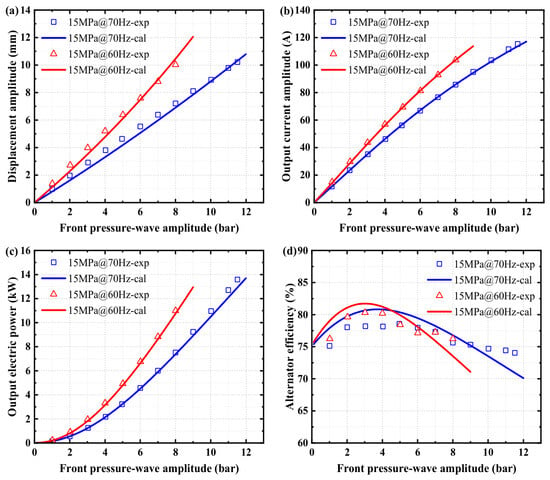
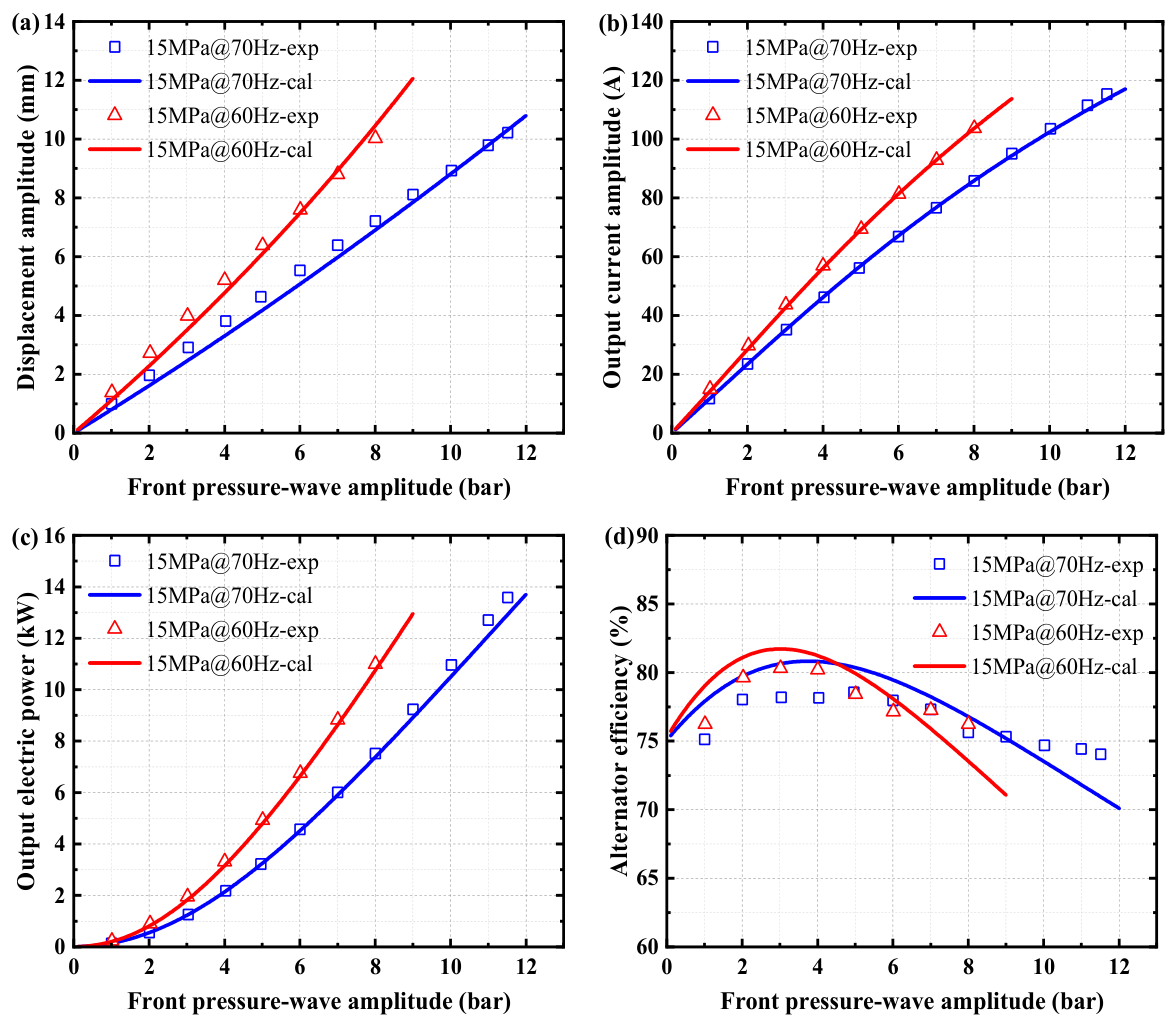
The proposed model was validated using two groups of experiments. The first group examined the predictive capability under different pressure wave amplitudes at a mean pressure of 15 MPa and driving frequencies of 60 and 70 Hz, whereas the second group examined the response under different external load resistances. In both cases, the measured front-chamber pressure amplitude and phase were imposed as the gas domain boundary condition, and the measured external load parameters were used directly in the electrical model. Figure 3 compares the calculated and experimental results under different pressure wave amplitudes. The model captures the main trends of the piston displacement, output current, electric power, and alternator efficiency. At 60 Hz, the mean absolute percentage errors of the displacement amplitude, current amplitude, electric power, and alternator efficiency are 5.32%, 0.75%, 2.86%, and 2.19%, respectively; at 70 Hz, the corresponding values are 3.98%, 0.40%, 2.87%, and 1.94%.The numerical calculations were performed using MATLAB R2023b.
Figure 3.
Comparison of calculated and experimental results under different operating conditions: (a) displacement amplitude, (b) current amplitude, (c) electric power, and (d) alternator efficiency.
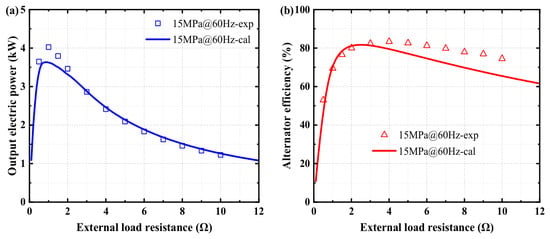
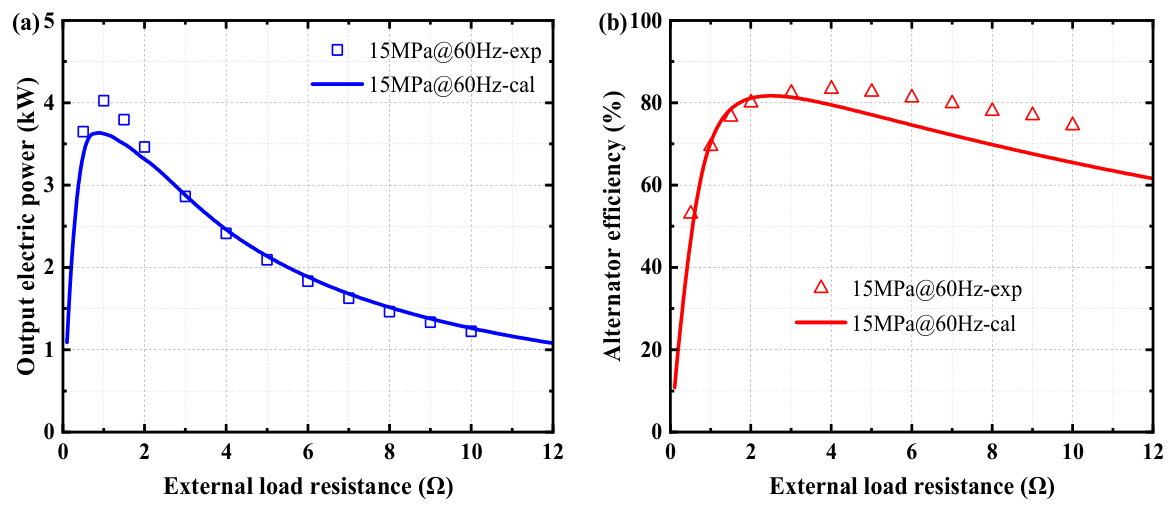
The variable resistance validation is shown in Figure 4. The calculated electric power follows the experimental trend well and reproduces the load resistance range over which the electric power reaches its maximum. For this group, the MAPE values of current, electric power, and acoustic power are 2.17%, 4.03%, and 12.46%, respectively, while the MAE of alternator efficiency is 5.93 percentage points. A 10,000-resample nonparametric bootstrap across the 14 tested resistance points (fixed seed 20260929) gives 95% intervals of 1.85–2.52% for current MAPE, 2.81–5.47% for electric power MAPE, 9.25–15.85% for acoustic power MAPE, and 4.11–7.75 percentage points for efficiency MAE. These intervals quantify variation across the tested operating points; the original records do not support a repeatability-based confidence interval at each individual operating point. The larger deviation in efficiency is mainly associated with the phase sensitivity of the pressure flow product because the acoustic power is determined by the real part of the complex pressure and volume flow interaction; under weak acoustic power or high-resistance conditions, this sensitivity is amplified, whereas the electric power and current, which do not involve this phase product, are validated much more robustly. Overall, the model provides sufficient accuracy for analyzing load-matching trends and loss transition mechanisms.
Figure 4.
Comparison of calculated and experimental results under different external load resistance: (a) electric power and (b) alternator efficiency.
4. Results and Discussion
4.1. Adaptability to Operating Conditions
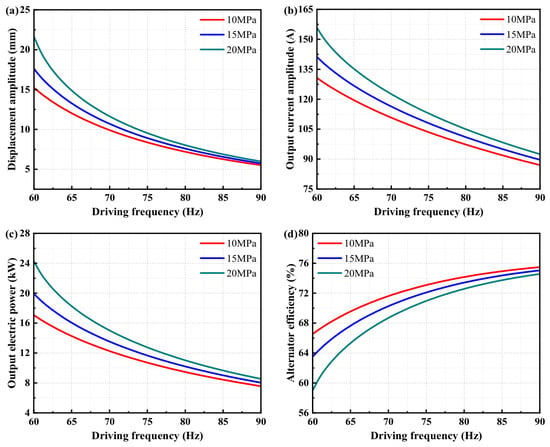
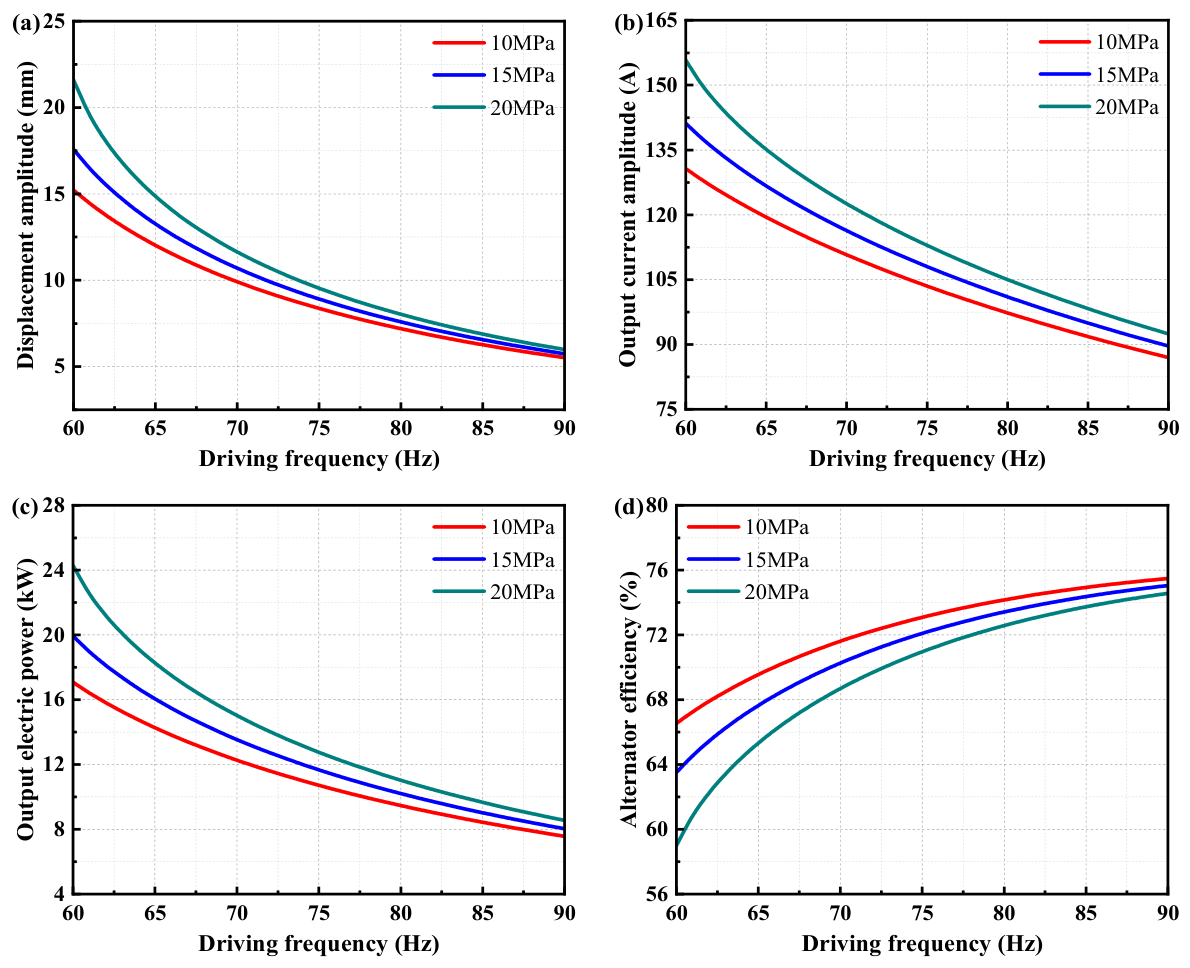
Figure 5 presents the coupled response of the gas-coupled HPLA to variations in mean pressure (10, 15, and 20 MPa) and driving frequency (60–90 Hz), with the front-chamber pressure wave amplitude fixed at 1.2 MPa, the load resistance at 2 Ω, and the series capacitance selected to cancel the winding inductance at each frequency. As shown in Figure 5, increasing the mean pressure improves the output capability, particularly in the lower-frequency region where the piston stroke is relatively large. At 60 Hz, the output electric power increases from 17.08 kW at 10 MPa to 19.93 kW at 15 MPa and 24.27 kW at 20 MPa. The corresponding current amplitude increases from 130.68 A to 141.17 A and 155.79 A, indicating that the stronger gas domain response also imposes a larger electromagnetic loss penalty. At 90 Hz, the power difference among the three pressure levels becomes much smaller, with output electric powers of 7.57, 8.04, and 8.55 kW at 10, 15, and 20 MPa, respectively. The frequency trend is governed by the dynamic response of the moving assembly. At a fixed pressure wave amplitude, increasing the frequency increases the inertial term and the dynamic stiffness of the coupled gas mechanical system, which suppresses the piston stroke. For example, at 15 MPa, the displacement amplitude decreases from 17.58 mm at 60 Hz to 5.74 mm at 90 Hz, and the output electric power decreases from 19.93 kW to 8.04 kW. The efficiency, however, increases from 63.51% to 75.05%, showing that the loss terms decrease faster than the electric power.
Figure 5.
The influence of mean pressure and driving frequency on HPLA performance: (a) displacement amplitude, (b) current amplitude, (c) electric power, and (d) alternator efficiency.
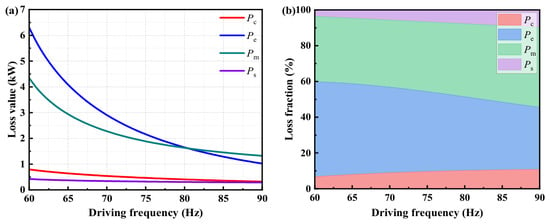
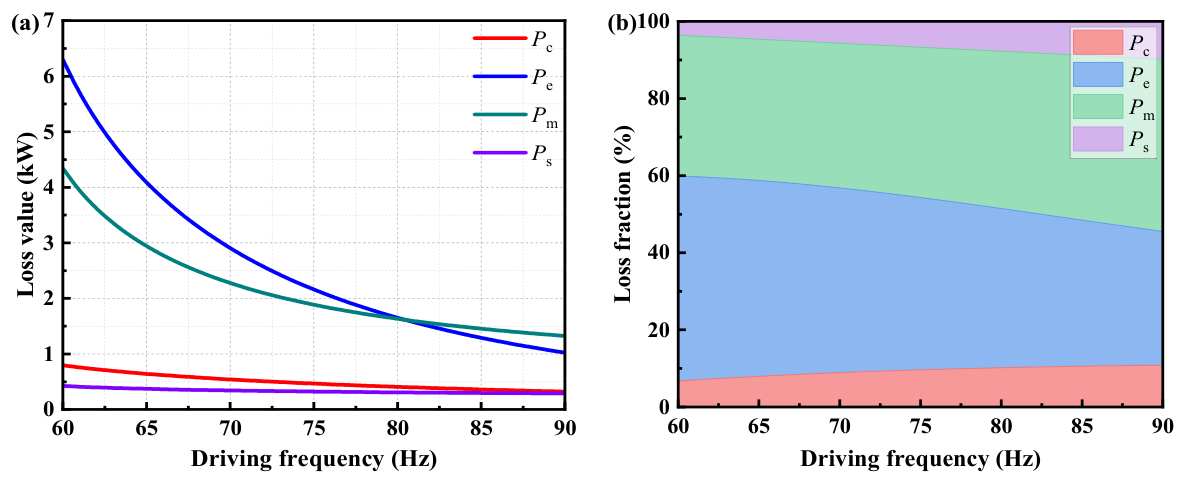
To connect the efficiency rise to specific dissipation mechanisms, Figure 6 reports the loss distribution for the 15 MPa case. It can be seen that the efficiency improvement at higher frequency is mainly caused by the suppression of high-current electromagnetic losses. At 15 MPa, when the frequency increases from 60 to 90 Hz, the additional electromagnetic loss decreases from 6.31 to 1.03 kW, while the mechanical damping loss decreases from 4.35 to 1.33 kW and the winding copper loss decreases from 0.80 to 0.32 kW. The fraction of additional electromagnetic loss in the total loss decreases from 53.1% to 34.6%, whereas the mechanical damping fraction increases from 36.6% to 44.8%. This does not mean that mechanical damping becomes larger in absolute value; rather, the current-dependent electromagnetic loss decreases more rapidly. Thus, the output electric power is highest at low frequency, while the efficiency is higher at elevated frequency because the high-current loss penalty is reduced.
Figure 6.
The influence of driving frequency on loss distribution: (a) loss value and (b) loss fraction.
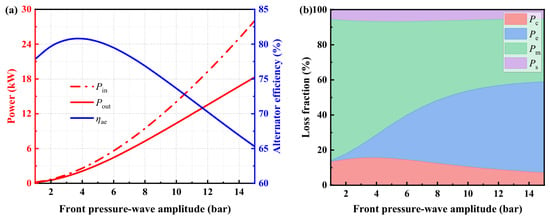
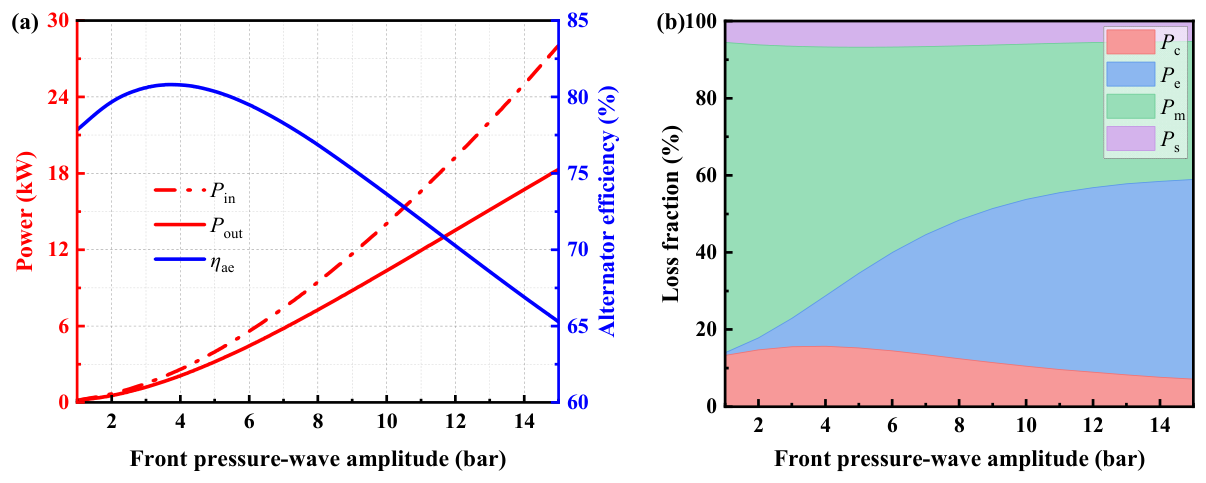
The influence of front-chamber pressure wave amplitude was further analyzed at 15 MPa and 70 Hz with a 2 Ω load and complete reactive compensation, as shown in Figure 7. It shows that increasing the front-chamber pressure wave amplitude monotonically increases piston displacement, output current, input acoustic power, and output electric power. When the pressure wave amplitude increases from 0.1 to 1.5 MPa, the displacement amplitude increases from 0.79 to 13.8 mm, and the output electric power increases from 0.13 to 18.31 kW. However, the efficiency reaches a maximum of 80.79% at about 0.4 MPa and then decreases to 65.29% at 1.5 MPa. At 0.1 MPa, the output electric power is very small, and the loss is dominated by mechanical damping, which accounts for about 80.5% of the total loss. At 0.4 MPa, the piston displacement amplitude exceeds the characteristic transition value Xc = 2.71 mm, indicating that the response has moved beyond the principal small-stroke gas-bearing/friction transition region, while the current-dependent electromagnetic loss remains limited. As the pressure wave amplitude further increases to 1.2–1.5 MPa, the additional electromagnetic loss becomes the dominant loss component, accounting for about 47.9–51.8% of the total loss. Therefore, a larger pressure wave amplitude is beneficial for power output, but excessive amplitude reduces efficiency because of the rapid growth of current-dependent electromagnetic losses.
Figure 7.
The influence of front pressure wave amplitude on HPLA performance: (a) input acoustic power, output electric power, and alternator efficiency, and (b) loss fraction.
4.2. Resistive Load-Matching Characteristics
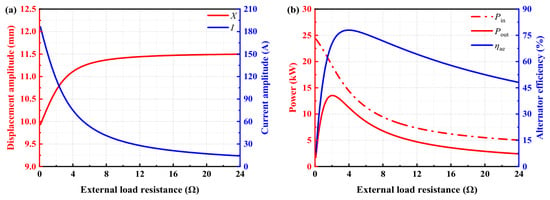
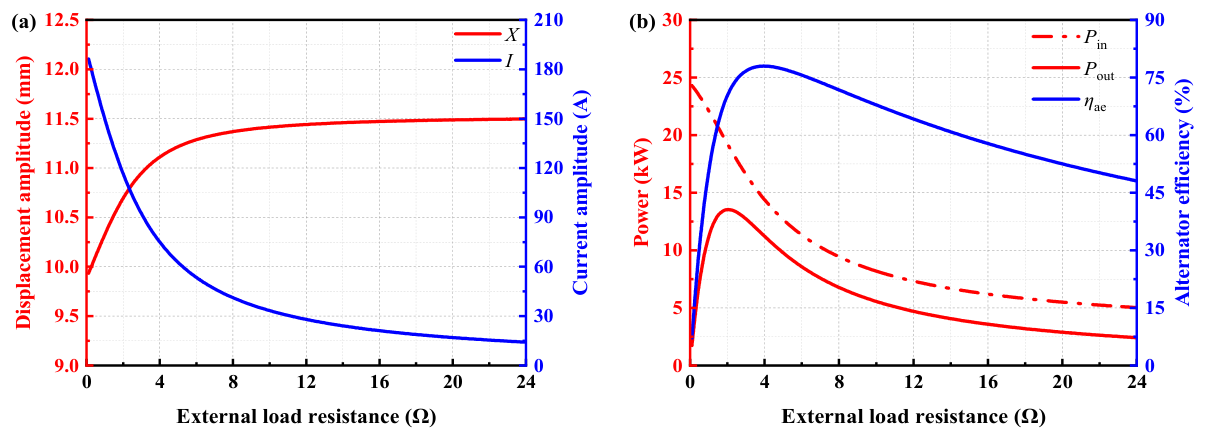
The resistive load-matching characteristics were calculated at 15 MPa and 70 Hz with a front-chamber pressure wave amplitude of 1.2 MPa. The series capacitance was selected to cancel the winding inductance, so that the total electrical impedance was almost purely resistive and the influence of external load resistance could be isolated. As shown in Figure 8, increasing the external load resistance strongly reduces the output current, from 186.47 A at 0.1 Ω to 14.20 A at 24 Ω. The piston displacement changes much more moderately because it is determined by the combined action of the gas domain stiffness, moving mass inertia, mechanical damping, and electromagnetic reaction. The output electric power first increases and then decreases, reaching a maximum of 13.54 kW at about 2.1 Ω. In contrast, the efficiency reaches its maximum of 77.98% at about 4 Ω. The separation between these two optima indicates that the load resistance that extracts the most power is not the same as the load resistance that minimizes the internal loss penalty.
Figure 8.
The influence of external load resistance on (a) displacement amplitude and current amplitude, (b) input acoustic power, output electric power, and alternator efficiency.
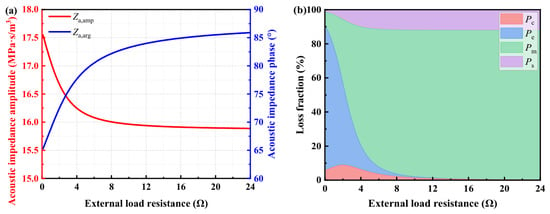
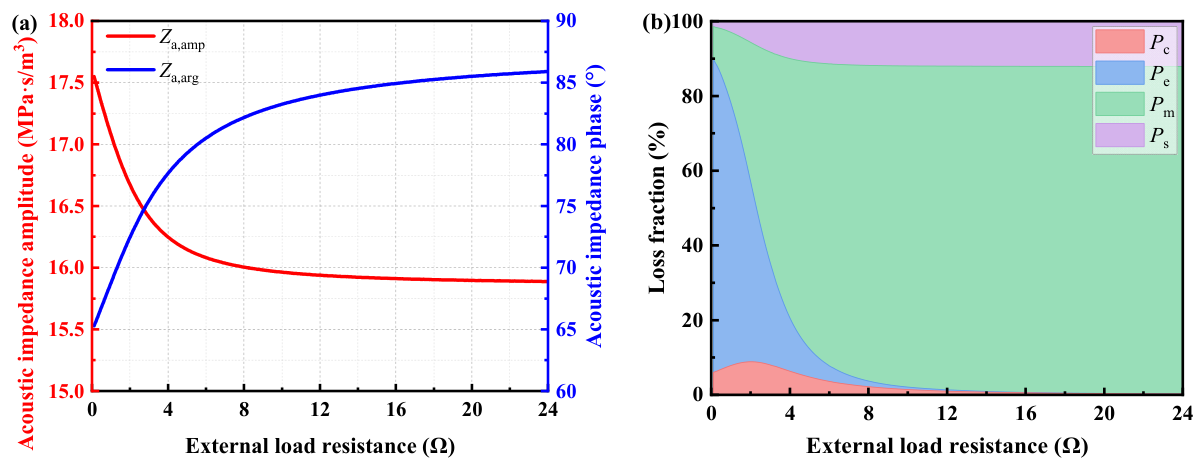
The physical origin of this separation is illustrated from the acoustic impedance and loss perspectives in Figure 9. Increasing the load resistance gradually weakens the real acoustic power absorption. The acoustic impedance phase increases from 65.3° at 0.1 Ω to 85.9° at 24 Ω, meaning that the pressure flow interaction becomes increasingly reactive. Meanwhile, the current-dependent losses decrease sharply. At 0.1 Ω, the additional electromagnetic loss is 19.2 kW, which is much larger than the useful output electric power of 1.74 kW; thus, the efficiency is only 7.15%. Near the maximum power point of 2.1 Ω, the output electric power increases to 13.54 kW and the additional electromagnetic loss decreases to 2.64 kW. Near the maximum efficiency point of 4 Ω, the additional electromagnetic loss is further reduced to 0.5 kW, and mechanical damping becomes the dominant loss component. When the resistance is increased beyond this region, the current and absorbed acoustic power become too small, and both electric power and efficiency decrease.
Figure 9.
The influence of external load resistance on (a) acoustic impedance amplitude and phase, as well as (b) loss fraction.
Overall, Figure 8 and Figure 9 show that resistive load matching is controlled by a trade-off between acoustic power absorption and current-dependent internal dissipation. A low load resistance strengthens the electromagnetic reaction and increases the absorbed acoustic power, but it also causes excessive additional electromagnetic loss. Increasing the load resistance suppresses this loss and improves the efficiency until the acoustic power absorption becomes too weak to sustain high output power. Therefore, the final resistive load should be selected according to whether the design priority is maximum electric power or maximum conversion efficiency.
4.3. Capacitive Load-Matching Characteristics
The capacitive load-matching characteristics were investigated at 15 MPa and 70 Hz with a fixed load resistance of 2 Ω and a front-chamber pressure wave amplitude of 1.2 MPa. The capacitance is expressed by the ratio C/CR, where CR denotes the capacitance required to cancel the winding inductance at the operating frequency. Thus, C/CR = 1 corresponds to the zero-reactance or complete electrical resonance condition. Notably, the capacitance sweep in this section is a model-based parametric analysis. The available variable resistance experiment already included a 557 μF series capacitor, which was kept constant across all resistance points at 60 Hz. It, therefore, validates the coupled R-C configuration at that capacitance, but it does not constitute an independent experimental validation of the capacitance sweep.
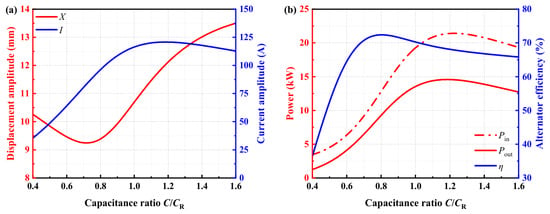
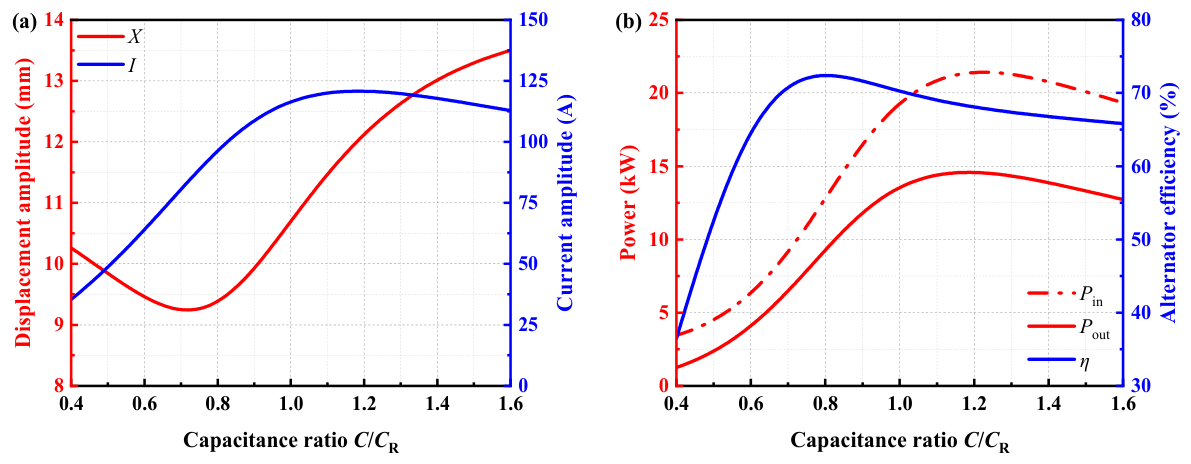
As shown in Figure 10, series capacitance has a strong influence on piston motion, current, acoustic power absorption, and output electric power. In the considered range, the maximum electric power is 14.58 kW at C/CR = 1.18, rather than at the complete electrical resonance point. At C/CR = 1, the electric power is 13.54 kW, and the efficiency is 70.26%. Increasing the capacitance to C/CR = 1.18 raises the displacement from 10.7 to 12 mm and the input acoustic power from 19.27 to 21.35 kW, so the output electric power increases despite the higher current-dependent loss. The maximum efficiency, however, occurs at C/CR = 0.8, where the output electric power is 9.27 kW, and the efficiency reaches 72.38%. The power and efficiency optima, therefore, differ.
Figure 10.
The influence of capacitance on (a) displacement amplitude and current amplitude, and (b) input acoustic power, output electric power, and alternator efficiency.
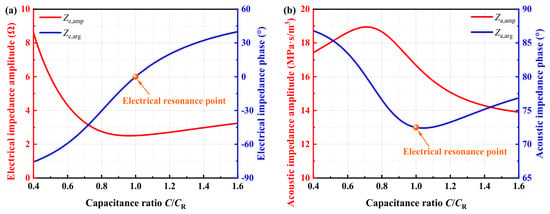
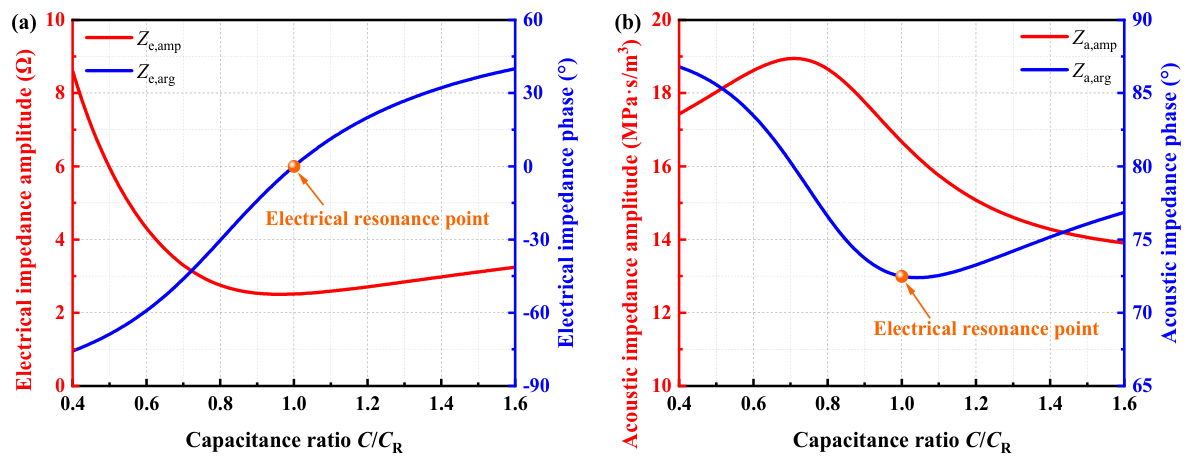
Figure 11 shows that C/CR = 1 makes the electrical impedance phase nearly zero, but this zero-reactance point is not equivalent to the best gas electromechanical matching condition. When C/CR is lower than 1, the electrical impedance is capacitive, and the equivalent electromagnetic stiffness is negative; for example, at C/CR = 0.8, the electrical impedance phase is −30.3°. When C/CR is higher than 1, the impedance becomes inductive, and the equivalent electromagnetic stiffness becomes positive; at the maximum power point C/CR = 1.18, the electrical impedance phase is 18.4°. These changes alter the piston motion and the acoustic impedance seen by the gas domain. Therefore, the capacitance for maximum power shifts to the slightly inductive side because this condition produces stronger acoustic power absorption, while the capacitance for maximum efficiency shifts to the capacitive side because it suppresses the current and reduces internal electromagnetic loss.
Figure 11.
The influence of capacitance on (a) electrical impedance amplitude and phase, as well as (b) acoustic impedance amplitude and phase.
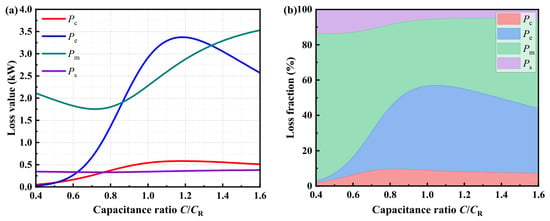
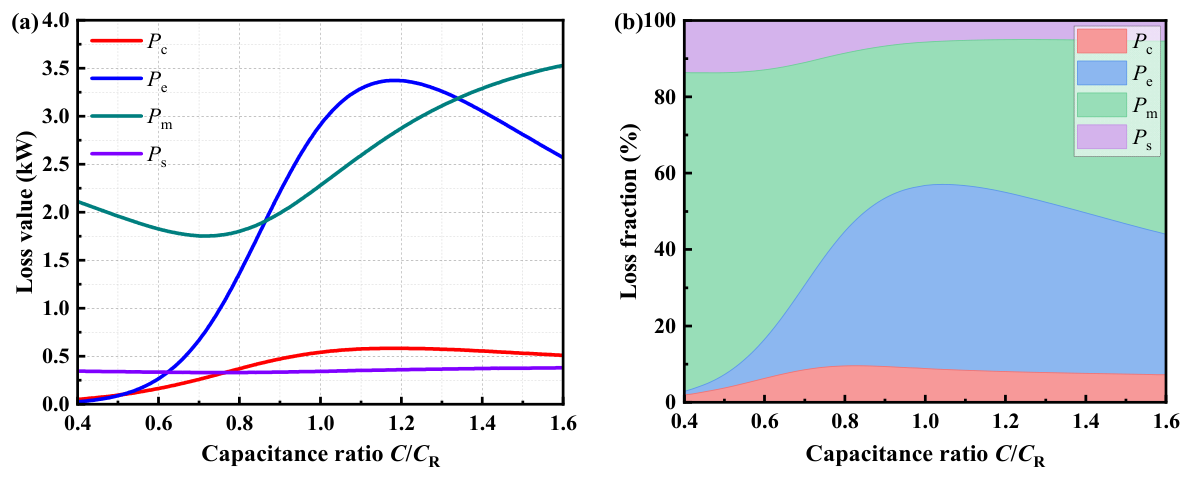
The corresponding loss distribution is also shown in Figure 12. It confirms this interpretation from the loss distribution perspective. At C/CR = 0.4, the current is only 35.41 A, and the electric power is limited to 1.25 kW; mechanical damping accounts for about 83.4% of the total loss. At complete electrical resonance, the output electric power increases to 13.54 kW, but the additional electromagnetic loss also rises to 2.91 kW and becomes the dominant loss component. At the maximum power capacitance, the additional electromagnetic loss further increases to 3.37 kW, while the mechanical damping loss is 2.82 kW. By contrast, at the maximum efficiency capacitance of C/CR = 0.8, the additional electromagnetic loss is only 1.36 kW. Therefore, capacitance tuning changes not only the electrical phase but also the relative importance of mechanical and electromagnetic losses.
Figure 12.
The influence of capacitance on loss distribution: (a) loss value and (b) loss fraction.
The separation among mechanical, winding copper, seal gap, and additional electromagnetic losses is obtained from the calibrated model rather than from independent thermal or calorimetric measurements. Accordingly, the reported transition of the dominant loss mechanism should be interpreted as a model prediction supported by the measured overall electromechanical response.
Overall, Figure 10, Figure 11 and Figure 12 demonstrate that capacitance matching affects the HPLA through both electrical phase compensation and dynamic feedback to the gas mechanical domain. Complete electrical resonance only eliminates the reactive part of the winding load circuit; it does not guarantee the best piston response, acoustic impedance, or loss distribution. For a gas-coupled HPLA driven by a finite pressure wave, the appropriate capacitance should, therefore, be selected from the coupled gas electromechanical response rather than from the zero-reactance condition alone.
4.4. Coupled R-C Load Matching Characteristics
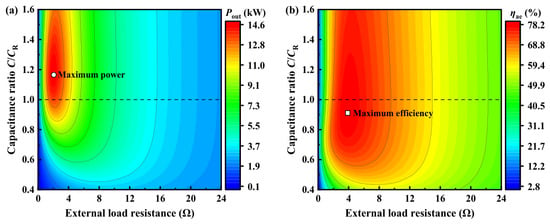
Because the resistance and the series capacitance influence the HPLA through different physical pathways, a coupled R-C load-matching map was constructed at 15 MPa, 70 Hz, and 1.2 MPa front-chamber pressure wave amplitude. The external resistance was varied from 0.1 Ω to 24 Ω, while the capacitance ratio C/CR was varied from 0.4 to 1.6. Figure 13 summarizes the combined effect of external resistance and series capacitance. The maximum power region is located at relatively low resistance and a capacitance slightly higher than the complete electrical resonance capacitance. The maximum output electric power reaches 14.58 kW at RL = 2 Ω and C/CR = 1.18, with an efficiency of 68.26%. In comparison, along the complete electrical resonance line, the maximum power is 13.54 kW at RL = 2.1 Ω. Therefore, allowing the capacitance to deviate from strict electrical resonance increases the maximum electric power by about 7.7%.
Figure 13.
The influence of R-C coupling on (a) output electric power and (b) alternator efficiency.
The maximum efficiency region is shifted toward a higher resistance and a capacitance slightly below the electrical resonance value. Under the conditions considered in Figure 13, namely, a mean pressure of 15 MPa, a driving frequency of 70 Hz, and a front-chamber pressure wave amplitude of 1.2 MPa, the calculated maximum power point occurs at RL = 2 Ω and C/CR = 1.18, yielding 14.58 kW at a current amplitude of 120.73 A and an efficiency of 68.26%. The maximum efficiency point occurs at RL = 3.9 Ω and C/CR = 0.94, yielding 10.96 kW at 74.98 A and 78.05% efficiency. Relative to the maximum power point, the maximum efficiency setting reduces output power by approximately 24.8% and current amplitude by approximately 37.9%. The former setting is, therefore, a candidate for power-oriented operation, whereas the latter is preferable when conversion efficiency and reduced current are the primary objectives. Under otherwise comparable cooling conditions, the lower current is expected to reduce winding copper and other current-dependent losses, potentially easing thermal loading. However, the present model does not resolve component temperatures, and long-term reliability was not tested; an increase in thermal margin or service life, therefore, cannot be quantified from these results. These candidate load settings apply to the specified operating condition and remain subject to the displacement, current, and temperature limits of the actual system.
5. Conclusions
In this study, the electrical load-matching characteristics and loss mechanisms of a gas-coupled HPLA for FPSGs were investigated experimentally and numerically. A multi-domain thermodynamic–dynamic–electromagnetic coupling model was first established and validated against gas-coupled dynamic experiments and then used to analyze the effects of operating conditions, load resistance, and series capacitance. The main conclusions are as follows.
(1) The proposed model can reproduce the main experimental trends while retaining the key physical coupling mechanisms of the test system. The model includes front- and back-chamber gas compliance, annular seal clearance leakage, piston dynamics, position-dependent BL and magnetic stiffness, amplitude-dependent mechanical damping, and equivalent electromagnetic loss resistance. For the operating condition validation, the mean absolute percentage errors of electric power and alternator efficiency are 2.86% and 2.19% at 60 Hz, and 2.87% and 1.94% at 70 Hz, respectively. For the variable resistance validation, the electric power MAPE is 4.03%, and the efficiency MAE is 5.93 percentage points. The larger efficiency deviation in the variable resistance case is mainly related to the sensitivity of acoustic power to the pressure flow phase.
(2) Operating pressure, driving frequency, and front-chamber pressure wave amplitude strongly affect the piston response, output power, efficiency, and loss distribution. Higher mean pressure and larger pressure wave amplitude increase the available acoustic driving capacity and power output but also increase the current level and current-dependent electromagnetic losses. At 15 MPa and 70 Hz, the output power reaches 18.31 kW at a pressure wave amplitude of 1.5 MPa, whereas the maximum efficiency of 80.79% appears at about 0.4 MPa. This separation between maximum power and maximum efficiency reflects a loss transition from mechanical damping at small amplitudes to current-dependent electromagnetic loss at large amplitudes. At a fixed pressure wave amplitude, increasing frequency reduces piston stroke and output power because of the stronger inertial effect, while the efficiency increases as high-current losses decrease more rapidly.
(3) Resistive load matching produces distinct maximum power and maximum efficiency operating points. With complete reactive compensation at 15 MPa, 70 Hz, and 1.2 MPa pressure wave amplitude, the maximum output power is 13.54 kW at about 2.1 Ω, whereas the maximum efficiency is 77.98% at about 4 Ω. A low load resistance strengthens acoustic power absorption but causes excessive current-dependent electromagnetic loss, while a high load resistance suppresses current and electromagnetic loss but weakens power extraction. Therefore, the resistive load should be selected according to whether power output or conversion efficiency is the primary design target.
(4) Series capacitance changes not only the electrical phase but also the equivalent electromagnetic stiffness and damping acting on the piston. Therefore, complete electrical resonance is not necessarily the best load-matching condition for a gas-coupled HPLA. The coupled R-C map gives a maximum output power of 14.58 kW at RL = 2 Ω and C/CR = 1.18, whereas the maximum efficiency of 78.05% occurs at RL = 3.9 Ω and C/CR = 0.94. The maximum power point shifts to a slightly inductive condition because it enhances acoustic power absorption, while the maximum efficiency point shifts to a slightly capacitive condition because it better suppresses current-dependent losses.
Overall, the results show that the optimal electrical load of a gas-coupled HPLA cannot be determined by electrical resonance or resistance matching alone. A coupled load-matching criterion that simultaneously considers gas domain acoustic absorption, piston dynamics, electromagnetic reaction, and loss distribution is required. The proposed framework provides a theoretical basis for selecting electrical loads and operating conditions for high-power linear alternators in FPSG systems. These conclusions apply to the investigated helium conditions (60–90 Hz, 10–20 MPa, front pressure wave amplitudes up to 1.5 MPa, and water cooling near 288 K), and the model prescribes the measured front-chamber pressure without resolving feedback to the complete Stirling cycle. The capacitance sweep and loss partition, therefore, remain model-based predictions because independent capacitance sweep and calorimetric measurements were unavailable.
Author Contributions
Conceptualization, J.L.; methodology, J.L.; software, Y.W.; validation, J.L.; formal analysis, J.L. and Y.W.; investigation, J.L., X.Z., G.S. and Y.S.; resources, none; data curation, J.L.; writ-ing—original draft preparation, Y.W. and G.S.; writing—review and editing, J.L., X.Z., Y.S., Y.C., J.H., H.H. and E.L.; visualization, J.L.; supervision, Y.S., J.H., H.H. and E.L.; project administration, J.L.; funding acquisition, Y.C. All authors have read and agreed to the published version of the manuscript.
Funding
This research was funded by the National Key Research and Development Program (Grant No. 2021YFC28026003) and the Youth Fund (Category C) of Guangxi Natural Science Foundation (Grant No. 2026GXNSFBA00640144). The APC was funded by the above projects.
Data Availability Statement
The raw data supporting the conclusions of this study will be made available by the corresponding author upon reasonable request.
Conflicts of Interest
The authors declare no conflict of interest.
Nomenclature
| Nomenclature | mi | gas mass in chamber i, kg | |
| Abbreviations | ṁ | mass flow rate, kg/s | |
| FPSG | free-piston Stirling generator | p0 | mean pressure, Pa |
| HPLA | high-power linear alternator | pb | back-chamber pressure, Pa |
| Common symbols | pf | front-chamber pressure, Pa | |
| â | complex phasor of a harmonic variable a | Pc | winding copper loss, W |
| a0, a2 | polynomial coefficients of the position-dependent BL(x) relation | Pe | additional electromagnetic loss, W |
| A | acceleration amplitude, m/s2 | Pin | acoustic power absorbed by the HPLA, W |
| Ap | effective area of the power piston, m2 | Pm | mechanical damping loss, W |
| b0, b2 | polynomial coefficients of the position-dependent Km(x) relation | Pout | output electric power, W |
| BL | transduction coefficient, N/A | Ps | seal gap viscous loss, W |
| BL1(X) | first-harmonic equivalent transduction coefficient, N/A | Qg | leakage volume flow of the clearance, m3/s |
| C | series capacitance, F | h,i | heat transfer rate, W |
| C0 | mechanical damping coefficient under fully developed gas film support, N·s/m | Qs | volume flow generated by source piston, m3/s |
| Cb | acoustic compliance of back chamber, m3/Pa | RC | coil resistance, Ω |
| Cf | acoustic compliance of front chamber, m3/Pa | RE | equivalent electromagnetic loss resistance, Ω |
| Ci | acoustic compliance of chamber i, m3/Pa | Rg | viscous resistance of the clearance, Pa·s/m3 |
| Cm | mechanical damping coefficient, N·s/m | RL | external load resistance, Ω |
| ΔC | additional small-stroke mechanical damping coefficient, N·s/m | Ti | gas temperature in chamber i, K |
| CR | resonant capacitance, F | Vb, Vf | back- and front-chamber volumes, m3 |
| cv | specific heat at constant volume, J/(kg·K) | Vi | volume of chamber i, m3 |
| Dg | diameter of the annular gap, m | x | piston displacement, m |
| Dp | diameter of the power piston, m | X | displacement amplitude, m |
| f | operating frequency, Hz | piston displacement phasor, m | |
| Fem | electromagnetic reaction force, N | Xc | characteristic displacement amplitude, m |
| h | specific enthalpy, J/kg | Yg | complex leakage admittance, m3/(Pa·s) |
| hg | radial clearance of the annular gap, m | Za | acoustic impedance of power piston, Pa·s/m3 |
| I | current amplitude, A | Ze | total electrical impedance, Ω |
| kf | frequency-dependent loss coefficient, Ω/Hz2 | Zx | complex dynamic stiffness of the moving assembly, N/m |
| kI | current-dependent loss coefficient, Ω/A2 | Greek symbols | |
| Kem* | equivalent complex electromagnetic stiffness of the moving assembly, N/m | γ | specific heat ratio of helium |
| Km | magnetic spring stiffness, N/m | ηae | acoustic-to-electrical efficiency of HPLA |
| Km,1(X) | first-harmonic equivalent magnetic stiffness, N/m | θ | harmonic phase variable, rad |
| L | coil inductance, H | μ | dynamic viscosity of helium, Pa·s |
| lg | length of the annular gap, m | ρ0 | mean density of helium, kg/m3 |
| Lg | inertance of the annular clearance, Pa·s2/m3 | ρi | density of helium in chamber i, kg/m3 |
| M | moving mass of the power piston, kg | ω | angular frequency, rad/s |
References
- Walker, G. Stirling Engines; Clarendon Press: Oxford, UK, 1980. [Google Scholar]
- Ye, W.; Yang, P.; Liu, Y. Multi-objective thermodynamic optimization of a free piston Stirling engine using response surface methodology. Energy Convers. Manag. 2018, 176, 147–163. [Google Scholar] [CrossRef] [Scilit]
- West, C.D. Principles and Applications of Stirling Engines; Van Nostrand Reinhold: New York, NY, USA, 1986. [Google Scholar]
- Yang, C.; Zhuang, N.; Zhao, H.; Tang, X. Dynamic performance of the combined Stirling thermoelectric conversion technology for a lunar surface nuclear power system. Appl. Therm. Eng. 2023, 221, 119873. [Google Scholar] [CrossRef] [Scilit]
- Dai, Z.; Wang, C.; Zhang, D.; Tian, W.; Qiu, S.; Su, G.H. Design and heat transfer optimization of a 1 kW free-piston Stirling engine for space reactor power system. Nucl. Eng. Technol. 2021, 53, 2184–2194. [Google Scholar] [CrossRef] [Scilit]
- Liao, Y.; Wang, H.; Zhu, Q.; Chen, Y.; Zhang, L.; Luo, E. Design and performance assessment of an integrated supercritical CO2 Brayton cycle and free-piston Stirling generator system for combined power generation. Energy 2026, 351, 140868. [Google Scholar] [CrossRef] [Scilit]
- Kong, L.; Li, H.; Sun, S.; Ye, W. Full-time domain analysis on operating characteristics of free piston Stirling generator. Energy Rep. 2022, 8, 6139–6149. [Google Scholar] [CrossRef] [Scilit]
- Guo, C.; Wang, Z.; Tong, L.; Feng, H. Research on the piston dynamics and energy distribution characteristics of a free-piston Stirling generator: Numerical model and experimental results. Results Eng. 2025, 27, 105903. [Google Scholar] [CrossRef] [Scilit]
- Wu, L.; Feng, H.; Jia, B.; Tang, Z.; Yan, X.; Wang, W. A novel method to investigate the power generation characteristics of a linear generator in the full-frequency operating range applied to an opposed-piston free-piston engine generator: Simulation and test results. Energy 2022, 254, 124235. [Google Scholar] [CrossRef] [Scilit]
- Zheng, P.; Yu, B.; Zhu, S.; Gong, Q.; Liu, J. Research on control strategy of free-piston Stirling-engine linear-generator system. In Proceedings of the 2014 17th International Conference on Electrical Machines and Systems (ICEMS), Hangzhou, China, 22–25 October 2014; pp. 2300–2304. [Google Scholar] [CrossRef] [Scilit]
- Holliday, E.; Keiter, D. Control electronics for Palm Power 35 W free-piston Stirling engine. In Proceedings of the 3rd International Energy Conversion Engineering Conference, San Francisco, CA, USA, 19 June 2005. AIAA Paper 2005–5750. [Google Scholar] [CrossRef] [Scilit]
- Chen, H.; Li, X.; Chen, P.; Jiang, H.; Niu, Y.; Liu, Y. Study on the thermodynamic-dynamic-electrical coupling model of free-piston Stirling generator and the impact of load on its characteristics. Case Stud. Therm. Eng. 2026, 83, 108189. [Google Scholar] [CrossRef] [Scilit]
- Yang, D.M. Review of controllers for low-power free-piston Stirling convertors. In Proceedings of the AIAA Propulsion and Energy 2021 Forum, Virtual Event, 28 July 2021. AIAA Paper 2021–3344. [Google Scholar] [CrossRef] [Scilit]
- Dugala, G.M. Stirling Convertor Controller Development at NASA Glenn Research Center; NASA Glenn Research Center: Cleveland, OH, USA, 2018; NASA/TM-2018-219963. [Google Scholar]
- Hung, N.B.; Lim, O. A review of free-piston linear engines. Appl. Energy 2016, 178, 78–97. [Google Scholar] [CrossRef] [Scilit]
- Jin, Z.; Huang, W.; Feng, Y.; Yang, J.; Wu, H.; Wang, D.; Shuai, Z. Power optimization control of active free piston Stirling generator based on displacement phase-frequency characteristics for improving adaptability to hot-end temperature variations. Appl. Therm. Eng. 2026, 291, 130190. [Google Scholar] [CrossRef] [Scilit]
- Chi, C.; Liu, H.; Li, R.; Lin, M.; Mou, J.; Hong, G. Study of the phase modulation effect of the bounce space on the free piston Stirling generator. Energy 2026, 362, 142205. [Google Scholar] [CrossRef] [Scilit]
- Formosa, F. Coupled thermodynamic-dynamic semi-analytical model of free piston Stirling engines. Energy Convers. Manag. 2011, 52, 2098–2109. [Google Scholar] [CrossRef] [Scilit]
- Benvenuto, G.; De Monte, F. Analysis of free-piston Stirling engine/linear alternator systems. Part I: Theory. J. Propuls. Power 1995, 11, 1036–1046. [Google Scholar] [CrossRef] [Scilit] [PubMed]
- Lewandowski, E.J.; Metscher, J. Development and integration of an advanced Stirling convertor linear alternator model for a tool simulating convertor performance and creating phasor diagrams. In Proceedings of the 11th International Energy Conversion Engineering Conference, San Jose, CA, USA, 12 July 2013. AIAA Paper 2013–3812. [Google Scholar] [CrossRef] [Scilit]
- Kankam, M.D.; Rauch, J.S.; Santiago, W. Dynamic analysis of free-piston Stirling engine/linear alternator-load system: Experimentally validated. In Proceedings of the 27th Intersociety Energy Conversion Engineering Conference, San Diego, CA, USA, 3 August 1992. SAE Technical Paper 929265. [Google Scholar] [CrossRef] [Scilit]
- Benvenuto, G.; De Monte, F. Electrodynamic analysis of free-piston Stirling engine/linear alternator systems. In Proceedings of the Intersociety Energy Conversion Engineering Conference, Monterey, CA, USA, 7 August 1994; pp. 1994–4031. [Google Scholar] [CrossRef] [Scilit]
- Wang, R.; Jia, Z.; Hu, J.; Zhang, L.; Xu, J.; Luo, E. Investigation on gas-coupled vibration damping modules in free-piston Stirling generator. Appl. Therm. Eng. 2023, 233, 121175. [Google Scholar] [CrossRef] [Scilit]
- Jia, Z.; Wang, R.; Hu, J.; Zhang, L.; Wu, Z.; Chen, Y.; Luo, E. Study on the coupling between engine and alternator in a free-piston Stirling generator. Appl. Therm. Eng. 2022, 217, 119222. [Google Scholar] [CrossRef] [Scilit]
- Dai, W.; Luo, E.; Wang, X.; Wu, Z. Impedance match for Stirling-type cryocoolers. Cryogenics 2011, 51, 168–172. [Google Scholar] [CrossRef] [Scilit]
- Ulusoy, N.; McCaughan, F. Nonlinear analysis of free piston Stirling engine/alternator system. In Proceedings of the Intersociety Energy Conversion Engineering Conference, Monterey, CA, USA, 7 August 1994. AIAA Paper 1994–3955. [Google Scholar] [CrossRef] [Scilit]
- Kirby, R.L.; Vitale, N. Update on development of a control system for a 5 kilowatt free piston Stirling engine convertor. In Proceedings of the 6th International Energy Conversion Engineering Conference, Cleveland, OH, USA, 15 June 2008. AIAA Paper 2008–5761. [Google Scholar] [CrossRef] [Scilit]
- Abdelwahed, A.Y.; Essawey, A.H.I.; Abdel-Rahman, E. Numerical simulation of key linear alternator performance indicators under thermoacoustic-power-conversion conditions. J. Acoust. Soc. Am. 2017, 141, 3737. [Google Scholar] [CrossRef] [Scilit]
- Zhu, Q.; Sun, H.; Yu, G.; Zhang, L.; Luo, E. Experimental and numerical study on synchronization characteristics of a dual-opposed free-piston Stirling generator. Appl. Therm. Eng. 2025, 281, 128671. [Google Scholar] [CrossRef] [Scilit]
- Sun, D.; Zhang, J.; Ge, S.; Shen, Q.; Linghu, J.; Qi, Y. Operating characteristics of a 15 W free-piston Stirling generator. Appl. Therm. Eng. 2022, 211, 118412. [Google Scholar] [CrossRef] [Scilit]
- Luo, J.; Sun, G.; Jin, Q.; Zhu, X.; Sun, Y.; Chen, Y.; Hu, J.; Luo, E. Numerical and experimental study on cooling enhancement of a high-power linear alternator for free-piston Stirling machines. Appl. Therm. Eng. 2026, 287, 129462. [Google Scholar] [CrossRef] [Scilit]

Disclaimer/Publisher’s Note: The statements, opinions and data contained in all publications are solely those of the individual author(s) and contributor(s) and not of MDPI and/or the editor(s). MDPI and/or the editor(s) disclaim responsibility for any injury to people or property resulting from any ideas, methods, instructions or products referred to in the content. |
© 2026 by the authors. Licensee MDPI, Basel, Switzerland. This article is an open access article distributed under the terms and conditions of the Creative Commons Attribution (CC BY) license.