


Abstract
Factory-gate carbon footprints of finished wood flooring are shaped by material supply, manufacturing energy, transport, finishing, packaging and waste treatment. This study compared solid wood flooring (SWF) and solid wood flooring for underfloor heating (HWF) produced within one enterprise under a common cradle-to-gate (A1–A3) framework. Process contributions were evaluated alongside evidence provenance, allocation sensitivity, paired epistemic uncertainty and deterministic mitigation screening. Baseline GWP100 was 14.18 kg CO2e m−2 for SWF and 17.54 kg CO2e m−2 for HWF. HWF-specific carbonization-kiln electricity and heat-treatment natural gas together contributed approximately 2.91 kg CO2e m−2, accounting for most of the manufacturing-stage difference. Across 100,000 paired draws, the median HWF–SWF difference was 3.30 kg CO2e m−2 under area allocation and 2.88 kg CO2e m−2 under mass allocation within the registered epistemic parameter model. The central combined mitigation scenario reduced baseline GWP100 by 32.61% for SWF and 33.99% for HWF, while wood materials remained the largest residual process group. HWF-specific heat treatment was therefore the principal source of the additional manufacturing burden, while lower-carbon electricity, material efficiency and transport reduction offered further mitigation potential.
1. Introduction
The factory-gate climate impact of finished wood flooring is shaped by both material supply and the energy and process services required to convert wood into a finished product. Harvesting and primary processing, conversion yield, manufacturing electricity and heat, logistics and product configuration all affect the impact associated with each square meter of flooring. Reviews and comparative life-cycle assessment (LCA) report substantial variation across wood products and flooring systems as product construction, manufacturing inputs, declared units and system boundary change [1,2,3,4,5]. In a recent Chinese cradle-to-gate assessment, four wood flooring types ranged from −8.50 to 4.83 kg carbon dioxide equivalent per square meter; raw-material production accounted for 46.4–72.1% of reported carbon emissions and manufacturing electricity for 8.4–33% [6]. Other Chinese studies of flooring, doors and panels connect product impacts to factory inventories and regional energy supply [7,8,9]. Product-specific inventories for solid hardwood and prefinished engineered flooring further show how material supply, manufacturing and transport accumulate within a declared unit [10,11].
A product-level total can identify a hotspot but does not by itself show which configuration-specific activities created the difference between the products manufactured within a shared production system. Wood input determines an upstream material contribution and part of the transport demand, whereas drying, machining, heat treatment, finishing and packaging add different manufacturing and material requirements. Coating formulation can alter the environmental profile of a flooring finish [12], kiln drying raises energy demand [13], production-yield improvement can reduce the input required for saleable flooring [14], and freight mode and distance affect supply-chain impacts [15]. Accordingly, the comparison of two related flooring configurations requires the contribution of shared activities to be distinguished from that of configuration-specific operations rather than relying only on aggregate product totals. Existing flooring LCAs have characterized product-level footprints and major hotspots, but the effect of a configuration-specific manufacturing step on closely related solid wood flooring products within one enterprise and a common background system is less directly resolved.
The same distinction is important for the evidence supporting the calculation. Enterprise inventories can combine meter readings, purchase records, production statistics, engineering conversions and historical reconstruction. Missing inventory data require explicit reconstruction and documented proxy selection [16], background datasets should be matched to the foreground activity with attention to process and site representativeness [17], and structured process-level collection supports transparent LCI construction [18]. Configuration-specific routing can also help retain explicit product assignments when equipment and services are shared [19]. In this study, GWP100-weighted evidence provenance is used only as a record-level traceability view linking calculated contributions to their source evidence; it is not treated as a data-quality score.
Uncertainty and mitigation are treated as separate supporting analyses. Monte Carlo simulation can propagate specified parameter uncertainty through LCA calculations [20,21], while comparative product-footprint analysis benefits from retaining dependence in parameters shared by the products being compared [22]. Such propagation does not provide complete LCA uncertainty unless the relevant sources of uncertainty have been parameterized. Mitigation screening addresses a different question by estimating how specified changes in energy supply, fuel service, material input, transport, packaging, coatings or waste would change the baseline footprint. Keeping these analyses separate avoids interpreting a deterministic engineering range as a statistical uncertainty interval or treating uncertainty coverage as a measure of record quality.
Here, SWF and the solid wood flooring for underfloor heating (HWF) produced within one enterprise were compared under a common cradle-to-gate (A1–A3) boundary. The analysis addressed four questions: (1) how do the GWP100 and process contribution structures differ between the two manufacturing configurations; (2) which configuration-specific activities, particularly the additional heat-treatment process, account for the difference; (3) which enterprise records and background links support the dominant contributions, and does the interpretation remain stable within the registered epistemic parameter model and under an alternative allocation basis; and (4) what GWP100 reduction potentials are indicated by deterministic measures targeting the identified material and energy hotspots? Process-resolved contribution analysis is used as the primary interpretation, while evidence provenance, allocation sensitivity, paired epistemic uncertainty and mitigation screening provide supporting information.
2. Materials and Methods
2.1. Study Design, Product Configurations, Declared Unit and Boundary
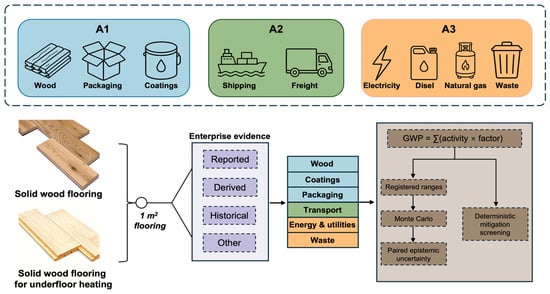
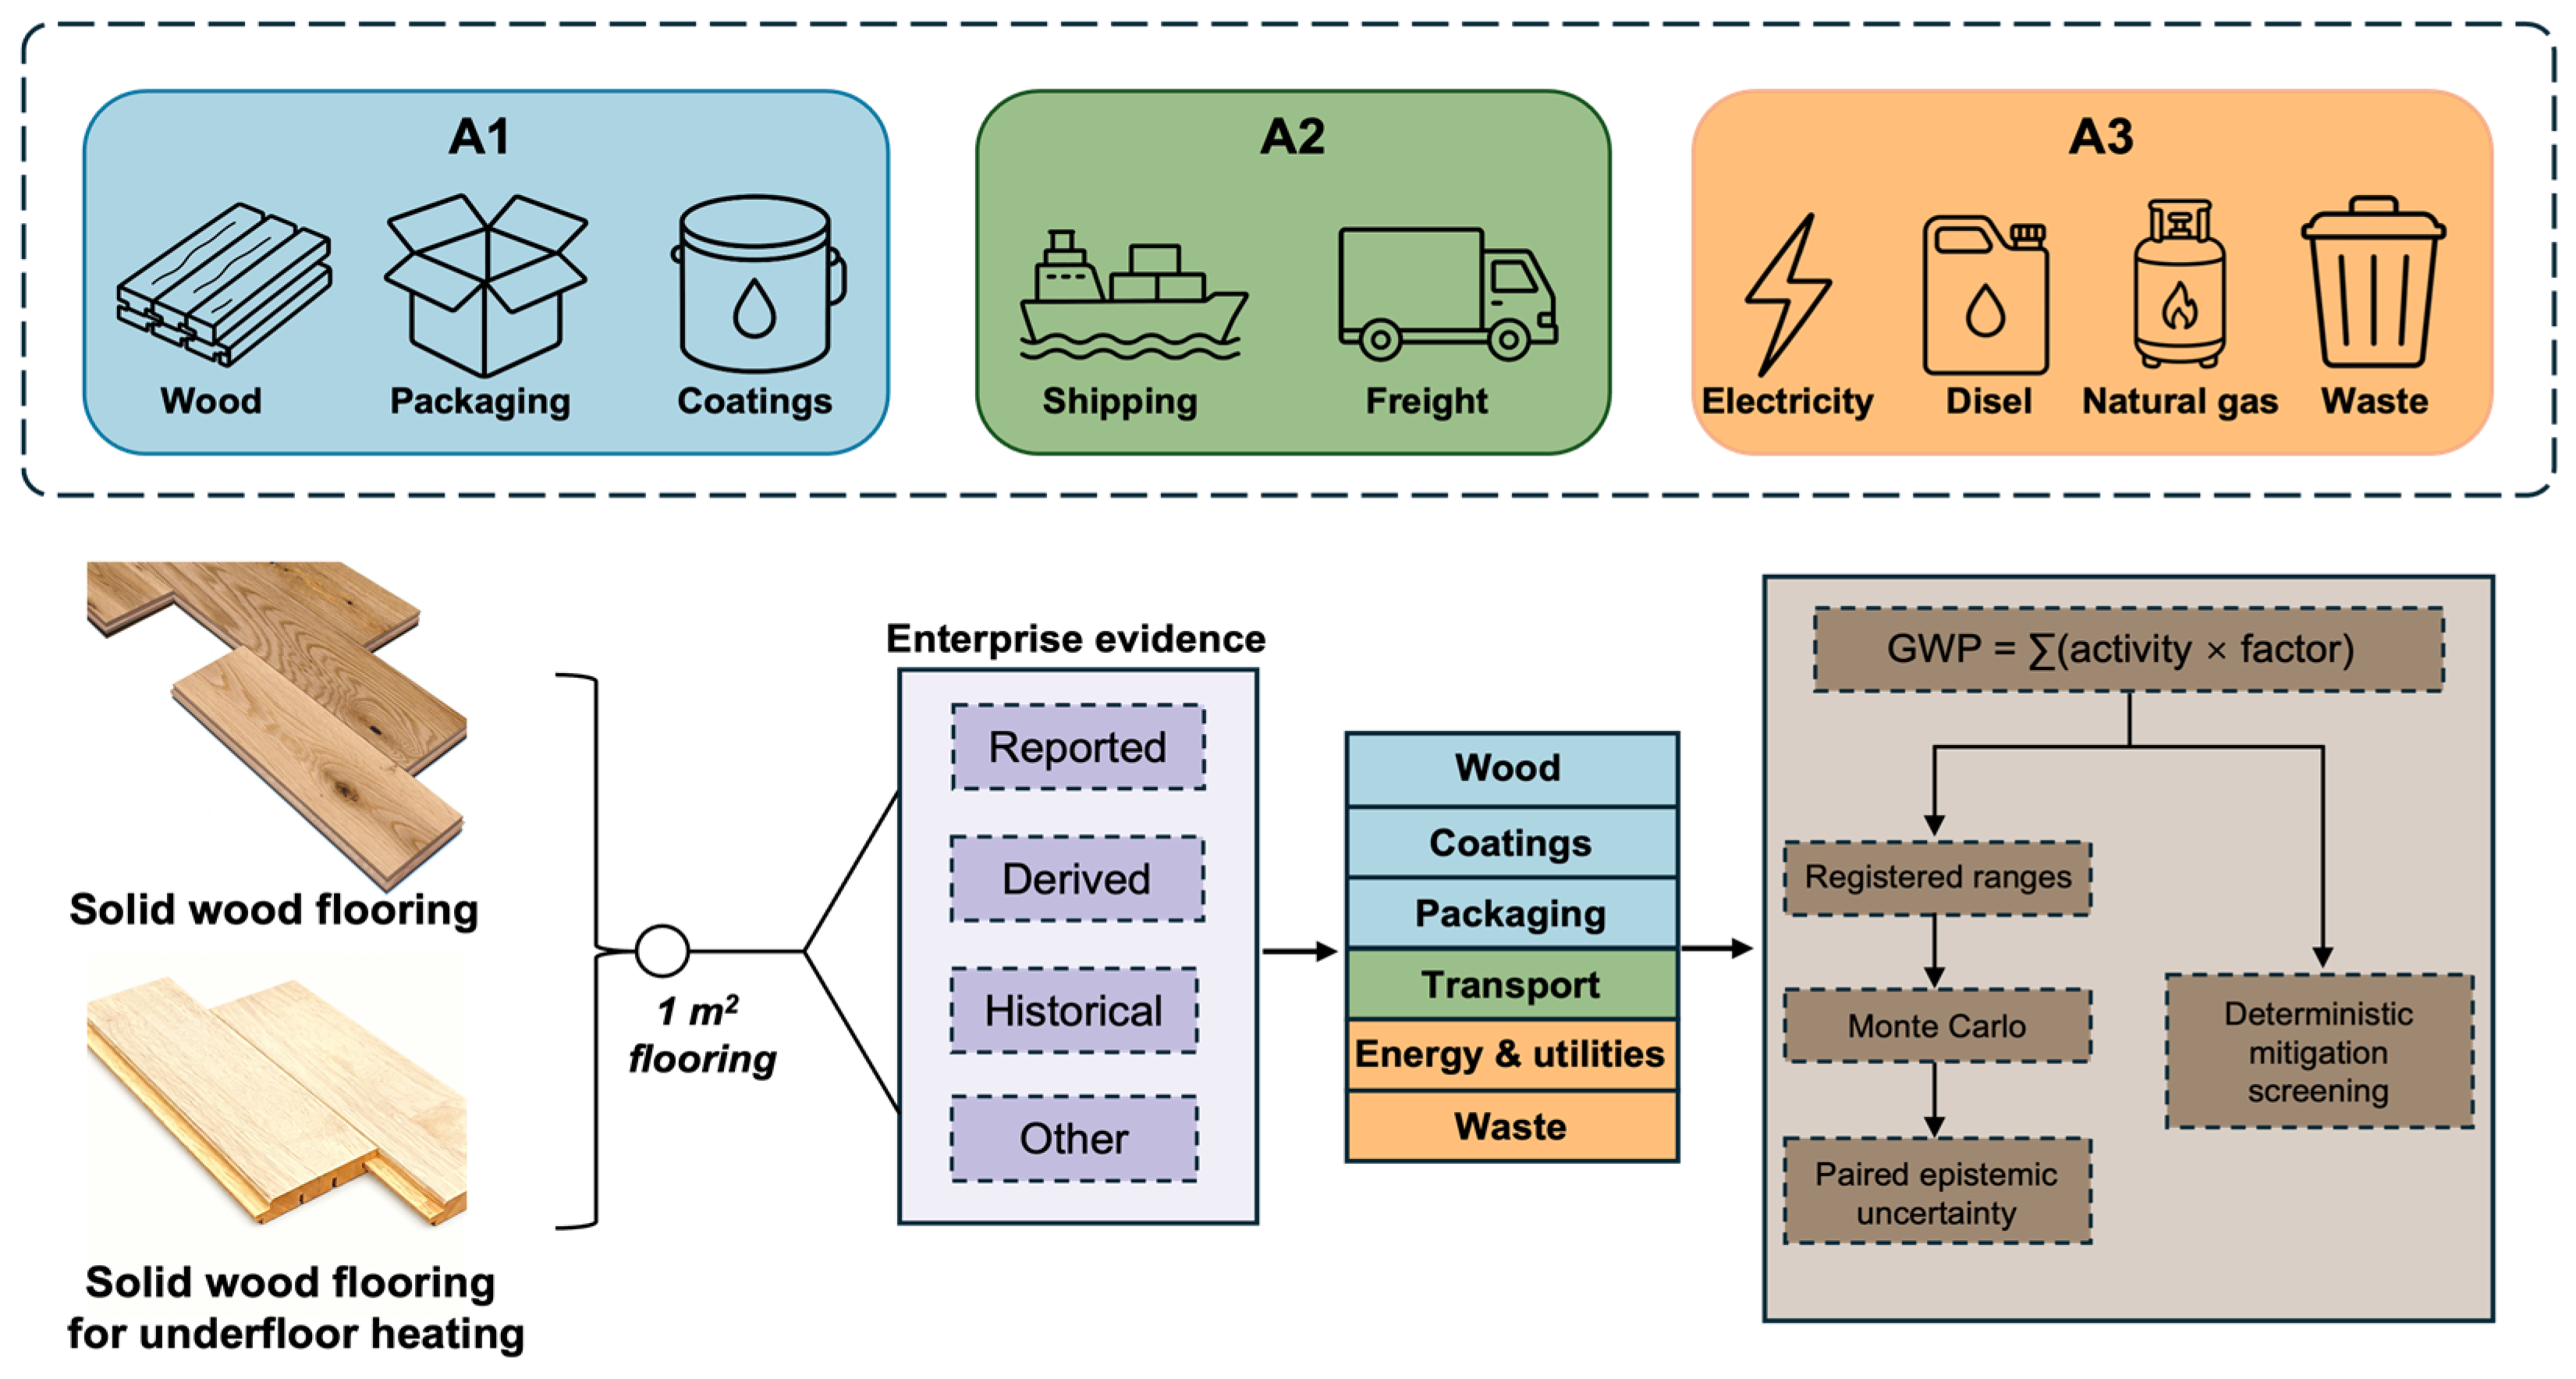
SWF and solid wood flooring for underfloor heating (HWF) were manufactured within the same enterprise production system and shared most production operations. Both were single-piece solid wood flooring products rather than multilayer engineered flooring, and product dimensions varied among individual product series rather than defining the two configurations. HWF contained no active heating components and did not provide an independent heating service. Its configuration-specific manufacturing requirement was an additional heat-treatment step for underfloor-heating application (Figure S1). The associated carbonization-kiln electricity and heat-treatment natural gas were assigned directly to HWF, while plant activities that could not be assigned directly were treated as shared activities. Figure 1 summarizes the common A1–A3 boundary and the relationship between shared and configuration-specific activities.
Figure 1.
Study design for cradle-to-gate A1–A3 GWP100 of SWF and HWF. Enterprise foreground records are linked to background factors and aggregated into stage and process contributions; the HWF configuration includes additional heat-treatment electricity and natural-gas use. Evidence provenance, allocation and paired epistemic uncertainty, and deterministic mitigation screening are supporting analyses. The wood-carbon-storage endpoint is reported separately.
The declared unit was 1 m2 of finished flooring at the factory gate, and the impact indicator was 100-year global warming potential (GWP100), reported in kilograms of carbon dioxide equivalent per square meter (kg CO2e m−2). The common area basis was used to compare A1–A3 manufacturing burdens because both configurations provide finished solid wood flooring and HWF does not provide an additional active heating function. This declared unit does not establish equivalence in service life, use-stage thermal performance or other downstream functions.
The cradle-to-gate boundary comprised A1, including raw-material supply and other upstream inputs; A2, including inbound transport; and A3, including manufacturing energy, utilities and waste treatment. Distribution beyond the factory, installation, use, maintenance, replacement and end of life was excluded. The study design and product-carbon-footprint reporting were informed by ISO 14040, ISO 14044 and ISO 14067 [23,24,25] and the relevant Chinese sector standard, T/CBMF 280-2024, for wood-based panels and wooden flooring [26]. A wood-carbon-storage endpoint was calculated from A1 wood activity and density and reported separately from ordinary A1–A3 GWP100. It was excluded from the paired epistemic uncertainty and deterministic mitigation analyses. Supplementary Methods S1 provides the detailed boundary and storage-accounting conventions.
2.2. Foreground Inventory, Background Linking and GWP100 Calculation
Foreground activity data were obtained from Jiusheng Flooring, Huzhou, Zhejiang Province, China. The main enterprise inventory represented normal production in April 2026 and covered product output, wood, coatings and auxiliaries, packaging, electricity, natural gas, inbound transport, manufacturing utilities and waste treatment. The underlying evidence included production and material records, submeter and other meter readings, supplier and logistics records, waste records and historical energy records; inventory-family source types are detailed in Supplementary Methods S2. Diesel activities were based on the most recent available 2025 enterprise records because complete independent monthly records were not available for April 2026; these entries were therefore retained as Historical record. Enterprise source material was preserved in its original form and transformed into source-traceable foreground records. Each record retained the product assignment, life-cycle stage, activity name, native unit, evidence basis, process label and conversion or proxy assumption needed to reproduce its use in the calculation. Evidence was classified as Reported, Derived, Historical record or Other evidence. These classes identify the route by which an activity entered the calculation, while the underlying enterprise source type is reported separately in Supplementary Methods S2; they do not constitute data-quality scores or uncertainty probabilities. At the inventory-family level, wood-input quantities were predominantly classified as Derived; coatings, road freight, manufacturing electricity and natural gas, and most waste-treatment records were classified as Reported; ocean-freight activities were classified as Other evidence; packaging combined Reported and Derived records; and diesel was retained as Historical record. These group-level descriptions do not replace the record-level classifications in Source Data. Table 1 summarizes the aggregated foreground activities, while the underlying records and reconstruction notes are provided in Source Data.
Table 1.
Aggregated foreground life-cycle inventory for the declared unit.
Each foreground activity was linked to a background process using process identity, material or transport mode, geography, technology and unit compatibility [17,18,27]. Principal baseline factors included 0.58 kg CO2e kWh−1 for grid electricity in China (2024) [28], 264.13 kg CO2e m−3 for roundwood production in China, 0.22 kg CO2e (t·km)−1 for Chinese road freight on a well-to-wheel basis, 0.0061 kg CO2e (t·km)−1 for ocean freight, for which the source reported a CO2-only basis, 0.61 kg CO2e m−3 for upstream natural-gas supply, and 2.23 kg CO2e m−3 for direct natural-gas combustion, which was likewise entered from a direct-CO2 source factor. Source-reported CO2-only factors were retained as CO2-only components and expressed in the common kg CO2e reporting unit using a GWP100 characterization factor of one for CO2; no additional gases were inferred beyond the source boundary. Upstream natural-gas supply and combustion were retained as separate background contributions. Complete background-process names, geography, reference year, source, unit and matching rationale are provided in Source Data. Missing values were not treated as zero, and records without a defensible link were not assigned to a generic catch-all process.
For contribution row i, GWP100 was calculated as Ci = Ai × Fi, where Ai is the foreground activity converted to the unit required by the matched factor and Fi is the corresponding background factor. This activity-by-factor calculation was performed at record level and then aggregated by A1, A2 and A3 and by six process groups: manufacturing energy and utilities, wood materials, wood transport, packaging materials, coatings and auxiliaries, and manufacturing-waste treatment. Stage totals, process-group totals and product totals were required to close numerically using unrounded contributions.
Native activity units were retained during source review because they preserve the meaning of enterprise records. Unit conversion was applied only when required for compatibility with the selected factor, and the conversion was recorded beside the affected activity rather than embedded in an aggregated total. This separation retained a traceable distinction between changes in foreground activity and changes in the matched background factor.
GWP100-weighted evidence provenance was calculated from the same record-level contribution rows. For product p and evidence basis e, the numerator was the sum of contributions linked to e and the denominator was ordinary A1–A3 product GWP100. Where one foreground record produced several background contributions, those contributions were combined before the evidence class was summarized. The resulting shares identify the source routes supporting calculated contributions; they do not represent record number, mass, quality or probability. Structured LCI collection, explicit reconstruction of missing data and representative background-data selection are established inventory issues [16,17,18]. Established LCI data-quality and pedigree approaches assess attributes such as reliability and temporal, geographical and technological representativeness and may also support uncertainty characterization [29,30]. The GWP100-weighted provenance analysis used here serves a complementary purpose by linking each foreground record’s evidence route to its contribution to the product footprint; the methodological comparison is detailed in Supplementary Methods S3. Supplementary Methods S2 and S3 provide the detailed inventory, aggregation and provenance procedures.
2.3. Paired Epistemic Uncertainty and Allocation Sensitivity
Epistemic uncertainty was propagated through 100,000 paired draws. The joint analysis sampled 12 registered background factors used in the GWP100 accounting and 17 wood-density parameters for which documented ranges and distributions had been registered. Inputs without a registered uncertainty range remained fixed at their baseline values, and the wood-carbon-storage endpoint was excluded. Results are reported as medians and empirical P2.5–P97.5 simulation intervals, defined by the 2.5th and 97.5th percentiles of the registered epistemic parameter model. Draw-count convergence was assessed using nested prefixes of 1000, 5000, 10,000, 50,000 and 100,000 observations from the same paired-draw sequence. Medians and empirical P2.5–P97.5 endpoints for SWF, HWF and the HWF–SWF difference under both allocation branches changed only slightly at the higher draw counts, with the paired product difference being particularly stable (Supplementary Table S1). The 100,000-draw setting was therefore retained to limit Monte Carlo sampling noise in the empirical summaries; increasing the draw count does not expand the set of parameterized uncertainties.
Monte Carlo simulation has been used to propagate specified uncertainty through LCA calculations [21]. Within each draw in the present study, SWF and HWF shared sampled background factors and wood densities, after which both product totals and the HWF–SWF difference were calculated. This paired design retained the dependence of inputs shared by the two products rather than treating common background knowledge as independent product uncertainty [22]. The same draw identifiers and sampled states were used for the area- and mass-allocation branches. The reported intervals therefore describe dispersion within the registered epistemic parameter model and do not represent the full uncertainty of the complete LCA model [20].
The area allocation assigned shared plant activities using qualified output area, defined as the recorded area of qualified finished flooring produced during the inventory period. In April 2026, SWF and HWF output areas were 21,505 and 32,846 m2, respectively, giving baseline allocation shares of 0.40 and 0.60. These shares served as a physical proxy for shared activities that could not be assigned directly. Mass allocation conserved the total of each activity originally shared by area and reassigned that pool using wood-mass shares derived from product output, per-unit wood use and sampled wood densities. Product-specific wood inputs, A2 freight and directly assigned activities retained their assignments. Different shared services could in principle have more specific causal drivers, such as operating time, throughput or direct metering, but the available enterprise records did not support consistent product-specific rules of that kind. Mass allocation was therefore evaluated as an alternative physical sensitivity case rather than as a preferred allocation rule. Supplementary Methods S4 gives the equations, distributions and coverage of both branches.
2.4. Deterministic Mitigation Screening
Mitigation was evaluated independently of paired epistemic uncertainty using low, central and high deterministic settings relative to each baseline. The screen included photovoltaic (PV) electricity, natural-gas heat electrification for HWF, on-site diesel electrification, and reductions in wood materials, wood transport, packaging materials, coatings and auxiliaries, and manufacturing-waste treatment. The registered settings are summarized in Table 2. Probability distributions for the engineering intervention rates were not available from the enterprise evidence base; the mitigation analysis was therefore kept separate from the epistemic Monte Carlo model rather than assigning unsupported probabilistic distributions. The low, central and high levels were defined as case-specific comparative screening assumptions representing progressively stronger intervention levels rather than predicted or empirically validated implementation rates. The non-energy brackets were defined as evidence-informed deterministic levels based on enterprise practice and intervention characteristics, using 5%, 15% and 30% for wood materials and coatings and 10%, 25% and 40% for transport, packaging and manufacturing waste. The PV shares were derived from enterprise electricity records: 52.79% corresponds to the July 2024–June 2025 operating average, 68.41% to the historical April share and 100% to full PV supply; the detailed derivation is provided in Supplementary Methods S5.
Table 2.
Deterministic mitigation settings.
The grid-electricity and PV-electricity factors were 0.58 and 0.0520 kg CO2e kWh−1, respectively [28]. Fuel replacement preserved the registered useful energy service. Natural-gas heat treatment used a conversion of 9.10 kWh m−3, while on-site diesel used 4.61 kWh kg−1. Backup-generation diesel was excluded from electrification. In single-fuel scenarios, existing electricity remained grid supplied and replacement electricity used the tier-specific grid–PV mix. In the PV-only scenario, the grid–PV mix applied to existing electricity. In the Total replacement scenario, the same-tier mix applied to both existing and replacement electricity.
Non-energy measures scaled the applicable baseline activities while retaining their background factors. Wood-material reduction also reduced the associated upstream wood-transport activity before the additional transport reduction was applied. Thus, combined wood transport was calculated as T0(1 − rwood)(1 − rtransport), corresponding to total wood-transport reductions of 14.50%, 36.25% and 58.00% in the low, central and high tiers. No direct coupling was imposed between wood-material reduction and manufacturing-waste output because the available enterprise records did not provide a sufficiently resolved quantitative relationship between wood input and the reported waste streams. Total replacement combined same-tier PV electricity, applicable fuel replacements and all five non-energy measures at the activity level. Avoided GWP100 was baseline minus scenario GWP100 and residual GWP100 was the complete scenario total. These scenarios are deterministic screening cases; costs, infrastructure, technology compatibility and operational feasibility were not included. Supplementary Methods S5 provides the conversion parameters and calculation details.
3. Results and Discussion
3.1. Baseline GWP100 and Configuration-Specific Manufacturing Contributions
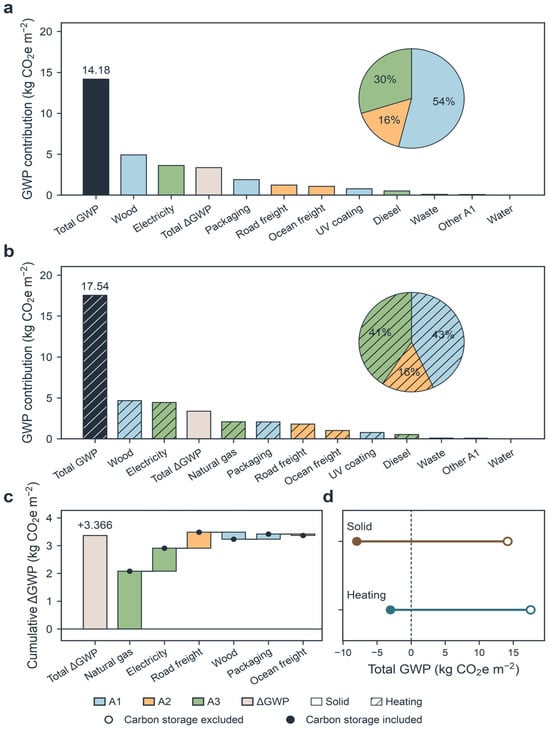
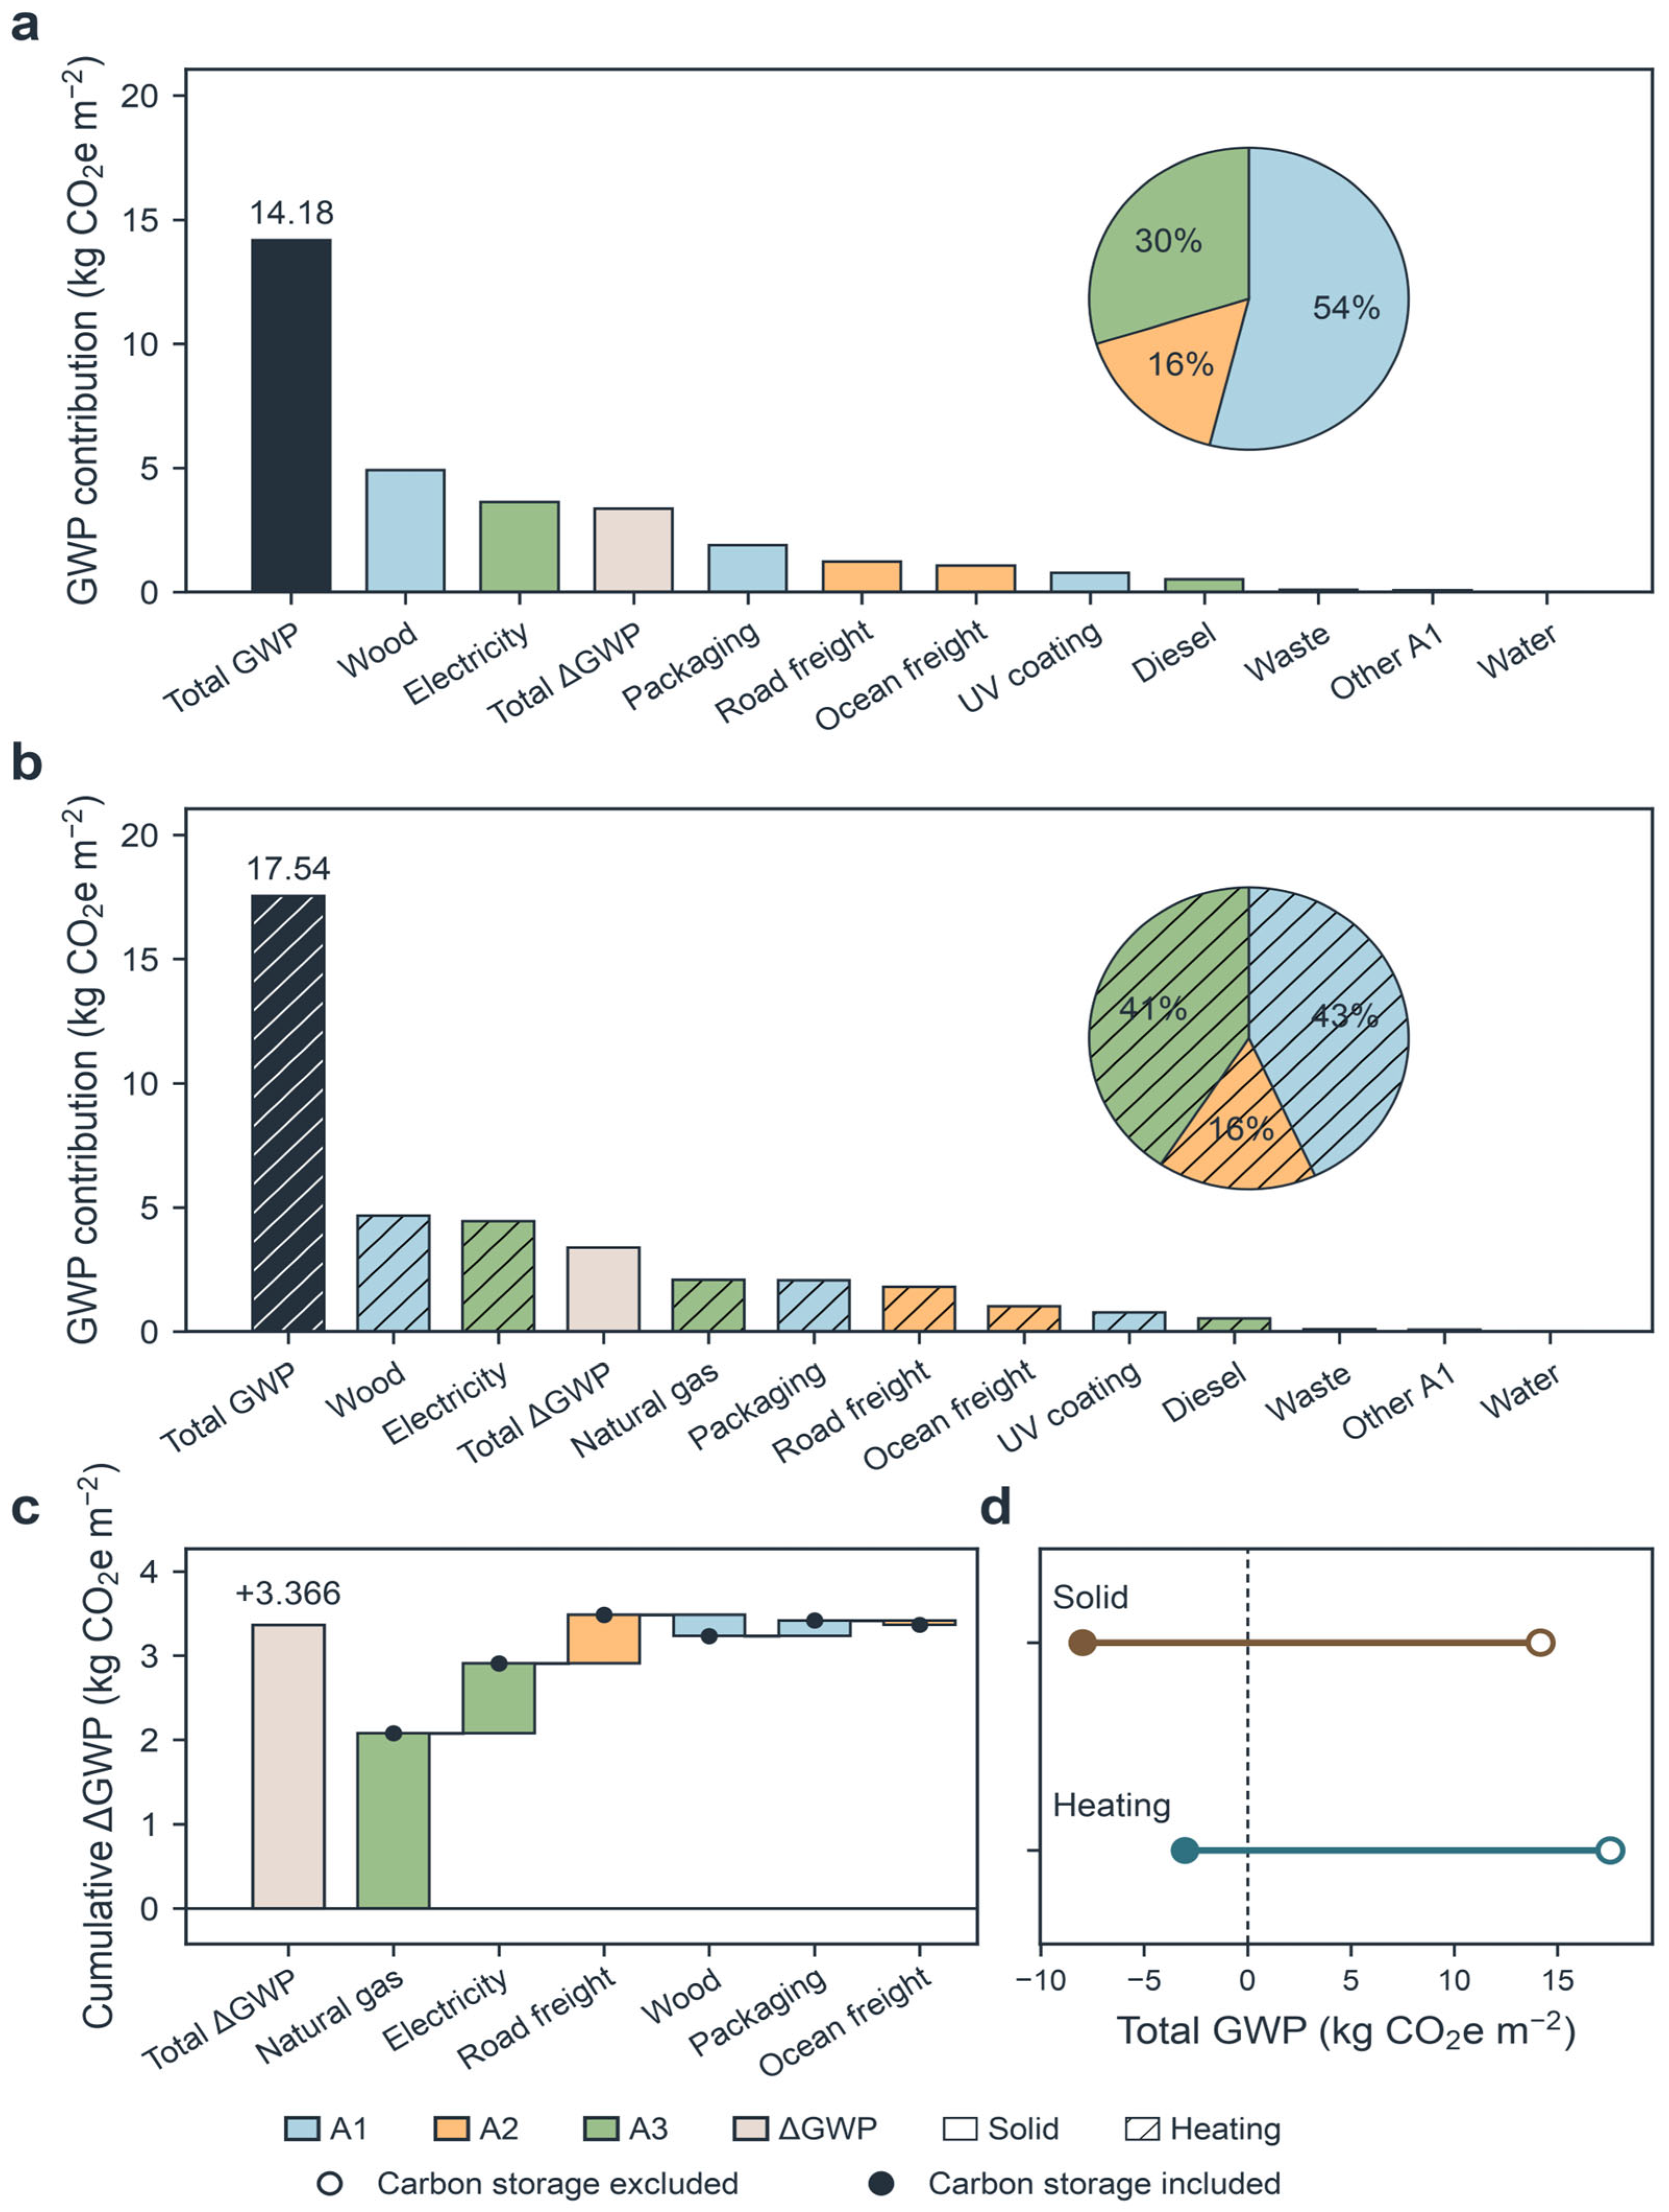
Under the common declared unit and cradle-to-gate boundary, baseline GWP100 was 14.18 kg CO2e m−2 for SWF and 17.54 kg CO2e m−2 for HWF (Figure 2a,b). The SWF stage contributions were 7.65 kg CO2e m−2 in A1, 2.30 in A2 and 4.23 in A3; the corresponding HWF contributions were 7.58, 2.82 and 7.14 kg CO2e m−2. At the process-group level, wood materials were the largest SWF contribution at 4.92 kg CO2e m−2 (34.70%), followed by manufacturing energy and utilities at 4.13 kg CO2e m−2 (29.15%). For HWF, manufacturing energy and utilities were the largest group at 7.04 kg CO2e m−2 (40.14%), while wood materials contributed 4.66 kg CO2e m−2 (26.59%). The largest structural difference between the configurations therefore occurred in A3 manufacturing energy.
Figure 2.
Baseline GWP100 and configuration-specific contribution decomposition. (a,b) A1, A2 and A3 contributions for SWF and HWF. (c) Signed HWF–SWF process differences closing to the total difference. (d) Ordinary A1–A3 totals and the separately reported wood-carbon-storage endpoints. Values are deterministic baselines.
The configuration-specific decomposition in Figure 2c shows the source of that difference. Relative to SWF, HWF used approximately 0.97 kg m−2 less wood, reducing the wood-material contribution by about 0.26 kg CO2e m−2. Smaller countervailing differences also occurred in ocean shipping, road freight and packaging. Within A3, HWF-specific heat-treatment natural gas contributed 2.08 kg CO2e m−2 and additional carbonization-kiln electricity contributed 0.83 kg CO2e m−2. Together, these activities contributed approximately 2.91 kg CO2e m−2, closely matching the 2.91 kg CO2e m−2 A3 increment. Using unrounded values, the A1, A2 and A3 differences closed to the total HWF–SWF difference of 3.37 kg CO2e m−2. HWF’s higher manufacturing-stage GWP100 was therefore primarily attributable to the additional heat-treatment process required for the underfloor-heating configuration rather than to a general increase in all shared plant activities.
Flooring LCAs differ in both assessment scope and the processes represented. The German study by Nebel et al. included installation, refurbishment and end-of-life energy recovery, extending beyond the present factory-gate boundary [1]. For four Chinese flooring types, Lao et al. reported that raw-material production contributed 46.4–72.1% of reported carbon emissions and manufacturing electricity 8.4–33% of reported carbon emissions [6]. A separate multi-impact assessment also identified woody raw materials and production electricity as environmental hotspots [7]. Product-level inventories for solid hardwood and prefinished engineered flooring in the eastern United States likewise separate material supply, manufacturing and transport within product-specific declared units [10,11]; differences in product construction, geography and boundary definitions limit direct numerical comparison. Coating formulation can alter environmental impacts [12], while a Brazilian lumber study highlighted substantial drying energy demand [13]. These studies provide context for the contribution structure observed here. The case-specific result is that additional HWF heat-treatment energy accounts for the principal manufacturing-stage increment between two configurations sharing most plant operations.
The wood-carbon-storage endpoint illustrates why cross-study accounting conventions need to remain explicit. Adding the separately calculated storage term to ordinary A1–A3 GWP100 produced endpoints of approximately −7.99 kg CO2e m−2 for SWF and −3.04 kg CO2e m−2 for HWF (Figure 2d). A recent Chinese flooring study reported approximately −8.50 kg CO2e m−2 for SWF [6], but the numerical proximity of these values does not establish equivalent accounting. System boundary, temporal treatment and downstream fate can materially alter the interpretation of biogenic carbon in forest-product LCAs [31,32,33,34,35]. For this reason, the configuration comparison in the present study is based on ordinary A1–A3 GWP100, with the storage endpoint reported separately.
3.2. Evidence Provenance and Data-Improvement Priorities
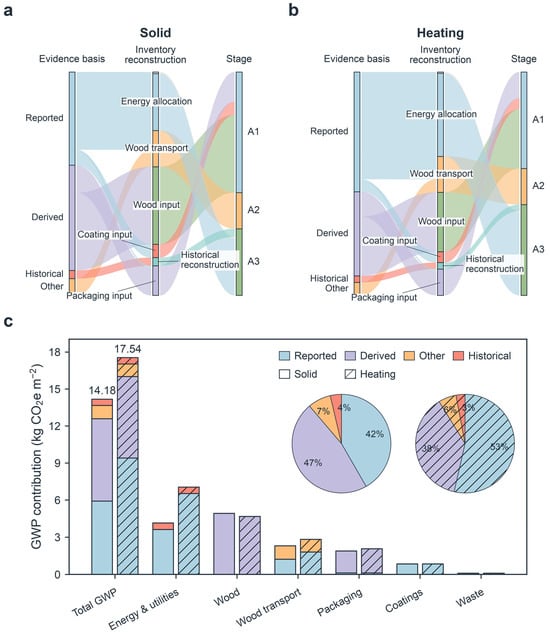
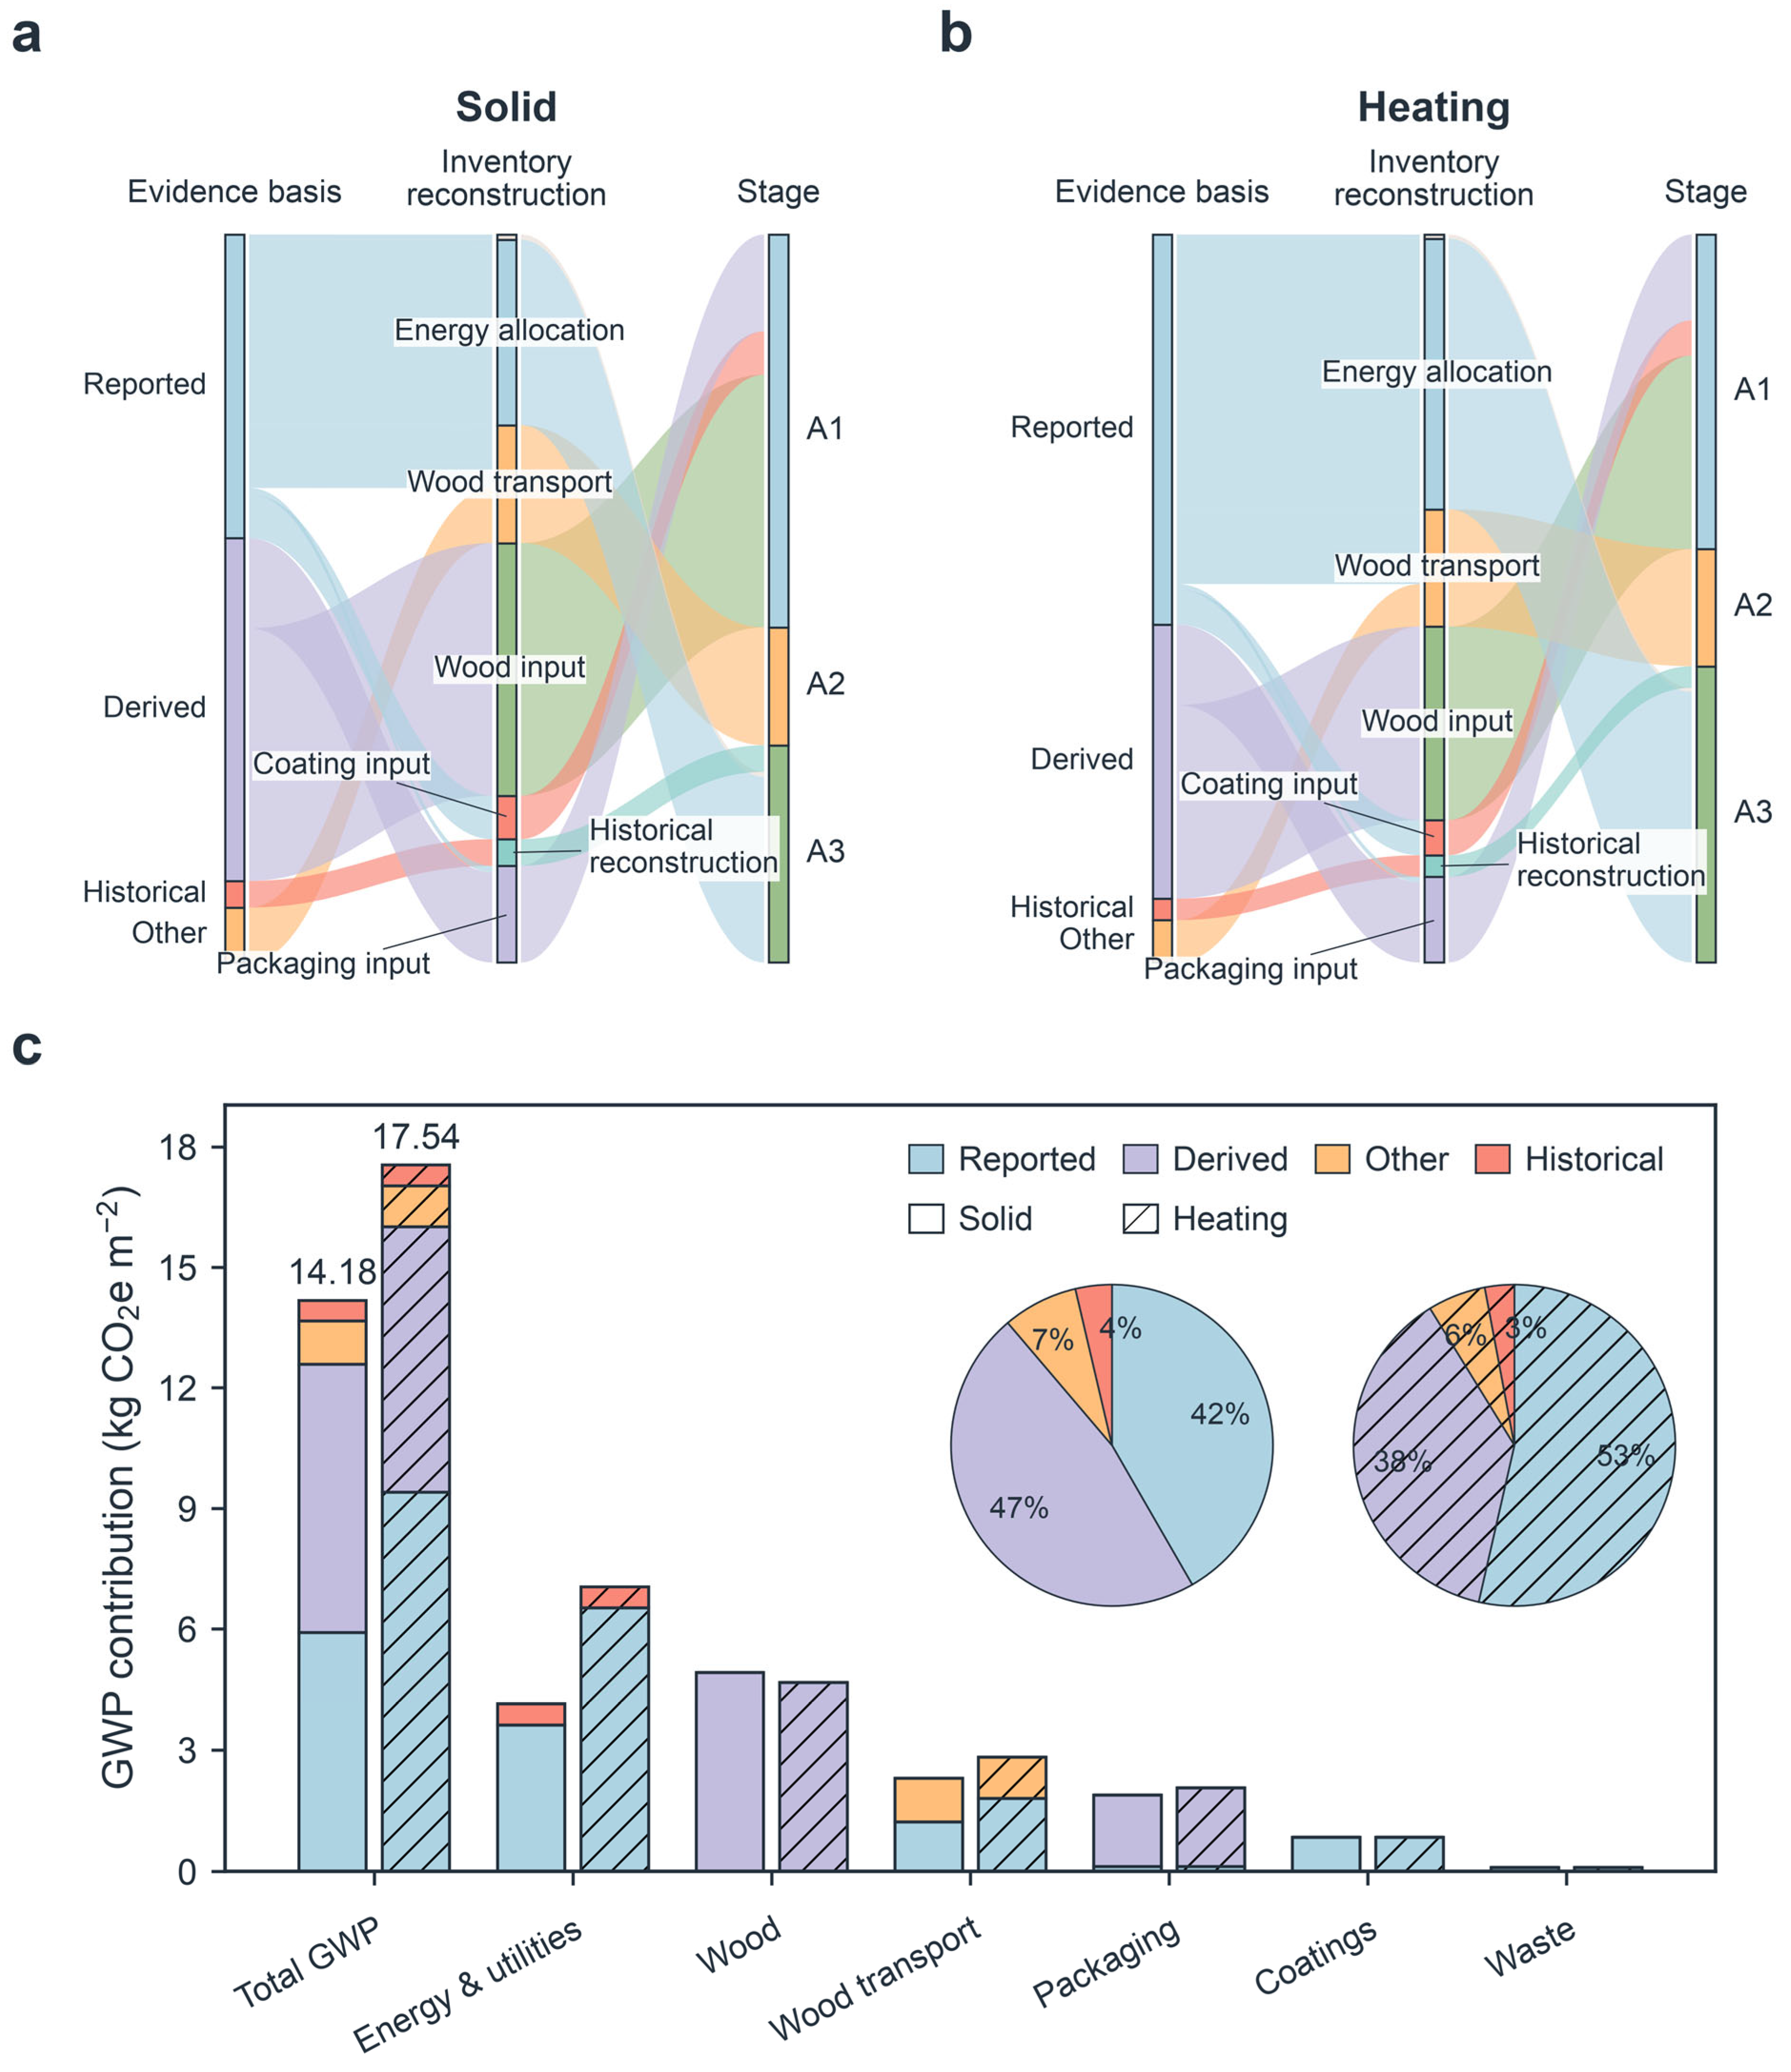
Reorganizing the same baseline contribution rows by evidence basis preserved each product total while showing how the calculated GWP100 entered the model (Figure 3). Reported, Derived, Historical record and Other evidence accounted for 41.69%, 47.10%, 3.66% and 7.55% of SWF GWP100, respectively; the corresponding HWF shares were 53.56%, 37.66%, 2.96% and 5.82%. Reported and Derived evidence together accounted for 88.79% of GWP100-weighted provenance for SWF and 91.22% for HWF. These percentages describe the evidence routes of calculated contributions and should not be interpreted as comparative data-quality scores.
Figure 3.
GWP100-weighted evidence provenance and aggregated process groups. (a,b) Within-product normalized compositions connecting evidence basis, inventory reconstruction and life-cycle stage for SWF and HWF. (c) Absolute GWP100 contributions by evidence basis and the six aggregated process groups. Evidence classes describe the source routes of calculated GWP100 contributions and are provenance categories rather than data-quality scores.
These provenance results identify records for which product-specific measurement, contemporaneous data or greater source specificity would provide more direct evidence. HWF’s larger Reported share includes directly assigned manufacturing energy records for its additional heat-treatment requirements, whereas the larger Derived share for SWF identifies a greater dependence on calculated or allocated quantities. High-GWP Reported records should retain attention to record coverage and background matching rather than being replaced solely because they are influential. High-GWP Derived records are stronger candidates for product-specific submetering, production logs or direct quantity records. Historical records, including the diesel entries used here, are candidates for replacement with contemporaneous enterprise data when available, while Other evidence records can be improved through greater process, geographic and technological specificity.
Existing LCI research addresses missing-data reconstruction [16], structured process-level data collection [18] and the selection of representative background datasets [17]. The GWP100-weighted provenance analysis links this source metadata to the enterprise records that contribute to the calculated footprint and identifies records for which measurement or source specificity can be improved. Foreground evidence and background matching remain separate: an improved enterprise measurement can update the activity without changing its background factor, while a more representative factor can be substituted without changing the provenance category of the original foreground record. Accordingly, the contribution-weighted provenance view complements formal data-quality assessment by prioritizing high-contribution enterprise records for improved measurement or source documentation according to the evidence route supporting each contribution (Supplementary Methods S3).
3.3. Paired Epistemic Uncertainty and Allocation Sensitivity
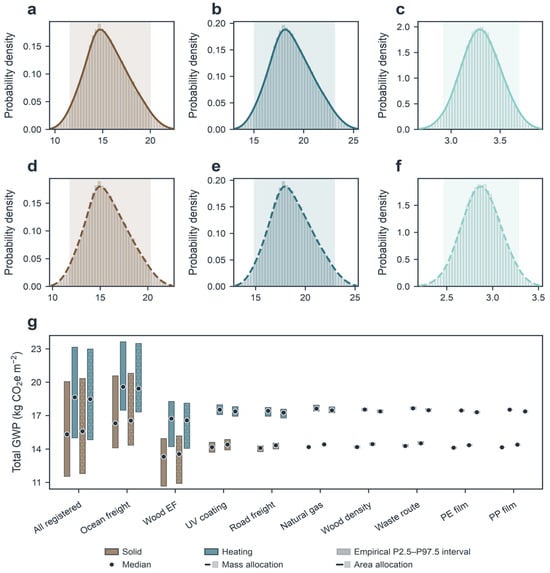
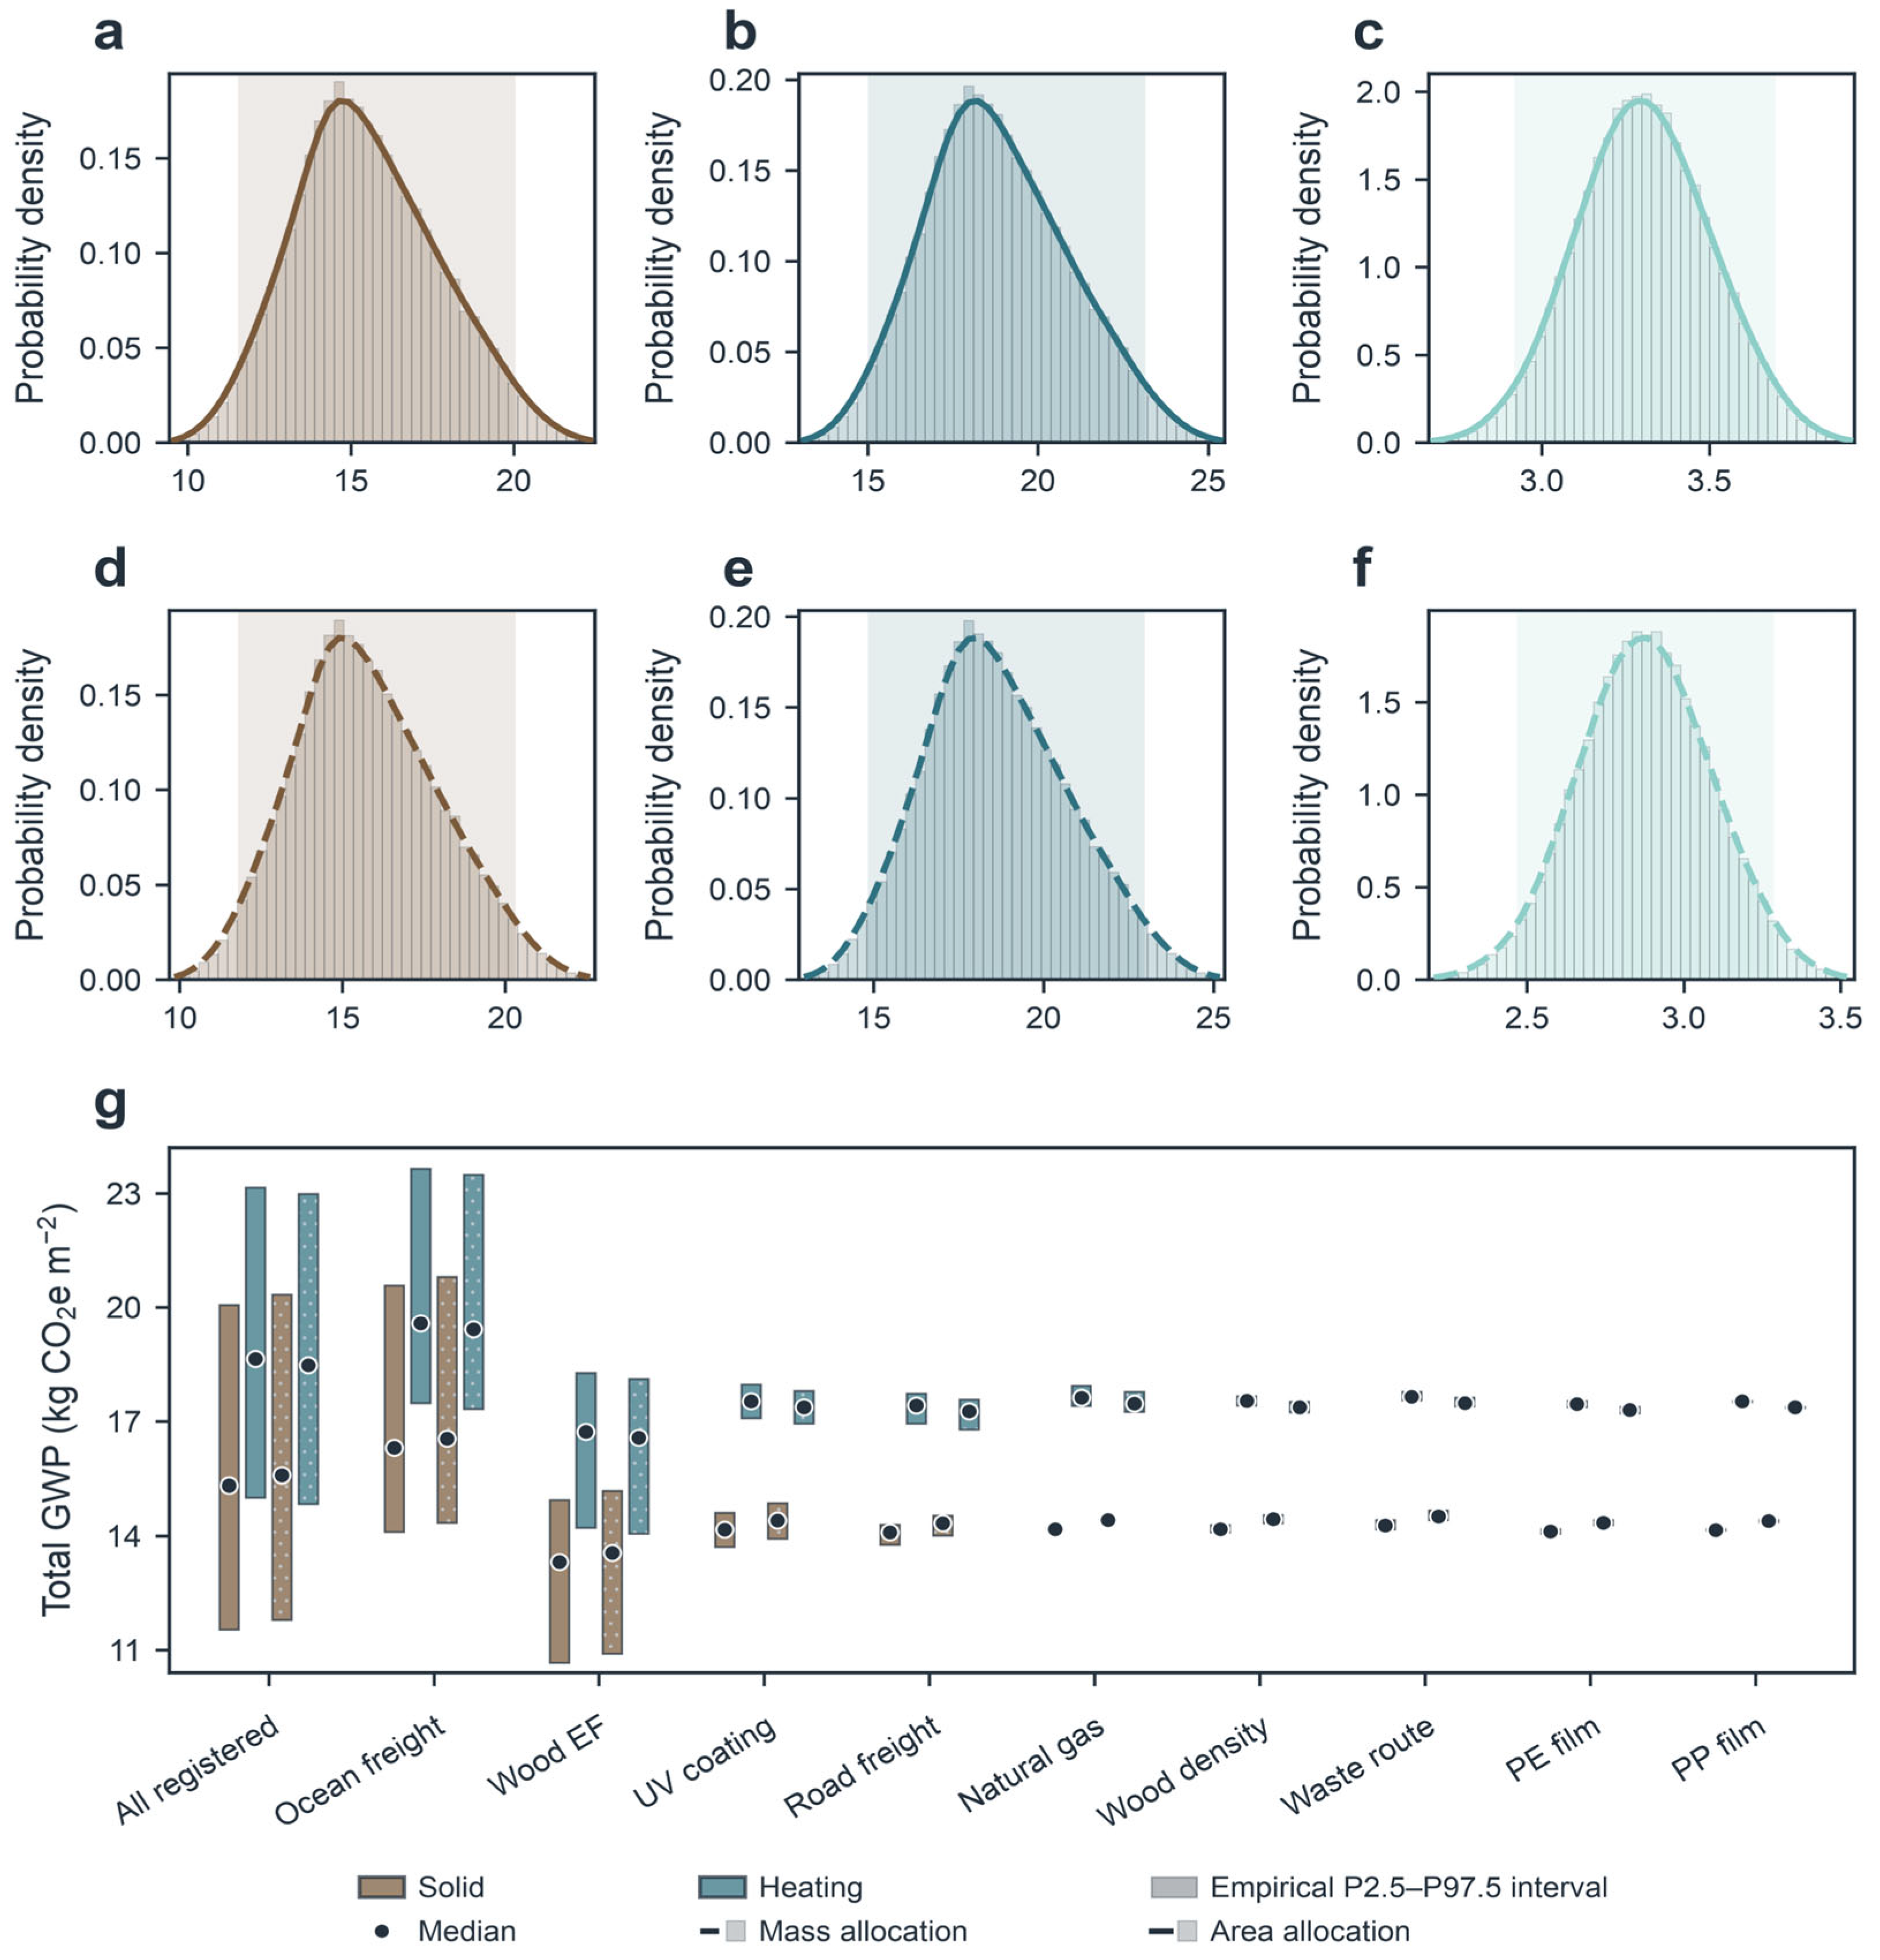
Paired epistemic uncertainty was propagated through 100,000 common draws (Figure 4). Under area allocation, median GWP100 was 15.32 kg CO2e m−2 for SWF and 18.64 kg CO2e m−2 for HWF, with empirical P2.5–P97.5 simulation intervals of 11.54–20.06 and 15.01–23.16, respectively. The paired HWF–SWF difference was 3.30 kg CO2e m−2 (2.92–3.70). Under mass allocation, the corresponding product medians were 15.58 (11.79–20.33) and 18.47 (14.84–22.99) kg CO2e m−2, and the paired difference was 2.88 kg CO2e m−2 (2.47–3.29). The difference was positive in every draw within the registered epistemic parameter model. Pairing retained common background-factor and wood-density movements in each draw, so the configuration difference was evaluated under the same sampled state rather than by comparing two independent marginal simulations [22].
Figure 4.
Paired epistemic uncertainty under area and mass allocation. (a,b) SWF and HWF total-GWP100 distributions under area allocation; (c) within-draw HWF–SWF difference under area allocation; (d,e) corresponding product distributions under mass allocation; (f) within-draw difference under mass allocation; (g) medians and empirical P2.5–P97.5 simulation intervals for joint and one-category-at-a-time diagnostic runs. Intervals show the 2.5th–97.5th percentiles within the registered epistemic parameter model and are not confidence intervals for the complete LCA.
The stage-resolved median difference remained concentrated in A3: 2.99 and 2.64 kg CO2e m−2 under area and mass allocation, respectively. The A1 and A2 median differences were −0.05 and 0.36 kg CO2e m−2 under area allocation and −0.13 and 0.36 kg CO2e m−2 under mass allocation. Using unrounded paired medians, changing the shared-activity allocation proxy from area to mass changed the HWF–SWF median separation by approximately 0.43 kg CO2e m−2. It did not change the main interpretation that the configuration difference was concentrated in manufacturing. This result is limited to the two physical proxies evaluated here and does not establish that area or mass is the unique causal basis for all shared plant services.
One-category-at-a-time diagnostic intervals were widest for ocean shipping, followed by the wood background factor, ultraviolet-curable coating factor and road freight. Monte Carlo propagation [21] and paired sampling [22] carried the specified input ranges into the reported results. The diagnostic ranges therefore identify influential inputs within the sampled model. Unregistered foreground variability, temporal variation, measurement error, alternative reconstruction assumptions and model-form uncertainty remain outside the analysis [20].
Comparable wood-product LCAs have identified raw-material, manufacturing energy and allocation assumptions as influential [6,7], while flooring coating studies have shown formulation-dependent environmental effects [12] and Monte Carlo analysis of a wood-product system has shown that uncertainty patterns depend on system boundary and parameterization [36]. In the present analysis, ocean shipping, the wood background factor, the UV-coating factor and road freight produced the widest diagnostic intervals, indicating a stronger influence of supply-chain and background-factor variability in this enterprise case. A more detailed comparison with previous wood-product LCA uncertainty studies is provided in Supplementary Methods S4.
3.4. Deterministic Mitigation Potentials and Residual Contributions
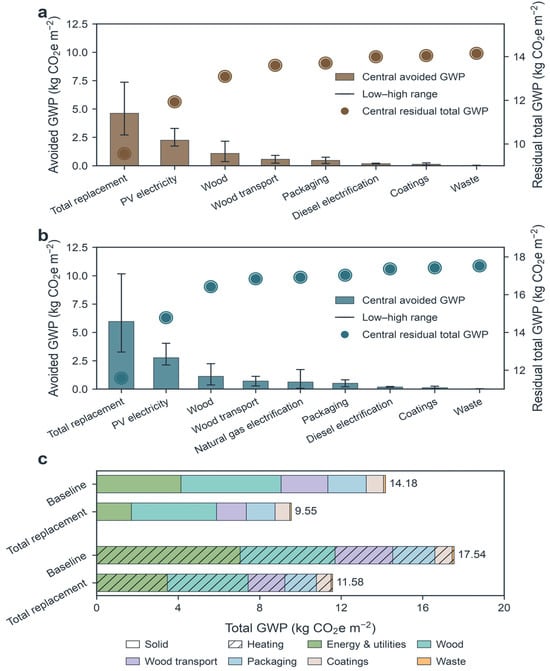
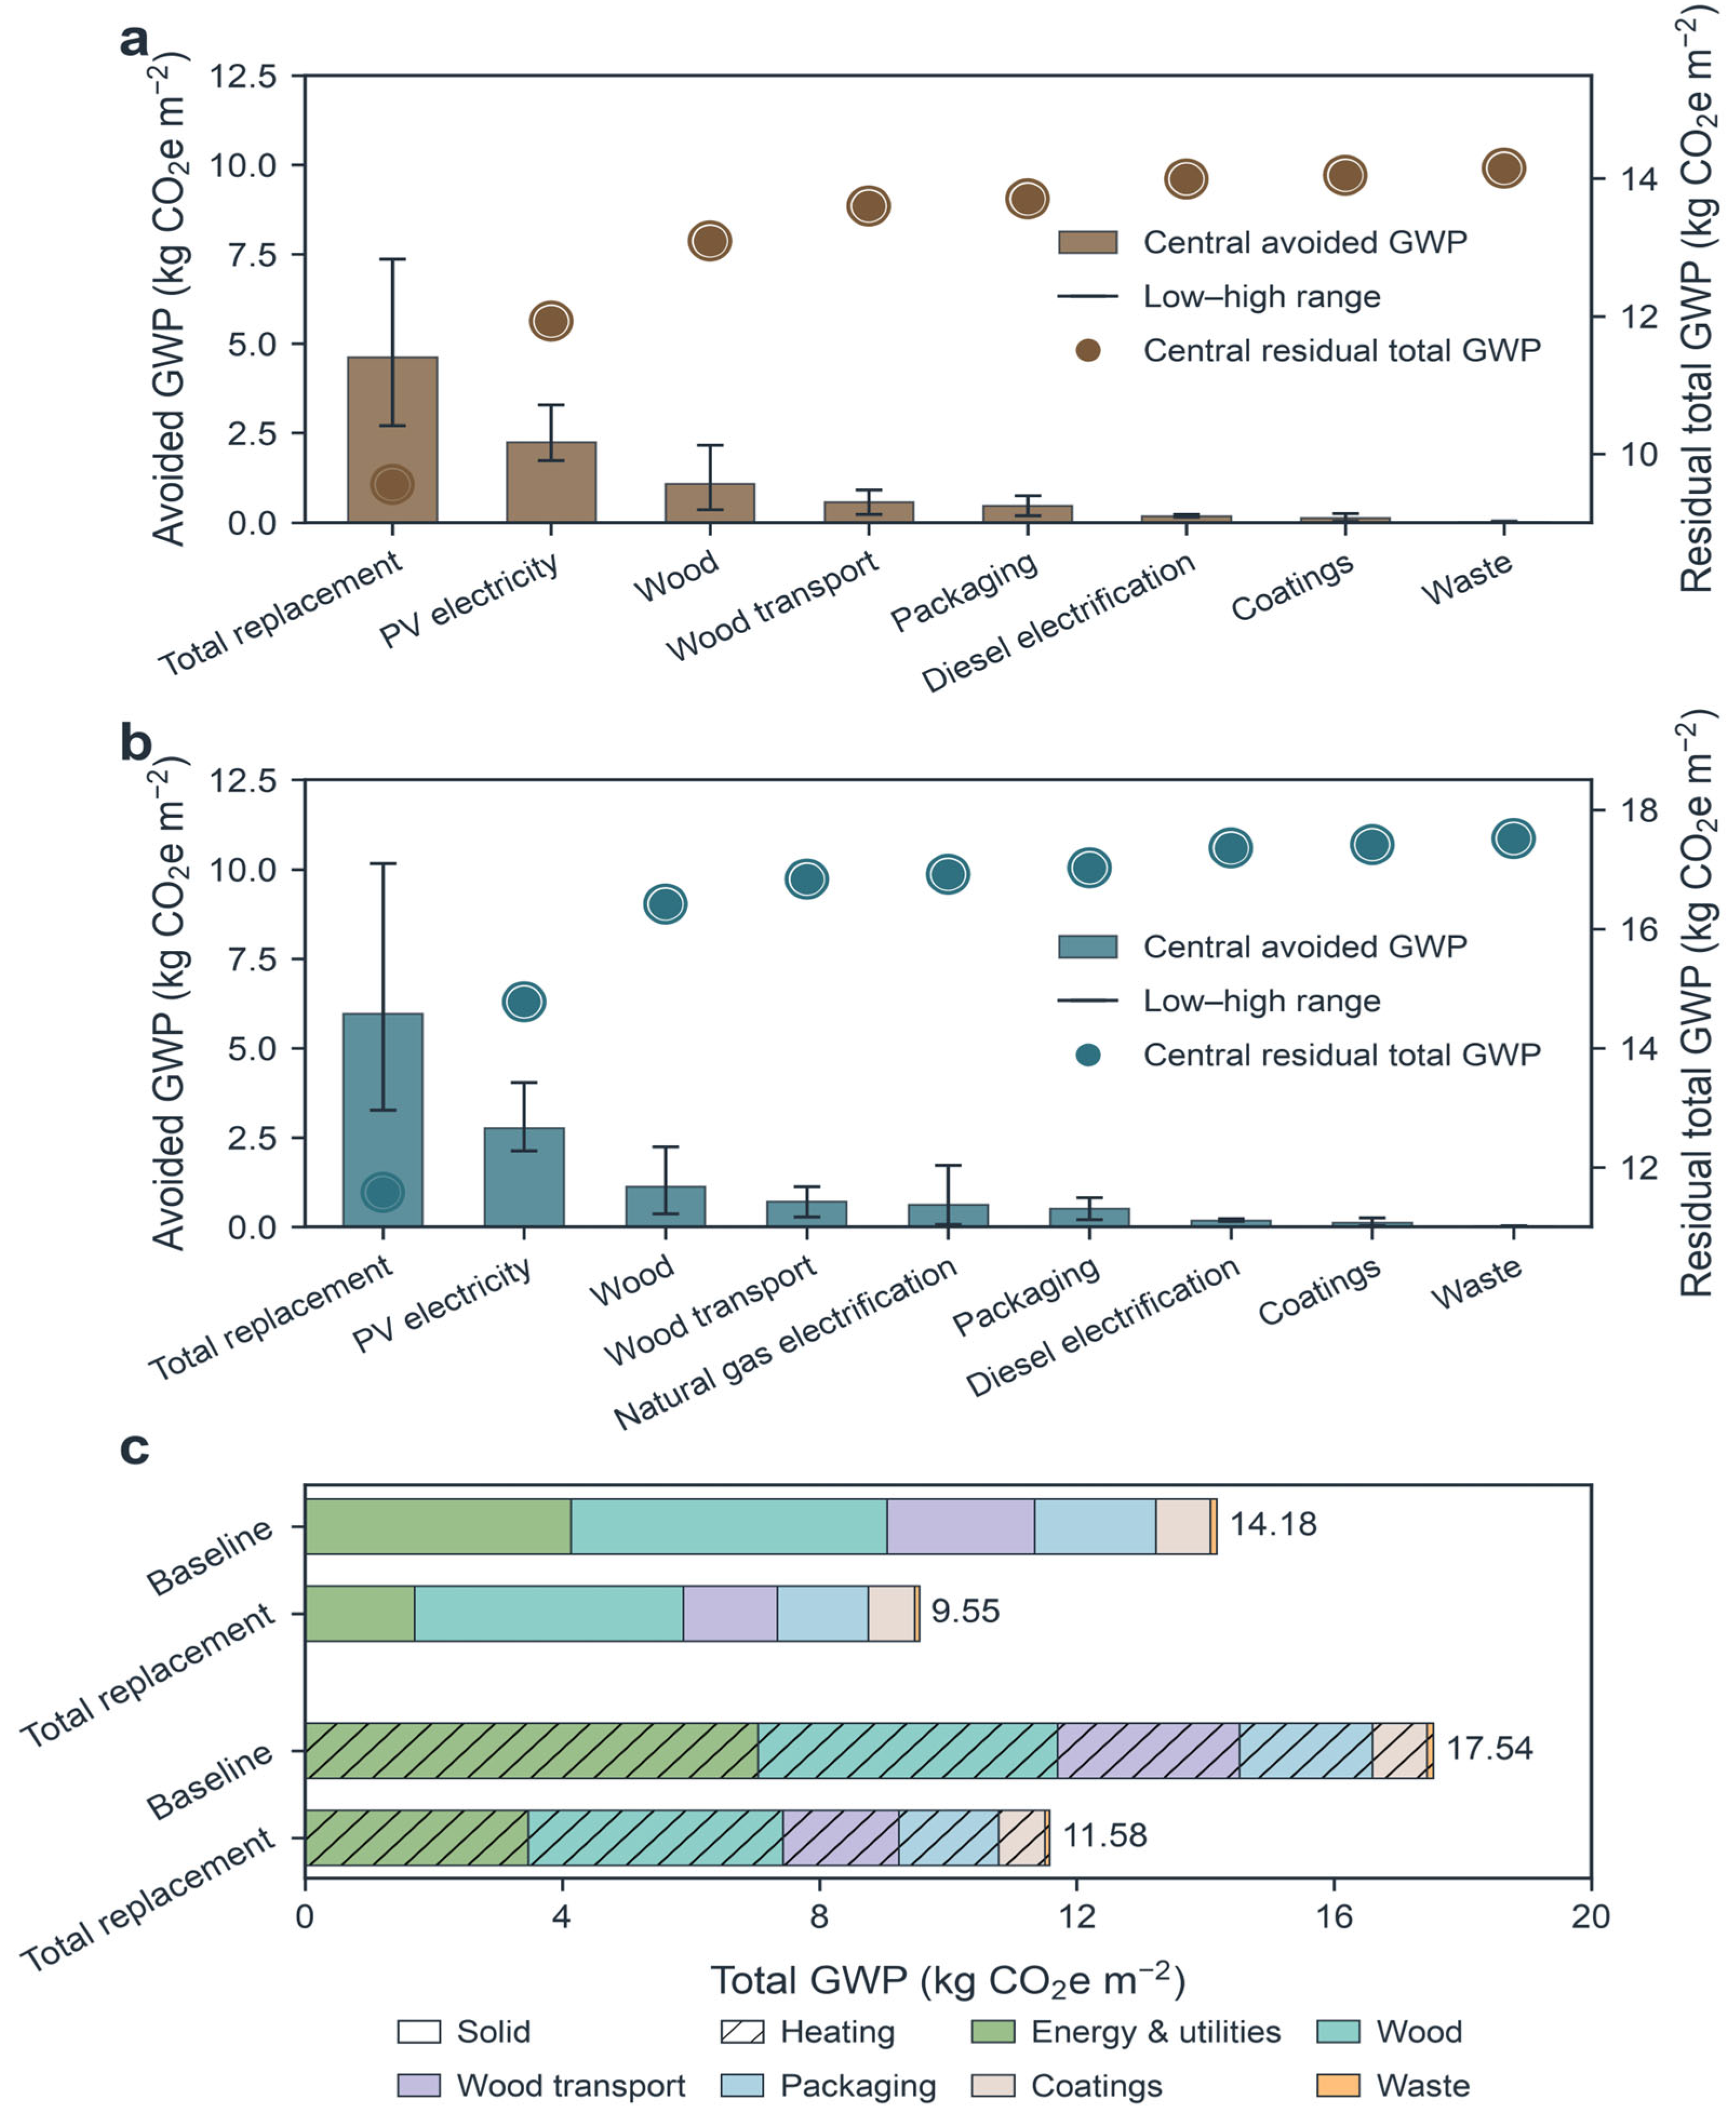
Deterministic interventions were screened against the same baseline contribution rows (Figure 5). Single measures were calculated independently and are interpreted as conditional GWP100-reduction potentials rather than an implementation sequence. PV electricity for existing electricity was the largest central single-measure reduction in both configurations, avoiding approximately 2.25 kg CO2e m−2 for SWF and 2.76 kg CO2e m−2 for HWF. For SWF, the next largest central reductions were wood materials (0.74), wood transport (0.57) and packaging (0.47 kg CO2e m−2), followed by on-site diesel electrification (0.18), coatings and auxiliaries (0.13) and waste treatment (0.02). For HWF, wood transport (0.71), wood materials (0.70), natural-gas heat electrification (0.62) and packaging (0.52 kg CO2e m−2) were the next largest modeled reductions. The natural-gas electrification result was calculated using the registered useful-service-equivalence conversion.
Figure 5.
Deterministic mitigation scenarios and residual GWP100. (a,b) Independent SWF and HWF mitigation measures reported as avoided GWP100 under low, central and high deterministic engineering settings; HWF includes natural-gas heat electrification. Total replacement is treated separately as a combined scenario. (c) Baseline and central Total replacement GWP100 contributions decomposed into the six process groups. Low–high spans represent deterministic scenario settings and are not statistical uncertainty intervals.
The central Total replacement scenario combined same-tier PV, applicable fuel replacements and the five non-energy measures using the interaction rules defined in Section 2.4. It avoided 4.62 kg CO2e m−2 for SWF and 5.96 kg CO2e m−2 for HWF, leaving residual totals of 9.55 and 11.58 kg CO2e m−2, respectively. These values correspond to reductions of 32.61% and 33.99% from the two baselines. Because wood-material reduction first changed the associated transport activity and the additional transport measure was applied to the remaining transport, Total replacement was recalculated at the activity level rather than obtained by simply adding avoided GWP100 from the independent measures.
Wood materials remained the largest residual group under the central Total replacement scenario, at 4.18 kg CO2e m−2 for SWF and 3.97 kg CO2e m−2 for HWF. Manufacturing energy and utilities declined to 1.70 and 3.47 kg CO2e m−2, respectively, and wood transport to 1.46 and 1.80 kg CO2e m−2. Manufacturing energy remained higher for HWF because the modeled interventions changed the energy supply while retaining its additional heat-treatment service. The residual structure identifies contributions remaining under the specified scenario assumptions.
Previous flooring studies support examining cleaner electricity supply [6] and reduced wood consumption [7], while manufacturing evidence shows that production yield can be improved [14]. Freight impacts warrant attention to transport mode and assessment boundary [15], and coating LCAs show formulation-dependent environmental trade-offs [12]. These findings motivate the intervention categories screened here but do not validate the assumed reduction percentages or simultaneous implementation. The modeled values quantify conditional carbon-reduction potentials. Costs, infrastructure, equipment compatibility, production-quality constraints and operational feasibility require separate evaluation.
4. Conclusions
This single-enterprise study compared the cradle-to-gate (A1–A3) GWP100 of two solid wood flooring manufacturing configurations under the same declared unit and background system. Baseline GWP100 was 14.18 kg CO2e m−2 for SWF and 17.54 kg CO2e m−2 for HWF. The additional HWF heat-treatment activities contributed approximately 2.91 kg CO2e m−2 and explained most of the A3 increment, identifying configuration-specific manufacturing energy as the main source of the product difference. GWP100-weighted evidence provenance linked the dominant contributions to their enterprise records and identified records where improved measurement or source specificity would strengthen traceability. Within the registered epistemic parameter model, the paired HWF–SWF median difference remained positive under both area and mass allocation, with A3 remaining the dominant component. The central combined mitigation scenario reduced baseline GWP100 by 32.61% for SWF and 33.99% for HWF, while wood materials remained the largest residual process group. These results are specific to one enterprise and an A1–A3 boundary, with the foreground inventory primarily representing April 2026 production. The uncertainty analysis covers registered background factors and wood-density parameters, while mass allocation provides a sensitivity case for shared activities. The deterministic mitigation scenarios quantify GWP100-reduction potentials without evaluating costs, infrastructure, technological compatibility or operational feasibility.
Supplementary Materials
The following supporting information can be downloaded at https://www.mdpi.com/article/10.3390/en19204851/s1, Supplementary Methods S1–S5; Table S1: Draw-count convergence of the paired epistemic uncertainty analysis; Figure S1: Simplified manufacturing routes of solid wood flooring (SWF) and solid wood flooring for underfloor heating (HWF); Figure S2: Mass-allocated baseline GWP100 and process contributions; Figure S3: Mass-allocated GWP100-weighted evidence provenance; Figure S4: Mass-allocated deterministic mitigation screening; Figure S5: Effect of allocation choice on baseline GWP100; Figure S6: Category-specific uncertainty distributions for SWF under area allocation; Figure S7: Category-specific uncertainty distributions for HWF under area allocation; Figure S8: Category-specific uncertainty distributions for SWF under mass allocation; Figure S9: Category-specific uncertainty distributions for HWF under mass allocation. The corresponding Source Data file is also provided. References [37,38,39,40] are cited in the Supplementary Information.
Author Contributions
D.X.: Methodology, software, formal analysis, writing—original draft. J.J., Y.Q., C.W., P.Z., M.S. and X.H.: data curation, writing—review and editing. R.L.: conceptualization, supervision, writing—review and editing. All authors have read and agreed to the published version of the manuscript.
Funding
This research was funded by the Science and Technology Program of the Zhejiang Provincial Administration for Market Regulation (JB2026021).
Data Availability Statement
The data supporting this study are provided in the Supplementary Information and accompanying Source Data files.
Acknowledgments
The authors acknowledge the support provided by the Big Data Computing Center and the Center for Fundamental and Interdisciplinary Sciences of Southeast University.
Conflicts of Interest
The authors declare no conflict of interest.
References
- Nebel, B.; Zimmer, B.; Wegener, G. Life Cycle Assessment of Wood Floor Coverings: A Representative Study for the German Flooring Industry. Int. J. Life Cycle Assess. 2006, 11, 172–182. [Google Scholar] [CrossRef] [Scilit]
- Seppälä, J.; Heinonen, T.; Pukkala, T.; Kilpeläinen, A.; Mattila, T.; Myllyviita, T.; Asikainen, A.; Peltola, H. Effect of increased wood harvesting and utilization on required greenhouse gas displacement factors of wood-based products and fuels. J. Environ. Manag. 2019, 247, 580–587. [Google Scholar] [CrossRef] [Scilit]
- Petersen, A.K.; Solberg, B. Greenhouse Gas Emissions and Costs over the Life Cycle of Wood and Alternative Flooring Materials. Clim. Change 2004, 64, 143–167. [Google Scholar] [CrossRef] [Scilit]
- Sahoo, K.; Bergman, R.; Alanya-Rosenbaum, S.; Gu, H.; Liang, S. Life Cycle Assessment of Forest-Based Products: A Review. Sustainability 2019, 11, 4722. [Google Scholar] [CrossRef] [Scilit]
- Werner, F.; Richter, K. Wooden building products in comparative LCA. Int. J. Life Cycle Assess. 2007, 12, 470–479. [Google Scholar] [CrossRef] [Scilit]
- Lao, W.-L.; Han, Y.-M.; You, J. Carbon footprint as an environmental indicator for wood flooring industry in China. Case Stud. Constr. Mater. 2024, 21, e03594. [Google Scholar] [CrossRef] [Scilit]
- Lao, W.-L. Assessing environmental burdens of China’s wooden flooring production based on life-cycle assessment. J. Clean. Prod. 2024, 446, 141341. [Google Scholar] [CrossRef] [Scilit]
- Lao, W.-L.; Li, W.-G. Comparative carbon footprint estimation of three types of wooden door: A case study from China. J. Clean. Prod. 2023, 433, 139745. [Google Scholar] [CrossRef] [Scilit]
- Lao, W.-L.; Chang, L. Greenhouse gas footprint assessment of wood-based panel production in China. J. Clean. Prod. 2023, 389, 136064. [Google Scholar] [CrossRef] [Scilit]
- Heidari, M.D.; Bergman, R.; Salazar, J.; Hubbard, S.S.; Bowe, S.A. Life-Cycle Assessment of Solid Hardwood Flooring in the Eastern United States; FPL-RP-717; U.S. Department of Agriculture, Forest Service, Forest Products Laboratory: Madison, WI, USA, 2023. [Google Scholar] [CrossRef] [Scilit]
- Heidari, M.D.; Bergman, R.; Salazar, J.; Hubbard, S.S.; Bowe, S.A. Life-Cycle Assessment of Prefinished Engineered Wood Flooring in the Eastern United States; FPL-RP-718; U.S. Department of Agriculture, Forest Service, Forest Products Laboratory: Madison, WI, USA, 2023. [Google Scholar] [CrossRef] [Scilit]
- Montazeri, M.; Eckelman, M.J. Life cycle assessment of UV-curable bio-based wood flooring coatings. J. Clean. Prod. 2018, 192, 932–939. [Google Scholar] [CrossRef] [Scilit]
- Punhagui, K.R.G.; John, V.M. Carbon dioxide emissions, embodied energy, material use efficiency of lumber manufactured from planted forest in Brazil. J. Build. Eng. 2022, 52, 104349. [Google Scholar] [CrossRef] [Scilit]
- Uddin, M.M. Improving Product Quality and Production Yield in Wood Flooring Manufacturing Using Basic Quality Tools. Int. J. Qual. Res. 2021, 15, 155–170. [Google Scholar] [CrossRef] [Scilit]
- Horvath, A. Environmental Assessment of Freight Transportation in the U.S. Int. J. Life Cycle Assess. 2006, 11, 229–239. [Google Scholar] [CrossRef] [Scilit]
- Zargar, S.; Yao, Y.; Tu, Q. A review of inventory modeling methods for missing data in life cycle assessment. J. Ind. Ecol. 2022, 26, 1676–1689. [Google Scholar] [CrossRef] [Scilit]
- Meron, N.; Blass, V.; Thoma, G. Selection of the most appropriate life cycle inventory dataset: New selection proxy methodology and case study application. Int. J. Life Cycle Assess. 2020, 25, 771–783. [Google Scholar] [CrossRef] [Scilit]
- Saavedra-Rubio, K.; Thonemann, N.; Crenna, E.; Lemoine, B.; Caliandro, P.; Laurent, A. Stepwise guidance for data collection in the life cycle inventory (LCI) phase: Building technology-related LCI blocks. J. Clean. Prod. 2022, 366, 132903. [Google Scholar] [CrossRef] [Scilit]
- Shamsuzzoha, A.; Mayanti, B.; Helo, P. Parametric life-cycle assessment for configurable products in high-mix manufacturing. J. Environ. Manag. 2026, 413, 130312. [Google Scholar] [CrossRef] [Scilit]
- Igos, E.; Benetto, E.; Meyer, R.; Baustert, P.; Othoniel, B. How to treat uncertainties in life cycle assessment studies? Int. J. Life Cycle Assess. 2019, 24, 794–807. [Google Scholar] [CrossRef] [Scilit]
- Hung, M.-L.; Ma, H.-W. Quantifying system uncertainty of life cycle assessment based on Monte Carlo simulation. Int. J. Life Cycle Assess. 2009, 14, 19–27. [Google Scholar] [CrossRef] [Scilit]
- Henriksson, P.J.G.; Heijungs, R.; Dao, H.M.; Phan, L.T.; de Snoo, G.R.; Guinée, J.B. Product Carbon Footprints and Their Uncertainties in Comparative Decision Contexts. PLoS ONE 2015, 10, e0121221. [Google Scholar] [CrossRef] [Scilit]
- ISO 14040:2006; Environmental Management—Life Cycle Assessment—Principles and Framework. International Organization for Standardization: Geneva, Switzerland, 2006. Available online: https://www.iso.org/standard/37456.html (accessed on 3 October 2026).
- ISO 14044:2006; Environmental Management—Life Cycle Assessment—Requirements and Guidelines. International Organization for Standardization: Geneva, Switzerland, 2006. Available online: https://www.iso.org/standard/38498.html (accessed on 3 October 2026).
- ISO 14067:2018; Greenhouse gases—Carbon Footprint of Products—Requirements and Guidelines for Quantification. International Organization for Standardization: Geneva, Switzerland, 2018. Available online: https://www.iso.org/standard/71206.html (accessed on 3 October 2026).
- T/CBMF 280-2024; Greenhouse Gases—Quantification Methods and Requirements for Product Carbon Footprint—Wood-Based Panels and Wooden Flooring. China Building Materials Federation: Beijing, China, 2024.
- Hischier, R.; Althaus, H.-J.; Werner, F. Developments in Wood and Packaging Materials Life Cycle Inventories in ecoinvent. Int. J. Life Cycle Assess. 2005, 10, 50–58. [Google Scholar] [CrossRef] [Scilit][Green Version]
- Ministry of Ecology and Environment of the People’s Republic of China; National Bureau of Statistics of China. National Energy Administration Announcement on the 2024 National Electricity Carbon Footprint Factors. 2025. Available online: https://www.mee.gov.cn/xxgk2018/xxgk/xxgk01/202510/t20251024_1130734.html (accessed on 3 October 2026).
- Weidema, B.P.; Wesnæs, M.S. Data quality management for life cycle inventories—An example of using data quality indicators. J. Clean. Prod. 1996, 4, 167–174. [Google Scholar] [CrossRef] [Scilit]
- Edelen, A.; Ingwersen, W.W. The creation, management, and use of data quality information for life cycle assessment. Int. J. Life Cycle Assess. 2018, 23, 759–772. [Google Scholar] [CrossRef] [Scilit]
- Peñaloza, D.; Røyne, F.; Sandin, G.; Svanström, M.; Erlandsson, M. The influence of system boundaries and baseline in climate impact assessment of forest products. Int. J. Life Cycle Assess. 2019, 24, 160–176. [Google Scholar] [CrossRef] [Scilit]
- Leinonen, I. A general framework for including biogenic carbon emissions and removals in the life cycle assessments for forestry products. Int. J. Life Cycle Assess. 2022, 27, 1038–1043. [Google Scholar] [CrossRef] [Scilit]
- Levasseur, A.; Lesage, P.; Margni, M.; Deschênes, L.; Samson, R. Considering Time in LCA: Dynamic LCA and Its Application to Global Warming Impact Assessments. Environ. Sci. Technol. 2010, 44, 3169–3174. [Google Scholar] [CrossRef] [Scilit]
- Guest, G.; Bright, R.M.; Cherubini, F.; Strømman, A.H. Consistent quantification of climate impacts due to biogenic carbon storage across a range of bio-product systems. Environ. Impact Assess. Rev. 2013, 43, 21–30. [Google Scholar] [CrossRef] [Scilit]
- Garcia, R.; Alvarenga, R.A.F.; Huysveld, S.; Dewulf, J.; Allacker, K. Accounting for biogenic carbon and end-of-life allocation in life cycle assessment of multi-output wood cascade systems. J. Clean. Prod. 2020, 275, 122795. [Google Scholar] [CrossRef] [Scilit]
- Lan, K.; Kelley, S.S.; Nepal, P.; Yao, Y. Dynamic life cycle carbon and energy analysis for cross-laminated timber in the Southeastern United States. Environ. Res. Lett. 2020, 15, 124036. [Google Scholar] [CrossRef] [Scilit]
- Rudd, L.; Kulshreshtha, S.; Belcher, K.; Amichev, B. Carbon life cycle assessment of shelterbelts in Saskatchewan, Canada. J. Environ. Manag. 2021, 297, 113400. [Google Scholar] [CrossRef] [Scilit]
- Guo, J.; Li, R.; Zhang, R.; Qi, J.; Li, N.; Xu, C.; Chiu, A.S.F.; Wang, Y.; Tanikawa, H.; Xu, M. Shedding light on the shadows: Transparency challenge in background life cycle inventory data. J. Ind. Ecol. 2025, 29, 766–776. [Google Scholar] [CrossRef] [Scilit]
- An, J.; Wu, F.; Wang, D.; You, J. Estimated material metabolism and life cycle greenhouse gas emission of major plastics in China: A commercial sector-scale perspective. Resour. Conserv. Recycl. 2022, 180, 106161. [Google Scholar] [CrossRef] [Scilit]
- Zeilerbauer, L.; Fischer, J.; Fazeni-Fraisl, K.; Mager, M.; Lindorfer, J.; Paulik, C. Life cycle assessment of mechanical recycling of low-density polyethylene into film products: Towards the need for life cycle thinking in product design. Resour. Conserv. Recycl. 2024, 209, 107807. [Google Scholar] [CrossRef] [Scilit]

Disclaimer/Publisher’s Note: The statements, opinions and data contained in all publications are solely those of the individual author(s) and contributor(s) and not of MDPI and/or the editor(s). MDPI and/or the editor(s) disclaim responsibility for any injury to people or property resulting from any ideas, methods, instructions or products referred to in the content. |
© 2026 by the authors. Licensee MDPI, Basel, Switzerland. This article is an open access article distributed under the terms and conditions of the Creative Commons Attribution (CC BY) license.