


Abstract
Partial shading creates multiple peaks in the power–voltage characteristic of a photovoltaic (PV) array, making global maximum power point tracking (MPPT) difficult. This study investigates ICS-Synergetic Control, an event-triggered global–local MPPT framework for a series-connected PV array and Boost converter, in which an improved cuckoo search evaluates candidate peak regions, synergetic control regulates the accepted operating point, and a locking mechanism limits unnecessary perturbations. Two sensing configurations are considered: ICS-SC-I uses module-level irradiance, whereas ICS-SC-E uses electrical measurements only. The controllers are compared with P&O, INC, CSA, GWO, PSO, and NSPSO-INC in MATLAB/Simulink switched-model simulations using a four-stage irradiance profile. With module-level irradiance available to all controllers, ICS-SC-I achieved a mean trajectory energy utilization of 96.992% over 30 repeated runs and satisfied a sustained ±2% GMPP criterion in all 120 stage events. Under the information-matched electrical-only condition, ICS-SC-E captured slightly less energy than PSO and NSPSO-INC, indicating that the irradiance information contributes substantially to this result. Module-removal tests identified peak-family prediction and search scheduling as the main determinants of transient loss. StarSim hardware-in-the-loop tests of the proposed controller and NSPSO-INC confirmed real-time execution and post-transition recovery under the evaluated conditions.
1. Introduction
Against the background of continuously growing global energy demand and intensifying pressure for carbon reduction, the development and utilization of renewable energy has become a central direction of the energy transition worldwide. Solar energy has attracted considerable attention owing to its abundance, cleanliness, and suitability for distributed deployment, and photovoltaic (PV) generation has consequently been applied to rooftops, building façades, vehicle-mounted systems, and distributed loads. However, PV systems exhibit strongly nonlinear output characteristics, and their generation efficiency is highly susceptible to external meteorological conditions such as irradiance and temperature, which substantially limits the practical utilization of PV generation [1].
Among the many influencing factors, partial shading is particularly severe. When moving clouds, building obstructions, dust accumulation, or module aging cause the components within a single series string to receive different irradiance levels, the bypass diodes of the shaded components conduct [2], and the effective electrical path of the string changes with the current. As a result, the power–voltage characteristic of the array degenerates from a single peak into a multimodal form containing several local peaks and a unique global peak [3]. In this case, if regulation relies only on local information near the current operating point, the controller can hardly determine whether a higher power peak exists elsewhere. Accurately and rapidly capturing the global maximum power point on such a multimodal characteristic is therefore the key to improving the generation efficiency of PV systems. To this end, PV systems are usually equipped with a maximum power point tracking controller, which regulates the duty cycle of a DC–DC converter so that the array operates continuously near the maximum power point.
To address the maximum power point tracking problem, various control methods have been proposed [4]. Perturb-and-observe and incremental-conductance methods are structurally simple and easy to implement, and they track the maximum power point effectively under uniform irradiance. Femia et al. [5] optimized the perturbation step size and sampling mechanism of the perturb-and-observe method to reduce steady-state oscillation, whereas Safari and Mekhilef [6] realized direct duty-cycle control of the incremental-conductance method based on a Ćuk converter. Under partial shading, however, the convergence conditions of both methods remain local; they are prone to settling near a local peak and producing steady-state oscillation, and they respond slowly when irradiance changes rapidly. To mitigate these issues, some studies have introduced variable-step-size mechanisms to balance tracking speed and accuracy; although performance is improved to some extent, the oscillation problem is still not effectively suppressed, and the algorithmic complexity increases accordingly.
Recent studies have therefore increasingly combined automated decision mechanisms with intelligent optimization methods for PV maximum power point tracking. Automated MPPT strategies can detect changes in operating conditions, schedule global searches, and switch between global exploration and local regulation according to measured electrical signals and, in some cases, irradiance information. Intelligent approaches, including adaptive optimization, artificial-intelligence-based methods, and nature-inspired metaheuristics, have been applied to locate global power peaks on multimodal PV characteristics and improve energy extraction under partial-shading conditions [4,7,8]. Their practical performance depends on the sensing configuration, search scheduling, computational burden, and the ability to distinguish actual irradiance transitions from normal steady-state fluctuations. These considerations have encouraged the development of event-triggered global–local MPPT frameworks.
To overcome the inherent limitations of conventional methods, swarm-intelligence algorithms have been widely introduced into maximum power point tracking. Particle swarm optimization, through cooperative sampling by multiple particles, can cross the power valleys between local peaks and offers good search accuracy under steady irradiance, but its convergence is slow and its implementation is difficult when irradiance changes rapidly. Along this line, Ishaque et al. [9] proposed a direct control method based on particle swarm optimization, Javed et al. [10] proposed a fully adaptive particle swarm optimization algorithm for global-peak tracking under partial shading, and Koh et al. [11] developed a modified particle swarm optimization algorithm for efficient maximum power point tracking under partial shading. Grey wolf optimization and artificial bee colony algorithms perform well in tracking the global peak, yet they suffer from high computational complexity, difficult parameter initialization, and large computational cost. Among these studies, Sundareswaran et al. [12] employed an artificial bee colony algorithm to improve energy harvesting under partial shading and further proposed a firefly-based tracking strategy [13]; Mohanty et al. [14] introduced grey wolf optimization into maximum power point tracking; and Jiang et al. [15] proposed an ant colony optimization-based tracking method to accommodate the multimodal characteristic. Cuckoo search, which combines frequent local moves with occasional long-range jumps through Lévy flights, is naturally suited to multimodal characteristics; accordingly, Ali et al. [16] proposed an enhanced cuckoo search method for global MPPT under partial shading. Nevertheless, its fixed step size and discovery probability cannot simultaneously balance search coverage and real-time performance, and the evaluation of online candidates must wait for the converter dynamics to settle, so that the search duration is directly coupled with the captured energy and the converter stress.
In addition to swarm-intelligence methods, model-based and artificial-intelligence-based methods have also been applied to maximum power point tracking. Fuzzy control, neural networks, and predictive control can approximate the optimal operating point to some extent, and lightweight neural-network methods combined with edge computing have recently further improved online prediction efficiency. For example, Alajmi et al. [17] proposed a fuzzy-logic maximum power point tracking technique for partially shaded PV systems in microgrids, whereas Boubaker [18] systematically reviewed PV maximum power point tracking techniques and recent artificial-intelligence-based advances. However, such methods generally depend on model parameters, training data, and computational resources; when the array, temperature, converter, or load changes, they often require re-tuning, which constrains their generalization capability.
To further reconcile global search and local stability, hybrid methods combine a global optimizer with a local controller, using global search to identify the peak region and local control to suppress residual oscillation. Rukhsar et al. [19] reviewed artificial-intelligence-based global maximum power point tracking methods, whereas Worku et al. [20] reviewed recent maximum power point tracking techniques for PV systems under partial shading. In recent years, novel swarm-intelligence methods have continued to emerge: Eltamaly et al. [21] proposed a scanning bat algorithm to improve tracking performance under partial shading, Mansoor et al. [22] introducing Harris hawks optimization into maximum power point tracking control, and Yang et al. [23] proposing a memetic salp swarm algorithm for partial-shading conditions. Regarding local control, Kim [24] employed sliding-mode control to achieve stable regulation of grid-connected PV systems. However, the performance of a hybrid controller depends on how the global search and local regulator exchange information. Continued exploration after a reliable reference has been obtained can increase transient energy loss and steady-state ripple, whereas an incorrectly selected local-peak reference can prevent the local regulator from correcting the global-selection error. Comparisons across the literature are also affected by differences in PV models, shading profiles, sampling intervals, and stopping criteria. The remaining practical issue addressed in this study is therefore the coordination of finite global candidate evaluation, reference confirmation, and local voltage regulation within a specified PV–Boost system and evaluation protocol.
Based on this motivation, this study develops an event-triggered global MPPT controller, termed ICS-Synergetic Control, for a series-connected PV array with a Boost interface. An irradiance or PV-port power change initiates a finite candidate search. Peak-family prediction, adaptive Lévy perturbation, differential updating, and elite neighborhood refinement are used to place and update candidates across the feasible voltage range. Each candidate is physically applied through the converter and evaluated using window-averaged PV power after the prescribed settling interval. Once the best candidate region satisfies the confirmation criterion, the search is stopped and the synergetic-control branch tracks the associated PV-voltage reference. The locking logic then prevents unnecessary search perturbations until a new event invalidates the reference. The method is assessed only under the specified deterministic simulation profiles and StarSim hardware-in-the-loop scenarios reported in this manuscript.
The individual techniques used in this study—including event-triggered operation, Lévy-flight-based search, nonlinear local control, and operating-point locking—are established concepts and are not claimed as standalone innovations. The contribution of this work lies in their application-specific coordination for partially shaded PV maximum power point tracking: global search identifies a promising peak region, synergetic control regulates the operating point locally after reference confirmation, and event monitoring and locking manage transitions between these operating modes. To examine the role of sensing information, the framework is implemented in two variants: ICS-SC-I, which uses module-level irradiance information, and ICS-SC-E, which does not use module-level irradiance inputs. Their event-detection and candidate-generation procedures are defined according to the information available to each variant.
The contributions of this study are summarized as follows:
- (1)
- An application-specific global–local MPPT framework is formulated for partially shaded PV arrays by coordinating improved cuckoo search for global peak-region exploration with synergetic control for local operating-point regulation.
- (2)
- Two sensing configurations, ICS-SC-I and ICS-SC-E, are implemented to assess the framework with and without module-level irradiance inputs, respectively.
- (3)
- The framework is evaluated using the switched PV–Boost model, controller comparisons, module-removal ablation, and the StarSim hardware-in-the-loop tests conducted in this study. The conclusions are limited to the implemented models, sensing configurations, and evaluated operating conditions.
2. Materials and Methods
2.1. Single-Diode Model and Series-Array Reconstruction
The single-diode model represents a PV component using an irradiance-driven photogenerated current source, a p-n junction diode, and series and shunt resistances; the component-level equivalent circuit is shown in Figure 1. Compared with the ideal current-source model, the exponential characteristic of the diode branch dominates the knee bending of the I–V curve near the open-circuit voltage Voc [25], the series resistance Rs mainly affects the slope in the high-voltage region, and the shunt resistance Rsh accounts for the leakage current.
Figure 1.
Equivalent circuit of the single-diode PV-component model.
For the m-th PV component, the implicit relationship between its terminal current Im and terminal voltage Vm is given by Equation (1), and the thermal voltage of a single cell is given by Equation (2):
where Iph,m is the photogenerated current, I0,m is the diode reverse saturation current, a is the diode ideality factor, Nc is the number of series-connected cells within the component, k is the Boltzmann constant, q is the elementary charge, and Tm is the cell temperature. Because the current appears simultaneously in the diode exponential term and in the series-shunt resistance terms, the component characteristic generally requires a numerical solution.
Irradiance and temperature influence the output characteristic through the photogenerated current and the reverse saturation current. Taking the reference irradiance Gref and reference temperature Tref as the baseline, the photogenerated current can be approximately corrected from the short-circuit current and its temperature coefficient, whereas the reverse saturation current varies markedly with the junction temperature, as expressed in Equations (3) and (4), respectively:
Under uniform irradiance and identical component parameters, the terminal voltages of the Ns series-connected components are summed, and all components carry the same string current, as expressed in Equations (5) and (6), respectively. This shared-current constraint is precisely the origin of the evolution from partial shading to array-level mismatch:
VPV = NsVm
I1 = I2 = … = IM = IPV
Consider M series-connected components, each equipped with a bypass diode. Under different irradiance levels Gm, their short-circuit currents and forward operating ranges differ, and the string current is limited by the weakest component. If this current forces a shaded component into reverse bias, its bypass diode conducts and clamps the component voltage to approximately −Vbd,m, thereby reducing the hot-spot risk and allowing the remaining components to continue supplying power; the role of the bypass diodes under partial shading is illustrated in Figure 2. Consequently, the effective number of series-connected components varies with the current and is not a simple linear scaling of a single component.
Figure 2.
Role of bypass diodes in series-connected PV components under partial shading.
Let σm denote the bypass state and Vsd,m the terminal voltage obtained from the single-diode model. For a given string current, the array terminal voltage is the sum of the component terminal voltages and the bypass clamping voltages, as expressed in Equations (7) and (8); the array power and the global maximum power point criterion are defined by Equations (9)–(11). Different bypass states correspond to different continuous operating branches, and branch switching alters the composition of the array voltage, thereby forming multiple local peaks on the power–voltage curve, among which the local peak with the highest power within the feasible voltage range is the global maximum power point:
vm(I,Gm,σm) = max(vsd,m(I,Gm),−Vbd,m)
PPV = IPVVPV
Irradiance variations shift the photogenerated current of each component continuously, whereas bypass-state changes alter array topology discretely; their superposition produces a piecewise non-convex power surface. Therefore, local derivatives apply only to refined regulation within a known peak region and cannot independently determine the global optimum, so global tracking must incorporate cross-branch candidate comparison or equivalent global information. Figure 3 presents the array P-V characteristics reconstructed under this study’s four-stage irradiance vectors, in which asterisks mark GMPP reference points for control evaluation.
Figure 3.
Array P-V characteristics for the four-stage component irradiance vectors; asterisks mark the GMPP reference points used for control evaluation.
2.2. Boost Converter Model and GMPP Problem Boundary
The system studied in this paper consists of a series-connected PV array with bypass diodes and a Boost-type maximum power point tracking interface; its MPPT control principle is shown in Figure 4. The controller regulates the equivalent input impedance of the Boost converter through the duty cycle d, driving the PV voltage and current toward the target maximum-power region. Let Cin denote the PV-side capacitor, L and rL the inductor and its equivalent series resistance, respectively, Co the output capacitor, R the equivalent load, and iL, VPV, and Vo the inductor current, PV terminal voltage, and output voltage, respectively.
Figure 4.
Principle of the photovoltaic maximum power point tracking controller.
In the continuous-conduction mode, state-space averaging over the switch-on and switch-off subintervals yields the balance equations for the input capacitor, the inductor, and the output capacitor, as expressed in Equations (12)–(14):
After a change in the duty cycle, the inductor current and the output-capacitor voltage of the Boost interface require a settling interval. To prevent the global optimization from being biased by measurements taken before the transient has ended, each discrete duty-cycle command is assigned a settling interval and a sampling window, and evaluation using the window-averaged power is performed only after the settling criterion is satisfied. Too short a sampling interval reduces measurement reliability, whereas too long a dwell time delays the optimization and the recapture after an irradiance event; the number of discrete commands is therefore constrained within a given duty-cycle range to balance the dynamic response against the search reliability.
The core task of global maximum power point tracking is to identify, within the feasible voltage range, the operating region corresponding to the global maximum power, and to stabilize the PV array in that region through duty-cycle control. Global optimization identifies the maximum-power region, whereas local control suppresses the transient and steady-state deviations near the target; although the two serve different purposes, both influence VPV, IPV, and PPV through the same duty-cycle command at the Boost interface. The controller uses VPV, IPV, iL, and Vo as measured electrical variables and adopts the window-averaged value of PPV = VPVIPV as the candidate fitness; the irradiance information is used only for event detection and candidate initialization, while the acceptance of a candidate is still determined by the PV power measured after the command has been applied.
Within this information boundary, the problem can be stated as follows: when an irradiance event alters the piecewise power surface, a finite number of physical candidate trials are used to identify the high-power voltage region; after the reference has been confirmed, fast local convergence is achieved under a constrained duty cycle; and when the measured power or irradiance indicates that the reference is no longer valid, the lock is released and the global search is restarted.
3. ICS-Synergetic Control Based MPPT Algorithm
3.1. Closed-Loop Framework and Event Triggering
To address the multimodal power-voltage characteristic caused by partial shading, this paper proposes a closed-loop maximum power point tracking strategy composed of event triggering, improved cuckoo search, and synergetic control. The improved search determines the high-power voltage reference from the power feedback of the Boost converter, whereas synergetic control is responsible for fast tracking of the reference voltage and steady-state retention. The overall control flow is shown in Figure 5.
Figure 5.
ICS-Synergetic Control closed-loop mode management and control flow.
During operation, ICS-Synergetic Control employs three modes: global optimization, synergetic control, and locking. The mode manager selects mode transitions according to irradiance variations and the PV-port response, and passes a voltage reference or a duty-cycle command to the continuous control layer. The responsibilities of the three modes are clearly defined: global optimization locates the high-power region on the multimodal curve, synergetic control completes local convergence once the region has been identified, and locking suppresses ineffective perturbations during the steady-state stage. Because all three act on the system through the same duty-cycle command at the Boost interface, the information-handover logic among the modes becomes decisive for the tracking performance.
The event-triggering stage determines whether the irradiance condition has changed substantially, thereby avoiding false triggering caused by measurement noise or transient fluctuations. For the irradiance vector G = [G1, G2, G3, G4], a valid event is confirmed only when the relative change of at least one component reaches the threshold εG (set to 0.03 in this study) and the vector remains stable over a subsequent interval. The event-confirmation condition is given by Equation (15):
To suppress false triggering, the relative fluctuation of the irradiance vector is required not to exceed 0.005 within a continuous 6 ms interval, and an 80 ms cooldown period is applied after event confirmation to prevent repeated triggering within the same transient process.
After an event is confirmed, the component irradiances are arranged in descending order as G1 ≥ G2 ≥ G3 ≥ G4, and a weighted index sk is computed to determine the initial search direction, as expressed in Equation (16). It should be emphasized that the irradiance information is used only for event detection and candidate initialization, while the maximum-power reference is still determined by the power measured after the command has been applied through the Boost interface, thereby separating the information used for control from the evaluation criterion:
sk = kGk, k = 1,2,3,4
The selected peak family is defined as:
Thus, the largest qualifying family index is selected when two family scores differ by no more than 2%. This provides a deterministic higher-voltage tie-break rule.
The normalized irradiance mismatch used in the family-4 prediction is defined as:
With the module maximum-power voltage Vm = 29.9 V, the predicted voltage center is determined according to:
The predicted center is then limited to the feasible voltage-search interval:
where sat(·) denotes saturation within [12, 135] V. The corresponding predicted peak interval is:
The initial candidate locations used by the implementation are
And each candidate is saturated to the interval [12, 135] V.
For the irradiance-assisted configuration, the predicted center is evaluated first. When the fast path is available, the controller may transfer to synergetic control after the predicted candidate satisfies the same candidate-arrival and power-evaluation conditions. When the fast path is unavailable or disabled, the complete candidate set is used. The electrical-only configuration, ICS-SC-E, does not receive direct module-level irradiance information; therefore, its irradiance-based prediction path is bypassed and the electrical fallback initialization is used.
The candidate fitness is calculated from the measured PV-side electrical quantities rather than directly from the irradiance estimate:
Pi = meanmindow(VPVIPV)
A candidate is considered to have arrived when:
|VPV − Ui| ≤ 2V
A 2 ms startup blanking interval or a 1 ms ordinary-event blanking interval is applied before evaluation. This is followed by a 3 ms power-evaluation gate. The required valid in-band sample counts are 10 for startup events, 5 for nonuniform irradiance events, and 4 for uniform irradiance events. The corresponding maximum candidate-arrival times are 30 ms, 20 ms, and 12 ms, respectively. If a candidate does not satisfy the arrival condition within the applicable time limit, it is treated as invalid for settled-fitness replacement and cannot replace a valid incumbent based only on transient measurements.
After the initial candidates have been evaluated, the elite-refinement process is applied. For generations that are not multiples of three, the active nests are refined around the current best voltage using:
At every third generation, the adaptive differential-preference and Lévy update is used. Define:
Pa(g) = 0.1 + 0.3ρg, λ(g) = 0.28ρg, β = 1.5
With probability Pa(g), the candidate is updated according to
Otherwise, the Lévy update is applied:
where
All updated candidate voltages are saturated to [12, 135] V.
The replacement rule is greedy and is based on measured candidate power. A valid candidate replaces its incumbent nest only when its window-averaged measured power is no lower than the incumbent power. The best measured candidate is updated only when the power improvement exceeds:
εP = max(0.0005max(|Pbest|,1W),0.1W)
The stochastic search terminates when any one of the following conditions is satisfied:
- (1)
- The active-nest voltage spread satisfies:
- (2)
- Beginning with generation six, four consecutive generations satisfy
- (3)
- The generation index reachesgmax = 10
These termination conditions are applied as an OR condition. The predicted single-candidate and uniform-irradiance fast paths may terminate earlier, but only after satisfying the same candidate-arrival and power-evaluation requirements. Once the search is terminated, the selected voltage reference is transferred to the synergetic-control stage.
In the locking mode, the controller continuously monitors the deviation of the filtered PV power from the baseline value. When an irradiance change is detected, or when this deviation reaches the threshold εP and is maintained for 30 consecutive sampling points, the system releases the lock and restarts global optimization, as expressed in Equation (36), where εP = 0.1; when the deviation falls back below 0.015, the baseline power is updated accordingly:
The irradiance-assisted configuration requires four module-level irradiance estimates, one for each series-connected module. In a physical installation, these estimates could be obtained using co-located calibrated reference cells or irradiance sensors, followed by channel calibration and filtering before delivery to the controller. Such a configuration entails additional sensor, wiring, calibration, temperature-compensation, soiling, and spatial-representativeness costs. In the present Simulink and StarSim models, G1–G4 are model signals; no physical module-mounted irradiance sensors were tested. To isolate input uncertainty, the Group-S simulation (Section 4.1) applied multiplicative errors only to the four controller input channels, while the irradiances driving the PV plant remained unchanged. One clean run, one run with a fixed alternating +5% bias, and 20 independent runs each with channel-wise bounded 5% and 10% errors updated every 2 ms were evaluated.
3.2. Improved Cuckoo Search for Global Optimization
Cuckoo search was proposed by Yang et al. [26] based on Lévy flights and has been further extended to various engineering optimization problems [27]. In the improved cuckoo search, each search individual is defined as a PV voltage reference to be applied, and its power objective is the window-averaged value, as expressed in Equation (37). Each evaluation includes dynamic settling, a settling-criterion check, and sample acquisition, so that every search update has a clear physical basis. The scheduling flow of the global search is shown in Figure 6:
Figure 6.
ICS-Synergetic Control global-search scheduling.
3.2.1. Population Initialization
The initialization adopts a peak-family prediction strategy. Based on the component irradiances G1 ≥ G2 ≥ G3 ≥ G4 arranged in descending order after event confirmation and the weighted index sk, the possible peak-voltage intervals on the multimodal power–voltage curve are predicted, and the initial search individuals are placed within the feasible voltage range [Umin, Umax] accordingly. Eight search individuals are used in this study, so that they are relatively dense near the predicted peak family while maintaining coverage over the remaining intervals, thereby balancing cross-peak exploration and search efficiency under a limited number of candidates. Compared with uniform initialization over the full range, peak-family prediction markedly reduces the physical probing of ineffective candidate points and lowers the energy loss during the search stage.
3.2.2. Exploration: Adaptive Lévy Flight
Cuckoo search generates heavy-tailed search step sizes through Lévy flights; its basic form is given by Equation (38), and the Lévy step size and its random-variable parameters are given by Equation (39). This mechanism helps to cross the low-power regions between local peaks and is suitable for the multimodal characteristic under partial shading:
Unlike static optimization problems, the maximum power value must be measured after the converter has responded dynamically; hence, a fixed step size and discovery probability may not simultaneously balance search coverage and real-time performance. For this reason, the discovery probability Pa and the Lévy scale λ decay gradually with iterations, so that the search maintains strong exploration in the early stage and focuses on the high-power region in the later stage, as expressed in Equations (40) and (41), respectively. The resulting candidate voltage is updated according to Equation (42) and is clamped within the feasible voltage range [Umin, Umax]:
3.2.3. Exploitation: DE Preference Walk and Elite Refinement
For search individuals eliminated by the discovery probability, reconstruction is performed based on the current optimal voltage, a differential term, and a Lévy term [28], as expressed in Equation (43), where w1 = 0.65 and w2 = 0.25. A new command is accepted only when its power feedback is no lower than that of the original command and the measurement window is valid, that is, a greedy selection rule is adopted, as expressed in Equation (44):
The voltage search interval is defined as Uref ∈ [12,135]V, while the Boost duty ratio is saturated within D ∈ [0.02,0.78]. The improved cuckoo-search stage uses eight nests and is allowed to execute at most ten refinement generations. The candidate-arrival condition and the termination criteria are given in Equations (24) and (33)–(35), respectively.
In the present implementation, β = 1.5, Pa ∈ [0.1,0.4], and λ0 = 0.28 are adopted. The search logic is updated every 200 μs. The predicted single-candidate and uniform-irradiance fast paths may terminate earlier, but only after satisfying the same candidate-arrival and power-evaluation conditions. Once the search is terminated, the selected voltage reference is transferred to the synergetic-control stage. An irradiance event is confirmed when the relative change exceeds 3% for 30 consecutive 200 μs samples, corresponding to 6 ms, and the lock cooldown time is 80 ms.
3.3. Synergetic Control for Local Convergence
3.3.1. Macro-Variable and Boost Control Law
Synergetic control is a nonlinear control method based on a macro-variable and an attracting manifold. Santi et al. [29] systematically compared synergetic control with sliding-mode control in power electronics, and Behih et al. [30] recently proposed an adaptive synergetic maximum power point tracking controller for photovoltaic systems. It constructs a macro-variable ψ = h(x) and a target manifold ψ = 0, and specifies a reaching law for the macro-variable so that the system states converge on a prescribed time scale. The reaching law and its solution are given by Equations (45) and (46), where T > 0 is the time constant:
After the reference voltage Uref has been selected, accepted, and transferred by the global-search stage, the macro-variable is defined as the difference between the inductor current and its desired value, as expressed in Equation (47), and the voltage error is defined by Equation (48). The desired inductor current is derived from the charge balance of the input capacitor, as expressed in Equations (49) and (50):
e = VPV − Uref
Substituting the averaged Boost model into the reaching law yields the ideal synergetic duty cycle dsyn, as expressed in Equation (51); after correction by the continuous error-feedback term kee and the application of duty-cycle saturation, the executable synergetic control law is obtained, as expressed in Equation (52). Here, T = 3 ms, τv = 12 ms, Cin = 220 μF, and L = 6.8 mH; the PWM frequency is 20 kHz, the duty-cycle range is [0.02, 0.78], and ke = 2.5 × 10⁻³V−1:
d = min{dmax,max{dmin,dsyn + kee}}
3.3.2. Local Stability Analysis of the Unsaturated Synergetic Sub-Law
The following analysis is restricted to the local synergetic-control mode after a valid voltage reference Uref has been selected, accepted, and transferred from the global-search stage. During this mode, Uref is assumed to remain fixed, and the ideal unsaturated synergetic duty command in Equation (52) is considered. The averaged Boost-converter model, locally constant PV operating conditions, and absence of duty-cycle saturation and rate limiting are assumed for the analytical derivation.
Under these assumptions, the Lyapunov function is selected as:
From the reaching law, the derivative of the macro-variable is obtained as in Equation (54):
Therefore, the derivative of the Lyapunov function is:
For ψ ≠ 0, , while only at ψ = 0. Thus, the origin of the ideal macro-variable dynamics is exponentially convergent under the stated assumptions.
On the target manifold ψ = 0, the local voltage error e(t) satisfies:
Hence, after a valid fixed reference has been transferred to the local controller, the local voltage error converges exponentially with the time constant τv.
This derivation establishes only the local convergence property of the ideal synergetic-control sub-law. It does not constitute a common-Lyapunov stability proof for the complete implemented hybrid MPPT controller; in particular, it does not cover duty-cycle saturation, rate limiting, the blending of the synergetic command with the local PI refinement, event-triggered global search, candidate-point switching, protection logic, locking, or lock/restart transitions. During global search and event-triggered transitions, the reference voltage is not necessarily fixed, and the assumptions of this proof do not hold. After a candidate reference is accepted and the controller re-enters the local regulation mode, the local convergence result applies again within that mode. The behavior of the complete hybrid controller is therefore assessed using the closed-loop switching simulations and the StarSim HIL tests.
4. Simulation and Hardware-in-the-Loop Results
4.1. Simulation Setup
All controllers were evaluated by closed-loop simulation in the MATLAB/Simulink R2018b environment using the same PV array, switched Boost converter, load, PWM interface, solver step, and signal-processing procedure. The unified switching model consists of four externally series-connected PV modules. The PV array is interfaced with a switched Boost converter, whose main electrical parameters, together with the PV-array configuration, are summarized in Table 1. Each module is represented by a single-diode PV Array block, and the module irradiances are independently assigned according to the stage profile in Table 2. Unless otherwise stated, the solver step size was fixed at 1 μs and the PWM frequency at 20 kHz. The converter duty cycle was constrained to the interval [0.02, 0.78].
Table 1.
Unified switching-model settings and ICS-Synergetic Control parameters.
Table 2.
Four controlled irradiance stages and the corresponding GMPPs obtained by static P–V curve scanning.
During each of the 4 s simulations, 50 raw samples were collected per switching period, resulting in 4,000,001 synchronized solver samples. The raw VPV and IPV signals were averaged over each switching period before power and performance metrics were calculated, thereby reducing the influence of PWM phase on the power estimate. The dedicated search and synergetic-control parameters of the proposed ICS-Synergetic Control are listed in Table 1, whereas the parameter settings of the comparison algorithms are specified separately in the corresponding comparison setup. Thus, the controllers share the same physical plant and numerical simulation interface; the differences observed within each information condition are attributed to the implemented MPPT strategy.
Baseline-controller implementation. For CSA, four nests were initialized at duty ratios of [0.30, 0.50, 0.65, 0.80] within [0.20, 0.86]. The discovery probability, Lévy exponent, initial step size, and maximum duty displacement were 0.25, 1.5, 0.05, and 0.04, respectively. Each candidate was held for 20 ms, with the first 10 ms excluded from power averaging; the search was terminated after at most four generations and the measured best point was then retained. For GWO, five wolves were distributed around a duty ratio of 0.50 with an initial radius of 0.34 within [0.20, 0.86]. The subsequent local-search radius was 0.12 and the duty increment was limited to 0.004 per update. Each candidate used the same 20 ms dwell and 10-ms exclusion intervals, and a maximum of two online generations was allowed before retaining the alpha solution.
For PSO, six particles were initialized at [0.30, 0.42, 0.50, 0.53, 0.59, 0.70] within [0.24, 0.82], with the factors ω = 0.7, c1 = c2 = 1.5, and a maximum velocity of 0.10. Each candidate was held for 20 ms, the first 10 ms were excluded, and the search was limited to four generations before the global-best solution was retained. NSPSO-INC used six particles initialized at [0.28, 0.40, 0.50, 0.60, 0.70, 0.82] within [0.20, 0.86]. During three PSO generations, ω decreased from 0.90 to 0.40, c1 decreased from 2.50 to 0.80, and c2 increased from 0.50 to 2.20; the natural-selection ratio and maximum velocity were 0.50 and 0.12. Each candidate was held for 16 ms, with the first 8 ms excluded, after which the controller transferred to INC refinement using a 10 ms update period and an adaptive duty step of 0.00015–0.0060.
All baseline controllers used switching-period-averaged VPV and IPV to evaluate candidate power and shared the same PV–Boost plant, irradiance profile, PWM interface, fixed solver step, duty constraints, and metric-calculation procedure. Their parameters were independently checked and adjusted for stable closed-loop operation under the common four-stage profile. However, their native population sizes and termination mechanisms were retained, and the number of physical candidate evaluations was therefore not identical. Accordingly, the comparison concerns complete closed-loop MPPT implementations under disclosed settings rather than strictly computation-budget-matched optimization kernels.
The irradiance conditions were arranged progressively according to shading complexity, as shown in Table 2. S1 represents uniform irradiance, whereas S2, S3, and S4 represent monotonically decreasing shading, non-monotonic shading, and severe non-monotonic shading, respectively. The four stages constitute one continuous simulation run, and the controller states are naturally inherited at the stage boundaries, allowing the tracking response to be evaluated during continuous migration of the peak position.
The evaluation metrics are given by Equations (57)–(60) and correspond, respectively, to the switching-period-averaged power, the steady-state tracking efficiency and error, the stage energy efficiency, and the settling time for entering the reference band. Here ηP denotes the static accuracy after convergence, and ηE denotes the energy cost including the search transient; together they constitute a dual measure of the global-local strategy.
tset = min{t:|PPV(τ) − PGMPP| ≤ 0.02PGMPP, ∀τ ∈ [t,t + 20ms]}
To separate the algorithmic effects from sensing-information effects, two sensing conditions were defined using the same four-stage irradiance profile and switched PV–Boost plant. In Group-I, module-level irradiances were available to all seven controllers. The comparison controllers used irradiance changes primarily for condition detection and restart, whereas ICS-SC-I additionally used the irradiance distribution to prioritize candidate peak regions. In Group-E, module-level irradiance inputs were not used by any controller; the proposed electrical-only variant is denoted ICS-SC-E. ICS-SC-E continued to use the inductor current and converter output voltage required by its implemented local-control law. Thus, Group-E removes the module-level irradiance advantage but does not imply identical sensor requirements or identical use of information across all controllers. Group-E therefore provides the information-matched comparison, whereas Group-I evaluates the complete irradiance-assisted implementation and is not used to attribute the observed differences solely to the control algorithm. Unless otherwise stated, the proposed controller in the tables below is ICS-SC-I.
To quantify run-to-run repeatability, the complete 0–4 s closed-loop switching simulation was repeated 30 times for each of the seven controllers, using random seeds 1001–1030. The controller state was explicitly reset at the beginning of every run, while the PV array, converter, irradiance profile, solver step, PWM frequency, initial conditions, static GMPP references, and evaluation windows were kept unchanged. A sustained ±2% GMPP criterion based on a 20 ms trailing average was used as the settling criterion. Failed settling events were recorded as unsuccessful events and were not assigned a zero settling time. The mean, sample standard deviation, and two-sided 95% Student-t confidence interval were calculated where applicable. When all repeated traces were identical, the confidence interval was reported as not applicable rather than being interpreted as a general uncertainty bound.
Figure 7 shows the sensitivity of ICS-SC-I to errors in the four controller-side irradiance inputs (Group-S, Section 3.1). Under the fixed alternating ±5% bias, all three true irradiance transitions were confirmed, and captured energy decreased from 0.571862 to 0.568758 Wh (0.543%). The time-varying errors had a substantially different effect. Across 20 runs at each level, the ±5% and ±10% conditions missed all three true transitions per run within the predefined 0.25 s detection window. Their mean captured energies were 0.470579 ± 0.005628 and 0.452330 ± 0.011103 Wh, respectively, where the intervals following the means are sample standard deviations. These correspond to reductions of 17.711% and 20.902% relative to the single clean run. No false events were recorded under either tested time-varying condition; this should not be interpreted as successful noise rejection, because true events were also missed. The recorded peak-family state differed from the clean trajectory in three later stages primarily because the corresponding event was not confirmed and the state was not updated. The test therefore identifies a limitation of the present 0.5% irradiance-vector consistency gate under independently varying, unfiltered input errors. Sensor filtering or a revised confirmation rule would require a separate implementation and re-evaluation.
Figure 7.
PV-side power responses of ICS-SC-I under clean irradiance input.
4.2. Uniform and Partial-Shading Response
Figure 8 presents the switching-period-averaged power trajectories of the seven controllers under the four-stage profile.
Figure 8.
Switching-period-averaged power trajectories of the seven controllers under the four-stage profile.
The trajectories in Figure 8 reveal the mechanistic differences among the three categories of methods. P&O and INC rely on local-gradient information and can therefore settle at lower-power local operating points under multimodal shading, as observed in S3 where their steady-state mean powers are 299.459 W and 233.716 W, respectively. CSA, GWO, PSO, and NSPSO-INC provide cross-peak sampling capability, but candidate evaluation through the Boost converter introduces transient power dips and recovery delays. ICS-Synergetic Control achieves a better balance between global-peak identification and post-selection regulation, reaching 908.375 W in S1, 376.384 W in S2, 369.772 W in S3, and 445.673 W in S4. These values are at or close to the best steady-state power levels among the compared controllers, indicating that peak-region prioritization and candidate-arrival verification help reduce local-peak trapping and unsettled-sampling errors.
The PV-voltage and PV-current responses of ICS-Synergetic Control and the local magnification of its PV power are shown in Figure 9 and Figure 10, respectively.
Figure 9.
PV-voltage and PV-current responses of ICS-Synergetic Control under the four-stage irradiance profile. (a) PV-voltage; (b) PV-current.
Figure 10.
Local magnification of the ICS-Synergetic Control PV-power response under the four-stage profile.
Figure 9 shows that, after each irradiance transition, VPV and IPV change together and establish a new power plateau. This response indicates that the operating point migrates to a new region of the multimodal PV characteristic after the operating condition changes. The local magnification in Figure 10 further shows that, after the controller enters the synergetic-regulation and locking stages, persistent perturbations around the selected operating point are substantially reduced. These waveforms support the role of the local regulation and locking mechanisms in limiting steady-state oscillation.
For the stage-wise comparison in Table 3, the reference GMPP, steady-state mean power, steady-state tracking efficiency, and the mean time required to reach the controller’s own steady state were extracted from the recorded power trajectories of the 30 repeated runs described in Section 4.1. Cases that did not satisfy the own-steady-state criterion within the evaluation window were marked as “Not achieved” rather than being assigned an artificial settling time.
Table 3.
Stage-wise mean performance comparison of the seven controllers over 30 independent runs under the Group-I condition.
The repeated-run comparison in Table 3 was conducted under the irradiance-assisted Group-I configuration using the same four-stage irradiance profile for all seven MPPT controllers. The electrical-only Group-E results are discussed separately to evaluate the effect of removing module-level irradiance information. The table reports the stage-wise repeated-trial results using the same scanned GMPP references. These results show that the time required to reach a controller’s own steady state does not necessarily represent global MPPT quality. A controller may stabilize rapidly around a local operating point while remaining far below the stage-specific GMPP, whereas a controller with a longer transient search may achieve a higher steady-state power after identifying a more appropriate peak region.
With increasing shading complexity, the difference between local regulation and global-peak identification becomes more evident. In the more challenging non-uniform irradiance stages, several baseline methods exhibit clear degradation in steady-state tracking efficiency. In contrast, the proposed ICS-Synergetic Control maintains high steady-state power across all four stages. It achieves the highest tracking efficiency in S1 and is effectively tied with the best-performing controller in S2, S3, and S4, while also requiring a shorter own steady-state time than the stochastic population-based baseline controllers in most stages. This indicates that the proposed controller combines accurate peak selection with a relatively fast transition toward the selected operating region.
Table 3 reports the same four stage-wise metrics for all seven controllers under each irradiance stage. In S1, ICS-Synergetic Control achieves the highest steady-state mean power of 908.375 W and the highest tracking efficiency of 99.290%, outperforming PSO, NSPSO-INC, GWO, CSA, INC, and P&O. In S2, both NSPSO-INC and ICS-Synergetic Control reach the same steady-state power level of 376.384 W, corresponding to a tracking efficiency of 99.147%, while the proposed controller reaches its own steady state faster than NSPSO-INC. In S3, ICS-Synergetic Control and GWO both converge to the global-peak region with a tracking efficiency of 98.036%, but the proposed controller reaches its own steady state much faster. In S4, ICS-Synergetic Control and PSO both reach the highest steady-state power level of 445.673 W, corresponding to a tracking efficiency of 98.743%, while the proposed controller again shows a shorter own steady-state time.
The repeated-trial results also show that the observed run-to-run variation is mainly associated with the stochastic search-based controllers, especially CSA, PSO, and NSPSO-INC. P&O, INC, and GWO produce deterministic traces under the tested implementations and parameter settings. The proposed controller shows negligible run-to-run variation for the present four-stage profile because the accepted candidate path transfers the selected reference to the synergetic-control stage before the randomized refinement branch substantially affects the final operating point. Therefore, its near-zero variation should be interpreted as fixed-profile repeatability under the tested condition rather than as a general claim of stochastic robustness.
Taken together, the stage-wise results in Table 3 indicate that the observed performance of ICS-Synergetic Control is associated with the coordinated operation of the improved cuckoo-search process, candidate-arrival verification, local regulation, and locking stages. The improved cuckoo-search stage identifies a promising high-power region on the multimodal PV characteristic, while the candidate-arrival criterion and power-evaluation procedure reduce premature decisions caused by insufficiently settled operating points. After the reference voltage has been selected, the synergetic-control stage drives the system toward the selected operating region, and the locking mechanism limits unnecessary steady-state perturbations. The results therefore suggest that the proposed method improves the balance between global-peak identification, transition speed, and steady-state power tracking under the tested four-stage irradiance profile.
To examine repeatability at the trajectory level, the 30 independent four-stage simulations in the irradiance-assisted Group-I configuration were further summarized for each of the seven controllers. Unlike the own steady-state time reported in Table 3, the settling time in Table 4 was calculated only from successful sustained ±2% GMPP events based on a 20 ms trailing average. ICS-Synergetic Control, implemented as ICS-SC-I in this configuration, achieved the highest mean captured energy of 0.571990 Wh and the highest trajectory energy utilization of 96.992%. Its mean steady-state error was 1.196%, and all 120 stage events satisfied the sustained ±2% GMPP criterion.
Table 4.
Statistical results of 30 independent four-stage simulations for the seven controllers under the Group-I condition.
Table 4 shows that ICS-Synergetic Control achieved the highest mean captured energy (0.572 Wh) and trajectory-level energy utilization (96.992%), followed by PSO (92.759%) and NSPSO-INC (92.314%). It also obtained the lowest mean steady-state error (1.196%) and satisfied the sustained ±2% GMPP criterion based on a 20 ms trailing average in all 120 stage events. By comparison, NSPSO-INC and PSO succeeded in 100/120 and 95/120 events, respectively, while GWO, INC, P&O, and CSA achieved 60/120, 30/120, 30/120, and 12/120 successful events. These results indicate that the proposed controller provided more consistent post-transition recovery and lower accumulated trajectory loss under the tested four-stage profile. Because module-level irradiance was available to all controllers but was used by ICS-SC-I for peak-region prioritization, these results characterize the complete irradiance-assisted implementation; the information-matched comparison is presented in Section 4.3.
4.3. Effect of Additional Irradiance Information
Figure 11 compares the PV-side power trajectories under the two sensing conditions. Under Group-I, ICS-SC-I rapidly returns to a high-power operating region after the prescribed changes and captures 0.572092 Wh over the four-stage trajectory. When module-level irradiance is removed, ICS-SC-E captures 0.530486 Wh. Its final power remains substantially lower in S2 and S4 than in the corresponding Group-I run. Under Group-E, PSO and NSPSO-INC capture 0.531623 Wh and 0.535710 Wh, respectively, compared with 0.530486 Wh for ICS-SC-E. Thus, under the information-matched condition, the proposed framework did not show an energy advantage over the strongest swarm-based baselines: ICS-SC-E captured 0.21% less energy than PSO and 0.97% less than NSPSO-INC. These results show that the irradiance-assisted result cannot be attributed to the global–local control law alone: the additional sensing information, particularly its use in event detection and peak-region prioritization, contributes materially to the observed performance. The electrical-only variant demonstrates operation without module-level irradiance measurements, but its electrical-only initialization requires further improvement.
Figure 11.
PV-side power trajectories of seven controllers under the four-stage profile: (a) Group-I, with module-level irradiance available to all controllers; (b) Group-E, without module-level irradiance input to the controllers.
These are deterministic results for the specified plant and four-stage profile. They do not establish a general statistical ranking or equal hardware cost among the controllers.
The Group-E results provide the information-matched comparison among the seven controllers. The Group-I results are interpreted separately as an irradiance-information sensitivity comparison and are not used to attribute all observed differences solely to the control algorithm.
4.4. Module-Removal Ablation Study
To assess the conditional effects of the controller components, A0–A7 were evaluated under the common four-stage irradiance profile in Table 2. All variants used the same PV array, Boost converter, solver step, PWM frequency, initial conditions, stage transitions, and independently scanned GMPP references. Their configurations are defined in Table 5. Because removing a component can also change the subsequent search trajectory, the results are interpreted as conditional module-removal effects rather than additive, independent contributions. Event confirmation was examined under two complementary conditions. The disturbance-free A0–A7 comparison first quantified the energy cost associated with the confirmation delay of A0. Its false-trigger-suppression role was then assessed in 30 paired sensor-disturbance runs, using seeds 1001–1030. For each pair, the same disturbance waveform was applied to the controller-side G1 input of A0 and A1; the irradiances applied to the physical PV model were unchanged. The waveform comprised Gaussian background measurement noise with a standard deviation of 0.10 W/m2, sampled every 200 μs, and three signed rectangular glitches per 1 s stage. Each glitch replaced the background noise for 0.6–2.0 ms and had a magnitude of 55–85 W/m2. Both variants retained the same 3% irradiance-change threshold. A0 required 30 consecutive consistent controller updates, corresponding to 6 ms, before restarting the search; A1 restarted after the first qualifying update. The remaining plant, controller, timing, and numerical settings were unchanged.
Table 5.
Experimental matrix for module removal.
Figure 12 presents the four-stage A0–A7 module-removal ablation under the disturbance-free profile: (a) relative captured-energy loss versus A0; (b) mean steady-state power ripple; (c) designed candidate evaluations per event. Table 6 reports the four-stage ablation using a common independently scanned GMPP reference. Removing peak-family prediction (A2), search scheduling (A3), or both within the basic-search configuration (A7) increased the energy loss relative to the ideal GMPP from 3.0039% for A0 to 16.9026%, 11.0236%, and 16.9686%, respectively. These are conditional module-removal effects: A2 invokes a full-range fallback, and the candidate counts are configured values rather than measured counts of settled evaluations. Without measurement disturbances, A1 captured 1.4482 J more than A0 by avoiding the 6 ms confirmation delay. In the 30 paired sensor-disturbance runs (Figure 13), however, A0 recorded no false search restarts, whereas A1 recorded approximately 15 false restarts per run and captured slightly less energy than A0. Event confirmation therefore incurs a small delay cost in disturbance-free operation but suppresses false restarts caused by short irradiance-measurement glitches; its benefit under other noise types and with physical sensors has not been evaluated. Removing the synergetic branch (A4) changed the ideal-relative energy loss only from 3.0039% to 3.0165%; because both measured ripple values are near the numerical floor, this experiment does not establish an independent smoothing benefit for that branch. Additional trajectory metrics showed only small differences between A0 and A4: the mean settling time was 0.185975 s and 0.189974 s, the transition energy loss was 63.8509 J and 64.1189 J, and the mean duty-cycle total variation, defined as the accumulated absolute change in the duty command within each stage and averaged over the four stages, was 0.382063 and 0.389244, respectively. Under the tested PI–synergetic blended implementation, the independent contribution of the synergetic branch is therefore limited to a modest improvement in transition behavior and duty-cycle variation. Removing local PI refinement (A5) or locking (A6) increased the measured steady-state ripple to 1.3890 W and 2.2330 W, respectively.
Figure 12.
Four-stage A0–A7 module-removal ablation under the disturbance-free profile: (a) relative captured-energy loss versus A0; (b) mean steady-state power ripple; (c) designed candidate evaluations per event.
Table 6.
Conditional module-removal results under the common four-stage irradiance profile.
Figure 13.
Paired A0/A1 sensor-disturbance comparison over 30 runs: (a) mean captured energy and sample standard deviation; (b) mean false search restarts per run and sample standard deviation.
4.5. Hardware-in-the-Loop Tests
To examine real-time implementability, the irradiance-assisted controller ICS-SC-I (ICS-Synergetic Control) and NSPSO-INC, which captured the highest energy among the baselines under Group-E, were implemented on the YuanKuan Energy StarSim hardware-in-the-loop (HIL) (ModelingTech Energy Technology Co., Ltd., Shanghai, China) platform (Figure 14). The PV array and Boost converter were represented by real-time models, and a RIGOL oscilloscope recorded analog output signals mapped from the model’s PV-side power, voltage, and current. Thus, the oscilloscope waveforms represent HIL interface signals rather than direct electrical measurements from a physical PV array or Boost-converter prototype. Both controllers used the same PV array, Boost converter, four-stage irradiance profile, PWM interface, analog-output scaling, oscilloscope settings, and power conversion. NSPSO-INC received only PV-side electrical quantities, whereas ICS-SC-I also received the module-level irradiances; the HIL comparison is therefore not information-matched. The scanned GMPP values in Table 2 were used only as references for evaluating the four-stage response.
Figure 14.
StarSim HIL test platform.
The HIL test used the four-stage irradiance profile in Table 2: uniform irradiance, monotonically decreasing shading, non-monotonic shading, and severe non-monotonic shading. The StarSim power signal PPV was routed to an analog output with a configured scale of 0.001 and zero software offset. The corresponding voltage and current outputs used configured scales of 0.05 and 1, respectively. The RIGOL oscilloscope probe was set to 1× attenuation. These values describe the configured signal mapping; they do not, on their own, establish the accuracy of the complete analog-output and oscilloscope measurement chain. No additional signal-conditioning circuits were connected between the HIL analog outputs and the oscilloscope inputs. The converted PV power was obtained by dividing the recorded power-channel voltage by the configured scale of 0.001 V/W.
In these tests, the oscilloscope operated at a sampling rate of 1 MSa/s with 12-bit vertical resolution under normal sampling mode, and waveform-averaging filtering was disabled throughout the tests. The DC voltage accuracy of the oscilloscope is ±0.8% of full-scale range, the DC output accuracy of the StarSim HIL analog-output module is ±0.2% of full-scale range, and the relative uncertainty introduced by the 1× passive probe is ±0.1%. Using the root-sum-square method and a coverage factor of k = 2 (95% confidence level), the expanded combined relative uncertainty of power converted from oscilloscope voltage readings is ±1.7%. For the converted steady-state powers in Table 7 and Table 8, this corresponds to approximately ±15 W in S1 and ±5.6–7.6 W in S2–S4. Differences between the converted power and the scanned GMPP that are smaller than this band are therefore not interpreted as significant.
Table 7.
Steady-state performance metrics of ICS-SC-I in the StarSim HIL test under the four-stage partial-shading profile.
Table 8.
Steady-state performance metrics of NSPSO-INC in the StarSim HIL test underthe four-stage partial-shading profile.
To examine whether the control sequence evaluated in simulation can operate under real-time execution, both controllers were tested under the same four-stage irradiance profile and scanned GMPP references as in Table 2. Figure 15 and Figure 16 show the oscilloscope-mapped response of ICS-SC-I, and Table 7 summarizes its converted steady-state power, steady-state tracking efficiency, and reported settling time for each stage. Figure 17 and Figure 18 and Table 8 provide the corresponding results for NSPSO-INC.
Figure 15.
Scaled oscilloscope response of ICS-Synergetic Control, showing the composite power, current, and voltage waveforms under the four-stage irradiance profile.
Figure 16.
Oscilloscope PV-power response of ICS-Synergetic Control under the four-stage partial-shading profile.
Figure 17.
Scaled oscilloscope response of NSPSO-INC, showing the composite power, current, and voltage waveforms under the four-stage irradiance profile.
Figure 18.
Oscilloscope PV-power response of NSPSO-INC under the four-stage partial-shading profile.
As the irradiance changed from uniform conditions to different partial-shading patterns, the controller returned to a stable operating region after each transition. Among the tested stages, the non-monotonic shading condition S3 showed a relatively longer recovery, with a reported settling time of 0.25 s and a 7.18 W (1.9%) difference between the converted steady-state power and the scanned GMPP, which is comparable to the ±1.7% expanded uncertainty of the converted power. Following the subsequent transition to severe non-monotonic shading in S4, the controller again reached a stable operating region within the reported 0.18 s. Under the common four-stage irradiance profile and scanned GMPP references, the post-transition recovery observed in the HIL waveforms is consistent with the trend obtained from the switched-model simulation. Therefore, the HIL results are mainly used to assess the real-time execution and post-transition recovery of the control sequence.
As the irradiance changed from the uniform condition to the four partial-shading stages, NSPSO-INC reached a stable operating region after each transition. Its settling time ranged from 0.03 to 0.08 s, with the longest recovery occurring in S3, the non-monotonic shading condition. However, the steady-state tracking efficiency in S3 decreased to 86.70%, corresponding to a 50.18 W difference between the converted steady-state power and the scanned GMPP. In comparison, the efficiencies in S1, S2, and S4 remained at 96.84%, 96.15%, and 97.04%, respectively. These results indicate that NSPSO-INC can respond rapidly to irradiance transitions, although its steady-state operating point is more sensitive to the complex non-monotonic shading condition represented by S3.
A comparison of Table 7 and Table 8 shows a clear difference between response speed and steady-state power accuracy. NSPSO-INC required shorter settling times in all four stages, ranging from 0.03 to 0.08 s, whereas ICS-Synergetic Control required 0.18–0.25 s. However, the shorter settling time of NSPSO-INC was accompanied by lower steady-state tracking efficiency, particularly in S3, where its efficiency decreased to 86.70% compared with 98.10% for ICS-Synergetic Control. In the other three stages, NSPSO-INC achieved efficiencies of 96.84%, 96.15%, and 97.04%, while ICS-Synergetic Control maintained 99.25%, 99.05%, and 98.81%, respectively. The comparison suggests that NSPSO-INC reaches its final operating region more quickly, whereas ICS-Synergetic Control spends more time during post-transition recovery but maintains a steady-state operating point closer to the scanned GMPP. The difference is most evident under the non-monotonic S3 condition, where the global search and local regulation stages of ICS-Synergetic Control provide more accurate steady-state localization. Because the two controllers used different sensing information and the converted powers carry a ±1.7% expanded uncertainty, this comparison is interpreted as a qualitative confirmation of the trade-off rather than as a quantitative ranking. The S3 difference (98.10% versus 86.70%) is well beyond the measurement uncertainty, whereas the differences of 1.8–2.9 percentage points in S1, S2, and S4 are comparable to or only moderately larger than it. Trajectory-level captured energy, transition energy loss, and steady-state ripple were not extracted from the mapped HIL records, and the controller computation time was not measured separately; these trajectory-level quantities are evaluated in the switched-model simulations (Table 3, Table 4 and Table 6). These observations are limited to the tested four-stage irradiance profile.
5. Discussion
The results show that ICS-Synergetic Control benefits mainly from coordinating global peak-region selection with local regulation. Under the four-stage Group-I profile, it achieved 96.992% trajectory energy utilization and satisfied the sustained ±2% GMPP criterion in all 120 stage events. The stage-wise results also show that faster settling does not necessarily mean better global MPPT performance: P&O and INC could settle quickly but often remained at local peaks, while PSO and NSPSO-INC improved cross-peak search but introduced transient evaluation loss. The proposed controller therefore provided a better balance between global-peak localization, transition recovery, and steady-state tracking.
The sensing and ablation results show that this advantage depends partly on module-level irradiance information. ICS-SC-I captured 0.572092 Wh, whereas electrical-only ICS-SC-E captured 0.530486 Wh and was slightly below PSO and NSPSO-INC under Group-E. Input-error tests also showed that rapidly varying ±5% and ±10% channel errors disrupted the present confirmation gate, so sensor filtering or revised confirmation logic is needed before field use. The HIL tests confirmed real-time execution on the StarSim platform, but because the signals were mapped interface outputs and the controllers used different sensing information, the results should be viewed as implementation-oriented evidence rather than a hardware-generalized ranking.
6. Conclusions
This study proposed ICS-Synergetic Control, a hybrid global-local MPPT framework combining improved cuckoo-search-based peak-region exploration, candidate verification, synergetic regulation, and operating-point locking. Two variants were implemented: ICS-SC-I with module-level irradiance information and ICS-SC-E without it.
In 30 independent four-stage Group-I simulations, ICS-SC-I achieved the highest mean captured energy of 0.571990 Wh, the highest trajectory energy utilization of 96.992%, the lowest mean steady-state error of 1.196%, and 120/120 successful sustained ±2% GMPP events. The results show a better balance between global-peak localization, transition recovery, and steady-state tracking than the baseline controllers.
The sensing and ablation results show that the performance benefit depends partly on module-level irradiance information and efficient search scheduling. ICS-SC-I captured 0.572092 Wh, whereas electrical-only ICS-SC-E captured 0.530486 Wh and was slightly below PSO and NSPSO-INC under Group-E. HIL tests confirmed real-time execution on the StarSim platform, but broader validation with measured weather profiles, uncertainty analysis, converter-loss modeling, and physical prototypes remains necessary.
Author Contributions
Conceptualization, B.Z. and J.L.; methodology, B.Z.; software, W.Y. and R.X.; validation, B.Z. and J.L.; formal analysis, B.Z.; investigation, B.Z.; resources, J.L. and W.Y.; data curation, B.Z. and R.X.; writing—original draft preparation, B.Z.; writing—review and editing, J.L. and W.Y.; visualization, B.Z.; supervision, J.L. and W.Y.; project administration, J.L.; funding acquisition, B.Z. All authors have read and agreed to the published version of the manuscript.
Funding
This research was partially funded by the University-Level Scientific Research Project of Huainan Normal University for the Year 2026 (Grant Number: 2026XJZD022) and the Enterprise Horizontal Fund Project (Grant Number: 2025HX438).
Data Availability Statement
The data presented in this study are available from the corresponding author upon reasonable request. The raw hardware-in-the-loop waveforms and processing files are not publicly available because they are associated with an ongoing research project.
Conflicts of Interest
The authors declare no conflicts of interest.
References
- Aslam, A.; Ahmed, N.; Qureshi, S.A.; Assadi, M.; Ahmed, N. Advances in Solar PV Systems; A Comprehensive Review of PV Performance, Influencing Factors, and Mitigation Techniques. Energies 2022, 15, 7595. [Google Scholar] [CrossRef] [Scilit]
- Bassi, H.; Salam, Z.; Ramli, M.Z.; Sindi, H.; Rawa, M. Hardware Approach to Mitigate the Effects of Module Mismatch in a Grid-connected Photovoltaic System: A Review. Energies 2019, 12, 4321. [Google Scholar] [CrossRef] [Scilit]
- Pathy, S.; Subramani, C.; Sridhar, R.; Thamizh Thentral, T.M.; Padmanaban, S. Nature-Inspired MPPT Algorithms for Partially Shaded PV Systems: A Comparative Study. Energies 2019, 12, 1451. [Google Scholar] [CrossRef] [Scilit]
- Badawi, A.; Elzein, I.M.; Matter, K.; El-bayeh, C.Z.; Ali, H.; Zyoud, A. A State-of-the-Art Comprehensive Review on Maximum Power Tracking Algorithms for Photovoltaic Systems and New Technology of the Photovoltaic Applications. Energies 2025, 18, 6555. [Google Scholar] [CrossRef] [Scilit]
- Femia, N.; Petrone, G.; Spagnuolo, G.; Vitelli, M. Optimization of Perturb and Observe Maximum Power Point Tracking Method. IEEE Trans. Power Electron. 2005, 20, 963–973. [Google Scholar] [CrossRef] [Scilit]
- Safari, A.; Mekhilef, S. Simulation and Hardware Implementation of Incremental Conductance MPPT With Direct Control Method Using Cuk Converter. IEEE Trans. Ind. Electron. 2011, 58, 1154–1161. [Google Scholar] [CrossRef] [Scilit]
- Alhazmi, A. A Comprehensive Survey of AI/ML-Driven Optimization, Predictive Control, and Innovative Solar Technologies. Energies 2026, 19, 1847. [Google Scholar] [CrossRef] [Scilit]
- Al-Dahidi, S.; Madhiarasan, M.; Al-Ghussain, L.; Abubaker, A.M.; Ahmad, A.D.; Alrbai, M.; Aghaei, M.; Alahmer, H.; Alahmer, A.; Baraldi, P.; et al. Forecasting Solar Photovoltaic Power Production: A Comprehensive Review and Innovative Data-Driven Modeling Framework. Energies 2024, 17, 4145. [Google Scholar] [CrossRef] [Scilit]
- Ishaque, K.; Salam, Z.; Shamsudin, A.; Amjad, M. A direct control based maximum power point tracking method for photovoltaic system under partial shading conditions using particle swarm optimization algorithm. Appl. Energy 2012, 99, 414–422. [Google Scholar] [CrossRef] [Scilit]
- Javed, S.; Ishaque, K.; Siddique, S.A.; Salam, Z. A Simple Yet Fully Adaptive PSO Algorithm for Global Peak Tracking of Photovoltaic Array Under Partial Shading Conditions. IEEE Trans. Ind. Electron. 2022, 69, 5922–5930. [Google Scholar] [CrossRef] [Scilit]
- Koh, J.S.; Tan, R.H.G.; Lim, W.H.; Tan, N.M.L. A Modified Particle Swarm Optimization for Efficient Maximum Power Point Tracking Under Partial Shading Condition. IEEE Trans. Sustain. Energy 2023, 14, 1822–1834. [Google Scholar] [CrossRef] [Scilit]
- Sundareswaran, K.; Sankar, P.; Nayak, P.S.R.; Simon, S.P.; Palani, S. Enhanced Energy Output From a PV System Under Partial Shaded Conditions Through Artificial Bee Colony. IEEE Trans. Sustain. Energy 2015, 6, 198–209. [Google Scholar] [CrossRef] [Scilit]
- Sundareswaran, K.; Peddapati, S.; Palani, S. MPPT of PV Systems Under Partial Shaded Conditions Through a Colony of Flashing Fireflies. IEEE Trans. Energy Convers. 2014, 29, 463–472. [Google Scholar] [CrossRef] [Scilit]
- Mohanty, S.; Subudhi, B.; Ray, P.K. A New MPPT Design Using Grey Wolf Optimization Technique for Photovoltaic System Under Partial Shading Conditions. IEEE Trans. Sustain. Energy 2016, 7, 181–188. [Google Scholar] [CrossRef] [Scilit]
- Jiang, L.L.; Maskell, D.L.; Patra, J.C. A novel ant colony optimization-based maximum power point tracking for photovoltaic systems under partially shaded conditions. Energy Build. 2013, 58, 227–236. [Google Scholar] [CrossRef] [Scilit]
- Ali, E.M.; Abdelsalam, A.K.; Youssef, K.H.; Hossam-Eldin, A.A. An Enhanced Cuckoo Search Algorithm Fitting for Photovoltaic Systems’ Global Maximum Power Point Tracking under Partial Shading Conditions. Energies 2021, 14, 7210. [Google Scholar] [CrossRef] [Scilit]
- Alajmi, B.N.; Ahmed, K.H.; Finney, S.J.; Williams, B.W. A Maximum Power Point Tracking Technique for Partially Shaded Photovoltaic Systems in Microgrids. IEEE Trans. Ind. Electron. 2013, 60, 1596–1606. [Google Scholar] [CrossRef] [Scilit]
- Boubaker, O. MPPT techniques for photovoltaic systems: A systematic review in current trends and recent advances in artificial intelligence. Discov. Energy 2023, 3, 9. [Google Scholar] [CrossRef] [Scilit]
- Rukhsar; Ajmal, A.M.; Yang, Y. Global Maximum Power Point Tracking of Photovoltaic Systems Using Artificial Intelligence. Energies 2025, 18, 3036. [Google Scholar] [CrossRef] [Scilit]
- Worku, M.Y.; Hassan, M.A.; Maraaba, L.S.; Shafiullah, M.; Elkadeem, M.R.; Hossain, M.I.; Abido, M.A. A Comprehensive Review of Recent Maximum Power Point Tracking Techniques for Photovoltaic Systems under Partial Shading. Sustainability 2023, 15, 11132. [Google Scholar] [CrossRef] [Scilit]
- Eltamaly, A.M.; Al-Saud, M.S.; Abokhalil, A.G. A novel scanning bat algorithm strategy for maximum power point tracker of partially shaded photovoltaic energy systems. Ain Shams Eng. J. 2020, 11, 1093–1103. [Google Scholar] [CrossRef] [Scilit]
- Mansoor, M.; Mirza, A.F.; Ling, Q. Harris hawk optimization-based MPPT control for PV systems under partial shading conditions. J. Clean. Prod. 2020, 274, 122857. [Google Scholar] [CrossRef] [Scilit]
- Yang, B.; Zhong, L.; Zhang, X.; Shu, H.; Yu, T.; Li, H.; Jiang, L.; Sun, L. Novel bio-inspired memetic salp swarm algorithm and application to MPPT for PV systems considering partial shading condition. J. Clean. Prod. 2019, 215, 1203–1222. [Google Scholar] [CrossRef] [Scilit]
- Kim, I.-S. Sliding mode controller for the single-phase grid-connected photovoltaic system. Appl. Energy 2006, 83, 1101–1115. [Google Scholar] [CrossRef] [Scilit]
- Villalva, M.G.; Gazoli, J.R.; Ruppert Filho, E. Comprehensive Approach to Modeling and Simulation of Photovoltaic Arrays. IEEE Trans. Power Electron. 2009, 24, 1198–1208. [Google Scholar] [CrossRef] [Scilit]
- Yang, X.-S.; Deb, S. Cuckoo Search via Lévy flights. In Proceedings of the 2009 World Congress on Nature & Biologically Inspired Computing (NaBIC), Coimbatore, India, 9–11 December 2009; pp. 210–214. [Google Scholar] [CrossRef] [Scilit]
- Salgotra, R.; Singh, S.; Verma, P.; Abualigah, L.; Gandomi, A.H. Mutation adaptive cuckoo search hybridized naked mole rat algorithm for industrial engineering problems. Sci. Rep. 2025, 15, 19655. [Google Scholar] [CrossRef] [Scilit] [PubMed]
- Tey, K.S.; Mekhilef, S.; Seyedmahmoudian, M.; Horan, B.; Oo, A.T.; Stojcevski, A. Improved Differential Evolution-Based MPPT Algorithm Using SEPIC for PV Systems Under Partial Shading Conditions and Load Variation. IEEE Trans. Ind. Inform. 2018, 14, 4322–4333. [Google Scholar] [CrossRef] [Scilit]
- Santi, E.; Monti, A.; Li, D.; Proddutur, K.; Dougal, R.A. Synergetic Control for Power Electronics Applications: A Comparison with the Sliding Mode Approach. J. Circuits Syst. Comput. 2004, 13, 737–760. [Google Scholar] [CrossRef] [Scilit]
- Behih, K.; Zerroug, N.; Bouchama, Z.; Essounbouli, N.; Benheniche, A.; Zebiri, F. Adaptive synergetic MPPT controller for optimal performance of photovoltaic systems. Arch. Control Sci. 2026, 36, 425–446. [Google Scholar] [CrossRef] [Scilit]
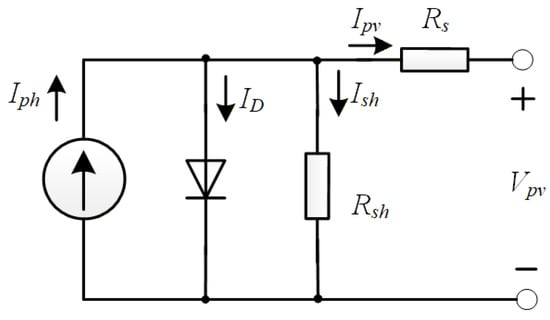
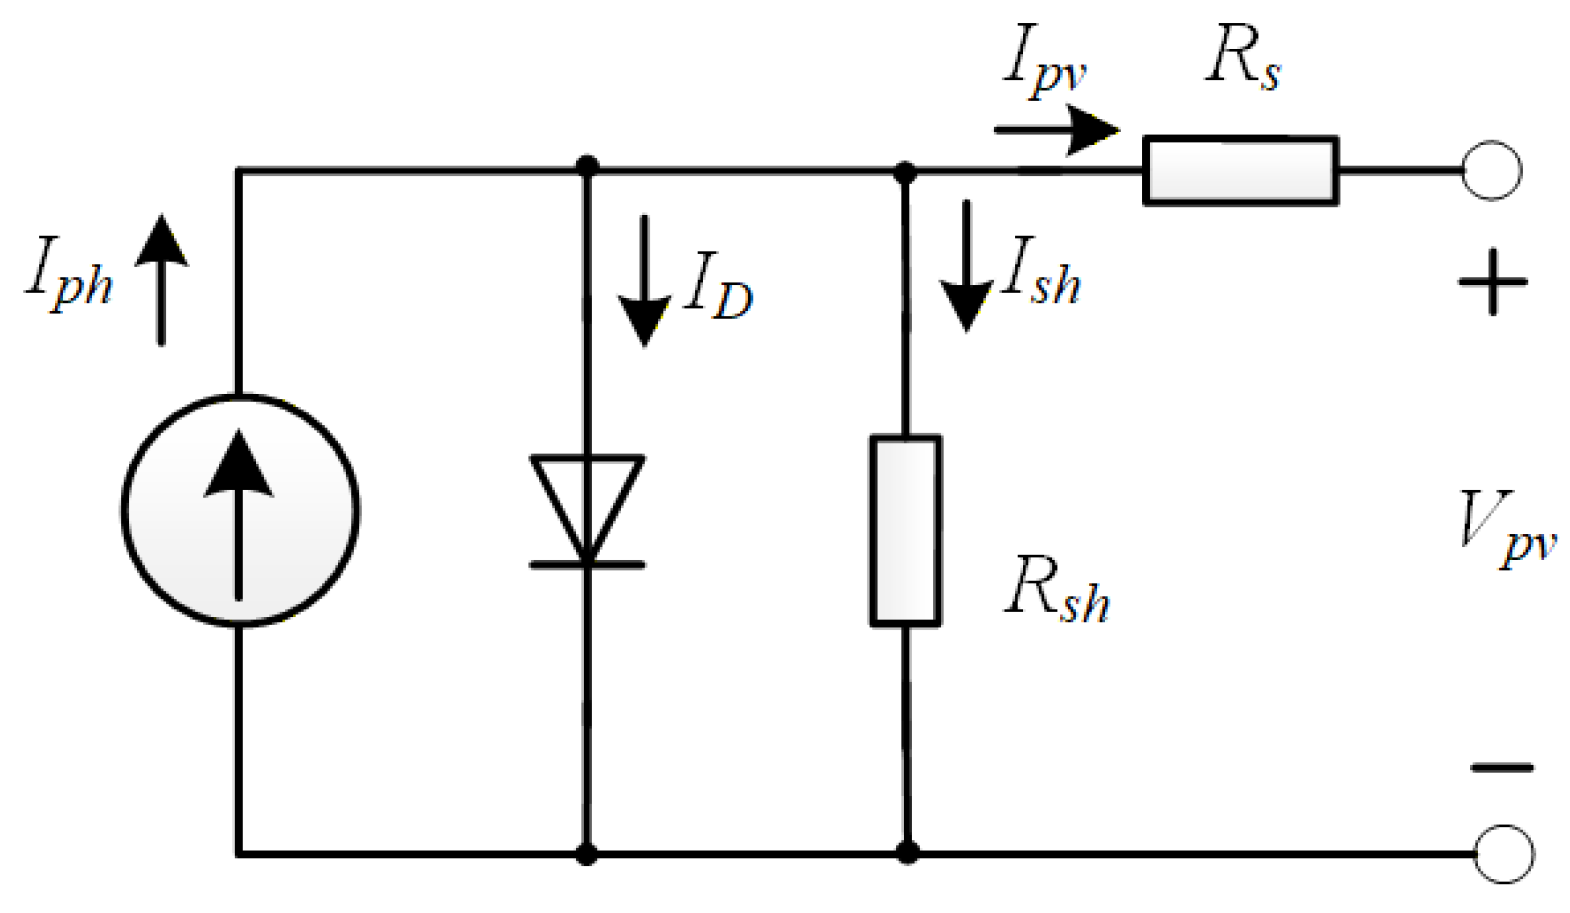
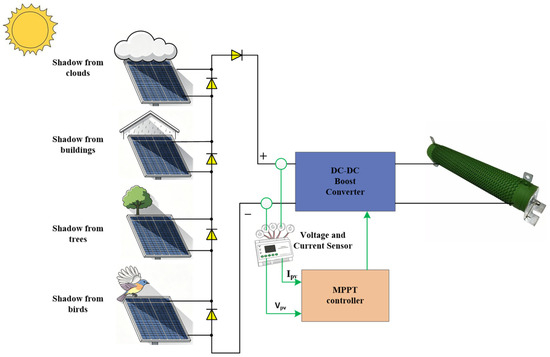
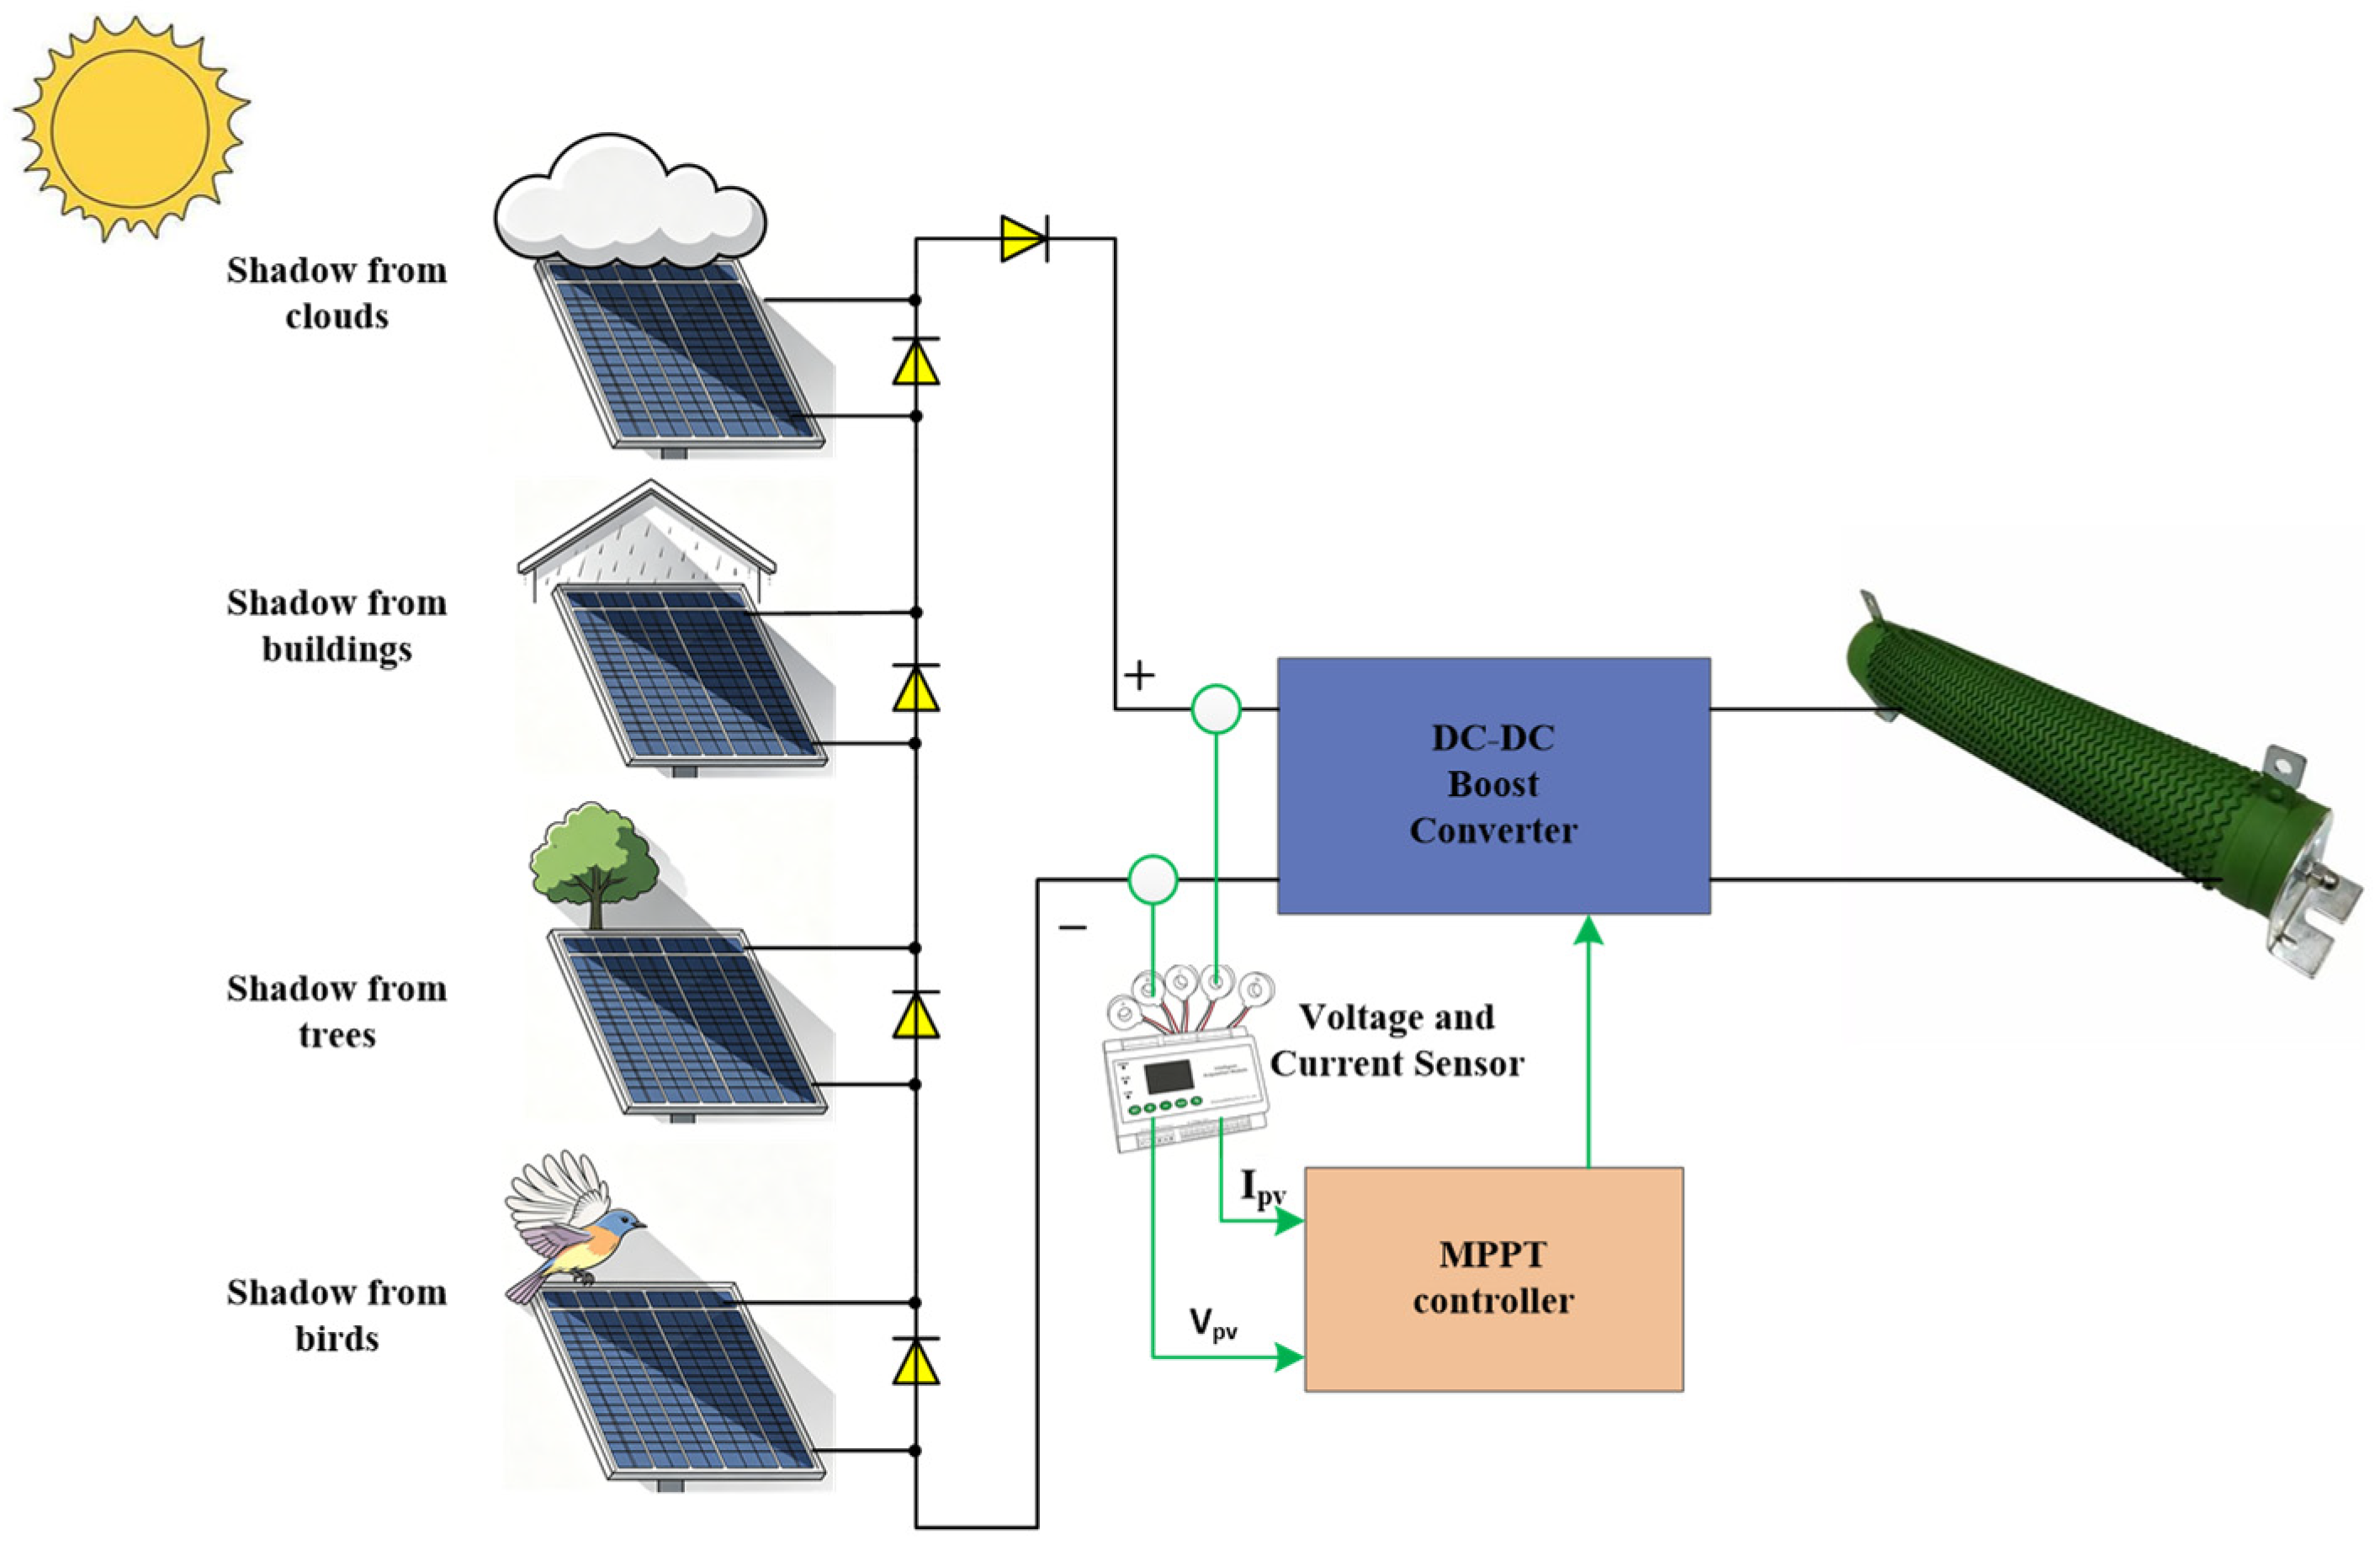
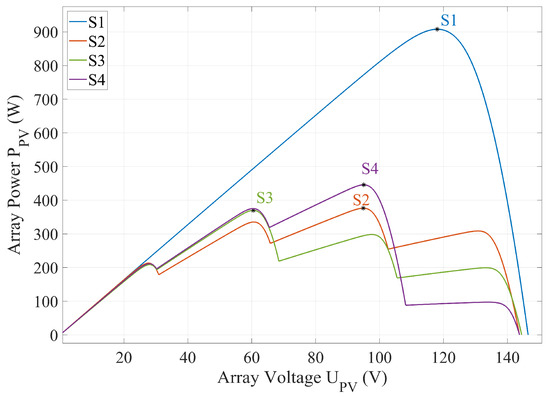
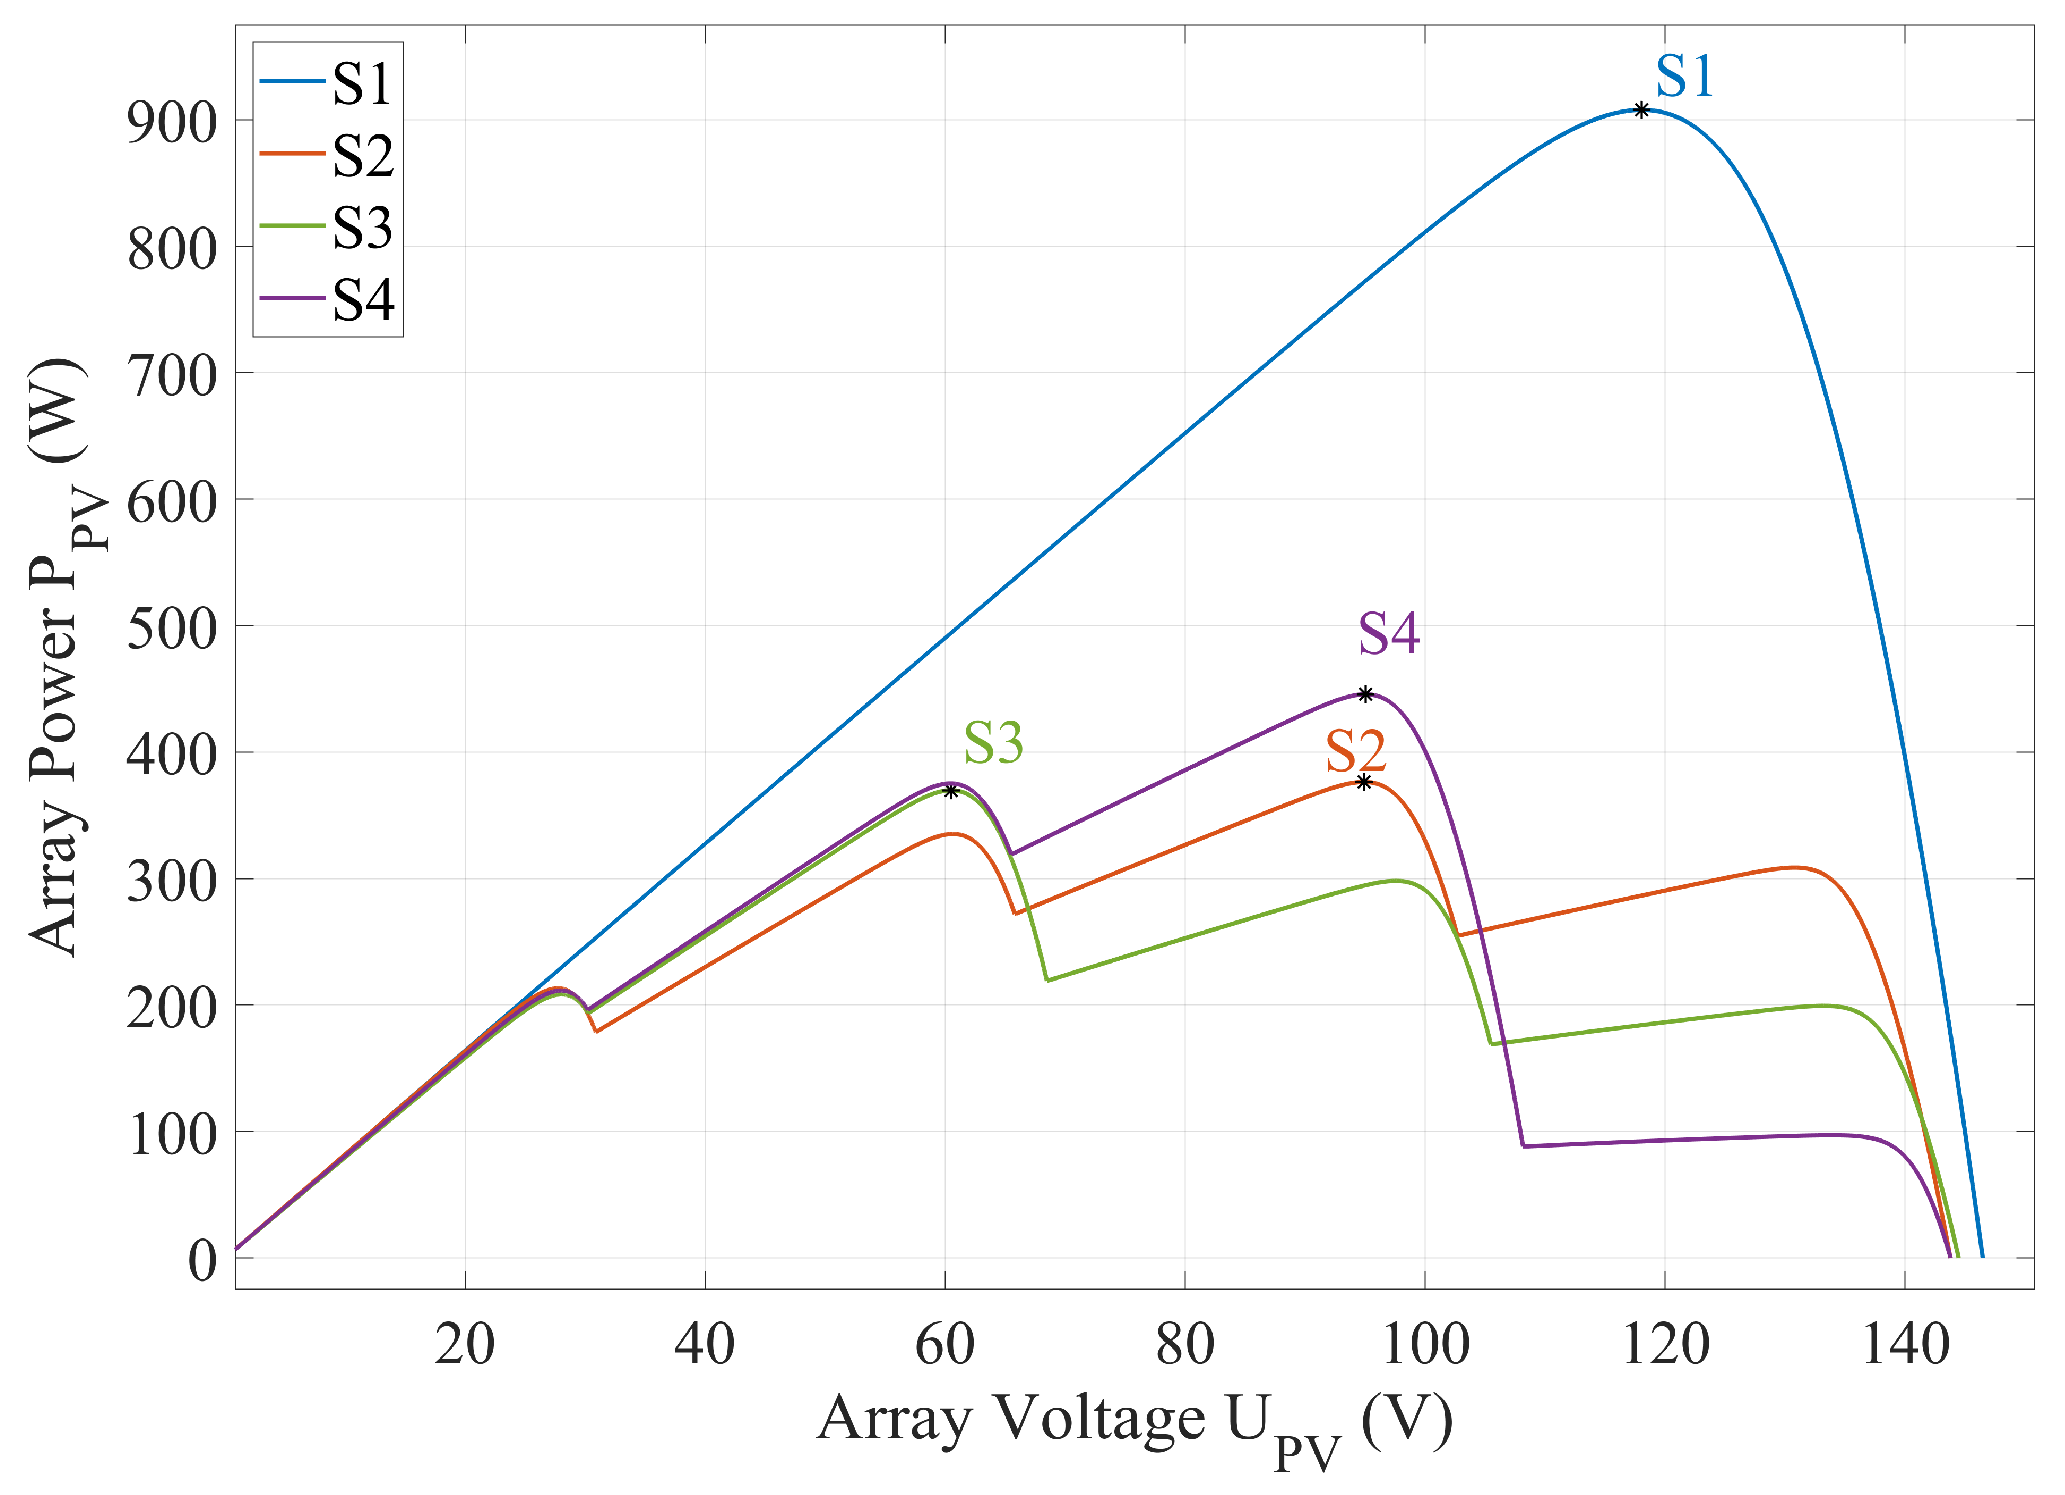
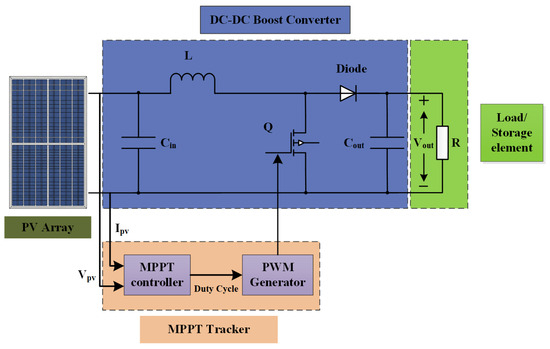
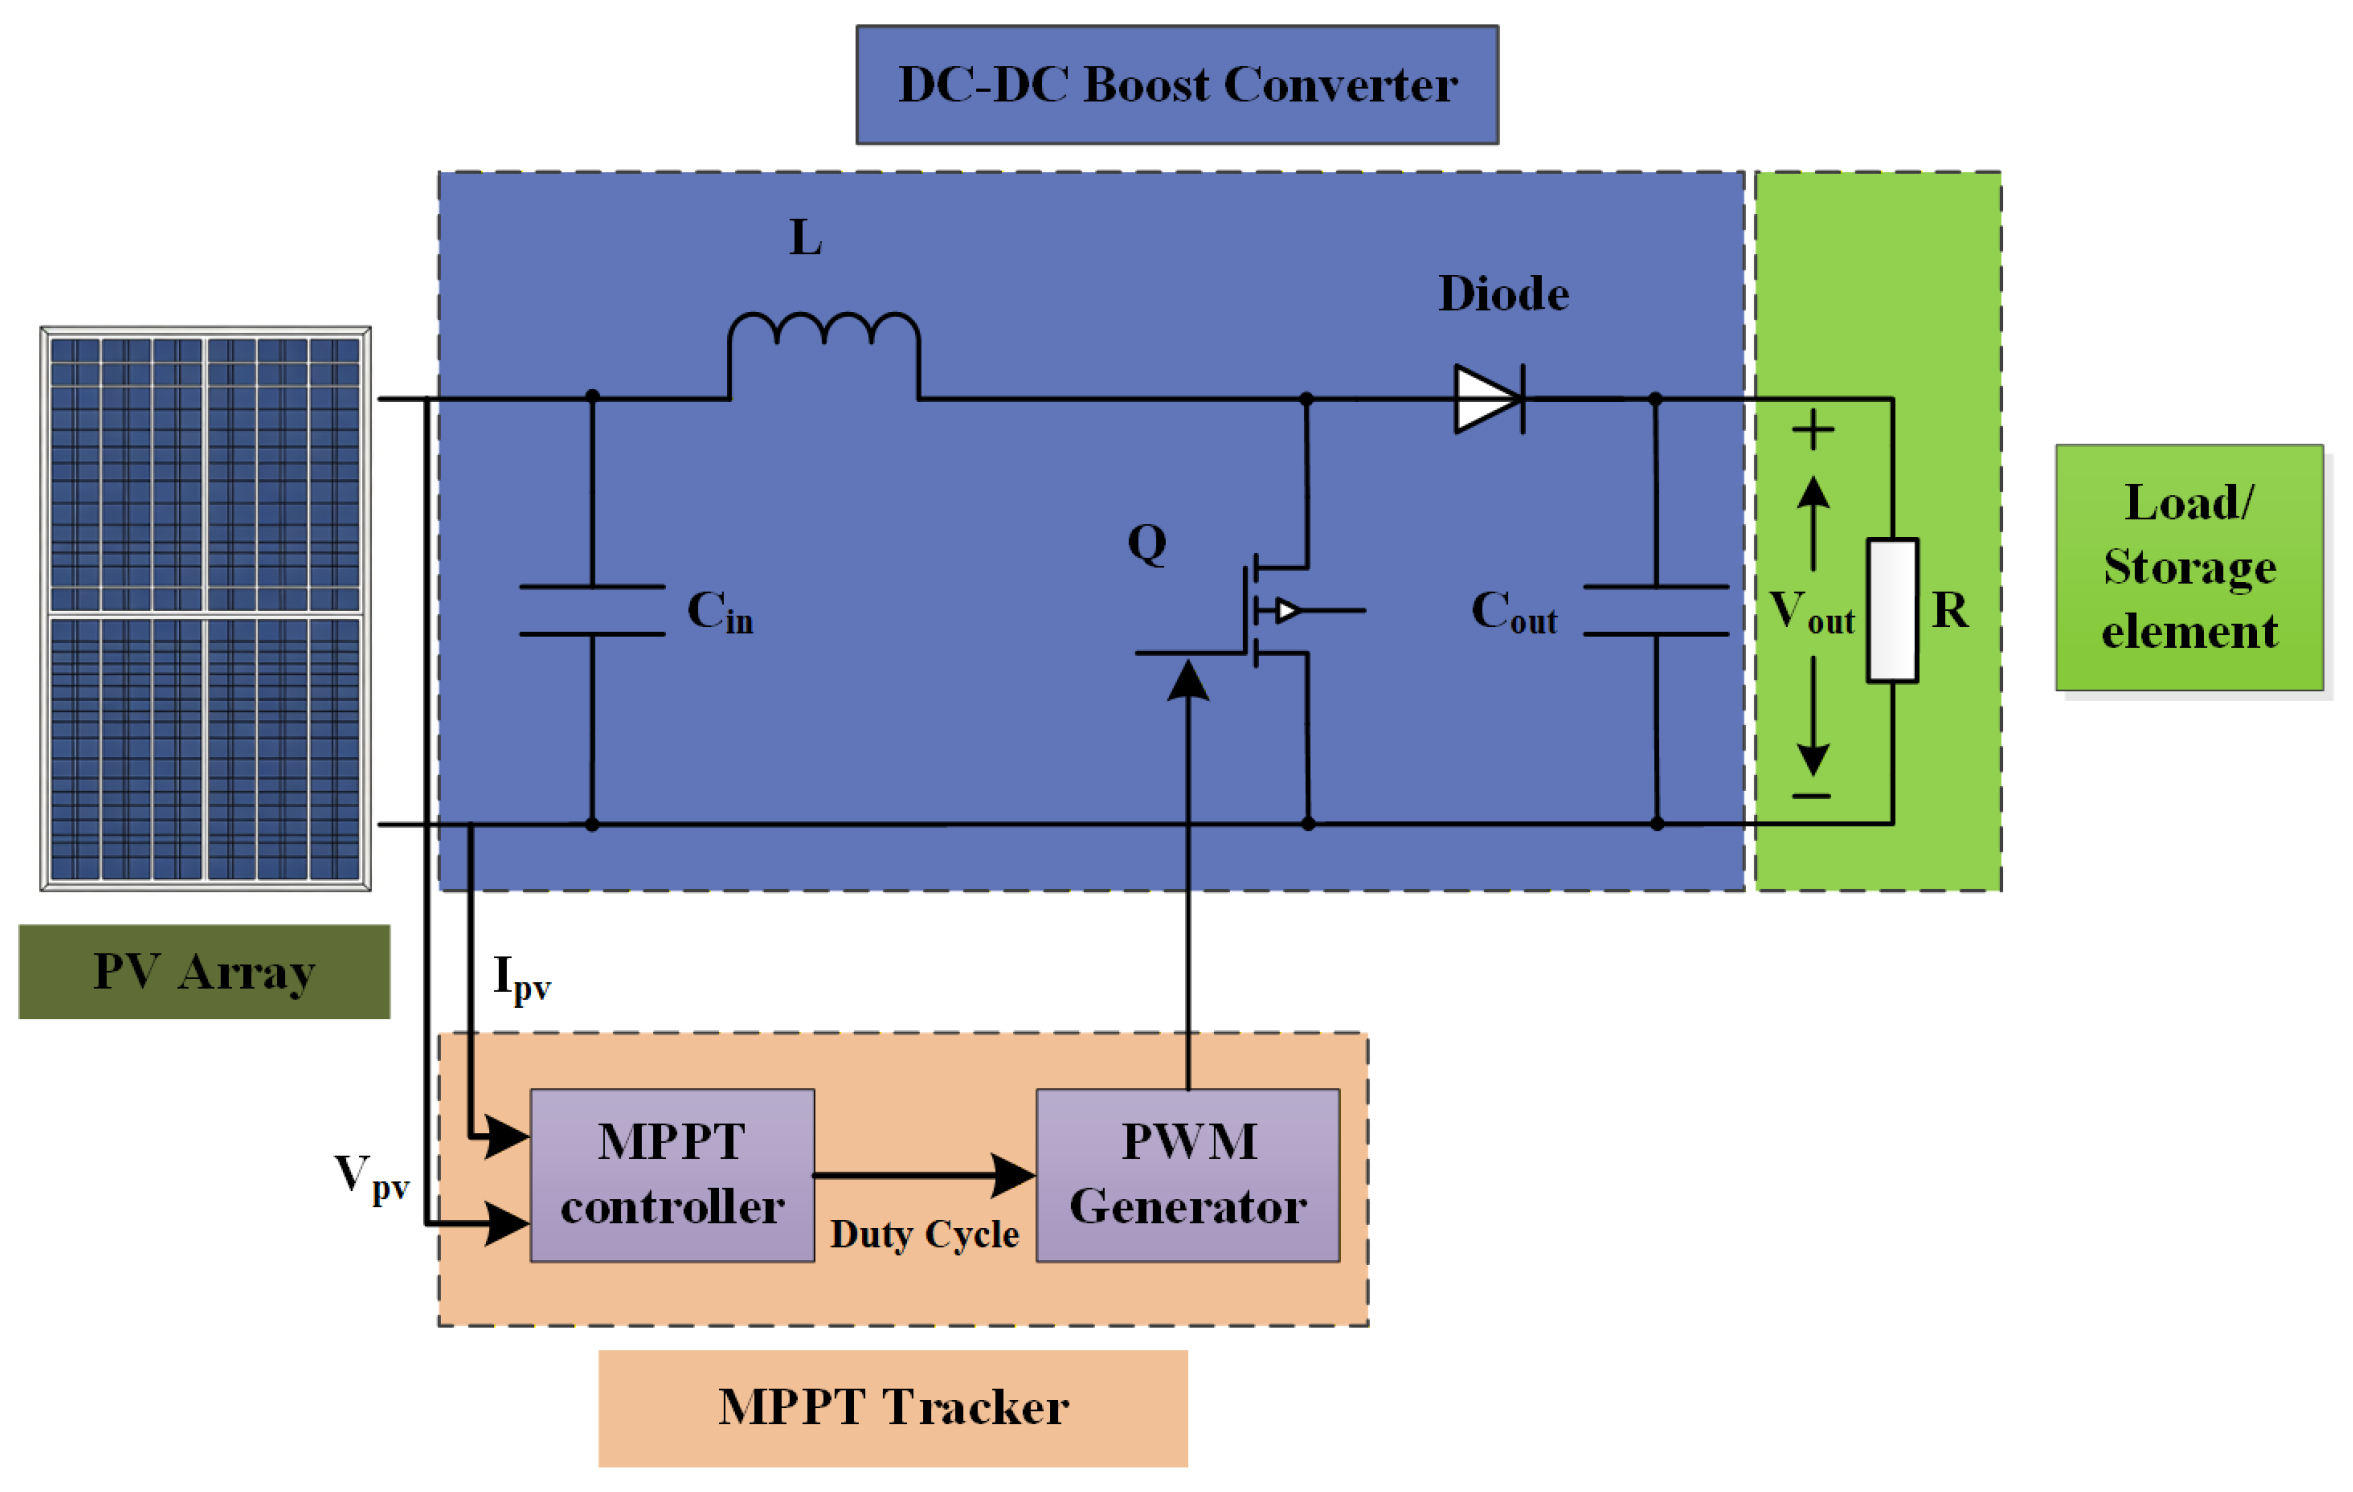
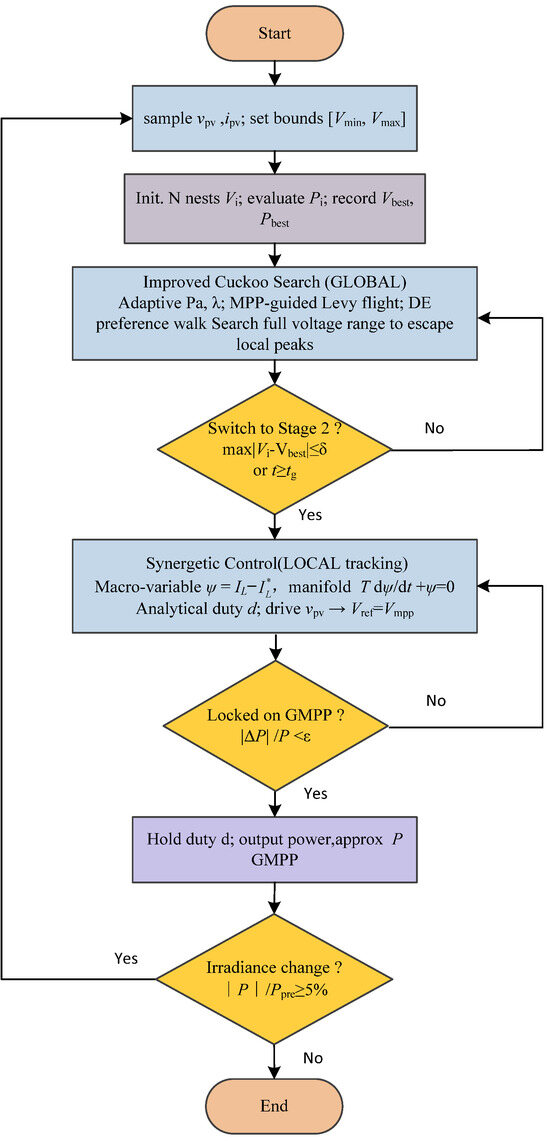
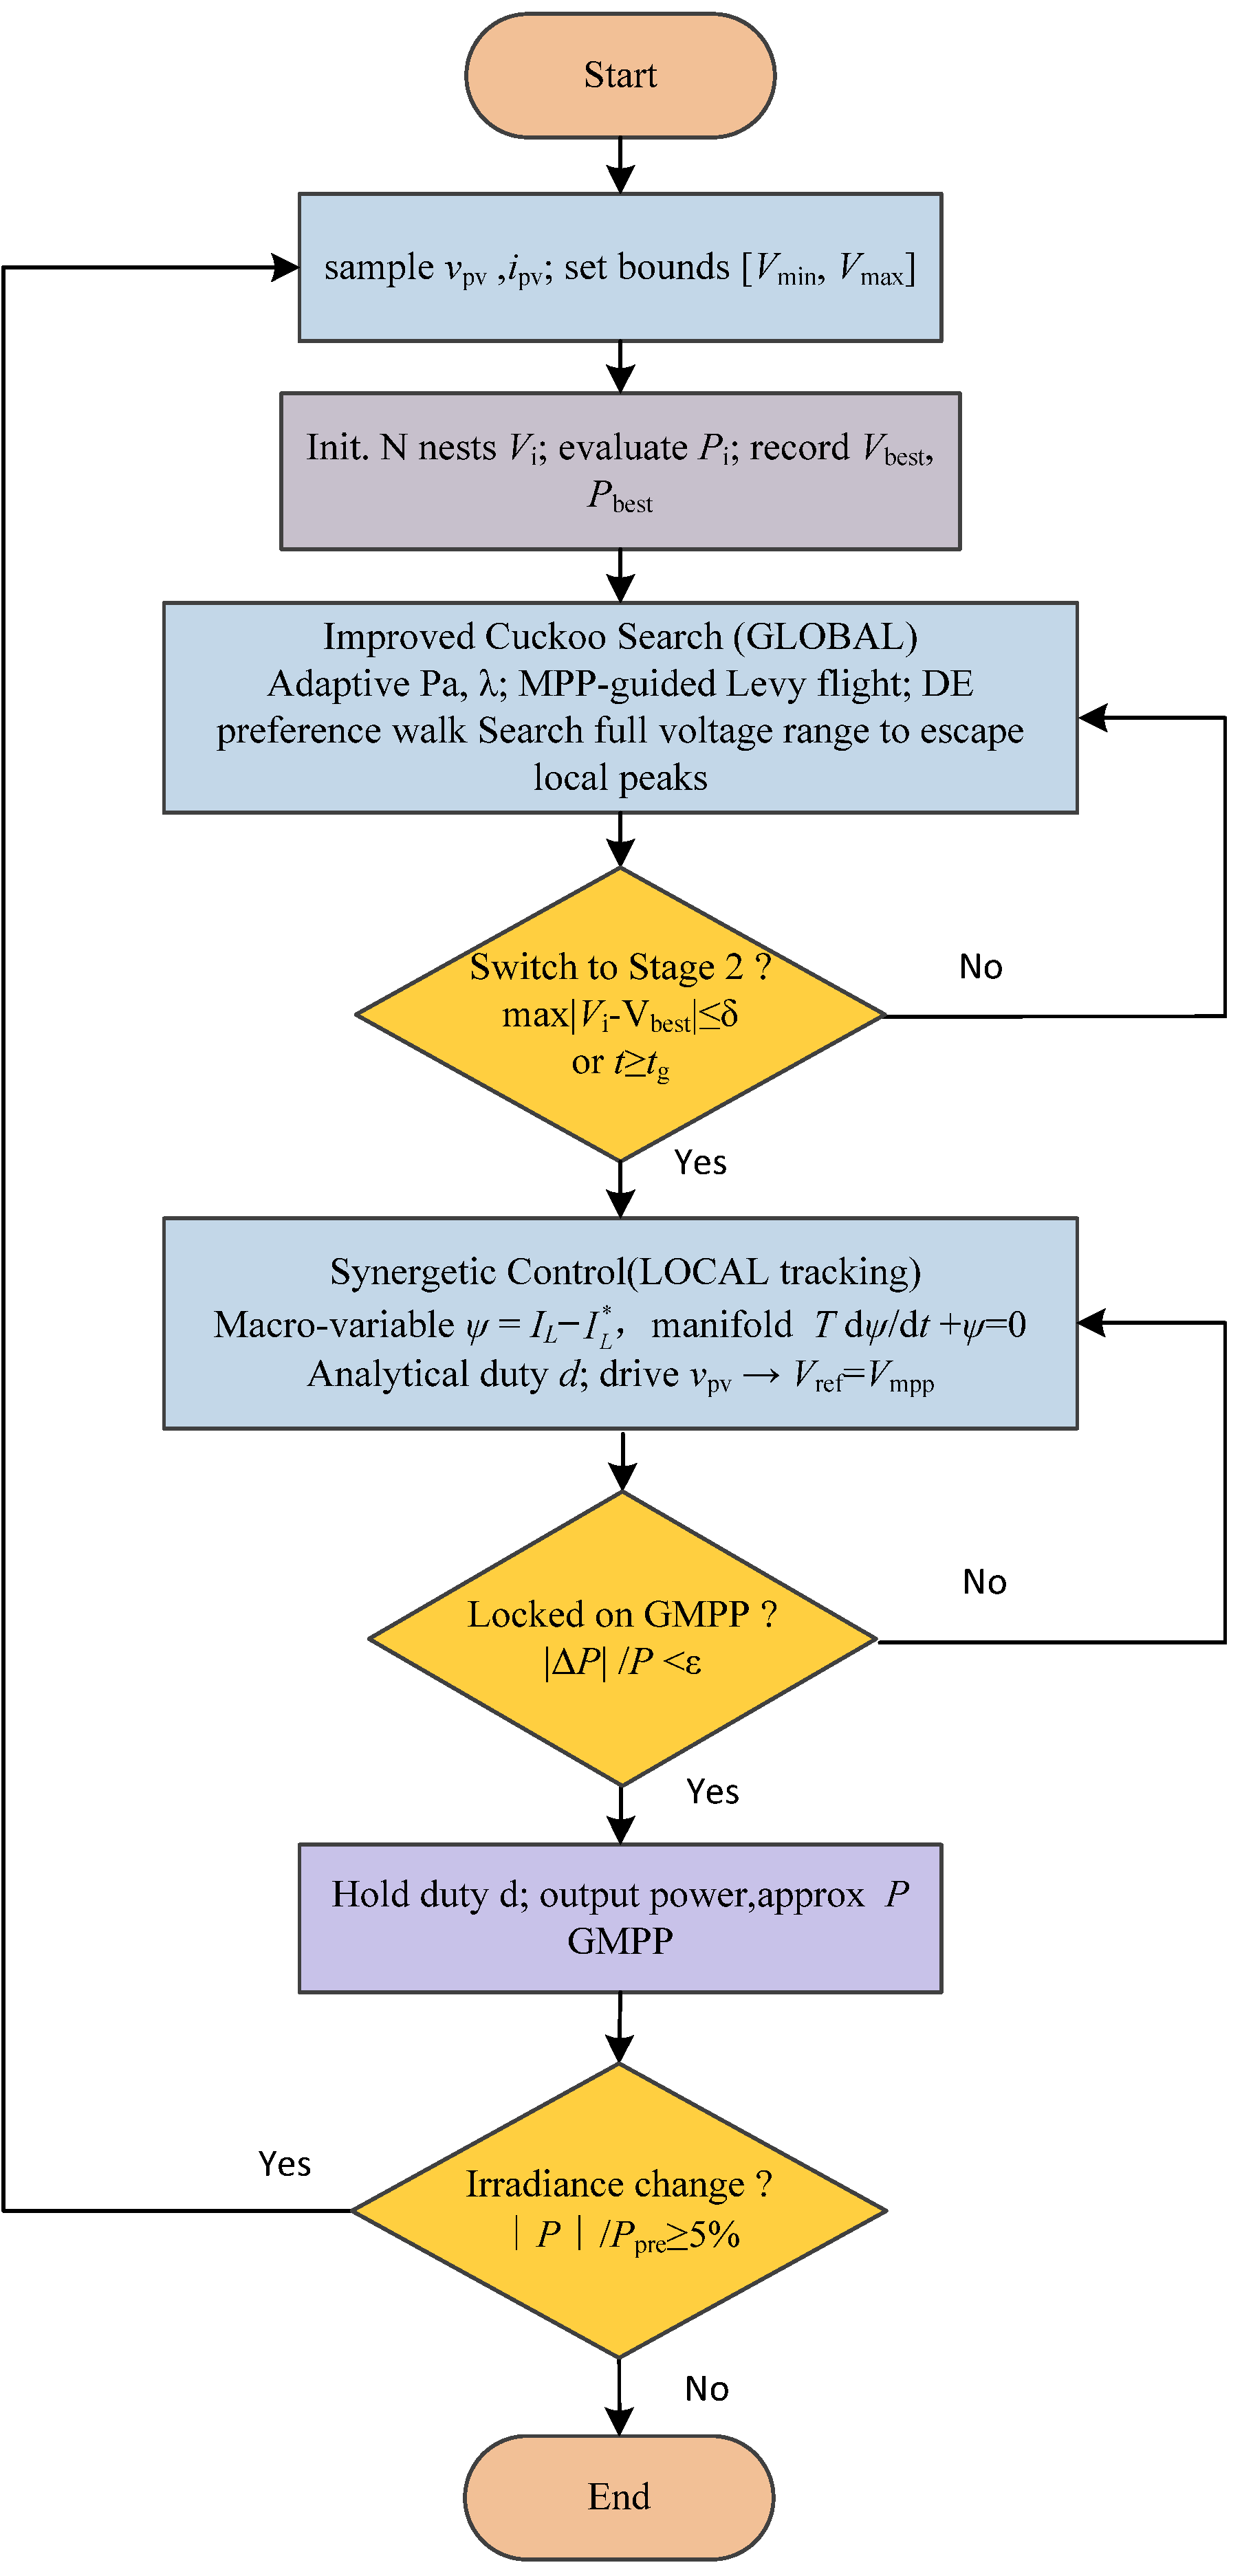
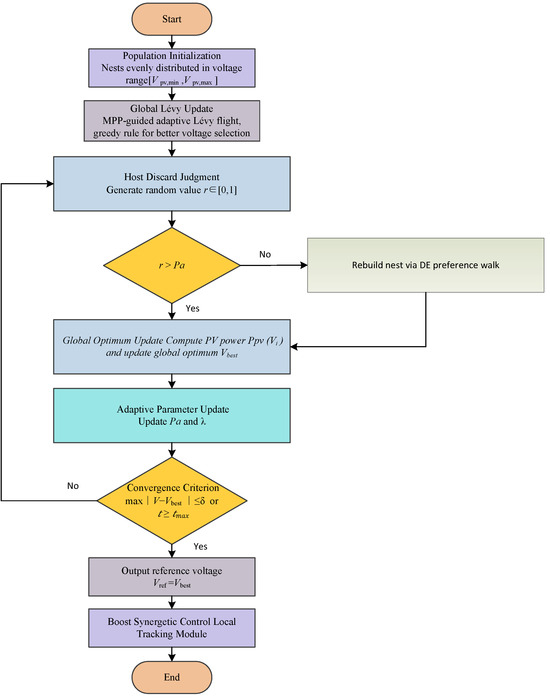
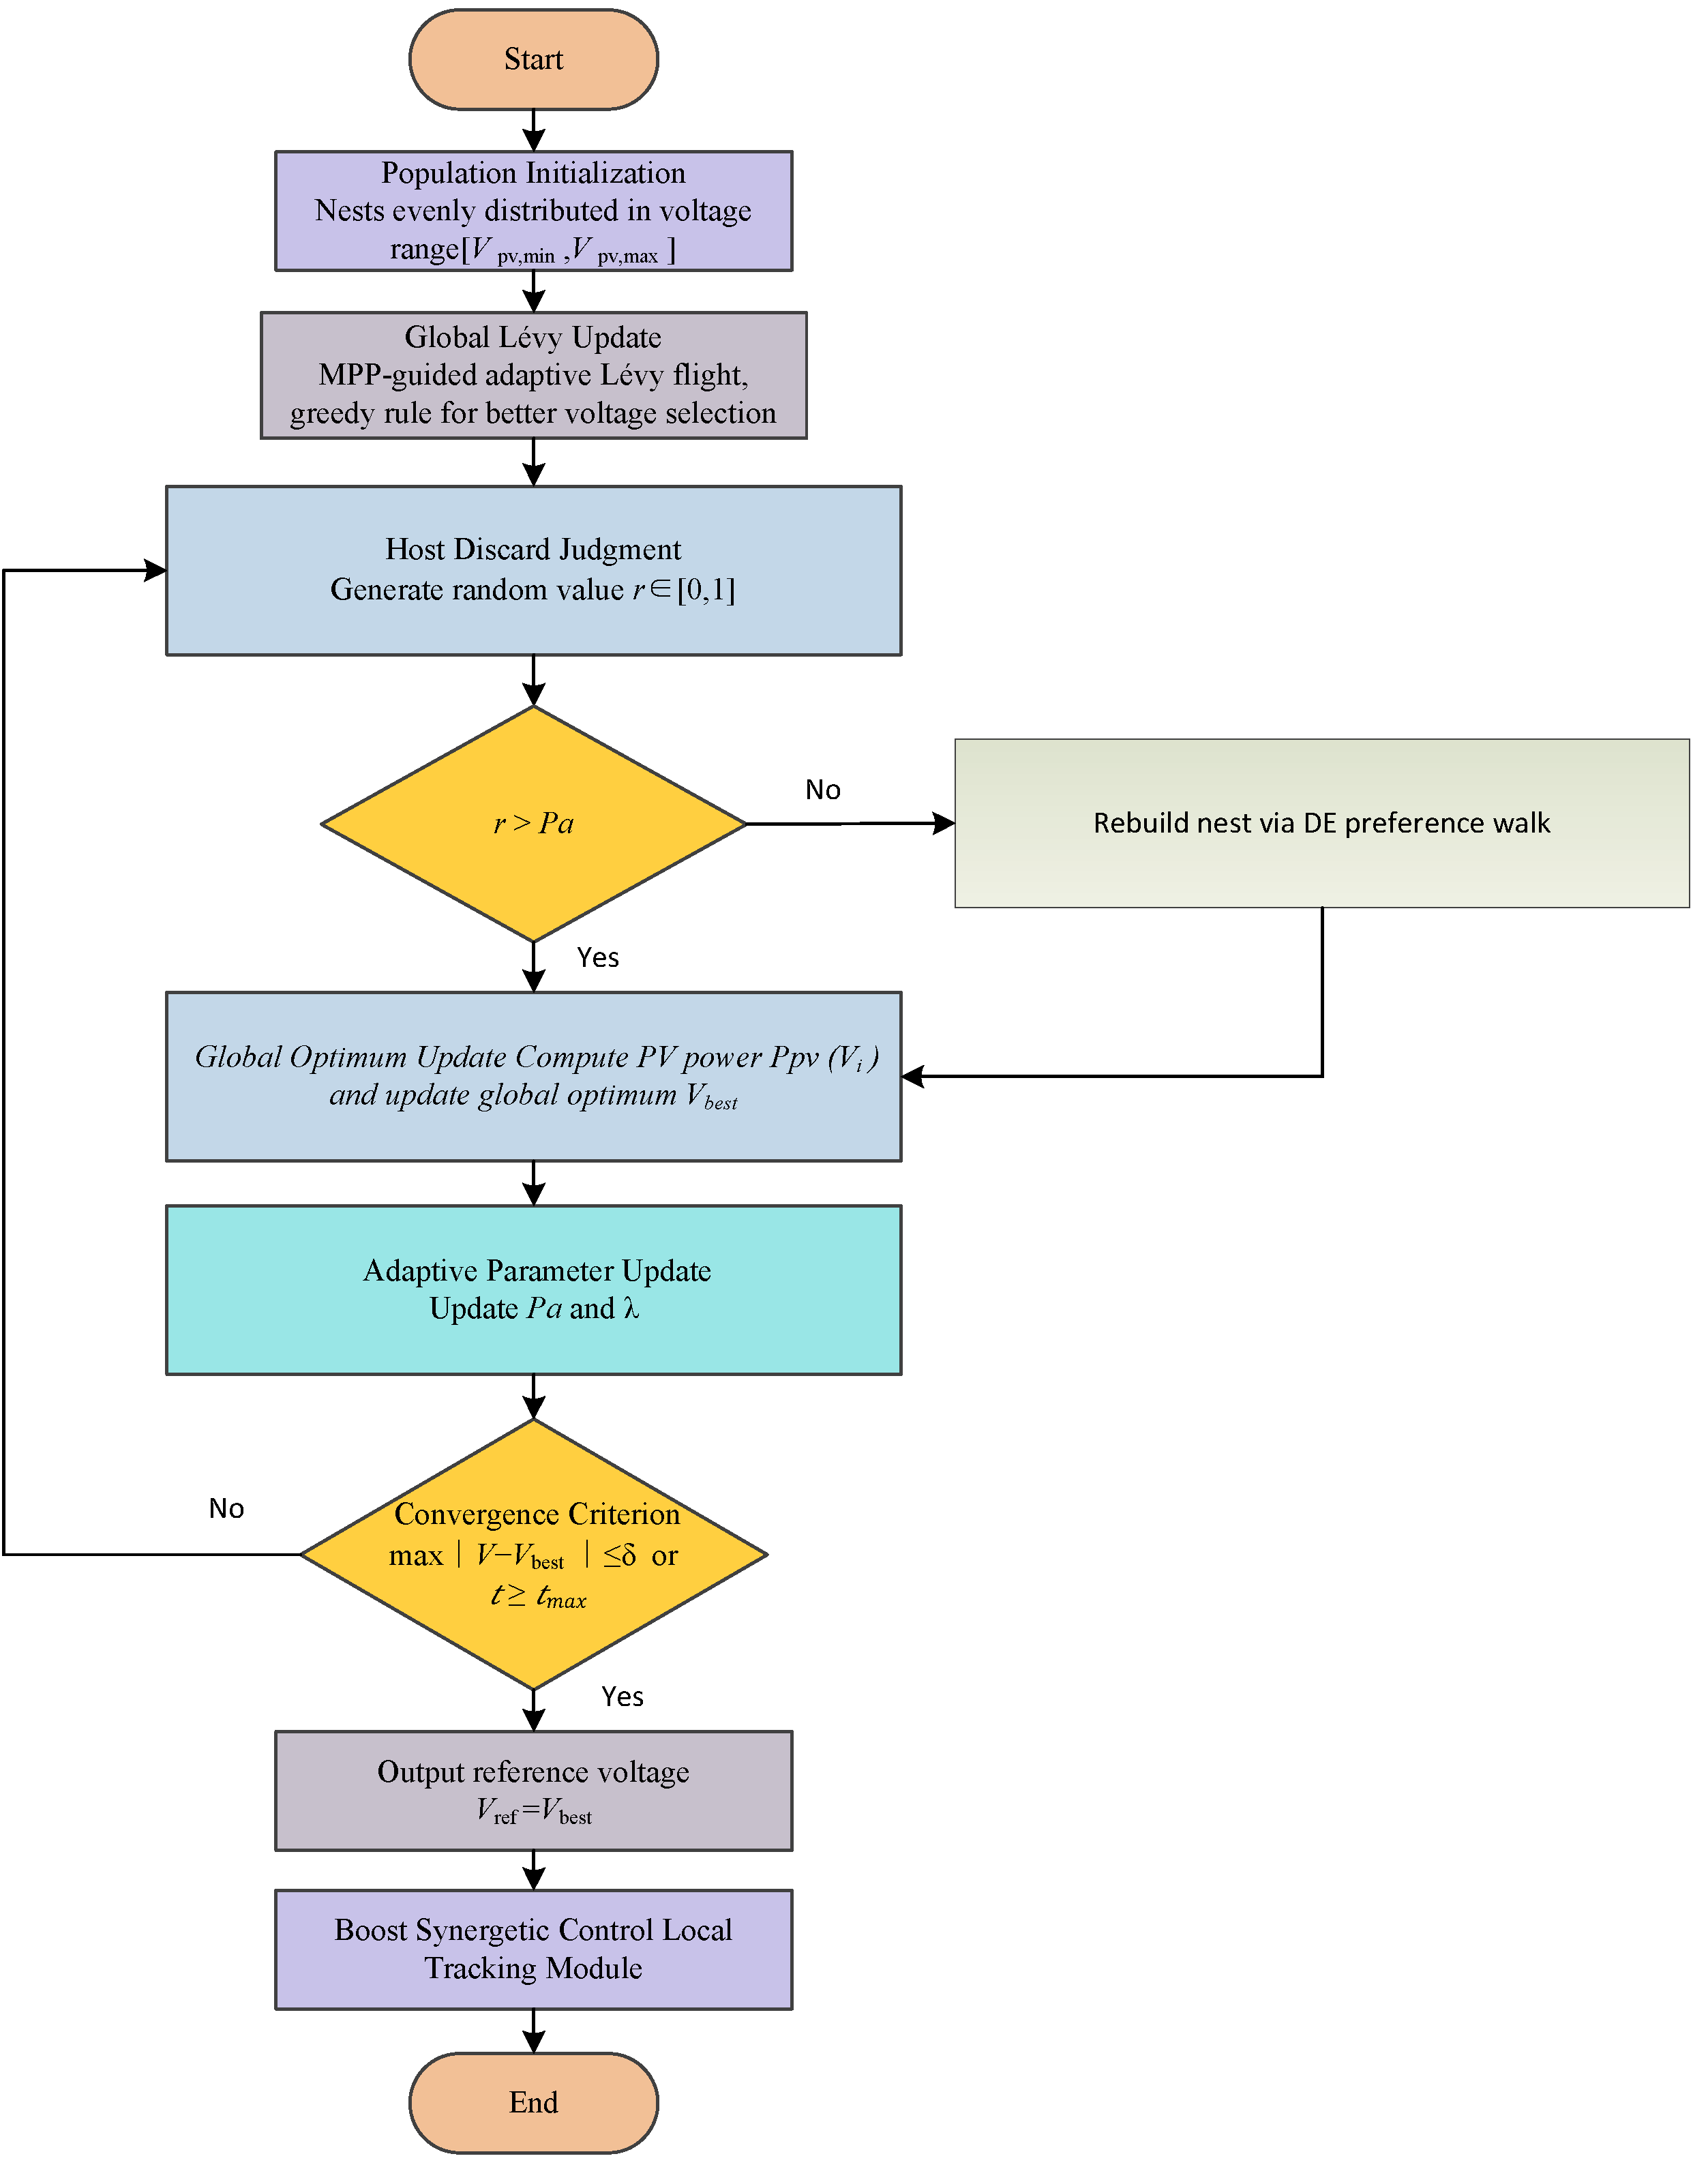
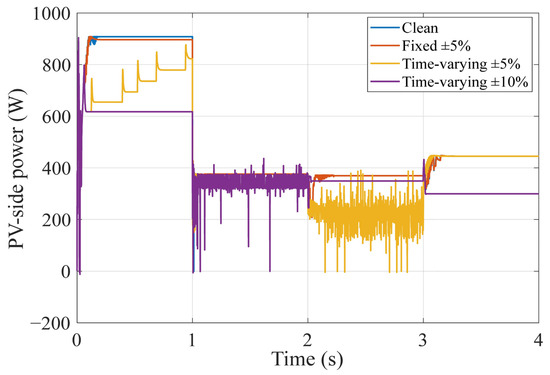
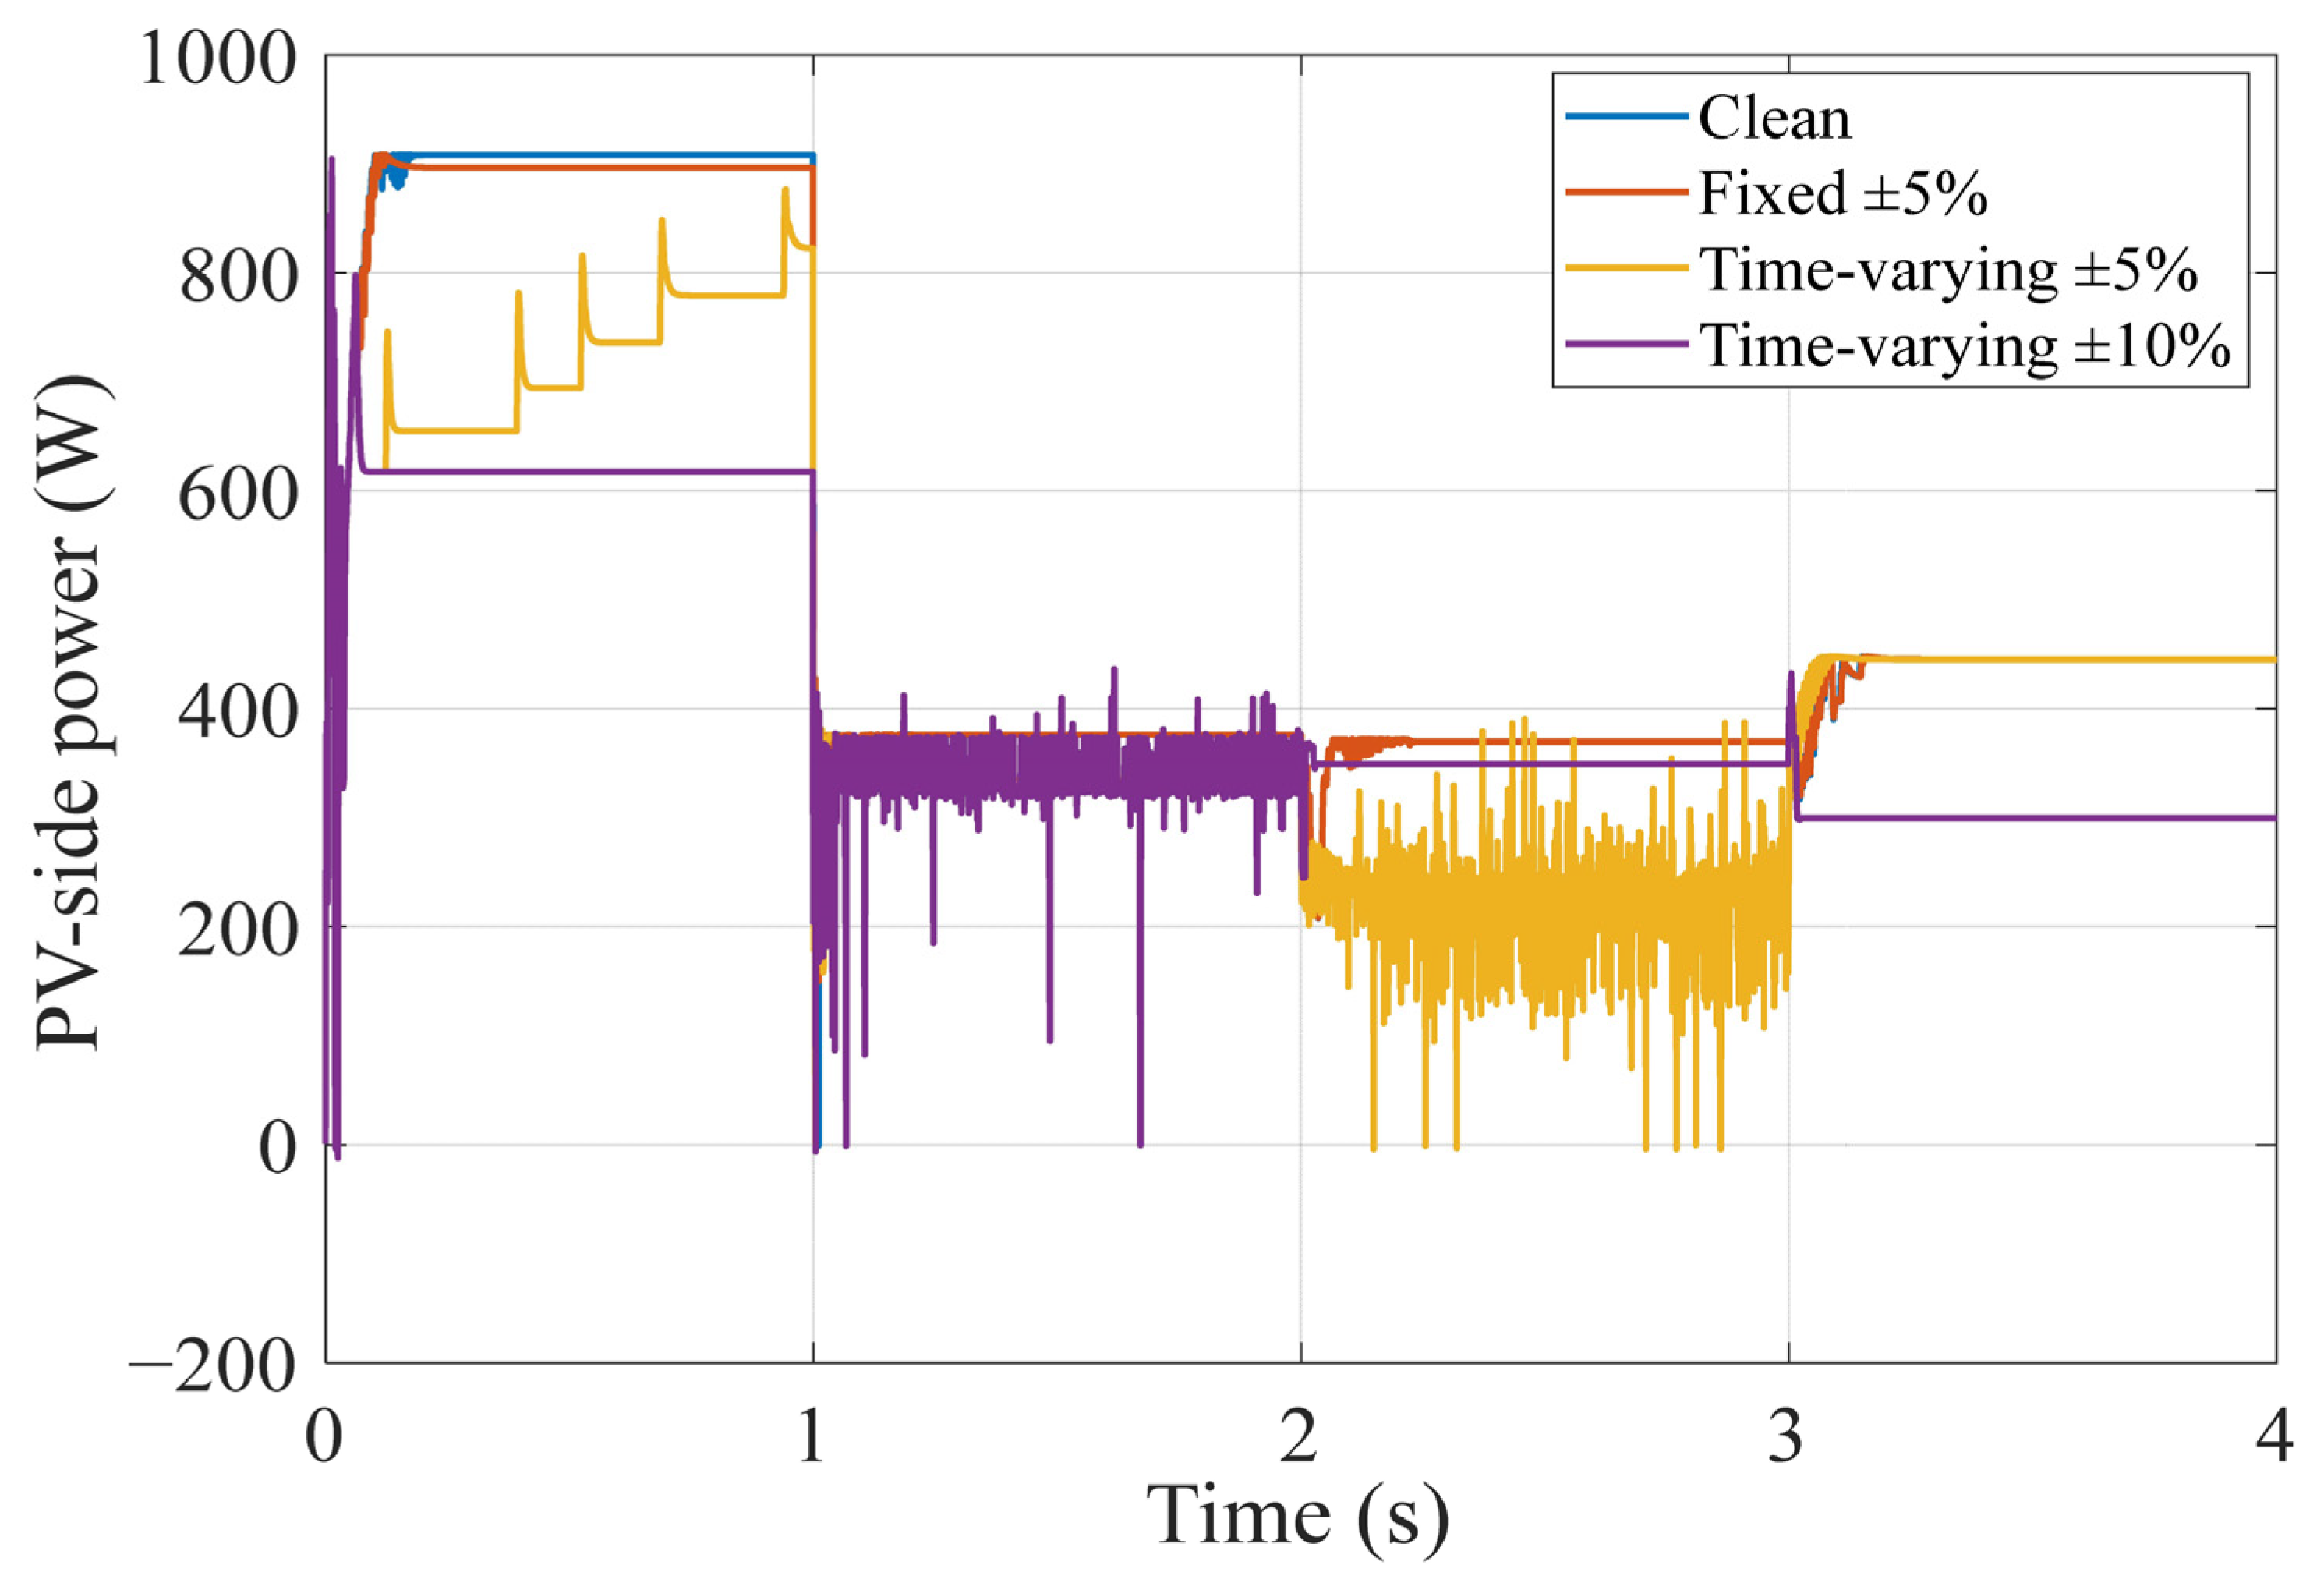
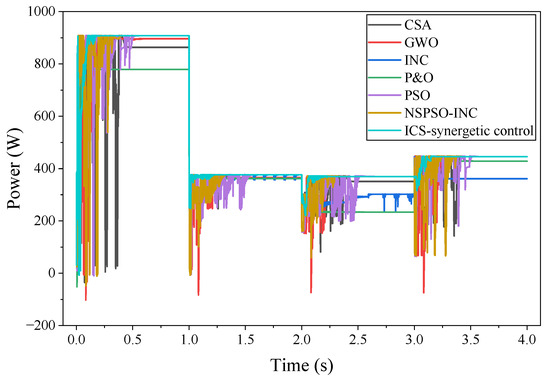
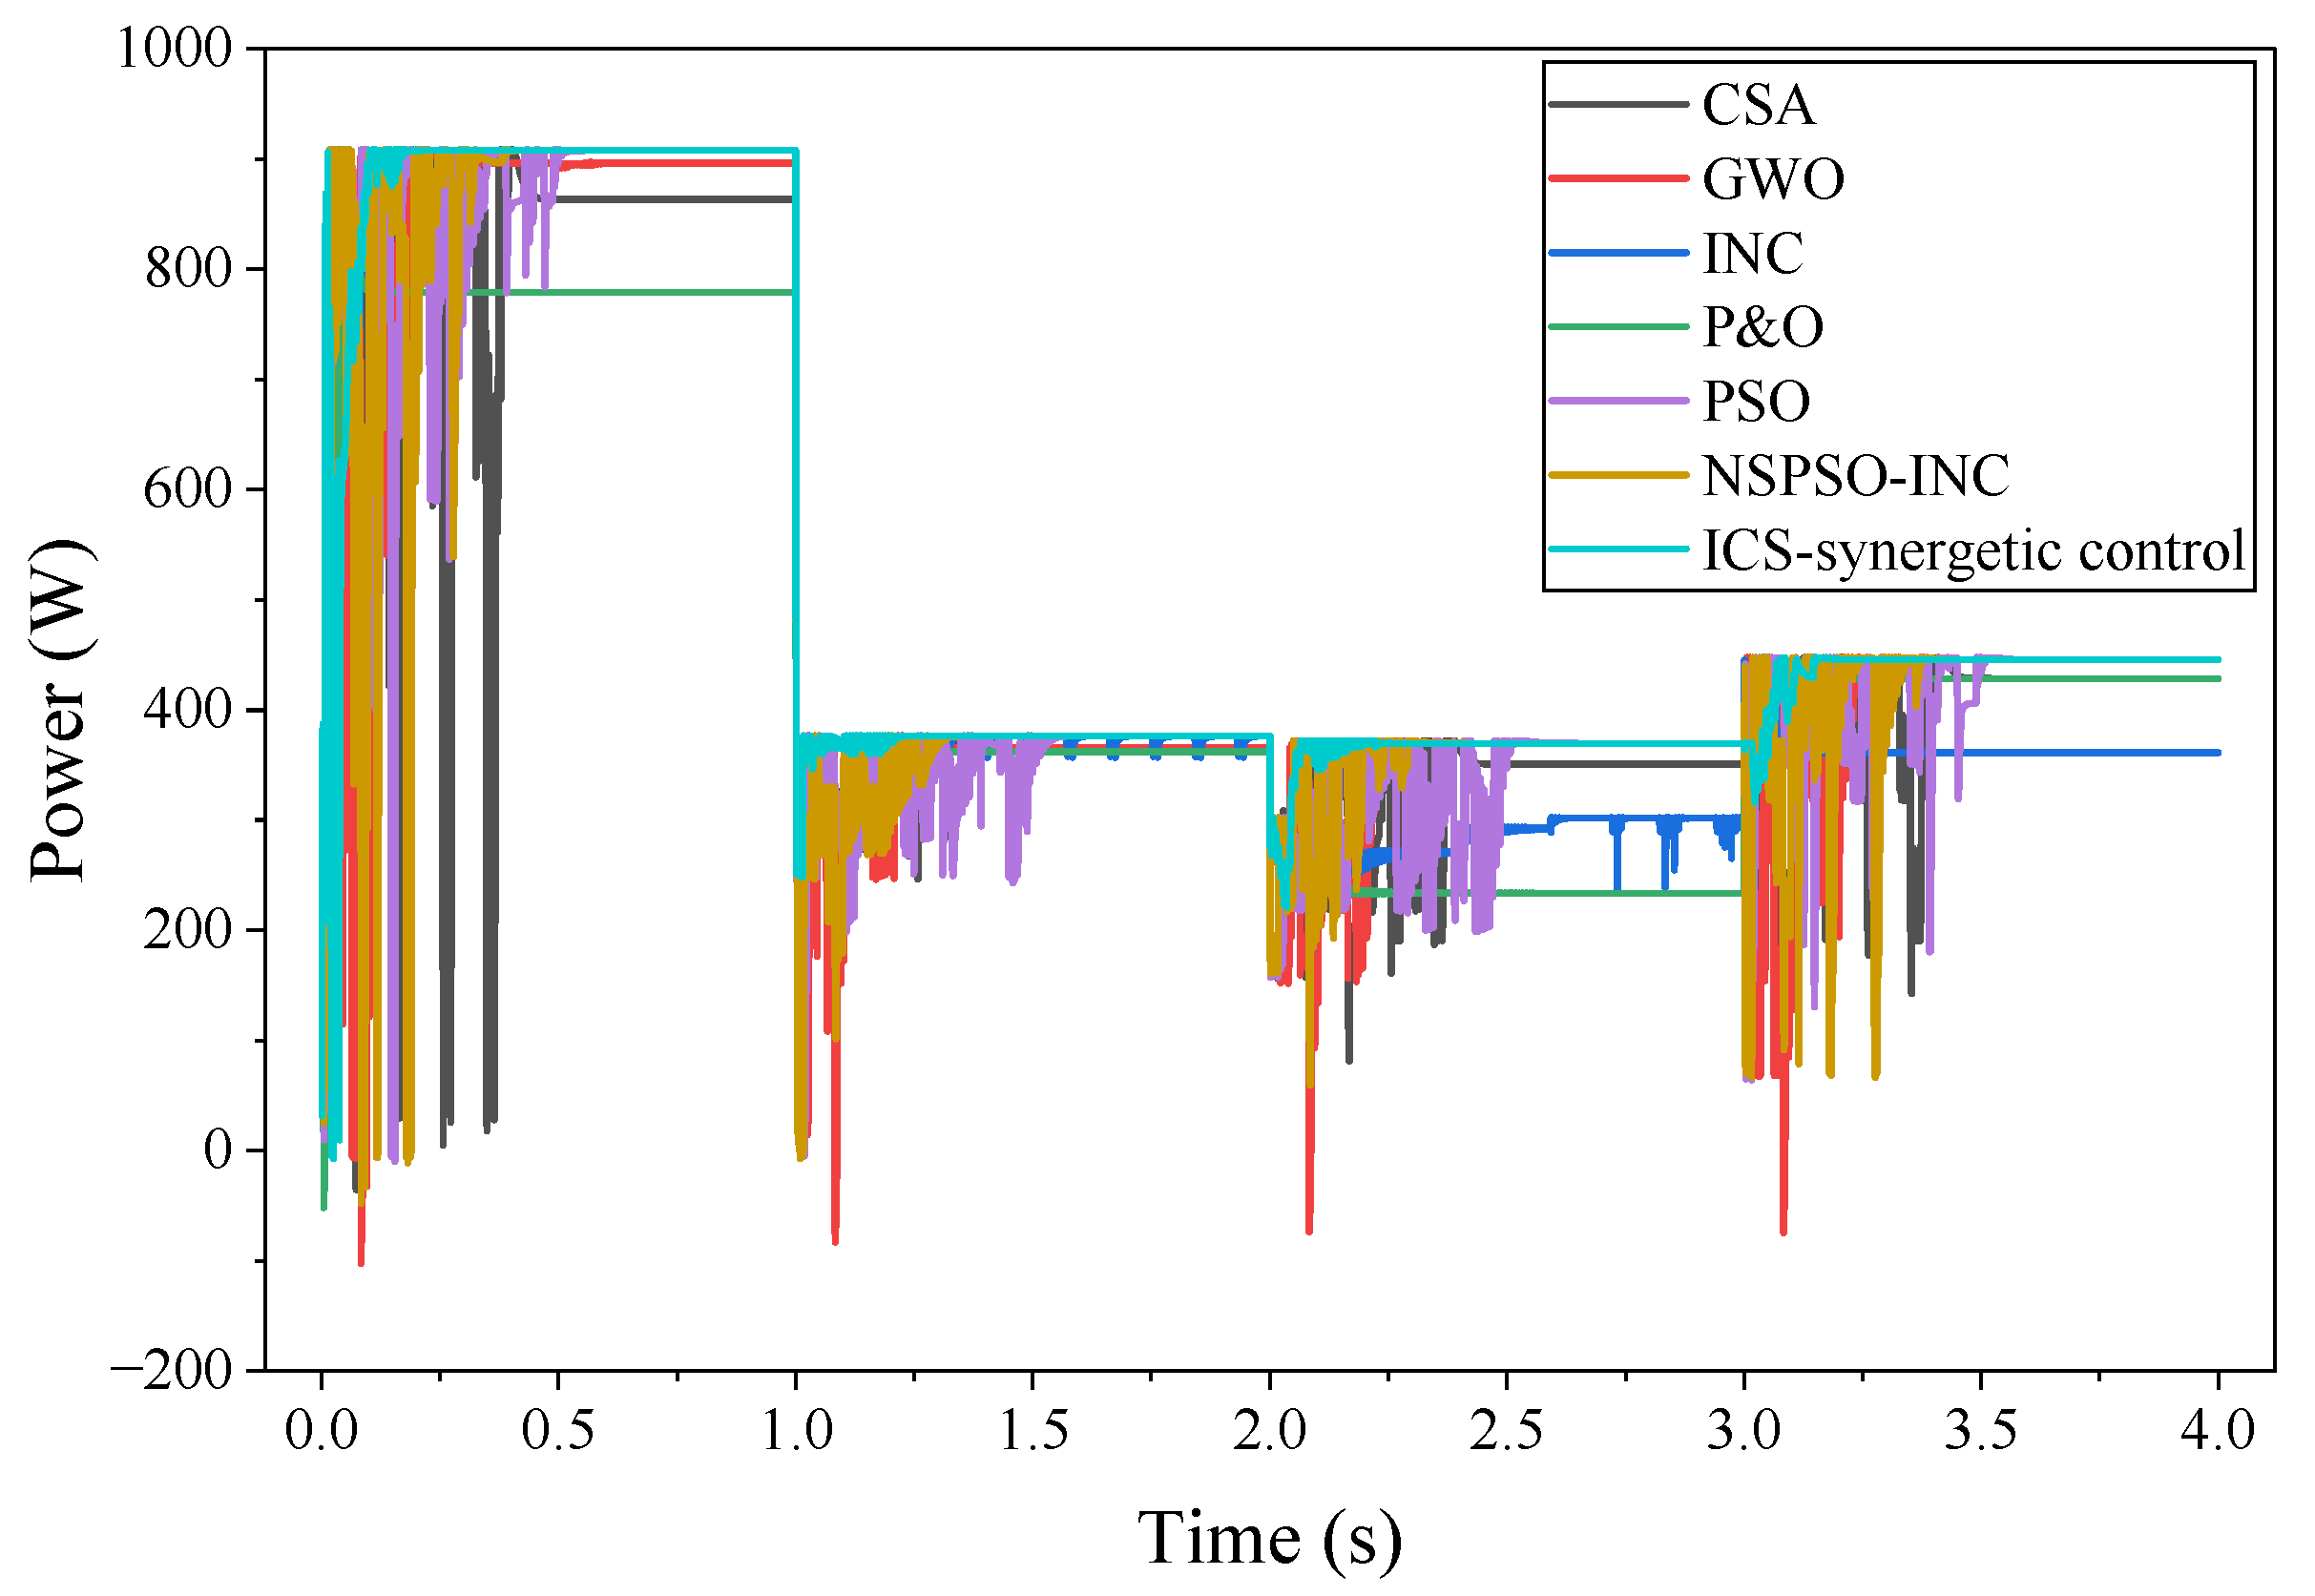
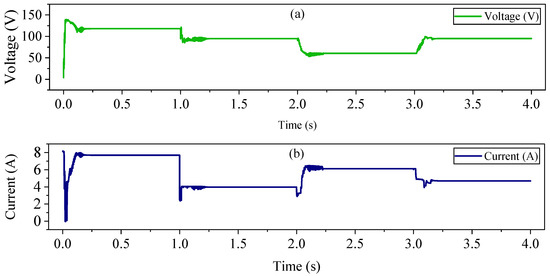
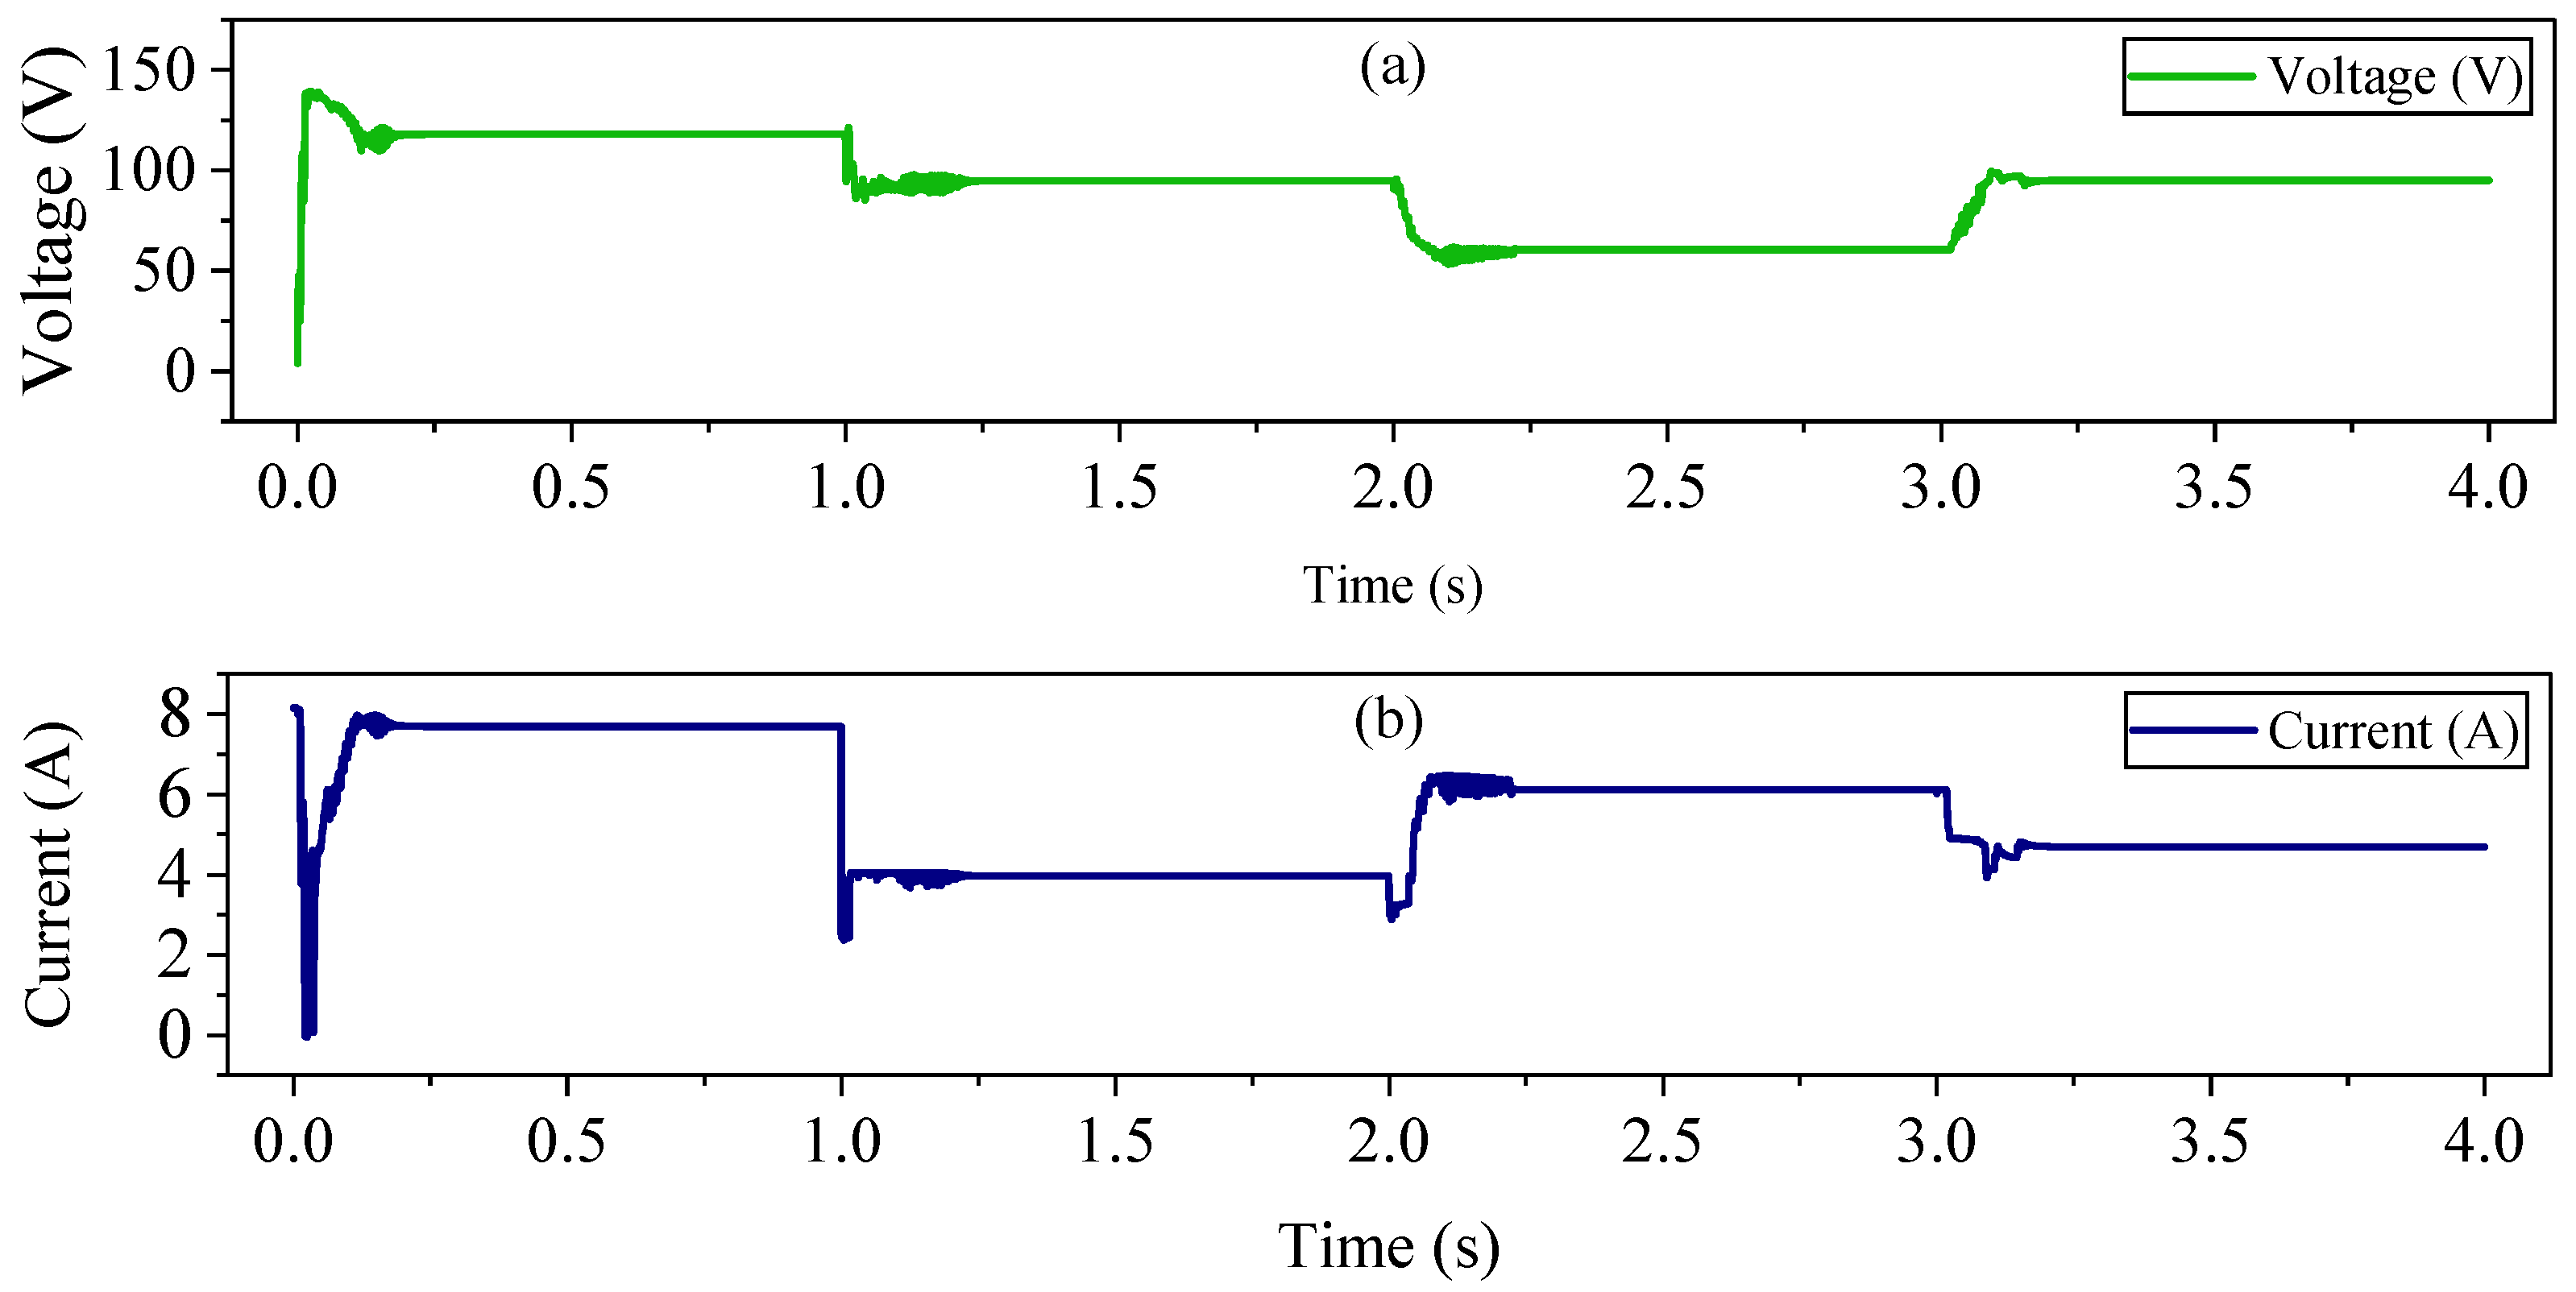
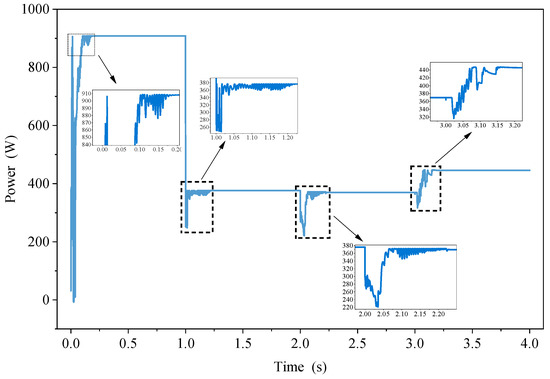
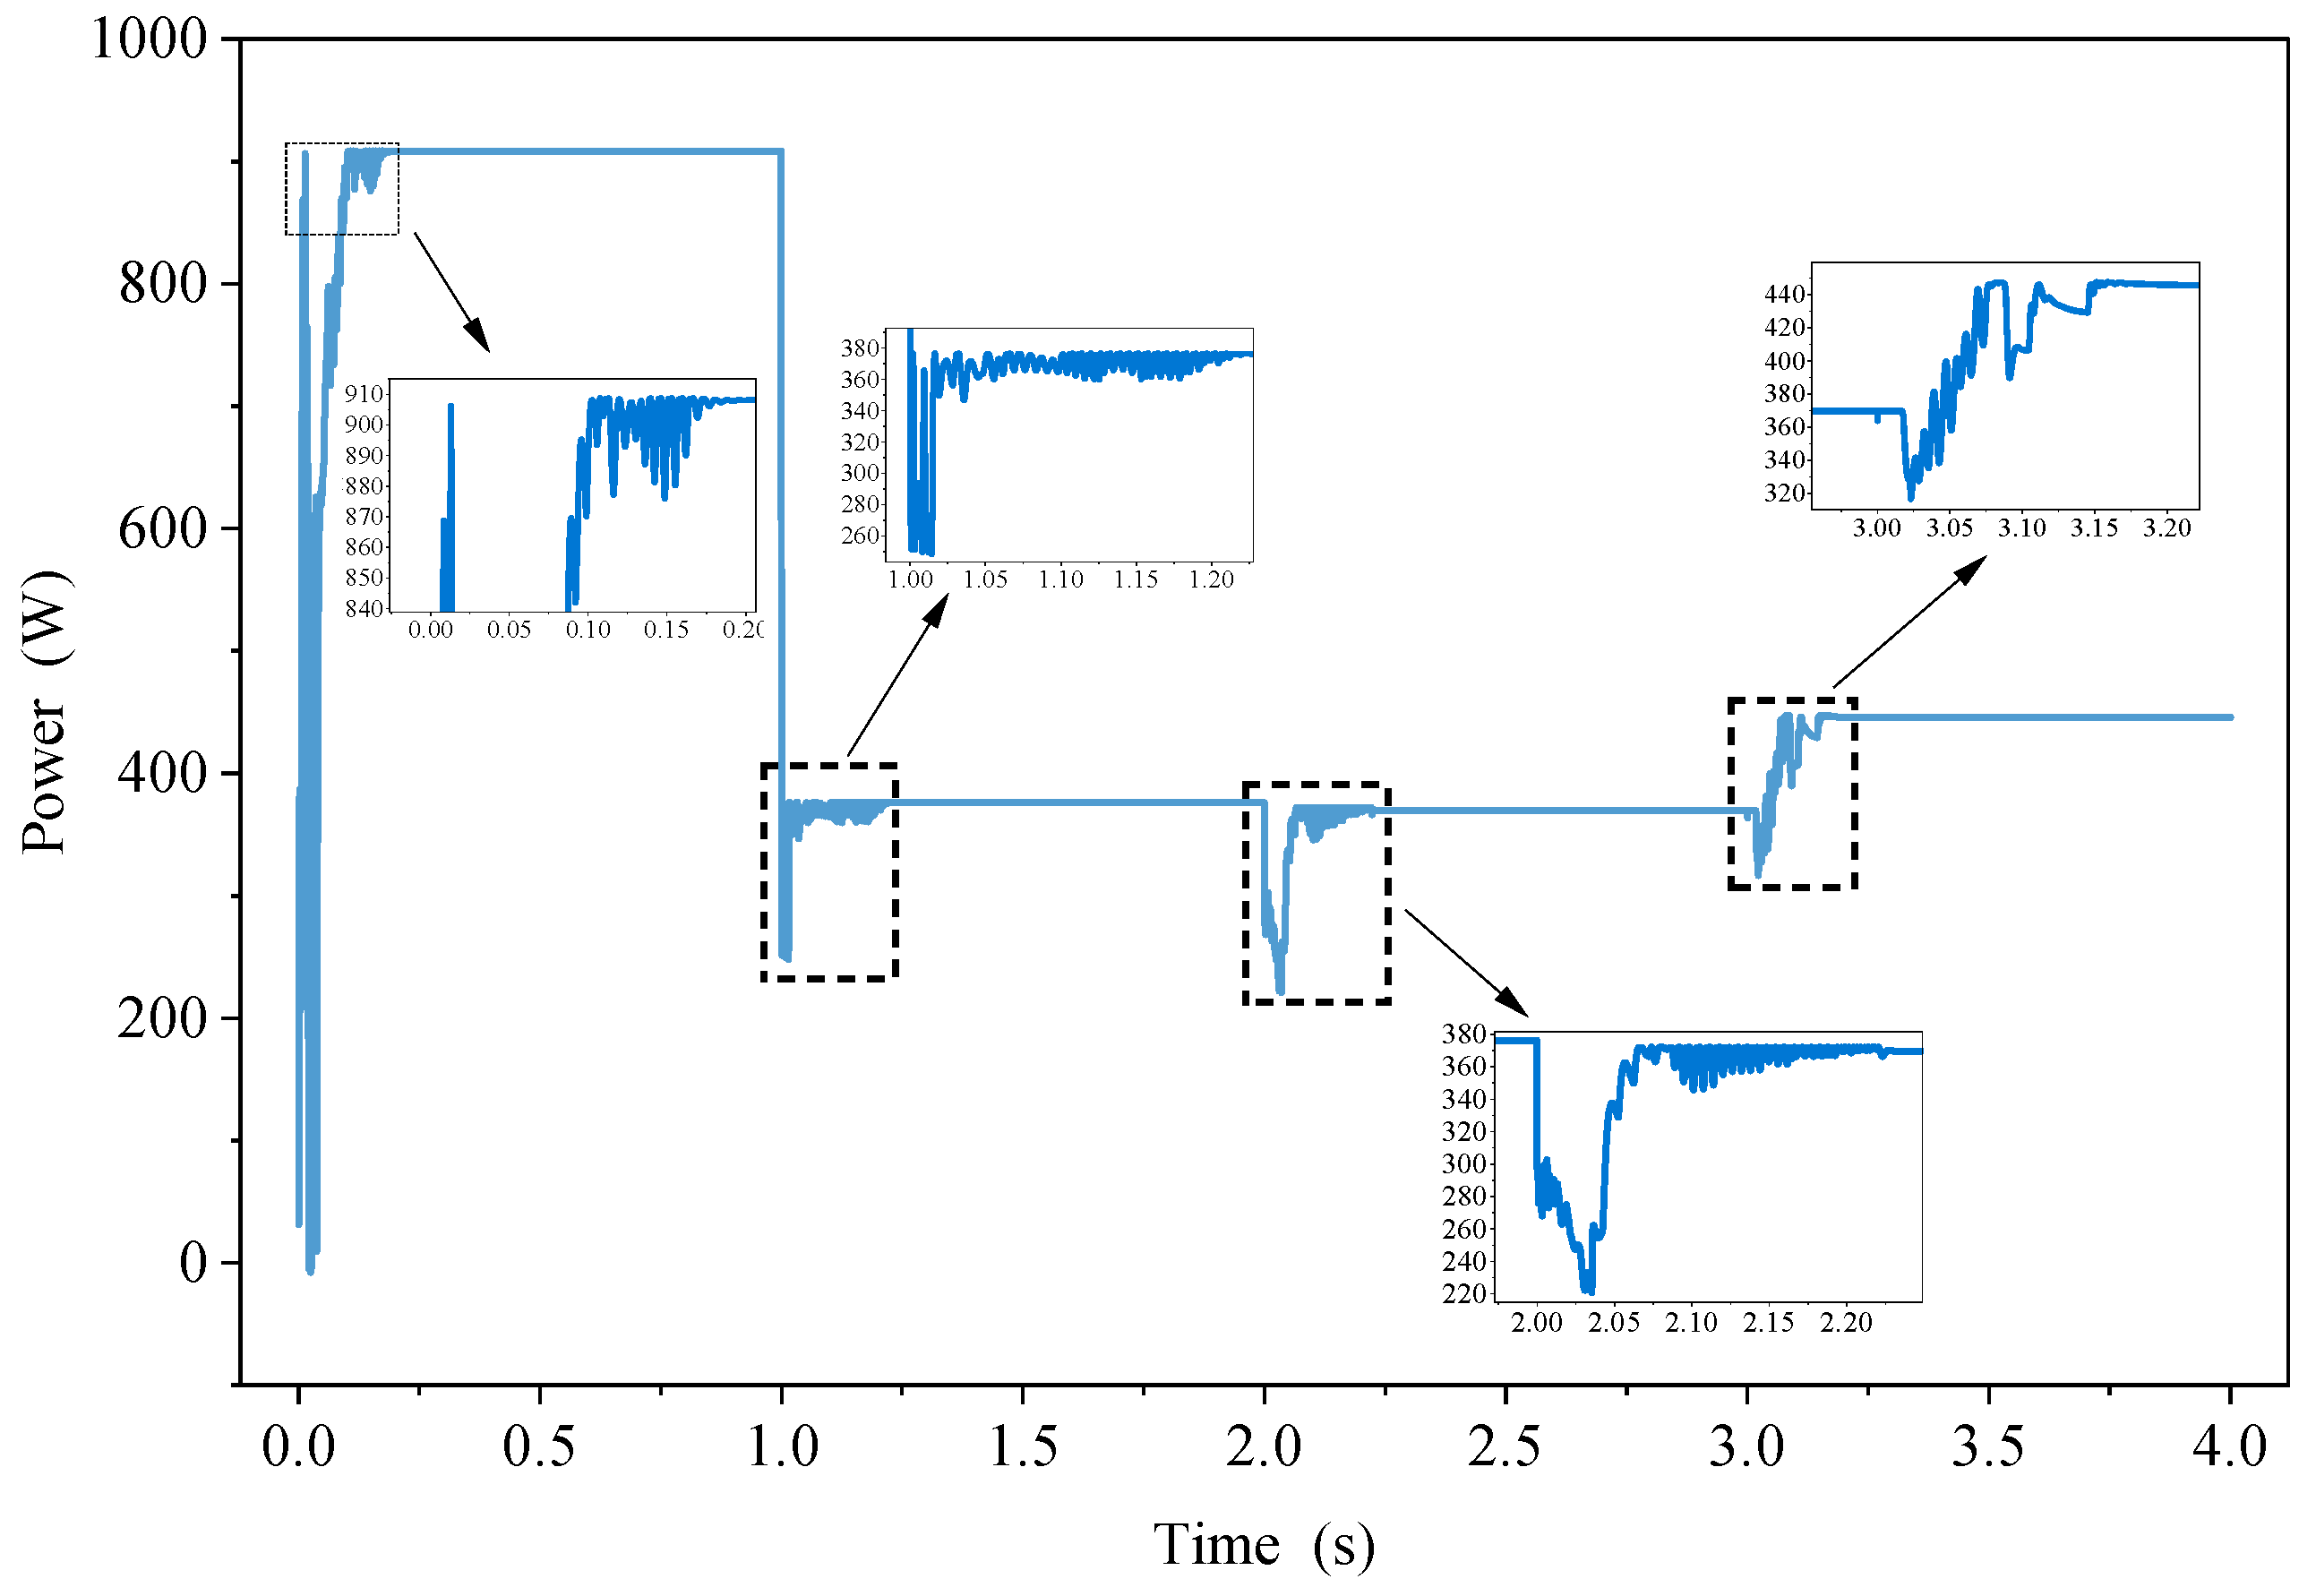
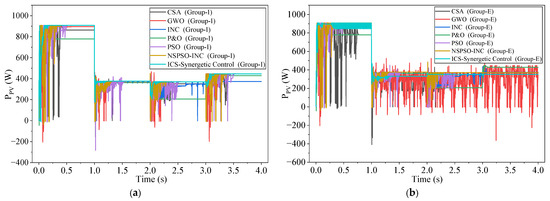
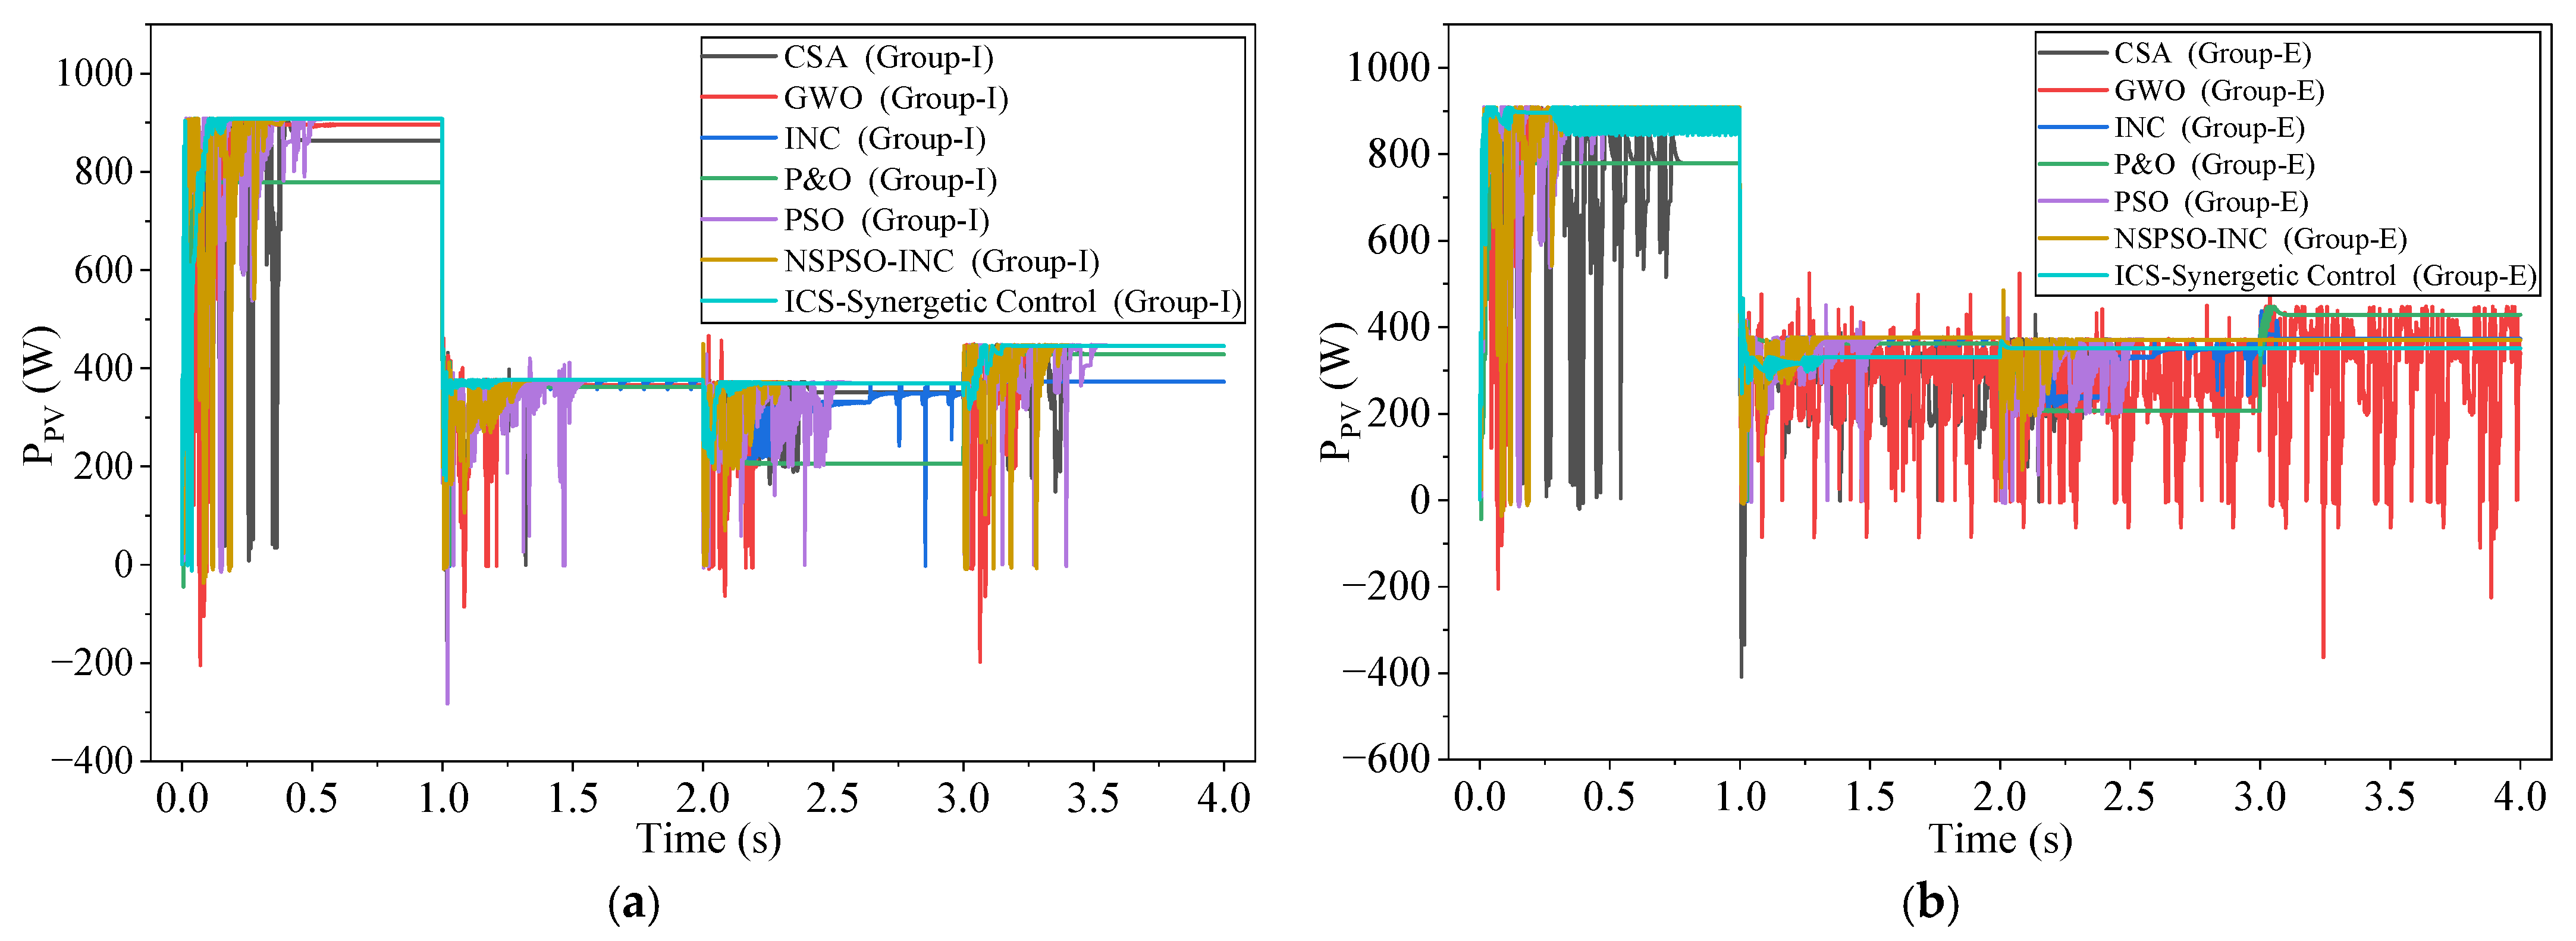
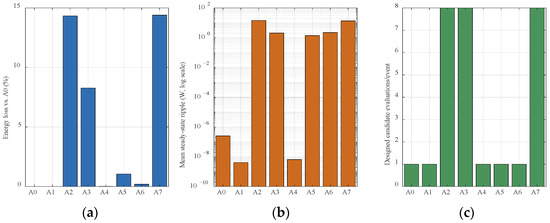
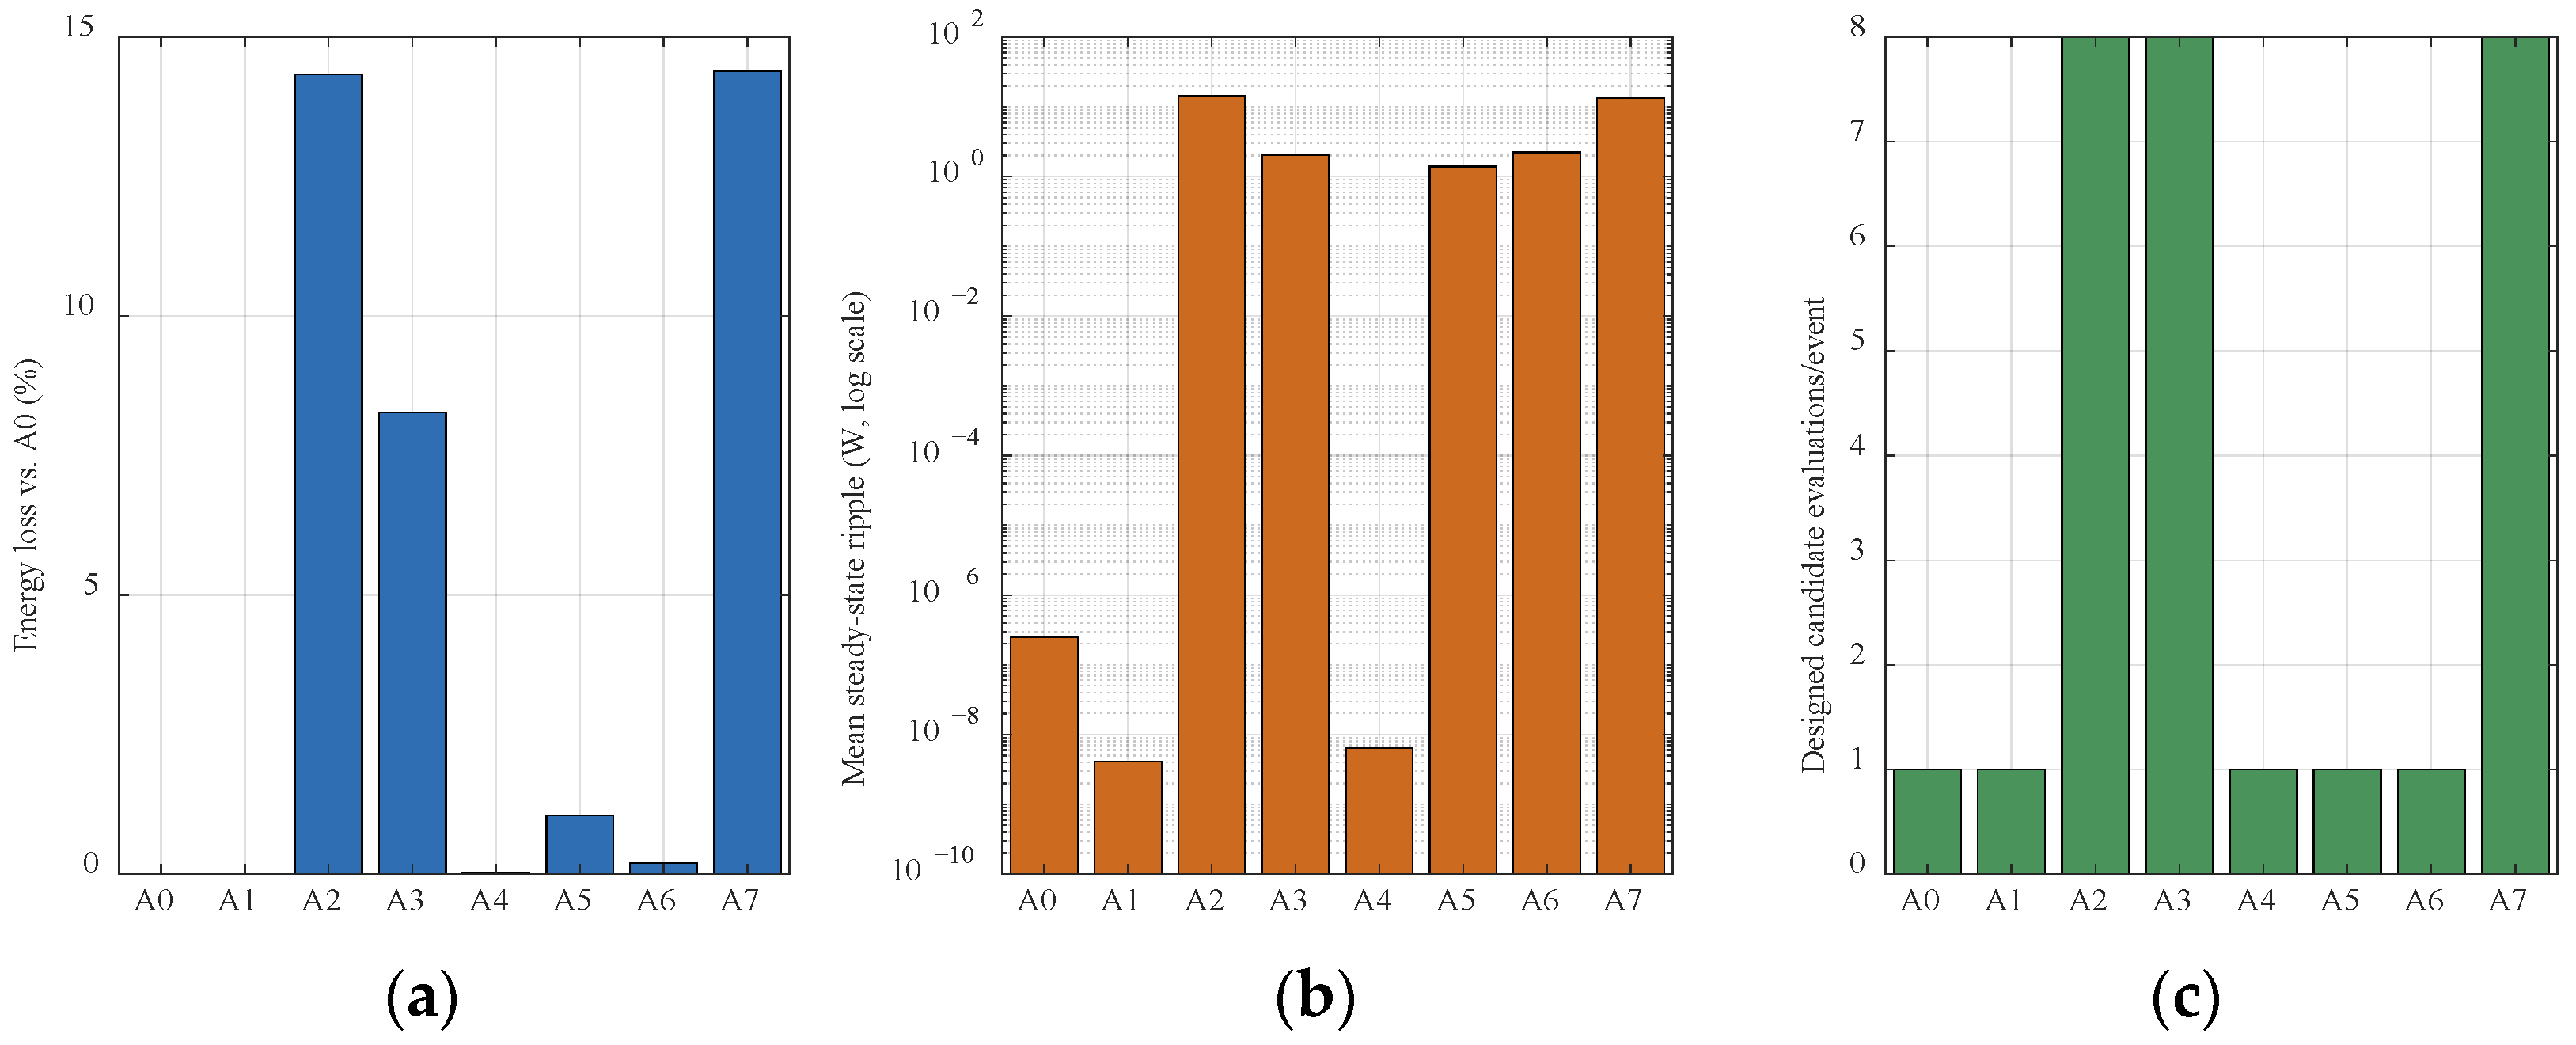
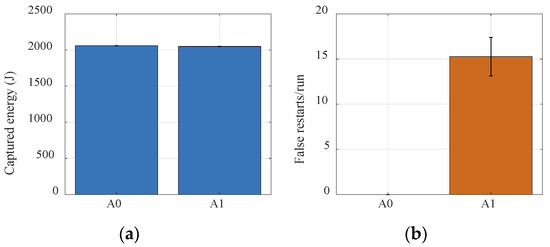
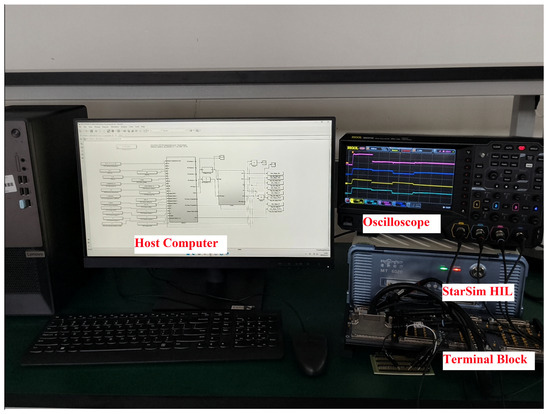
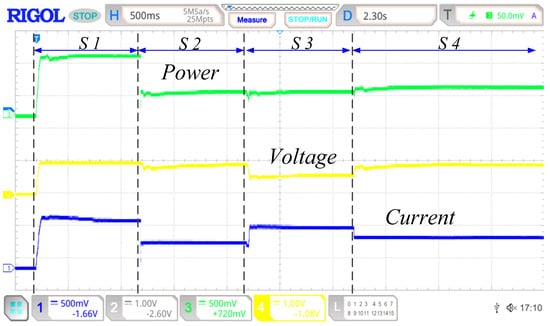
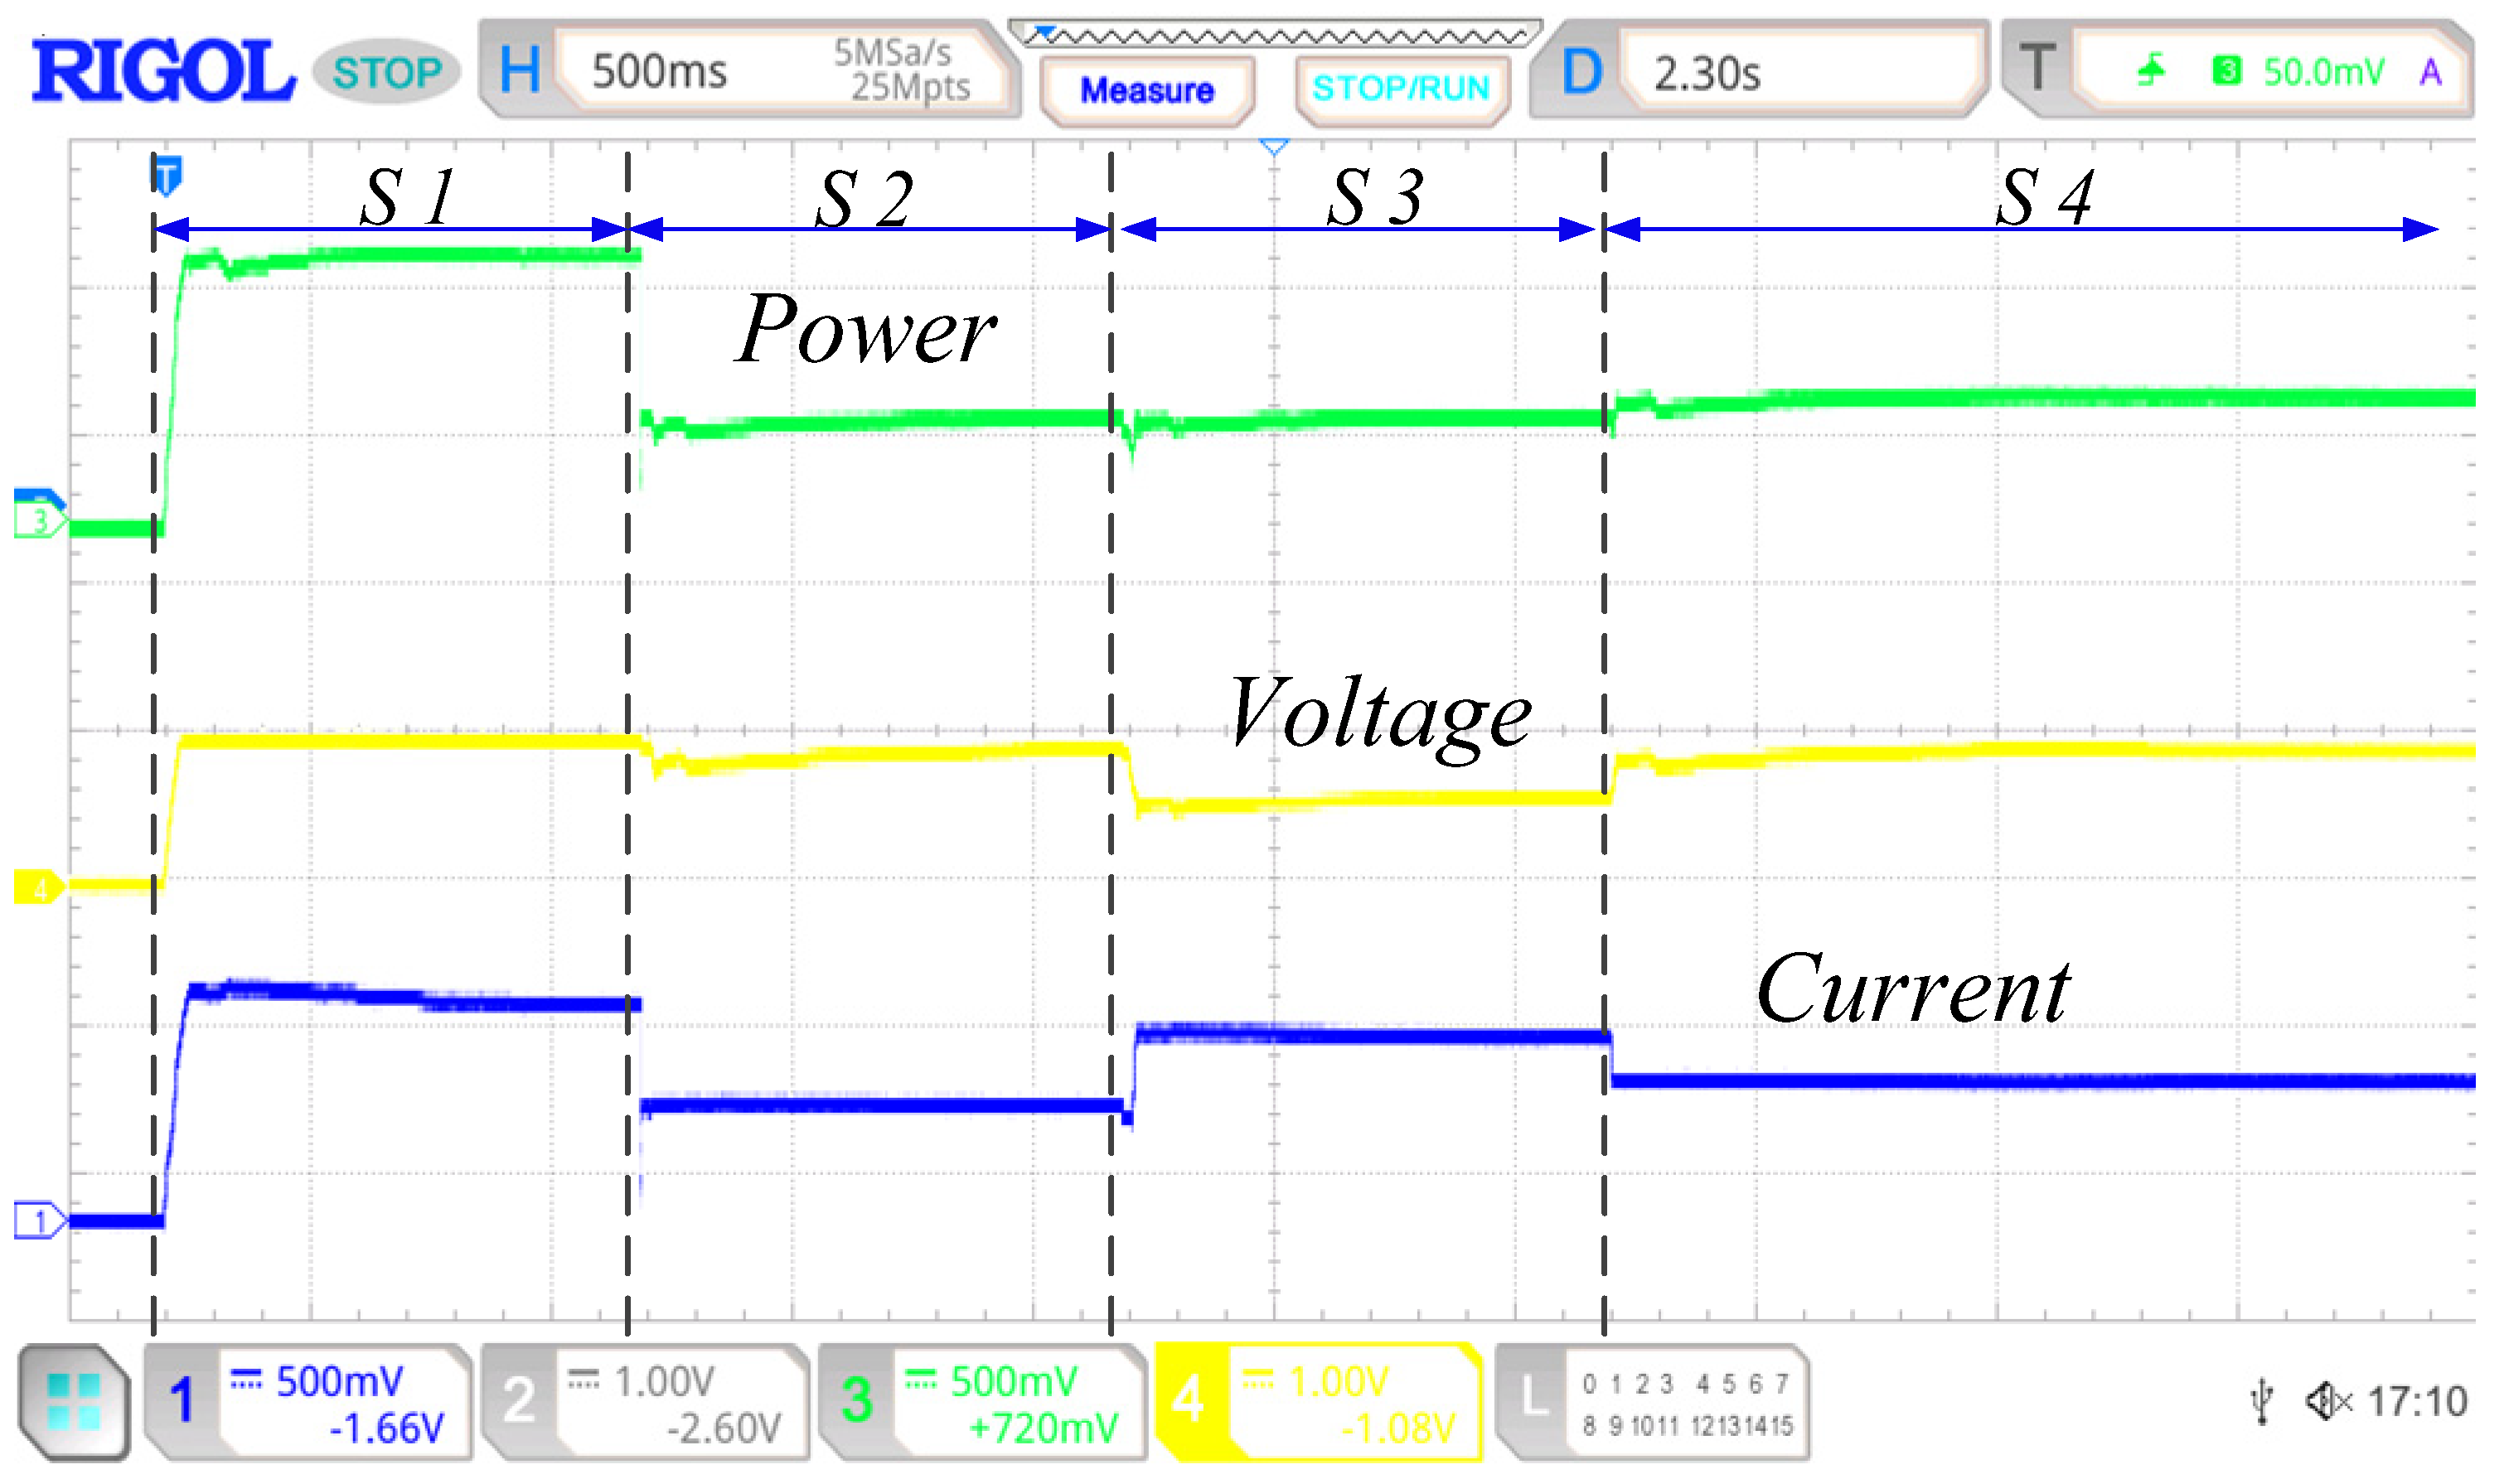
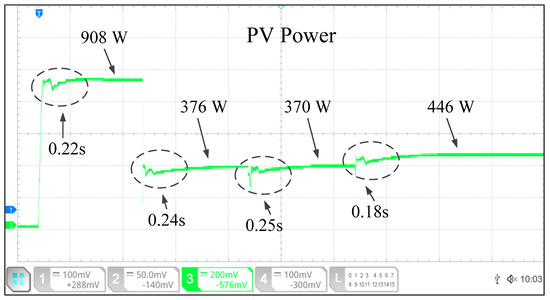
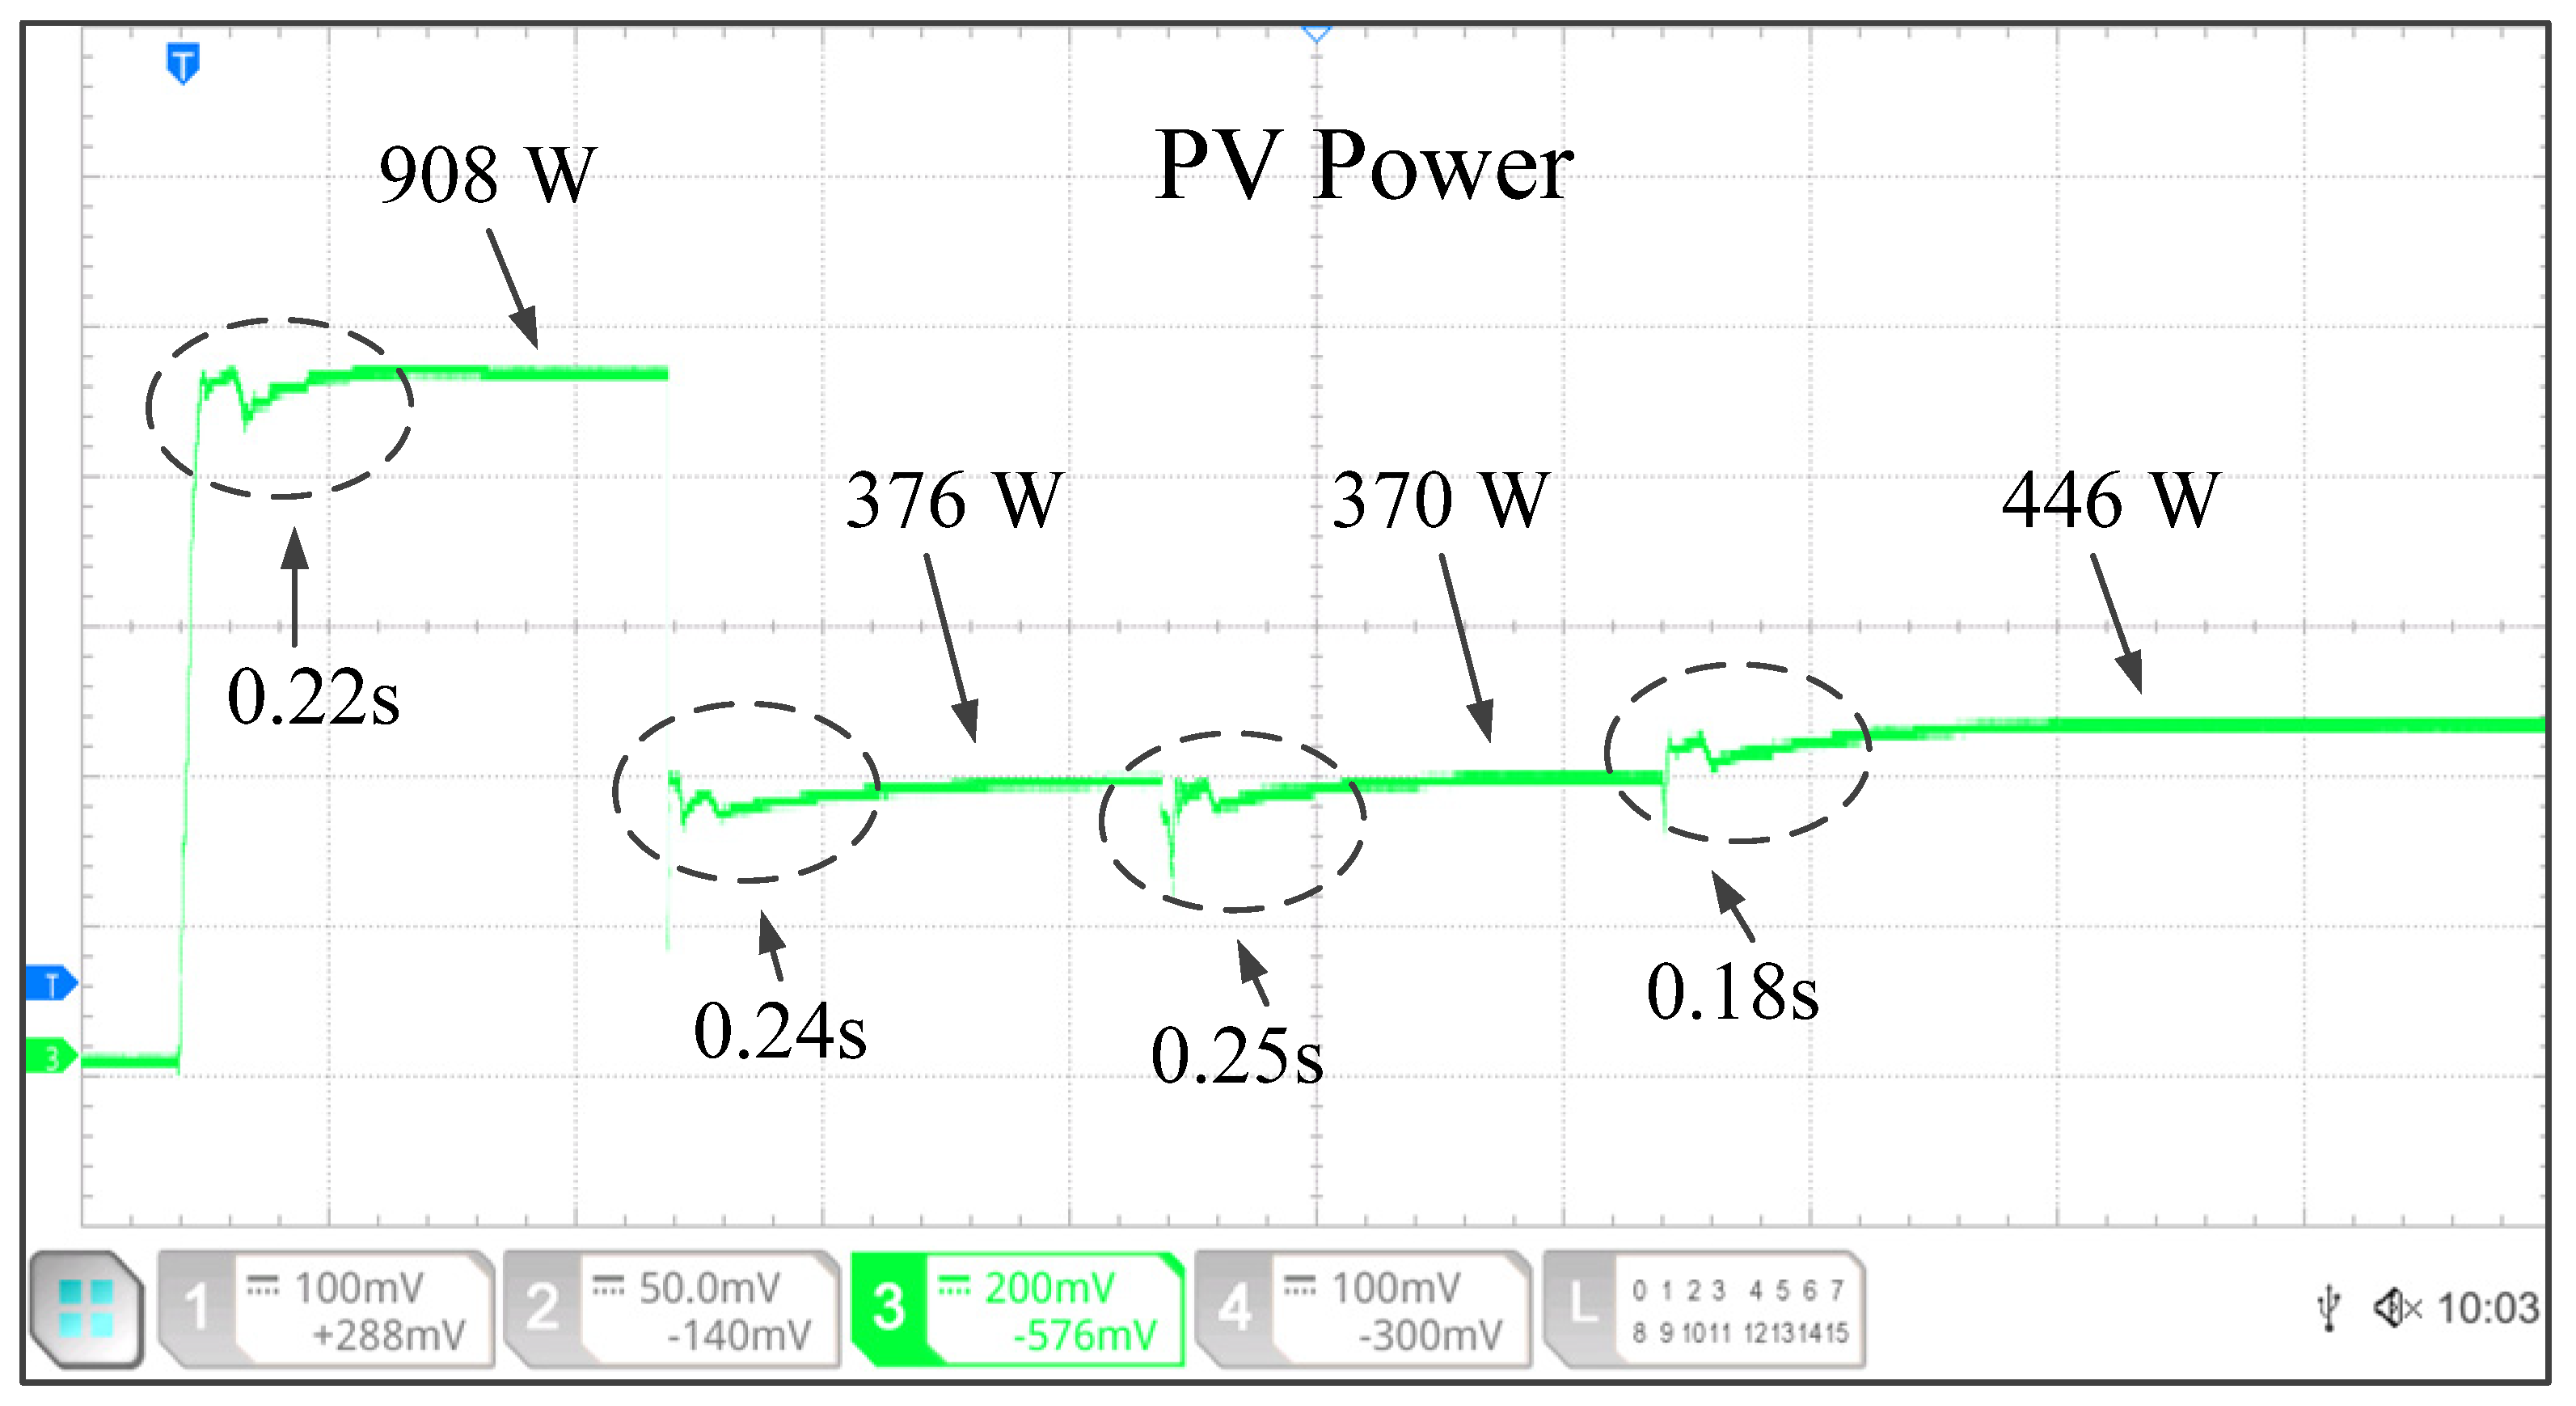
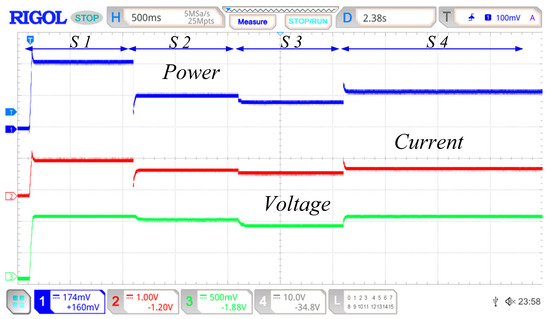
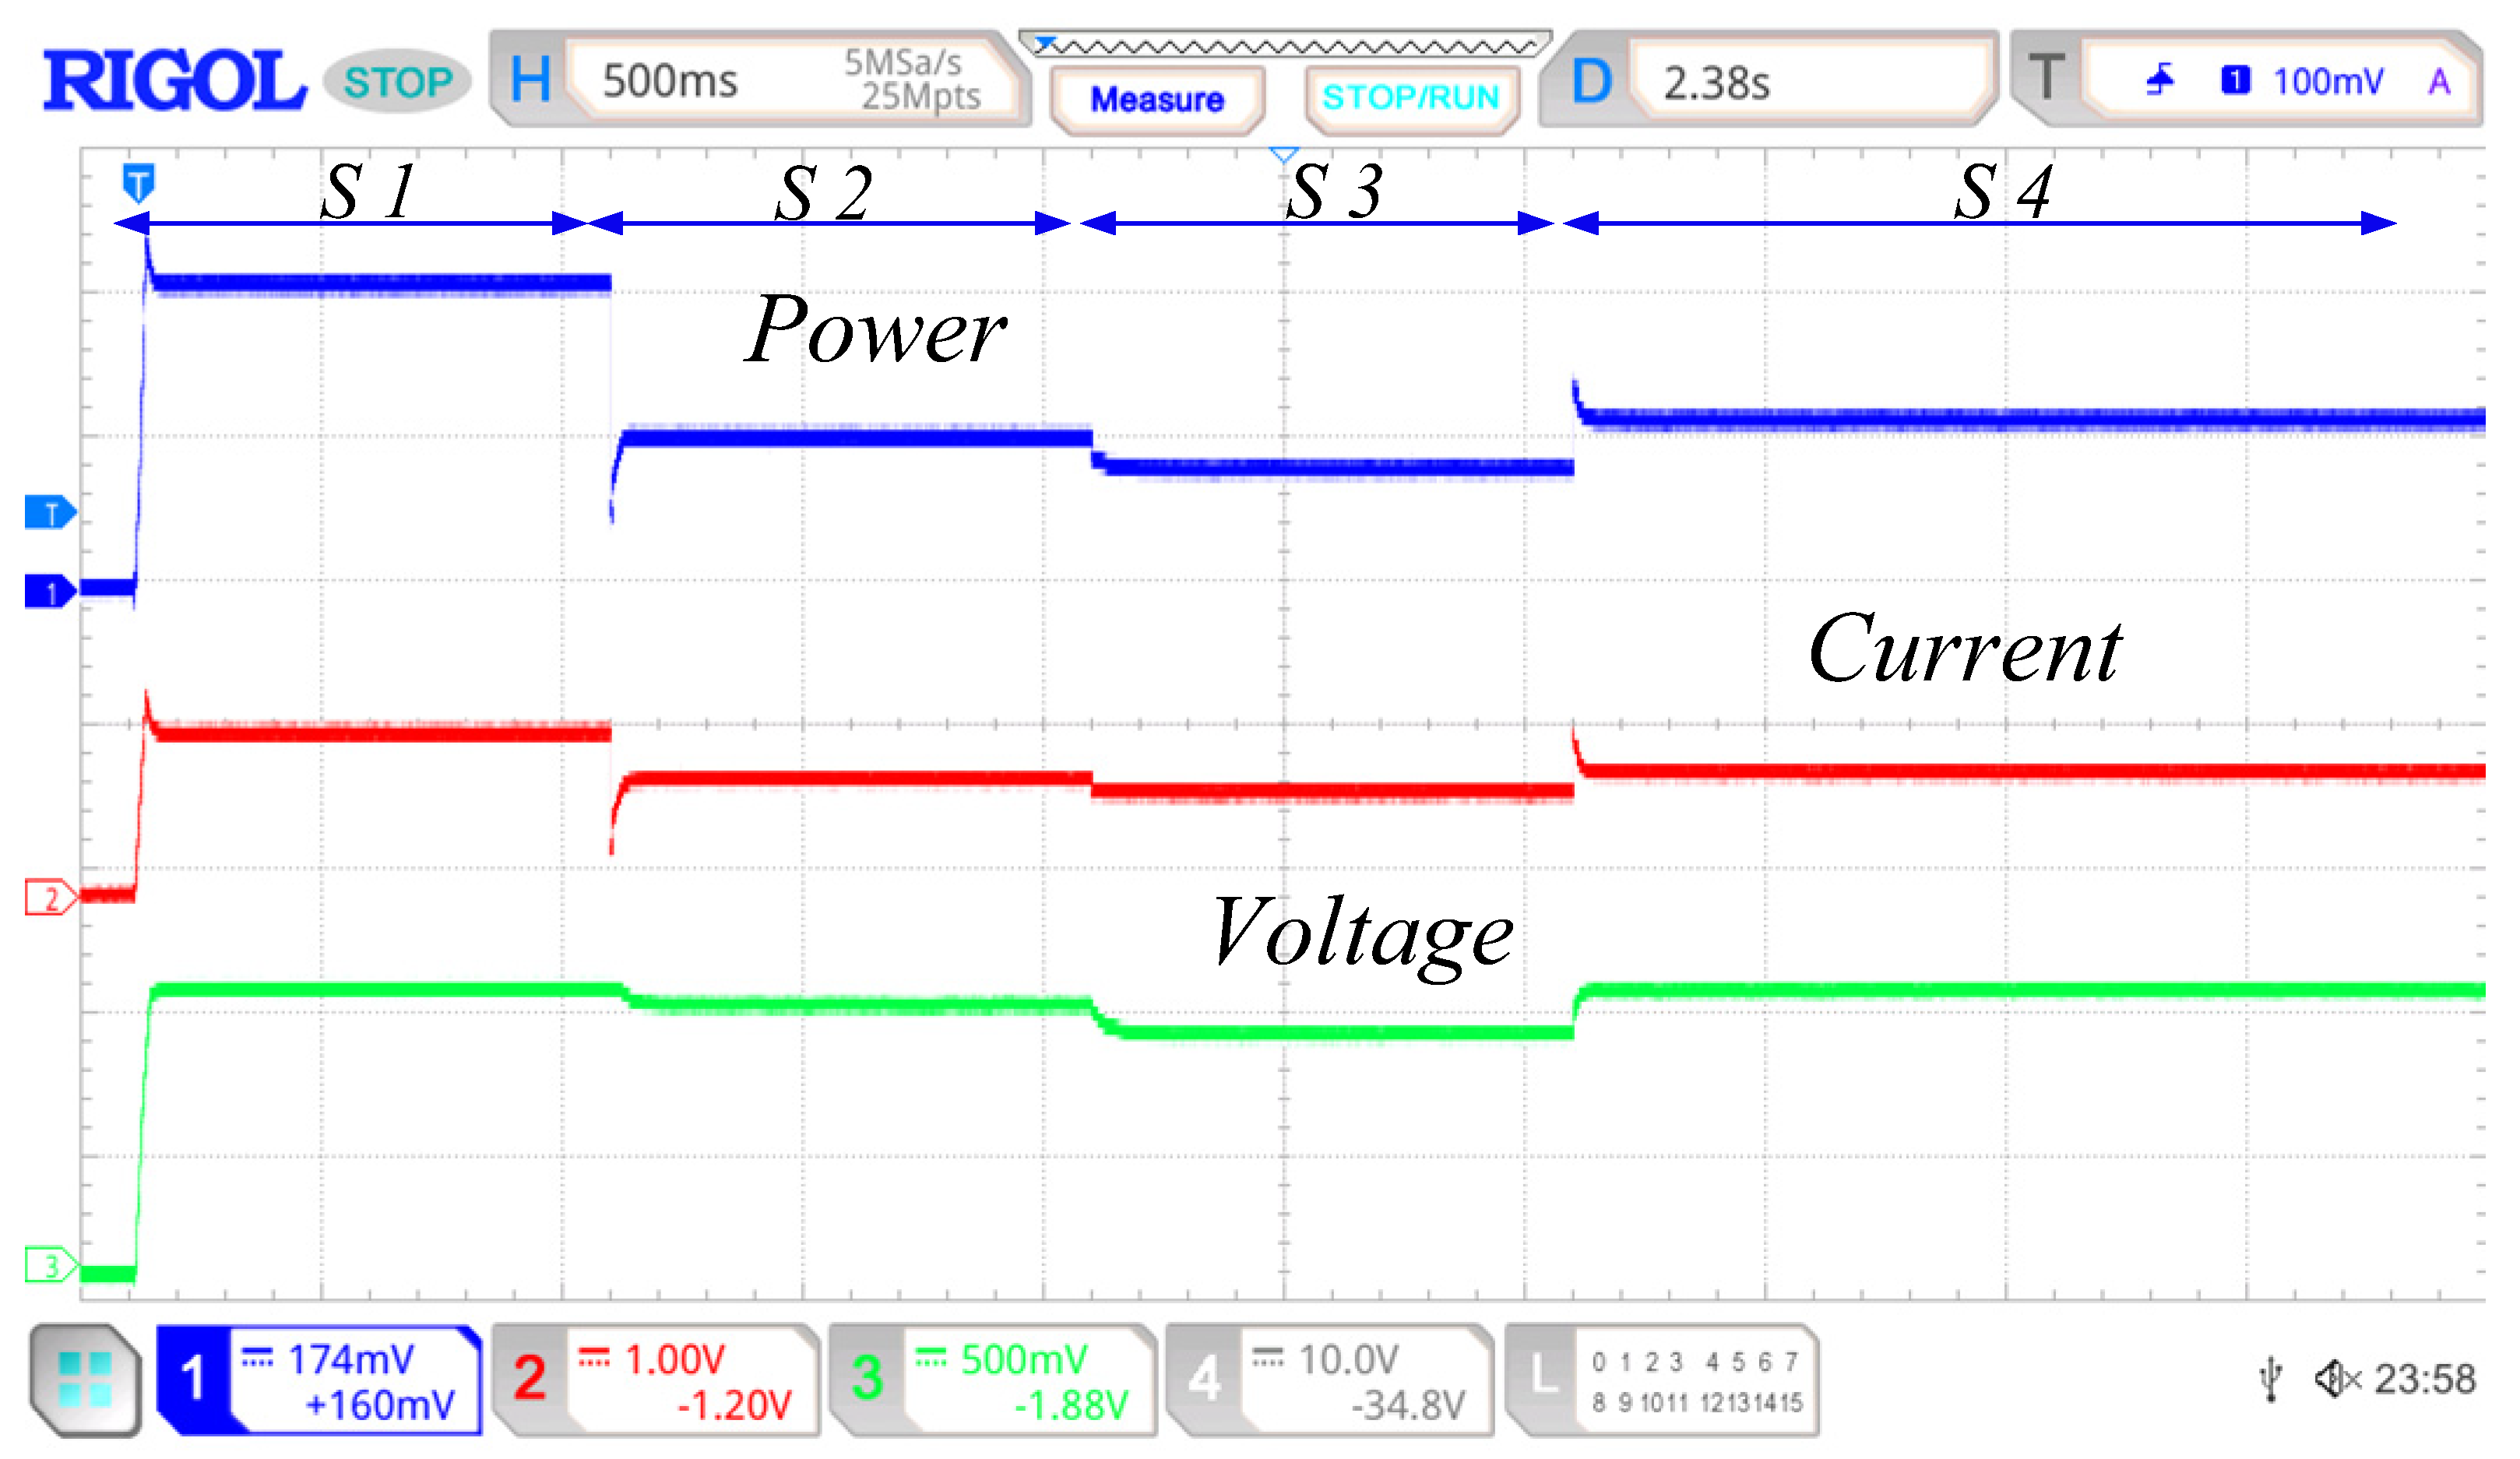
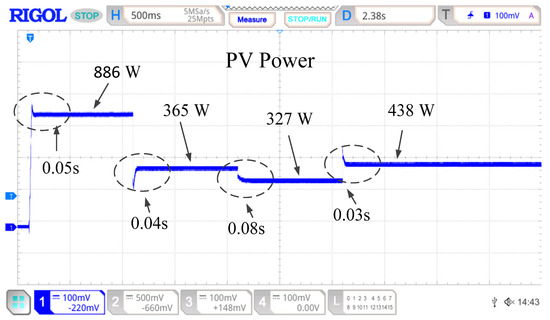
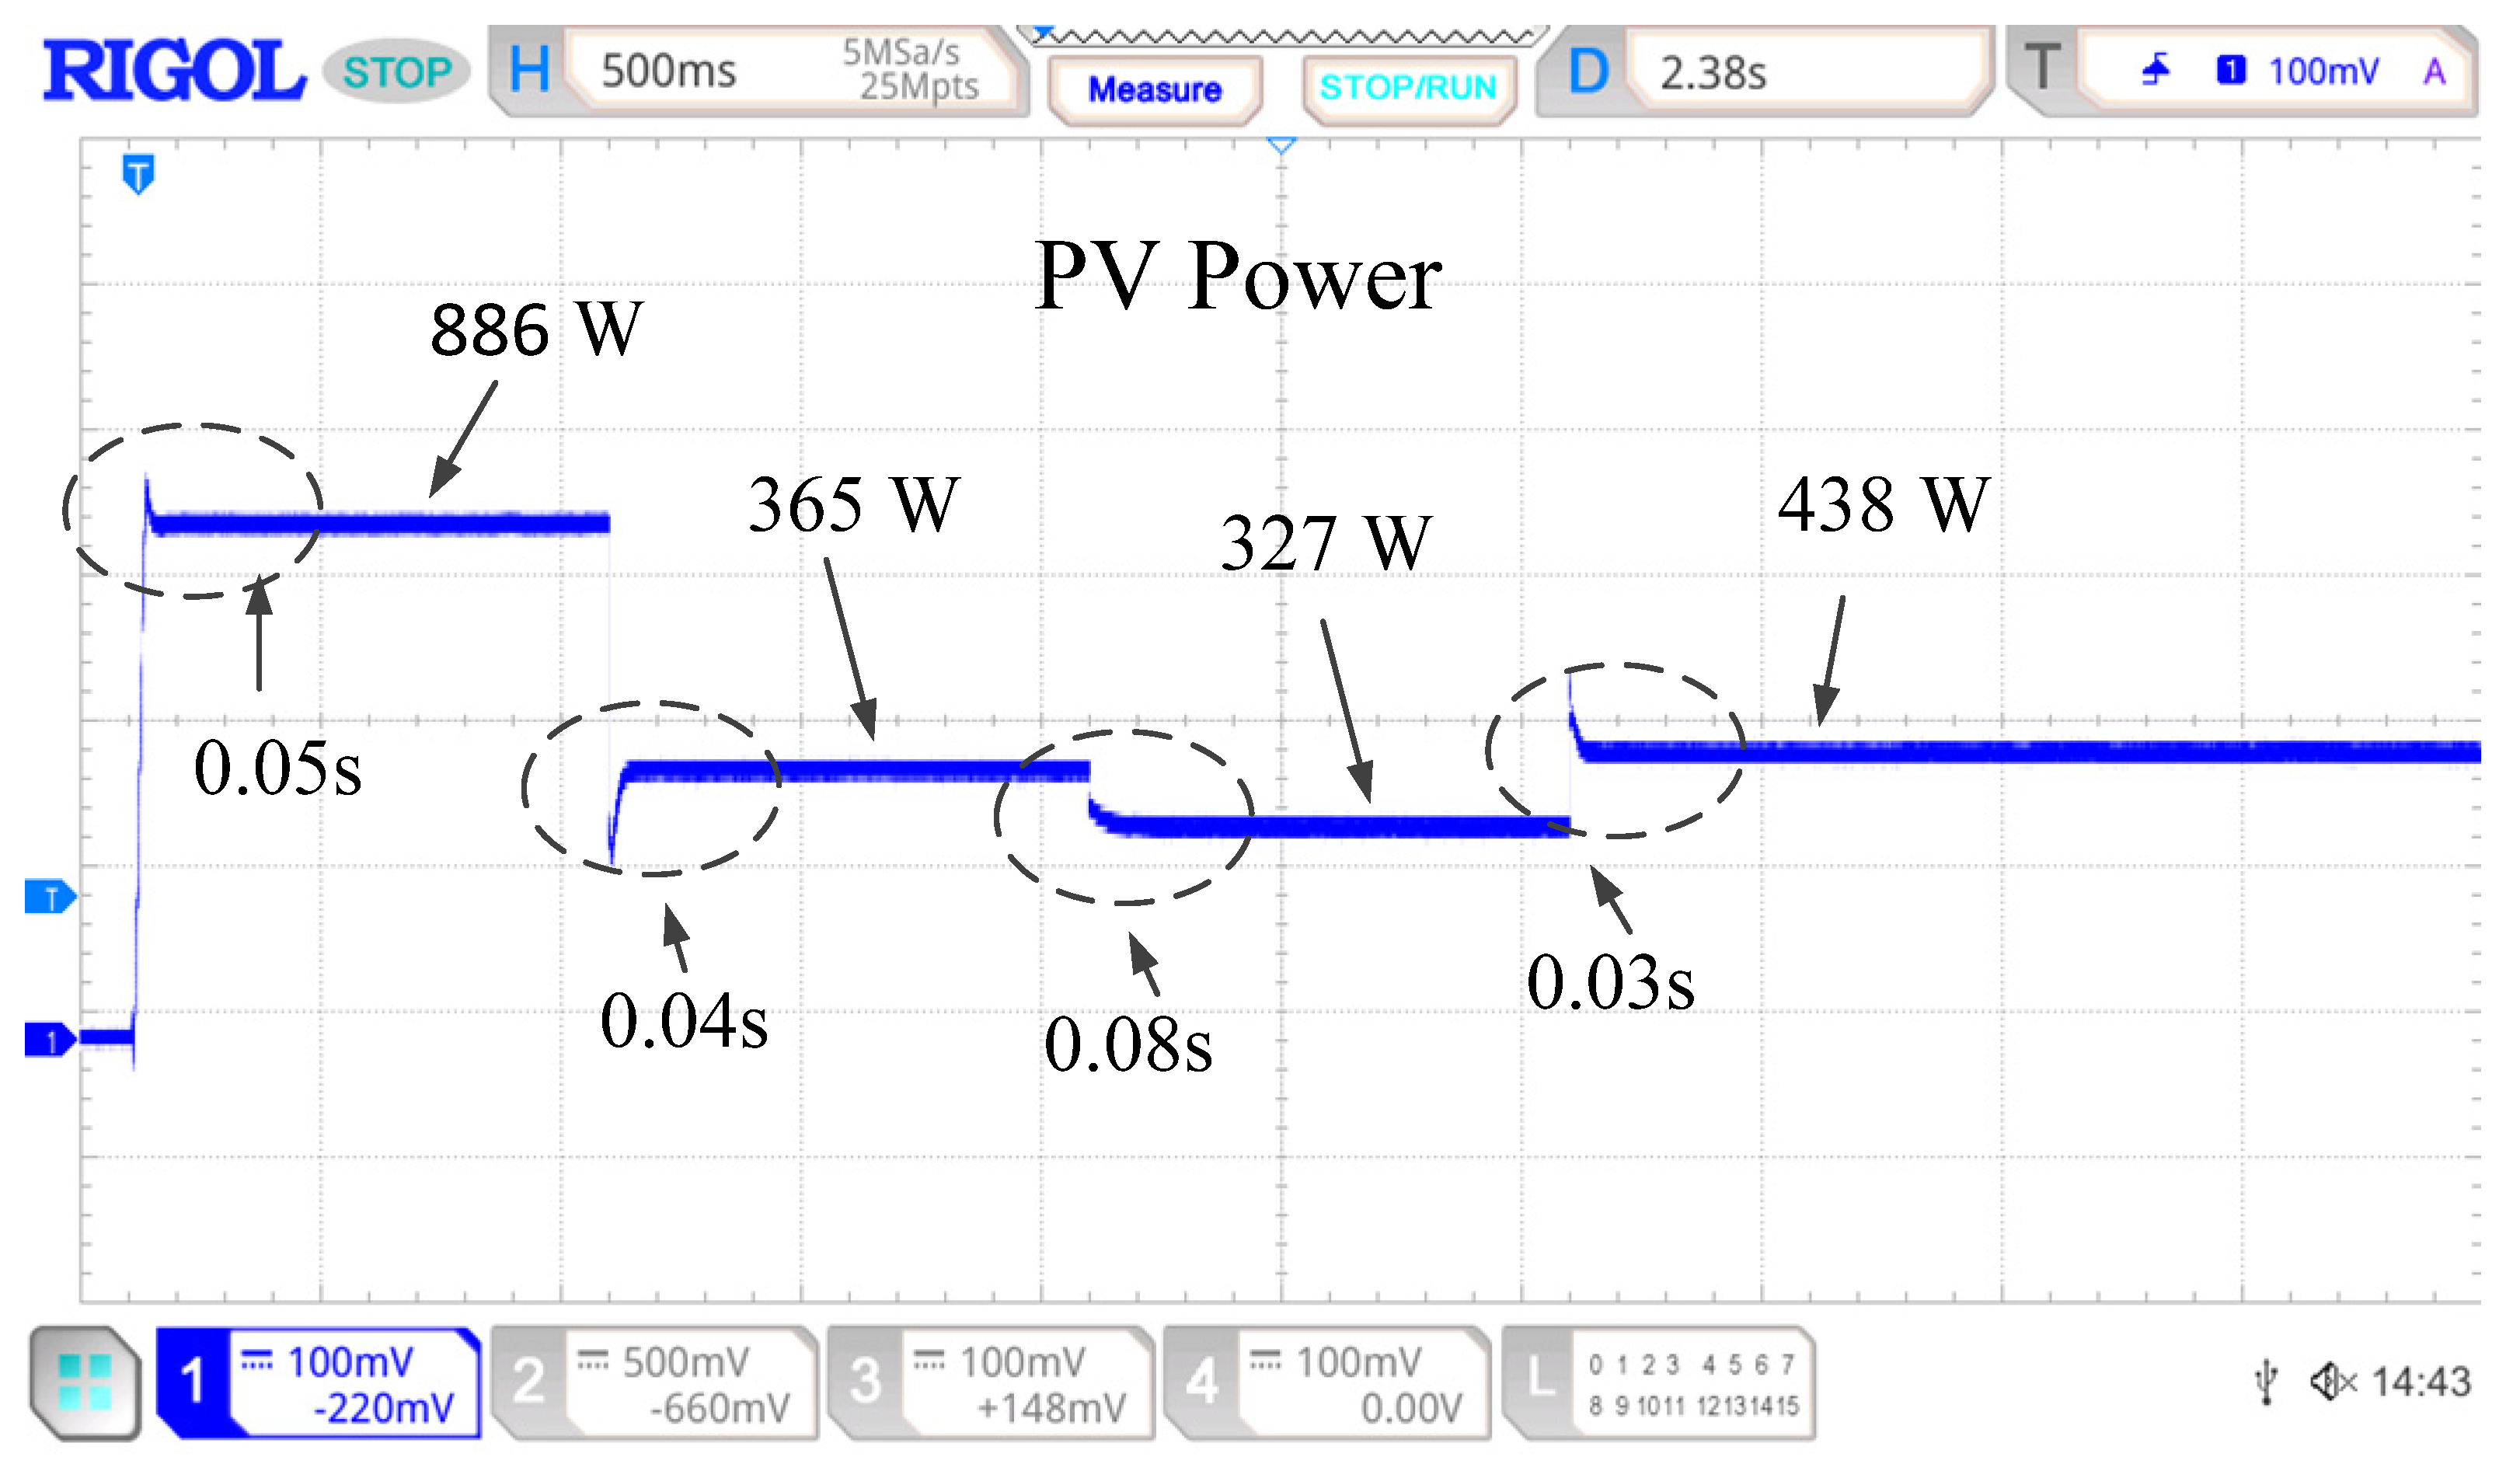

Disclaimer/Publisher’s Note: The statements, opinions and data contained in all publications are solely those of the individual author(s) and contributor(s) and not of MDPI and/or the editor(s). MDPI and/or the editor(s) disclaim responsibility for any injury to people or property resulting from any ideas, methods, instructions or products referred to in the content. |
© 2026 by the authors. Licensee MDPI, Basel, Switzerland. This article is an open access article distributed under the terms and conditions of the Creative Commons Attribution (CC BY) license.