


Abstract
The aim of this paper is to present the transformation of the network tariff system in Slovenia using a comprehensive assessment methodology for the techno-economic evaluation of electricity costs for households. The novelty of the proposed approach lies in the combined assessment of the previous and new network tariff systems, explicitly accounting for power-based network tariff components, time-block-dependent charges, and different support schemes for household photovoltaic systems, including net metering and credit note-based schemes. The results show that the transition from an energy-based to a more power-based network tariff system, introduced primarily to mitigate congestion in distribution networks, is not inherently disadvantageous for consumers and prosumers. When tariff structures are appropriately designed, the new framework can support efficient grid utilization and maintain favorable conditions for prosumers, particularly those integrating battery storage systems. Overall, the proposed methodology provides a transparent and robust framework for evaluating the economic impacts of network tariff reforms on residential consumers and prosumers, offering relevant insights for tariff design and the development of future low-carbon household energy systems.
1. Introduction
Over the past decade, European distribution and transmission networks have undergone continuous upgrades to enable the integration of an increasing amount of renewable generation, thereby maintaining overall system resilience. While transmission systems play a key role in providing high-capacity power transfer within a country and across cross-border corridors, distribution networks are primarily responsible for integrating renewable energy sources (RES) at the local level, where installed capacities are typically lower. Since distribution networks were historically not designed for bidirectional power flows but primarily for delivering electricity from large, centralized power plants to consumers, ongoing annual upgrades, investments, and the adoption of innovative approaches aim to address these limitations. However, to keep pace with the growing energy flows and the rapidly increasing number of renewable-energy generation units, it is essential to secure sufficient funding. This financing is provided through network charges paid by system users within the network tariff system.
Given that past investments in distribution and transmission systems were relatively limited and focused mainly on routine maintenance and minor upgrades, network tariff systems were traditionally rigid, inexpensive, and based mainly on flat-rate principles derived from monthly electricity consumption. In many countries, charges were determined according to the amount of energy consumed rather than the actual power levels, which, in today’s context, have proven to be a more accurate indicator due to the increasing variability of demand, higher peak loads, and the growing share of decentralized renewable generation that introduces significant local fluctuations in power flows.
According to data from the European Union Agency for the Cooperation of Energy Regulators (ACER) [1], Slovenia is among the countries with more than 95% of installed smart electricity meters, which enable the measurement and recording of electrical parameters at 15 min intervals. Other countries with the same or a higher share include Denmark, Finland, Italy, and Luxembourg. These meters provide the foundation for upgrading the network tariff system towards shorter time intervals, allowing a fairer and more precise calculation of network charges. Based on the data presented in the ACER Annual Report 2025 [1], it is evident that ENTSO-E member states apply specific types of network tariff systems. Western European countries predominantly use tariff models that rely more on power-based calculation principles, focusing on instantaneous power rather than total energy consumed. By contrast, many Eastern European countries, where the integration of renewable-generation units has progressed more slowly, continue to apply tariff systems that are primarily energy-based.
This shift in tariff design has become increasingly relevant as prosumers equipped with photovoltaic (PV) systems, battery storage systems (BSSs), and electric vehicles (EVs) actively reshape electricity consumption patterns. Several papers demonstrate that energy-based tariffs combined with net-metering arrangements lead to inequitable cost allocation, where households without access to PV systems effectively subsidize those that can offset their consumption. Alahmed et al. [2] and Ansarin et al. [3] show that conventional tariff structures may significantly distort system costs, while Cambini et al. [4], Hoarau et al. [5], and Eid et al. [6] confirm that current net-metering regimes reduce network-cost recovery and create cross-subsidies. Additional analyses from Australia and Europe further support the notion that the rise in distributed generation and household storage exacerbates revenue erosion for distribution system operators [7,8].
Growing attention is, therefore, placed on how tariff structures influence prosumer behavior. Avau et al. [9] show that tariffs based solely on energy consumption can incentivize individual economic optimization at the expense of increased system costs. In contrast, papers comparing energy and power-based tariffs [10,11,12,13,14,15,16] highlight that pricing structures reflecting actual power peaks better align prosumer incentives with network requirements. Morell et al. [11] demonstrate, in the case of Slovenia, that hybrid tariffs combining energy and peak-power charges ensure a more equitable cost distribution. Stute et al. [14] reveal that power-based tariffs can reduce reinforcement needs by up to 37%. Similar results are obtained in comparative network-tariff assessments for European households [7], confirming the inadequacy of purely energy tariffs in highly electrified environments.
Electric mobility adds a further layer of complexity. Empirical evidence from the Netherlands [17] shows that dynamic network tariffs can reduce transformer overloading by 21%, while Chen et al. [18], Daneshzand et al. [19], and Khan et al. [20] demonstrate that appropriately designed tariffs shift EV charging to periods of lower network stress or higher renewable generation output. Studies from Germany [21] and Ireland [22] indicate that dynamic network tariffs not only reduce charging costs but also disperse consumption peaks, although their economic benefits depend on the presence of home energy management systems [23]. These findings confirm that pricing signals are crucial for integrating EVs into distribution networks without compromising technical stability.
Tariff structures equally affect the deployment and operation of a BSS, energy communities, and power-to-heat technologies. Danish and German case studies [24,25,26,27,28] demonstrate that energy-only tariffs fail to utilize available flexibility resources, whereas power-based and dynamic network tariffs foster more efficient charging and discharging strategies, improve heat pump scheduling, and reduce network losses by up to 20%. Household-level analyses [29] and system-level investigations [8] further demonstrate that the choice of tariff determines the economic viability of residential BSS and the extent to which distributed storage mitigates peak loads.
At the regulatory level, tariff reform is shaped by national contexts. China’s energy-based transmission-and-distribution charging model [30,31] highlights the risks of tariff structures that are disconnected from investment needs, while tariff reforms in Africa [32] stress that cost-reflective pricing without social safeguards may exacerbate energy poverty. Research from Portugal [33] and Denmark [34] emphasizes that the acceptance of new tariffs depends on predictability, transparency, and perceived fairness, whereas global approaches that rely on wholesale price signals [35] and dynamic price communication [36] confirm that even simple mechanisms can steer consumer behavior if appropriately regulated. System dynamics studies [37] also reveal that two-part tariffs influence investment decisions in generation capacity, underscoring the broader economic implications of tariff design.
Taken together, the reviewed literature indicates that future network tariff systems must evolve beyond traditional energy-based structures and adopt multifaceted pricing mechanisms that reflect actual network usage, integrate flexibility resources, and ensure cost recovery. Whether through coincident-peak pricing, hybrid power–energy models, or dynamic network tariffs, the evidence provided by the presented research and studies consistently confirms that tariff design is no longer a passive billing tool but a central mechanism for managing prosumer integration, accommodating electric mobility, fostering energy communities, and enabling a financially sustainable energy transition.
Therefore, to achieve the objectives set for the transmission and distribution network operator, Slovenia revised its network tariff system on 1 January 2024. This reform represents a fundamental shift from traditional flat-rate structures towards a more cost-reflective approach, in which network charges are calculated based on 15 min measurement intervals and differentiated according to seasonal variations and five-time blocks. The introduction of agreed and excess contracted power charges marks a departure from purely energy-based billing and establishes a pricing structure that more accurately reflects network usage. The underlying aim is to encourage consumers and prosumers to adjust their electricity consumption patterns in a way that mitigates peak loads, reduces network reinforcement needs, and supports the secure and efficient operation of the network system.
The new network tariff system applies to all network users, including households and commercial customers, and requires a higher level of consumer engagement when planning and managing electricity use. Although consumption behavior can be modified through informed decision-making and the manual adjustment of electrical loads, further improvements can be achieved through smart energy management systems that coordinate consumption, storage, and generation units without requiring any modifications to the existing electrical infrastructure. Such systems enable the automated scheduling of devices, allowing electricity consumption to be shifted to periods with lower tariff levels, which results in measurable reductions in network charges and total electricity costs.
In this context, Slovenia’s tariff reform provides a regulatory foundation for a more flexible, data-driven energy system that can accommodate the growing share of distributed renewable generation and electrified end-use technologies. By combining real-time measurement capabilities with a tariff structure that differentiates between consumption patterns and peak contributions, the new system not only aligns with European trends in tariff design but also contributes to a more transparent, economically sustainable, and technologically adaptable electricity market. Given the regulatory changes, the evolution of tariff structures, and the growing presence of distributed RES units, the central question that arises is as follows: To what extent does the newly adopted Slovenian network tariff system financially affect a household consumer, and how do the integration of a PV system and a BSS influence the resulting network tariff costs under different support schemes?
To address this research question, this paper employs a comprehensive assessment methodology for the techno-economic evaluation of electricity costs for households under both the previous and newly adapted network tariff systems in Slovenia. The methodology explicitly accounts for power-based network tariff components, time-block-dependent charges and different support schemes for household PV systems, including net-metering and credit-note-based schemes. The assessment is conducted for three scenarios: a household with baseline electricity consumption, a household with electricity production from a PV system, and a household equipped with both a PV system and a BSS. High-resolution 15 min electricity consumption data are used to reflect the actual calculation logic of the Slovenian network tariff system and to quantify the resulting network tariff costs for each configuration. By evaluating both the previous and the revised network tariff systems within a unified framework, the methodology allows a consistent comparison of electricity cost structures and investment outcomes. In this way, the paper provides a transparent basis for assessing how the shift from an energy-based to a more power-based network tariff system affects household consumers and prosumers and under which conditions the new tariff framework supports efficient grid utilization and the integration of a BSS.
This paper is organized into five sections. Section 2 presents the network tariff system in Slovenia and introduces the assessment methodology used to calculate network-tariff costs for a household consumer under different configurations. Section 3 provides the technical and economic results for all analyzed scenarios, including the baseline household, the household with a PV system, and the household equipped with both a PV system and a BSS. Section 4 discusses the findings, and Section 5 concludes the paper.
2. Materials and Methods
Our paper encompasses more than 37 scientific papers published between 2005 and 2025, in which various authors examine network tariff systems across different countries and analyze how tariff structures affect cost allocation, consumer behavior, prosumer integration, and the deployment of technologies such as PV systems, EV, BSS, and heat pump units. Building upon these insights, this section provides a comprehensive description of the network tariff framework in Slovenia and presents the assessment methodology used to evaluate network-tariff costs for consumers and prosumers under different support schemes for RES generation units.
2.1. Network Tariff System in Slovenia
Network charges constitute the portion of the electricity bill that users pay for access to and use of the power system. In Slovenia, the Energy Agency sets four network tariff components that together cover the costs of operating, maintaining, and developing the transmission and distribution networks, as well as ensuring stable system conditions.
The transmission network charge covers the costs of the transmission system operator (ELES), including system operation, grid development, and services required to maintain power balance, voltage regulation, and black-start capability. The distribution network charge finances the operation, maintenance, and expansion of the distribution network, including measures to address local congestion and system services at the distribution level. The connection capacity charge reflects the costs associated with providing and maintaining the contracted capacity at the user’s connection point. The excess reactive energy charge covers the costs of maintaining appropriate voltage conditions in the grid and encourages users to reduce unnecessary reactive power consumption, for example, by using compensation devices.
Following the adoption of the “Act on the Methodology for Calculating Network Charges” [38], preparations commenced for the introduction of a new network tariff system, initially scheduled for 1 January 2024. Due to its higher complexity compared to the existing framework, the implementation was postponed several times, most recently to 1 October 2024.
Under the new system, the previous 14 consumer groups are replaced by five groups defined solely by the voltage level and the point of connection. The existing single capacity charge is replaced by five time-dependent contracted-power tariffs, applied across five predefined time blocks, with the highest price in block one and the lowest in block 5. A surcharge for excess power is introduced when the contracted power is exceeded. Energy-based charges (formerly peak tariff, off-peak tariff, and uniform tariff) are also replaced by five-time block-specific tariffs. The assignment of time blocks depends on whether the day is a working day or a holiday, the hour of the day, and the season. Each day includes up to three different time blocks.
The network tariff system framework defines how contracted power and active energy are determined for the purpose of calculating network charges. The contracted power consists of two elements: the agreed contracted power, set in advance by the system operator, and the excess power, measured when the user exceeds the agreed level. For users with a connection capacity exceeding 43 kW, the agreed contracted power is determined for each time block based on the highest 15 min power values recorded over the previous 12 months. For users with a connection capacity of 43 kW or less, the agreed contracted power is defined as the average of the three highest 15 min peaks in each time block during the previous high-load season. Minimum contracted-power thresholds also apply.
In cases of new connection approvals or changes in supply point, the system operator sets the contracted power according to predefined rules, depending on the user’s connection capacity and the availability of 15 min measurement data. Users may adjust their contracted power once per year and may also request changes during the year, provided the adjustment applies to full calendar months.
Excess power is charged whenever the achieved 15 min power exceeds the agreed contracted level in each time block. Achieved power is expressed in kW and derived from the 15 min energy measurements.
Active energy for network-charge calculation is defined as the metered energy withdrawn from the grid in each time block. If the sum of time-block energy differs from the meter reading, adjustments are made in the lowest-load block of a non-working day.
For users without 15 min measurements (typically low-voltage users with a capacity below 43 kW), the contracted power is determined as a predefined percentage of the connection capacity, depending on whether the connection is single-phase or three-phase. If 15 min metering becomes available, the contracted power is recalculated using the achieved 15 min values for the following year(s). Active energy for these users is accounted according to their metering type: two-tariff (peak and off-peak tariff) or single-tariff measurement.
The distribution system operator charges the user a monthly distribution network charge for contracted power (NCdC) for each calendar month, calculated according to (1) to (4):
where NCdC denotes the distribution network charge for contracted power [EUR], NCdbC the distribution network charge for contracted power in time block b [EUR], NCdbCc the distribution network charge in time block b based on the agreed contracted power [EUR], NCdbCex the distribution network charge in time block b based on excess power [EUR], Ccb the agreed contracted power in time block b [kW], Cmk,b the achieved 15 min measured power k in time block b [kW], Cexb the excess power in time block b [kW], Tci,bC the network tariff component for contracted power for user group i in time block b [EUR/kW], Fex the weighting factor for excess power (0.9 in 2024–2025, 1.05 in 2026–2027, 1.2 from 2028 onwards), n the number of 15 min intervals in which the achieved power exceeds the agreed contracted power within time block b during the billing month. The monthly distribution network charge for energy NCdE is calculated according to (5) and (6):
where NCdE denotes the distribution network charge for energy [EUR], NCdbE the distribution network charge for energy in time block b [EUR], Tdi,bE the network tariff component for energy for user group i in time block b [EUR/kWh], and ceb the energy withdrawn from the system in time block b [kWh].
For users in Group 0, who have 15 min measurements of withdrawn energy not recorded and whose contracted power is determined according to the applicable procedure, the monthly network charges for power and energy are calculated using the same approach. In this case, the withdrawn energy is accounted for according to the metering periods, peak, off-peak, or uniform tariff.
The impact of the network tariff system on different categories of end-users depends primarily on their electricity consumption profile. The framework places significantly greater weight on contracted power than on energy. A key factor, therefore, is the determination of the user’s contracted power. Under the revised methodology, the contracted power consists of an agreed contracted power, set in advance, and an excess power, representing the measured power above the agreed level.
The system operator determines the agreed contracted power based on 15 min peak values measured in the previous 12 months, or as the average of the three highest peaks during the most recent high-load season, depending on whether the user’s connection capacity is above or below 43 kW. Minimum contracted-power thresholds must also be met. For time block 1, these minimum values range from a defined percentage of the connection capacity for single-phase and three-phase users up to 43 kW, to 25% of the connection capacity for users above 43 kW.
Excess power occurs when the achieved 15 min value exceeds the agreed contracted level. In such cases, excess-power charges apply for each 15 min exceedance, provided that the sum of agreed and excess contracted power does not exceed the user’s connection capacity.
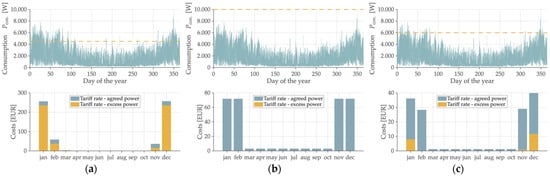
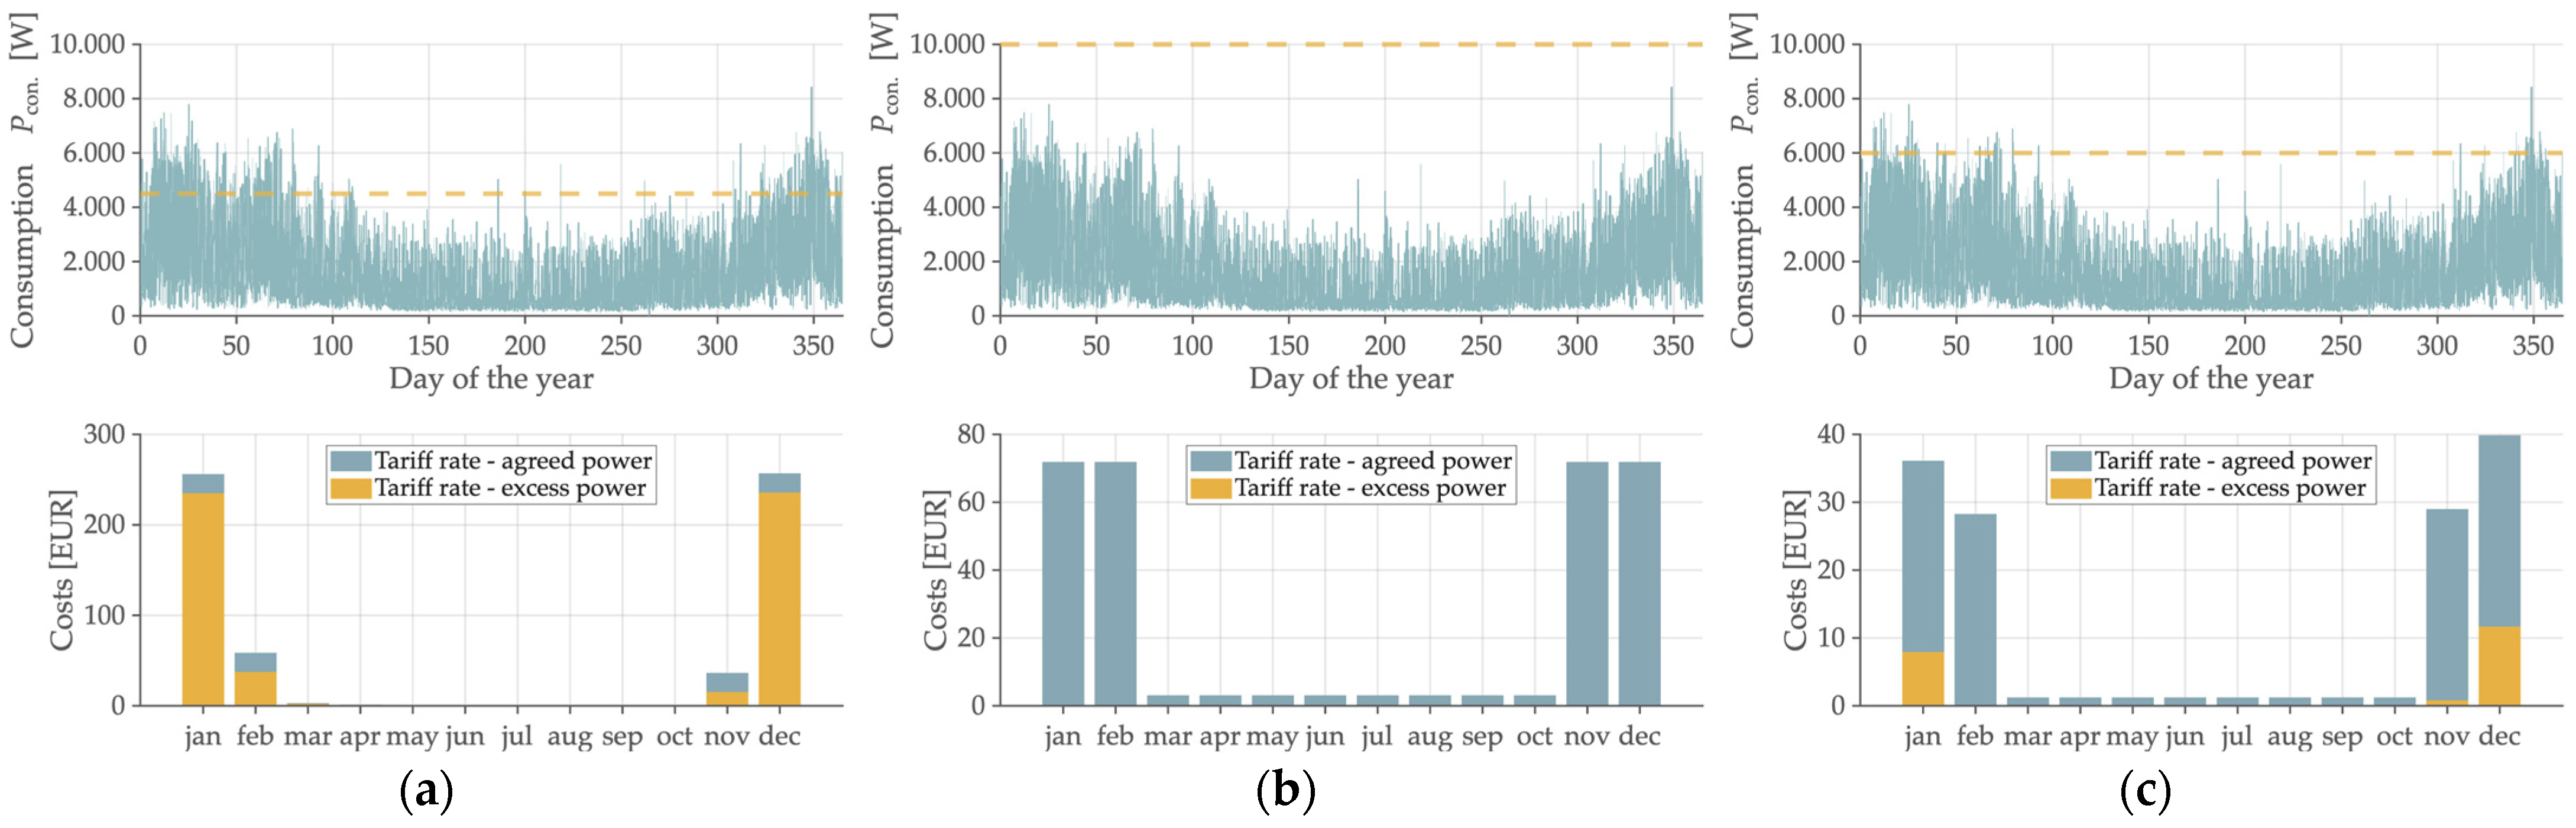
In practice, determining the contracted power based on the average of the highest peaks in the high-load season is the most sensible approach, as this period has the most significant influence on total network charges. An inappropriately selected contracted power can lead to higher costs, either due to excessive values or due to repeated exceedances. Figure 1 illustrates this effect for (a) undersized, (b) oversized, and (c) optimally selected contracted power for a typical household consumer.
Figure 1.
Impact of contracted power selection for a typical household consumer: (a) undersized; (b) oversized; and (c) optimal agreed contracted power.
2.2. Assessment Methodology for Network Tariff Costs
The assessment methodology is structured into two parts: technical and economic. It includes the calculation of network tariff costs for three household configurations: a household with baseline electricity consumption, a household equipped with a PV system, and a household equipped with both a PV system and a BSS.
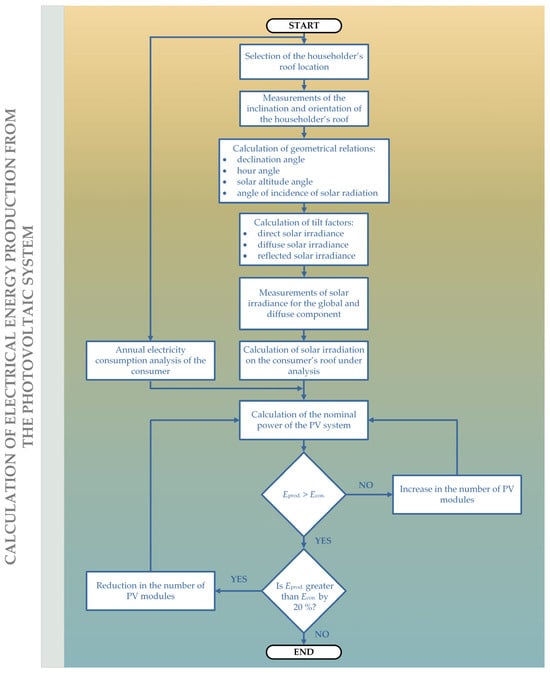
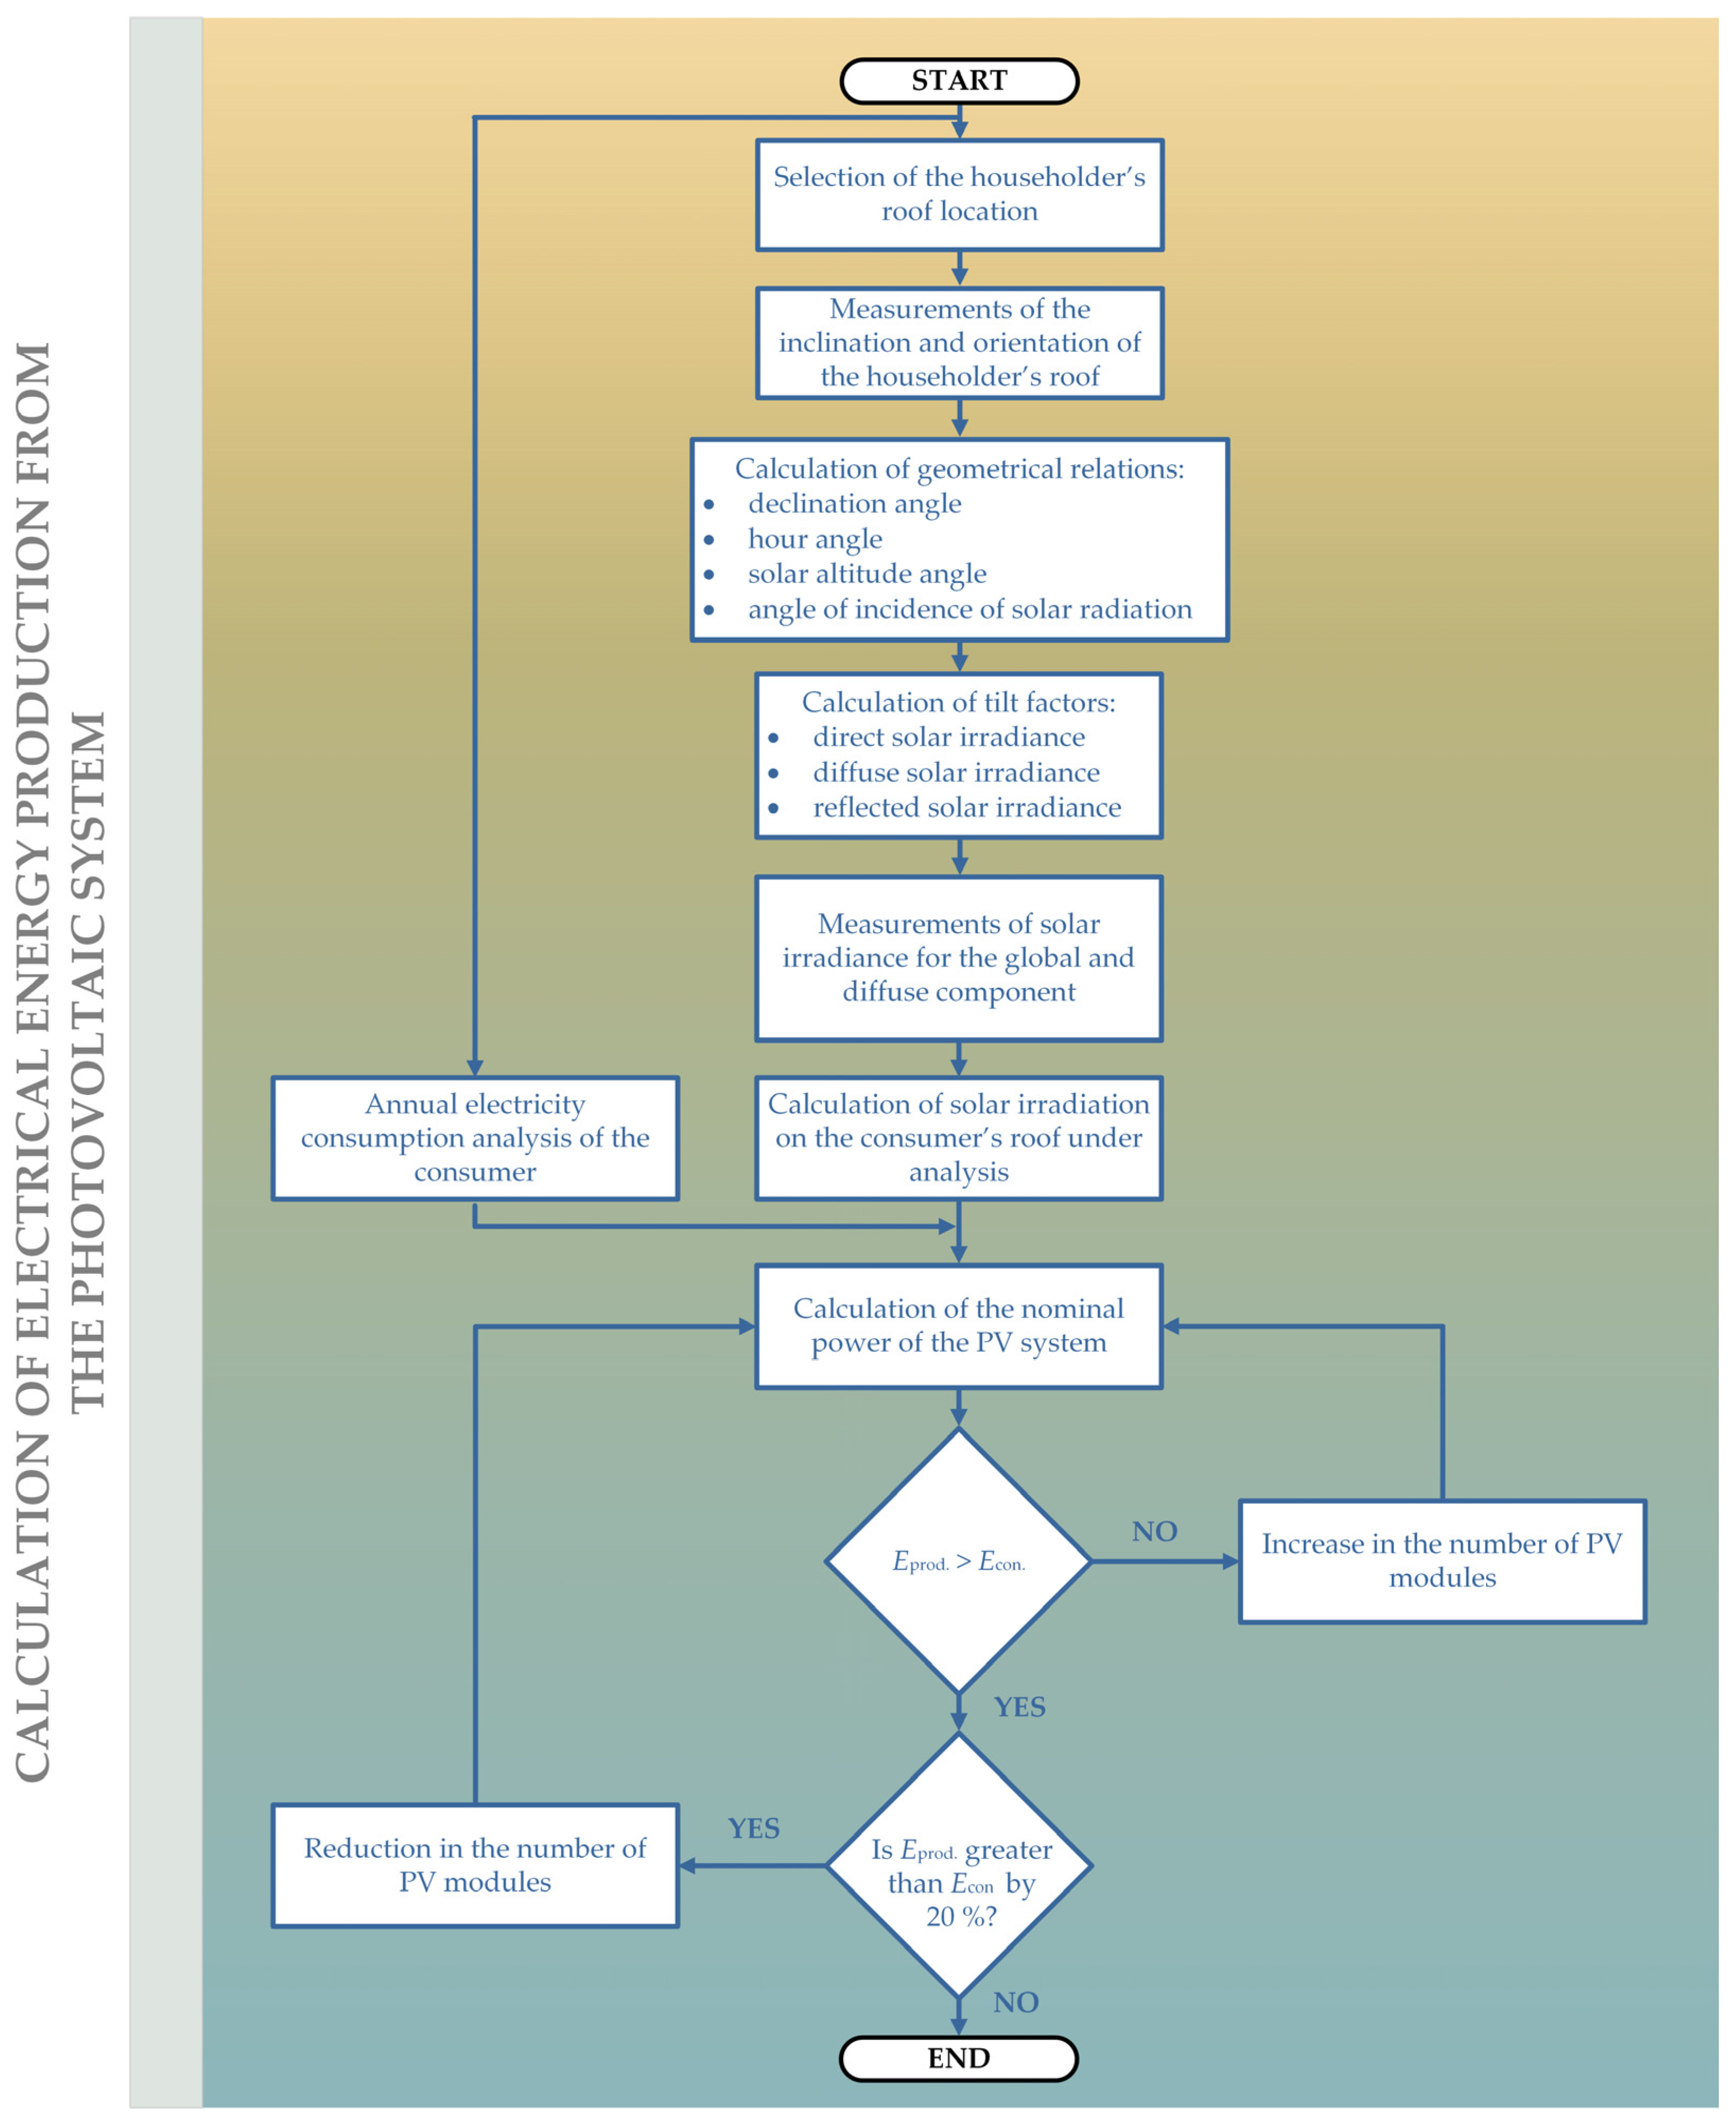
The technical part begins with estimating electricity production from the household PV system. The procedure starts with determining the installation site, roof inclination, and roof orientation. Using geometric relations between the sun and the earth, the declination angle, hour angle, solar altitude angle, and the angle of incidence on the module plane are calculated. Subsequently, global and diffuse irradiance data on a horizontal surface are obtained from the nearest meteorological station, and the corresponding solar irradiation on the household roof is derived. Based on the 15 min household electricity consumption profile and the computed solar irradiation, the optimal PV system size is determined, allowing for an installed capacity up to 20% higher. The complete workflow for estimating PV system electricity production is illustrated in Figure 2.
Figure 2.
Calculation of electricity production from a photovoltaic system.
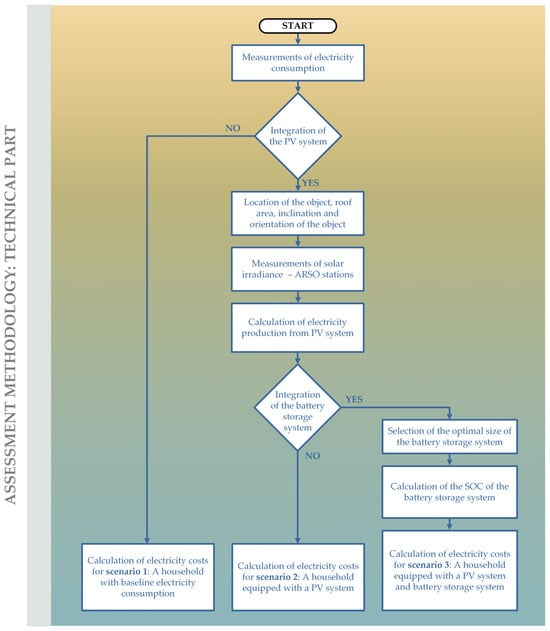
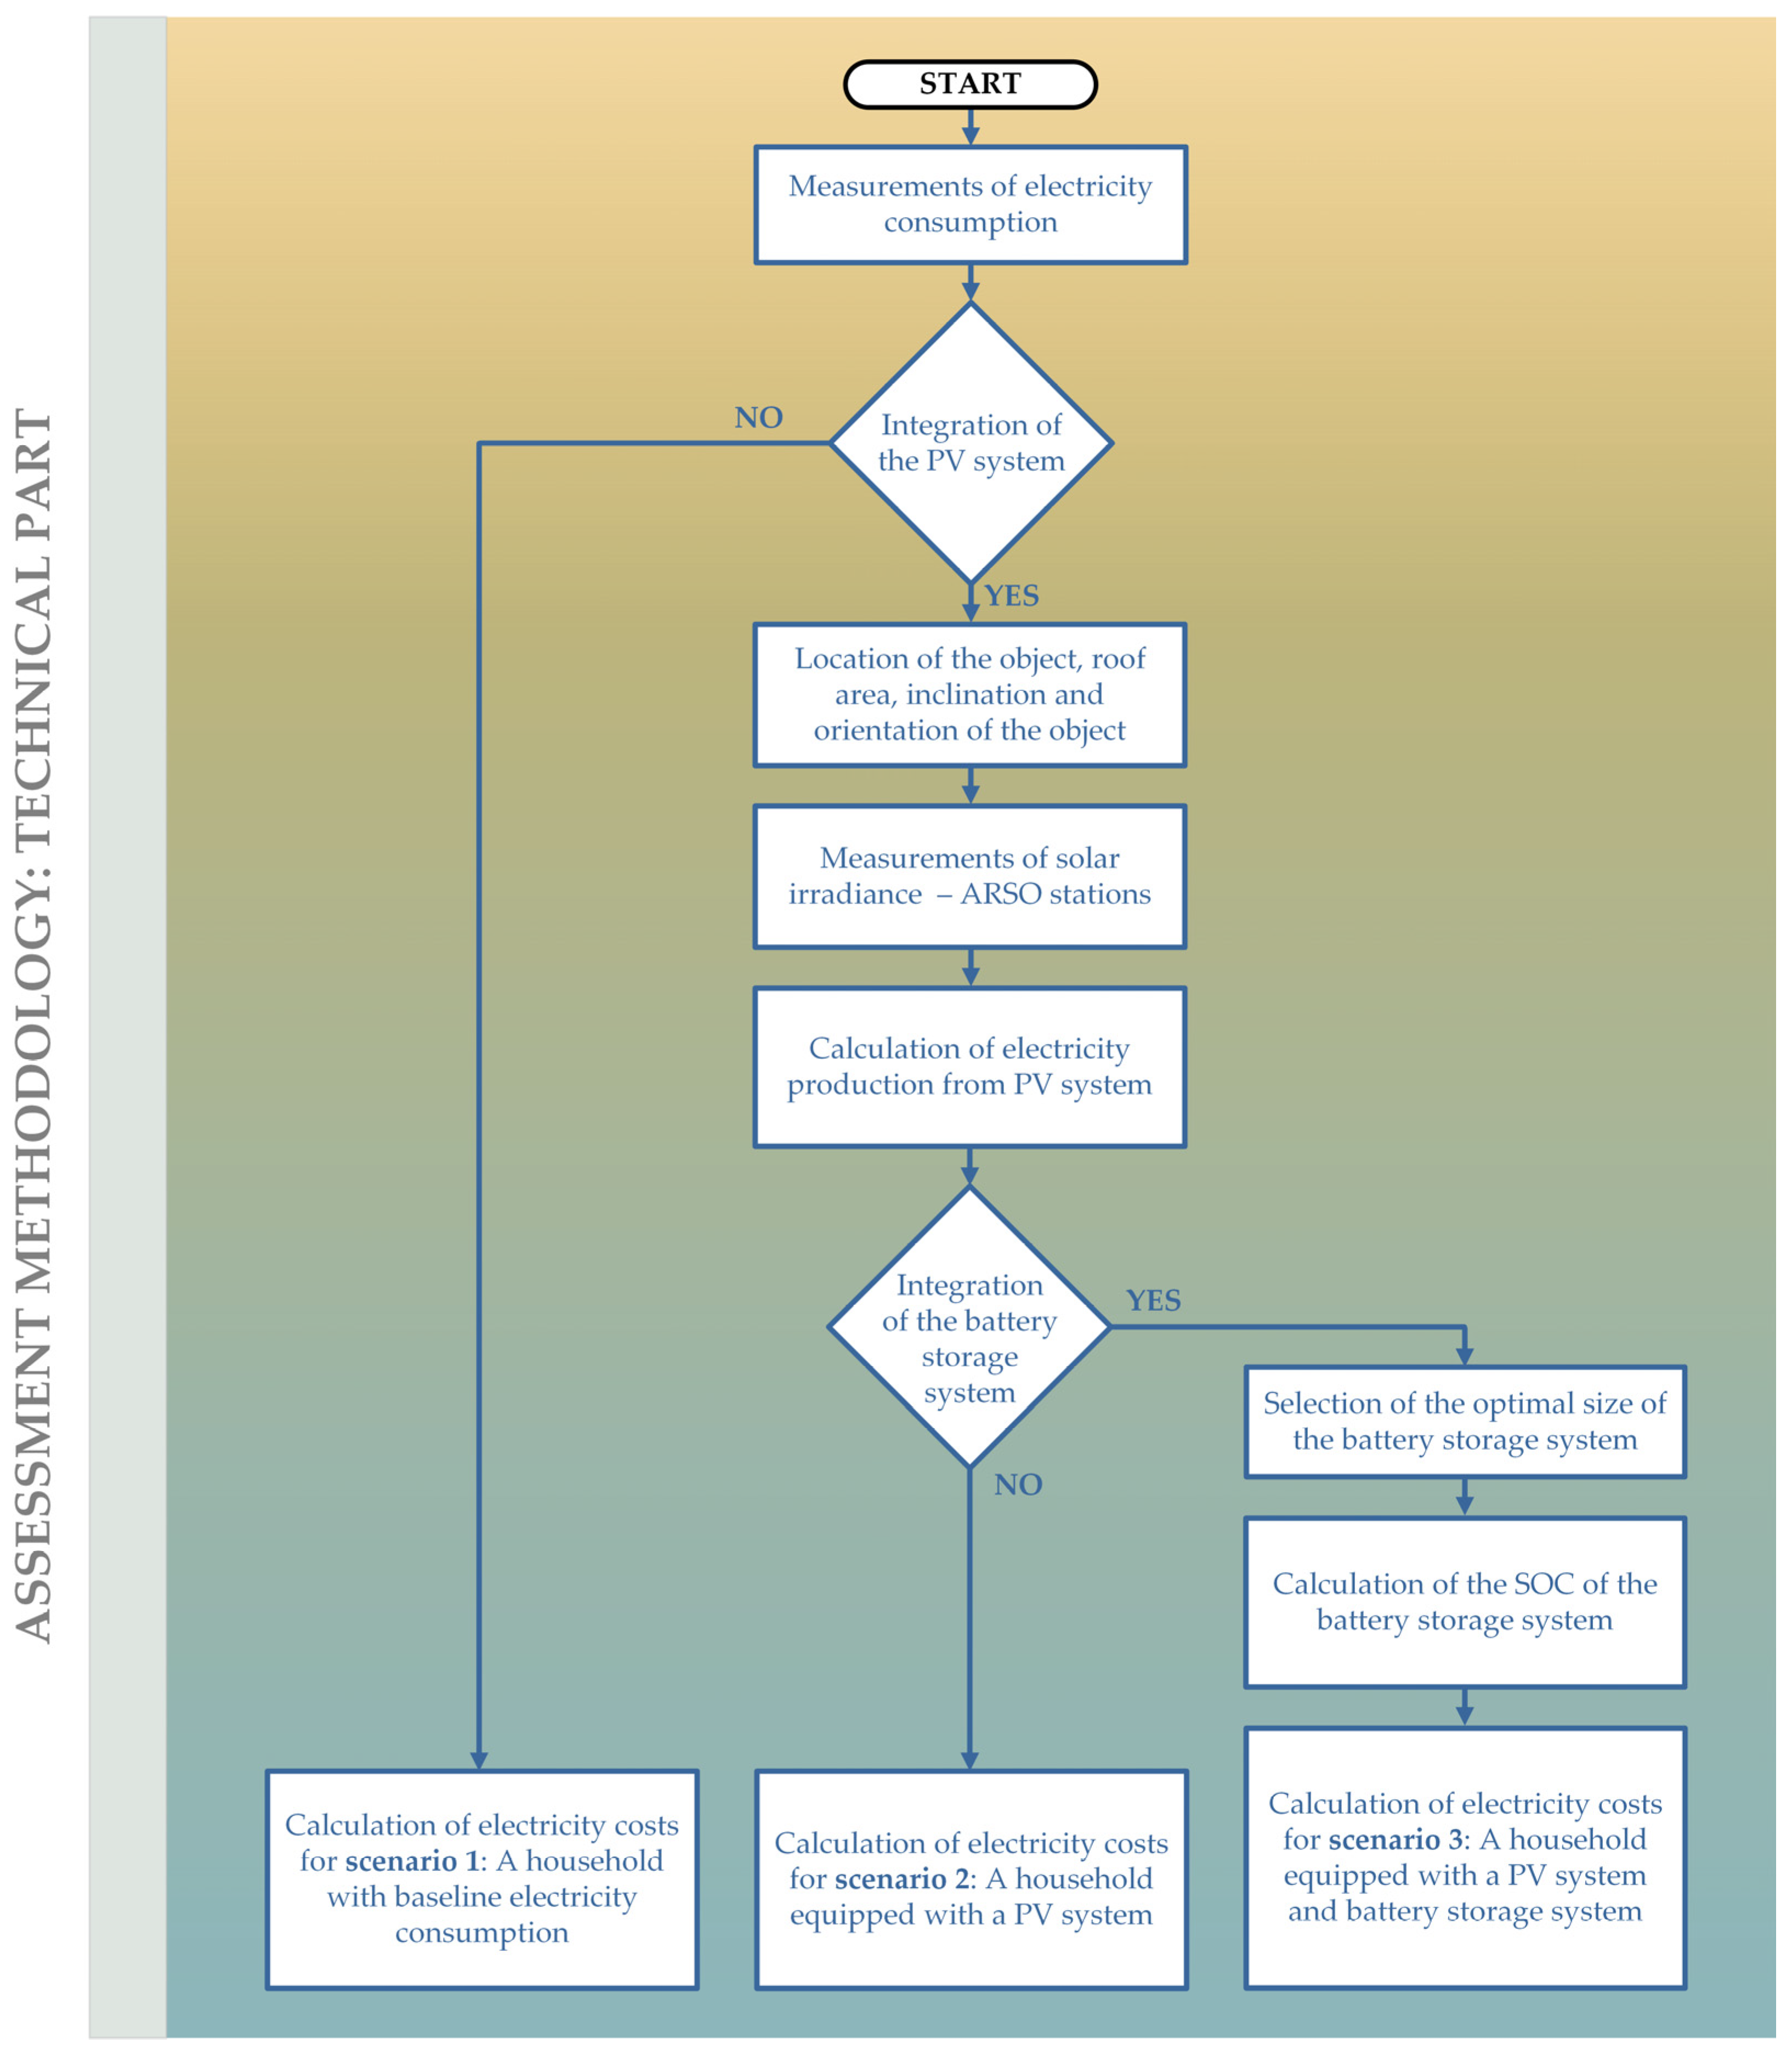
As previously noted, the technical part of the assessment methodology involves calculating household electricity consumption for three configurations. A key prerequisite is the availability of 15 min electricity consumption data, which can be obtained from the transmission and distribution system operators via smart meters. In the first scenario, representing a household with baseline electricity consumption, the optimal agreed contracted power is determined according to the Slovenian network tariff system framework presented in Section 2.1, followed by an analysis of the household’s consumption profile. In the second scenario, the methodology incorporates a PV system, with its electricity production calculated according to the workflow illustrated in Figure 2. The third scenario extends the analysis by including both a PV system and a BSS sized for self-consumption. The operating logic prioritizes covering the household’s instantaneous demand, then charging the BSS, and only after these conditions are met, exporting excess electricity to the grid; the reverse applies during battery discharge. The complete technical workflow of the assessment methodology is shown in Figure 3.
Figure 3.
Technical part of the assessment methodology.
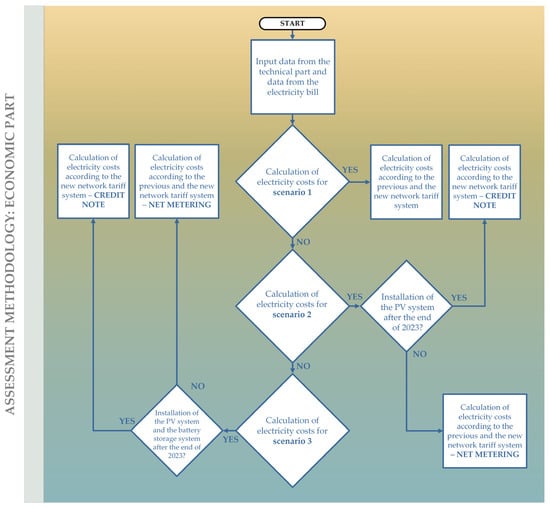
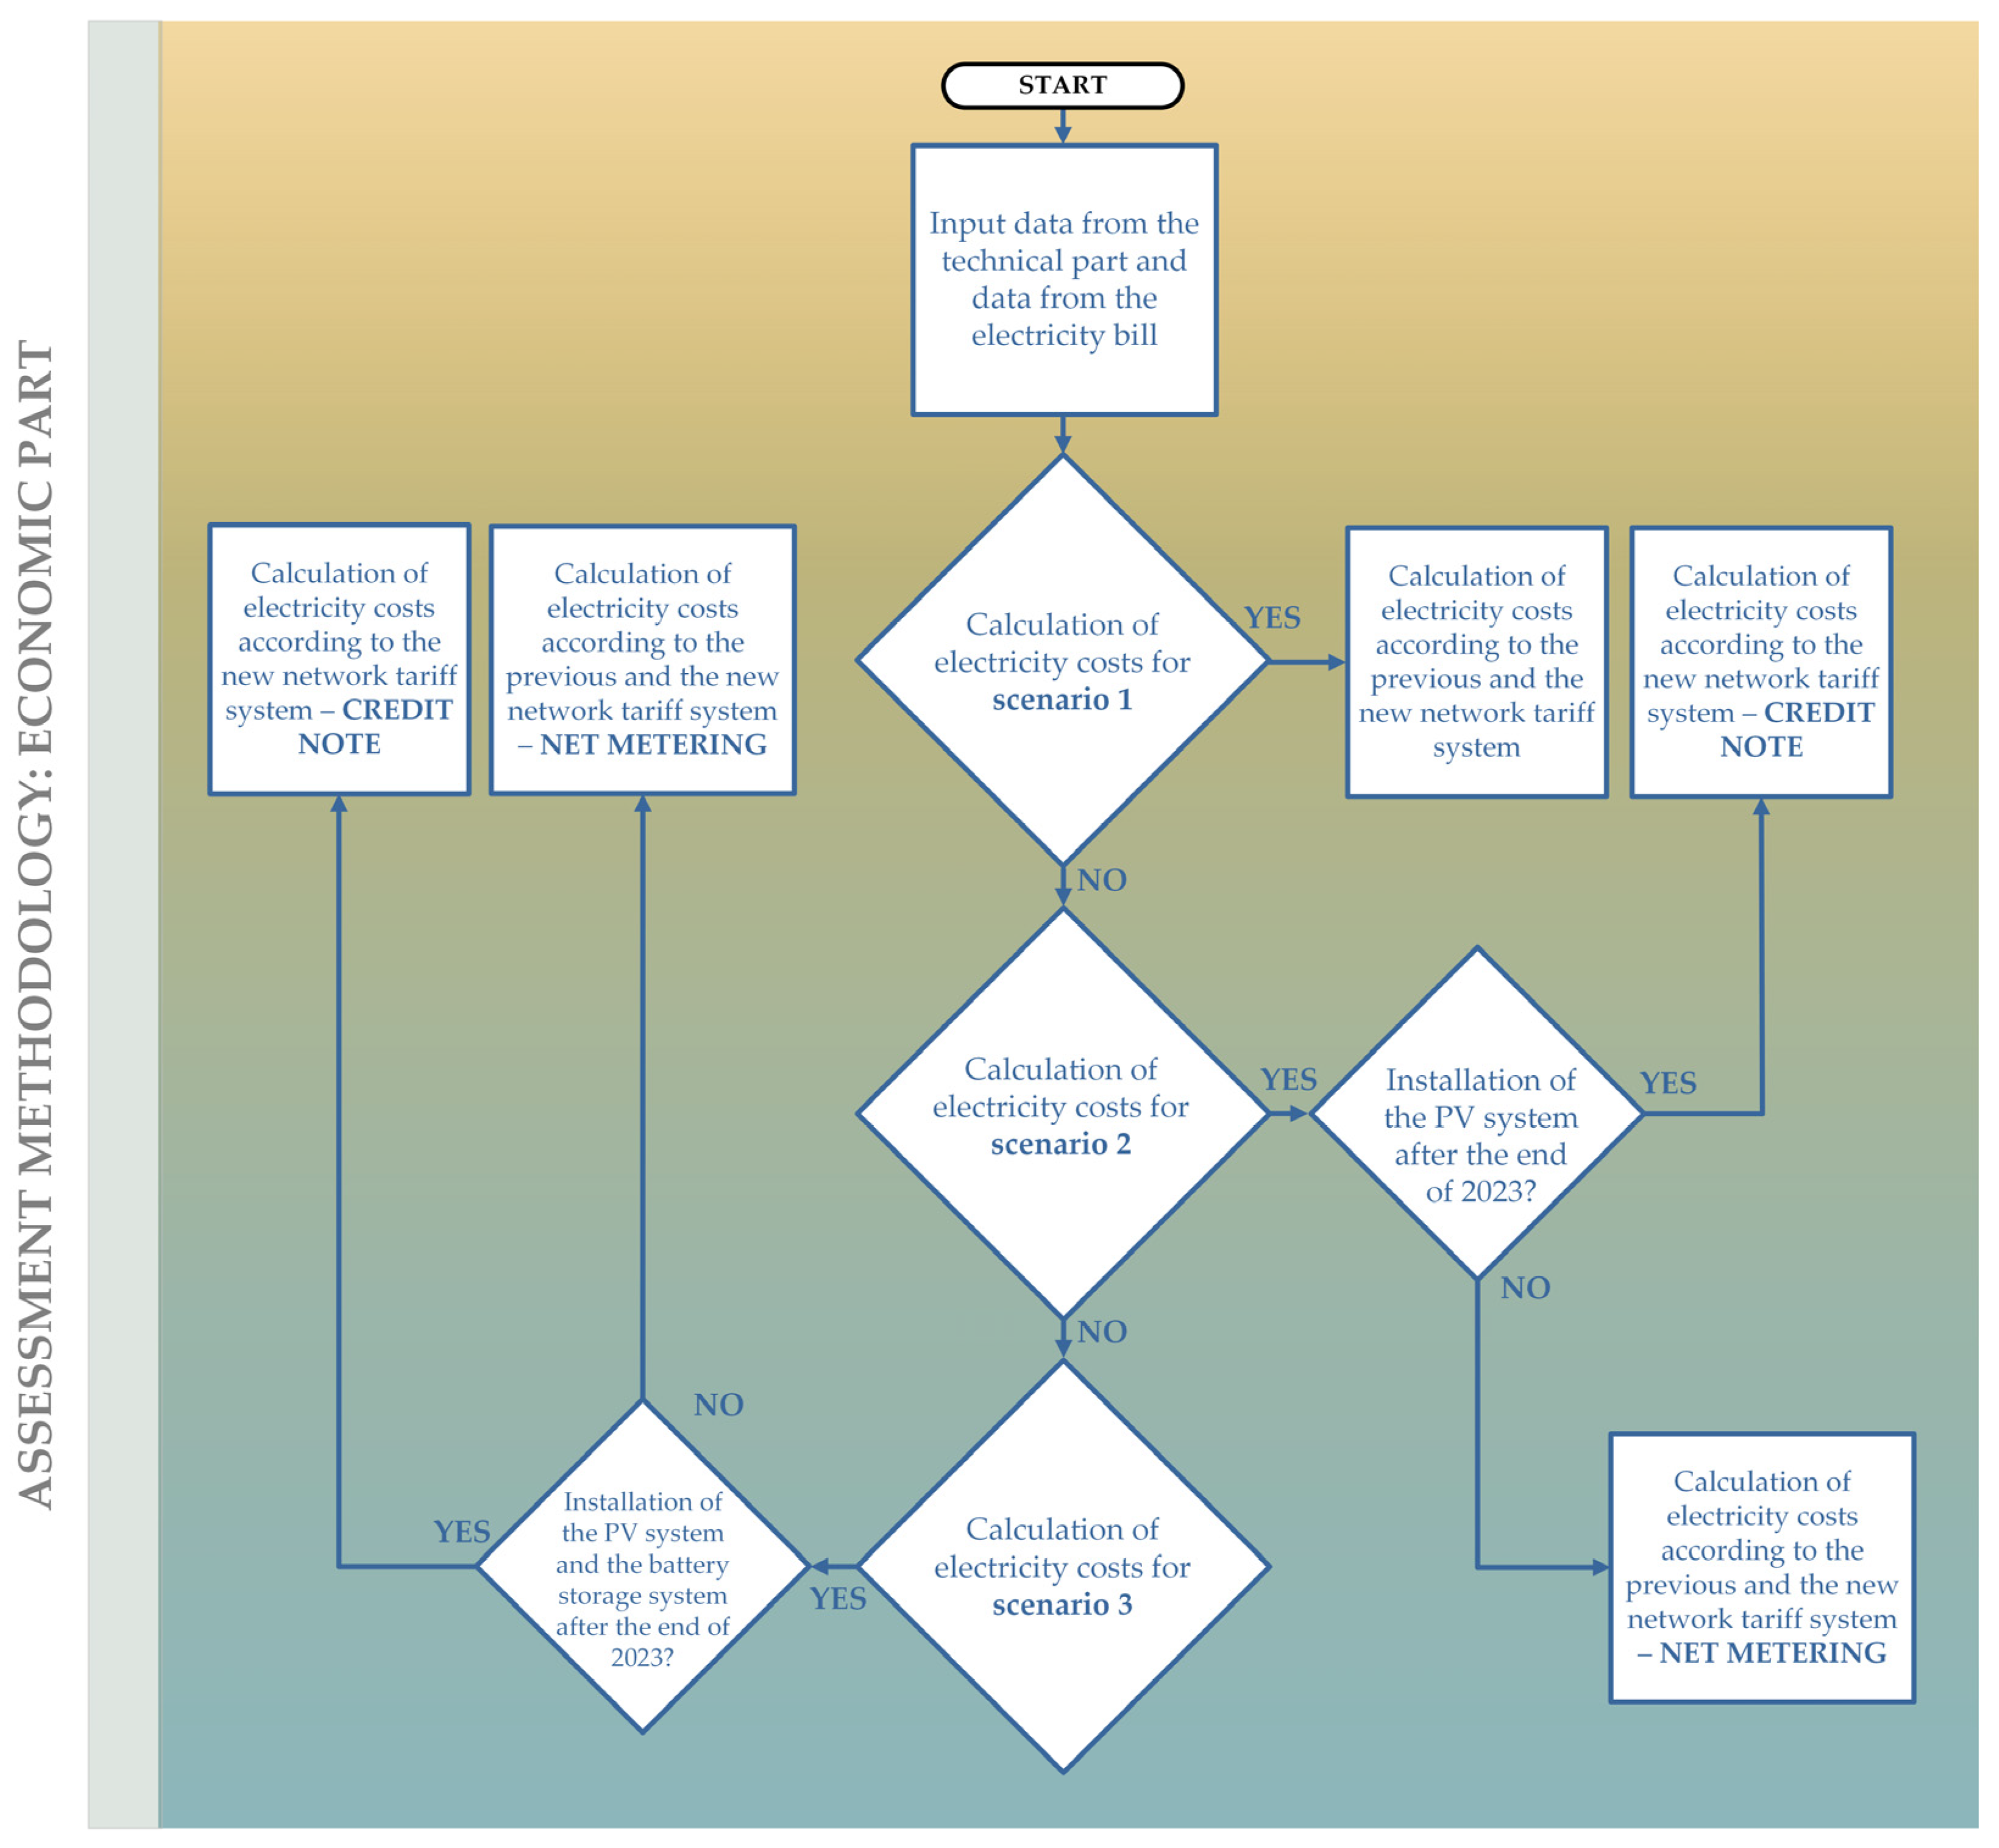
As for the economic part of the assessment methodology, the first step requires extracting the relevant information from the household electricity bill, including the electricity price, connection capacity, market-operation charges, RES contributions, energy-efficiency contributions, excise duty, value-added tax (VAT), and the network tariff components for power and energy across all five-time blocks. The calculated electricity consumption values for all three scenarios serve as the basis for the subsequent economic evaluation.
A crucial consideration in the economic analysis of households equipped with a PV system is the need to account for two distinct support schemes implemented in Slovenia over the past decade. The first is the annual netting scheme, also known as net-metering, which was available to PV system owners who entered the scheme between 2015 and the end of 2023. Under net-metering, electricity production and consumption were balanced over the entire year, meaning that only the annual net consumption was billed, while annual surpluses had no monetary value but offset the final bill to zero. This incentivized sizing the PV system so that its annual production closely matched the household’s annual demand.
From 2024 onwards, a new support scheme has been introduced, which, from a technical and regulatory perspective, encourages the integration of a BSS and applies monthly balancing of electricity production and consumption. In this scheme, only the imported electricity is subject to network charges, while excess electricity that is exported to the grid is compensated through a credit note at a predefined rate. This makes the economic performance of PV systems more dependent on self-consumption, and the inclusion of a BSS becomes increasingly essential for reducing electricity taken from the grid and for improving the overall financial outcome. The complete economic workflow of the assessment methodology is shown in Figure 4.
Figure 4.
Economical part of the assessment methodology.
3. Results
Based on the assessment methodology presented in Chapter 2, this chapter provides the technical and economic results for a household under the network tariff system framework for three scenarios: a household with baseline electricity consumption, a household equipped with a PV system, and a household equipped with both a PV system and a BSS.
3.1. Household Baseline Electricity Consumption
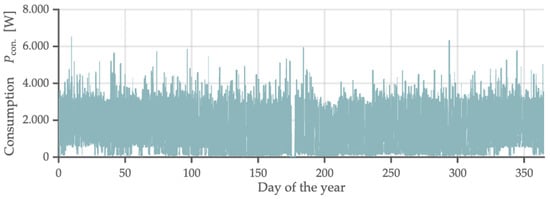
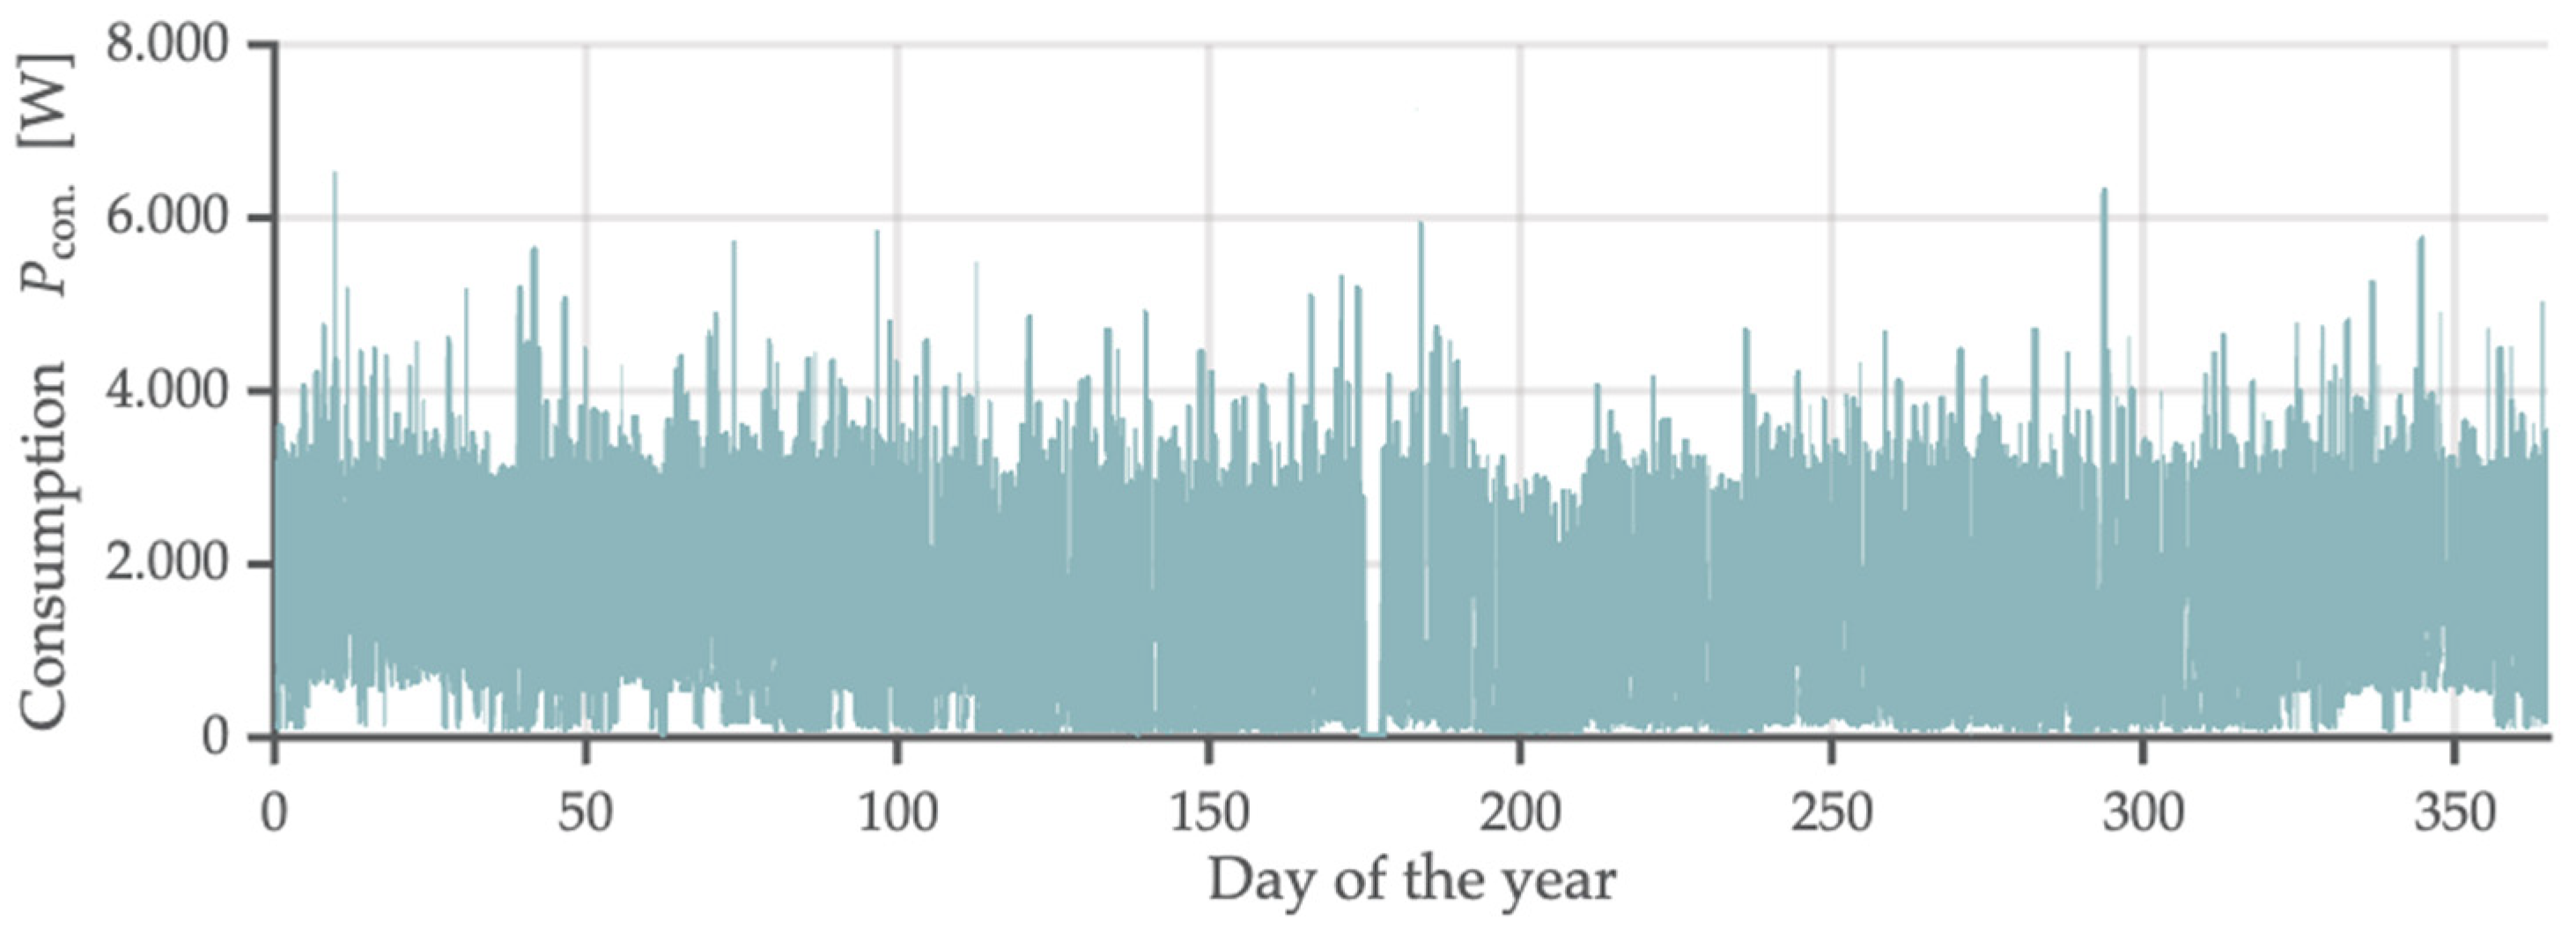
The selected household represents a typical four-person detached dwelling with a net floor area of 135 m2, located in the north-eastern part of Slovenia. Domestic hot water preparation and space heating are provided by an air-to-water heat pump. The household connection is defined by a connection capacity of 7 kW and protection with 3 × 20 A fuses. The proposed household represents a typical low-carbon consumer whose energy supply is entirely electricity-based. Figure 5 presents the baseline electricity consumption profile for a household.
Figure 5.
Baseline electricity consumption profile for a household.
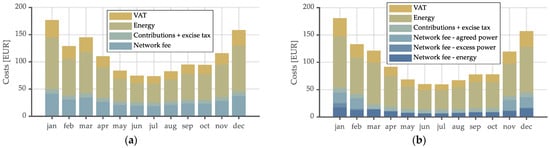
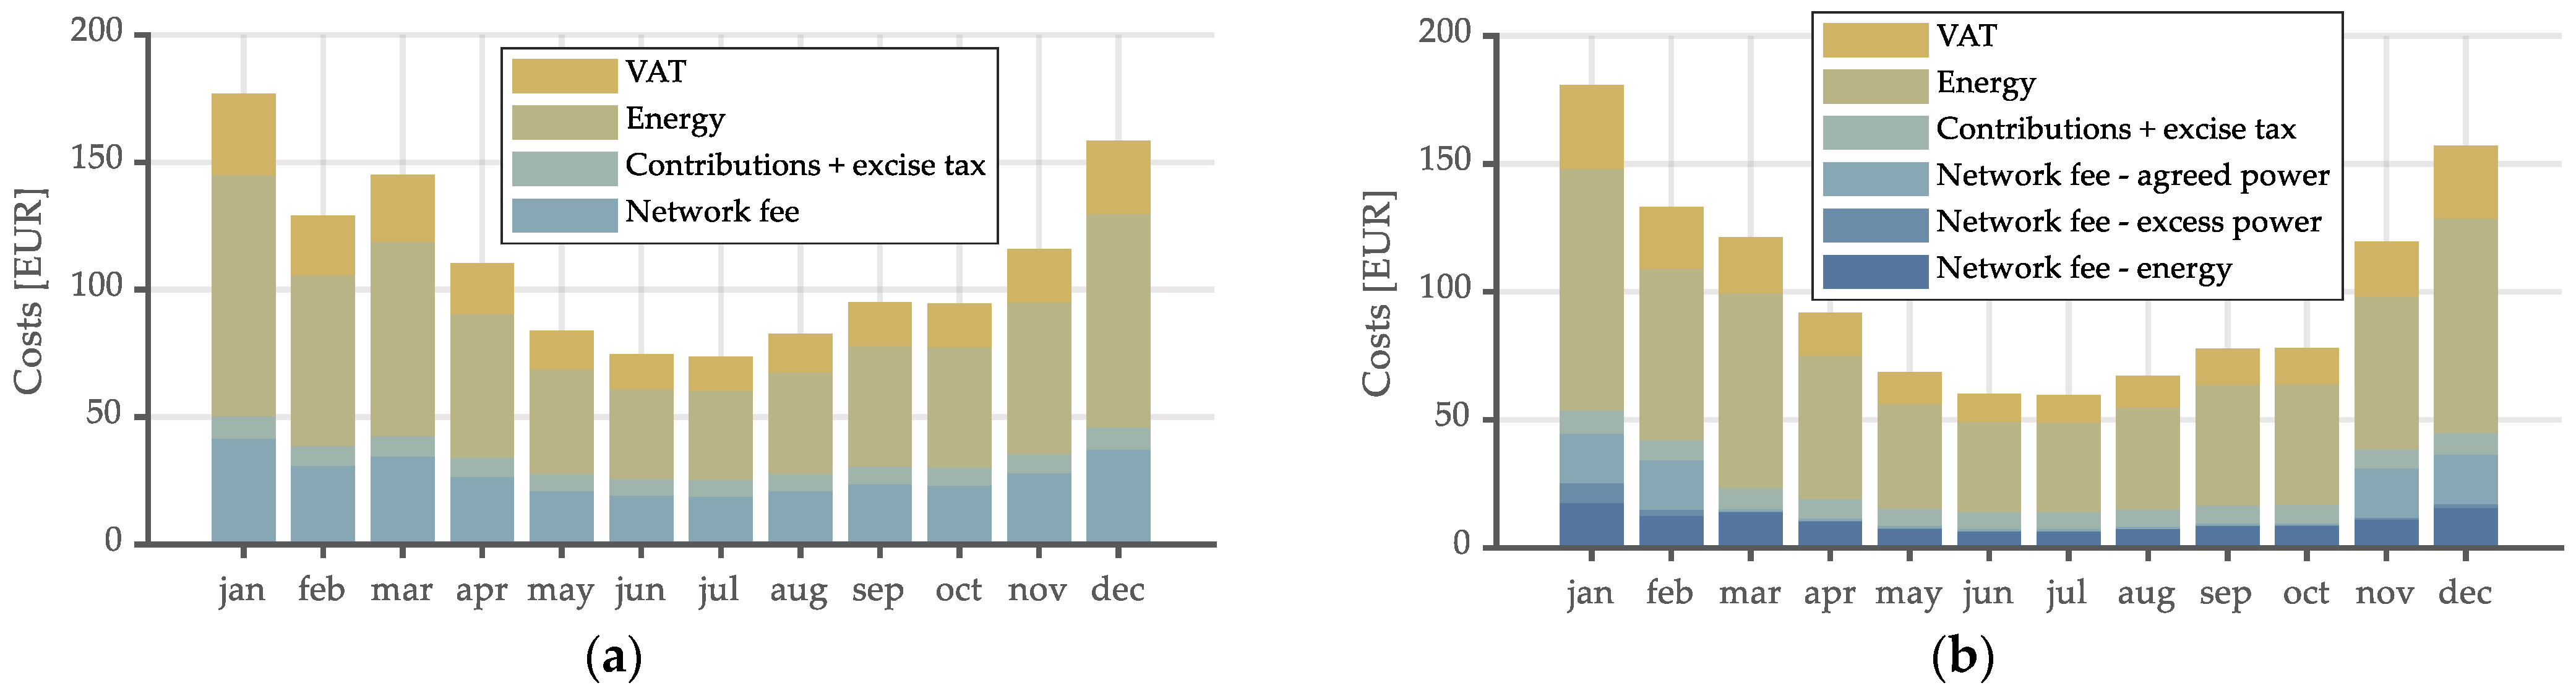
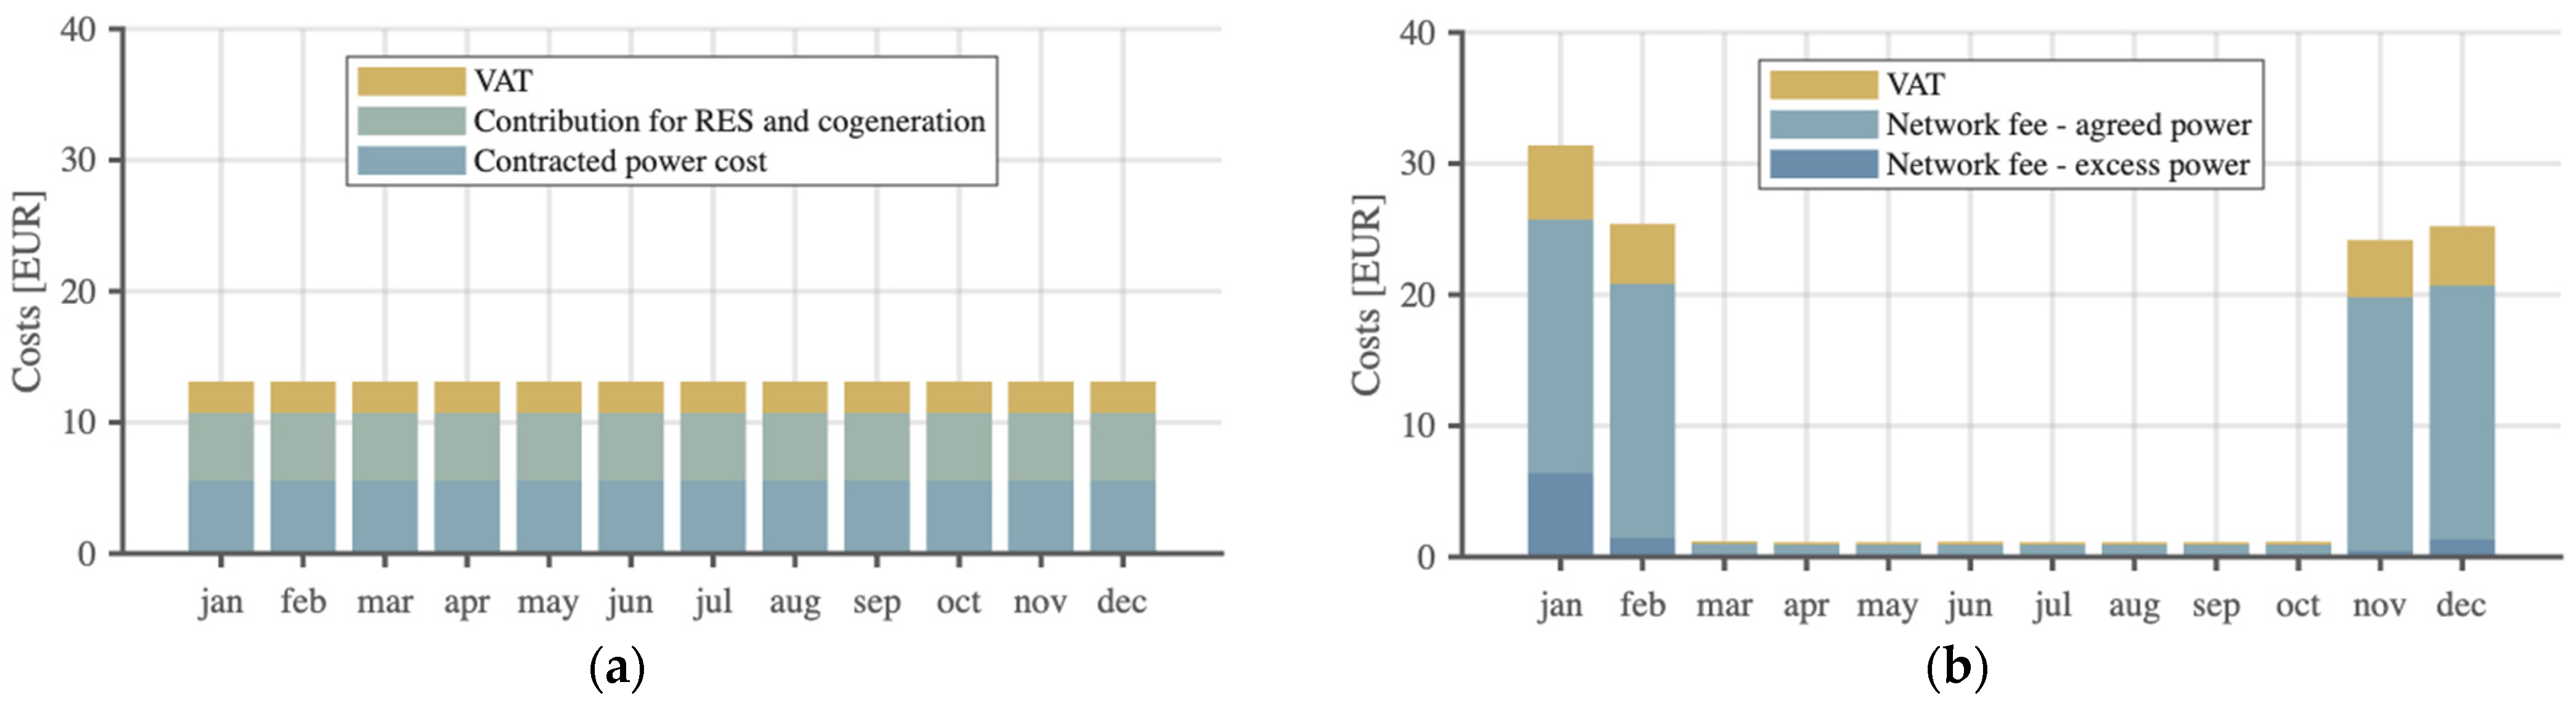
Figure 5 shows an almost evenly distributed household electricity consumption profile with an average power demand of 779.6 W. The highest recorded peak load reaches 6504 W, while the annual electricity consumption amounts to 6828 kWh. Overall consumption remains relatively stable throughout the year without clearly distinguishable seasonal patterns, suggesting that the dominant household loads are distributed evenly over the year. Based on the presented electricity consumption and the network tariff components listed in Appendix A, Figure 6 shows the structure of electricity costs under (a) the previous and (b) the new network tariff system.
Figure 6.
The structure of electricity costs under (a) the previous and (b) the new network tariff system for a household with baseline electricity consumption.
Figure 6a shows that the annual electricity costs under the previous network tariff system amount to 1340.3 EUR. Under the new tariff framework (Figure 6b), the annual costs are reduced by 124.7 EUR (a reduction of 9.3%), resulting in a total of 1215.6 EUR. During the high-season months (winter), monthly electricity costs are higher than under the previous system, primarily due to the relatively high tariff rate of the agreed contracted power component in time block 1. In contrast, the tariff rates for the agreed contracted power in the low-season months are significantly lower, which results in lower monthly costs compared to the previous tariff system.
A comparison of the cost structures between the two systems reveals that the primary change introduced by the new network tariff system is a shift in cost contribution: a larger share of the final electricity price now originates from power-based components, whereas under the previous system, the dominant share was attributable to energy-based charges.
3.2. Household Electricity Consumption with a Photovoltaic System
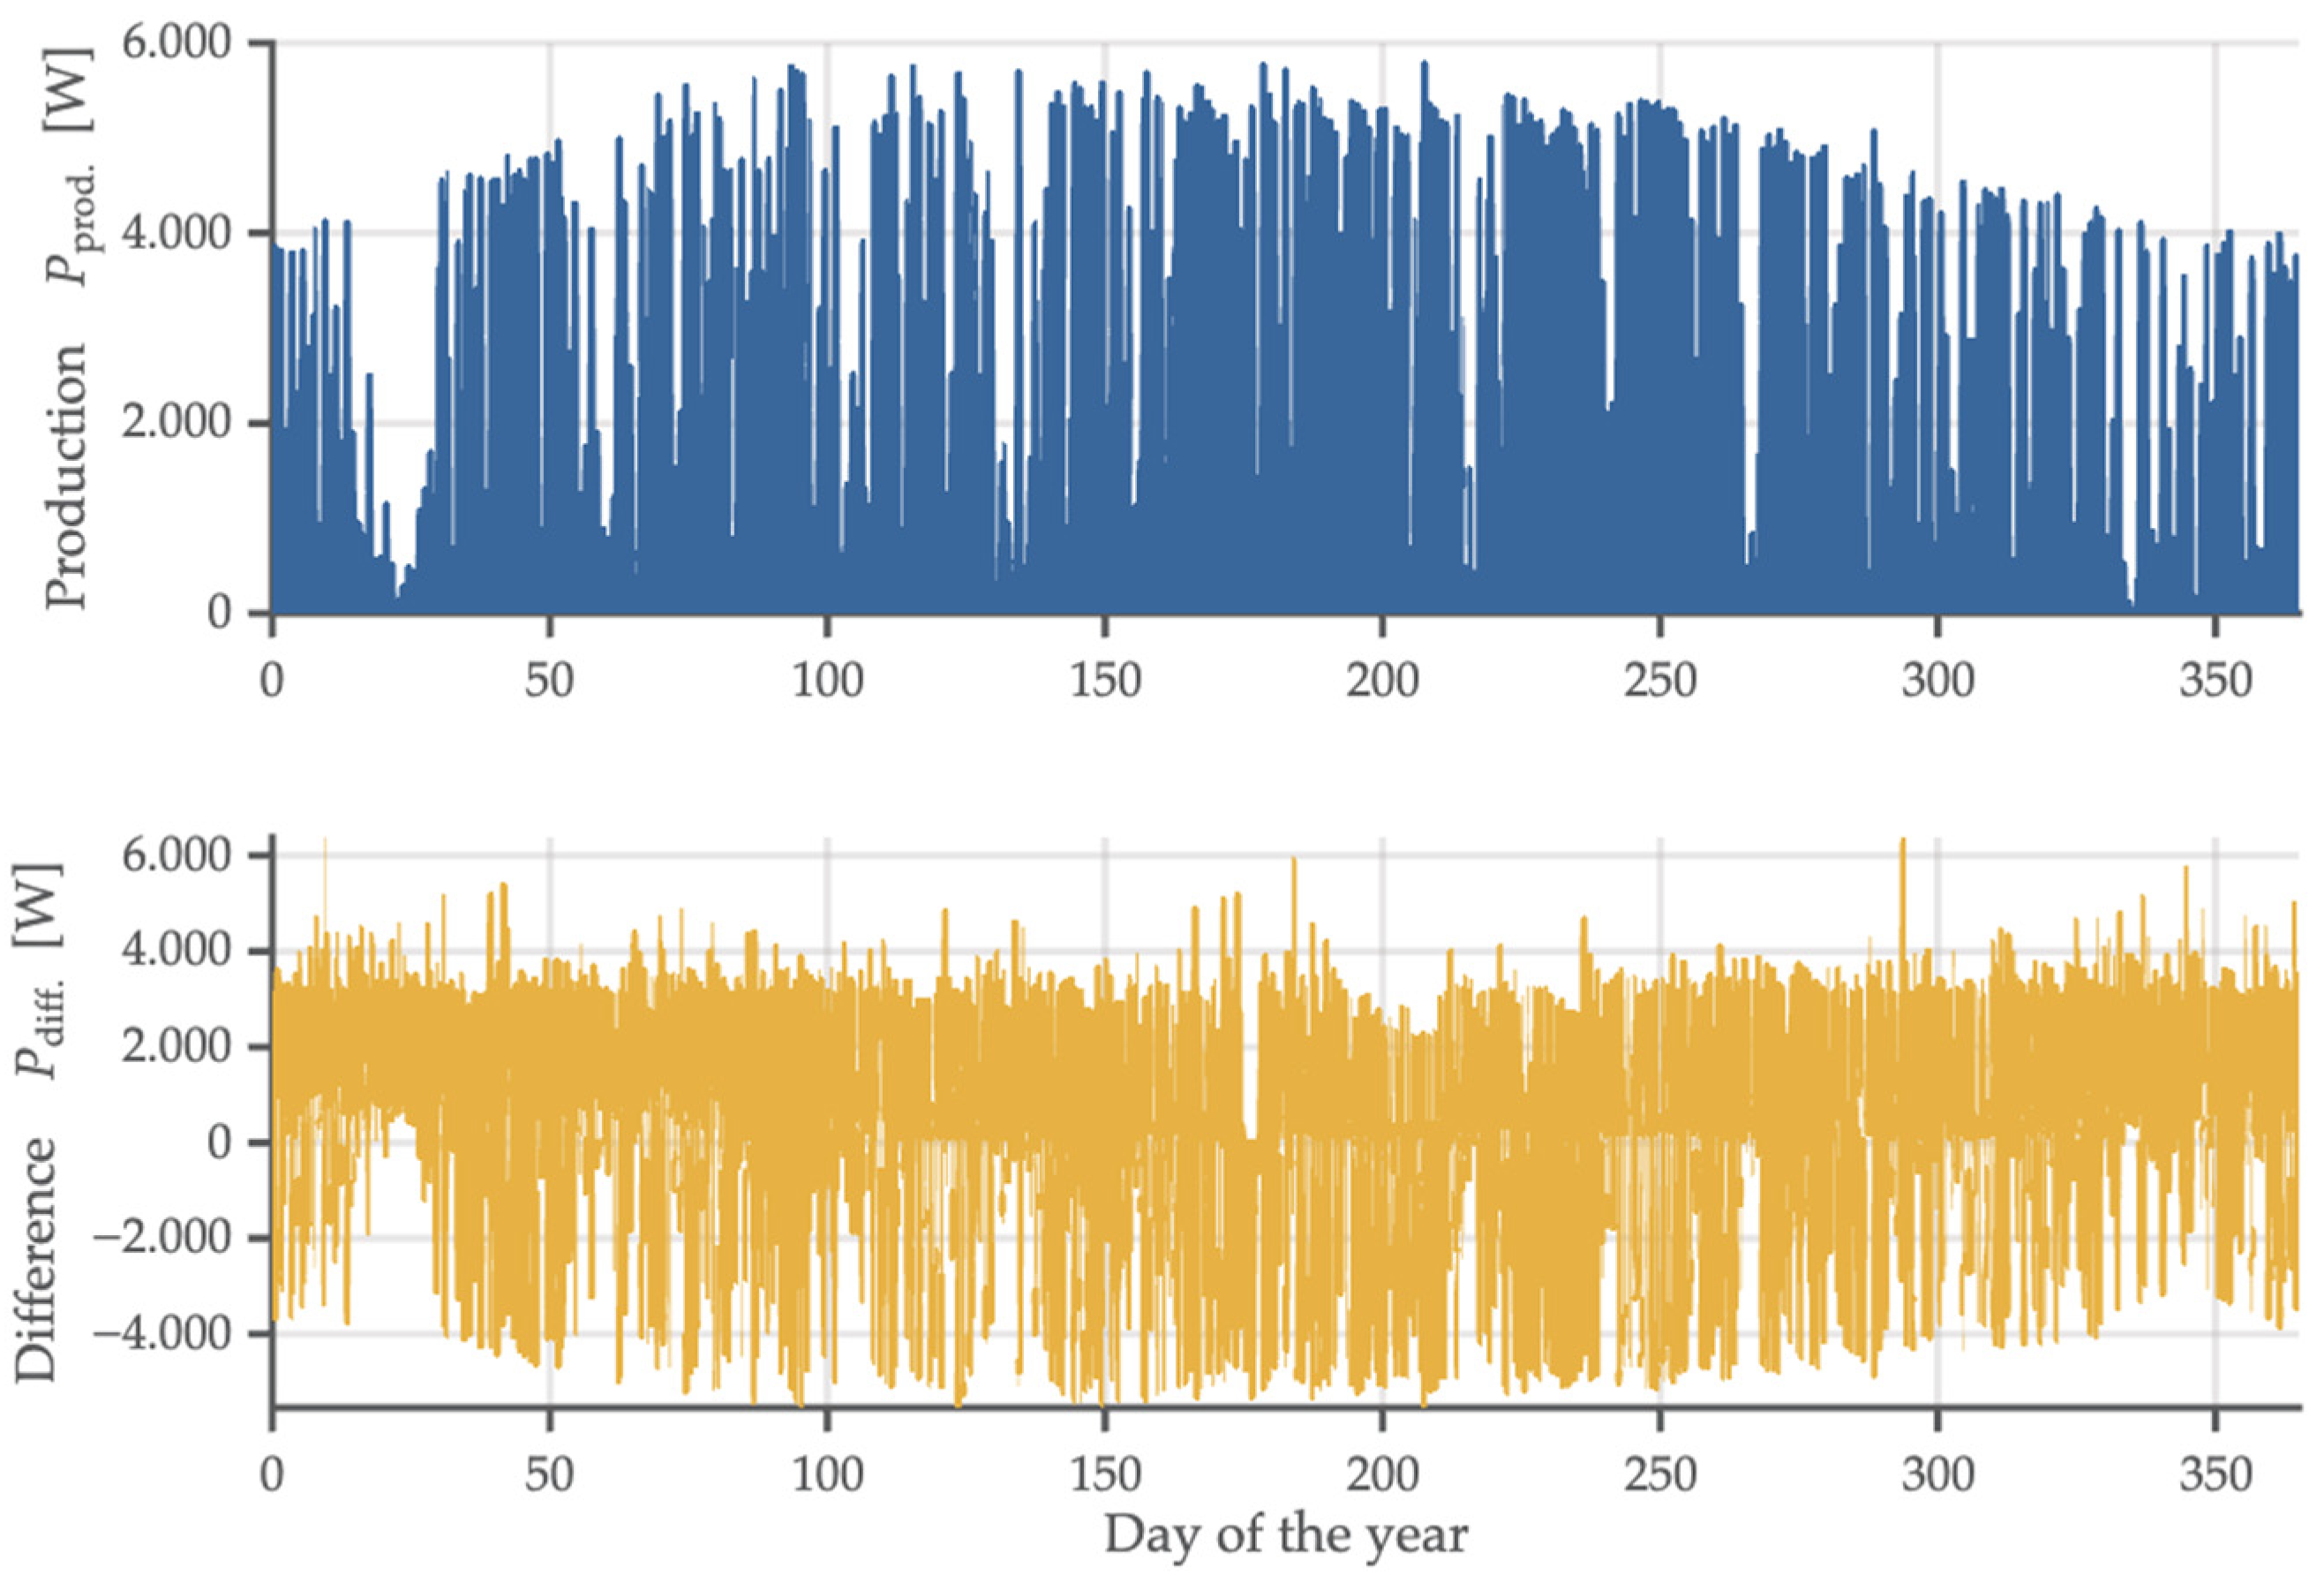
The second scenario represents a household equipped with a PV system. The installed PV capacity is 5400 W, consisting of twelve monocrystalline modules. The system is mounted at a 35° inclination, corresponding to the roof slope, and oriented towards the south with an azimuth angle of 0°. Figure 7 shows the electricity consumption profile of the household with the integrated PV system.
Figure 7.
Electricity consumption profile of the household with the integrated PV system.
Figure 7 shows that the average PV system output is 914.4 W, with a maximum recorded power of 5783.6 W and an annual electricity production of 8010.6 kWh. With the integration of the PV system, 55.48% of the produced electricity (5.979 MWh) is exported to the grid, while 44.52% (4.798 MWh) is imported from the grid to cover the household’s electricity demand on 15 min intervals. Based on the presented electricity consumption and production, Figure 8 shows the structure of electricity costs under (a) the previous and (b) the new network tariff system for a household with the integrated PV system under the net-metering scheme.
Figure 8.
The structure of electricity costs under (a) the previous and (b) the new network tariff system for a household with the integrated PV system under the net-metering scheme.
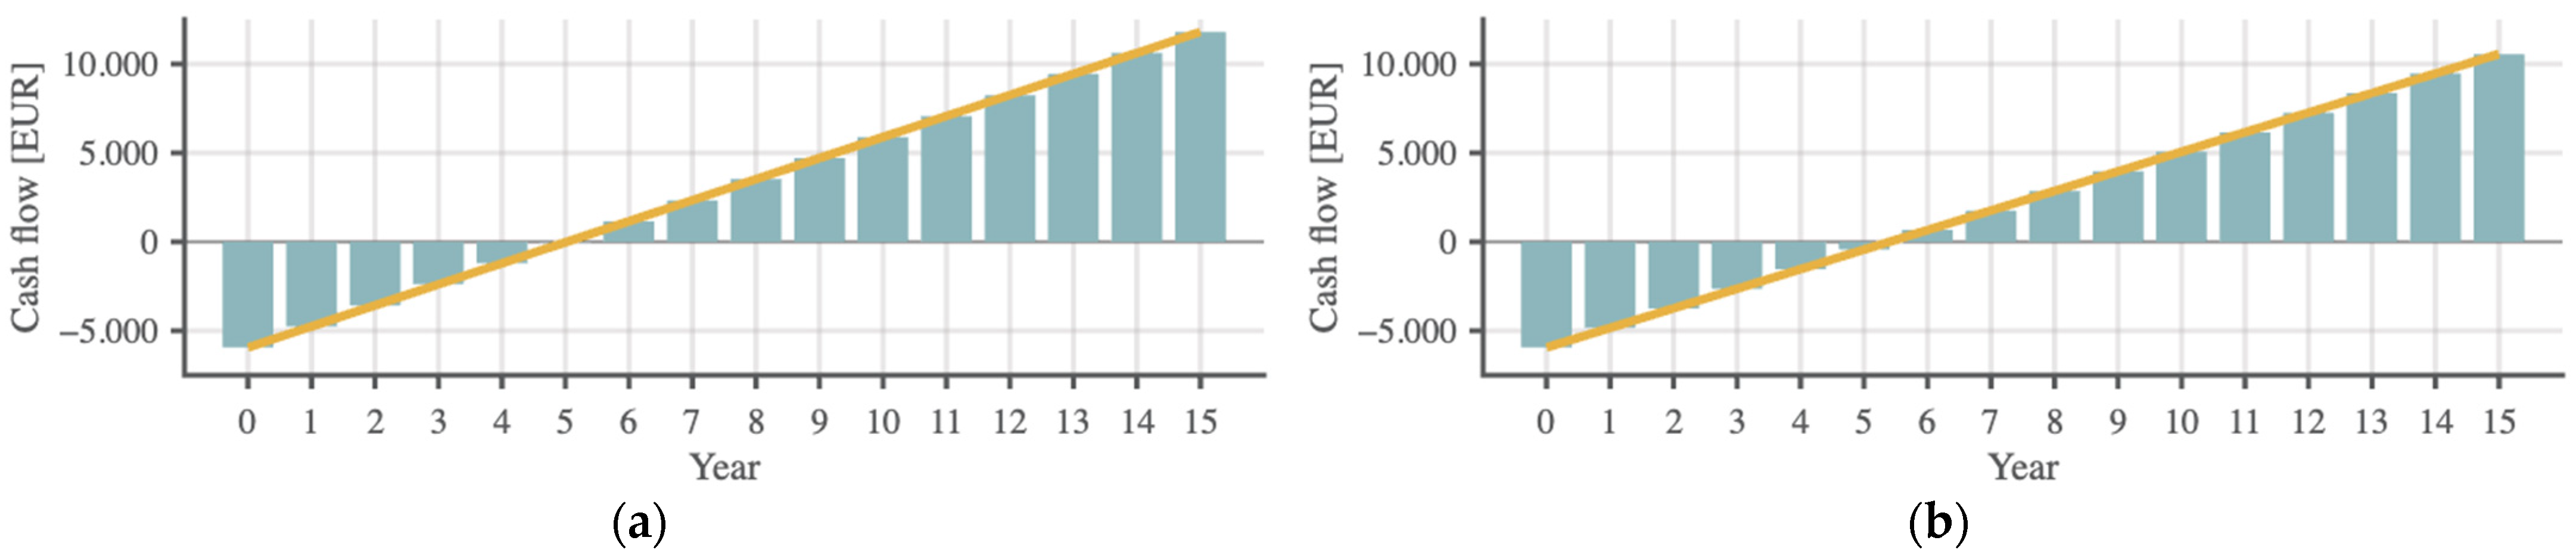
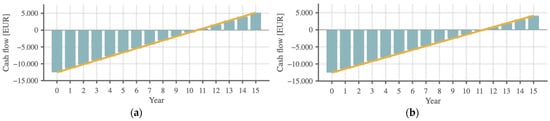
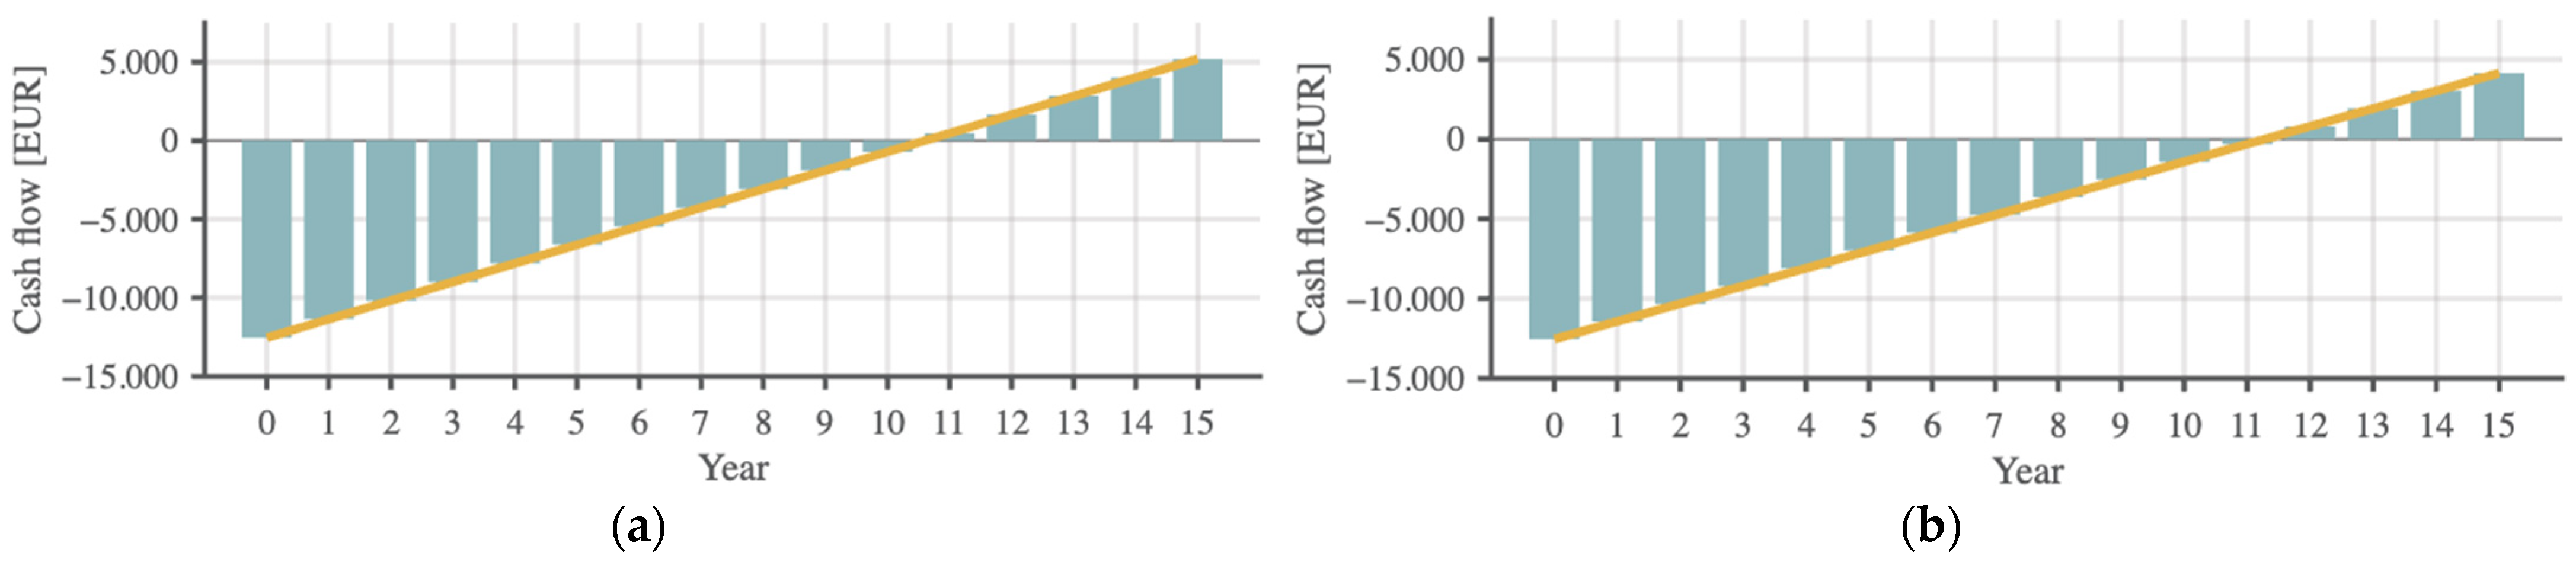
Figure 8a shows that under the previous network tariff system, the electricity costs for households with an integrated PV system operating under the net-metering scheme remain constant throughout the year, amounting to 157.30 EUR annually. In contrast, Figure 8b indicates that under the new network tariff system, the electricity costs for the households operating under the net-metering scheme are unevenly distributed across the months. This is primarily due to the highest tariff rate for contracted power occurring in time block 1, which corresponds to the high-load season (January, February, November, and December). As a result, the annual electricity costs under the new network tariff system decrease to 115.30 EUR, representing a 26.7% decrease compared to the electricity costs calculated under the previous tariff system. Figure 9 shows the payback period of the investment under (a) the previous and (b) the new network tariff system for a household with the integrated PV system under the net-metering scheme.
Figure 9.
The payback period of the investment under (a) the previous and (b) the new network tariff system for a household with the integrated PV system under the net-metering scheme.
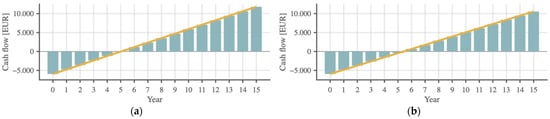
Figure 9a shows that, assuming an investment cost of 5940 EUR, constant annual savings, and an unchanged electricity consumption and production profile, the investment in a PV system under the previous network tariff system and the net-metering scheme is recovered within 5.02 years. Under the new network tariff system combined with the net-metering scheme (Figure 9b), the payback period increases to 5.4 years. Figure 10 shows the structure of electricity costs (a) and the payback period of the investment (b) under the new network tariff system for a household with the integrated PV system under the credit-note scheme.
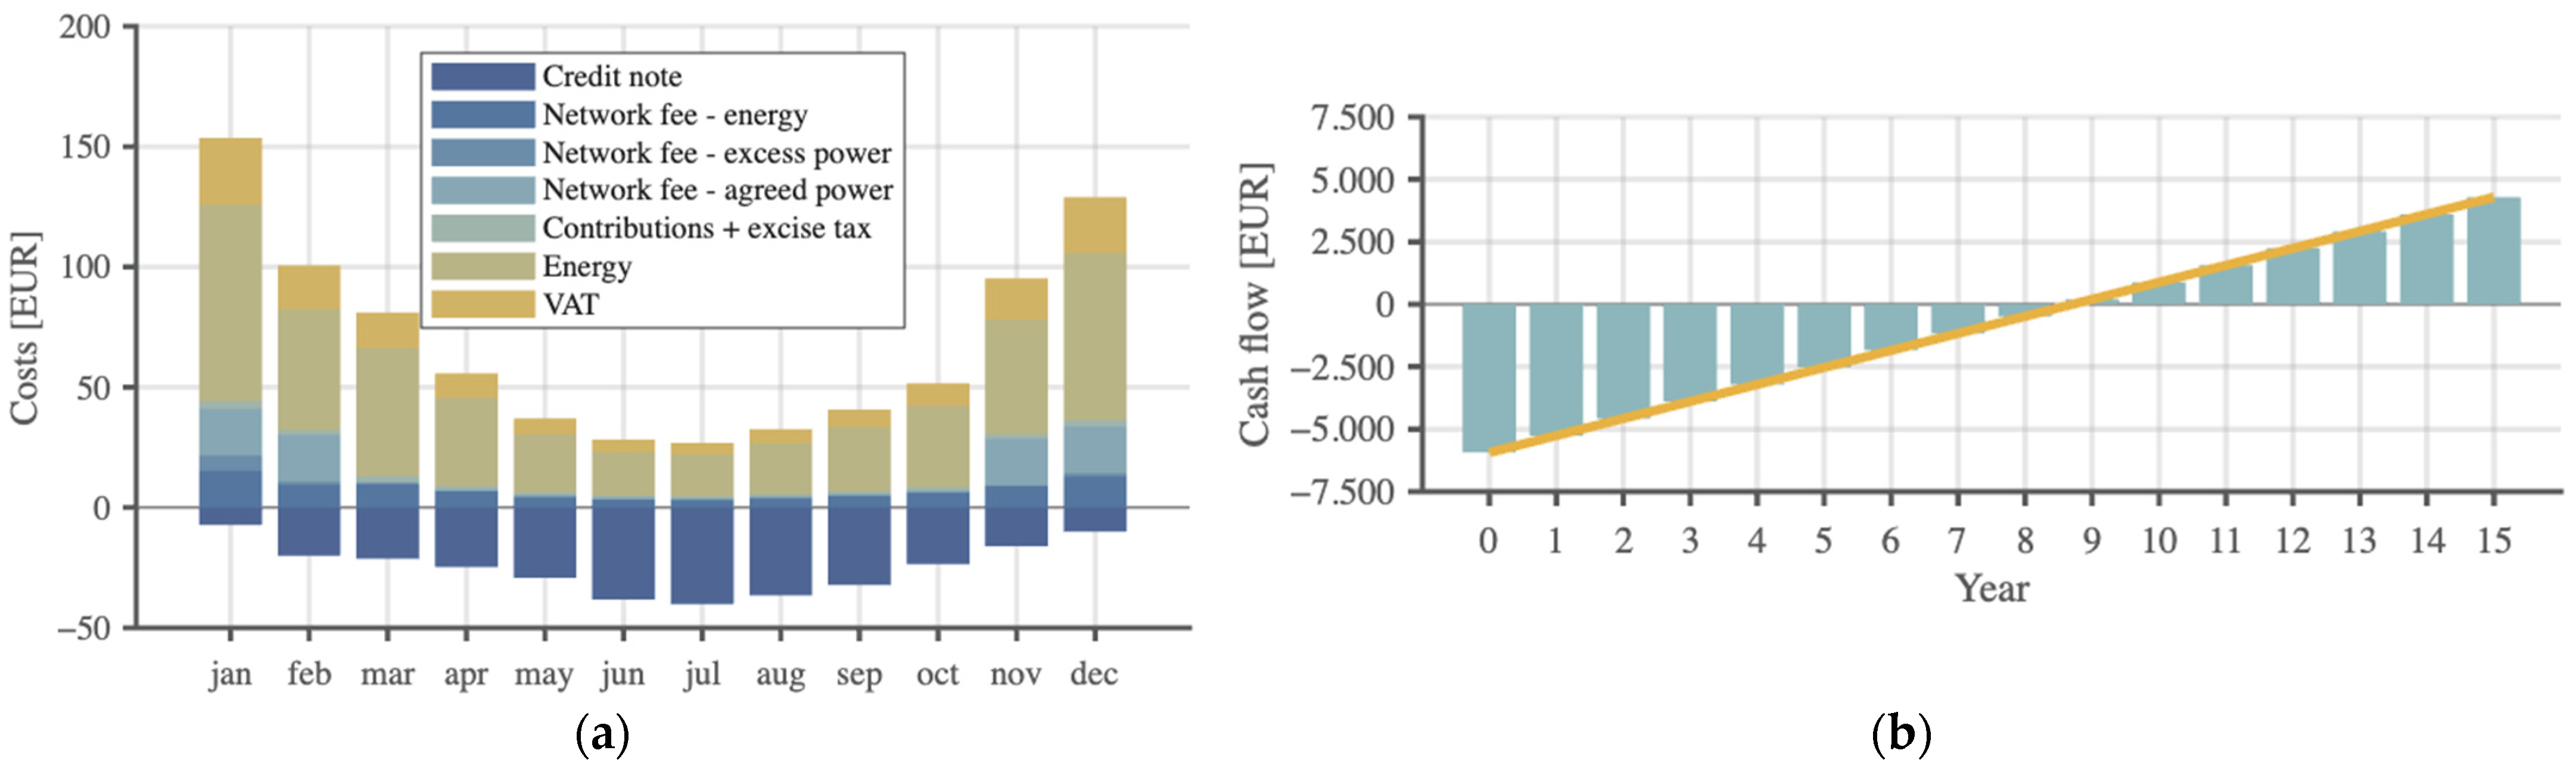
Figure 10.
The structure of electricity costs (a), and the payback period of the investment (b) under the new network tariff system for a household with the integrated PV system under the credit-note scheme.
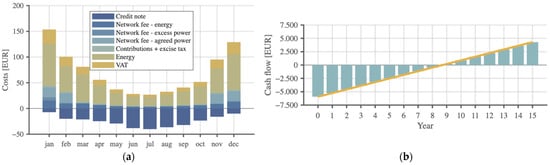
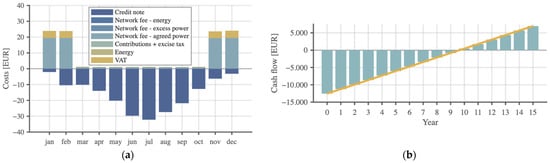
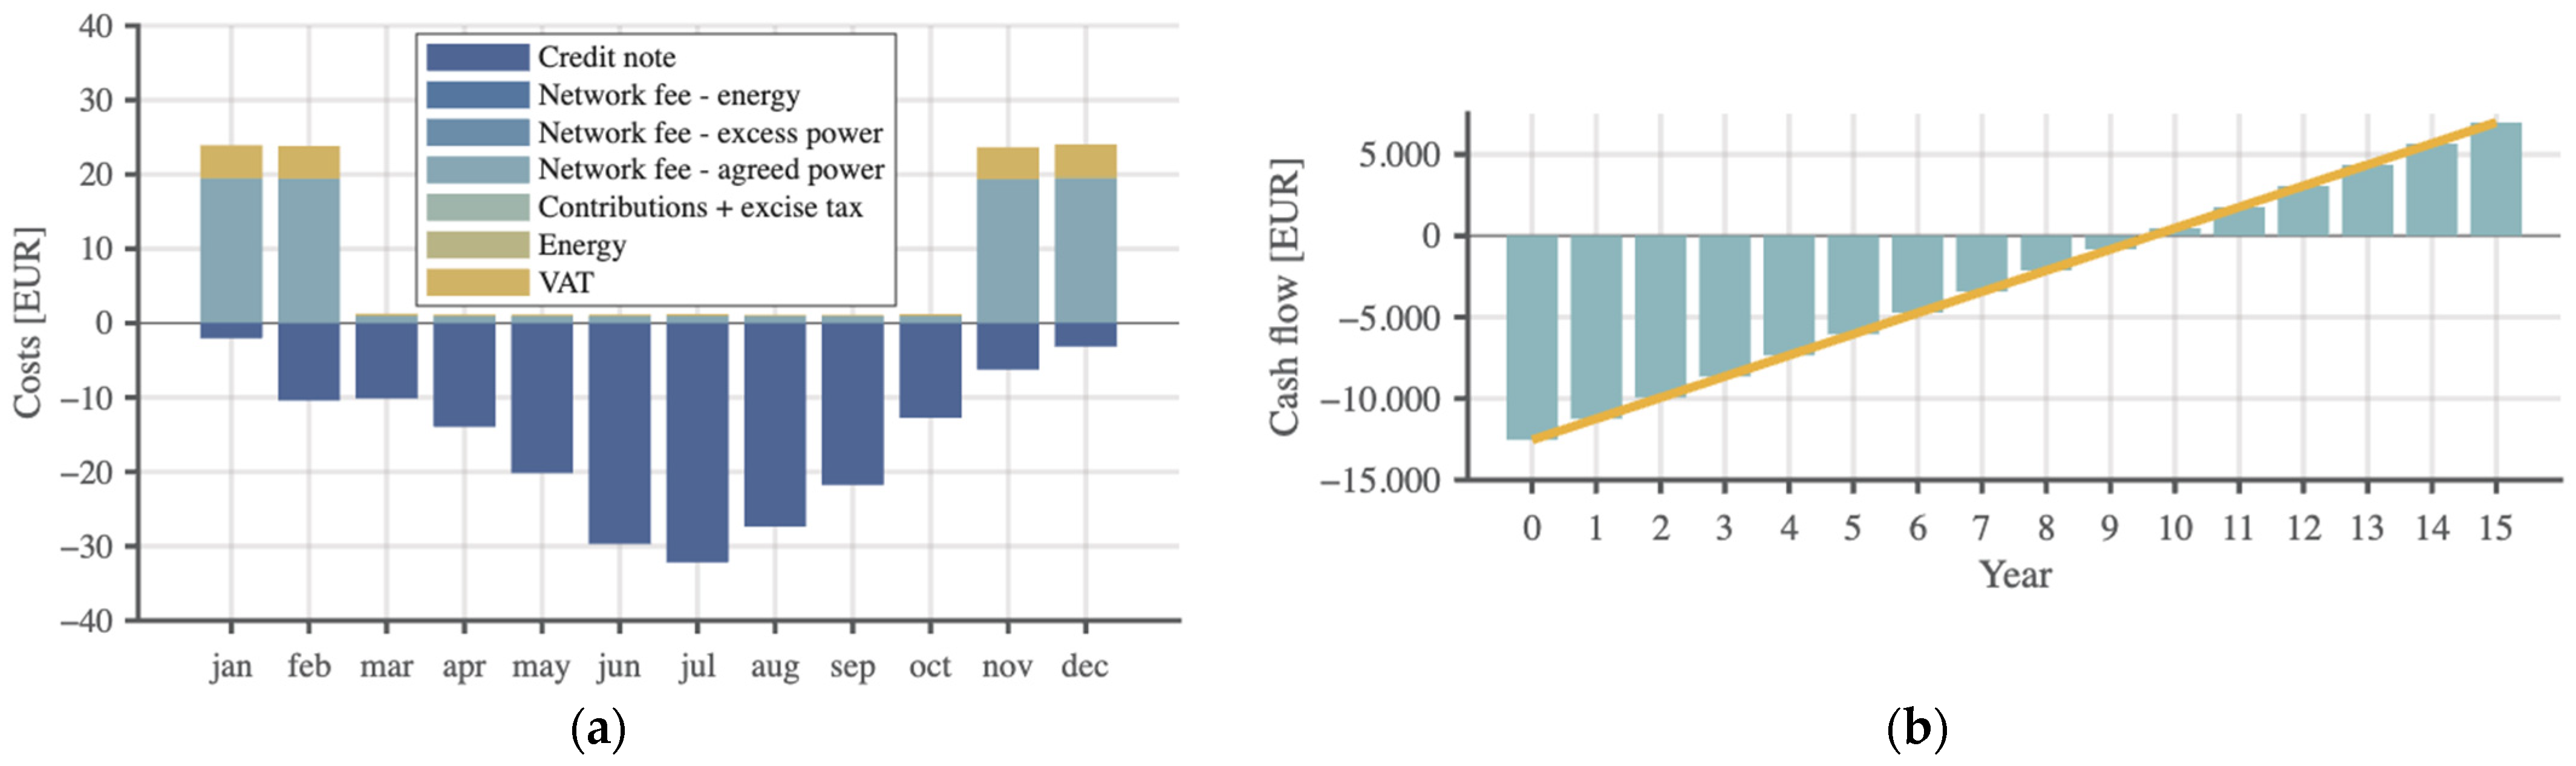
Figure 10a shows that under the new network tariff system, the electricity costs for households with an integrated PV system operating under the credit-note scheme are unevenly distributed across the months, amounting to 533.52 EUR per year. Figure 10b indicates that, assuming an investment cost of 5940 EUR, constant annual savings, and an unchanged electricity consumption and production profile, the investment in the PV system under the new network tariff system and the credit-note scheme is recovered within 8.7 years. This represents a 62% increase in the payback period compared to the net-metering scheme.
3.3. Household Electricity Consumption with a Photovoltaic System and a Battery Storage System
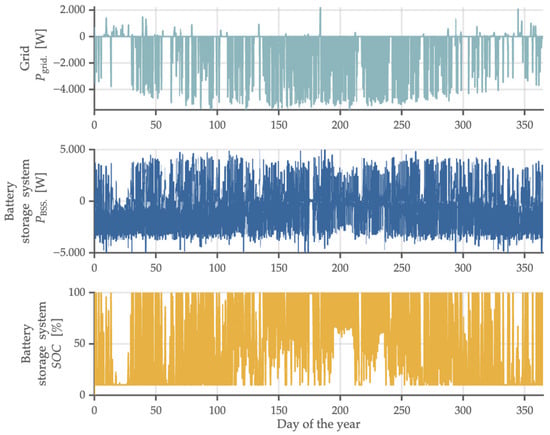
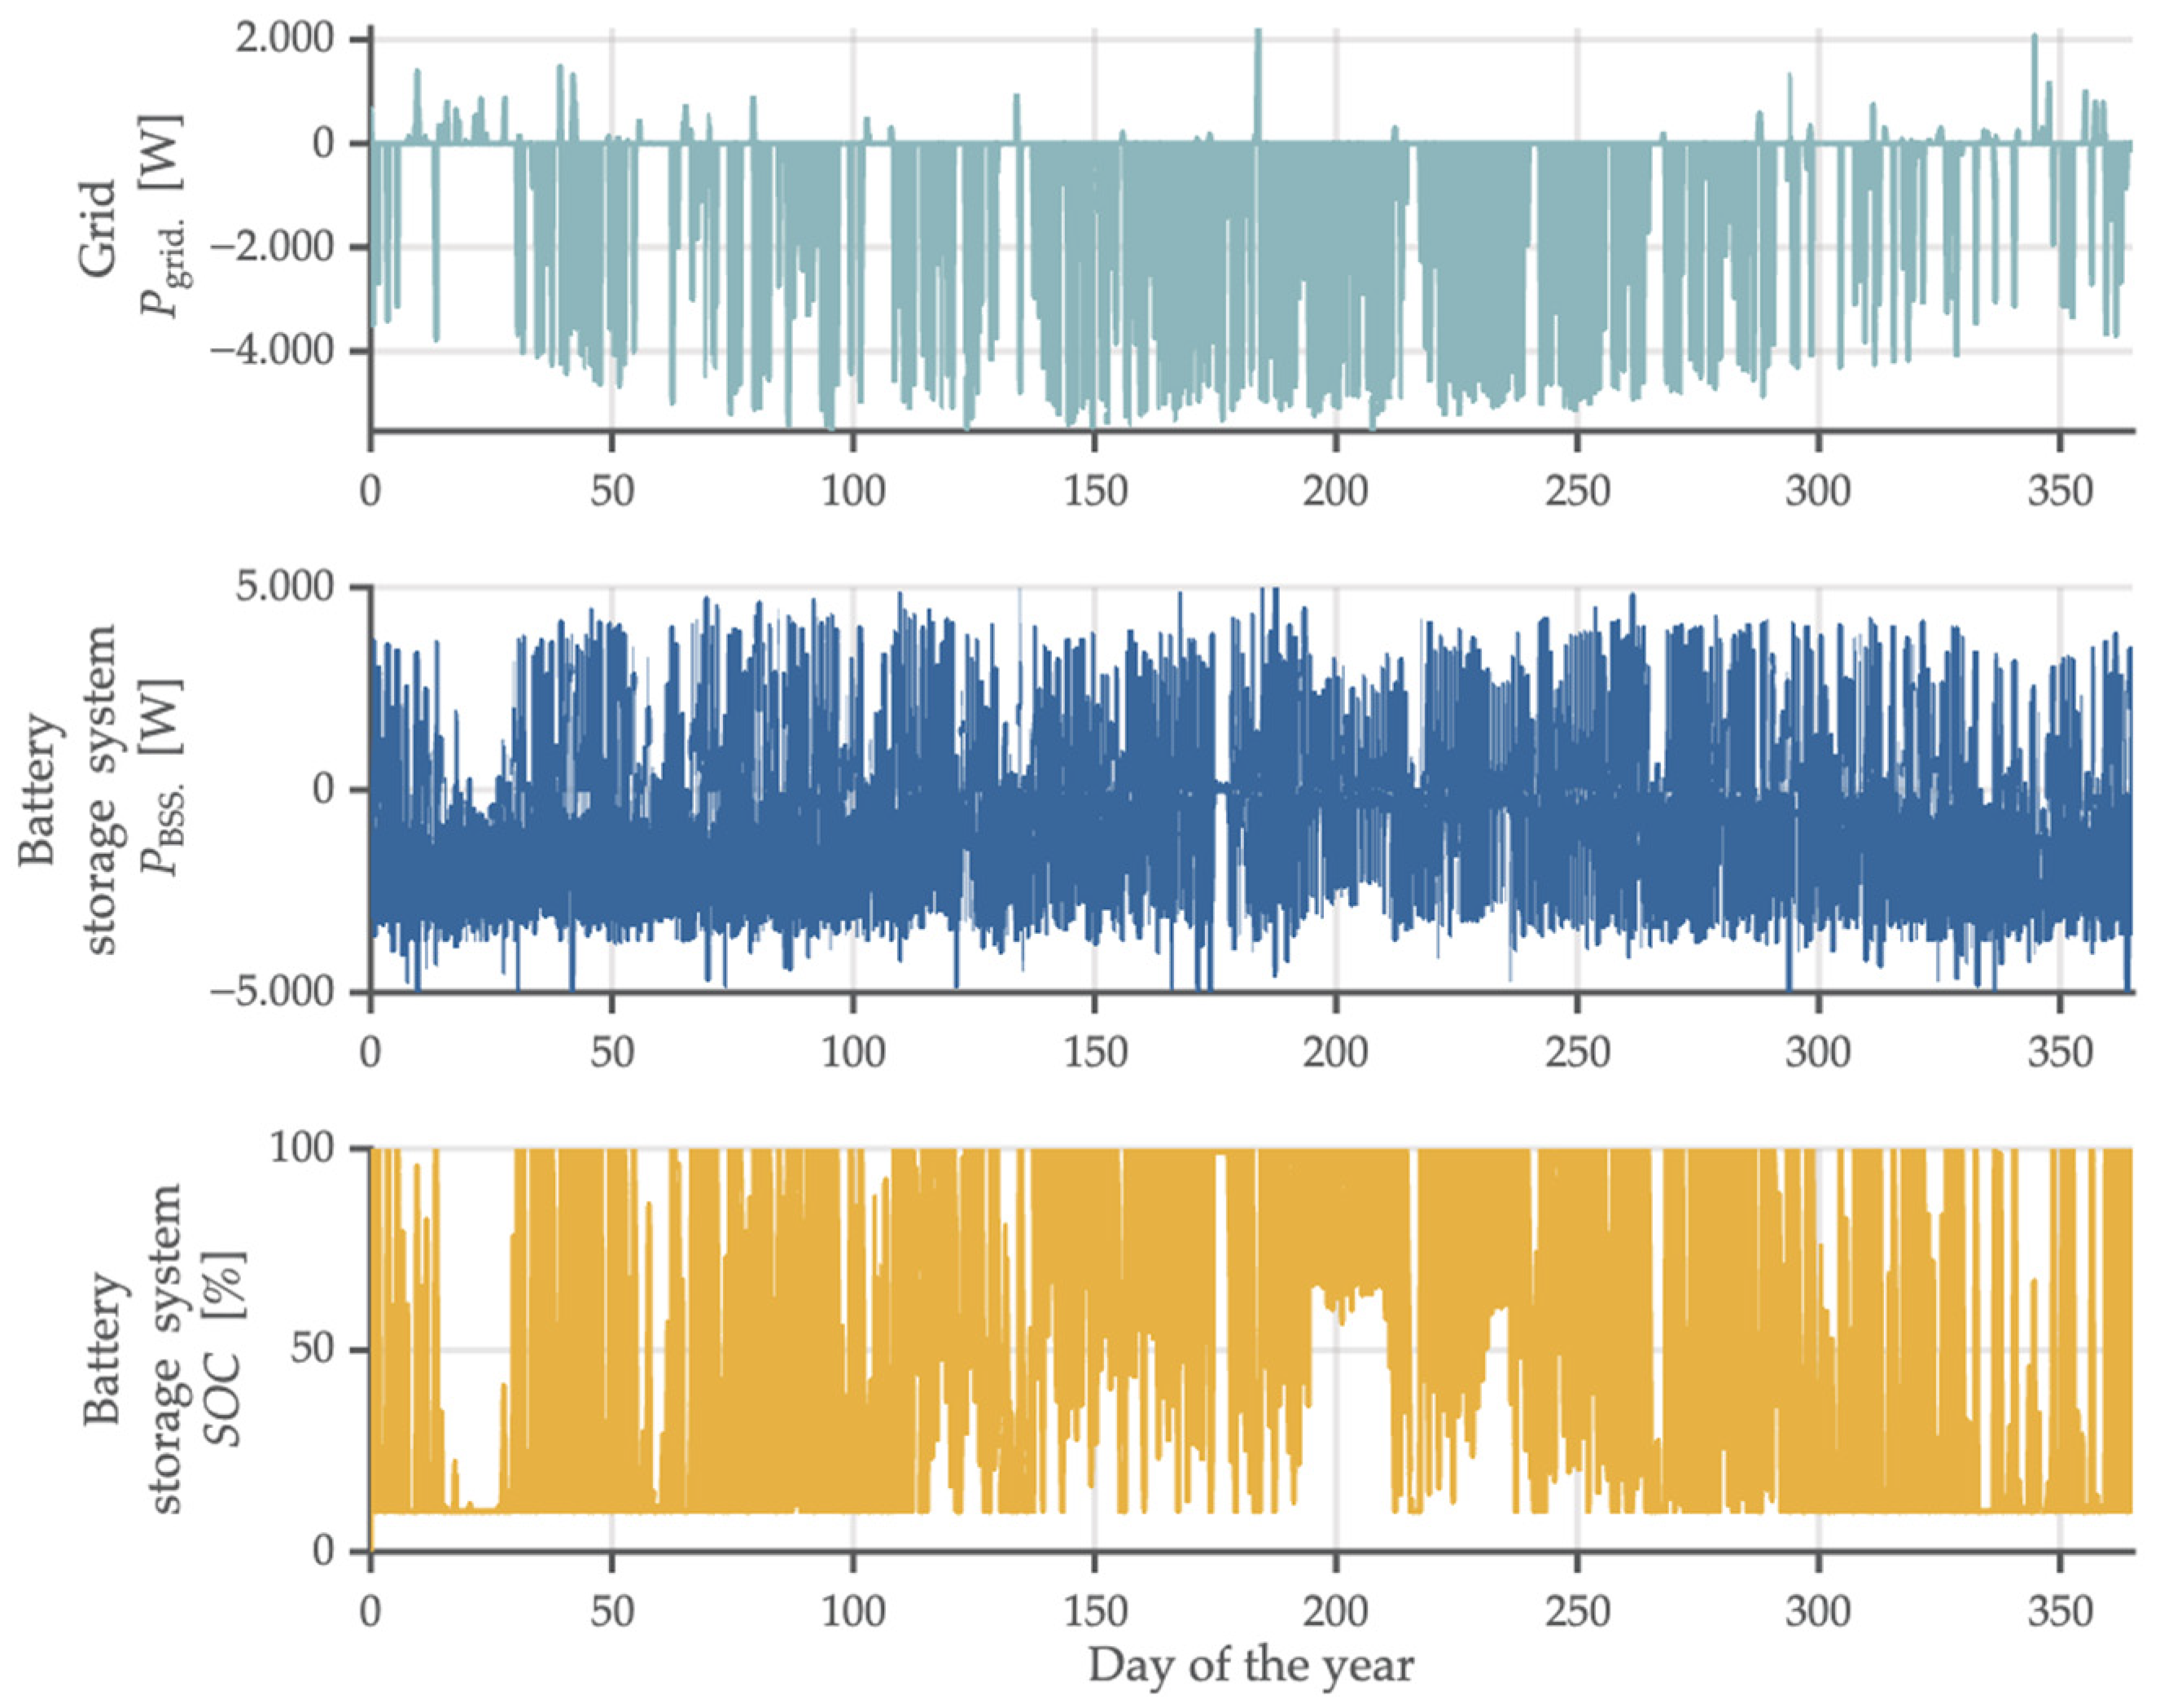
The third scenario represents a household equipped with both a PV system and a BSS. The BSS has a capacity of 9.2 kWh, a maximum charging and discharging power of 5000 W, and an investment cost of 6600 EUR. Figure 11 shows the electricity consumption profile of the household with the integrated PV system and BSS.
Figure 11.
Electricity consumption profile of the household with the integrated PV system and BSS.
Figure 11 shows that, with the use of the BSS, only 10.26 kWh of electricity is imported from the grid, which represents a 99.79% reduction compared to the case where the household is equipped only with a PV system (4798 kWh). Additionally, the amount of electricity exported to the grid decreases from 5979 kWh to 3799 kWh, representing a 36.5% reduction. By integrating a sufficiently sized BSS, nearly all surplus electricity generated by the PV system is stored throughout the year, resulting in minimal electricity imports from the grid.
The temporal evolution of the BSS state of charge indicates that the selected battery capacity is appropriately sized relative to the installed PV system capacity (1.7 kWh/kWp). Despite the lower electricity production from the PV system during the winter months compared to summer, the BSS is still capable of reaching a full state of charge, confirming that the system is neither undersized nor excessively oversized. The suitability of BSS capacity is therefore not evaluated solely based on the SOC trajectory, but also in relation to electricity imports from and exports to the grid. The combination of high self-consumption, limited grid exports, and negligible electricity imports confirms that the selected BSS capacity is well balanced with respect to the PV system size and the household load profile. Figure 12 shows the structure of electricity costs under (a) the previous and (b) the new network tariff system for a household with the integrated PV system and a BSS under the net-metering scheme.
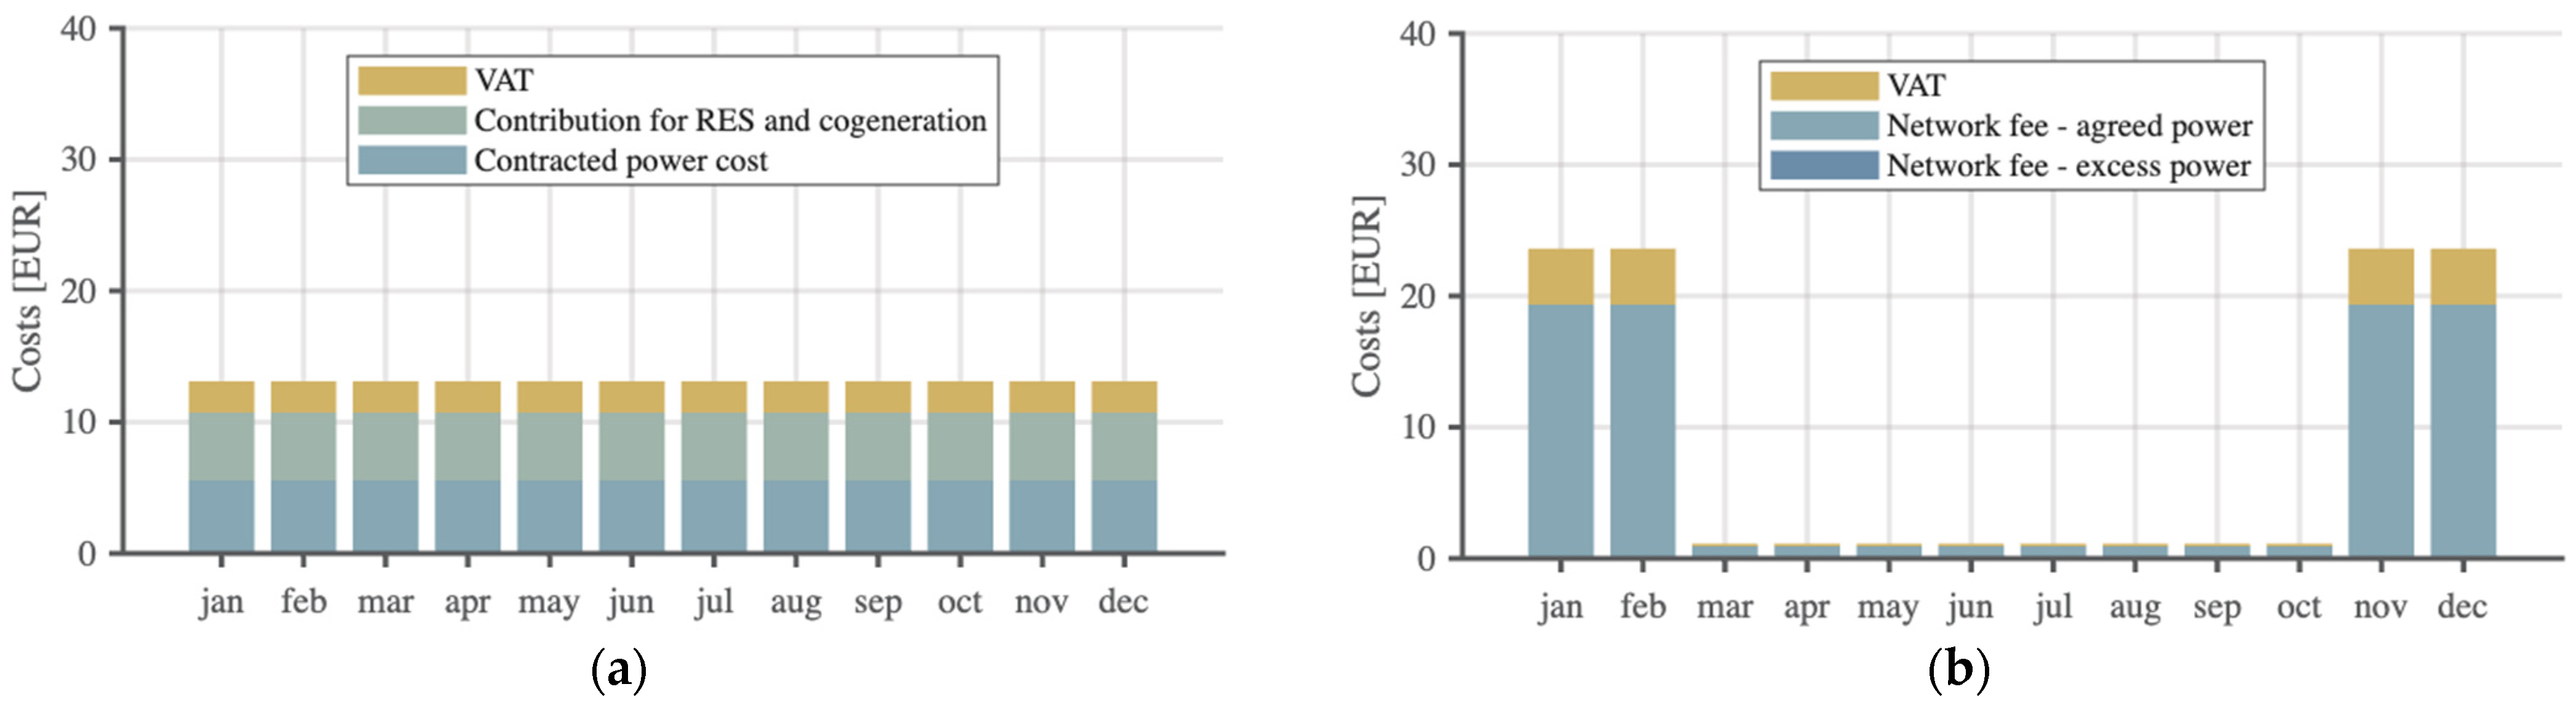
Figure 12.
The structure of electricity costs under (a) the previous and (b) the new network tariff system for a household with the integrated PV system and BSS under the net-metering scheme.
Figure 12a shows that under the previous network tariff system, the electricity costs for households with an integrated PV system and BSS operating under the net-metering scheme remain constant throughout the year, amounting to 157.30 EUR annually. In contrast, Figure 12b indicates that under the new network tariff system, the electricity costs for the households operating under the net-metering scheme are unevenly distributed across the months. This is primarily due to the highest tariff rate for agreed contracted power occurring in time block 1, which is associated with season one (January, February, November, and December). As a result, the annual electricity costs under the new network tariff system decrease to 103.38 EUR, representing a 34.4% decrease compared to the electricity costs calculated under the previous tariff system. The results indicate that the electricity costs for a household equipped with both a PV system and a BSS under the net-metering scheme are identical to those of a household with a PV system only. Owing to the inherent characteristics of net-metering, the electricity grid effectively functions as a virtual battery. As a result, integrating a BSS under the net-metering scheme does not provide an economic benefit. Figure 13 shows the payback period of the investment under (a) the previous and (b) the new network tariff system for a household with the integrated PV system and BSS under the net-metering scheme.
Figure 13.
The payback period of the investment under (a) the previous and (b) the new network tariff system for a household with the integrated PV system and BSS under the net-metering scheme.
Figure 13a shows that, assuming an investment cost of 12,540 EUR, constant annual savings, and an unchanged electricity consumption and production profile, the investment in a PV system and BSS under the previous network tariff system and the net-metering scheme is recovered within 10.60 years. Under the new network tariff system combined with the net-metering scheme (Figure 13b), the payback period increases to 11.27 years. Figure 14 shows the structure of electricity costs (a) and the payback period of the investment (b) under the new network tariff system for a household with the integrated PV system and BSS under the credit-note scheme.
Figure 14.
The structure of electricity costs (a), and the payback period of the investment (b) under the new network tariff system for a household with the integrated PV system and BSS under the credit-note scheme.
Figure 14a shows that under the new network tariff system, the electricity costs for households with an integrated PV system and a BSS operating under the credit-note scheme are unevenly distributed across the months, amounting to −85.06 EUR per annum. Figure 14b indicates that, assuming an investment cost of 12,540 EUR, constant annual savings, and an unchanged electricity consumption and production profile, the investment in the PV system and BSS under the new network tariff system and the credit-note scheme is recovered within 9.64 years. This represents a 14.5% reduction in the payback period compared to the case where the household is equipped only with a PV system operating under the credit-note scheme.
By selecting a sufficiently sized BSS, electricity costs, energy-related network charges, and all energy-based contributions are effectively eliminated. Furthermore, since the installed generation capacity exceeds the contracted connection capacity, the household is also exempt from contributions related to RES and CHP.
4. Discussion
This paper evaluated the economic impacts of Slovenia’s transition from a predominantly energy-based network tariff system to a more power-based system with five-time blocks, seasonal differentiation, and explicit charges for agreed and excess contracted power. The results confirm that the economic output of tariff reforms is determined by the household consumption profile and the applied support schemes for PV and BSS integration. Overall, the results indicate that power-oriented tariff systems increase cost reflectiveness and encourage flexibility, although they also lead to a redistribution of costs across time periods and RES technologies.
For the first scenario, the new network tariff system reduced annual electricity costs from 1340.3 EUR to 1215.6 EUR, corresponding to a 9.3% decrease. Although monthly costs increased during the high season due to the higher tariff rate for agreed contracted power in time block 1, the low-season months became cheaper because the agreed contracted power tariff rates are significantly lower. This shift confirms the fundamental structural change in the new network tariff system, namely that power-based components contribute a larger share to the final electricity bill than energy-based components. This observation is consistent with the broader European trend identified in the literature, where power-based or hybrid tariffs are introduced to better reflect network usage under increasing load variability and decentralized electricity production. In comparative analyses of energy- and power-based network tariff systems, peak-demand-related pricing is associated with better alignment between consumer behavior and network constraints and with lower network reinforcement requirements, assuming clearly defined time blocks.
The second scenario demonstrates how significantly the support scheme influences economic output. Under net-metering, the annual electricity costs were low under both network tariff systems, and the transition to the new tariff system resulted in a reduction in annual costs from 157.30 EUR to 115.30 EUR. The monthly cost distribution becomes uneven in the new network tariff system because the agreed contracted power charge in time block 1 dominates during the high-load season. Nevertheless, the overall annual reduction suggests that the combined effect of reduced energy-related charges and the tariff structure for power components remains favorable. This observation is consistent with previous studies reporting that net-metering significantly reduces energy-based billing and weakens network cost recovery. Several studies associate this effect with cross-subsidization from non-prosumers to prosumers. The Slovenian tariff reform partly mitigates this issue by increasing the role of power-based components, which remain applicable even when net electricity consumption is low.
When the credit-note scheme is applied, the economic output changes substantially. For the second scenario, annual electricity costs under the new network tariff system increase to 533.52 EUR, and the payback period rises to 8.7 years, which is 62% longer than under net-metering. This result is consistent with the conceptual difference between annual netting and support schemes based on short intervals and monetary compensation of exports. In such schemes, the economic value of electricity production from PV systems depends primarily on self-consumption, while exported electricity receives only a limited financial return. Similar outcomes are reported in the literature, where the removal of annual netting and the introduction of more granular settlement increase the incentive to shift consumption towards PV production hours or to use BSS.
The BSS becomes relevant primarily under the credit-note scheme and within a network tariff system where electricity imports drive network charges. From a technical perspective, integrating a BSS reduces annual electricity imports from 4798 kWh to 10.26 kWh and decreases electricity exports from 5979 kWh to 3799 kWh, indicating a substantial increase in on-site utilization of electricity produced by the PV system. The reduction in exported electricity is consistent with the role of BSS as a flexibility resource, whereby surplus electricity production from the PV system is stored and subsequently used to meet household demand, thereby reducing bidirectional power exchanges with the grid. From an economic perspective, the household equipped with a PV system and a BSS operating under the credit-note scheme achieves a net annual electricity revenue of 85.06 EUR. At the same time, the investment payback period is reduced to 9.64 years compared to the corresponding configuration without storage under the same settlement scheme. In contrast, under the net-metering scheme, the integration of a BSS does not result in additional economic benefits. Electricity costs for households with a PV system remain effectively unchanged when a BSS is added, as the annual settlement mechanism enables the grid to function as a virtual storage medium for electricity produced by the PV system.
To improve the extrapolation of the results, the same type of analysis was performed for multiple consumers, with all tariff parameters kept constant and only the contracted power levels varying between consumers. In addition to the representative household presented in the main analysis, two further consumers were included to illustrate the variability of outcomes across different consumption and power configurations. Results are shown in Table 1.
Table 1.
Comparison of annual electricity costs under the previous and new network tariff systems for additional household and agricultural consumers across different scenarios (baseline, PV, and PV + BSS) and support schemes (net-metering, credit note).
Several limitations should be acknowledged. The analysis is based on fixed assumptions for investment costs, electricity prices, and network tariff components, while the results depend on the chosen agreed contracted power levels and the specific PV system and BSS size.
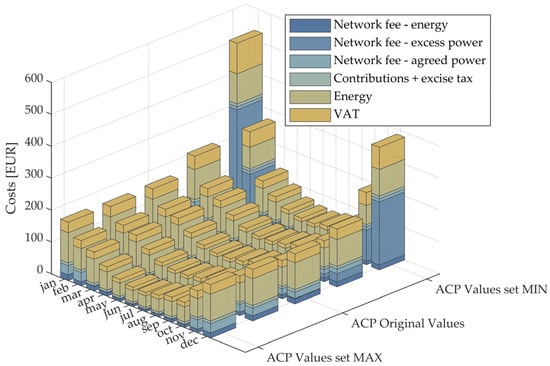
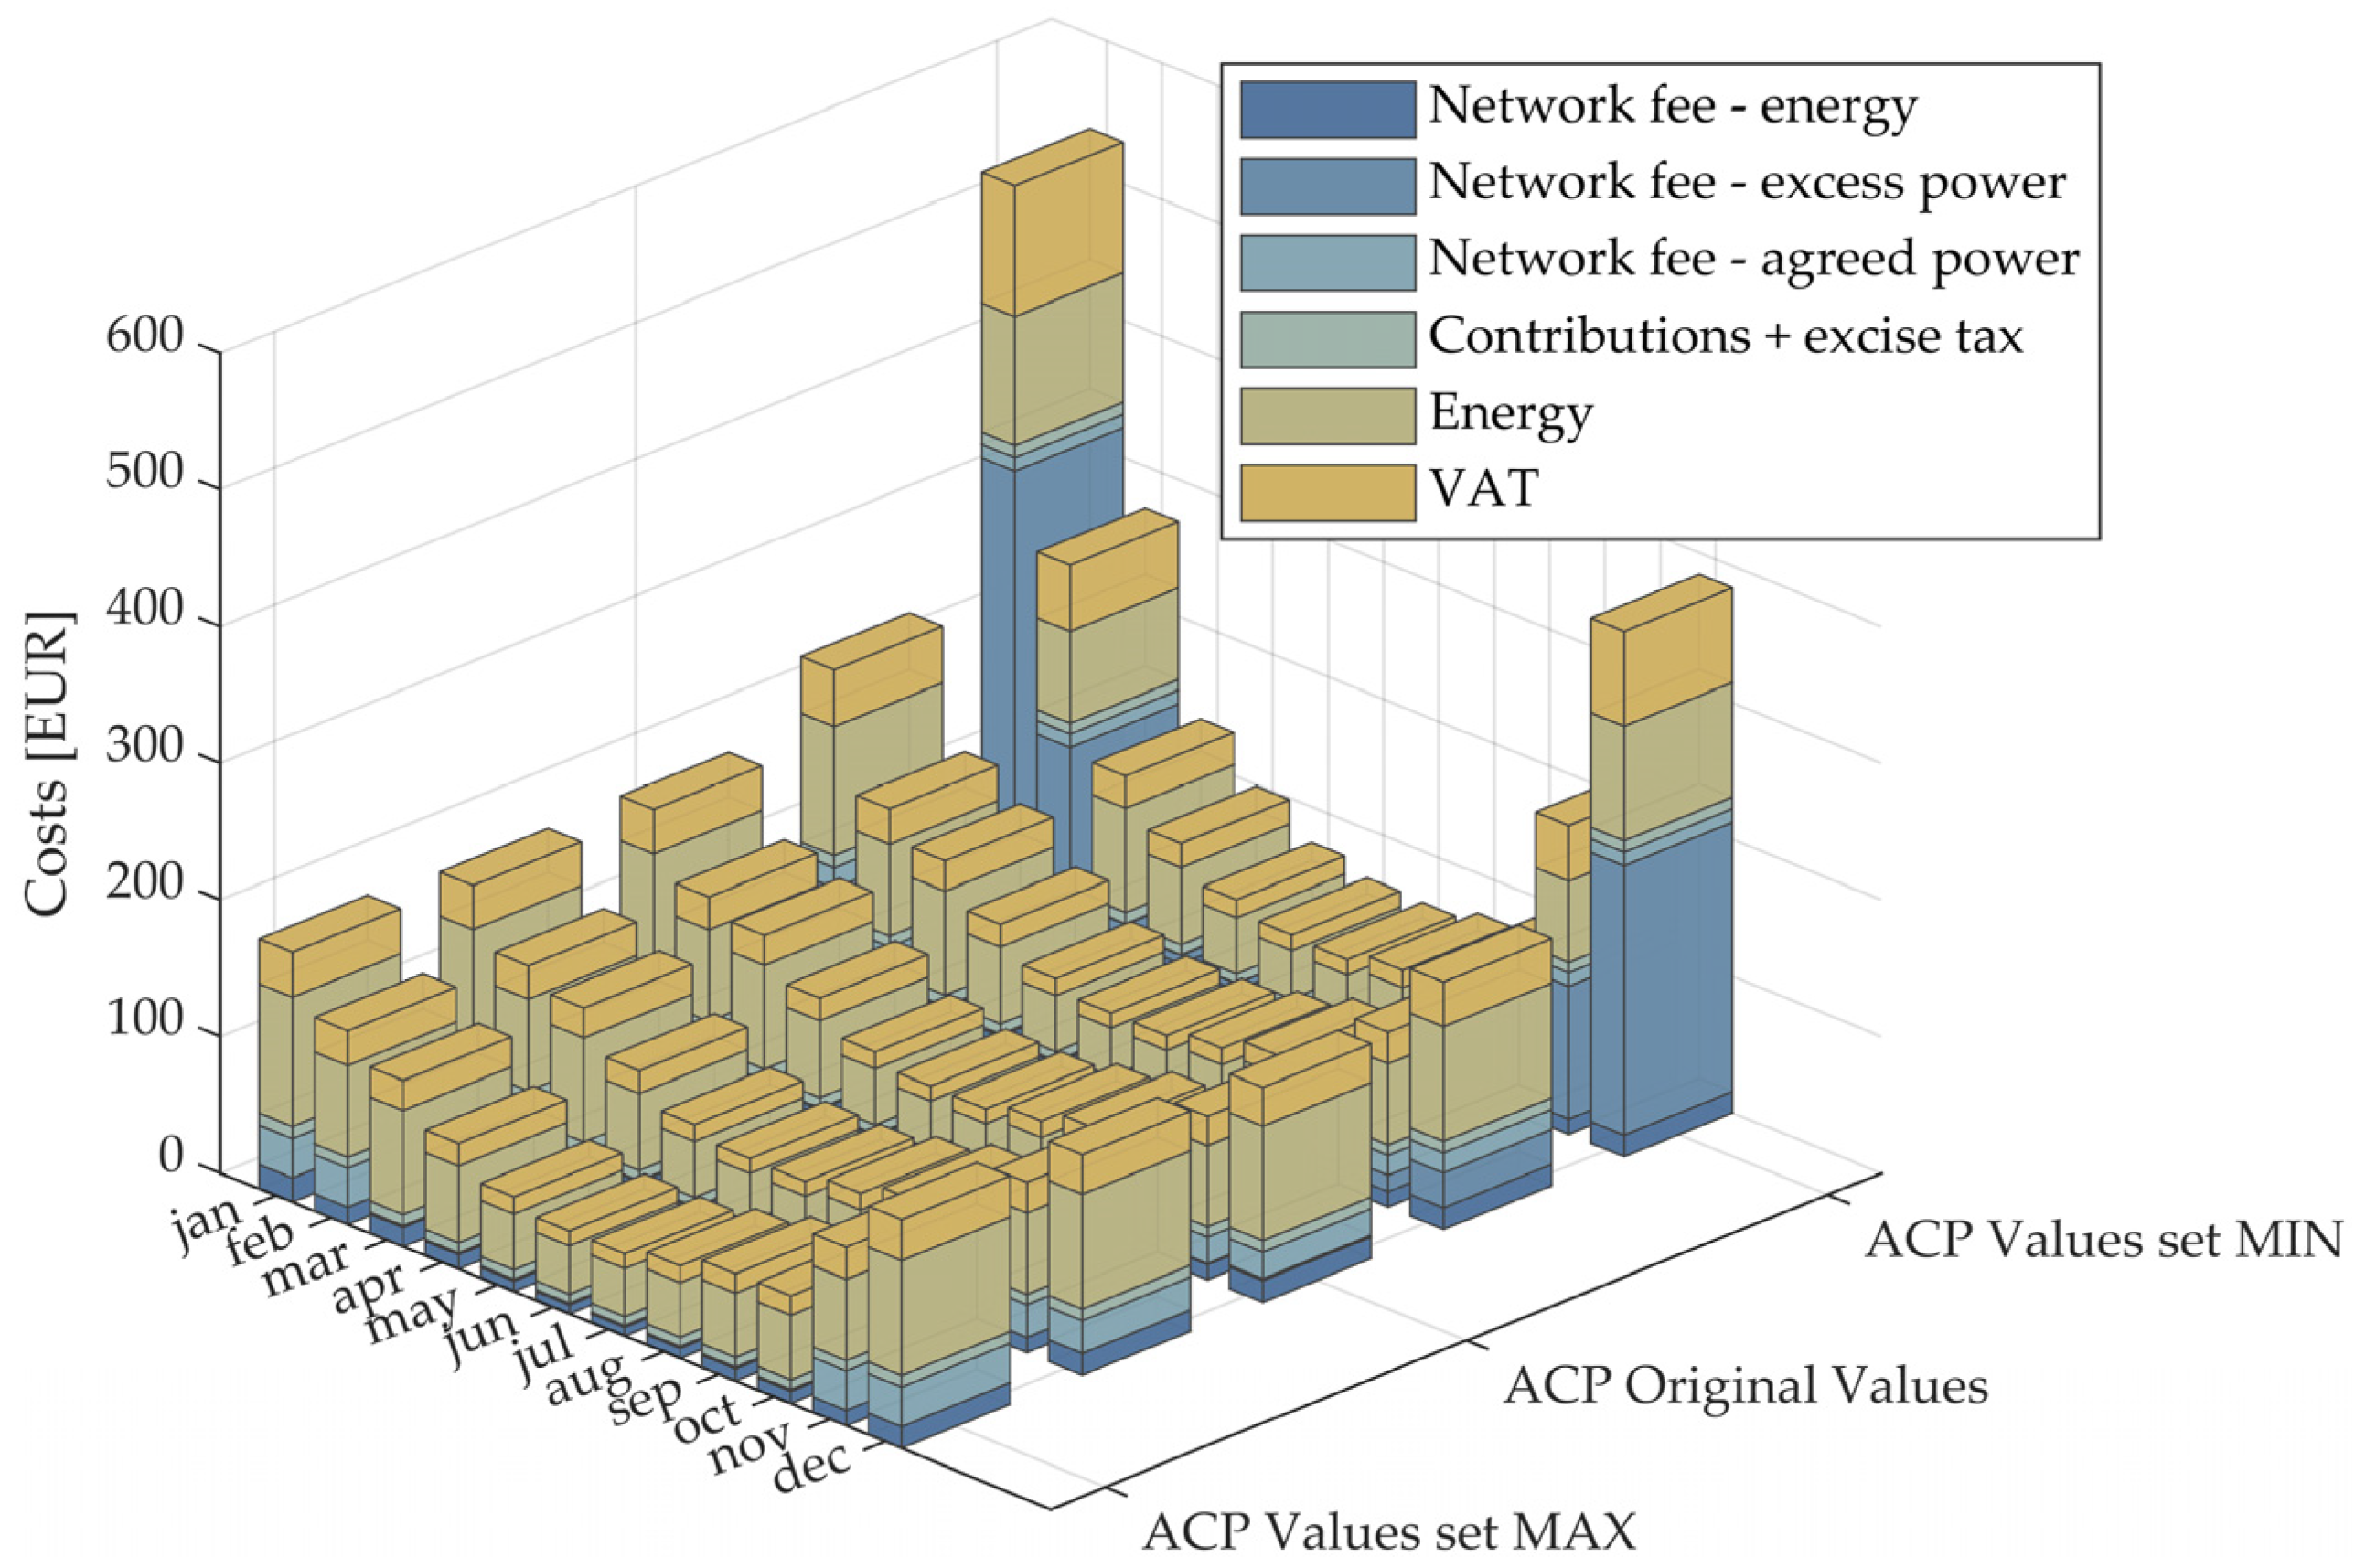
To partially illustrate the impact of suboptimal agreed contracted power selection, a sensitivity analysis was performed for three representative cases, all based on the first scenario (baseline household consumption). The results show that selecting an excessively high agreed contracted power leads to an increase in total costs (1249.70 EUR compared to 1215.56 EUR for the original contracted power level), primarily due to higher fixed contracted power charges. However, this increase remains relatively modest compared to the case of insufficient agreed contracted power, which results in substantially higher total costs (2077.95 EUR), mainly driven by the increased contribution of the excess contracted power cost component. The corresponding cost structure as a function of the selected agreed contracted power levels is shown in Figure 15.
Figure 15.
Structure of electricity costs under the new network tariff system for a household with baseline electricity consumption at different agreed contracted power levels.
The assessment also assumes stable annual profiles and does not account for behavioral changes, demand response, or smart energy management strategies that could further reduce agreed contracted power costs by actively limiting peaks during time block 1. Additionally, network tariff components may evolve over time, including changes in the excess contracted power weighting factor (), which can impact long-term outcomes. Although a constant value of this factor was assumed in calculating investment payback periods, its impact on total costs was nevertheless evaluated through an additional sensitivity analysis.
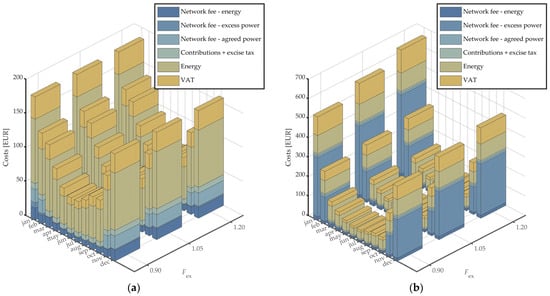
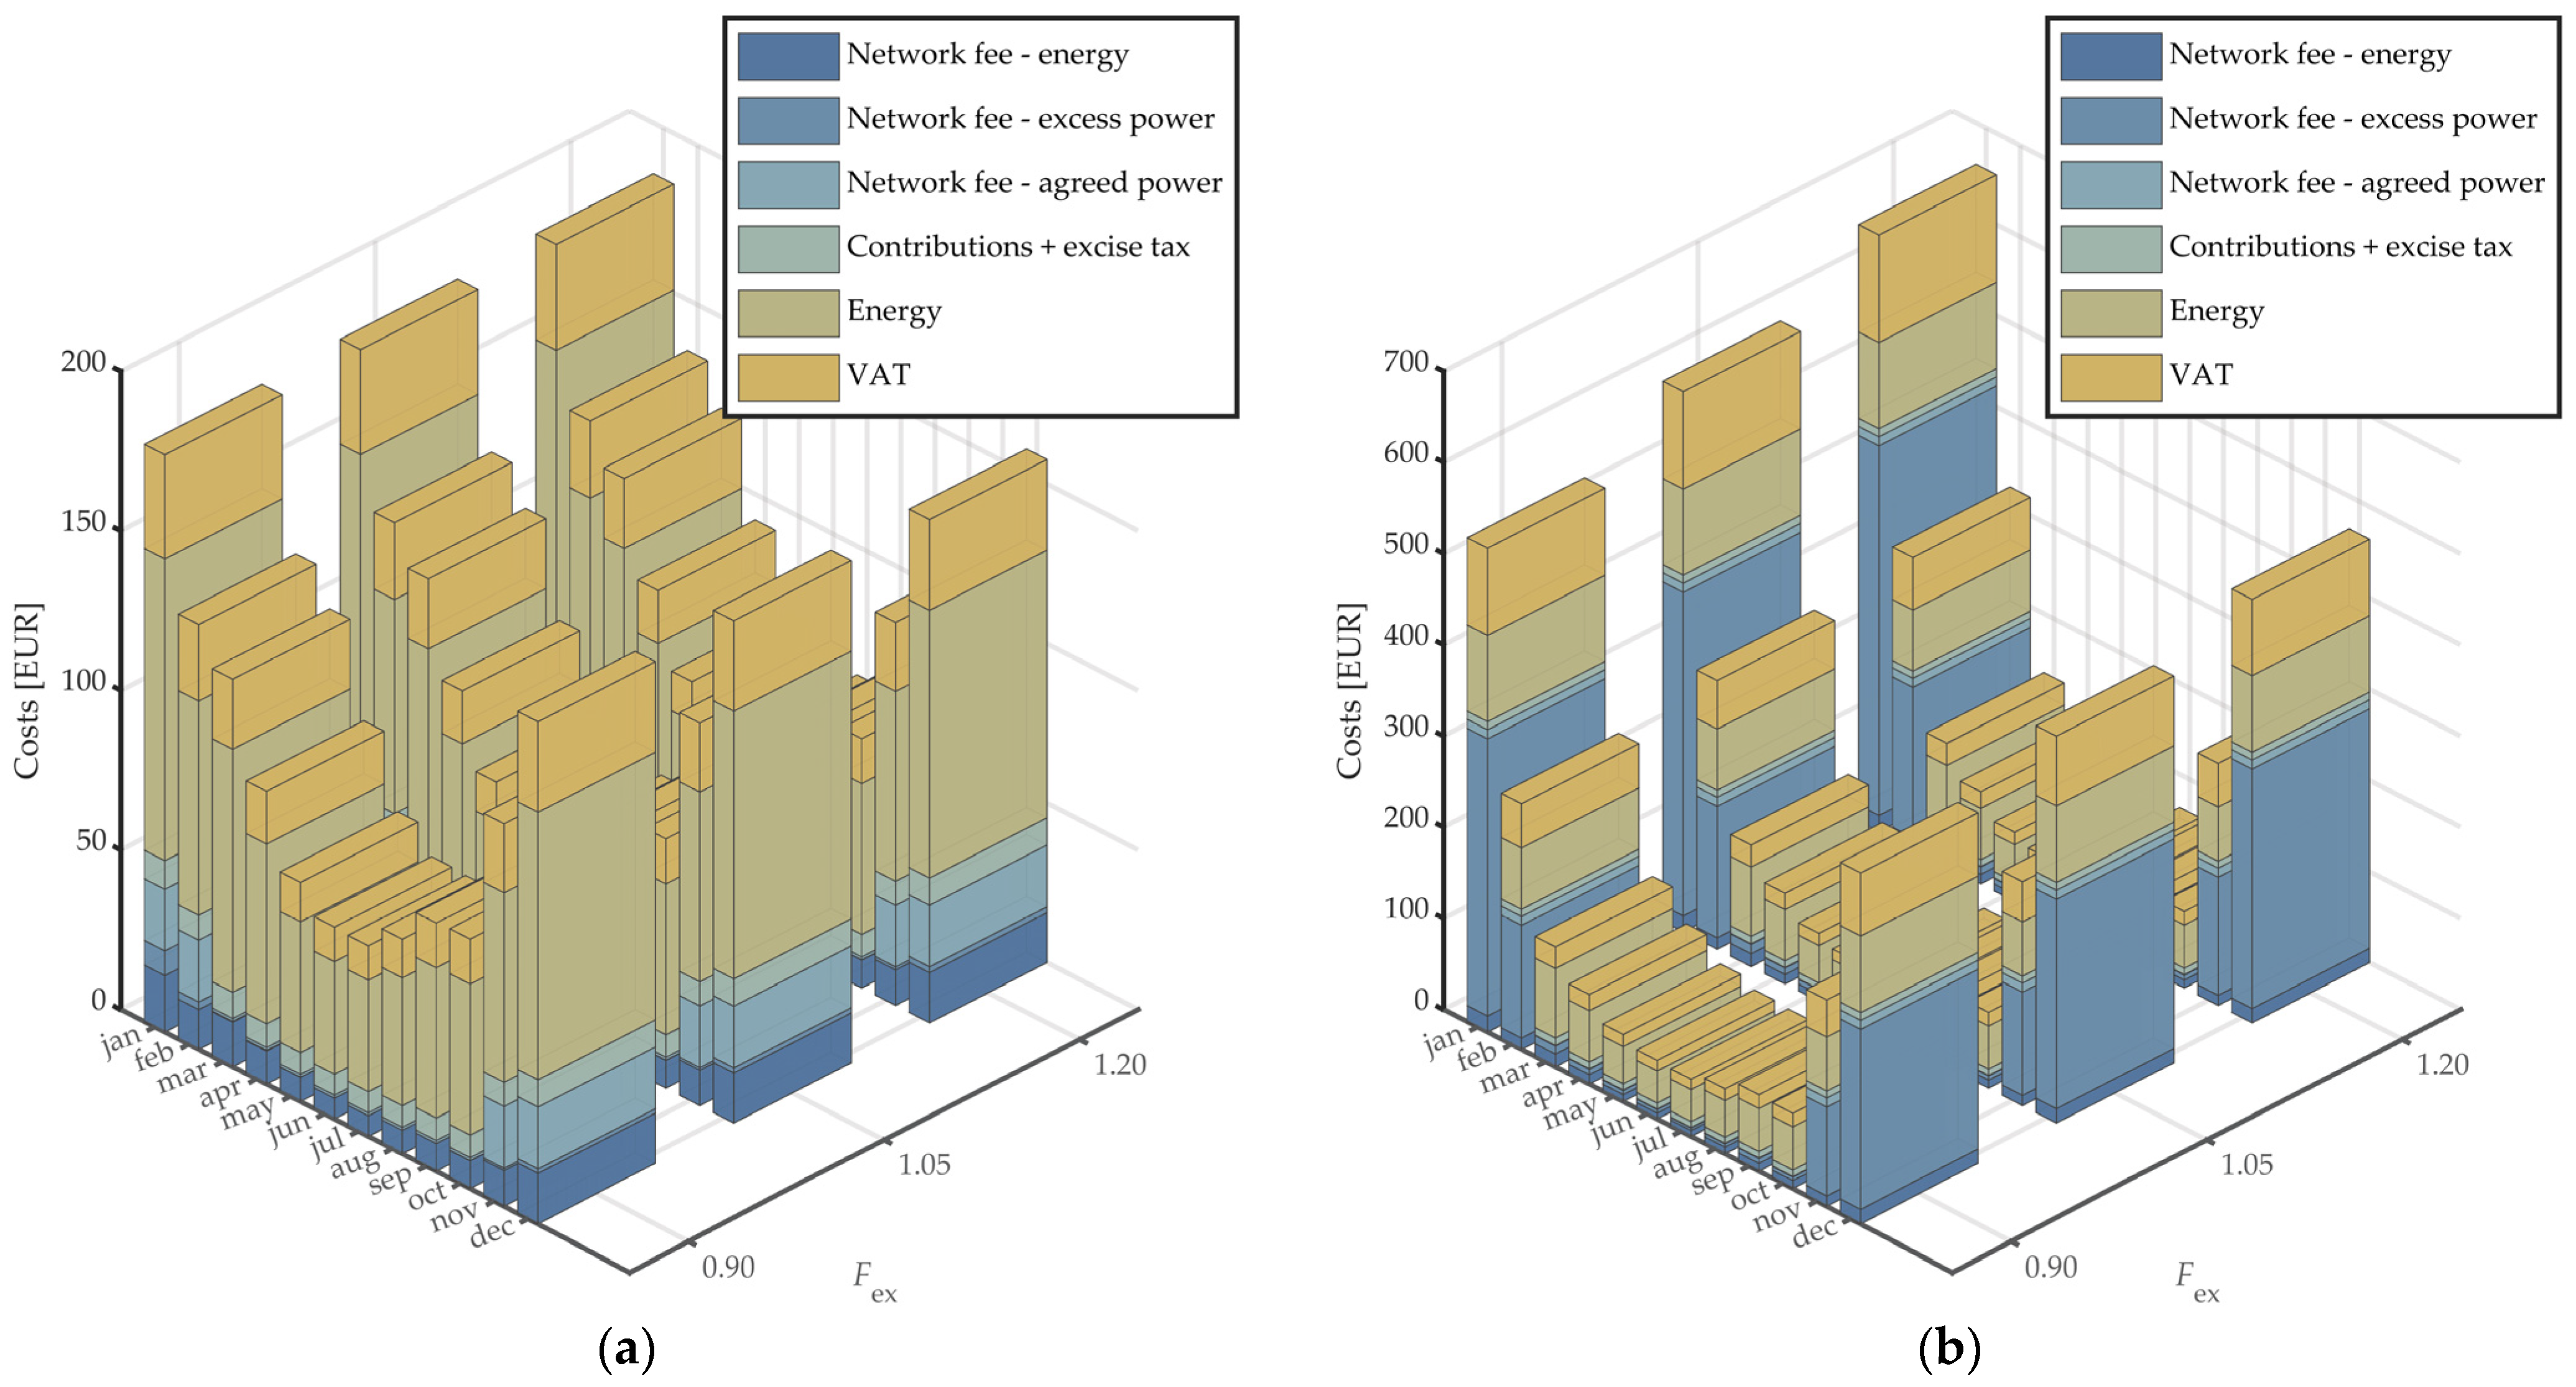
The effect of future changes in the excess contracted power weighting factor was examined following the planned regulatory progression from 0.9 to 1.05 and subsequently to 1.2. Two representative cases were analyzed, both based on the baseline household consumption scenario. In the case with ACP Optimal values, total annual costs increased only marginally from 1215.56 EUR at to 1218.20 EUR at and 1220.80 EUR at as the excess power component remained relatively small. In contrast, in the case with ACP Values set MIN, the impact of increasing was substantial, with total costs rising from 2077.95 EUR at to 2232.60 EUR at and further to 2387.30 EUR at , reflecting the dominant contribution of excess contracted power charges. The corresponding cost structures as a function of the factor are illustrated in Figure 16a for ACP Optimal values and in Figure 16b for ACP Values set MIN.
Figure 16.
Structure of electricity costs under the new network tariff system for a household with baseline electricity consumption at different factors for (a) ACP Optimal values and (b) ACP values set MIN.
These results highlight the strong interaction between contracted power selection and excess power penalties, underscoring the importance of appropriately sizing contracted power. Future research should therefore extend the assessment to a larger set of households with diverse load profiles and electrification levels, including EV charging and different heat pump operating regimes.
5. Conclusions
This paper presents a comprehensive assessment methodology for evaluating the techno-economic impacts of transforming the network tariff system in Slovenia for household electricity consumers and prosumers. The methodology integrates regulatory provisions, high-resolution electricity consumption and production data, and the operational behavior of PV systems and BSS under different support schemes. The main contributions and findings of this paper can be summarized as follows:
- A transparent and replicable methodology was developed to assess electricity costs under the previous and the newly adopted Slovenian network tariff system, explicitly accounting for power-based network tariff components, time-block-dependent charges, and support schemes.
- The results confirm that the transition from an energy-based to a more power-based network tariff system fundamentally changes the structure of electricity costs, increasing the relative importance of contracted and excess power components compared to energy-based charges.
- For households without electricity production, the new tariff system results in a redistribution of costs across seasons and time blocks, with higher charges during high-load periods and lower costs during low-load periods, thereby more accurately reflecting actual network usage.
- For households equipped with PV systems, the economic output depends strongly on the applied support scheme. Under net-metering, electricity costs remain low, and the integration of BSS does not provide additional economic benefits, as the grid effectively functions as a virtual storage system.
- Under the credit-note support scheme, BSS contributes to improved economic output by reducing electricity imports, limiting electricity exports, and lowering energy-related network charges, which results in shorter investment payback periods compared to households equipped only with PV systems under the same support scheme.
Overall, the results indicate that the newly adopted Slovenian network tariff system is not inherently disadvantageous for household consumers and prosumers. When supported by suitable tariff design and support schemes, the new network tariff system can encourage more efficient grid utilization, reduce peak loads, and promote investments in flexibility technologies. The proposed assessment methodology provides a robust analytical tool and can be readily extended to include additional technologies, such as EVs, advanced demand-side management strategies, and community-based energy systems.
Author Contributions
Conceptualization, K.S., S.S. and J.P.; methodology, K.S.; software, J.P.; validation, K.S. and J.P.; formal analysis, J.P. and D.K.; investigation, J.P.; resources, K.S.; data curation, K.S.; writing—original draft preparation, K.S.; writing—review and editing, S.S., E.S. and D.K.; visualization, K.S.; supervision, K.S. and S.S.; project administration, K.S. and S.S.; funding acquisition, K.S. and S.S. All authors have read and agreed to the published version of the manuscript.
Funding
This research received no external funding.
Data Availability Statement
The data presented in this study are available upon request from the corresponding author. The data are not publicly available due to institutional and project-specific restrictions.
Acknowledgments
The authors acknowledge the use of research equipment and the DC power supply system for simulations of diffuse sources, with equipment set for managing energy systems together with a hybrid solar system, procured within the operation “Upgrading national research infrastructures—RIUM”, which was co-financed by the Republic of Slovenia and the European Union from the European Regional Development Fund.
Conflicts of Interest
The authors declare no conflicts of interest.
Abbreviations
The following abbreviations and symbols are used in this manuscript:
| Abbreviations | |
| ACER | European Union Agency for the Cooperation of Energy Regulators |
| ACP | Agreed contracted power |
| ARSO | Slovenian Environment Agency |
| BSS | Battery storage system |
| CHP | Combined heat and power |
| ELES | Slovenian Transmission System Operator |
| ENTSO-E | European Network of Transmission System Operators for Electricity |
| EV | Electric vehicle |
| PV | Photovoltaic |
| RES | Renewable energy sources |
| SOC | State of charge |
| VAT | Value-added tax |
| Symbols | |
| Agreed contracted power in time block b [kW] | |
| Energy withdrawn from the system in time block b [kWh] | |
| Excess power in time block b [kW] | |
| Achieved 15 min measured power k in time block b [kW] | |
| Distribution network charge for contracted power in time block b [EUR] | |
| Weighting factor for excess power | |
| Number of 15 min intervals in which the achieved power exceeds the agreed contracted power within time block b during the billing month [/] | |
| Distribution network charge in time block b based on the agreed contracted power [EUR] | |
| Distribution network charge in time block b based on excess power [EUR] | |
| Distribution network charge for energy in time block b [EUR] | |
| Distribution network charge for contracted power [EUR] | |
| Distribution network charge for energy [EUR] | |
| Network tariff component for contracted power for user group i in time block b 255 [EUR/kW] | |
| Network tariff component for energy for user group i in time block b [EUR/kWh] | |
Appendix A. Network Tariff Components
Table A1.
Network tariff components considered in the calculation of electricity costs for a household with and without a PV system and a BSS.
References
- ACER. Energy Retail—Active Consumer Participation Is Key to Driving the Energy Transition: How Can It Happen? 2024 Market Monitoring Report; ACER: Taipei, Taiwan, 2024. [Google Scholar]
- Alahmed, A.S.; Tong, L. Integrating Distributed Energy Resources: Optimal Prosumer Decisions and Impacts of Net Metering Tariffs. arXiv 2022, arXiv:2204.06115. [Google Scholar] [CrossRef] [Scilit]
- Ansarin, M.; Ghiassi-Farrokhfal, Y.; Ketter, W.; Collins, J. The economic consequences of electricity tariff design in a renewable energy era. Appl. Energy 2020, 275, 15317. [Google Scholar] [CrossRef] [Scilit]
- Cambini, C.; Soroush, G. Designing grid tariffs in the presence of distributed generation. Util. Policy 2019, 61, 979. [Google Scholar] [CrossRef] [Scilit]
- Hoarau, Q.; Perez, Y. Network tariff design with prosumers and electromobility: Who wins, who loses? Energy Econ. 2019, 83, 26–39. [Google Scholar] [CrossRef] [Scilit]
- Eid, C.; Guillén, J.; Marín, P.; Hakvoort, R. The economic effect of electricity net-metering with solar PV: Consequences for network cost recovery, cross subsidies and policy objectives. Energy Policy 2014, 75, 244–254. [Google Scholar] [CrossRef] [Scilit]
- Nijhuis, M.; Gibescu, M.; Cobben, J.F.G. Analysis of reflectivity & predictability of electricity network tariff structures for household consumers. Energy Policy 2017, 109, 631–641. [Google Scholar] [CrossRef] [Scilit]
- Young, S.; Bruce, A.; MacGill, I. Potential impacts of residential PV and battery storage on Australia’s electricity networks under different tariffs. Energy Policy 2019, 128, 616–627. [Google Scholar] [CrossRef] [Scilit]
- Avau, M.; Govaerts, N.; Delarue, E. Impact of distribution tariffs on prosumer demand response. Energy Policy 2021, 151, 112116. [Google Scholar] [CrossRef] [Scilit]
- Hofmann, M.; Bjarghov, S.; Saele, H.; Lindberg, K.B. Grid tariff design and peak demand shaving: A comparative tariff analysis with simulated demand response. Energy Policy 2025, 198, 14475. [Google Scholar] [CrossRef] [Scilit]
- Morell-Dameto, N.; Chaves-Avila, J.P.; Roman, T.G.S.; Schittekatte, T. Forward-looking dynamic network charges for real-world electricity systems: A Slovenian case study. Energy Econ. 2023, 125, 6866. [Google Scholar] [CrossRef] [Scilit]
- Olmos, L.; Perez-Arriaga, I.J. A comprehensive approach for computation and implementation of efficient electricity transmission network charges. Energy Policy 2009, 37, 5285–5295. [Google Scholar] [CrossRef] [Scilit]
- Passey, R.; Haghdadi, N.; Bruce, A.; MacGill, I. Designing more cost reflective electricity network tariffs with demand charges. Energy Policy 2017, 109, 642–649. [Google Scholar] [CrossRef] [Scilit]
- Stute, J.; Klobasa, M. How do dynamic electricity tariffs and different grid charge designs interact?—Implications for residential consumers and grid reinforcement requirements. Energy Policy 2024, 189, 14062. [Google Scholar] [CrossRef] [Scilit]
- Winzer, C.; Hensler-Ludwig, P. Design and Impact of Grid Tariffs. Energies 2024, 17, 1364. [Google Scholar] [CrossRef] [Scilit]
- Hennig, R.; Ribo-Perez, D.; Vries, L.; Tindemans, S. What is a good distribution network tariff?—Developing indicators for performance assessment. Appl. Energy 2022, 318, 119186. [Google Scholar] [CrossRef] [Scilit]
- Brinkel, N.; Markotic, P.; Kuiper, L.; Warmerdam, S.; Baeten, B.; Meersmans, J.; Fidder, H.; Berg, R.; van der Ree, B.; van Sark, W.; et al. Dynamic Grid Tariffs for Electric Vehicle Charging: Results from a Real-World Experiment. In Proceedings of the IEEE Belgrade PowerTech Conference, Belgrade, Serbia, 25–29 June 2023. [Google Scholar]
- Chen, Q.; Folly, K.; IEEE. Impact of Renewable Energy and Dynamic Pricing on Electric Vehicles Charging. In Proceedings of the 30th Southern African Universities Power Engineering Conference (SAUPEC), Durban, South Africa, 25–27 January 2022. [Google Scholar]
- Daneshzand, F.; Coker, P.J.; Potter, B.; Smith, S. EV smart charging How tariff selection influences grid stress and carbon reduction. Appl. Energy 2023, 348, 21482. [Google Scholar] [CrossRef] [Scilit]
- Khan, T.A.; Aziz, T.; IEEE. Developing A Day-Ahead Dynamic Pricing Scheme for Charging Electric Vehicles in Bangladesh. In Proceedings of the International Conference on Green Energy, Computing and Sustainable Technology (GECOST), Miri Sarawak, Malaysia, 26–28 October 2022; pp. 440–445. [Google Scholar]
- Stute, J.; Kuhnbach, M. Dynamic pricing and the flexible consumer-Investigating grid and financial implications: A case study for Germany. Energy Strategy Rev. 2023, 45, 987. [Google Scholar] [CrossRef] [Scilit]
- Gholamnia, M.; Eslamirad, N.; Sajadi, P.; Masoumi, S.; Shahabi, H.; Pilla, F. Dynamic electricity pricing model with hourly and monthly adjustments: A time series-based approach. Energy Rep. 2025, 13, 5238–5251. [Google Scholar] [CrossRef] [Scilit]
- Stute, J.; Pelka, S.; Kuehnbach, M.; Klobasa, M. Assessing the conditions for economic viability of dynamic electricity retail tariffs for households. Adv. Appl. Energy 2024, 14, 100174. [Google Scholar] [CrossRef] [Scilit]
- Bergaentzle, C.; Jensen, I.G.; Skytte, K.; Olsen, O.J. Electricity grid tariffs as a tool for flexible energy systems: A Danish case study. Energy Policy 2019, 126, 12–21. [Google Scholar] [CrossRef] [Scilit]
- Deguenon, L.; Yamegueu, D.; Yan, B.; Kadri, S.M.; Winzer, C. Impact of dynamic grid tariffs on grid-connected storage dispatch and revenues. J. Energy Storage 2025, 120, 16472. [Google Scholar] [CrossRef] [Scilit]
- Gjorgievski, V.Z.; Velkovski, B.; Markovski, B.; Cundeva, S.; Markovska, N. Energy community demand-side flexibility: Energy storage and electricity tariff synergies. Energy 2024, 313, 134078. [Google Scholar] [CrossRef] [Scilit]
- Kirkerud, J.G.; Tromborg, E.; Bolkesjo, T.F. Impacts of electricity grid tariffs on flexible use of electricity to heat generation. Energy 2016, 115, 1679–1687. [Google Scholar] [CrossRef] [Scilit]
- Velkovski, B.; Gjorgievski, V.Z.; Kothona, D.; Bouhouras, A.S.; Cundeva, S.; Markovska, N. Impact of tariff structures on energy community and grid operational parameters. Sustain. Energy Grids Netw. 2024, 38, 1382. [Google Scholar] [CrossRef] [Scilit]
- Parra, D.; Patel, M.K. Effect of tariffs on the performance and economic benefits of PV-coupled battery systems. Appl. Energy 2016, 164, 175–187. [Google Scholar] [CrossRef] [Scilit]
- He, Y.; Wang, B.; Li, D.; Du, M.; Huang, K.; Xia, T. China’s electricity transmission and distribution tariff mechanism based on sustainable development. Int. J. Electr. Power Energy Syst. 2015, 64, 902–910. [Google Scholar] [CrossRef] [Scilit]
- He, Y.X.; Jiao, J.; Chen, R.J.; Shu, H. The optimization of Chinese power grid investment based on transmission and distribution tariff policy: A system dynamics approach. Energy Policy 2018, 113, 112–122. [Google Scholar] [CrossRef] [Scilit]
- Klug, T.W.; Beyene, A.D.; Meles, T.H.; Toman, M.A.; Hassen, S.; Hou, M.; Klooss, B.; Mekonnen, A.; Jeuland, M. A review of impacts of electricity tariff reform in Africa. Energy Policy 2022, 170, 13226. [Google Scholar] [CrossRef] [Scilit]
- Saraiva, J.T.; Fidalgo, J.N.; Pinto, R.B.; Soares, R.; Santos Afonso, J.; Pires, G.; IEEE. Implementation of Dynamic Tariffs in the Portuguese Electricity System—Preliminary Results of a Cost-Benefit Analysis. In Proceedings of the 13th International Conference on the European Energy Market (EEM), Porto, Portugal, 6–9 June 2016. [Google Scholar]
- Trong, M.D.; Yang, Y. An investigation on fairness perception for grid tariff models: Evidence from Denmark. Electr. J. 2023, 36, 107240. [Google Scholar] [CrossRef] [Scilit]
- Lutz, O.; Olavarria, V.; Hollinger, R.; Wittwer, C.; Koch, B. Dynamic Tariff Design for a Robust Smart Grid Concept: An Analysis of Global vs. Local Incentives. In Proceedings of the IEEE PES Innovative Smart Grid Technologies Conference Europe (ISGT-Europe), Torino, Italy, 26–29 September 2017; IEEE: Piscataway, NJ, USA. [Google Scholar]
- Malatji, E.M. The use of Dynamic Tariff by The Utilities to Counter act The Influence of Renewable Energy Sources. In Proceedings of the 7th International Conference on Smart Grid (icSmartGrid), Newcastle, Australia, 9–11 December 2019; IEEE: Piscataway, NJ, USA, 2019; pp. 103–107. [Google Scholar]
- Shao, L.; Huang, J.; Fu, F. A system dynamics analysis about two-part tariff’s leading effect on generating capacity investment. In Proceedings of the Conference of System Dynamics and Management Science, Shanghai, China, 4–6 November 2005; pp. 345–351. [Google Scholar]
- Act on the Methodology for Calculating Network Charges. 2022, No. 146/22. Available online: https://pisrs.si/pregledPredpisa?id=AKT_1266 (accessed on 19 January 2026).

Disclaimer/Publisher’s Note: The statements, opinions and data contained in all publications are solely those of the individual author(s) and contributor(s) and not of MDPI and/or the editor(s). MDPI and/or the editor(s) disclaim responsibility for any injury to people or property resulting from any ideas, methods, instructions or products referred to in the content. |
© 2026 by the authors. Licensee MDPI, Basel, Switzerland. This article is an open access article distributed under the terms and conditions of the Creative Commons Attribution (CC BY) license.