


Abstract
Accurate estimation of the state of health (SOH) of lithium-ion batteries is crucial for the safe operation of electric vehicles and energy storage systems. However, most existing methods rely on complete charging curves or manual feature engineering, making them difficult to adapt to practical scenarios where only limited charging segments are available. To fully exploit degradation information from limited charging data, this paper proposes a dual-modal mixture of Kolmogorov–Arnold network (DM-MoKAN) for lithium-ion battery SOH estimation using only early-stage constant-current charging voltage data. The proposed method incorporates three synergistic modules: an image branch, a sequence branch, and a dual-modal fusion regression module. The image branch converts one-dimensional voltage sequences into two-dimensional Gramian Angular Difference Field (GADF) images and extracts spatial degradation features through a lightweight network integrating Ghost convolution and efficient channel attention (ECA). The sequence branch employs a patch-based Transformer encoder to directly model local patterns and long-range dependencies in the raw voltage sequence. The dual-modal fusion module concatenates features from both branches and feeds them into a MoKAN regression head composed of multiple KAN experts and a gating network for adaptive nonlinear mapping to SOH. Experimental results demonstrate that DM-MoKAN outperforms various baseline methods on both Oxford and NASA datasets, achieving average RMSE/MAE of 0.28%/0.19% and 0.89%/0.71%, respectively. Ablation experiments further verify the effective contributions of the dual-modal fusion strategy, ECA attention mechanism, and MoKAN regression head to estimation performance improvement.
1. Introduction
With growing public concern over environmental pollution and ecological degradation, the development of sustainable energy technologies has become a crucial approach to mitigating the negative environmental impacts of conventional energy systems [1,2]. Owing to their high energy density, long cycle life, excellent charge–discharge efficiency, and low self-discharge rate, lithium-ion batteries have gradually become the mainstream choice in electrochemical energy storage applications [3,4,5]. However, during long-term use and repeated cycling, the capacity and power performance of lithium-ion batteries inevitably deteriorate due to aging mechanisms such as decomposition of electrochemically active materials, gradual increase in internal resistance, and structural degradation of electrode materials. These degradation processes not only significantly reduce the overall performance of battery systems but may also trigger safety risks such as thermal runaway under extreme operating conditions [6,7]. Therefore, accurate and timely estimation of the battery state of health (SOH) is of great significance for the safety and reliability of battery management systems.
In general, SOH estimation methods for lithium-ion batteries can be categorized into model-driven and data-driven approaches [8]. Model-driven methods typically infer SOH through physical/mathematical descriptions such as electrochemical mechanism models or equivalent circuit models, and their accuracy highly depends on the understanding of internal battery mechanisms and model fidelity. In contrast, data-driven methods employ machine learning techniques to automatically extract features from historical degradation data and construct SOH prediction models, focusing on the statistical mapping relationship between inputs and outputs without explicitly characterizing complex electrochemical processes.
Among model-driven methods, electrochemical models (EMs) [9] can reproduce internal battery dynamics with high fidelity [10] but are computationally expensive and sensitive to parameter identification. Equivalent circuit models (ECMs) offer computational simplicity [11] yet often struggle to track parameter changes under dynamic conditions, limiting their generalization capability [12].
Compared with model-driven approaches, data-driven SOH estimation methods do not require complete battery mechanism models or detailed electrochemical knowledge but instead learn the mapping relationship between inputs and outputs directly from data, thus providing better adaptability and flexibility [13]. Existing data-driven methods can generally be divided into two categories: expert-guided feature engineering methods and end-to-end deep feature extraction methods.
Feature engineering-based methods first construct health indicators (HIs) from charge–discharge curves then feed them into machine learning models for SOH estimation. For example, Wang et al. [14] extracted voltage-related HIs and combined empirical mode decomposition, variance contribution ratio analysis, gated recurrent units, and random forests to construct an ensemble method (EVGR) for SOH estimation. Hong et al. [15] selected charging-phase HIs and built a dual-stage attention-based recurrent neural network (RNN) for SOH estimation. Goh et al. [16] segmented discharge curves to extract features and implemented SOH estimation using Gaussian process regression and long short-term memory (LSTM). However, these approaches heavily rely on domain knowledge for HI design, limiting model generalization under varying operating conditions.
In contrast, end-to-end deep feature extraction methods directly learn degradation representations from raw operational signals without explicit feature design. Zhu et al. [17] combined convolutional autoencoders with bidirectional LSTM to automatically extract SOH-related features from charging curves. Wu et al. [18] proposed a hybrid convolutional autoencoder–recurrent autoencoder (CAE+RAE) framework with ensemble learning for automatic feature extraction. He et al. [19] constructed a multi-scale convolutional attention network with residual connections for robust SOH feature extraction. Bai et al. [20] designed a convolutional Transformer-based multi-view information perception framework (MVIP-Trans) to jointly learn global and local features from multi-channel signals. Lin et al. [21] employed sliding-window sampling and independently recurrent neural network (IndRNN) to alleviate gradient vanishing issues for end-to-end SOH estimation.
Beyond one-dimensional time series modeling, some studies have attempted to encode battery operating curves into two-dimensional image representations to leverage mature computer vision model architectures for feature extraction. A representative approach is based on Gramian Angular Field (GAF), which maps normalized voltage trajectories into two-dimensional images in a polar coordinate system while preserving temporal correlations. For instance, Mao et al. [22] converted charging profiles into GAF images and employed a 2D convolutional neural network combined with a bidirectional LSTM for SOH estimation, demonstrating that image-based feature extraction can yield more discriminative degradation representations than directly using raw sequences.
However, both sequence-based and GAF/GADF-based deep learning frameworks are typically developed under the assumption that relatively long or even complete charging curves are available, which differs significantly from practical battery management systems where measurement windows are often limited. In engineering practice, collecting complete charging curves for every cycle incurs considerable time and operational costs. In scenarios such as opportunity charging and fast on-board diagnosis, only partial charging segments can be measured in a stable and repeatable manner. Therefore, investigating SOH estimation methods that can maintain high accuracy when relying solely on limited charging segments is of significant practical importance. This study takes early-stage voltage segments during constant-current charging as a representative scenario, focusing on SOH estimation under early charging data conditions and exploring how to fully exploit latent temporal and spatial degradation features within a limited observation window.
Some recent studies have explored SOH estimation using partial charging segments. Chen et al. [23] performed end-to-end SOH estimation by feeding the early-stage constant-voltage (CV) charging current and its differential current into a convolutional neural network, and experimental results indicated that early CV charging data can contain sufficient degradation information for accurate health assessment. Guo et al. [24] proposed a rapid online SOH estimation method based on partial CV charging segments, where multiple health indicators were constructed from the segment (e.g., CV current evolution characteristics, charging time, and charging capacity). An optimized CV segment was further determined to reduce data requirements, and promising SOH prediction performance was achieved using Gaussian process regression. However, existing approaches typically follow either a hand-crafted HI-based pipeline or an end-to-end model built on a single-view representation of the partial segment and thus may not fully exploit the degradation information embedded in limited charging data.
To address the aforementioned challenges of limited charging data and the need for comprehensive degradation feature extraction, this paper proposes a dual-modal mixture of KAN network (DM-MoKAN) for lithium-ion battery SOH estimation using early charging voltage data. In the image branch, early charging voltage is converted into Gramian Angular Difference Field (GADF) images and fed into a Ghost convolutional network integrated with efficient channel attention (ECA) to extract discriminative spatial degradation features. In the sequence branch, the same early charging segment is retained as a one-dimensional voltage sequence and processed by a patch-based temporal Transformer encoder, which partitions the voltage sequence into short segments embedded as segment-level temporal tokens and performs self-attention operations to capture characteristic charging patterns and long-range aging dependencies in the time domain. Features from both branches are fused in a common latent space to form a joint degradation representation, upon which a Mixture-of-KANs (MoKAN) regression head composed of multiple Kolmogorov–Arnold Network (KAN) experts and a gating network is introduced for adaptive modeling of the nonlinear mapping from multimodal features to SOH. Compared with traditional multilayer perceptron (MLP) regression heads, MoKAN can dynamically adjust expert combinations according to input sample characteristics, making it more suitable for characterizing complex and diverse degradation behaviors under limited charging information conditions.
In summary, the main contributions of this paper are as follows:
- Construction of the dual-modal SOH estimation framework DM-MoKAN: A dual-branch network is designed to jointly exploit early charging voltage sequences and their GADF image representations, providing more complete and robust battery degradation representations compared to sequence-only or image-only unimodal methods.
- Design of image and sequence feature extraction branches aligned with battery degradation characteristics: The image branch employs GADF with Ghost-CNN integrated with ECA to extract spatial degradation patterns, while the sequence branch adopts a patch-based temporal Transformer to model local behaviors and long-range aging dynamics in the raw voltage, capturing SOH-related spatiotemporal information from two complementary perspectives.
- Introduction and validation of the MoKAN-based multimodal regression layer: A MoKAN regression structure composed of multiple KAN experts and a gating network is employed on top of the fused features for adaptive modeling of complex nonlinear SOH trajectories. Experimental results demonstrate that this structure outperforms traditional MLP regression heads and single-branch baseline models in both fitting accuracy and robustness.
2. Materials and Methods
This section first introduces the SOH definition and experimental datasets, then presents the proposed dual-modal mixture of KAN network (DM-MoKAN) for lithium-ion battery SOH estimation based on early constant-current charging information.
2.1. SOH Definition and Datasets
2.1.1. SOH Definition
SOH is a core indicator in battery management systems (BMS), describing the performance retention of a battery at the current cycle relative to its initial nominal state. This paper adopts a capacity-based SOH definition:
where is the effective capacity measured at the current cycle and is the rated capacity or selected reference capacity of the battery. As cycling progresses, capacity gradually decays and SOH decreases from approximately . When SOH drops to about 70–, the battery is typically considered to have reached end-of-life (EOL).
2.1.2. Oxford Dataset
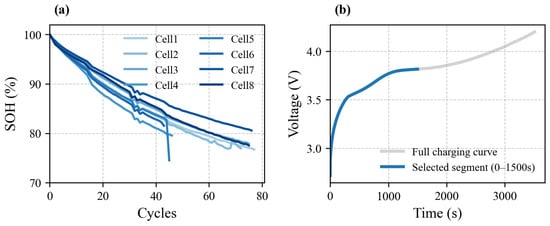
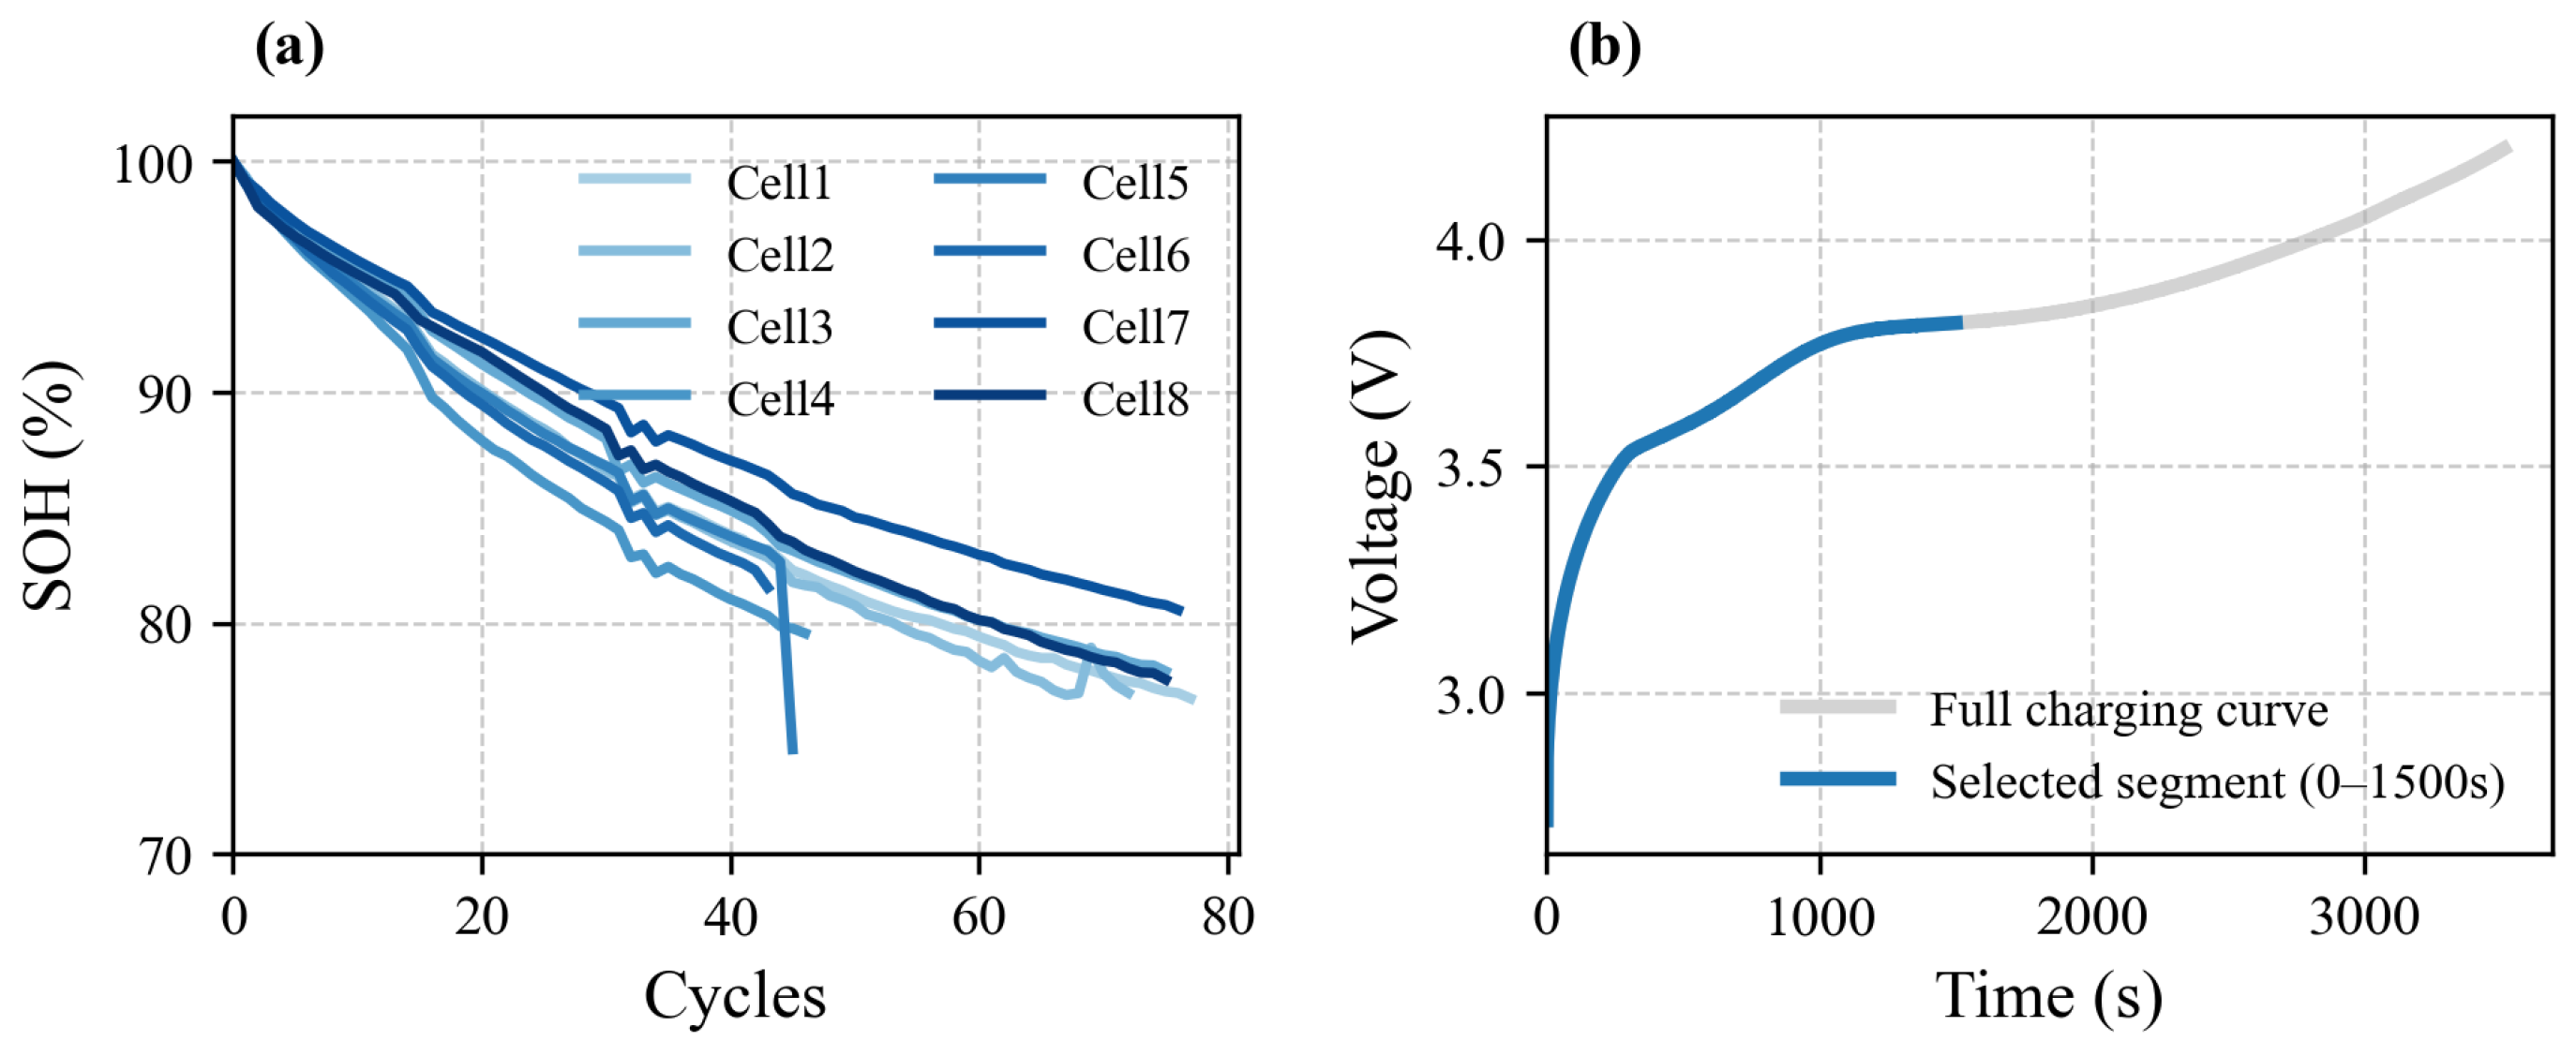
The Oxford dataset [25] contains 8 Kokam lithium polymer pouch cells (Cell1–Cell8) with a nominal capacity of 740 mAh, subjected to multiple driving cycles under accelerated aging conditions at 40 °C. True SOH is obtained through periodically inserted characterization cycles: during characterization cycles, batteries are charged at a constant current of 0.74 A to 4.2 V, then discharged at the same current to 2.7 V, with complete voltage, current, and capacity–time curves recorded. This paper selects Cell4 and Cell6 as test sets, with the remaining cells used as training samples. Figure 1 shows the SOH degradation curves and a complete charging voltage profile for this dataset. The selected early stage segment (0–1500 s) for feature extraction is annotated in Figure 1b.
Figure 1.
Oxford dataset: (a) SOH degradation curves for Cell1–Cell8; (b) Complete charging voltage curve with annotation of the early stage (0–1500 s) for SOH estimation.
2.1.3. NASA Dataset
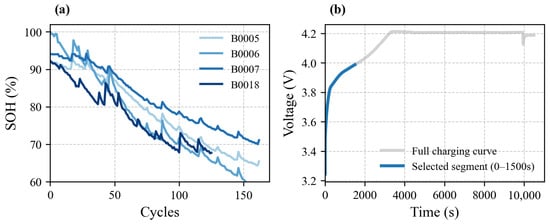
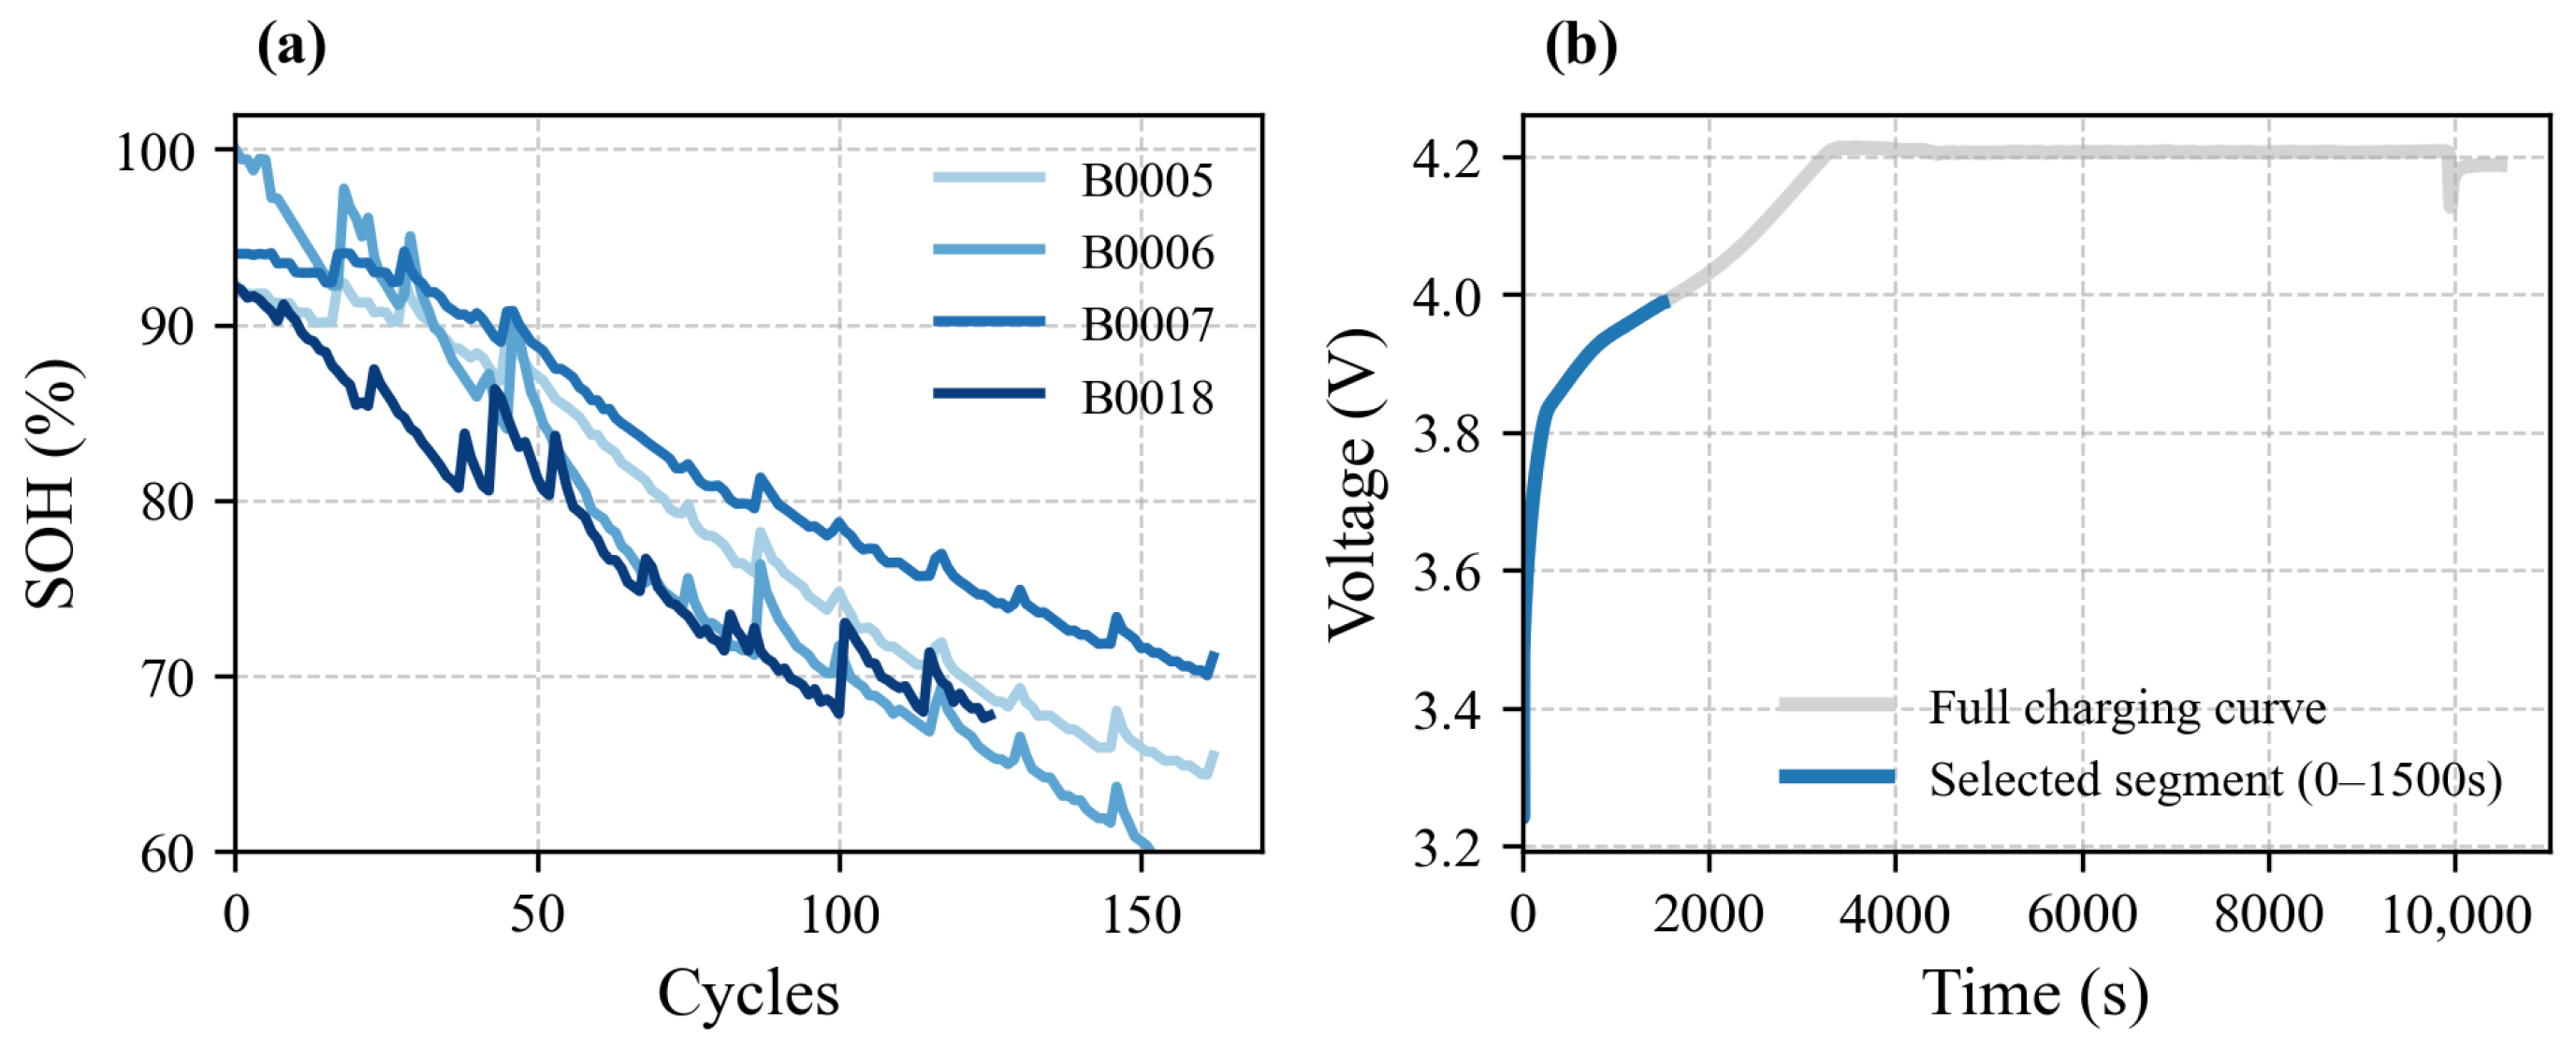
The battery dataset released by NASA Prognostics Center of Excellence (PCoE) [26] includes full-life charge–discharge records of multiple 2 Ah lithium cobalt oxide cells under constant temperature environment (approximately 24 °C). The charging phase employs a constant-current–constant-voltage (CC–CV) strategy: first charging at 1.5 A constant current to 4.2 V, then constant-voltage charging at 4.2 V until the current decays to 20 mA; the discharge phase uses 2 A constant-current discharge to a set cutoff voltage. This paper selects B0005, B0006, B0007, and B0018 as research objects, with B0005 as the test battery and the remaining batteries used for training. Figure 2 shows the SOH degradation curves and a complete charging voltage profile for this dataset. Similarly, the selected early stage segment (0–1500 s) for the experiments is annotated in Figure 2b.
Figure 2.
NASA dataset: (a) SOH degradation curves for B0005, B0006, B0007, and B0018; (b) Complete charging voltage curve with annotation of the early stage (0–1500 s) for SOH estimation.
2.2. The Proposed DM-MoKAN Model
The proposed DM-MoKAN framework consists of three cooperating functional modules corresponding to the image branch, sequence branch, and dual-modal fusion and regression module. This subsection details the overall framework and each module.
2.2.1. Overall Framework
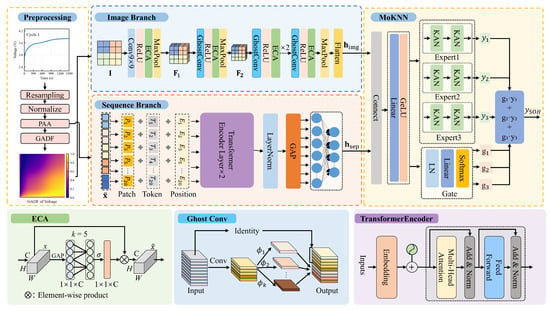
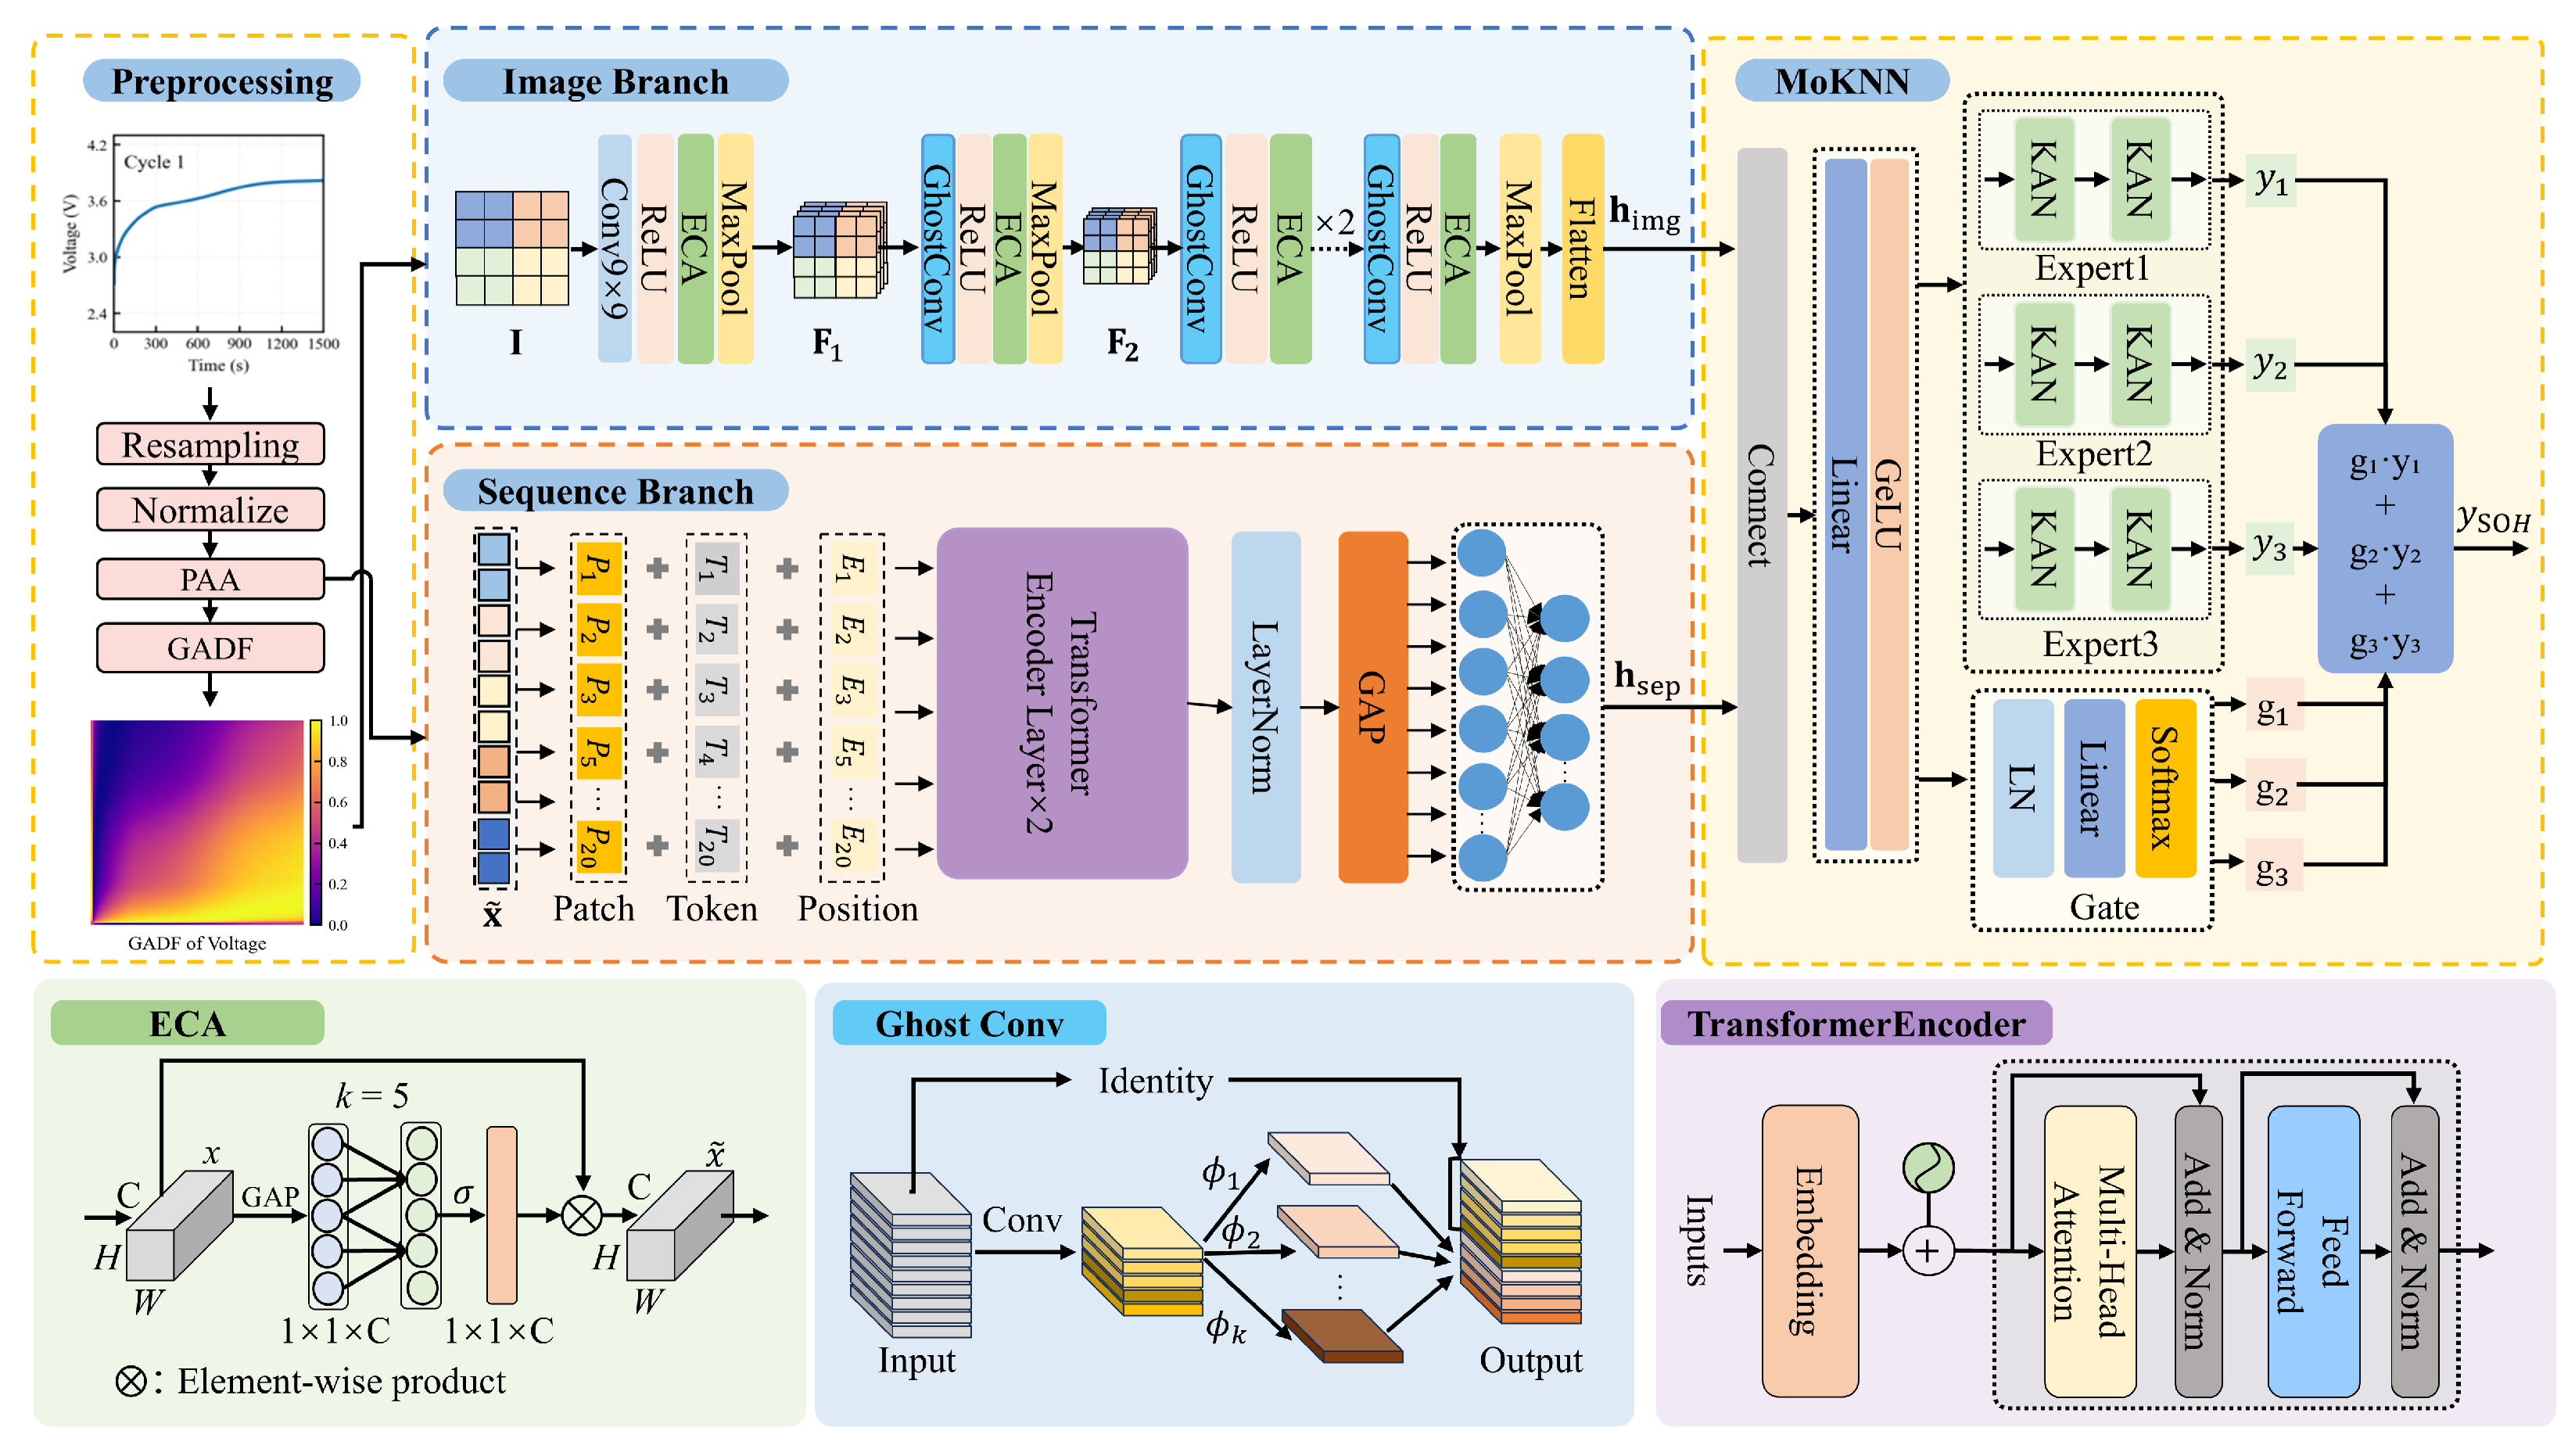
The DM-MoKAN framework consists of three functional modules. Module I is the image branch, which employs GADF to convert early charging voltage sequences into two-dimensional image representations, then extracts spatial features related to degradation patterns through a lightweight Ghost–ECA convolutional network. Module II is the sequence branch: it takes the same early voltage sequence as input and models local fluctuations and long-range dependencies using a patch-based Transformer structure. Module III is the dual-modal fusion and MoKAN regression head: it fuses image and sequence representations in a unified feature space and introduces a multi-expert KAN for nonlinear regression estimation of SOH. This three-module structure achieves multi-perspective representation and adaptive fusion of early charging information while maintaining model compactness. The overall architecture of the proposed DM-MoKAN framework is illustrated in Figure 3.
Figure 3.
Overall architecture of the proposed DM-MoKAN framework for lithium-ion battery SOH estimation.
2.2.2. Module I: GADF Image Branch
This module utilizes GADF [27] to convert early constant-current charging voltage time series into two-dimensional image representations, and employs a Ghost–ECA convolutional network for feature embedding to obtain spatial features representing battery degradation patterns.
- (1)
- GADF Degradation Data Transformation
For each characterization cycle, the voltage sequence collected during the early constant-current charging phase is denoted as:
where n is the number of sampling points within this time window. To reduce computational complexity while preserving main shape information, Piecewise Aggregate Approximation (PAA) is first applied to downsample the raw sequence to length l:
where represents the average voltage value in the i-th time sub-segment of the original sequence.
Subsequently, min–max normalization is applied to the PAA sequence on a per-cycle basis, scaling voltage amplitudes to the interval :
yielding the normalized sequence with .
Based on this, the normalized voltage is mapped to the polar coordinate angular domain:
The GADF matrix is constructed using these angular values:
GADF maps the correlations between sampling points in the time series to a two-dimensional plane by applying sine transformation to polar angle differences between any two time points, helping preserve sequential dependencies and degradation patterns of the original sequence in the image domain. This paper constructs a single-channel GADF matrix based solely on the voltage channel, treating it as a two-dimensional image representation of size :
- (2)
- Ghost–ECA Convolutional Feature Embedding
To fully extract degradation pattern information from GADF images while maintaining computational efficiency, the image branch employs a lightweight convolutional network integrating Ghost convolution and ECA. The Ghost module [28] decomposes standard convolution into intrinsic feature generation and cheap feature expansion stages, significantly reducing parameter count and computational complexity. The ECA module [29] achieves local cross-channel interaction through one-dimensional convolution, adaptively recalibrating the importance of each channel feature.
The single-channel GADF image is input to the image branch. First, preliminary feature extraction and spatial downsampling are performed through a large convolution kernel:
where is a convolution operation with stride 4 and 64 output channels, and is max pooling with stride 2.
continues through Ghost–ECA blocks and pooling operations to further expand channel dimensions and compress spatial resolution:
To extract deeper abstract features, passes through three cascaded Ghost–ECA blocks for progressive nonlinear transformation:
where and .
Finally, the feature maps are converted to a one-dimensional vector through pooling and flattening operations:
At this point, the image branch completes the end-to-end mapping from two-dimensional GADF representation to one-dimensional feature vector, providing discriminative degradation information in the spatial domain for subsequent dual-modal fusion.
2.2.3. Module II: Sequence Branch
To capture local charging patterns and long-range aging dependencies from the raw voltage sequence, the sequence branch employs a patch-based Transformer encoder [30]. Compared to directly applying self-attention to the entire sequence, the patch-based strategy divides the long sequence into multiple short segments that are processed in parallel, reducing computational complexity while preserving local temporal structure.
- (1)
- Patch Embedding and Positional Encoding
The normalized voltage sequence is equally divided into non-overlapping segments, each of length P:
Subsequently, linear projection is applied to the patch matrix , mapping each P-dimensional segment to a -dimensional token representation, with learnable positional encodings added to preserve the relative position information of segments within the sequence:
where is the learnable linear projection matrix and is the learnable positional encoding parameter. Through this embedding operation, the normalized voltage sequence is transformed into the token sequence consisting of N token vectors each of dimension , which serves as the input to the subsequent Transformer encoder.
- (2)
- Transformer Encoding
The token sequence is fed into an encoder composed of M stacked standard Transformer encoder layers. Within each layer, all N tokens are processed simultaneously as a sequence matrix . Through the self-attention mechanism, each token computes attention weights with respect to all other tokens, enabling direct information exchange between any pair of patches regardless of their temporal distance.
Specifically, the i-th encoder layer () receives the output from the previous layer as input, and first performs multi-head self-attention (MHSA). For the h-th attention head (), the query, key, and value matrices are obtained through linear transformations:
where are learnable parameters, is the dimension per head, and H is the total number of attention heads. Each attention head computes inter-token correlations via the scaled dot-product mechanism:
MHSA concatenates the outputs from H attention heads along the feature dimension and applies a linear projection to restore the dimension to :
where is the output projection matrix.
Subsequently, the MHSA output is combined with the input through residual connection followed by layer normalization, yielding the intermediate representation . The intermediate representation is then fed into the feed-forward network (FFN) for position-wise nonlinear transformation. The FFN consists of two fully connected layers with GELU activation, and similarly employs residual connection and layer normalization:
where denotes layer normalization and is the output of the i-th layer.
After layer-by-layer processing through M encoder layers, the final output contains N token representations fused with global contextual information. To obtain a compact global temporal feature, layer normalization is first applied to , followed by global average pooling along the token dimension, and finally a fully connected layer maps to the target dimension:
At this point, the sequence branch completes the end-to-end mapping from the normalized voltage sequence to the -dimensional feature vector , providing temporal-domain degradation information for subsequent dual-modal fusion.
2.2.4. Module III: Dual-Modal Fusion and MoKAN Regression
To adaptively model the complex nonlinear mapping from fused features to SOH, this work employs a KAN regression head built on a Mixture-of-Experts (MoE) architecture, referred to as MoKAN. Unlike conventional MLPs that place fixed activation functions on the nodes, KAN places learnable activation functions on the edges of the network, endowing it with stronger function approximation capability [31]. The MoE architecture, on the other hand, dynamically combines the outputs of multiple expert networks through a gating mechanism, making it suitable for handling diverse degradation patterns [32]. MoKAN integrates these two ideas by using multiple KAN experts as subnetworks, while a gating network adaptively allocates weights to each expert according to the input characteristics.
The feature vector output from the image branch and that from the sequence branch are first concatenated to form a joint degradation representation:
This fusion strategy enables the model to simultaneously exploit spatial correlation patterns encoded in the GADF images and temporal dynamic information contained in the raw voltage sequence.
The fused feature vector is then passed through a linear bottleneck layer with nonlinear activation to reduce dimensionality:
where is the projection matrix and denotes the bottleneck dimension.
Based on the bottleneck feature , the gating network generates the weight allocation for each expert:
where is the gating projection matrix, E is the number of experts, and represents the contribution weight of each expert.
Each KAN expert consists of two cascaded KAN blocks that map the bottleneck feature to a scalar output:
The final SOH estimate is obtained as the weighted sum of the expert outputs:
With this design, MoKAN can dynamically adjust the combination of experts according to the characteristics of each input sample, enabling more effective fitting of complex and diverse SOH degradation trajectories under limited charging information.
2.2.5. SOH Estimation Workflow of DM-MoKAN
Based on the above model architecture, the complete workflow of the proposed DM-MoKAN for battery SOH estimation is as follows:
Step 1: Data Collection and Preprocessing: Collect voltage time series data during the early constant-current charging phase, apply linear interpolation resampling to ensure sampling consistency, and perform min–max normalization:
where is the normalized value, x is the original value, and and are the minimum and maximum values of the sequence, respectively.
Step 2: GADF Transformation and Sequence Downsampling. The preprocessed data is downsampled to l data points via PAA, then converted to the polar coordinate angular domain through angle mapping , and the GADF matrix is constructed to represent temporal correlations in the voltage signal. Simultaneously, the downsampled one-dimensional sequence serves as input to the sequence branch.
Step 3: Dual-Branch Feature Extraction: The image branch converts the GADF matrix into a compact spatial feature representation through the Ghost–ECA convolutional network; the sequence branch maps the one-dimensional voltage sequence into a temporal feature vector through the Patch-Transformer encoder.
Step 4: Feature Fusion and SOH Regression: Feature vectors from the image and sequence branches are concatenated and fed into the MoKAN regression head. The gating network dynamically allocates weights to each KAN expert according to input characteristics, and the final SOH estimate is output.
3. Results and Discussion
This section comprehensively evaluates the proposed DM-MoKAN model on the Oxford and NASA public datasets. We first introduce the experimental setup and evaluation metrics, then analyze the degradation representation features contained in early voltage sequences using GADF images of test batteries from the Oxford dataset as examples. Subsequently, we compare DM-MoKAN with various baseline methods on the Oxford dataset and analyze the contributions of dual-channel structure and key modules through ablation experiments. Finally, we verify the cross-dataset generalization capability on the NASA dataset.
3.1. Experimental Setup
Experimental Platform: All numerical computations were conducted on the same hardware and software platform: a workstation (CSHW-iWork2022, Changsha Huiwei Information Technology Co., Ltd., Changsha, China) equipped with an Intel Core i7-11700F processor (Intel Corporation, Santa Clara, CA, USA), 32 GB RAM, and an NVIDIA GeForce RTX 3060 GPU with 12 GB VRAM (NVIDIA Corporation, Santa Clara, CA, USA), running Windows 10 (Microsoft, Redmond, WA, USA) with Python 3.10 and PyTorch 2.3 as the main development environment.
Models and Baselines: To evaluate the effectiveness of the proposed DM-MoKAN model, three categories of baseline models were constructed. The first category comprises ablation variants for analyzing contributions of individual components, including Seq-only retaining only the sequence branch, Img-only retaining only the image branch, DM-MoKAN-w/oECA removing the ECA channel attention module from the image branch, DM-KAN removing the MoE structure and using only a single KAN, and DM-MLP replacing the MoKAN regression head with a traditional MLP. The second category comprises traditional deep learning baseline models implemented under the same experimental conditions as DM-MoKAN. All these models use the same early-stage charging voltage data (0–1500 s) as input, which is either converted to GADF images for image-based models or directly used as a one-dimensional sequence for sequence-based models. 2D-CNN-MLP takes GADF images as input and uses three convolution–pooling modules (with channel numbers 64, 96, and 128/128/128) followed by three fully connected layers for SOH regression. 1D-CNN-LSTM takes the voltage sequence of length as input, first extracting local temporal features through three 1D convolution and max pooling layers, then feeding the feature sequence into a bidirectional LSTM layer (64 hidden units per direction), and finally outputting SOH predictions through two fully connected layers. ViT (Vision Transformer) takes GADF images as input and employs a standard patch-based Transformer encoder followed by an MLP regression head for SOH estimation. The third category comprises representative methods from the literature: CAE+RAE [18] and EVGR [14] for comparison on the NASA dataset, and MVIP-Trans [20] and IndRNN [21] for comparison on the Oxford dataset. For these literature methods, the results reported in their original publications were directly adopted. Since the experiments follow the same train/test split as used in these studies, the reported results are directly comparable. The experimental configurations of these methods, including input data and hyperparameters, are as specified in their respective original papers.
Hyperparameters and Training Configuration: All models implemented in this paper were trained using the AdamW optimizer and mean squared error (MSE) loss function. For hyperparameter selection, 10% of the training set from each dataset was randomly split as a validation set, with the remaining 90% used for model training. The main training hyperparameters for DM-MoKAN were determined through grid search combined with validation set performance feedback. The search ranges and optimal values are shown in Table 1.
Table 1.
Core hyperparameters and search ranges for the DM-MoKAN model.
3.2. Evaluation Metrics
Root mean square error (RMSE) and mean absolute error (MAE) are used to evaluate SOH estimation performance, defined as:
where is the estimated SOH, is the true value, and L is the number of test samples. Lower RMSE and MAE indicate higher estimation accuracy.
3.3. GADF Image Feature Analysis
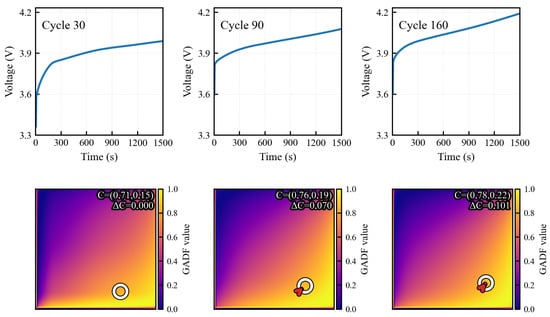
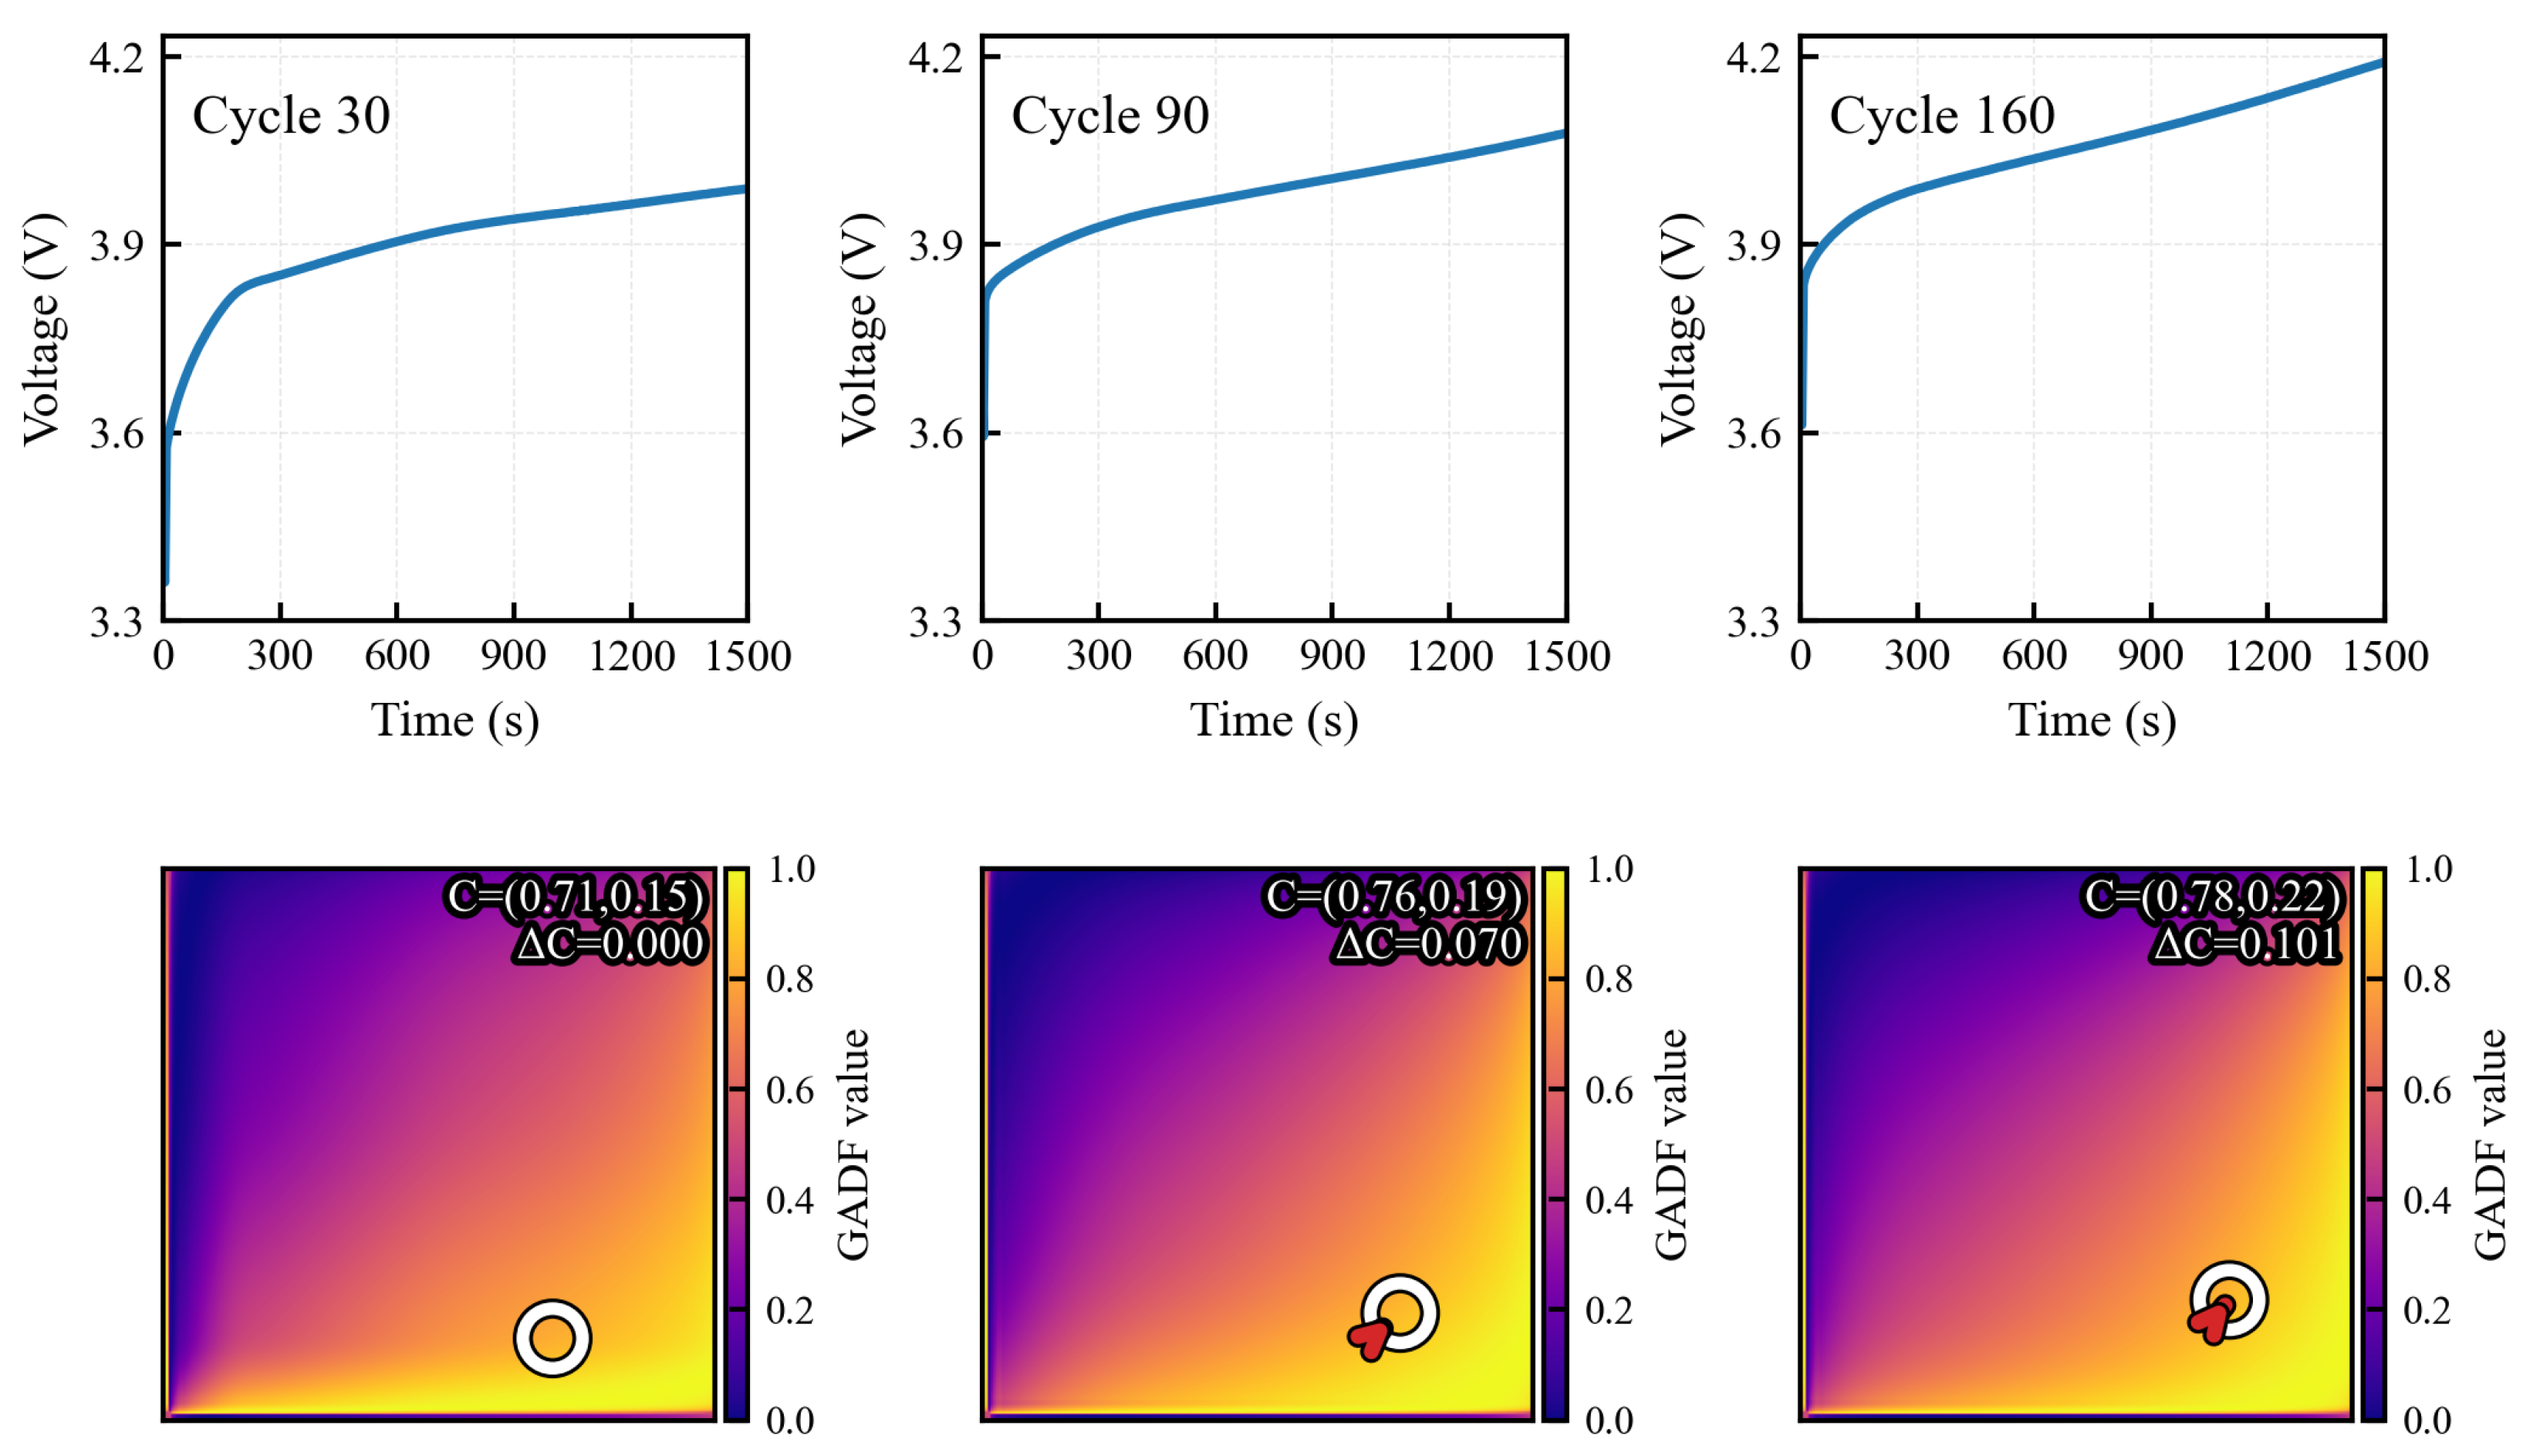
To intuitively examine whether early constant-current charging voltage sequences already exhibit distinguishable patterns during the degradation process, Figure 4 presents the early charging voltage curves and their GADF representations for the NASA dataset battery B0005 at different cycle numbers. Each column corresponds to one cycle (from left to right: cycles 30, 90, and 160); the top row shows the early voltage–time curves, and the bottom row shows the GADF images constructed from the corresponding voltage sequences. It can be observed that, as the cycle number increases, the overall color distribution of the GADF images changes in a regular manner: the dark purple region in the upper-left corner corresponding to lower correlation values gradually expands, and the shape and position of the internal color transition bands also shift in a regular way. To further enhance the distinguishability, we mark the intensity-weighted centroid C of the high-value region in each GADF image, where the high-value region is defined as the top 15% pixels with the largest GADF values, and we report the centroid displacement relative to the baseline cycle (Cycle 30) as . The centroid exhibits a consistent drift with cycling, moving progressively toward the upper-right direction. This indicates that the correlation patterns in the voltage sequences evolve systematically with cycling and manifest as structural features that gradually change with degradation in the image space, providing intuitive support for GADF-based feature extraction and discriminative modeling.
Figure 4.
Early charging voltage curves (top row) and corresponding GADF images (bottom row) for the NASA battery B0005 at different cycle numbers (from left to right: Cycle 30, Cycle 90, Cycle 160). The intensity-weighted centroid C is marked in each GADF image, and denotes the centroid displacement relative to Cycle 30.
3.4. Comparative Experiments on Oxford Dataset
On the Oxford dataset, DM-MoKAN is compared with the following representative methods: MVIP-Trans [20], IndRNN [21], ViT, 2D-CNN-MLP, and 1D-CNN-LSTM. Table 2 presents the MAE and RMSE (in %) for each method on Cell4 and Cell6.
Table 2.
Performance comparison of DM-MoKAN and existing methods on the Oxford dataset (error in %).
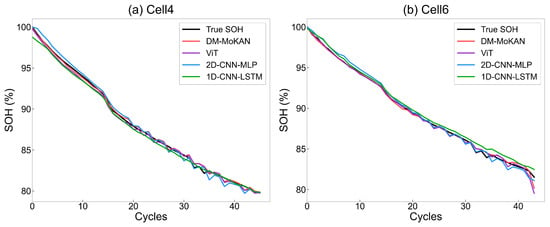
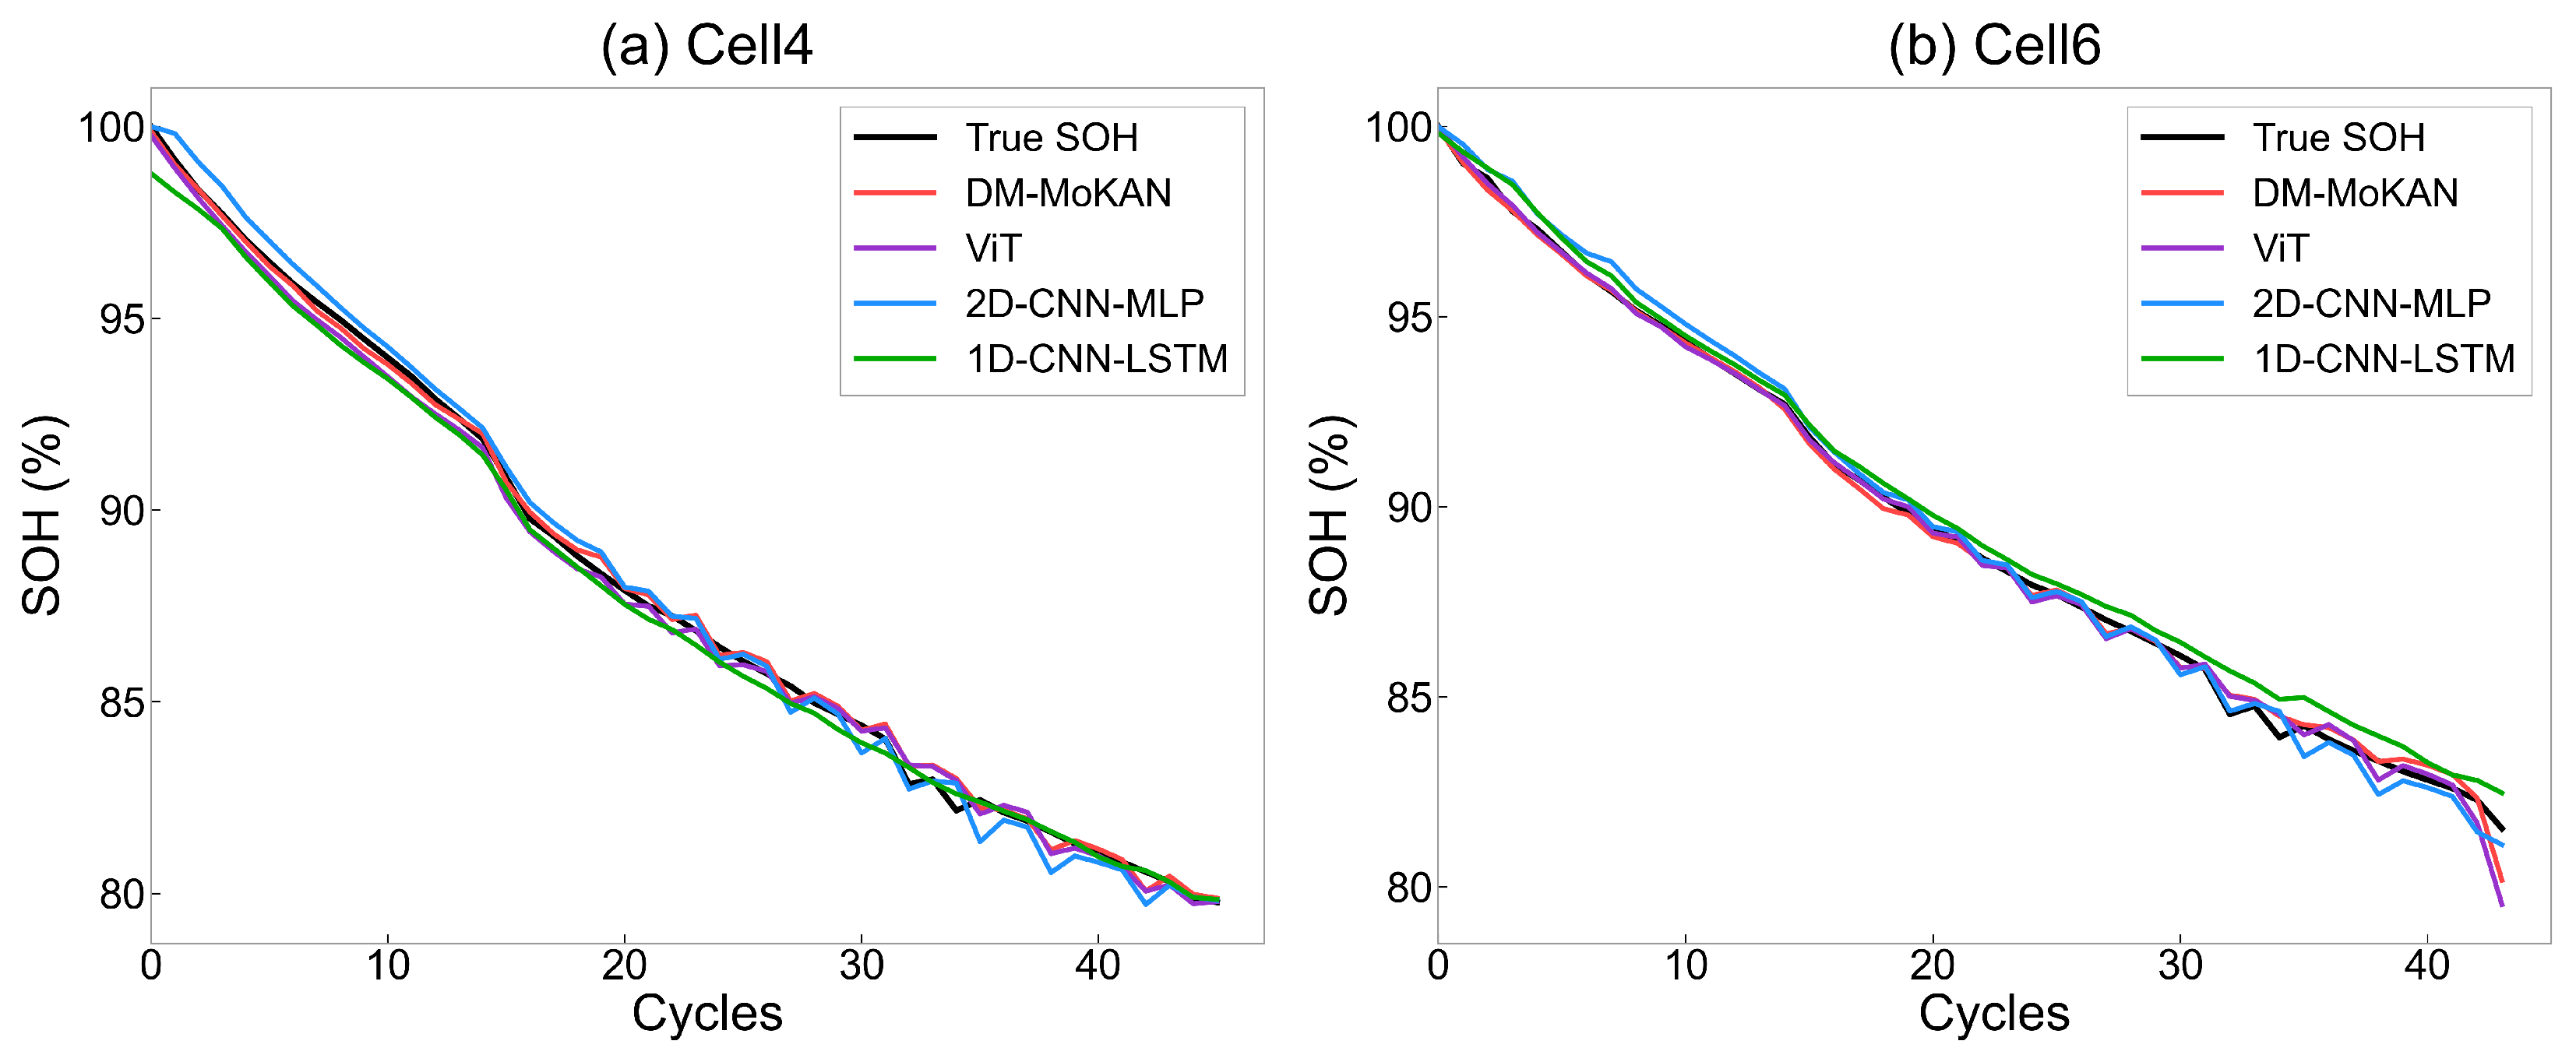
As shown in Table 2, DM-MoKAN achieves the lowest MAE and RMSE on both Cell4 and Cell6. Figure 5 shows the SOH estimation curves for each method on the two test batteries. It can be observed that the prediction trajectory of DM-MoKAN is closer to the true SOH throughout the entire lifetime and can better track degradation trends, while some comparison methods show significant deviations.
Figure 5.
Comparison of SOH estimation results for DM-MoKAN and existing methods on the Oxford dataset.
To further analyze the trade-off between accuracy and computational cost, Table 3 presents the computational complexity and accuracy improvement comparison among all methods.
Table 3.
Computational complexity and accuracy improvement comparison.
As shown in Table 3, DM-MoKAN achieves the best accuracy with MAE reductions ranging from 38.7% (vs. MVIP-Trans) to 59.6% (vs. IndRNN) compared to all baseline methods. Despite having 6× more parameters than DM-MoKAN (8.48M vs. 1.41M), DM-MoKAN still achieves 40.6% lower MAE than ViT. As a single-modal method processing only GADF images, ViT cannot capture the complementary temporal dynamics provided by the sequence branch, which explains its inferior performance.
Although 2D-CNN-MLP has more parameters than DM-MoKAN (4.43M vs. 1.41M), its training and inference times are shorter because standard CNN operations are highly optimized on GPUs, whereas DM-MoKAN involves dual-modal processing and the MoKAN regression head with B-spline activation functions that require more computation. Nevertheless, the inference time of DM-MoKAN (4.52 ms per sample) is acceptable for practical BMS applications, where SOH estimation is typically performed once per charging cycle.
Regarding MVIP-Trans and IndRNN, their source codes are not publicly available for direct complexity comparison. Nevertheless, DM-MoKAN achieves better accuracy than both methods, with 38.7% lower MAE than MVIP-Trans and 59.6% lower MAE than IndRNN. Furthermore, the primary advantage of DM-MoKAN lies in achieving superior accuracy using only early-stage charging data (0–1500 s), whereas methods such as MVIP-Trans require complete multi-channel charge–discharge cycle data. This data acquisition advantage makes DM-MoKAN more suitable for practical applications.
3.5. Ablation Experiments
To analyze the contributions of each component of DM-MoKAN, this section conducts ablation experiments from two dimensions: branch configuration and key modules.
3.5.1. Effect of Branch Configuration
Three model variants are constructed to evaluate the role of different modalities. Seq-only uses only the sequence branch, Img-only uses only the image branch, and DM-MoKAN is the complete dual-branch structure. Table 4 presents the performance comparison of the three configurations.
Table 4.
Performance comparison of different branch configurations for SOH estimation (error in %).
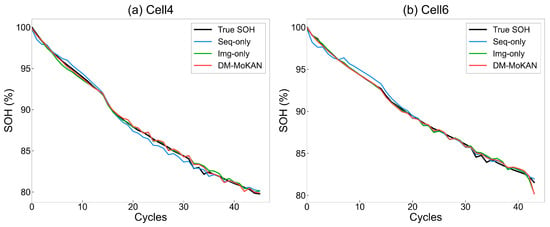
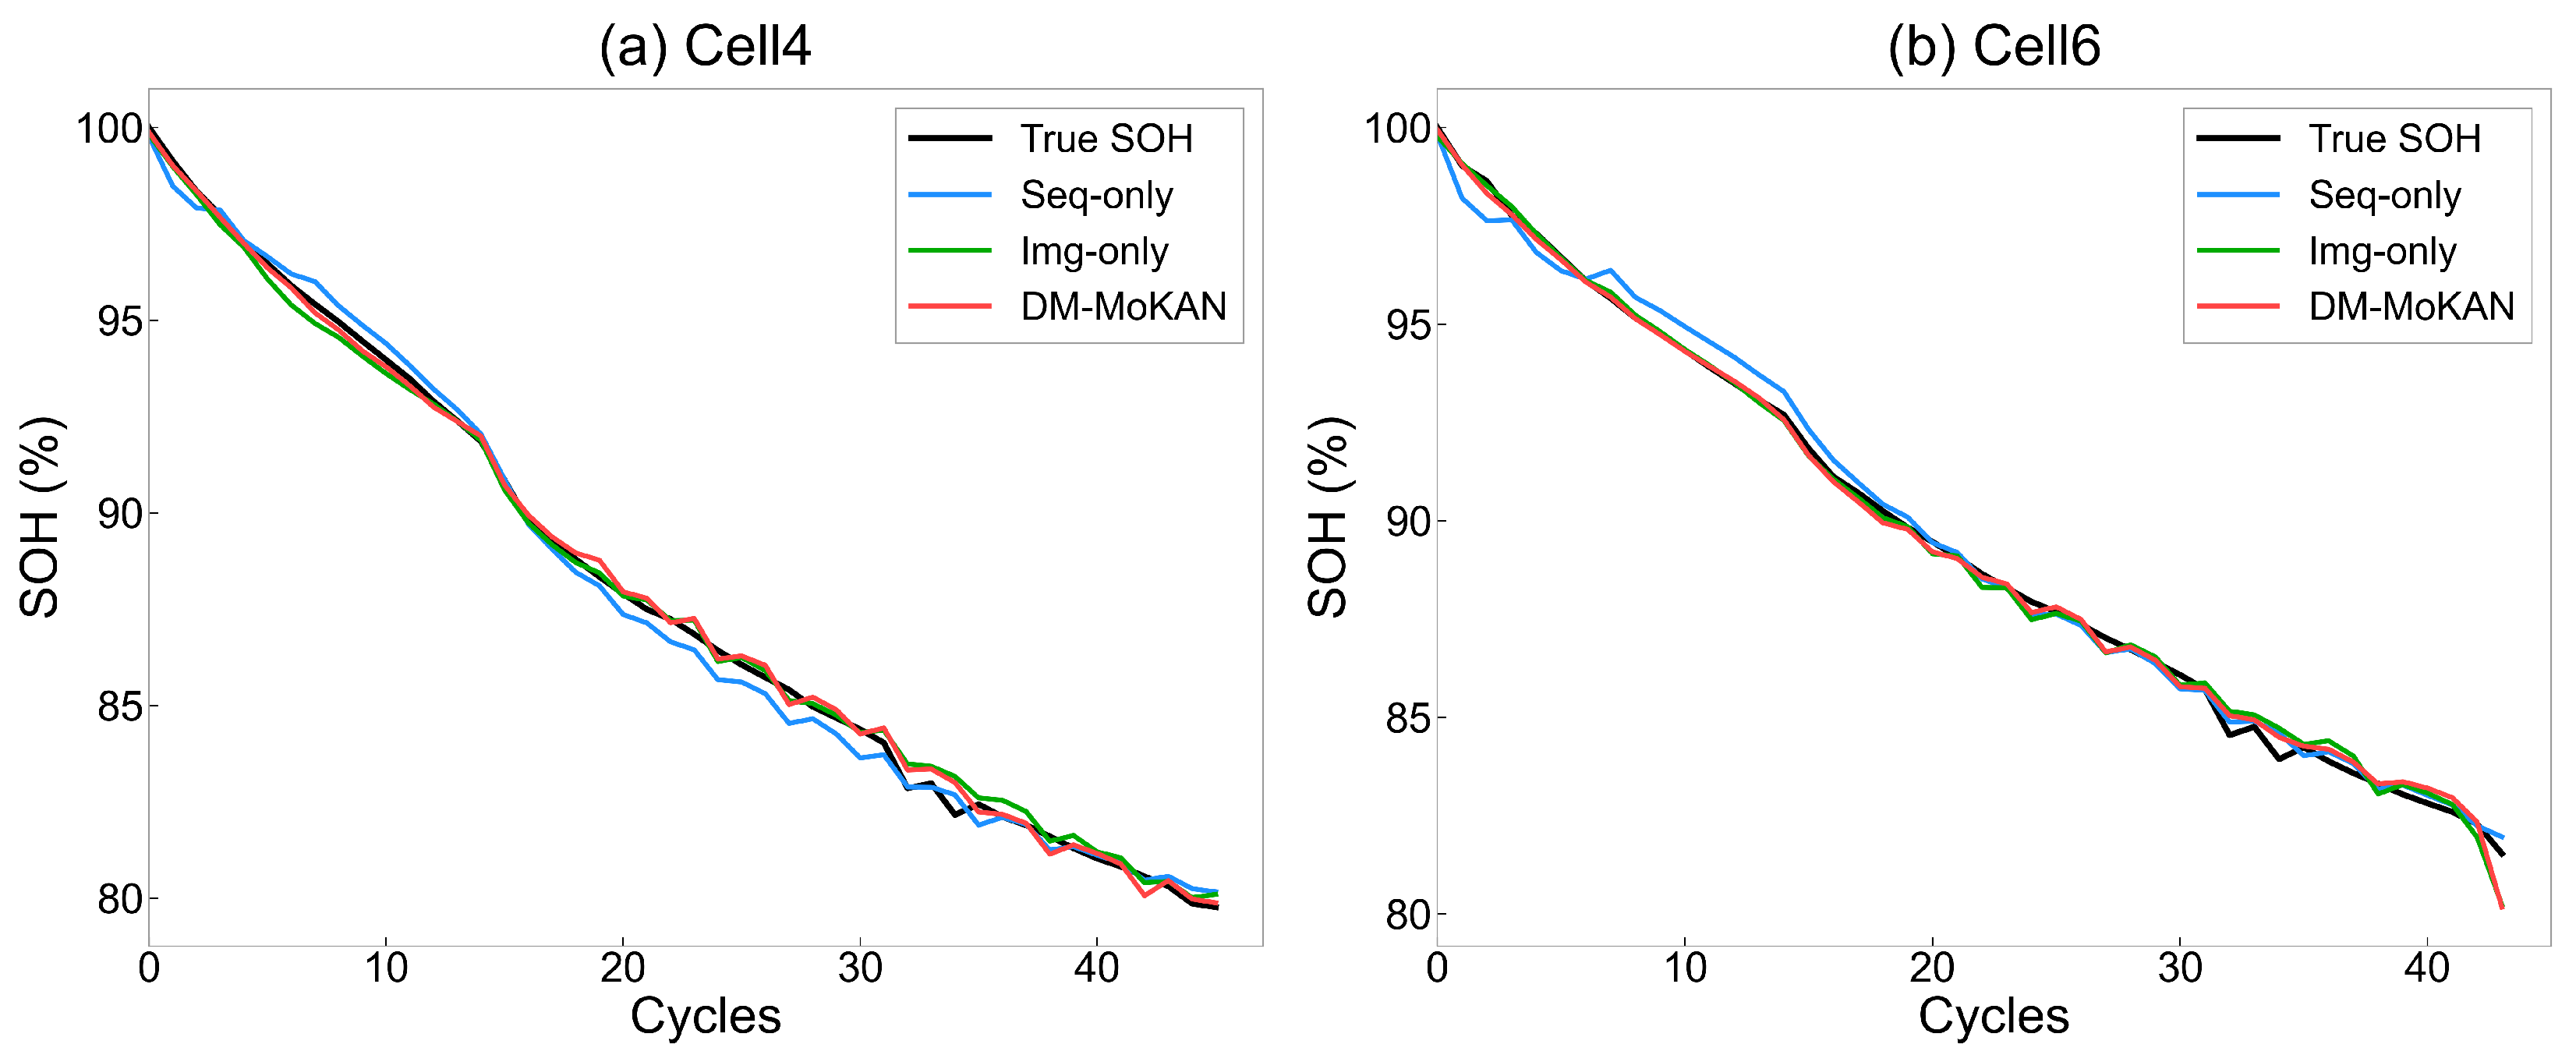
Results show that the dual-branch DM-MoKAN outperforms both single-branch models, with average MAE and RMSE decreasing by 42.4% and 30.0% compared to Seq-only, and by 17.4% and 12.5% compared to Img-only. This improvement demonstrates that the two branches capture complementary degradation information. The image branch extracts global correlation structures through GADF encoding, while the sequence branch preserves fine-grained local temporal dynamics. Dual-modal fusion combines the strengths of both and provides a more complete degradation representation. The consistent performance gains on both Cell4 and Cell6 further confirm that the dual-modal fusion strategy enhances model robustness across batteries with different degradation trajectories. The SOH estimation curves in Figure 6 visually demonstrate the accuracy advantage of DM-MoKAN over single-branch models.
Figure 6.
Comparison of SOH estimation results for different branch configurations.
3.5.2. Effect of Key Modules
To analyze the contributions of the attention mechanism and regression head, four model variants are designed. DM-MoKAN is the complete model, DM-KAN removes the MoE structure and uses only a single KAN, DM-MoKAN-w/oECA removes the ECA attention module from the image branch, and DM-MLP replaces the MoKAN regression head with MLP. Table 5 presents the ablation results.
Table 5.
Ablation experiments on key modules (error in %).
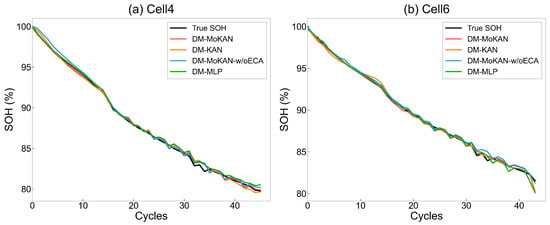
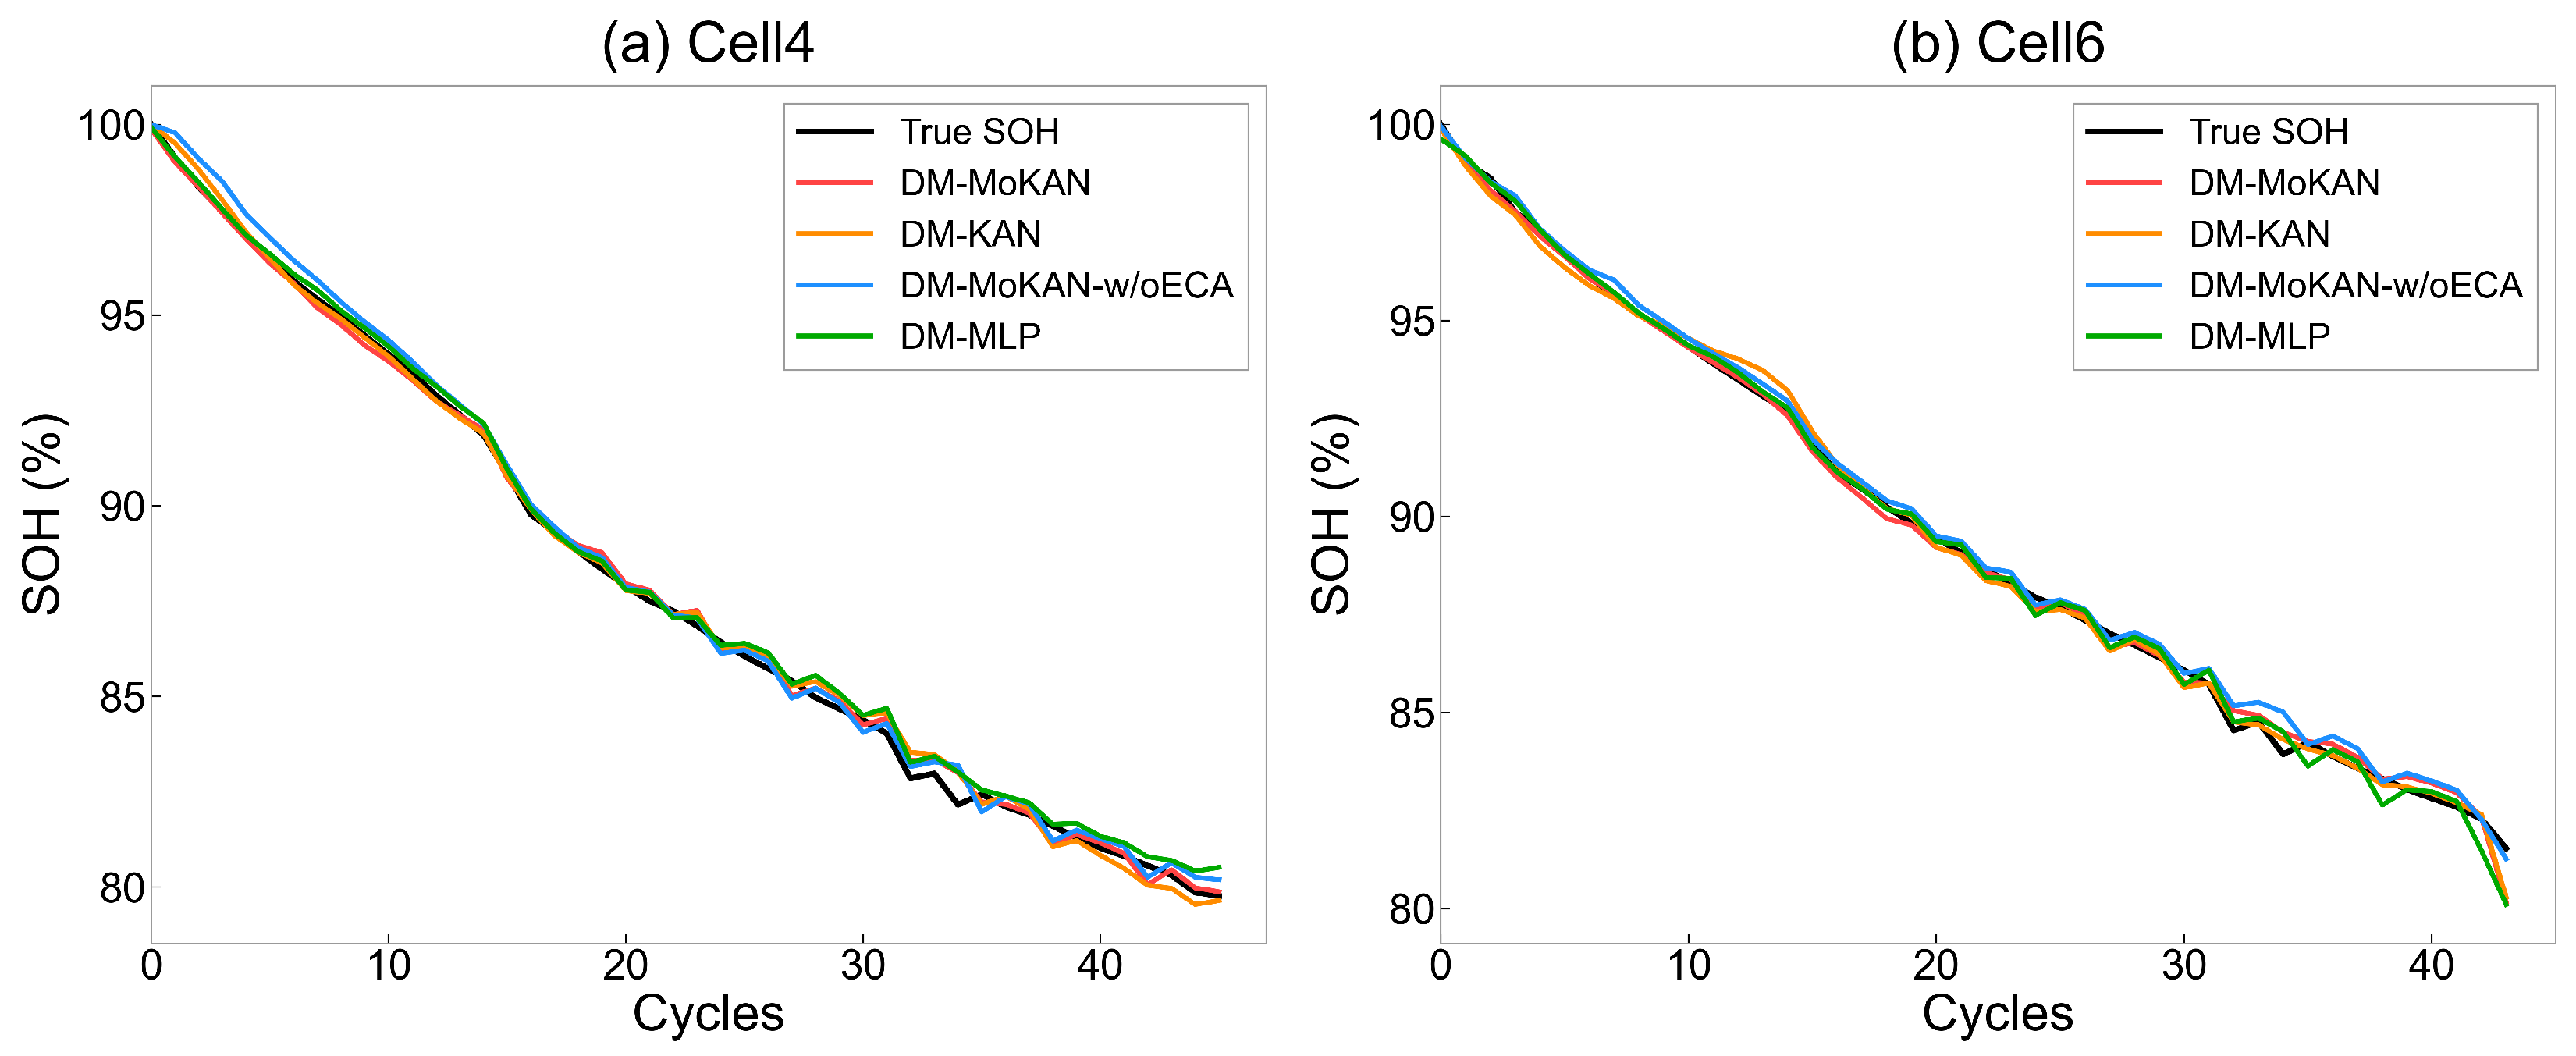
Results show that removing ECA causes average MAE and RMSE to increase significantly. Specifically, DM-MoKAN achieves 38.7% lower MAE and 24.3% lower RMSE than the variant without ECA (DM-MoKAN-w/oECA). GADF images contain both degradation-relevant correlation patterns and irrelevant noise. The role of the ECA module lies in effectively suppressing noise-dominated features while amplifying discriminative degradation signatures through adaptive channel importance recalibration. Without ECA, the model struggles to distinguish useful information from noise. Comparing DM-KAN with DM-MLP reveals that replacing MLP with KAN reduces average MAE and RMSE by 4.2% and 8.8%, respectively. This improvement can be attributed to the fundamental architectural differences between KAN and MLP. Traditional MLPs use fixed activation functions (e.g., ReLU, GELU) at nodes, whereas KAN places learnable activation functions parameterized as B-splines on edges. According to the Kolmogorov–Arnold representation theorem, any multivariate continuous function can be represented as a composition of univariate functions on edges, which provides KAN with a strong theoretical foundation for function approximation. In SOH estimation scenarios characterized by limited training data and strong nonlinear degradation behavior, KAN’s learnable edge functions can adaptively capture the complex capacity fade patterns without requiring excessively deep network structures, resulting in better parameter efficiency and generalization performance. Furthermore, comparing DM-MoKAN with DM-KAN shows that the MoE structure provides an additional 17.4% and 9.7% reduction in average MAE and RMSE, respectively. The MoE architecture enables dynamic expert selection through the gating network, allowing different experts to specialize in different degradation patterns. This input-dependent routing mechanism is particularly beneficial for SOH estimation, where batteries exhibit heterogeneous degradation behaviors across different aging stages. Overall, the combination of MoE and KAN in the complete DM-MoKAN model achieves a total reduction of 20.8% in MAE and 17.6% in RMSE compared to DM-MLP. Figure 7 shows the prediction differences among the four variants, where the complete DM-MoKAN achieves the best prediction accuracy and stability across all degradation stages.
Figure 7.
Ablation experiment results for DM-MoKAN and its variants.
3.6. Generalization Validation on NASA Dataset
To evaluate the generalization capability of DM-MoKAN under different operating conditions and battery types, experiments are further conducted on the NASA dataset. Data preprocessing and training workflows remain consistent with the Oxford dataset experiments.
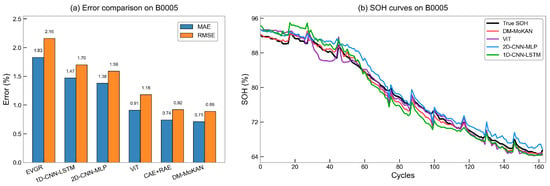
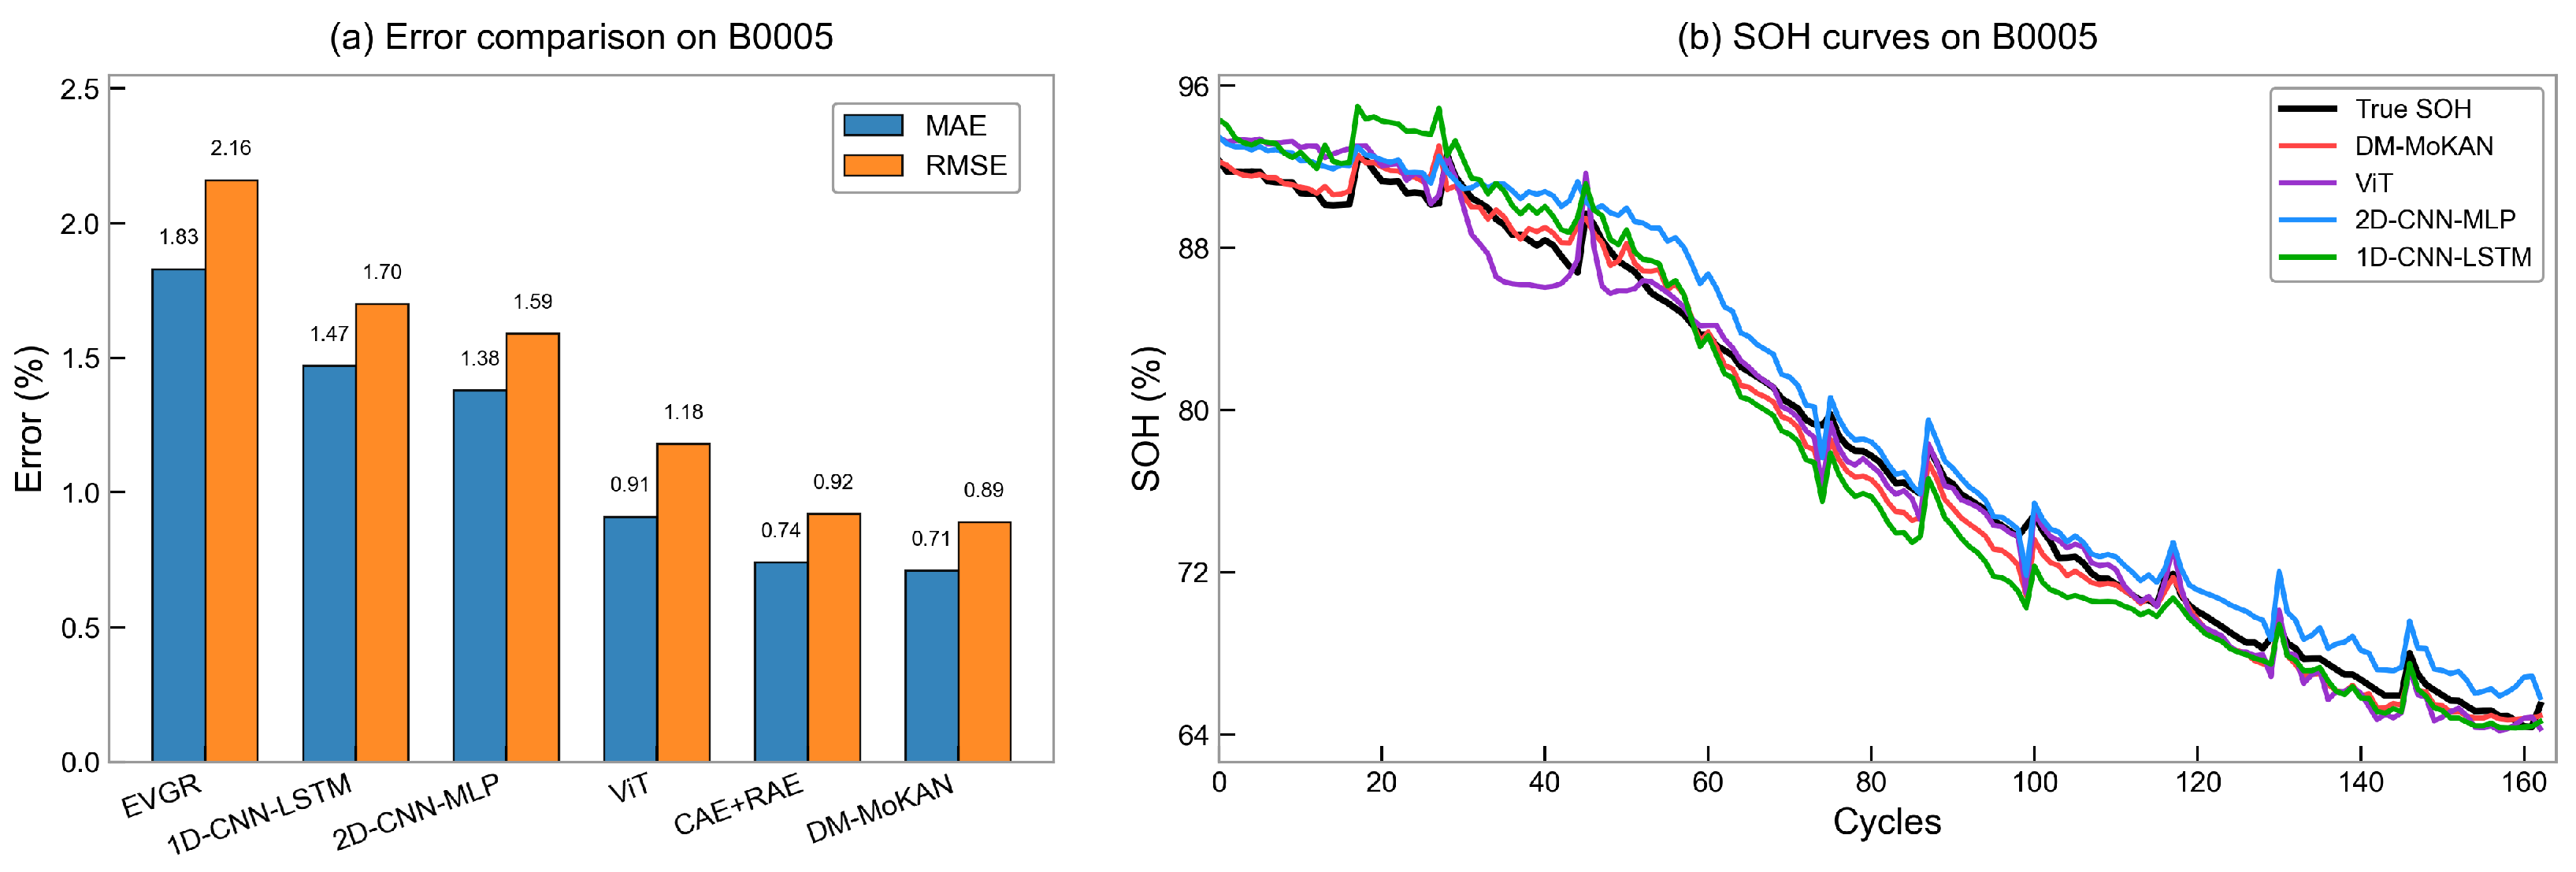
Figure 8a shows the MAE and RMSE statistics for DM-MoKAN and comparison methods on test battery B0005. It can be seen that DM-MoKAN achieves the lowest error on both metrics, with MAE and RMSE of 0.71% and 0.89%, respectively, outperforming all comparison methods.
Figure 8.
Comparison of SOH estimation performance on NASA dataset test battery B0005. (a) MAE and RMSE statistics for DM-MoKAN and comparison methods; (b) True SOH and model estimation curves.
Figure 8b shows the SOH estimation curves over the full lifetime of B0005. It can be observed that the prediction trajectory of DM-MoKAN is closer to the true SOH in both overall degradation trends and local fluctuation positions. Particularly in later cycles, it can still stably track SOH changes, while some comparison methods show significant deviations in this phase. These results demonstrate that DM-MoKAN also achieves good estimation accuracy and generalization capability on the NASA dataset.
In summary, experimental results on both the Oxford and NASA datasets demonstrate that DM-MoKAN exhibits excellent SOH estimation performance across different battery types and operating conditions, proving that the proposed method has good generalization capability.
3.7. Effect of Input Voltage Segment Length
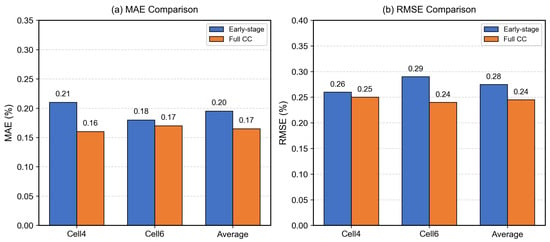
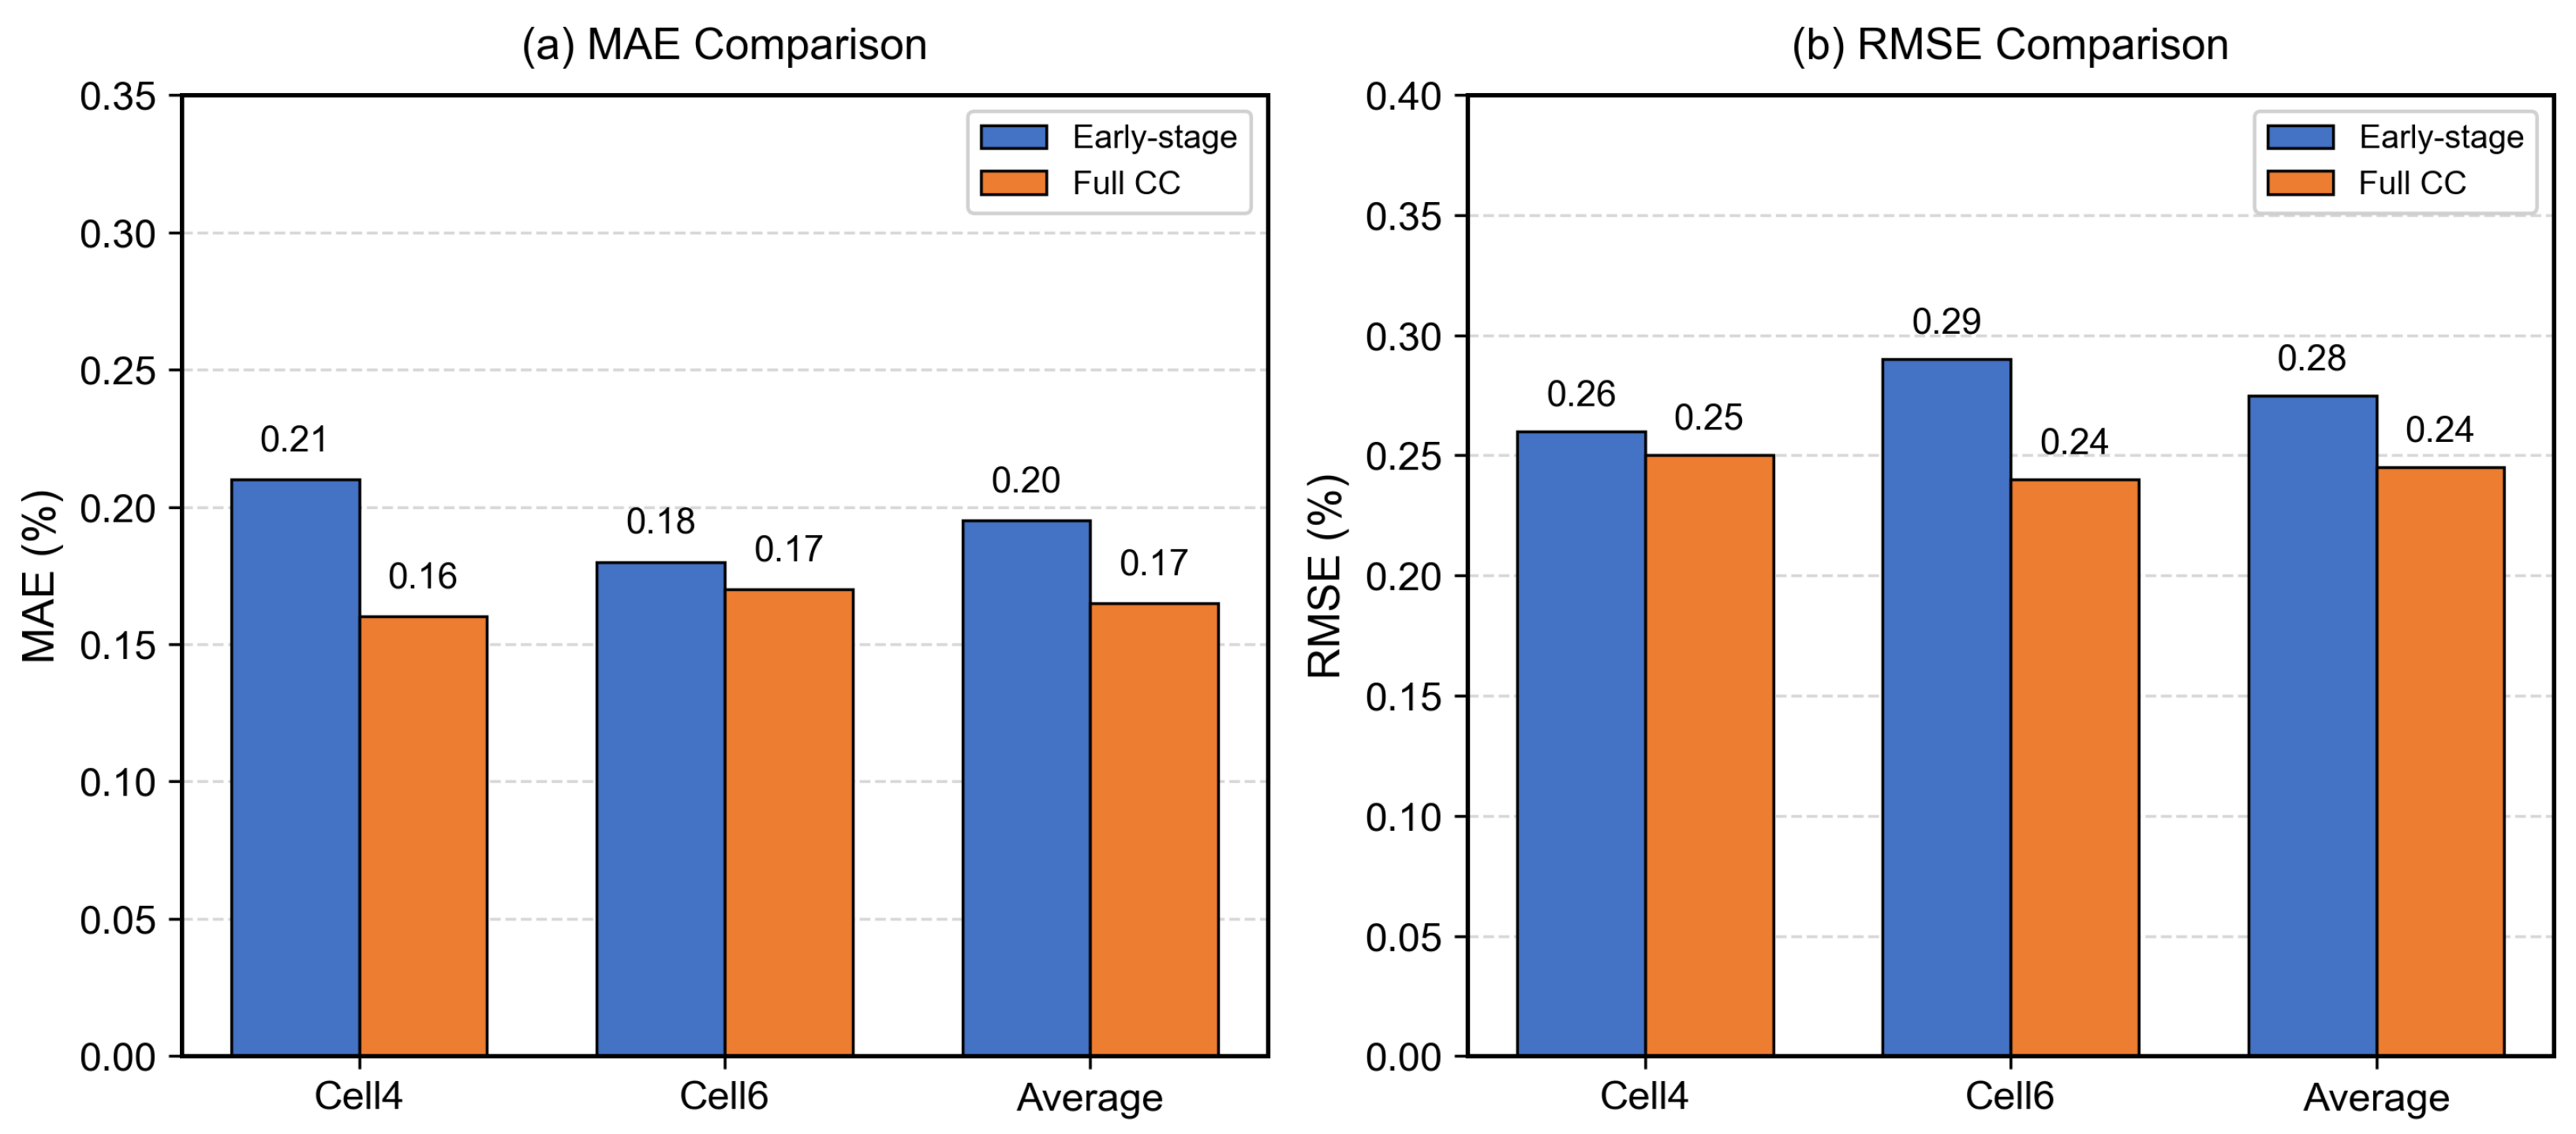
To investigate the impact of input voltage segment length on SOH estimation performance, comparative experiments are conducted on the Oxford dataset using the proposed DM-MoKAN model with two input configurations: early-stage charging data (0–1500 s) and full constant-current (CC) charging data. As shown in Figure 9, using the full CC charging voltage achieves approximately 15% lower MAE and 14% lower RMSE on average compared to the early-stage segment, indicating that longer charging segments provide additional degradation information that benefits SOH estimation. Meanwhile, the early-stage segment already delivers competitive accuracy, indicating that the initial 0–1500 s provides sufficient degradation-related information to support reliable SOH estimation.
Figure 9.
Comparison of SOH estimation performance using early-stage (0–1500 s) and full CC charging voltage segments on the Oxford dataset.
From a practical perspective, the early-stage approach reduces data acquisition time since only the initial portion of charging needs to be recorded, and it is compatible with opportunity-charging scenarios where batteries may not be fully charged, enabling faster on-board SOH diagnosis without waiting for complete charging cycles. Therefore, the early-stage segment provides a favorable trade-off between estimation accuracy and data acquisition convenience in practical battery management systems. When full CC charging data is available and maximum accuracy is desired, using the full segment can provide further performance gains.
4. Conclusions
This paper proposes a dual-modal mixture of KAN network (DM-MoKAN) for lithium-ion battery SOH estimation based on early-stage charging voltage data. The framework integrates spatial degradation patterns from GADF images and temporal dynamics from raw voltage sequences through collaborative modeling of image and sequence branches. Experimental results show that DM-MoKAN achieves average RMSE of 0.28% and MAE of 0.19% on the Oxford dataset, and RMSE of 0.89% and MAE of 0.71% on the NASA dataset, outperforming all comparison methods. Ablation studies validate the effectiveness of each module. Dual-modal fusion reduces MAE by 17.4% to 42.4% compared to single-modal branches, the ECA attention mechanism reduces MAE by 38.7%, replacing MLP with KAN reduces MAE by 4.2%, and the MoE structure provides an additional 17.4% MAE reduction, resulting in a total improvement of approximately 21% for the MoKAN regression head compared to MLP. Experimental results on both datasets demonstrate that DM-MoKAN has good generalization capability. Future work will explore extending this method to pack-level SOH estimation and investigate SOH estimation based on arbitrary charging segments to accommodate more flexible practical application scenarios.
Author Contributions
Conceptualization, Y.W.; methodology, Z.Z.; software, Z.Z.; validation, Y.W. and Z.Z.; formal analysis, Y.W.; investigation, Z.Z.; writing—original draft preparation, Z.Z.; writing—review and editing, Y.W. and F.Z.; supervision, F.Z. All authors have read and agreed to the published version of the manuscript.
Funding
The work is supported by the Natural Science Foundation of Hunan Province, China, under Grant 2024JJ4069.
Institutional Review Board Statement
Not applicable.
Informed Consent Statement
Not applicable.
Data Availability Statement
The datasets analyzed in this study are publicly available. The Oxford battery degradation dataset is available at the Oxford Research Archive [25]. The NASA battery dataset is available at the NASA Prognostics Data Repository [26].
Acknowledgments
The authors thank Oxford University and NASA Prognostics Center of Excellence for providing the public battery datasets.
Conflicts of Interest
The authors declare no conflicts of interest.
Abbreviations
The following abbreviations are used in this manuscript:
| SOH | State of Health |
| BMS | Battery Management System |
| DM-MoKAN | Dual-Modal Mixture of KAN |
| GADF | Gramian Angular Difference Field |
| GAF | Gramian Angular Field |
| ECA | Efficient Channel Attention |
| KAN | Kolmogorov–Arnold Network |
| MoKAN | Mixture of KAN |
| MoE | Mixture-of-Experts |
| MLP | Multilayer Perceptron |
| CNN | Convolutional Neural Network |
| MHSA | Multi-Head Self-Attention |
| FFN | Feed-Forward Network |
| GAP | Global Average Pooling |
| LN | Layer Normalization |
| FC | Fully Connected Layer |
| GELU | Gaussian Error Linear Unit |
| PAA | Piecewise Aggregate Approximation |
| ECM | Equivalent Circuit Model |
| EM | Electrochemical Model |
| HI | Health Indicator |
| RNN | Recurrent Neural Network |
| LSTM | Long Short-Term Memory |
| IndRNN | Independently Recurrent Neural Network |
| CAE | Convolutional Autoencoder |
| RAE | Recurrent Autoencoder |
| CC–CV | Constant-Current–Constant-Voltage |
| MSE | Mean Squared Error |
| RMSE | Root Mean Square Error |
| MAE | Mean Absolute Error |
| EOL | End of Life |
| PCoE | Prognostics Center of Excellence |
References
- Wang, C.; Wang, S.; Zhou, J.; Qiao, J.; Yang, X.; Xie, Y. A Novel Back Propagation Neural Network-Dual Extended Kalman Filter Method for State-of-Charge and State-of-Health Co-Estimation of Lithium-Ion Batteries Based on Limited Memory Least Square Algorithm. J. Energy Storage 2023, 59, 106563. [Google Scholar] [CrossRef] [Scilit]
- Li, P.; Wu, X.; Grosu, R.; Hou, J.; Ilolov, M.; Xiang, S. Applying Neural Network to Health Estimation and Lifetime Prediction of Lithium-Ion Batteries. IEEE Trans. Transp. Electrif. 2025, 11, 4224–4248. [Google Scholar] [CrossRef] [Scilit]
- Lin, C.; Xu, J.; Jiang, D.; Hou, J.; Liang, Y.; Zou, Z.; Mei, X. Multi-Model Ensemble Learning for Battery State-of-Health Estimation: Recent Advances and Perspectives. J. Energy Chem. 2025, 100, 739–759. [Google Scholar] [CrossRef] [Scilit]
- Cao, N.; Du, H.L.; Lu, J.; Li, Z.; Qiang, Q.; Lu, H. Designing Ionic Liquid Electrolytes for a Rigid and Li-Conductive Solid Electrolyte Interface in High Performance Lithium Metal Batteries. Chem. Phys. Lett. 2025, 866, 141959. [Google Scholar] [CrossRef] [Scilit]
- Liu, Z.; Liu, Y.; Zhang, Y.; Wu, C.; Zhang, S.; Sun, C. Data-driven lithium-ion battery SOH prediction: A novel SHMM-transformer-BiGRU hybrid neural network method. Measurement 2025, 257, 118579. [Google Scholar] [CrossRef] [Scilit]
- Xiong, R.; Wang, S.L.; Takyi-Aninakwa, P.; Jin, S.; Fernandez, C.; Huang, Q.; Hu, W.; Zhan, W. Critical Review on Improved Electrochemical Impedance Spectroscopy-Cuckoo Search-Elman Neural Network Modeling Methods for Whole-Life-Cycle Health State Estimation of Lithium-Ion Battery Energy Storage Systems. Prot. Control Mod. Power Syst. 2024, 9, 75–100. [Google Scholar] [CrossRef] [Scilit]
- Liang, H.; Zhang, P.; Gu, W.; Zhang, Z.; Zhu, W.; Shi, L.; Zheng, M. A lithium battery state of health estimation method based on ridge regression-support vector regression-hidden Markov model with data utilization. Measurement 2025, 257, 118710. [Google Scholar] [CrossRef] [Scilit]
- Wen, J.; Chen, X.; Li, X.; Li, Y. SOH Prediction of Lithium Battery Based on IC Curve Feature and BP Neural Network. Energy 2022, 261, 125234. [Google Scholar] [CrossRef] [Scilit]
- Li, W.; Fan, Y.; Ringbeck, F.; Jöst, D.; Han, X.; Ouyang, M.; Sauer, D.U. Electrochemical Model Based State Estimation for Lithium-Ion Batteries with Adaptive Unscented Kalman Filter. J. Power Sources 2020, 476, 228534. [Google Scholar] [CrossRef] [Scilit]
- Gao, Y.; Liu, K.; Zhu, C.; Zhang, X.; Zhang, D. Co-Estimation of State-of-Charge and State-of-Health for Lithium-Ion Batteries Using an Enhanced Electrochemical Model. IEEE Trans. Ind. Electron. 2022, 69, 2684–2696. [Google Scholar] [CrossRef] [Scilit]
- Tran, M.; Mathew, M.; Janhunen, S.; Panchal, S.; Raahemifar, K.; Fraser, R.; Fowler, M. A Comprehensive Equivalent Circuit Model for Lithium-Ion Batteries, Incorporating the Effects of State of Health, State of Charge, and Temperature on Model Parameters. J. Energy Storage 2021, 43, 103252. [Google Scholar] [CrossRef] [Scilit]
- Wang, Z.; Gladwin, D.T.; Smith, M.J.; Haass, S. Practical State Estimation Using Kalman Filter Methods for Large-Scale Battery Systems. Appl. Energy 2021, 294, 117022. [Google Scholar] [CrossRef] [Scilit]
- Dong, G.; Hua, N.; Chen, H.; Lou, Y. Deep Transfer Learning Enabled State of Health Estimation of Lithium-Ion Battery Using Voltage Sample Entropy under Fast Charging Profiles. IEEE Trans. Transp. Electrif. 2025, 11, 3703–3714. [Google Scholar] [CrossRef] [Scilit]
- Wang, X.; Hu, B.; Su, X.; Xu, L.; Zhu, D. State of Health Estimation for Lithium-Ion Batteries Using Random Forest and Gated Recurrent Unit. J. Energy Storage 2024, 76, 109796. [Google Scholar] [CrossRef] [Scilit]
- Hong, J.; Chen, Y.; Chai, Q.; Lin, Q.; Wang, W. State-of-Health Estimation of Lithium-Ion Batteries Using a Novel Dual-Stage Attention Mechanism Based Recurrent Neural Network. J. Energy Storage 2023, 72, 109297. [Google Scholar] [CrossRef] [Scilit]
- Goh, H.H.; Lan, Z.; Zhang, D.; Dai, W.; Kurniawan, T.A.; Goh, K.C. Estimation of the State of Health (SOH) of Batteries Using Discrete Curvature Feature Extraction. J. Energy Storage 2022, 50, 104646. [Google Scholar] [CrossRef] [Scilit]
- Zhu, C.; Gao, M.; He, Z.; Wu, H.; Sun, C.; Zhang, Z.; Bao, Z. State of Health Prediction for Li-Ion Batteries with End-to-End Deep Learning. J. Energy Storage 2023, 65, 107218. [Google Scholar] [CrossRef] [Scilit]
- Wu, J.; Chen, J.; Feng, X.; Xiang, H.; Zhu, Q. State of Health Estimation of Lithium-Ion Batteries Using Autoencoders and Ensemble Learning. J. Energy Storage 2022, 55, 105708. [Google Scholar] [CrossRef] [Scilit]
- He, T.; Gong, Z. State of Health Estimation for Lithium-Ion Batteries Using a Hybrid Neural Network Model with Multi-Scale Convolutional Attention Mechanism. J. Power Sources 2024, 609, 234680. [Google Scholar] [CrossRef] [Scilit]
- Bai, T.; Wang, H. Convolutional Transformer-Based Multiview Information Perception Framework for Lithium-Ion Battery State-of-Health Estimation. IEEE Trans. Instrum. Meas. 2023, 72, 2523312. [Google Scholar] [CrossRef] [Scilit]
- Lin, M.; Wu, D.; Chen, S.; Meng, J.; Wang, W.; Wu, J. Battery Health Prognosis Based on Sliding Window Sampling of Charging Curves and Independently Recurrent Neural Network. IEEE Trans. Instrum. Meas. 2024, 73, 2505609. [Google Scholar] [CrossRef] [Scilit]
- Mao, B.; Yuan, J.; Li, H.; Li, K.; Wang, Q.; Xiao, X.; Zheng, Z.; Qin, W. Gramian Angular Field-Based State-of-Health Estimation of Lithium-Ion Batteries Using Two-Dimensional Convolutional Neural Network and Bidirectional Long Short-Term Memory. J. Power Sources 2025, 626, 235713. [Google Scholar] [CrossRef] [Scilit]
- Chen, S.-Z.; Liang, Z.; Yuan, H.; Yang, L.; Xu, F.; Fan, Y. A Novel State of Health Estimation Method for Lithium-Ion Batteries Based on Constant-Voltage Charging Partial Data and Convolutional Neural Network. Energy 2023, 283, 129103. [Google Scholar] [CrossRef] [Scilit]
- Guo, W.; Yang, L.; Deng, Z.; Li, J.; Bian, X. Rapid Online Health Estimation for Lithium-Ion Batteries Based on Partial Constant-Voltage Charging Segment. Energy 2023, 281, 128320. [Google Scholar] [CrossRef] [Scilit]
- Birkl, C. Oxford Battery Degradation Dataset 1. In Oxford Research Archive; University of Oxford: Oxford, UK, 2017; Available online: https://ora.ox.ac.uk/objects/uuid:03ba4b01-cfed-46d3-9b1a-7d4a7bdf6fac (accessed on 1 December 2025).
- Saha, B.; Goebel, K. Battery Data Set. In NASA Prognostics Data Repository; NASA Ames Research Center: Moffett Field, CA, USA, 2007. Available online: https://ti.arc.nasa.gov/tech/dash/groups/pcoe/prognostic-data-repository/ (accessed on 1 December 2025).
- Wang, Z.; Oates, T. Imaging Time-Series to Improve Classification and Imputation. In Proceedings of the 24th International Joint Conference on Artificial Intelligence (IJCAI), Buenos Aires, Argentina, 25–31 July 2015; pp. 3939–3945. [Google Scholar]
- Han, K.; Wang, Y.; Tian, Q.; Guo, J.; Xu, C.; Xu, C. GhostNet: More Features from Cheap Operations. In Proceedings of the IEEE/CVF Conference on Computer Vision and Pattern Recognition (CVPR), Seattle, WA, USA, 13–19 June 2020; pp. 1577–1586. [Google Scholar]
- Wang, Q.; Wu, B.; Zhu, P.; Li, P.; Zuo, W.; Hu, Q. ECA-Net: Efficient Channel Attention for Deep Convolutional Neural Networks. In Proceedings of the IEEE/CVF Conference on Computer Vision and Pattern Recognition (CVPR), Seattle, WA, USA, 13–19 June 2020; pp. 11534–11542. [Google Scholar]
- Nie, Y.; Nguyen, N.H.; Sinthong, P.; Kalagnanam, J. A Time Series is Worth 64 Words: Long-Term Forecasting with Transformers. In Proceedings of the 11th International Conference on Learning Representations (ICLR), Kigali, Rwanda, 1–5 May 2023. [Google Scholar]
- Liu, Z.; Wang, Y.; Vaidya, S.; Ruehle, F.; Halverson, J.; Soljačić, M.; Hou, T.Y.; Tegmark, M. KAN: Kolmogorov–Arnold Networks. arXiv 2024, arXiv:2404.19756. [Google Scholar]
- Zhang, Y.; Cai, J.; Wu, Z.; Wang, P.; Ng, S.-K. Mixture of Experts as Representation Learner for Deep Multi-View Clustering. In Proceedings of the 39th AAAI Conference on Artificial Intelligence (AAAI 2025), Philadelphia, PA, USA, 25 February–4 March 2025; pp. 22704–22713. [Google Scholar]

Disclaimer/Publisher’s Note: The statements, opinions and data contained in all publications are solely those of the individual author(s) and contributor(s) and not of MDPI and/or the editor(s). MDPI and/or the editor(s) disclaim responsibility for any injury to people or property resulting from any ideas, methods, instructions or products referred to in the content. |
© 2026 by the authors. Licensee MDPI, Basel, Switzerland. This article is an open access article distributed under the terms and conditions of the Creative Commons Attribution (CC BY) license.