


Abstract
Tree-induced single-phase high-impedance faults (THIFs) threaten the reliability of distribution networks because their fault currents typically fall below the operating thresholds of conventional overcurrent relays. Accurately identifying tree species based on fault records is crucial for implementing differentiated vegetation management; however, the limited size of sample sets obtained from field experiments leads to severe overfitting in deep learning models. This paper proposes a framework that integrates physics-guided and data-driven approaches. First, a branch utilizing manually designed physical features extracts time-domain and frequency-domain metrics, while a MiniRocket branch captures multi-resolution temporal patterns. A bootstrap-based stability selection procedure is employed to retain discriminative features, and a rigorous “leave-one-file-out” cross-validation (LOFO-CV) scheme is used to train a strongly regularized Ridge classifier. Additionally, ablation studies are conducted to compare the feature information content at sampling rates of 100 kHz and 10 kHz under the experimental conditions. Finally, a carbonization degradation index (CDI) threshold is proposed. Experiments involving 37 fault records across five tree species demonstrate that the Hybrid + Ridge method achieves a file-level F1 score of 97.3%, achieving a file-level F1 of 97.3%, higher than standalone handcrafted features and MiniRocket.
1. Introduction
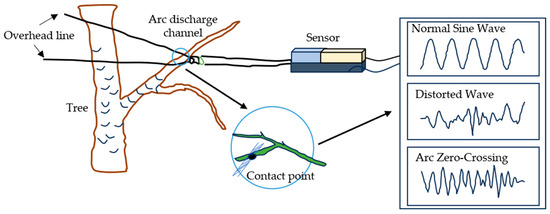
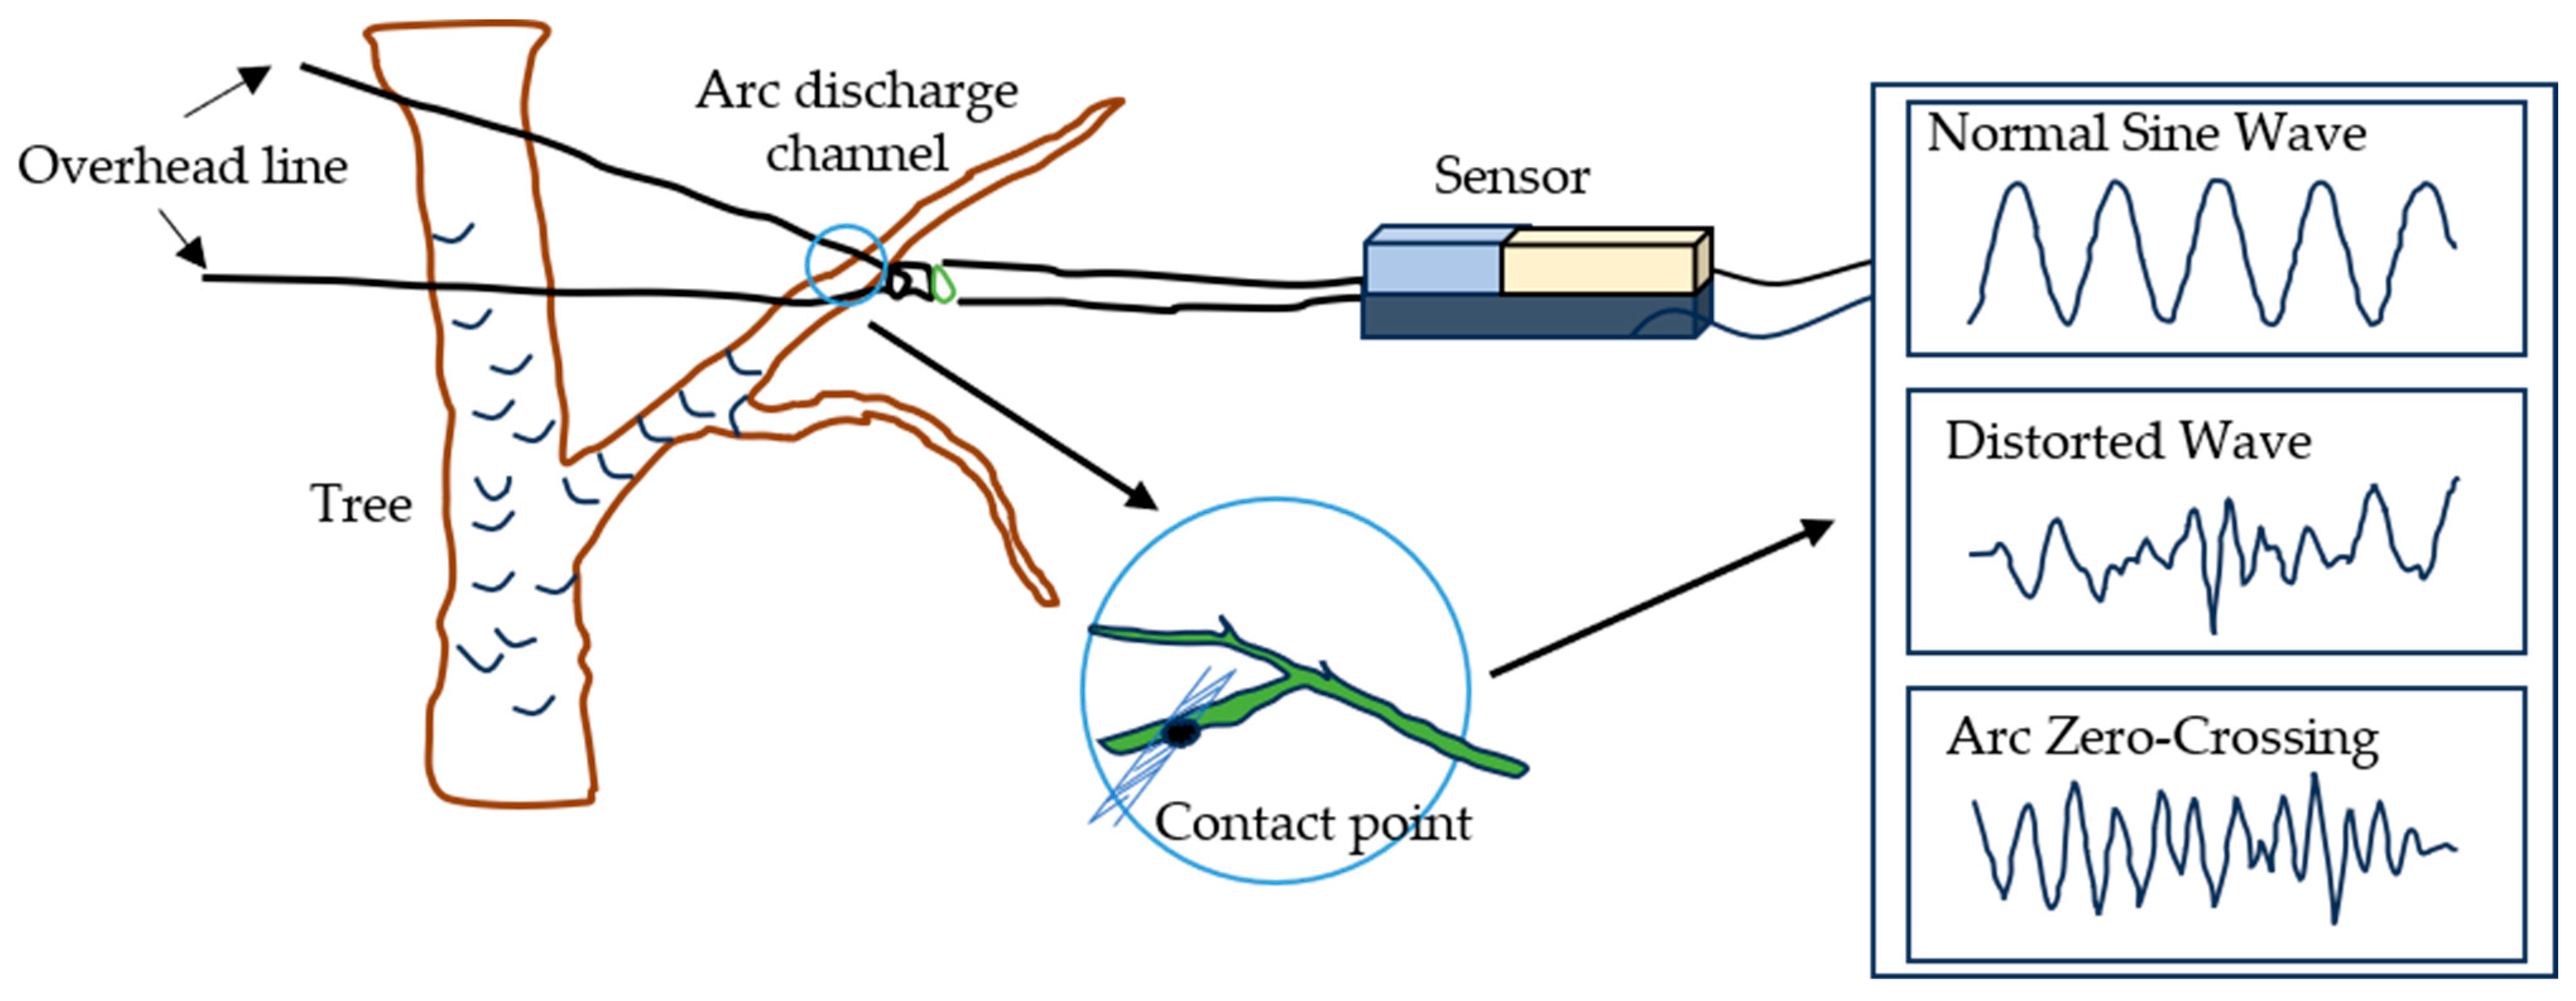
Contact between vegetation and overhead conductors is one of the leading causes of single-phase high-impedance faults (THIFs) in medium-voltage distribution networks [1,2,3]. Unlike metallic ground faults, THIFs exhibit extremely high transition resistance—often reaching hundreds of kilo-ohms—and fault currents that remain below the activation thresholds of conventional overcurrent relays [4,5]. The resulting sustained arcing not only poses fire risks but also induces gradual insulation degradation, thereby threatening long-term grid safety [6]. The physical mechanism of a tree-caused high-impedance fault is schematically shown in Figure 1.
Figure 1.
Physical mechanism of tree-caused high-impedance fault.
Tree species identification from fault recordings is a particularly challenging yet practically valuable problem. Different tree species possess distinct anatomical structures, moisture contents, and electrical conductivities, which fundamentally alter the dynamic behavior of fault impedance [7].
For instance, broadleaf species with high moisture contents (e.g., willow and poplar) tend to exhibit gradual carbonization paths with sustained low-amplitude arcing, whereas coniferous species with lower moisture contents (e.g., pine) often display intermittent arc reignition characterized by pronounced shoulder distortions in the current waveform [8]. Therefore, accurate species-level diagnosis can enable differentiated vegetation management strategies, ranging from prioritized pruning schedules to predictive risk zoning, rather than treating all vegetation contacts uniformly [9].
Despite its practical importance, tree species identification from THIF waveforms faces formidable methodological barriers.
Small-sample constraints. Field experiments requiring live-line tree contact are dangerous, expensive, and subject to strict safety regulations. Consequently, publicly available datasets are exceedingly rare, with typical studies operating on fewer than 40 fault files [10]. Under such constraints, deep learning architectures—including convolutional neural networks (CNNs), long short-term memory (LSTM) networks, and temporal convolutional networks (TCNs)—are prone to severe overfitting [11,12]. Few-shot learning surveys further emphasize that time-series classifiers with millions of parameters require hundreds of samples per class to avoid memorization [13]. Online few-shot adaptations remain underexplored for fault waveforms [14]. Moreover, a recent study on nuclear-plant fault diagnosis demonstrated that temporal convolutional networks (TCNs) trained on small source domains achieve near-perfect training accuracy yet fail catastrophically on target-domain tests because of memorization rather than generalization [15].
Physical blindness of data-driven models. MiniRocket, a state-of-the-art time-series classifier based on random convolutional kernels [16,17], has gained popularity for its computational efficiency and competitive accuracy on large-scale benchmarks, such as the UCR archive [18,19], as well as on multivariate time-series classification tasks [20]. Subsequent variants such as MultiRocket [21] and Hydra [22] improve accuracy on large-scale benchmarks by expanding the feature space; however, this expansion exacerbates the curse of dimensionality under small-sample constraints [23]. However, MiniRocket kernels are initialized randomly without domain knowledge, and its proportion-of-positive-values (PPV) features discard amplitude information entirely [24]. In power system fault diagnosis, where physical quantities such as harmonic distortion rates and arc reignition frequencies carry explicit species-related information, such physical blindness fundamentally limits discriminative power under small-sample conditions.
Existing studies lack rigorous validation of manually designed features, and the complementarity between these and data-driven features remains unquantified [25,26,27,28]. To address this, this paper proposes a physics-guided feature fusion framework. Through leave-one-file-out cross-validation, the recognition performance of manually designed features, MiniRocket features, and hybrid features was compared; results showed that using only manually designed features yielded an F1 score 9% higher than that of MiniRocket. The study elucidated the complementary roles of global and local features during fusion under bootstrap selection and constructed a fault recognition model based on feature fusion, achieving a file-level F1 score of 97.3%. This overcomes the limitations of single-feature recognition capabilities, enabling accurate identification of vegetation-induced faults. Ablation experiments revealed the critical role of a 100 kHz sampling rate in model performance, noting a significant performance drop when downsampling to 10 kHz. Analysis based on physical feature metrics identified the 50 Hz grounding current amplitude as the core discriminant criterion, while the high-frequency voltage ratio serves as a unique recognition fingerprint for faults caused by black locust trees. Finally, a carbonization degradation index and corresponding graded application rules were developed to address samples misclassified due to carbonization.
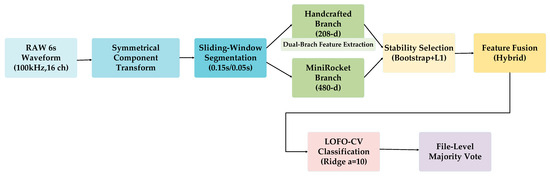
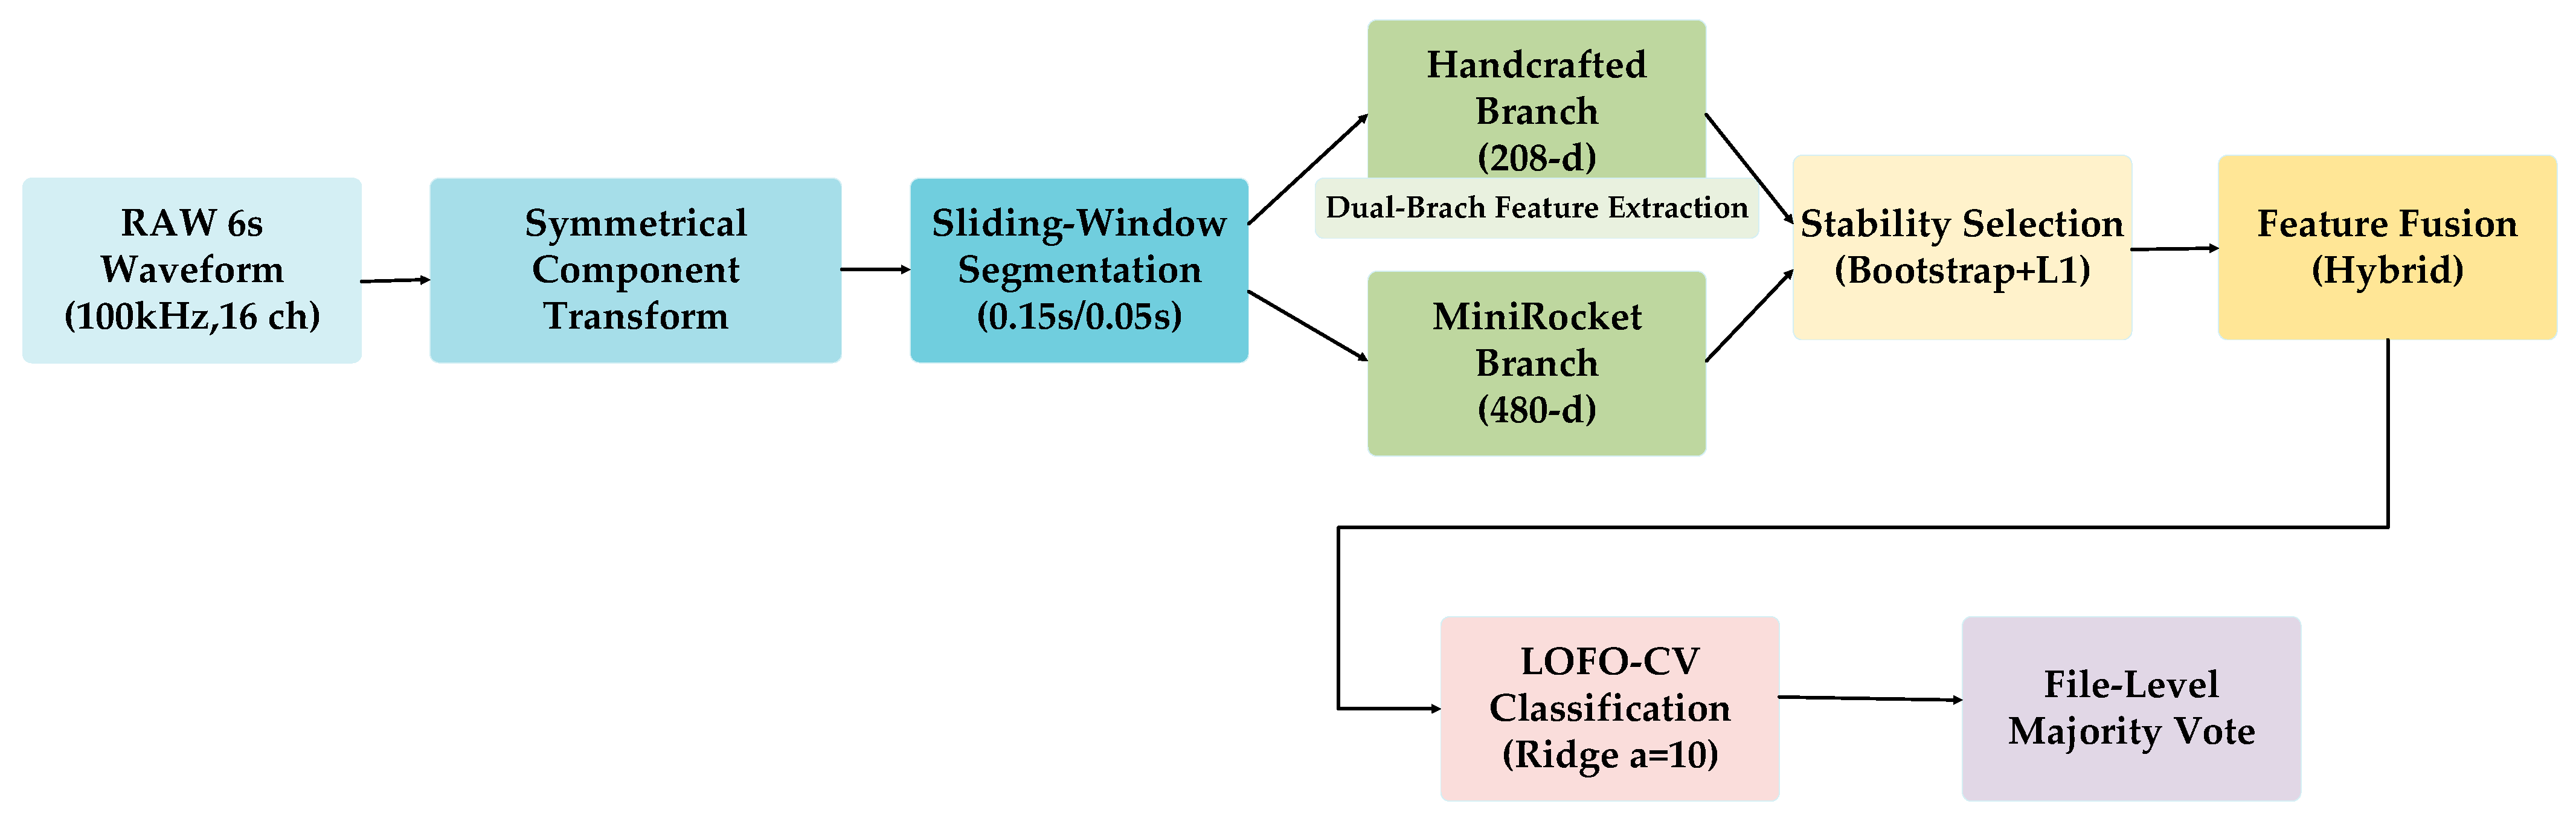
The overall framework of the proposed method is shown in Figure 2.
Figure 2.
Overall framework of the proposed physics-guided and data-driven fusion method.
2. Materials and Methods
2.1. Problem Formulation and Notation
Consider a dataset of fault recordings from tree species. Each recording corresponds to a single experimental file indexed by (here ), with a species label . The raw waveform of file is a matrix:
where is the number of time samples at sampling rate and denotes the raw electrical channels: .
The goal is to learn a classifier that maps a file-level feature representation to the species label , evaluated under strict LOFO-CV where all windows from file are held out during training.
2.2. Data Preprocessing
2.2.1. Symmetrical Component Transformation
Because the fault phase is not fixed across experiments (phases A, B, or C may contact the tree) [29], phase-dependent raw quantities are transformed into phase-independent symmetrical components at each time instant:
where . The magnitudes are appended to the 12 raw channels, yielding a 16-channel matrix . Detailed physical explanations of these 16 channels are provided in Appendix A.
2.2.2. Sliding-Window Segmentation
To augment the effective sample size while preserving temporal locality, each 6 s recording was segmented via sliding windows [30]:
where window length is samples and step size is samples. Each file yields approximately windows. Crucially, all windows from the same file share the same label and file ID, which ensures that LOFO-CV operates at the file level rather than the window level, thereby preventing information leakage.
Data augmentation was applied only to training windows within each LOFO-CV fold: Gaussian noise ( of the channel standard deviation) and amplitude scaling () are added to simulate sensor errors and varying ground resistances [31]. Validation and test windows are never augmented.
For the 10 kHz analysis, the 100 kHz recordings were downsampled by first applying a 6th-order Butterworth low-pass anti-aliasing filter (cutoff 4 kHz, i.e., 0.8× the Nyquist frequency of the target rate) prior to 10-fold decimation, implemented via scipy signal butter and scipy signal sosfilt.
2.3. Dual-Branch Feature Extraction
2.3.1. Branch I: Handcrafted Physical Features (208 D)
For each window , a 13-dimensional feature vector was extracted from each channel, yielding . The detailed definitions and formulas of these 13 handcrafted features are listed in Table 1.
Table 1.
Handcrafted physical features.
The frequency-domain features were extracted from the first 2000 samples (20 ms) of each window, which corresponds exactly to one 50 Hz cycle. This integer-cycle window eliminates spectral leakage at the fundamental and harmonic frequencies. A Hanning window was applied to the segment, followed by zero-padding to 4096 points, and the 50 Hz, 150 Hz, 250 Hz, and 350 Hz amplitudes were estimated via parabolic interpolation around the peak magnitude bins. All frequency-domain features reported in this paper were extracted using this procedure.
2.3.2. Branch II: MiniRocket Temporal Features (480 D)
MiniRocket extracts proportion-of-positive-values (PPV) features via random convolutional kernels. Extensions of MiniRocket and related convolution-kernel transforms have also been successfully applied to multivariate time-series data [32]. To ensure reproducibility and memory safety under the large window size, a lightweight in-house implementation was adopted:
where is a random zero-mean kernel, is the dilation factor, is a bias estimated from training-set quantiles, and denotes the channel-averaged convolution output.
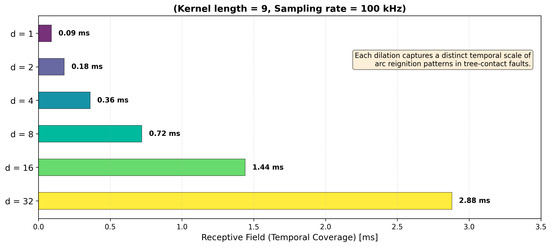
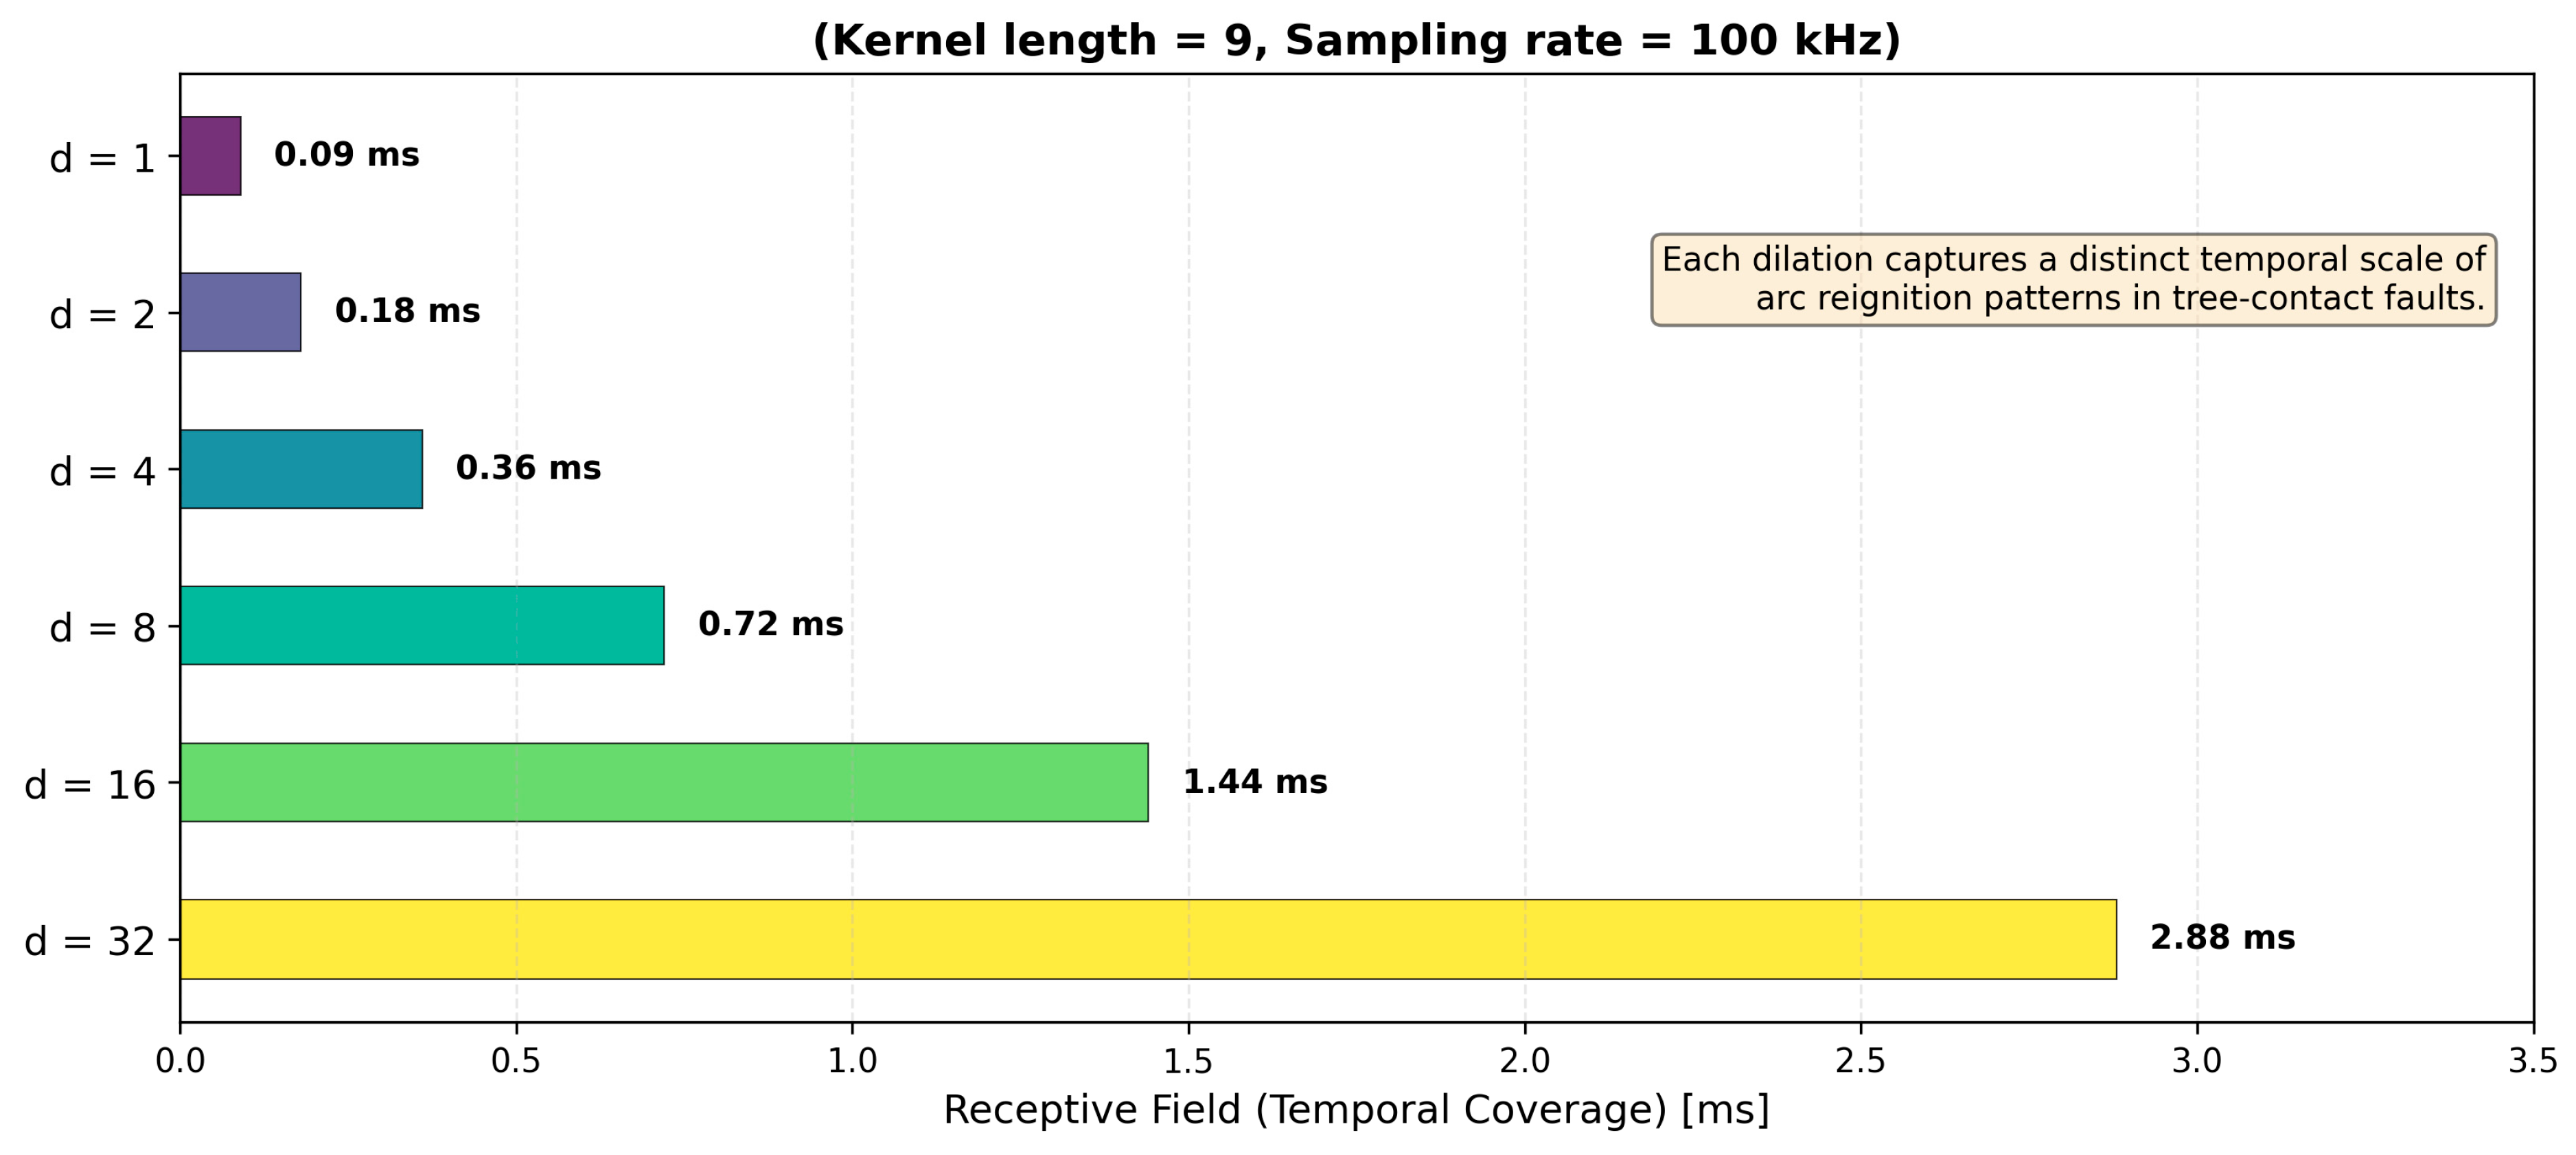
The multi-resolution design comprises two sampling-rate branches. The 100 kHz branch uses dilation factors [1, 2, 4, 8, 16, 32], while the 10 kHz branch uses [1, 1, 1, 1, 1, 3] to preserve comparable absolute temporal coverage. The final configuration uses 40 kernels per dilation with a kernel length of 9, yielding 240 PPV features per branch and 480 MiniRocket features in total. The complete configuration is summarized in Table A2. The multi-resolution kernel coverage is illustrated in Figure 3.
Figure 3.
Multi-resolution kernel coverage of MiniRocket.
The kernel length of 9 samples corresponds to 0.09 ms at 100 kHz and provides a balance between sensitivity to short arc transients and robustness to noise. The 100 kHz dilation factors [1, 2, 4, 8, 16, 32] provide receptive fields ranging from 0.09 ms to 2.9 ms, covering short-scale reignition fluctuations and longer arc-shoulder patterns observed in the recordings.
A sensitivity analysis was conducted to assess the robustness of the selected configuration. Reducing the number of kernels per dilation from 40 to 20 resulted in only a 1.0% decrease in File-F1, whereas 10 kernels led to a 9.4% decrease. These results indicate that the 20-kernel configuration provides performance comparable to the 40-kernel configuration, while further reduction to 10 kernels substantially degrades performance. The 40-kernel configuration was retained for the final experiments to preserve the higher observed performance. Kernel length was also evaluated: reducing the length to 7 resulted in a 10.5% decrease in File-F1, whereas increasing it to 11 caused a 2.4% decrease. In addition, the full dilation set [1, 2, 4, 8, 16, 32] outperformed the truncated set [1, 2, 4, 8, 16] by 2.9% in File-F1. These results support the use of a kernel length of 9, 40 kernels per dilation, and the full six-factor dilation set in the final experiments.
2.4. Strictly Nested Feature Selection and Preprocessing Pipeline
Three classifiers were evaluated using the fused feature space: Ridge, Linear-SVM, and RBF-SVM. Ridge was included for its L2 regularization and suitability for small-sample settings, while Linear-SVM and RBF-SVM provided linear and nonlinear maximum-margin baselines, respectively [33,34].
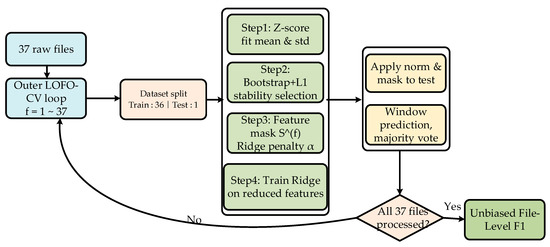
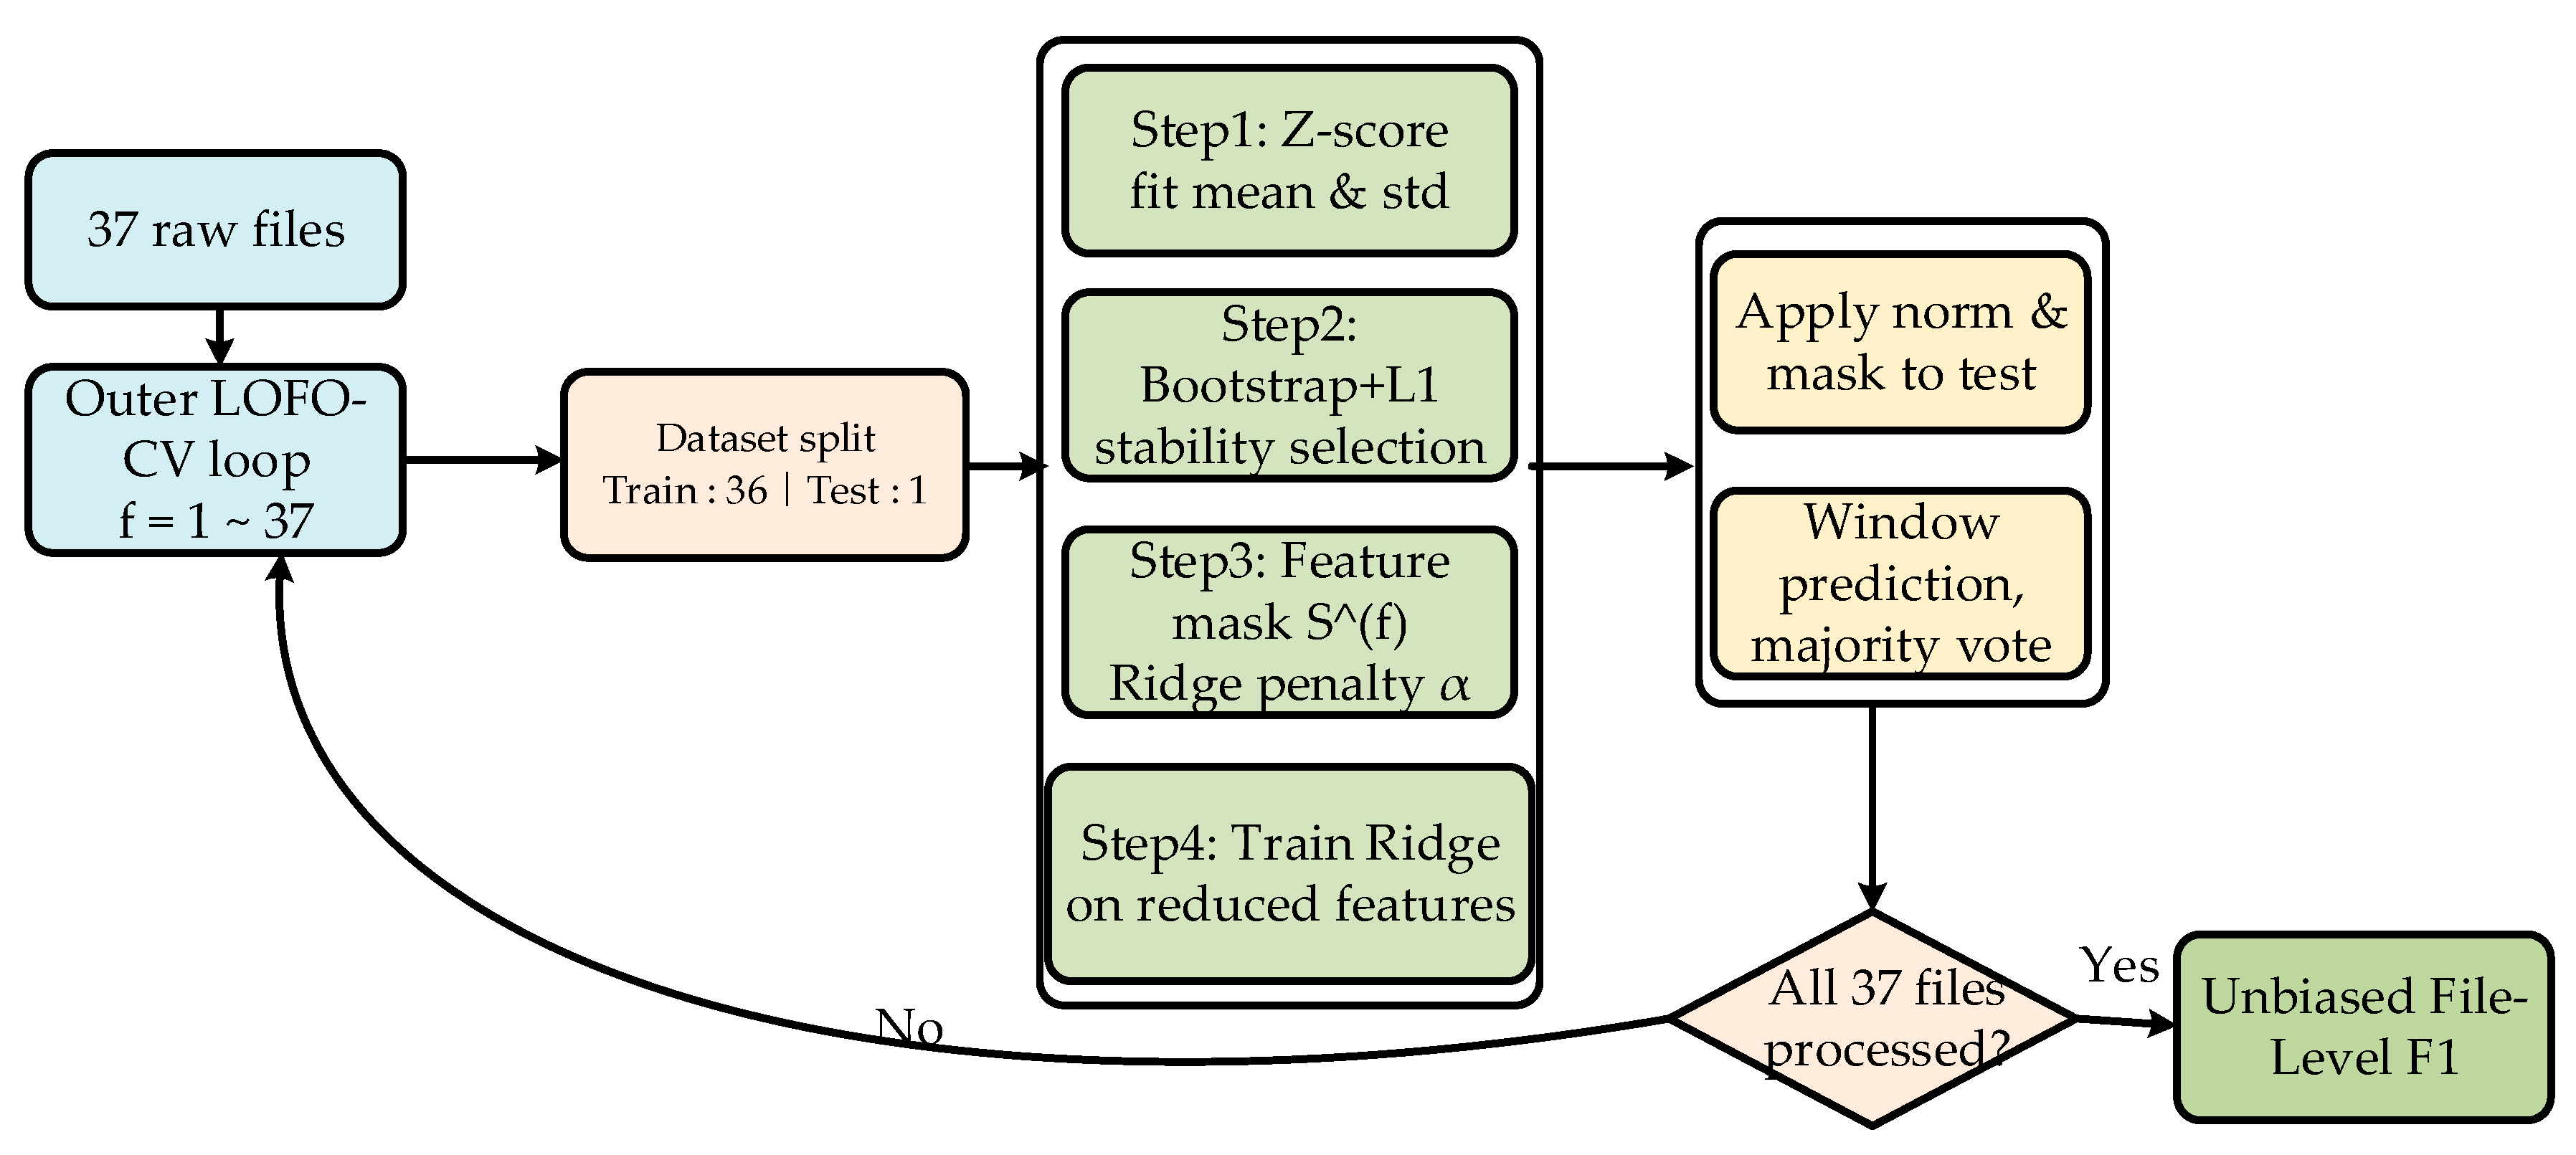
To prevent data leakage, all preprocessing, feature selection, and model training procedures were strictly nested within the leave-one-file-out cross-validation (LOFO-CV) loop [35]. In each outer fold, one file was held out for testing and the remaining 36 files were used for training. Z-score normalization parameters and the bootstrap-based L1 stability-selected feature mask [31] were derived exclusively from the training files. The stability-selection procedure included an internal 3-fold GroupKFold intersection to improve feature robustness.
Unless otherwise stated, all architecture hyperparameters were fixed before the main LOFO-CV evaluation and were not re-tuned within any LOFO fold. Some of these hyperparameters were selected during exploratory sensitivity analysis on the full 37-file dataset, whereas the stability-selection parameters were applied only within each training fold.
The Ridge regularization parameter was selected as α = 10 during a preliminary development stage using the pre-specified 25-training-file/5-validation-file partition shown in Table 2. The validation files were used only for this preliminary hyperparameter selection, while the seven files designated as the original test set were excluded from tuning. After α = 10 was selected, it was fixed throughout the subsequent strict LOFO-CV experiments. No Ridge hyperparameter was re-tuned using the held-out file in any LOFO fold.
Table 2.
Dataset statistics.
Figure 4 illustrates the nested LOFO-CV framework. File-level accuracy and macro-F1 were used as the primary evaluation metrics, whereas window-level metrics were reported only for reference because windows from the same file are temporally correlated.
Figure 4.
Strictly nested LOFO-CV pipeline.
3. Results
3.1. Experimental Setup
3.1.1. Dataset Description
The field experiments were conducted on a 10 kV distribution-network test platform. Five tree species commonly found near overhead lines in northern China were selected, maple (Acer), locust (Sophora), elm (Ulmus), persimmon (Diospyros), and pine (Pinus), yielding a total of 37 fault files. Each file contains six seconds of fault data sampled at 100 kHz. The original CSV headers are as follows: .
To ensure zero information leakage, the dataset was strictly partitioned by the original experiment files into training, validation, and test sets using the suffixes _tra, _val, and _tes. All 37 files were pooled and evaluated under a leave-one-file-out cross-validation (LOFO-CV) protocol [36]: in each fold, all windows belonging to a single file were held out as the test set, whereas windows from all remaining files constituted the training set. The final file-level label was determined by majority voting across all windows of the held-out file. The species-wise file counts and dataset split statistics are summarized in Table 2.
3.1.2. Evaluation Metrics
Given the small variation in the number of classes (8/7/7/8/7 files) and the multi-class nature of the task, both window-level and file-level accuracy and macro-F1 metrics are reported.
Because the dataset contains only 37 files, point estimates of file-level F1 alone can be misleading. To quantify the sampling uncertainty, we report 95% confidence intervals (CIs) for the file-level macro-F1 using the bootstrap percentile method (B = 1000 replicates). In each replicate, the 37 LOFO-CV folds were resampled with replacement, the Macro-F1 was recomputed from the resampled file-level predictions, and the 2.5th and 97.5th percentiles of the resulting distribution defined the CI.
All metrics are computed under the LOFO-CV to guarantee statistical rigor.
3.1.3. Baseline Methods
To validate the necessity of each proposed component, the following baselines were established.
- Random guess: a theoretical lower bound (for 5-class uniform).
- Majority class: always predicting the most frequent class.
- MiniRocket + Ridge: standalone MiniRocket features (480 d) with a Ridge classifier.
- Handcrafted + Ridge: standalone handcrafted physical features (208 d or 156 d) with a Ridge classifier.
- Hybrid variants: concatenation of handcrafted and MiniRocket features, combined with Ridge, LinearSVM, or RBF-SVM.
All classifiers were standardized (zero-mean, unit-variance) on the training fold. The Ridge regularization parameter was set to by default; an ablation study on was also conducted.
3.2. Main Results: Single-Source vs. Fusion
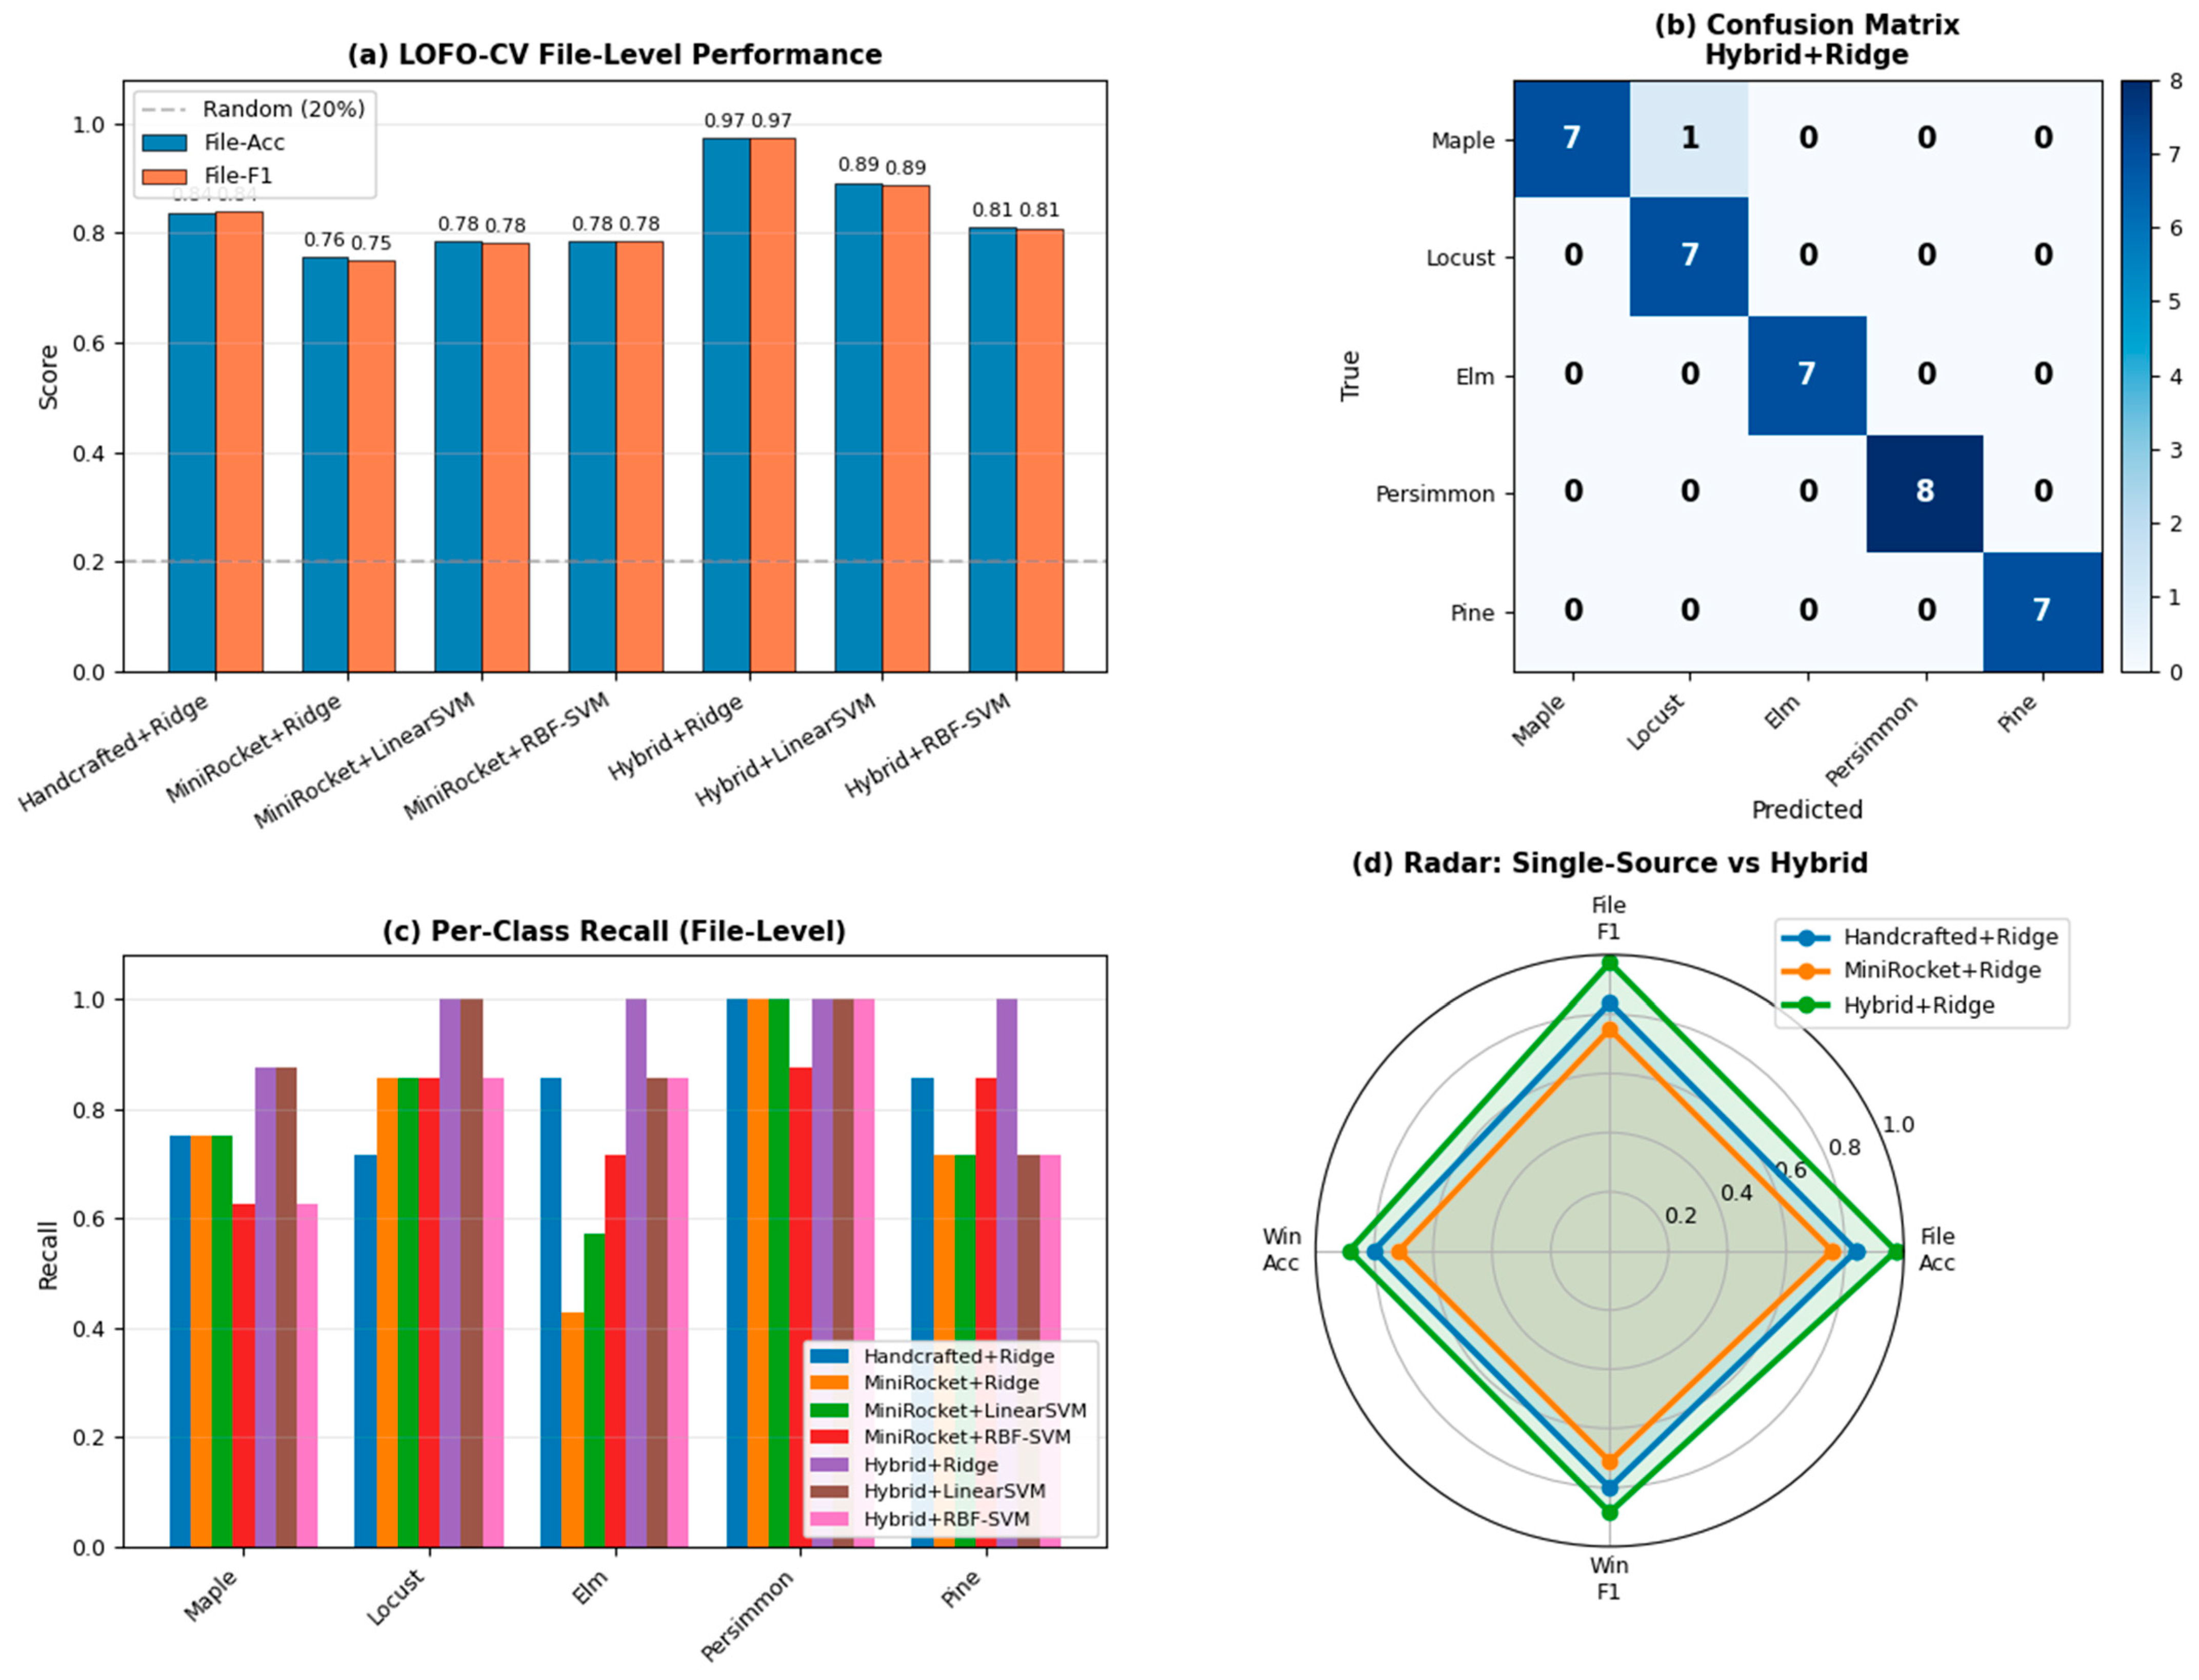
Table 3 presents the LOFO-CV file-level performance of all compared methods. The proposed Hybrid + Ridge achieved the highest file-level accuracy and macro-F1 of 0.973 (36 out of 37 files correctly classified), surpassing the standalone handcrafted baseline by 10.8 percentage points and the standalone MiniRocket baseline by 22.3 percentage points.
Table 3.
LOFO-CV performance comparison (file-level).
Several critical observations emerge from Table 3.
- Handcrafted features alone are surprisingly effective (86.5% File-F1), confirming that physical quantities such as the fundamental amplitude and harmonic distortion carry strong species-discriminative information.
- MiniRocket alone underperforms (75% File-F1), indicating that random convolutional kernels without domain guidance struggle to generalize under extreme small-sample conditions.
- RBF-SVM on Hybrid features degrades compared with Ridge, suggesting that the high-dimensional Hybrid space (688 d) with only approximately 30 training files per fold induces severe overfitting in nonlinear kernel classifiers. Linear models with strong L2 regularization are markedly more robust.
- The 95% CIs in Table 3 reveal substantial sampling uncertainty for standalone methods. Handcrafted + Ridge spans 0. 744–0.966 (width ≈ 0.22), and MiniRocket + Ridge spans 0.593–0.880 (width ≈ 0.29), reflecting the inherent variance of small-sample estimates. By contrast, the Hybrid + Ridge CI [0.900, 1.000] is markedly tighter (width ≈ 0.10), indicating that the fusion model not only achieves a higher point estimate but also exhibits greater statistical stability.
- Given the small sample size (N = 37 files), a paired McNemar test on the 37 file-level binary outcomes yielded p = 0.125 for Hybrid + Ridge versus Handcrafted + Ridge and p = 0.008 versus MiniRocket + Ridge; however, these tests have limited statistical power.
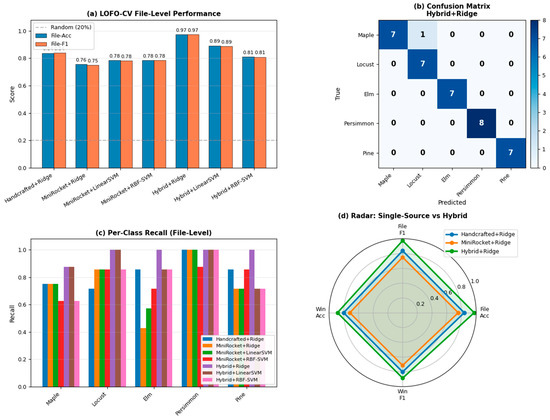
Figure 5 presents the LOFO-CV file-level performance.
Figure 5.
LOFO-CV file-level performance. (a) accuracy and F1 comparison; (b) confusion matrix of Hybrid + Ridge; (c) per-class recall; (d) radar chart of single-source vs. hybrid methods.
3.3. Ablation Study
To dissect the contribution of each architectural component, we conducted systematic ablations under identical LOFO-CV protocols. The results are summarized in Table 4.
Table 4.
Detailed ablation study results under LOFO-CV.
The key findings from the ablation study are as follows.
- (1)
- Sampling rate matters critically.
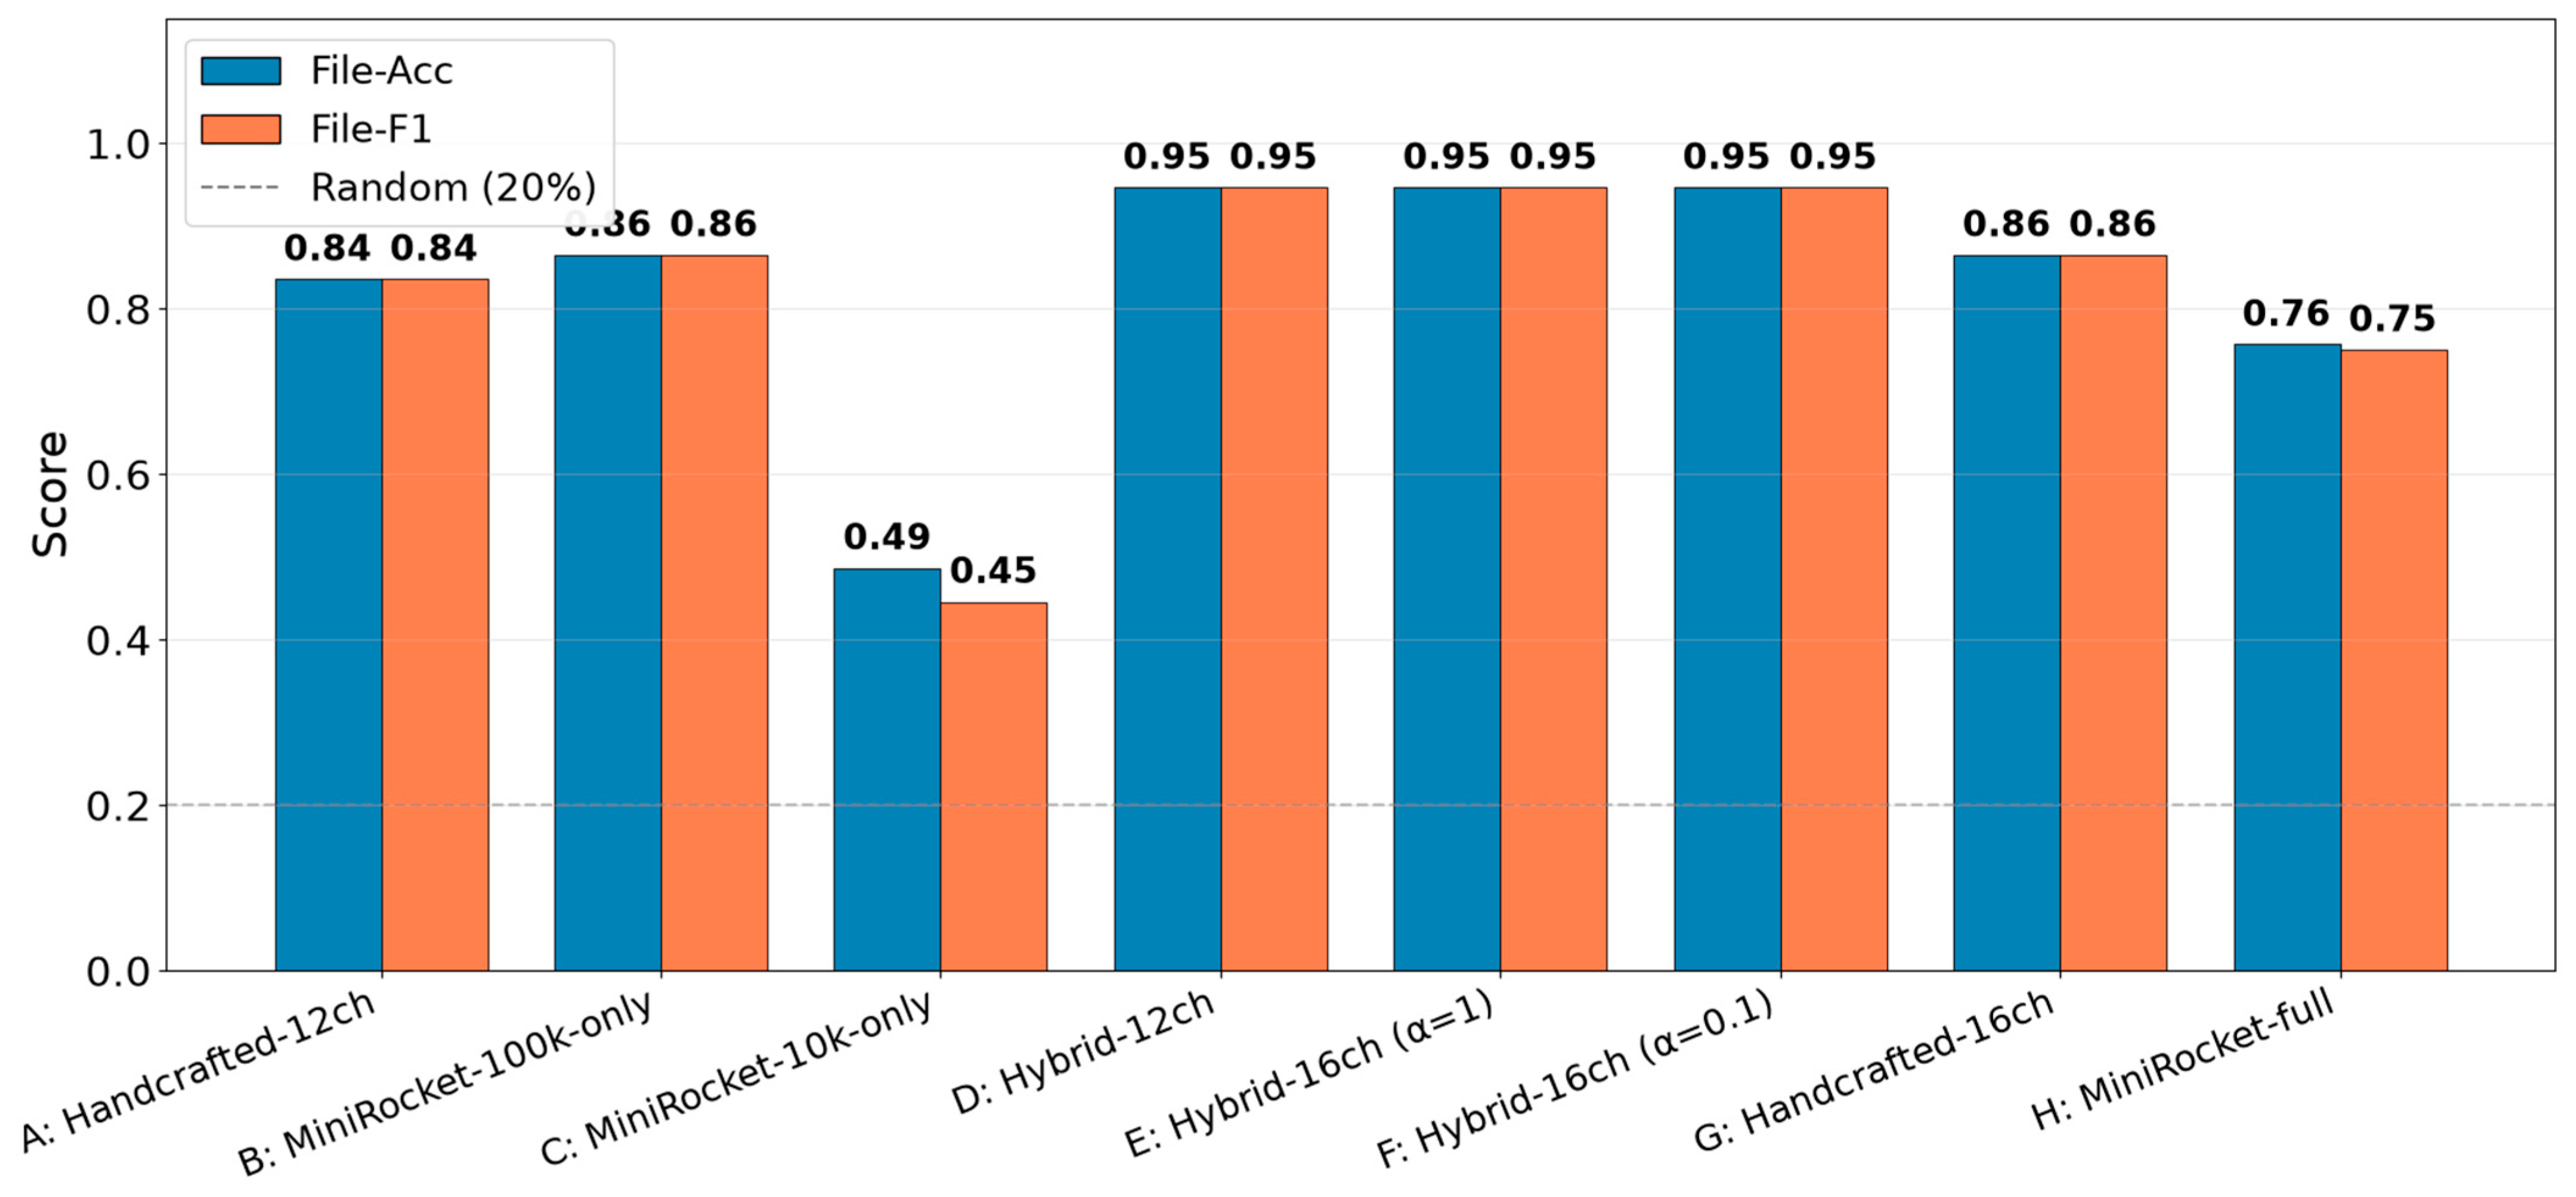
MiniRocket-100k-only achieved 86.5% in file-level F1, whereas MiniRocket-10k-only collapses to 44.6%—near random guessing. This demonstrates that the 10 kHz Nyquist frequency (5 kHz) is insufficient to capture the high-frequency arc noise that encodes species-specific nonlinear conduction patterns. Downsampling to 10 kHz with a 4 kHz anti-aliasing cutoff removes high-frequency arc noise above 4 kHz; the resulting performance drop is therefore consistent with discriminative information being present above the retained bandwidth. However, this experiment alone cannot precisely localize the spectral band responsible for the improvement. A frequency-band ablation with progressively lower cutoff frequencies would be required to substantiate that claim.
- (2)
- Multi-resolution fusion can be harmful without physical compensation.
Interestingly, the full MiniRocket (100k + 10k, 480 d) achieves only 75% File-F1, lower than the 100k-only variant (85%). This implies that the 10k branch introduces spectral aliasing noise or redundant dimensions that dilute the effective 100k features during L1 stability selection. However, when the 10k branch is fused with handcrafted physical features (which provide explicit frequency-domain information such as THD and harmonic ratios), the Hybrid recovers to 97.3%. This validates that handcrafted features compensate for the information loss in the low-resolution branch, enabling true cross-resolution complementarity.
- (3)
- Symmetrical components are non-essential.
Handcrafted-12ch (excluding ) attains 83.6% File-F1, only 2.9% below the 16-channel version, and the Hybrid-12ch matches Hybrid-16ch exactly. This suggests that the raw three-phase voltages and currents already implicitly encode sufficient phase-relationship information for species discrimination; therefore, the explicit symmetrical transformation can be omitted to simplify deployment.
- (4)
- Strong regularization is required.
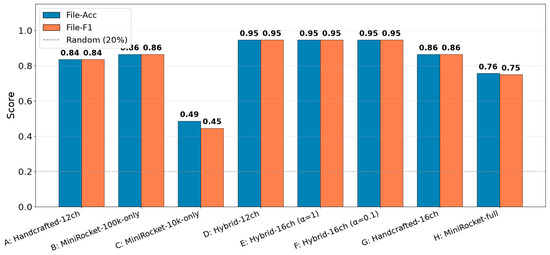
The hybrid model achieves 97.3% with α = 10 but drops to 94.6% with α = 1.0 or α = 0.1. This indicates that the fused feature space benefits from strong L2 regularization in the small-sample regime, where the number of effective features (≈53 after stability selection) approaches the number of training files per fold. The ablation study results are summarized in Figure 6.
Figure 6.
Bar chart comparison of ablation variants under LOFO-CV.
3.4. Interpretability Analysis
To elucidate why the Hybrid model succeeds and what physical mechanisms drive species discrimination, this paper conducted three layers of interpretability analysis.
3.4.1. Group Permutation Importance
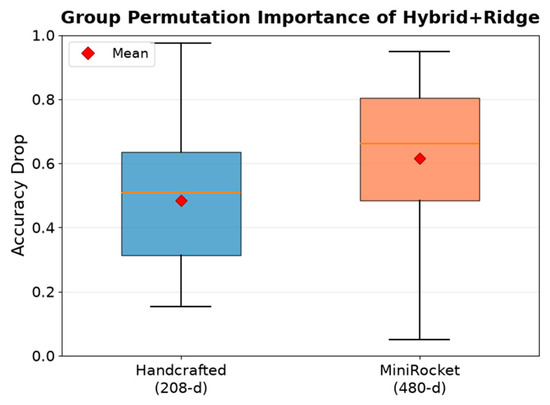
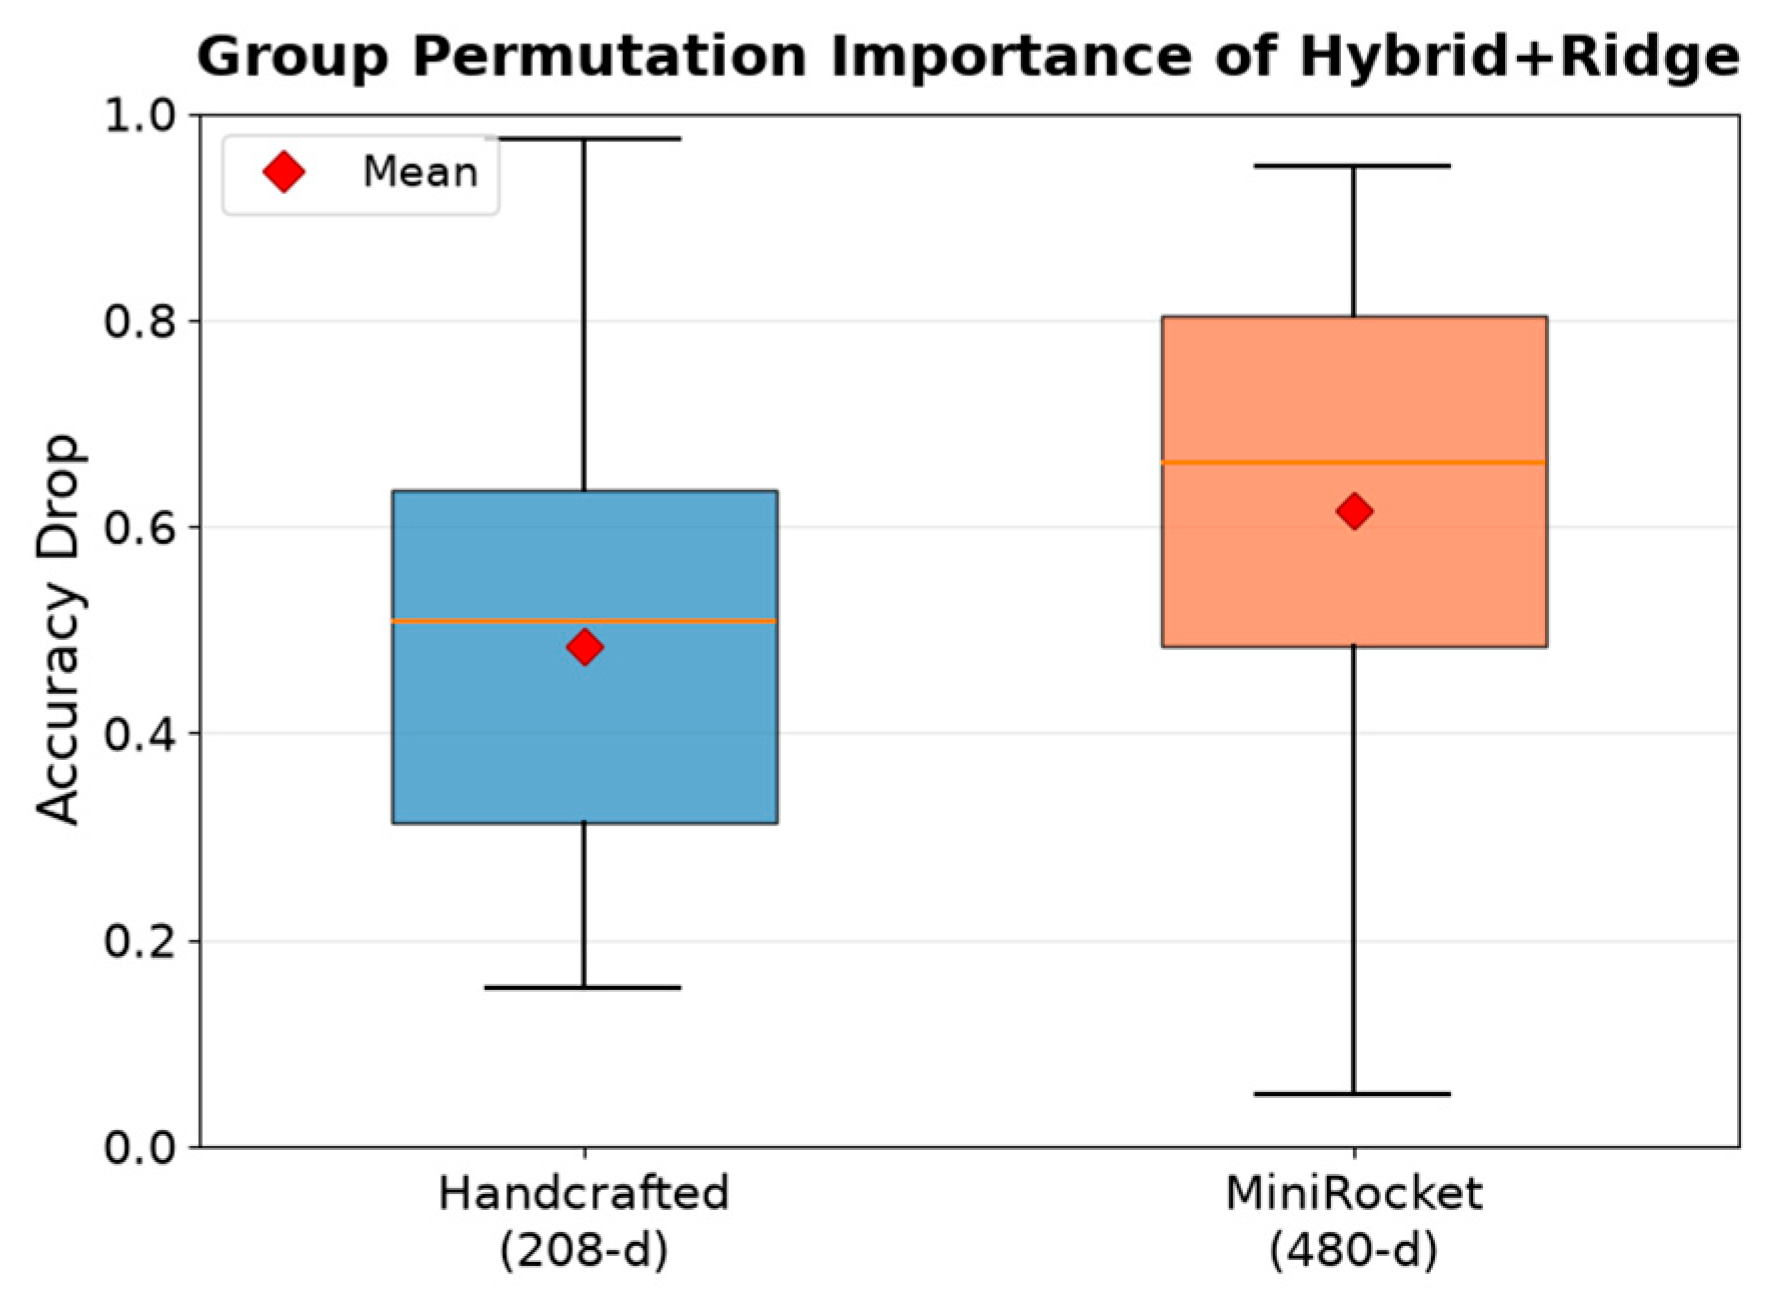
The accuracy drop was caused by permuting (i.e., destroying) the handcrafted block (208 d) versus the MiniRocket block (480 d) within the trained Hybrid + Ridge model. As shown in Figure 7, permuting MiniRocket caused an average accuracy drop of 0.616 ± 0.230, larger than that of the handcrafted block (0.484 ± 0.237). The relatively large standard deviation reflects genuine across-fold variability under the small-sample regime; the consistent ranking (MiniRocket > Handcrafted) across folds supports the robustness of the complementarity finding.
Figure 7.
Group permutation importance of the Hybrid + Ridge model.
The quantitative patterns in the report appear contradictory at first glance. These observations are not contradictory; rather, they reflect structural complementarity between the two branches.
On the one hand, the most discriminative features in each category (Figure 4) are all hand-designed, with the 50 Hz fundamental amplitude of the ground current (channel 9) dominating across all species. On the other hand, the importance of group permutations (Figure 7) shows that permuting the MiniRocket leads to a greater accuracy drop than permuting the hand-designed features (0.484), despite the weaker performance of the MiniRocket alone (75.0% File-F1 compared to 86.5% for hand-designed features). The physical implication of this counterintuitive pattern is that, in the fusion model, the previously weaker independent branches become more critical.
We acknowledge that marginal permutation importance on correlated features may not fully disentangle the contributions of each branch. The complementary mechanism is supported by converging evidence from per-class feature analysis (Figure 8), distribution analysis (Figure 9), and the ablation study (Table 4).
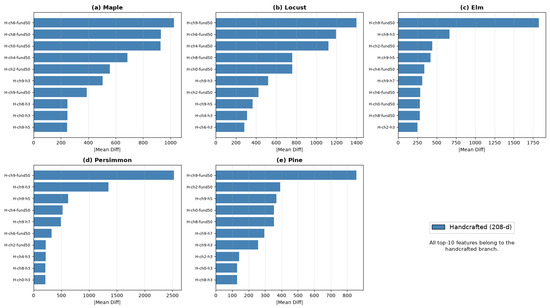
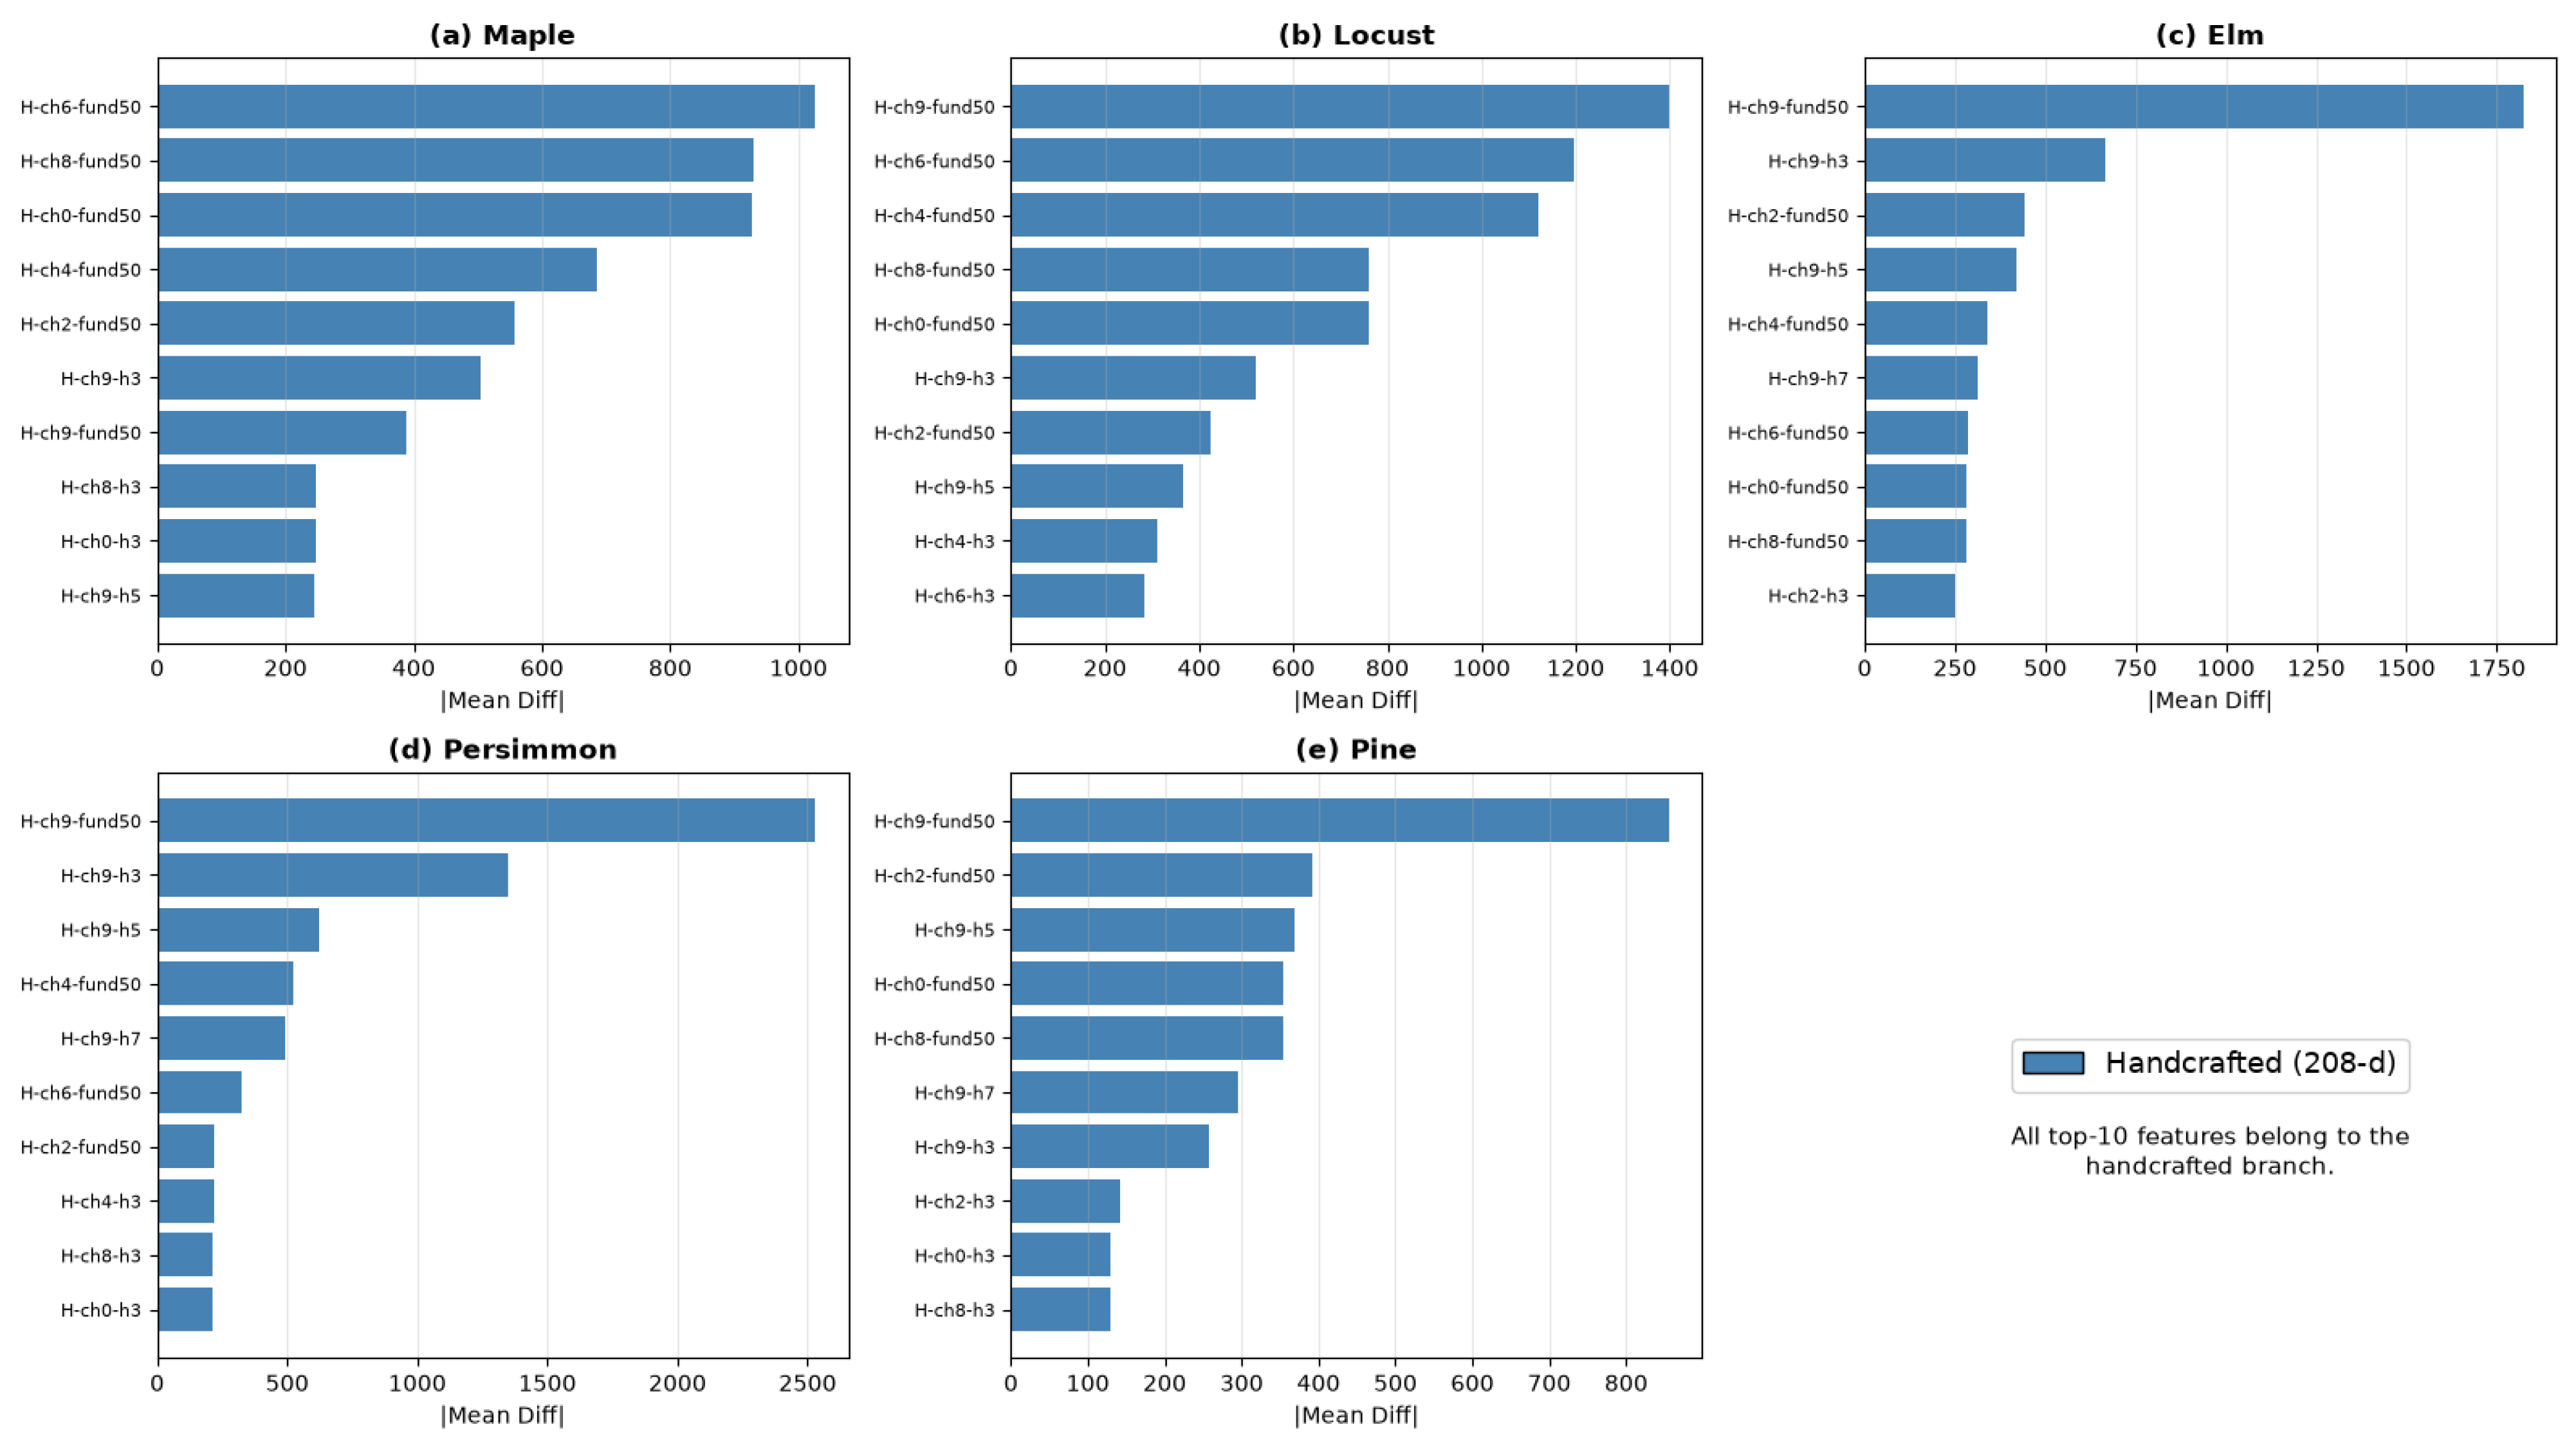
Figure 8.
Top 10 discriminative features per class.
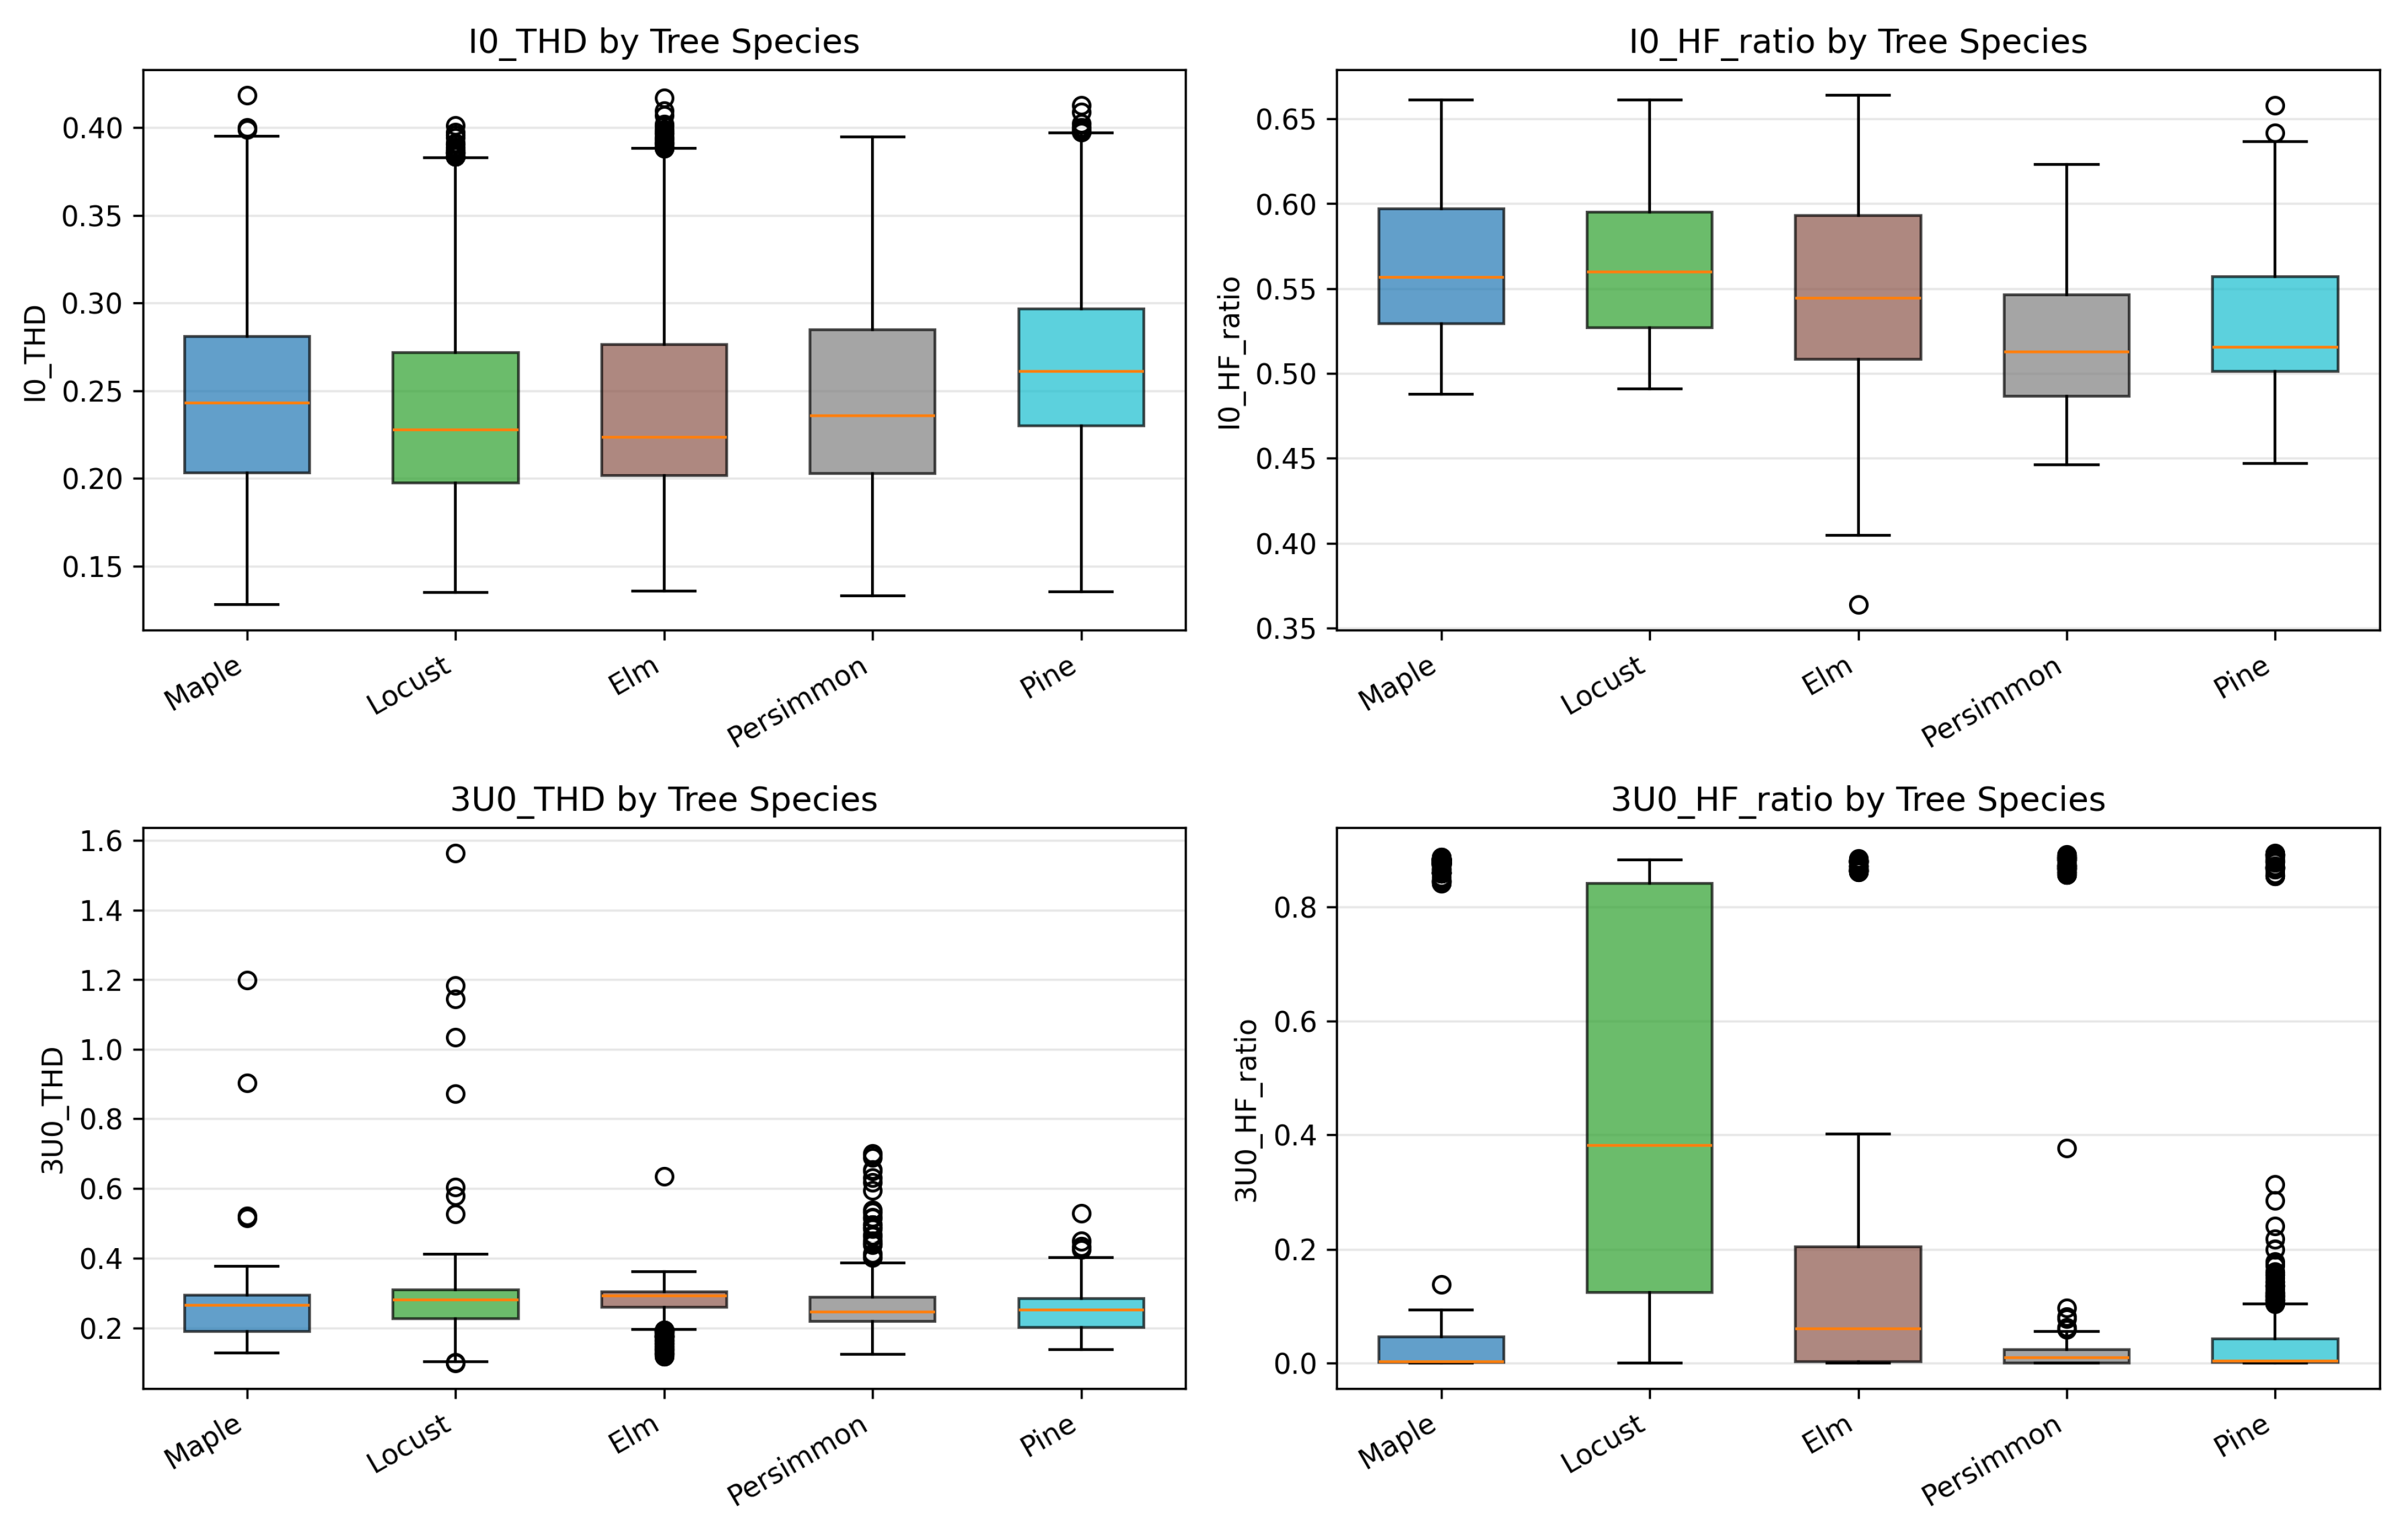
Figure 9.
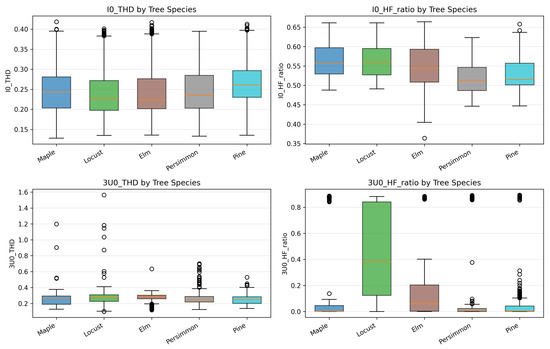
Distribution of key physical features across five tree species.
3.4.2. Per-Class Top Discriminative Features
Figure 8 displays the top 10 features with the largest absolute mean differences between each target class and all the other classes. Strikingly, all the top-ranked features belong to the handcrafted branch (blue bars), with the fundamental 50 Hz amplitude () of the ground current (Channel 9) dominating for every species.
3.4.3. Distribution of Key Physical Quantities
Figure 9 presents boxplots of four critical physical features across the five species. The fundamental 50 Hz amplitude effectively distinguishes persimmon and pine trees (low impedance, high current) from maple and locust trees (high impedance, low current). However, in this coarse-grained physical space, decision boundaries overlap between easily confused species (e.g., maple and locust, both broadleaf deciduous trees with similar moisture ranges). Harmonic descriptors (THD and HF ratios) alone are insufficient to address these overlaps, as evidenced by the significant inter-species overlap in the I0-THD and I0-HF ratio distributions.
3.5. Failure-Mode Analysis
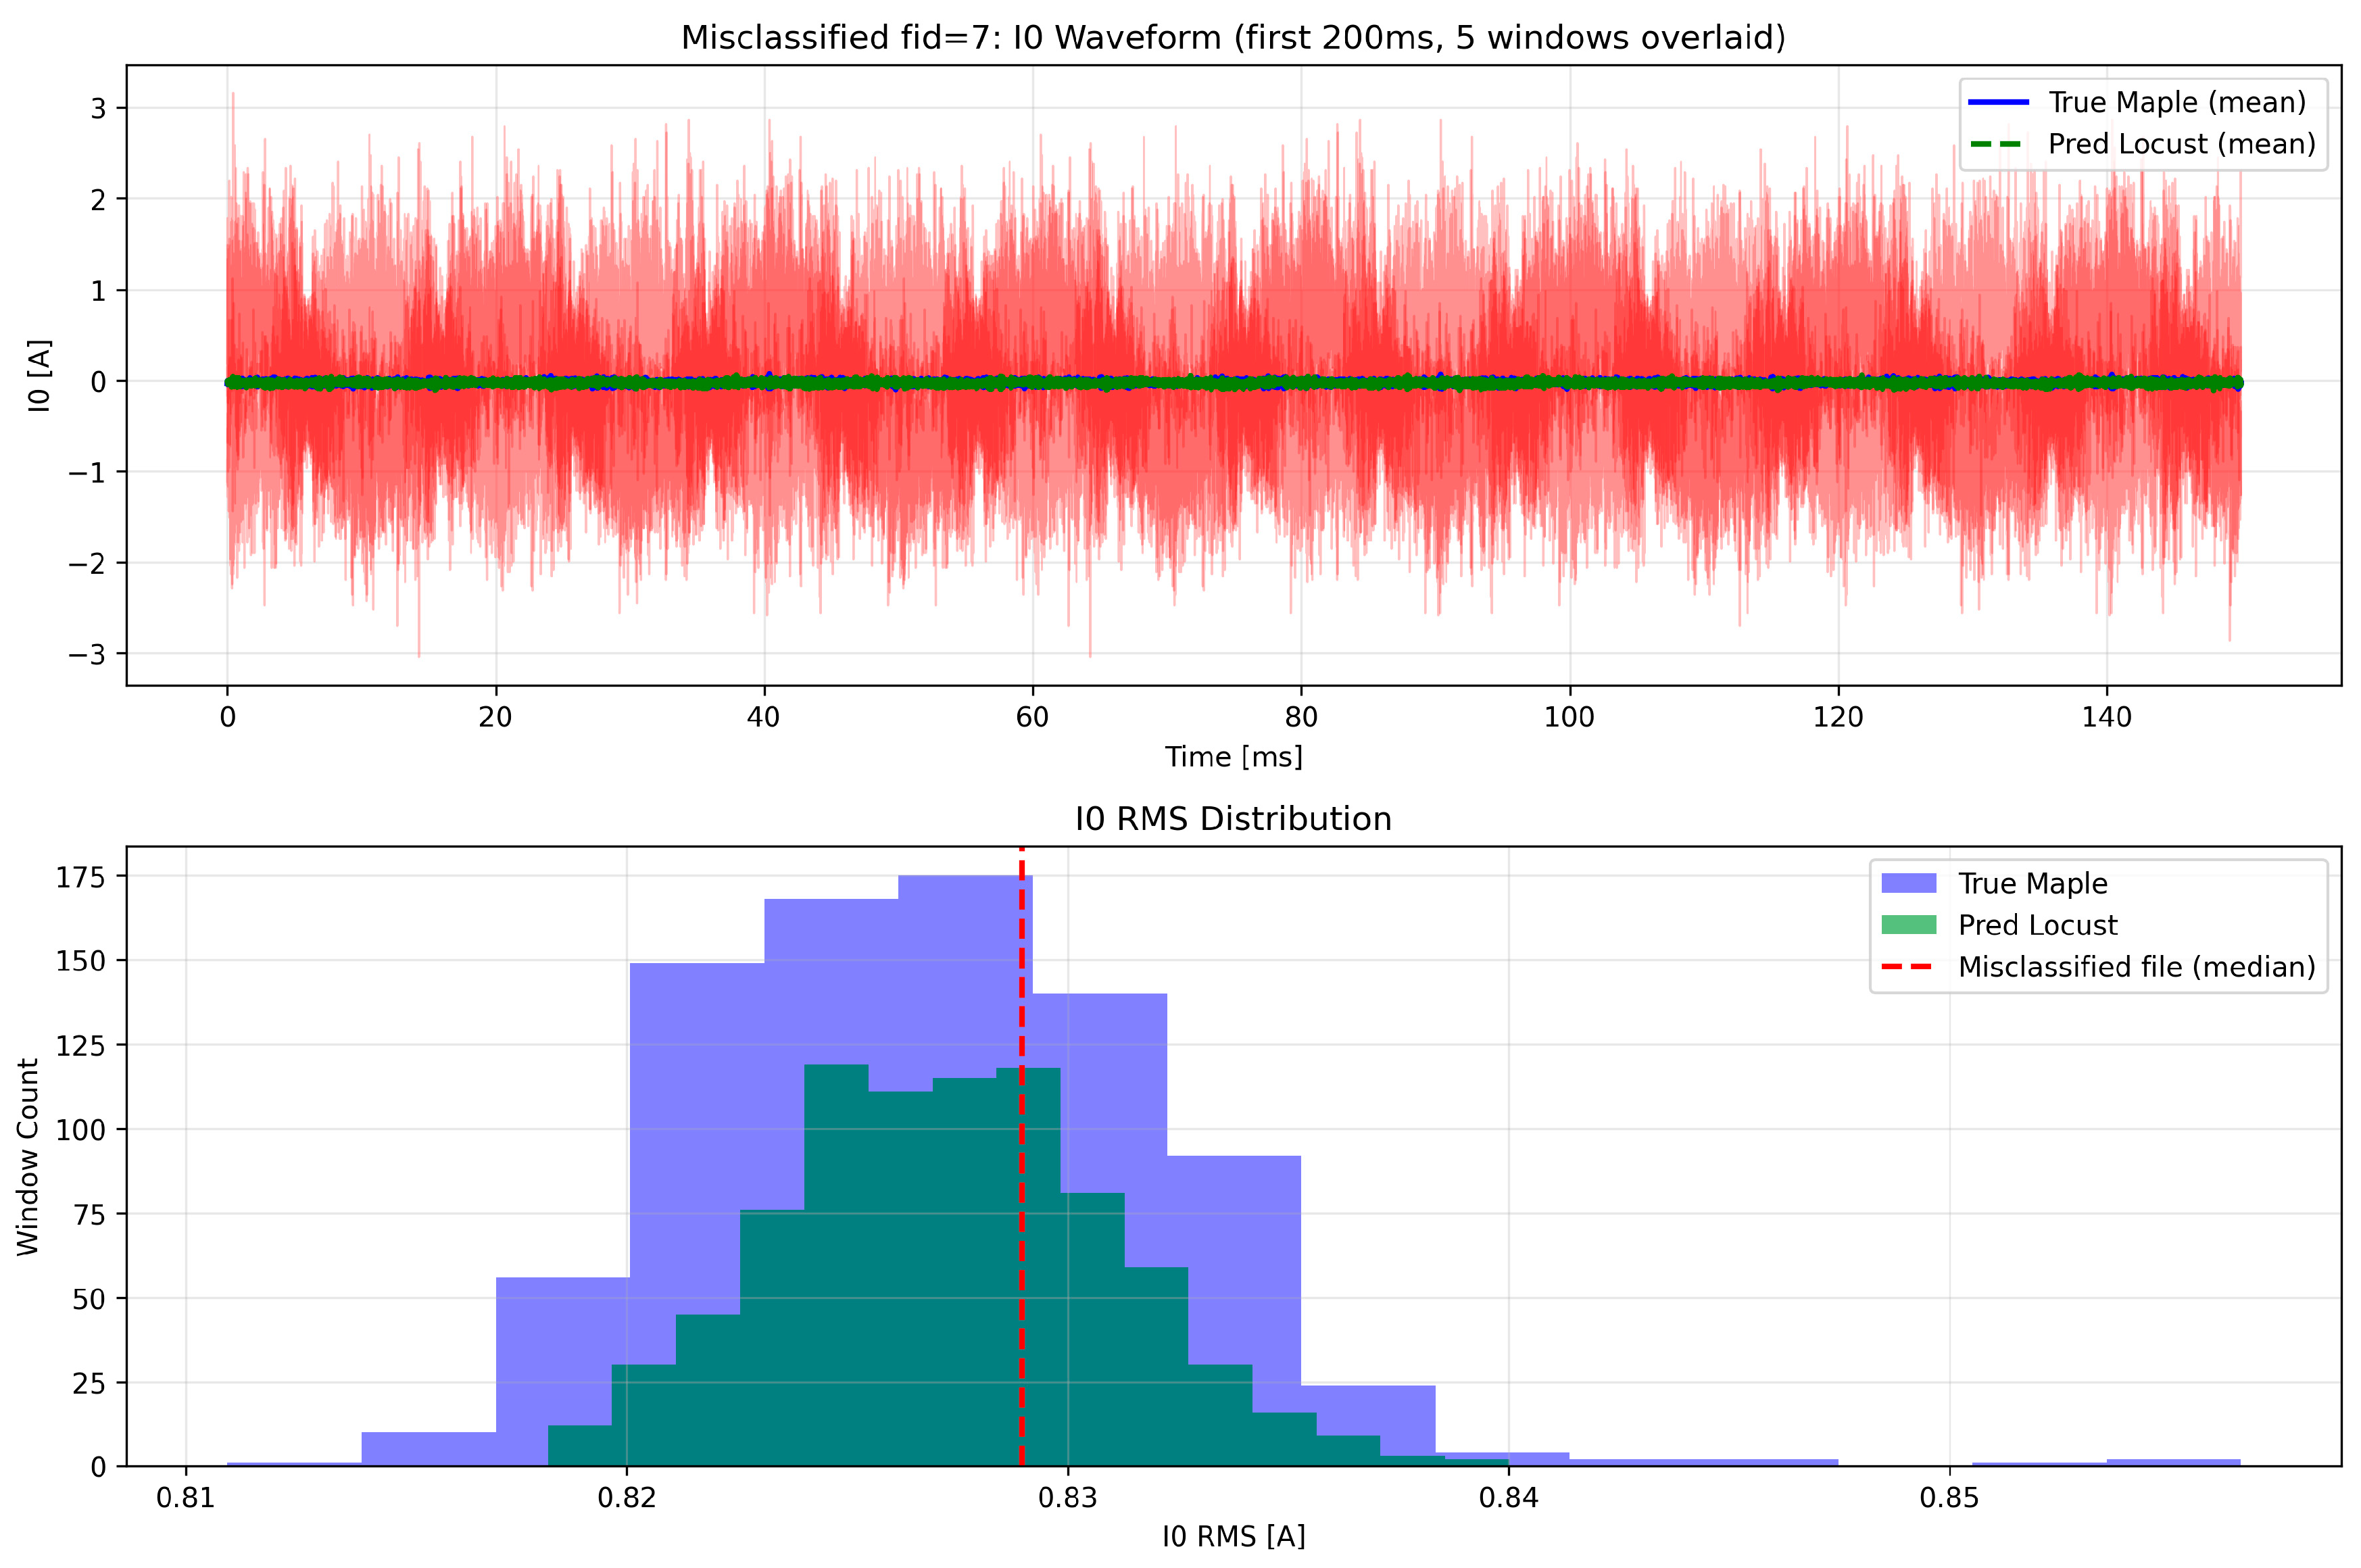
Under the LOFO-CV, the Hybrid + Ridge model misclassified exactly one file: a maple file (fid = 7) is erroneously labeled as locust. Figure 10 analyzes this failure.
Figure 10.
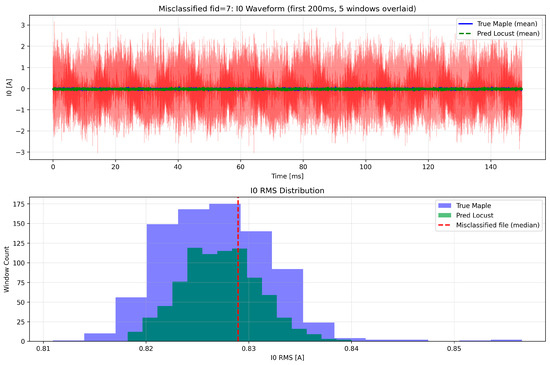
Analysis of the sole misclassified file (fid = 7, maple misclassified as locust).
The upper panel shows that the I0 waveform of the misclassified file is dominated by extreme high-frequency noise, with the fundamental component almost completely submerged—distinctly different from the clean mean waveforms of typical maple and locust files. The mean lines of true Maple and predicted Locust overlap and cannot be visually separated. The lower panel reveals that the I0 RMS distribution of this file (median: 0.83 A) falls squarely in the overlapping region between the true maple and predicted locust distributions.
Prolonged arcing charred the wood tissue, degrading the species-specific anatomical and moisture properties. The fault path effectively became a carbon conductor, causing different tree species to converge toward similar electrical characteristics.
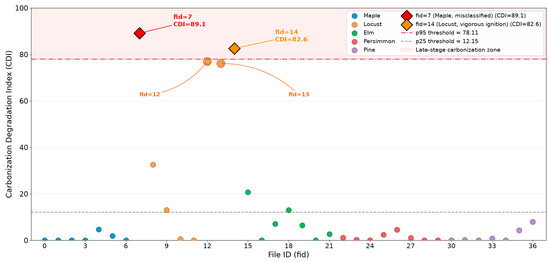
To quantify late-stage carbonization, this paper define the carbonization degradation index (CDI). Let denote the ratio of THD to fundamental amplitude of the zero-sequence current for file , and its zero-sequence voltage high-frequency energy ratio:
To establish a file-independent baseline, both quantities are normalized by their leave-one-out medians over all other files :
The CDI is then defined as their product:
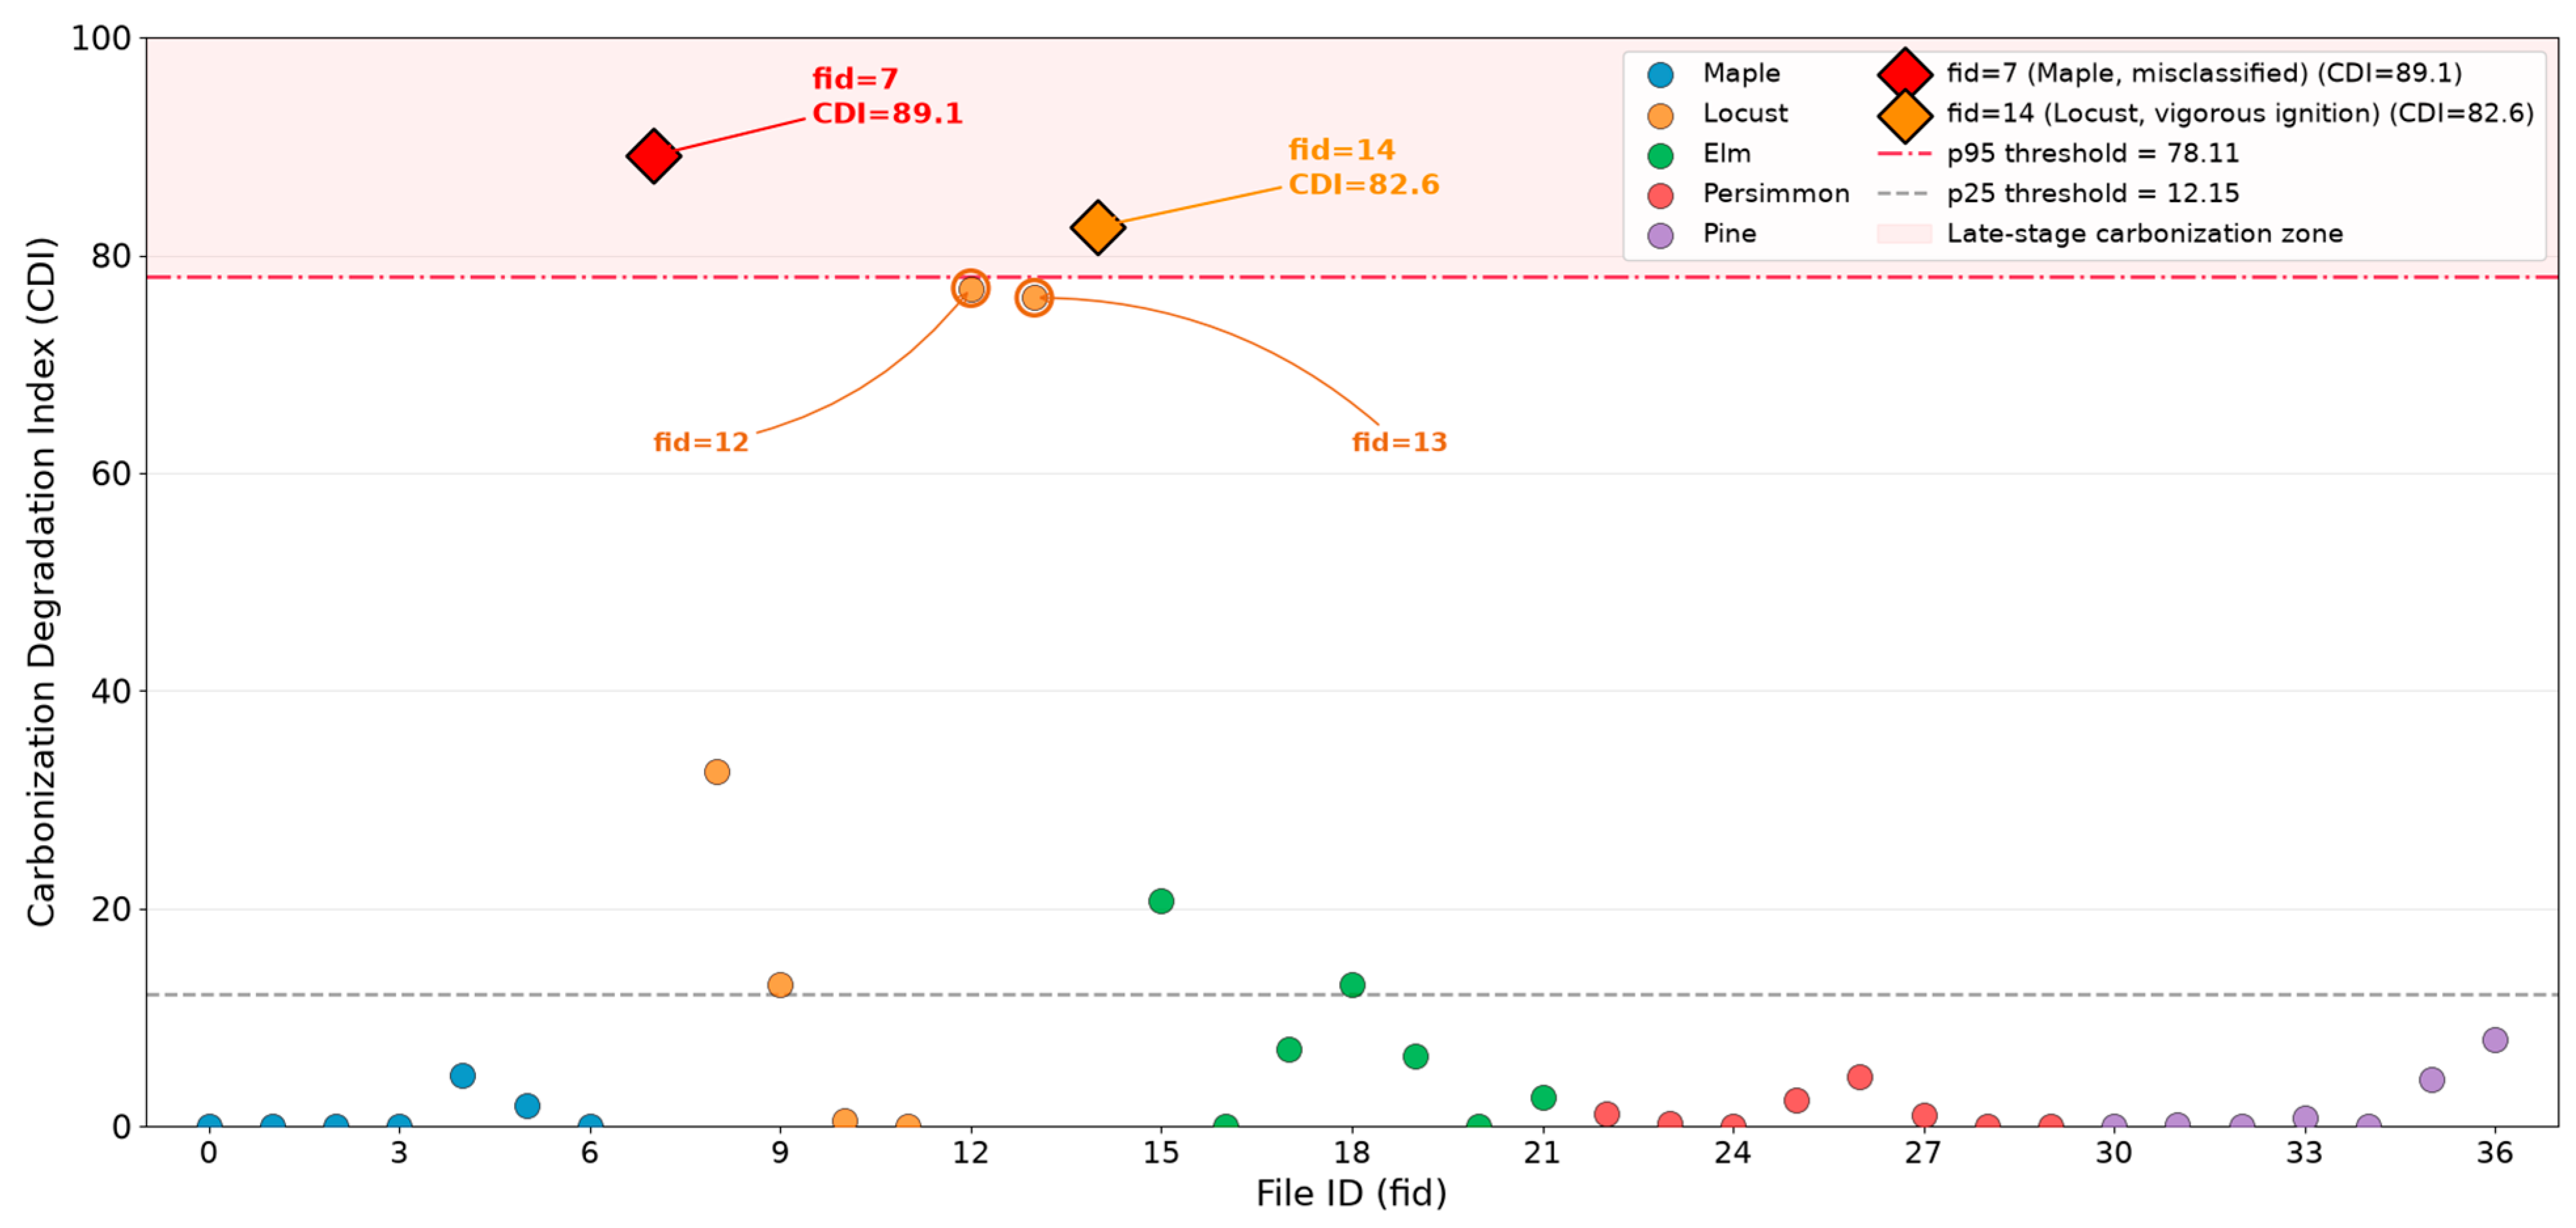
Across the 37 folds, the median of these thresholds was 73.18 (IQR 64.74–78.32). The median value 73.18 is adopted as the final deployment threshold because it provides a robust central estimate of the fold-wise optimal thresholds, is insensitive to extreme folds, and represents the typical threshold selected by the training-only nested optimization. Since neither the inner grid search nor the median aggregation uses the held-out test fold, this procedure preserves the no-leakage property of LOFO-CV. The IQR upper bound 78.32 corresponds to the 75th percentile of the fold-wise thresholds and would be more conservative than the typical optimum; it is therefore reported only to indicate fold-to-fold variability and is not used as an independent threshold. The lower threshold 12.15 was derived from the empirical distribution of low-carbonization training files.
The misclassified maple file (fid = 7) had a CDI of 89.13, exceeding the upper threshold. Three additional locust files (fid = 14, 12, and 13) had CDI values of 82.61, 76.98, and 76.10, respectively, and were correctly classified. These observations indicate that the CDI is more appropriately interpreted as an indicator of carbonization-related degradation than as a species-discrimination feature.
Accordingly, the following preliminary interpretation is adopted under the present experimental conditions: CDI > 73.18 indicates a strong carbonization warning, for which species inference should be treated with caution or withheld; 12.15 < CDI ≤ 73.18 indicates elevated carbonization risk, and the predicted species label should be regarded as provisional; CDI ≤ 12.15 does not trigger an additional carbonization warning. The results are shown in Figure 11. Importantly, the last condition should not be interpreted as a guarantee of reliable species identification.
Figure 11.
Carbonization degradation index (CDI) distribution.
Because these thresholds were derived from a relatively small number of clearly carbonized cases, they should be regarded as dataset-derived indicators rather than universal operational boundaries. Independent validation using controlled carbonization experiments or continuously monitored fault progression is required before the CDI can be used as a generalizable reliability criterion.
4. Discussion
4.1. Why Do Handcrafted Features Outperform MiniRocket in This Task?
On the 112-dataset UCR archive, MiniRocket and its Hydra/MultiRocket extensions consistently rank among the top performers [18,19,20,21], often surpassing feature-engineering baselines. However, these benchmarks typically provide hundreds to thousands of training samples per class. In N = 37 regime, the 688-dimensional hybrid space contains fewer than 30 training files per LOFO-CV fold, rendering high-dimensional random-kernel features statistically undersampled [23]. This suggests a regime boundary: below a critical sample-size threshold, domain-informed feature engineering dominates data-driven feature learning, which is a conclusion aligned with few-shot learning theory [13].
Under strict LOFO-CV protocol, standalone MiniRocket achieved only 75.0% file-level F1, whereas handcrafted physical features reached 86.5%. This finding contrasts with the prevailing trend in large-scale time-series benchmarks, where Hydra and MultiRocket variants dominate [21,22]. These gains are achieved on datasets with hundreds of training samples per class—a regime fundamentally different from N = 37 setting, in which feature-space inflation without domain guidance leads to noise accumulation [23]. We attribute this reversal to three factors rooted in the physics of tree-contact faults.
First, information density. MiniRocket generates 480-dimensional PPV features, yet stability selection revealed that fewer than 53 dimensions (11%) carried consistent discriminative signal; the remainder approximated noise in this small-sample regime. By contrast, each of the 208 handcrafted dimensions has an explicit physical interpretation—mean, standard deviation, fundamental amplitude, harmonic content and THD—which is directly linked to the tree–electrode interface impedance. The signal-to-noise ratio per dimension is therefore orders of magnitude higher.
Second, amplitude invariance versus amplitude sensitivity. MiniRocket’s PPV operation, , discards the absolute magnitude of the convolved signal. In tree faults, however, the absolute magnitude of the ground current ( at 50 Hz) is precisely the quantity modulated by species-dependent moisture and conductivity. Handcrafted features preserve this amplitude, whereas MiniRocket discards it. This explains why the top discriminative features in Figure 8 are exclusively handcrafted fund50 amplitudes.
Third, sample complexity. MiniRocket’s random kernels require sufficient data to reliably estimate the bias threshold and the resulting PPV statistics. With only approximately 30 training files per LOFO-CV fold, the empirical distribution of convolved values is undersampled, leading to unstable bias estimates and high-variance features. Handcrafted features, being deterministic transformations of known physical laws, require no statistical estimation and remain stable even with a handful of samples. The proposed framework can be situated within the emerging paradigm of physics-guided machine learning, in which physical laws or domain constraints are explicitly encoded to compensate for data scarcity.
4.2. The Complementary Mechanism: Global Framework vs. Local Correction
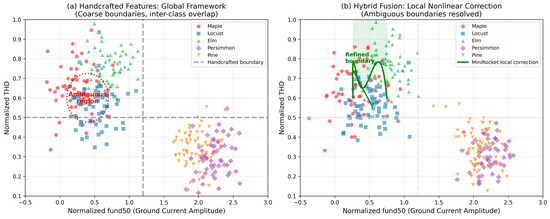
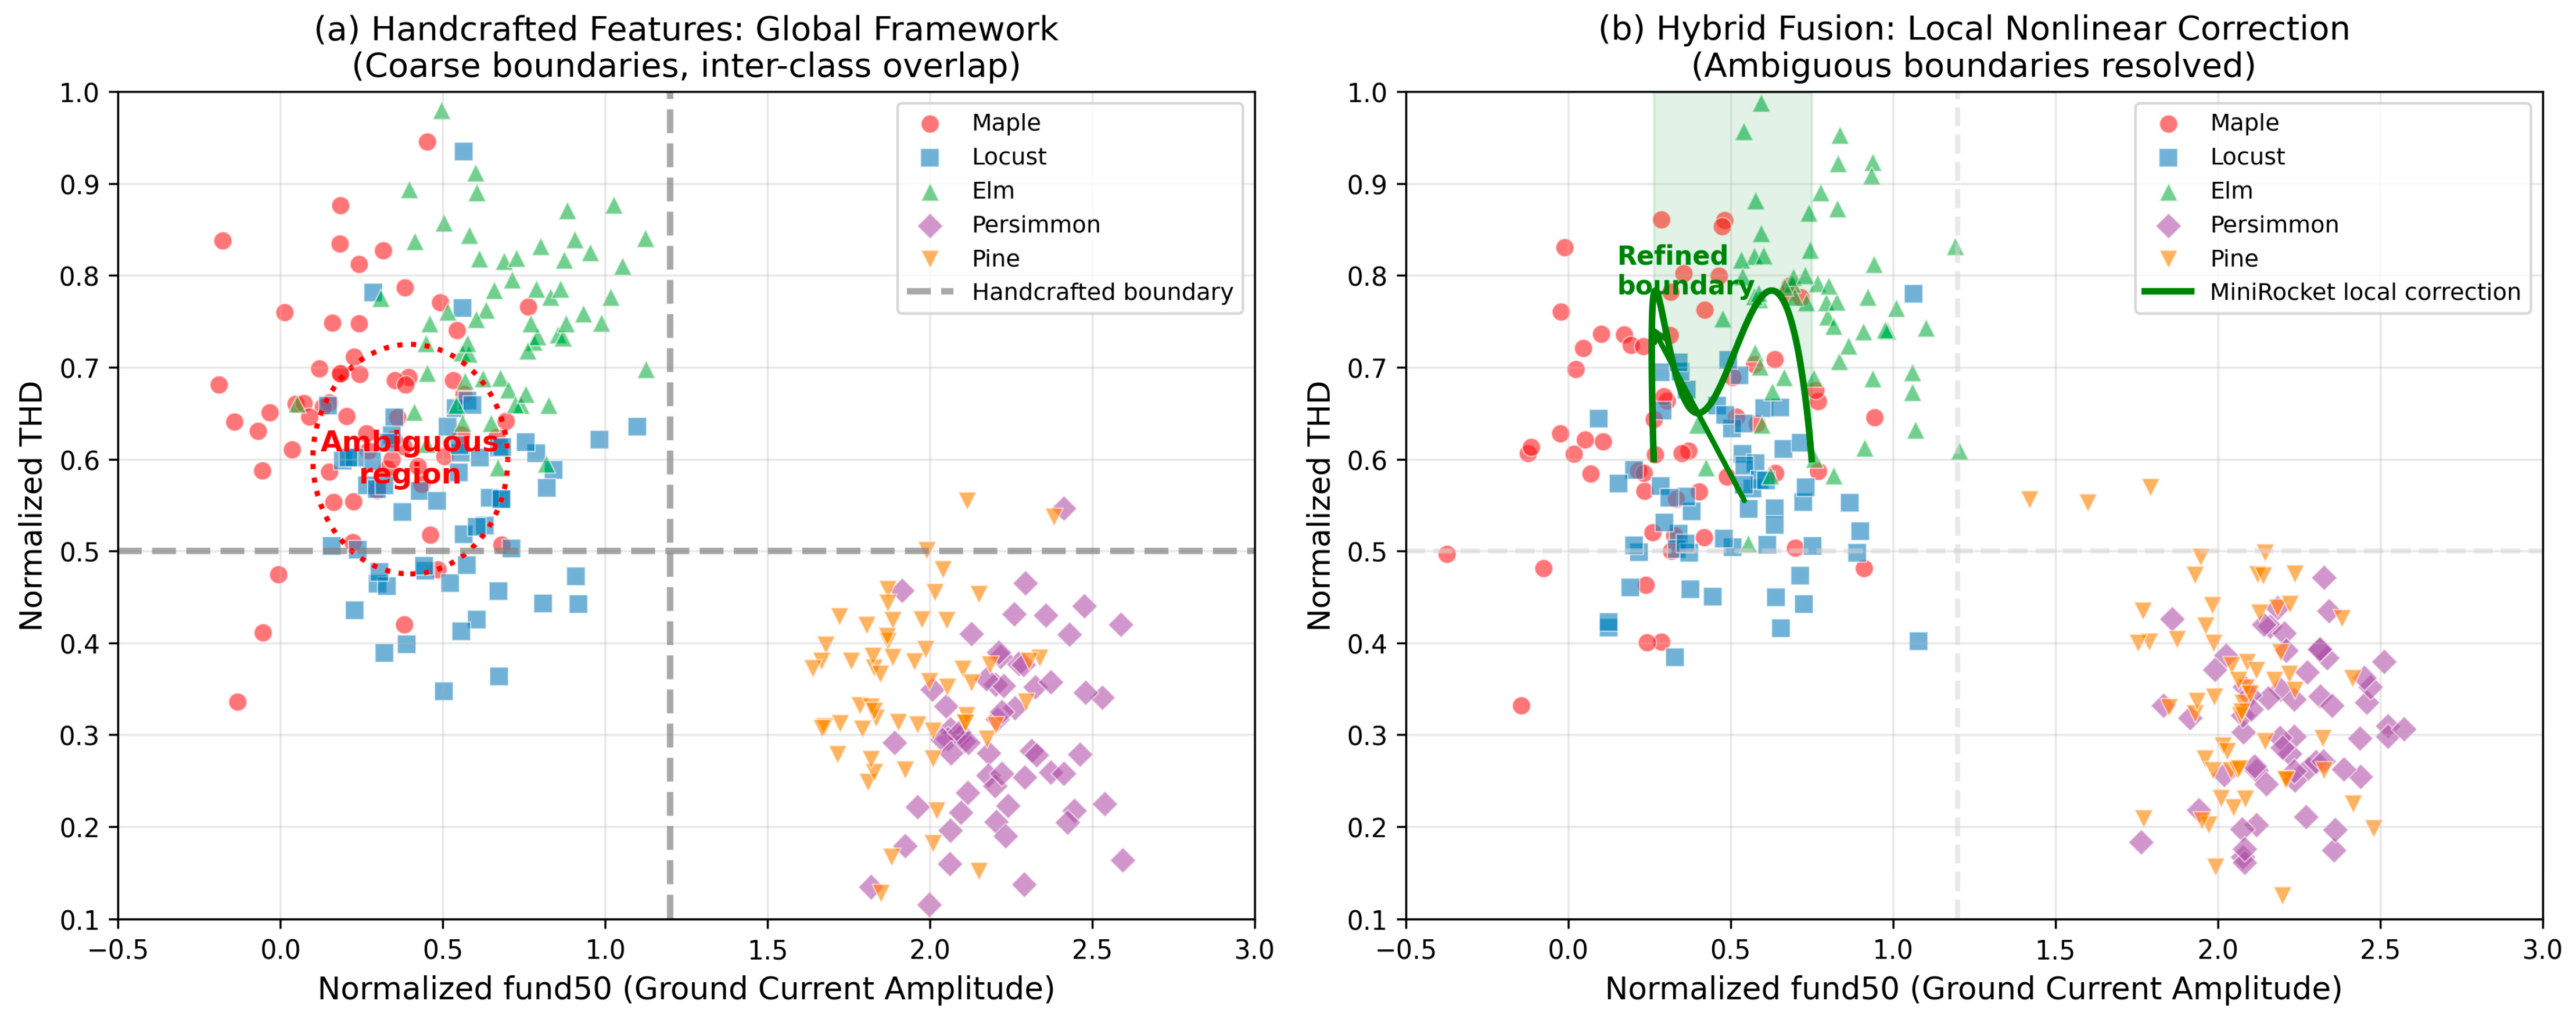
MiniRocket features operate in a high-dimensional PPV space in which random dilated kernels capture subtle temporal motifs—such as the exact timing and width of arc shoulders, or the micro-fluctuations during arc reignition—that cannot be expressed by simple harmonic ratios. These motifs supply the necessary local nonlinear corrections at ambiguous boundaries in which handcrafted features fail. In geometric terms, the hybrid classifier constructs a composite decision manifold in which the global topology is dictated by physical quantities (fund50 and THD) and the local curvature is fine-tuned by MiniRocket’s temporal motifs (Figure 12).
Figure 12.
Schematic of the complementary decision mechanism.
This interpretation also explains the outlier behavior of the 3U0-HF ratio for locust (Figure 9). Although this feature forms a species-specific statistical signature, its discriminative power is localized to a single class boundary. MiniRocket generalizes this principle across all ambiguous boundaries by learning data-driven temporal motifs that compensate for the blind spots of handcrafted descriptors.
Consequently, the 97.3% file-level F1 achieved by the Hybrid model is not an additive average of 86.5% and 75.0%, but a superior equilibrium in which each branch compensates for the other’s limitations. This finding carries a broader methodological implication: in power system fault diagnosis—a domain governed by strong electromagnetic constraints—the indiscriminate pursuit of model complexity may be less productive than a principled fusion of domain knowledge and lightweight data-driven corrections.
4.3. Limitations and Future Work
A fundamental limitation of this study is that all 37 files were collected from a single experimental campaign at one site during one winter season. Although moisture content was measured on multiple candidate branches and specimens with comparable moisture levels were selected for testing (Appendix C.1), moisture was not tracked continuously during each individual trial. Consequently, the classifier may still partially capture residual specimen-specific characteristics. Wood electrical resistivity varies substantially with season, temperature, branch diameter, and moisture gradient [37,38]. The results should therefore be interpreted as a proof-of-concept under controlled single-season conditions, not as a validated field-deployable species-identification system. Future work must track moisture per trial and span multiple seasons before generalization can be claimed.
Second, the current sampling configuration may exclude high-frequency arc components that contain additional information about species-specific nonlinear conduction. Future work should investigate higher sampling rates and physics-guided sampling strategies based on the frequency characteristics of arc reignition.
Third, the CDI thresholds are derived from a dataset containing only a few clearly carbonized cases. Although the 37-fold leave-one-out threshold optimization yields a stable median upper bound (73.18, IQR: 64.74–78.32), independent validation on stepped-carbonization trials or continuously monitored carbonization time series remains necessary before the CDI can be deployed as a generalizable reliability criterion.
Finally, domain-adaptation and transfer-learning techniques may further help leverage simulated or historical data to reduce the dependence on large-scale field recordings [39,40,41], while physics-guided neural networks could improve generalization by incorporating relevant electromagnetic constraints [9,42].
5. Conclusions
This paper proposes a framework integrating physical mechanisms with data-driven methods to identify tree species associated with high-impedance faults (THIFs). Through rigorous “leave-one-file-out” cross-validation, the study systematically compares manually extracted physical features, MiniRocket time-series features, and hybrid features. The findings can be summarized in the following four points:
- The proposed Hybrid + Ridge classifier achieved a file-level macro-F1 score of 97.3% across five tree species, compared with 86.5% for the handcrafted-feature baseline and 75.0% for MiniRocket alone. The higher observed performance is consistent with the benefit of combining physics-based descriptors with data-driven temporal features.
- Analysis of sampled data at 100 kHz and 10 kHz reveals that, under the current experimental conditions, a 100 kHz sampling rate preserves arc noise characteristics above 5 kHz—which reflect tree species-specific properties—whereas a 10 kHz rate results in significant information loss.
- Severe carbonization diminishes the unique physical attributes of the wood, causing different tree species to exhibit similar conductive behavior during the carbonization process. This highlights a potential limitation for practical application: tree species identification is most reliable during the early-to-mid stages of the fault.
These results provide a proof-of-concept basis for differentiated vegetation management in distribution networks.
Author Contributions
Conceptualization, Z.C. and Z.L.; methodology, Z.L.; software, H.C.; validation, Y.Z. and Z.L.; formal analysis, S.L.; investigation, B.Z.; resources, B.Z.; data curation, H.C.; writing—original draft preparation, S.L. and K.L.; writing—review and editing, Z.C.; visualization, S.L. and K.L.; supervision, Z.C.; project administration, Z.C.; funding acquisition, Z.L. All authors have read and agreed to the published version of the manuscript.
Funding
This research was funded by the State Grid Beijing Electric Power Company, with Grant Number 52022325000G.
Data Availability Statement
The original contributions presented in this study are included in the article. Further inquiries can be directed to the corresponding authors.
Conflicts of Interest
Author Shaoshuai Li was employed by the institution Changsha University of Science and Technology. Authors Zexi Chen, Zijin Li, Kewen Liu, Bin Zhao, Huimin Chen and Yujia Zhang were employed by the State Grid Beijing Electric Power Company. The remaining authors declare that the research was conducted in the absence of any commercial or financial relationships that could be construed as potential conflicts of interest. The authors declare that this study received funding from State Grid Beijing Electric Power Company. The funder was not involved in the study design, collection, analysis, interpretation of data, the writing of this article or the decision to submit it for publication.
Appendix A. Channel Definition and Symmetrical Component Transformation
Detailed Channel Definitions
Table A1 presents the complete definitions of the 16 electrical channels. While the main text omits the physical-meaning column to improve readability and conserve space, the full descriptions are retained here to ensure reproducibility and to assist readers unfamiliar with power-system fault recordings. Channels 1–12 are direct measurements from the experimental platform, whereas Channels 13–16 are derived from the symmetrical-component transformation.
Table A1.
Complete definition of the 16 electrical channels.
Appendix B. MiniRocket Configuration and PPV Computation
The MiniRocket implementation used in this work is a lightweight, NumPy-based variant specifically adapted for small-sample multivariate time series. The hyperparameters are listed in Table A2.
All algorithms were implemented in Python 3.9, with scikit-learn 1.3.0 used for classification and stability selection, and SciPy 1.11.0 for signal processing. The MiniRocket implementation follows the architecture described in [16] with custom modifications for multi-resolution PPV extraction. Source code and preprocessed data are available upon reasonable request. The main Hybrid + Ridge results reported in the text use the fixed final configuration; classifier-side preprocessing, stability selection, and Ridge training are performed within the LOFO training folds.
The MiniRocket kernel length, dilation set, and number of kernels were fixed through exploratory sensitivity analysis on the full 37-file dataset and were not re-tuned within any LOFO fold. This is a practical choice under extreme small-sample conditions, where fully nested hyperparameter selection is computationally infeasible. The sensitivity analysis indicates that the results are robust to reasonable variations in these settings: reducing kernels per dilation from 40 to 20 changed File-F1 by only 1.0%, and kernel length 9 consistently outperformed shorter kernels. The reported file-level F1 should therefore be interpreted as a proof-of-concept under a fixed, physically motivated configuration.
Table A2.
Final model configuration used for all experiments reported in this paper.
The configuration in Table A2 was used for the final strict LOFO-CV experiments. In particular, 40 kernels were used per dilation, resulting in 240 features for each sampling-rate branch and 480 MiniRocket features in total. This configuration was fixed throughout the LOFO-CV evaluation.
A reduced configuration with 20 kernels per dilation was additionally examined in the sensitivity analysis reported in Table A3. This analysis was intended to assess the effect of kernel count on representation quality and computational cost; it was not used to define the final model configuration.
Table A3.
Sensitivity analysis of the standalone 100 kHz MiniRocket branch.
Appendix C. Detailed Experimental Protocol
Appendix C.1. Tree Specimens and Branch Preparation
Thirty-seven independent physical trials were conducted across five species: maple, locust, elm, persimmon, and pine. For each trial, a fresh lateral branch (diameter 4–8 cm, length ~50 cm) was cut from a distinct individual tree (age 8–15 years) sourced from the Beijing suburban area. Samples from the same species had no kinship, shared branches, or root connections, eliminating potential correlations between specimens. The experiments were conducted in December during winter. Branch moisture content was measured via the oven-dry method on companion samples from the same trees: maple ~ 74%, locust ~ 58%, elm ~ 80%, persimmon ~ 59%, pine ~ 130%.
For each tree species, researchers used the oven-drying method to measure the moisture content of multiple candidate branches. To minimize intraspecific variation in moisture content, branches with similar moisture levels were selected for the experiment. These values represent the typical (median) moisture content of the selected samples at the time of collection. This screening procedure was adopted to prevent the classifier from learning moisture content differences specific to a particular batch, rather than the characteristic signals inherent to the tree species.
Appendix C.2. Instrumentation and Data Acquisition
Electrical quantities were recorded by 0.2-class capacitive voltage dividers (7.2 kV/100 V) and 0.2-class current transformers (50 A/5 A), sampled by a 16-bit NI PXI-5105 digitizer at 100 kHz per channel, with an analog anti-aliasing filter cutoff at 48 kHz. Each file contains six seconds of continuous fault data.
References
- Emanuel, A.E.; Cyganski, D.; Orr, J.A.; Shiller, S.; Gulachenski, E.M. High impedance fault arcing on sandy soil in 15 kV distribution feeders: Contributions to the evaluation of the low frequency spectrum. IEEE Trans. Power Deliv. 1990, 5, 676–686. [Google Scholar] [CrossRef] [Scilit]
- Chakraborty, S.; Das, S. Application of smart meters in high impedance fault detection on distribution systems. IEEE Trans. Smart Grid 2019, 10, 3465–3473. [Google Scholar] [CrossRef] [Scilit]
- Esmail, E.; Elgamasy, M.; Kawady, T.; Taalab, A.M.; Elkalashy, N.; Elsadd, M. Detection and experimental investigation of open conductor and single-phase earth return faults in distribution systems. Int. J. Electr. Power Energy Syst. 2022, 140, 108089. [Google Scholar] [CrossRef] [Scilit]
- Asman, S.H.; Ab Aziz, N.F.; Amirulddin, U.A.; Ab Kadir, M.Z.A. Transient fault detection and location in power distribution network: A review of current practices and challenges in Malaysia. Energies 2021, 14, 2988. [Google Scholar] [CrossRef] [Scilit]
- Mosavi, A.; Salimi, M.; Andahii, S.F.; Rakczuk, T.; Shamshirband, S.; Varkonyi-Koczy, A.R. State of the art of machine learning models in energy systems, a systematic review. Energies 2019, 12, 1301. [Google Scholar] [CrossRef] [Scilit]
- Chen, K.; Huang, C.; He, J. Fault detection classification and location for transmission lines and distribution systems: A review on the methods. High Volt. 2016, 1, 25–33. [Google Scholar] [CrossRef] [Scilit]
- Sassetto, M. Tree High Impedance Fault Modelling. Ph.D. Thesis, University of Padova, Padova, Italy, 2020. [Google Scholar]
- Jiang, C.; Bi, M.; Zhang, S.; Li, K.; Lei, S.; Jiang, T. Study on arc characteristics and combustion feature of tree-wire discharge fault in distribution line. Electr. Power Syst. Res. 2024, 230, 110210. [Google Scholar] [CrossRef] [Scilit]
- Xu, K.; Qiu, L.; Dai, X.; Ding, Y.; Ye, C.; Fang, Y. Optimal power flow under varying topologies via physics-guided neural network with stack-learning. Int. J. Electr. Power Energy Syst. 2025, 173, 111391. [Google Scholar] [CrossRef] [Scilit]
- Mamuya, Y.D.; Der, L.Y.; Shen, J.W.; Shafullah, M.; Kuo, C.C. Application of machine learning for fault classification and location in a radial distribution grid. Appl. Sci. 2020, 10, 4965. [Google Scholar] [CrossRef] [Scilit]
- Fawaz, H.I.; Forestier, G.; Weber, J.; Idoumghar, L.; Muller, P.A. Deep learning for time series classification: A review. Data Min. Knowl. Discov. 2019, 33, 917–963. [Google Scholar] [CrossRef] [Scilit]
- Zhang, Y.; Wang, X.; Luo, Y.; He, J.; Hua, B.; Xu, Q. High impedance fault detection in distribution network using convolutional neural network based on distribution-level PMU data. In Proceedings of the 8th Renewable Power Generation Conference (RPG 2019), Shanghai, China, 24–25 October 2019; pp. 1–8. [Google Scholar]
- Wang, Y.; Yao, Q.; Kwok, J.; Ni, L. Generalizing from a Few Examples: A Survey on Few-shot Learning. ACM Comput. Surv. 2020, 53, 1–34. [Google Scholar]
- Zhong, S.; Souza, V.M.A.; Baker, G.E.; Mueen, A. Online few-shot time Series classification for aftershock detection. In Proceedings of the 29th ACM SIGKDD Conference on Knowledge Discovery and Data Mining (KDD ’23); Association for Computing Machinery: New York, NY, USA, 2023; pp. 5707–5716. [Google Scholar]
- Veerasamy, V.; Wahab, N.I.A.; Othman, M.L.; Padmanaban, S.; Sakar, K.; Ramachandran, R. LSTM recurrent neural network classifier for high impedance fault detection in solar PV integrated power system. IEEE Access 2021, 9, 32672–32687. [Google Scholar] [CrossRef] [Scilit]
- Dempster, A.; Schmidt, D.F.; Webb, G.I. MiniRocket: A very fast (almost) deterministic transform for time series classification. In Proceedings of the 27th ACM SIGKDD Conference on Knowledge Discovery and Data Mining, Virtual Event, 14–18 August 2021; pp. 248–257. [Google Scholar]
- Teimourzadeh, H.; Moradzadeh, A.; Shoaran, M.; Mohammadi, B.; Razzaghi, R. High impedance single-phase faults diagnosis in transmission lines via deep reinforcement learning of transfer functions. IEEE Access 2021, 9, 15796–15809. [Google Scholar] [CrossRef] [Scilit]
- Dempster, A.; Petitjean, F.; Webb, G.I. ROCKET: Exceptionally fast and accurate time series classification using random convolutional kernels. Data Min. Knowl. Discov. 2020, 34, 1454–1495. [Google Scholar] [CrossRef] [Scilit]
- Bagnall, A.; Lines, J.; Bostrom, A.; Large, J.; Keogh, E. The great time series classification bake off: A review and experimental evaluation of recent algorithmic advances. Data Min. Knowl. Discov. 2017, 31, 606–660. [Google Scholar] [CrossRef] [Scilit] [PubMed]
- Ruiz, A.P.; Flynn, M.; Large, J.; Middlehurst, M.; Bagnall, A. The great multivariate time series classification bake off: A review and experimental evaluation of recent algorithmic advances. Data Min. Knowl. Discov. 2021, 35, 401–449. [Google Scholar] [CrossRef] [Scilit] [PubMed]
- Tan, C.W.; Dempster, A.; Bergmeir, C.; Webb, G.I. MultiRocket: Multiple pooling operators and transformations for fast and effective time series classification. Data Min. Knowl. Discov. 2022, 36, 1623–1646. [Google Scholar] [CrossRef] [Scilit]
- Dempster, A.; Schmidt, D.F.; Webb, G.I. Hydra: Competing convolutional kernels for fast and accurate time series classification. Data Min. Knowl. Discov. 2023, 37, 1779–1805. [Google Scholar] [CrossRef] [Scilit]
- Lo, M.M.; Morvan, G.; Rossi, M.; Morganti, F.; Mercier, D. Time series classification with random convolution kernels based transforms: Pooling operators and input representations matter. arXiv 2024, arXiv:2409.01115. [Google Scholar]
- Meng, Q.; Gao, Y.; Hussain, S.; He, Y.; Li, B. A novel approach for high impedance fault detection in resonant grounding systems based on statistical characteristics. Sci. Rep. 2025, 15, 33118. [Google Scholar] [CrossRef] [Scilit] [PubMed]
- Gadanayak, D.A.; Mishra, M.; Bansal, R.C. High impedance fault detection in distribution networks based on randomness and unpredictability of fault currents. Appl. Energy 2024, 375, 124012. [Google Scholar] [CrossRef] [Scilit]
- Hao, B. AI in arcing-HIF detection: A brief review. IET Smart Grid 2020, 3, 435–444. [Google Scholar] [CrossRef] [Scilit]
- Sapountzoglou, N.; Lago, J.; De Schutter, B.; Raison, B. A generalizable and sensor-independent deep learning method for fault detection and location in low-voltage distribution grids. Appl. Energy 2020, 276, 115299. [Google Scholar] [CrossRef] [Scilit]
- Breiman, L. Random forests. Mach. Learn. 2001, 45, 5–32. [Google Scholar] [CrossRef] [Scilit]
- Fortescue, C.L. Method of symmetrical co-ordinates applied to the solution of polyphase networks. Trans. Am. Inst. Electr. Eng. 1918, 37, 1027–1140. [Google Scholar] [CrossRef] [Scilit]
- Dau, H.A.; Bagnall, A.; Kamgar, K.; Yeh, C.C.M.; Zhu, Y.; Gharghabi, S.; Ratanamahatana, C.A.; Keogh, E. The UCR Time series archive. IEEE/CAA J. Autom. Sin. 2019, 6, 1293–1305. [Google Scholar] [CrossRef] [Scilit]
- Meinshausen, N.; Buhlmann, P. Stability selection. J. R. Stat. Soc. Ser. B Stat. Methodol. 2010, 72, 417–473. [Google Scholar] [CrossRef] [Scilit]
- Middlehurst, M.; Large, J.; Bagnall, A. The canonical interval forest (CIF) classifier for time series classification. In Proceedings of the 2020 IEEE International Conference on Big Data (Big Data), Atlanta, GA, USA, 10–13 December 2020; pp. 188–195. [Google Scholar]
- Kalousis, A.; Prados, J.; Hilario, M. Stability of feature selection algorithms: A study on high-dimensional spaces. Knowl. Inf. Syst. 2007, 12, 95–116. [Google Scholar] [CrossRef] [Scilit]
- Nature Research Intelligence. Feature Selection Techniques in High-Dimensional Data Analysis. Nature Index Topics. Available online: https://www.nature.com/nature-index/topics (accessed on 16 August 2026).
- Roberts, D.R.; Bahn, V.; Ciuti, S.; Boyce, M.S.; Elith, J.; Guillera-Arroita, G.; Hauenstein, S.; Lahoz-Monfort, J.J.; Schröder, B.; Thuiller, W.; et al. Cross-validation strategies for data with temporal, spatial, hierarchical, or phylogenetic structure. Ecography 2017, 40, 913–929. [Google Scholar] [CrossRef] [Scilit]
- Pedregosa, F.; Varoquaux, G.; Gramfort, A.; Michel, V.; Thirion, B.; Grisel, O.; Blondel, M.; Prettenhofer, P.; Weiss, R.; Dubourg, V.; et al. Scikit-Learn: Machine Learning in Python. J. Mach. Learn. Res. 2011, 12, 2825–2830. [Google Scholar]
- Ashrafi, A.E. Modeling of power losses caused by hidden tree-related high impedance faults. Bull. Electr. Eng. Inform. 2016, 5, 381–389. [Google Scholar] [CrossRef] [Scilit]
- Barański, J.; Suchta, A.; Barańska, S.; Klement, I.; Vilkovská, T.; Vilkovský, P. Wood moisture-content measurement accuracy of impregnated and nonimpregnated wood. Sensors 2021, 21, 7033. [Google Scholar] [CrossRef] [Scilit] [PubMed]
- Mohammadi, A.; Jannati, M.; Shams, M. Using deep transfer learning technique to protect electrical distribution systems against high-impedance faults. IEEE Syst. J. 2023, 17, 3160–3171. [Google Scholar] [CrossRef] [Scilit]
- Wang, C.; Feng, L.; Hou, S.; Ren, G.; Lu, T. A high-impedance fault detection method for active distribution networks based on time–frequency–space domain fusion features and hybrid convolutional neural network. Processes 2024, 12, 2712. [Google Scholar] [CrossRef] [Scilit]
- Li, X. High impedance fault location in power distribution systems using deep learning and micro phasor measurement units. Multiscale Multidiscip. Model. Exp. Des. 2024, 7, 1045–1056. [Google Scholar] [CrossRef] [Scilit]
- Ghorbani, M.; Razavi, F.; Fakharian, A. A physics-informed neural network approach for fault diagnosis and protection in multi-source microgrids. Int. J. Smart Electr. Eng. 2026, 14, 269–277. [Google Scholar]

Disclaimer/Publisher’s Note: The statements, opinions and data contained in all publications are solely those of the individual author(s) and contributor(s) and not of MDPI and/or the editor(s). MDPI and/or the editor(s) disclaim responsibility for any injury to people or property resulting from any ideas, methods, instructions or products referred to in the content. |
© 2026 by the authors. Licensee MDPI, Basel, Switzerland. This article is an open access article distributed under the terms and conditions of the Creative Commons Attribution (CC BY) license.