


Abstract
The controllable line-commutated converter (CLCC), which achieves forced commutation and effectively prevents commutation failures, has seen initial engineering applications in high-voltage direct current (HVDC) transmission systems. This paper analyzes fault characteristics and develops a valve control strategy for single-phase-to-ground faults on the valve side of the CLCC converter transformer. First, mathematical models of the DC-side circuit and its control system are established. Next, based on the fault location and changes in current paths during the fault, the transient characteristics of the valve current are analyzed, accounting for the effects of the control system. Furthermore, a relationship describing how faults affect the extrema of the valve current during commutation is derived. Finally, a method for optimizing the valve control strategy is proposed based on predicting the times at which the valve current reaches its extrema. This prediction is obtained using a current transfer time model derived from an equivalent circuit describing current transfer between the main and auxiliary branches of the CLCC. Simulation results show that the proposed method can effectively reduce the current stress imposed on the arrester by fault-induced abnormal commutation, improve the current waveform during commutation, and enhance the operational stability of the system during faults.
1. Introduction
With the sustained development of ultra-high-voltage direct-current transmission in China, regional power grids, such as East China and South China power grids, are evolving into more densely interconnected multi-infeed DC systems [1,2,3,4]. The commutation failure and its cascading effects caused by the traditional LCC-HVDC (Line-Commutated Converter-based High-Voltage Direct Current) systems have seriously threatened secure and stable operation for the regional power grids containing these hybrid AC/DC power systems [5,6,7]. CLCC (Controllable Line-Commutated Converter) was recently proposed to eliminate commutation failure. By introducing fully controlled sub-valves into the bridge arms, CLCC enables controllable transfer of the main-branch thyristor current and active turn-off of the bridge-arm current, such that the commutation failure from the converter topology itself can be avoided [8,9]. Existing studies have shown that CLCC not only has the advantages of LCC in terms of large transmission capacity and low losses, but can also enhance commutation voltage and provide reactive power support to the AC system. These results show that CLCC has wide and good application prospects.
In terms of topology and modeling, Ref. [10] proposed a novel CLCC topology with a shared auxiliary branch, which reduces the number of fully controllable devices while retaining forced commutation capability. Ref. [11] proposed a simplified electromagnetic transient modeling method based on the switching logic of the bridge arms. The model was reduced to an equivalent circuit containing only one insulated-gate bipolar transistor (IGBT) and one surge arrester, thereby significantly improving simulation efficiency.
Regarding the valve control system, Ref. [12] proposed an energy-saving operating mode for the CLCC, in which the power-support capability under receiving-end AC faults was enhanced by modifying the valve control sequence. Refs. [13,14] completed the design, development, and engineering implementation of the valve control system.
In terms of experimental verification and characteristic analysis, Refs. [15,16] established a single-valve turn-off test platform and proposed a low-voltage energization test method to verify the transient withstand capability of the devices. Ref. [17] analyzed the harmonic distribution characteristics under various operating conditions.
At the level of fault characteristics and control strategies, Ref. [18] analyzed the transient characteristics of a single-valve short-circuit fault in the CLCC and verified its superior fault stability compared with that of a conventional LCC. Ref. [19] proposed a method for locating internal faults in the valve area, providing a technical means for troubleshooting faults within the converter area. Ref. [20] established a hierarchical coordinated control framework in which the MMC regulates the DC voltage and the CLCC regulates the DC current. By exploiting the negative-voltage output capability of the MMC and the fast current-regulation capability of the CLCC, a power-flow reversal control strategy was designed. Ref. [21] compared the fault-power characteristics of the CLCC with those of conventional LCC and VSC systems under receiving-end AC faults, and proposed an optimized CLCC control method based on increasing the maximum firing angle. This method effectively enhanced the active-power transmission capability and the speed of receiving-end voltage recovery during faults. Ref. [22] further explored the multi-quadrant power-control capability of the CLCC. The upper operating limit of the firing angle was determined according to the ratio between the arrester voltage and the AC line voltage, based on which a short-term reactive-power support control strategy using firing-angle compensation was proposed to maximize the retention of DC transmission power during faults. Ref. [23] proposed a coordinated control strategy combining adaptive current-deviation control with an improved VDCOL. The former adaptively reduced the extinction angle according to the magnitude of the AC voltage drop, while the latter activated current limiting in advance to suppress the valve-side current stress and accelerate power recovery after the fault. This strategy improved the active-power transmission capability and system recovery speed under single-phase-to-ground and three-phase-to-ground faults on the AC side. Overall, existing studies on the fault characteristics of CLCCs have mainly focused on internal bridge-arm faults and AC-side disturbances, while the corresponding fault-control methods have largely been limited to the dynamic adjustment of the firing angle at the pole-control level. Research on valve-side faults of converter transformers and their suppression strategies remains insufficient.
It is worth noting that, for conventional thyristor converters and voltage-source converters, existing studies have conducted relatively in-depth analyses of valve-side grounding faults in converter transformers. These studies have shown that valve-side grounding faults in converter transformers can trigger complex transient processes.
Ref. [24] proposed the concept of commutation-failure-like phenomena and investigated the influence of fault duration on the transient behavior of converters. Ref. [25] employed a piecewise analytical method to reveal the harmonic characteristics of single-phase-to-ground faults on the valve side of the low-voltage bridge and their effects on the performance of differential protection. Ref. [26] found that an asymmetric grounding fault on the valve side can produce a new type of fault-induced excitation inrush current. The inrush-current characteristics under different winding connection configurations were compared, and the resulting risk of false blocking of differential protection was analyzed. Ref. [27] pointed out that an asymmetric fault on the valve side of a converter transformer may cause maloperation of the overcurrent protection of the commutation reactor. Based on the component characteristics of the fault current, a protection-blocking criterion utilizing the difference between half-cycle integral values at different fault initiation instants was proposed, thereby enabling reliable blocking of such faults. Ref. [28] proposed the installation of a fault current-limiting device at the grounding electrode to absorb energy in the circuit and suppress both the rate of rise and the peak value of the fault current.
Because the CLCC possesses forced commutation capability, its fault characteristics differ significantly from those of conventional converters. Therefore, the fault mechanisms and control strategies reported in existing studies cannot be directly extended to CLCCs. It is thus necessary to systematically analyze the transient fault characteristics of CLCCs under valve-side grounding faults of converter transformers and further exploit the forced commutation capability of the CLCC to optimize the valve control sequence, thereby reducing the transient stresses on the devices during faults.
To address the above-mentioned research limitations, this paper conducts a series of studies, and its main contributions are summarized as follows:
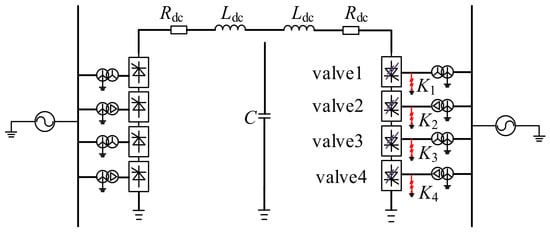
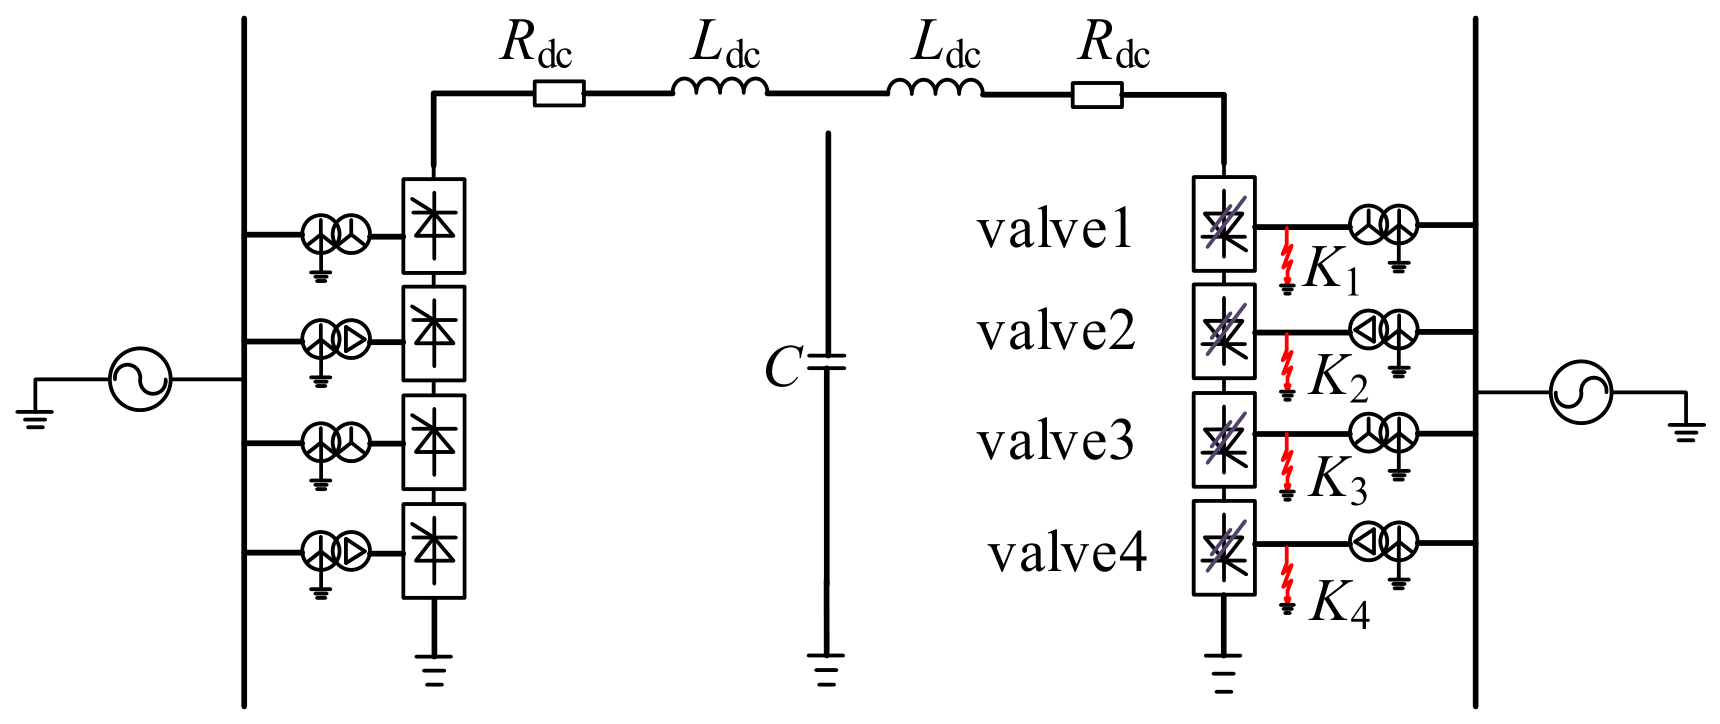
- First, aiming at the converter-transformer valve-side single-phase-to-ground fault of CLCC-based HVDC systems, this paper reveals the fault transient characteristics under different fault locations K1–K4, and clarifies how the fault position and valve conduction status jointly affect the variation law of the valve-current extremum during commutation.
- Second, considering the influence of the predictive constant extinction angle control at the inverter side, piecewise mathematical fault models are established to describe the dynamic variation processes of DC voltage, DC current, and valve current under different fault conditions.
- Third, a valve control strategy optimization method based on valve-current extreme-point prediction is proposed. By constructing an analytical model of the current transfer time between the main and auxiliary branches, the method dynamically adjusts the turn-off delay parameters of the sub-valves to transfer current to the arrester before the valve current reaches its extreme point, thereby effectively suppressing abnormal commutation under fault conditions.
This paper is organized as follows: Section 2 introduces the CLCC topology and its valve control timing, analyzes the transient fault characteristics for different fault locations at the converter-transformer valve side, and elaborates the modeling derivation and design process of the proposed coordinated turn-off control strategy for the main and auxiliary branches. Section 3 builds the PSCAD/EMTDC simulation model of the CLCC-HVDC system and verifies the fault characteristic analysis as well as the effectiveness of the proposed control scheme under multiple fault scenarios. Section 4 summarizes the conclusions of this paper.
2. Materials and Methods
2.1. CLCC Topology and Valve Control Timing
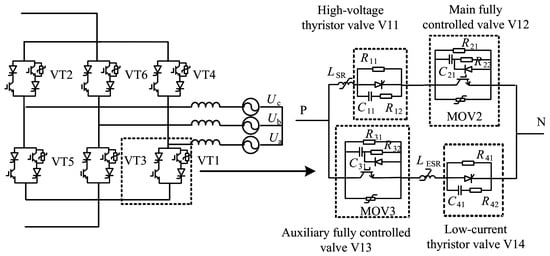
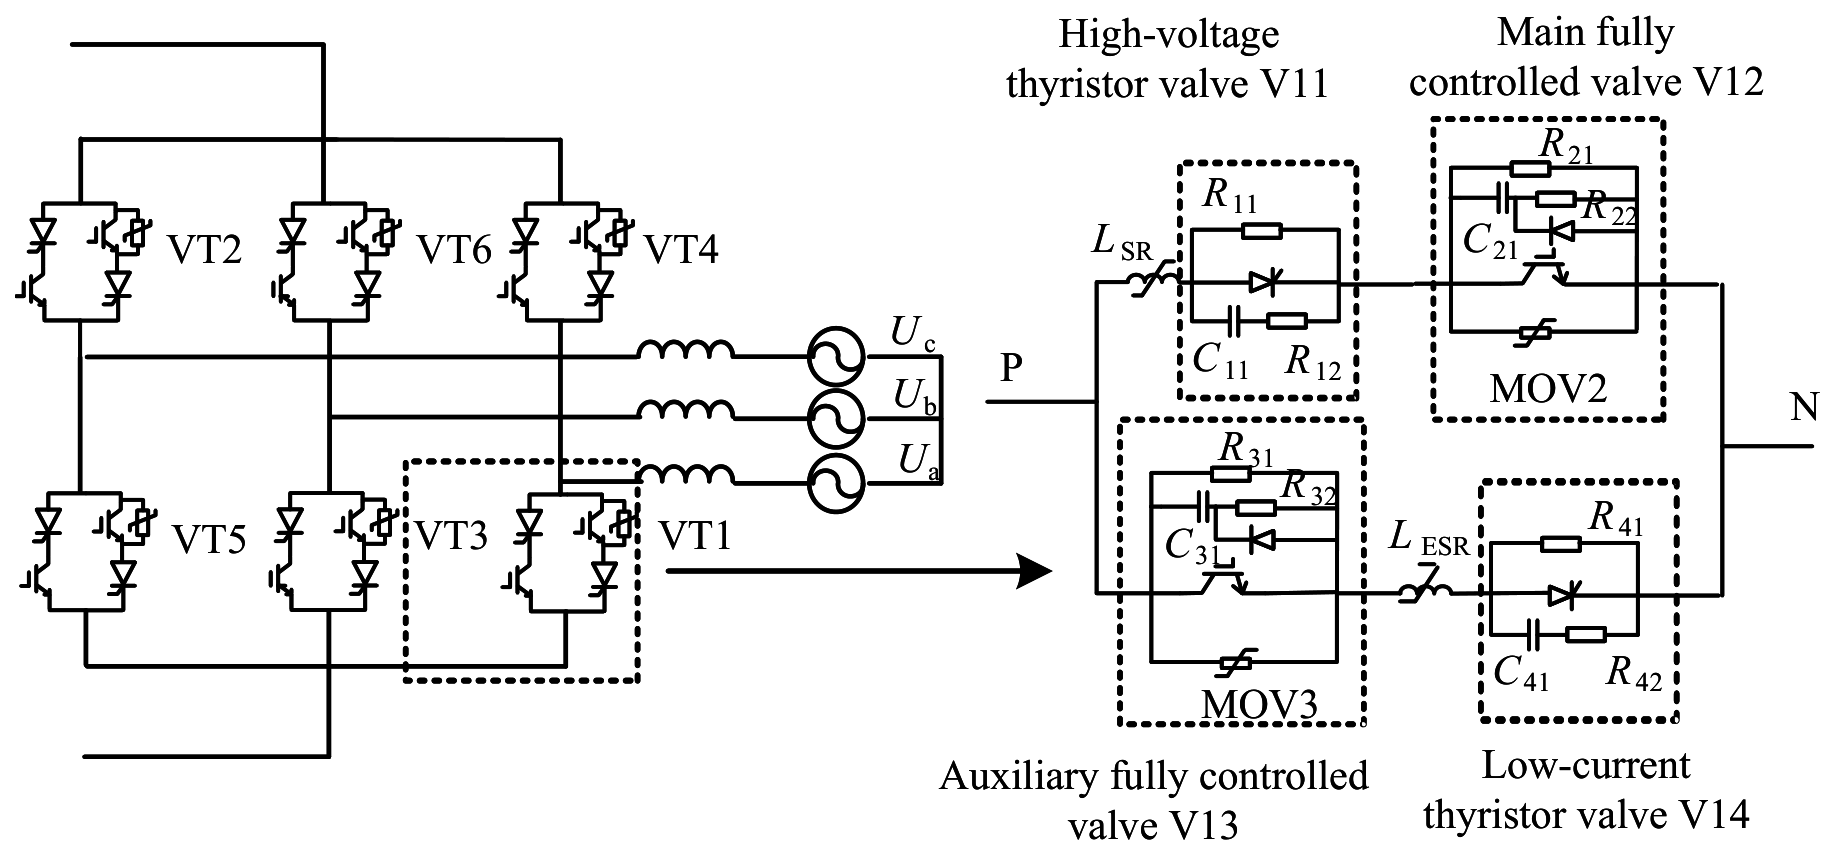
The topology of a 6-pulse CLCC converter valve is shown in Figure 1. It consists of 6 bridge arms, denoted as V1–V6. Taking bridge arm V1 as an example, each bridge arm is composed of 4 sub-valves, namely, V11, V12, V13, and V14.
Figure 1.
CLCC topology diagram.
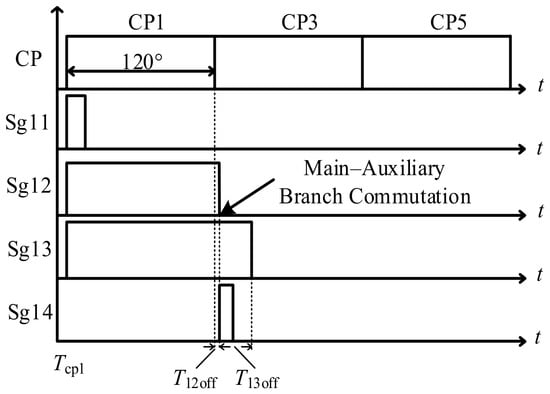
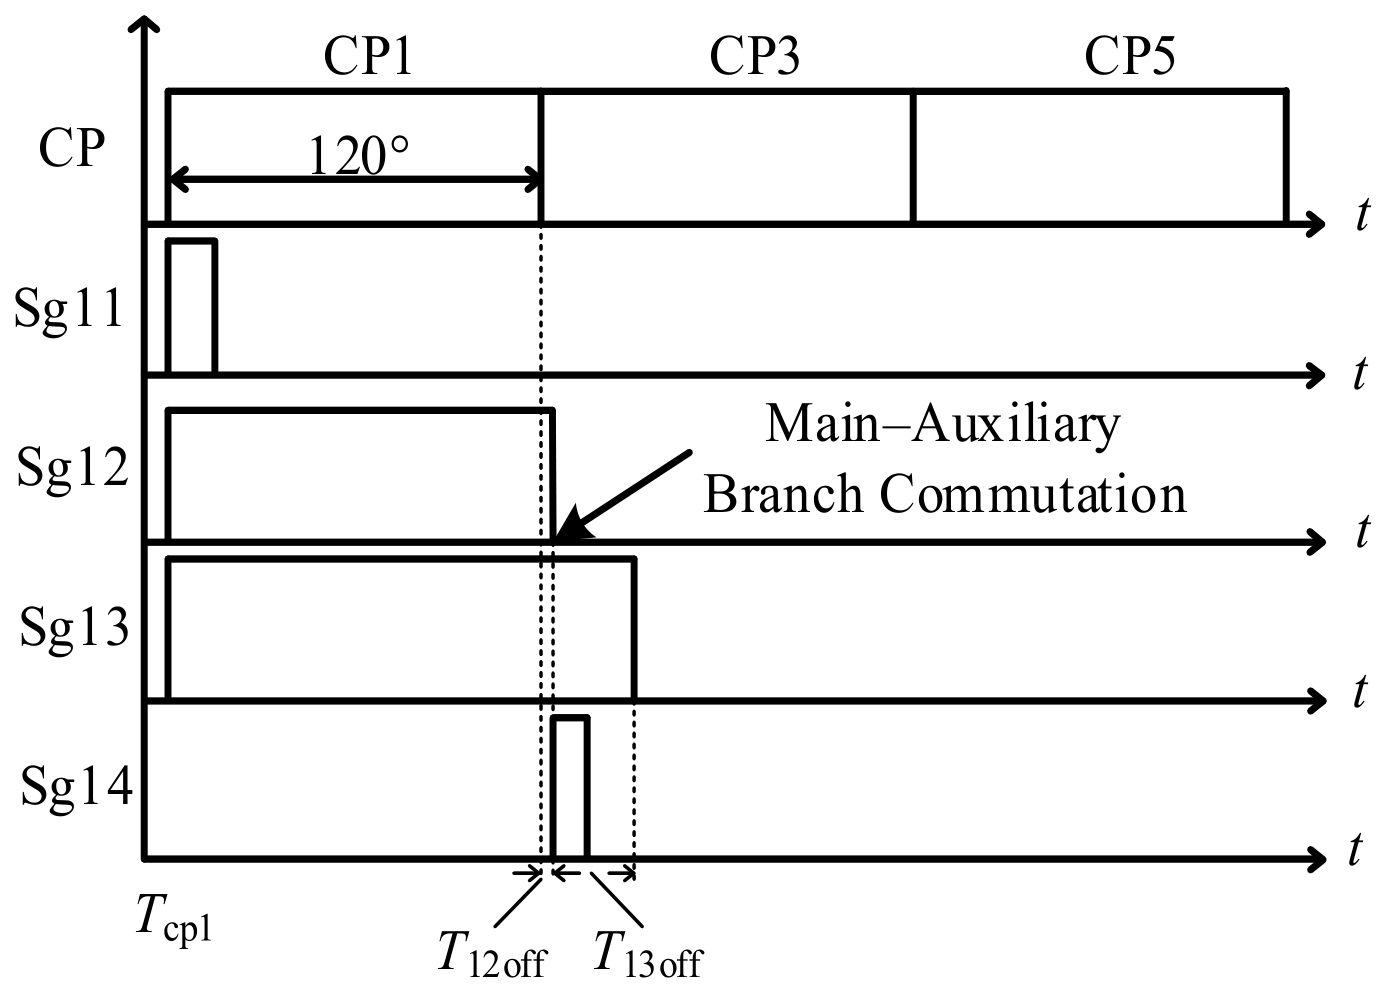
Figure 2 shows the control timing of each sub-valve in the CLCC. When the valve control system receives the firing control command from the pole control system, V11, V12, and V13 are turned on simultaneously. V11 and V12 form the main current path, while V13 remains conducting. However, since V14 is turned off, no current flows through the auxiliary branch. The commutation stage then begins. When the valve control system detects that the main-branch current is lower than the turn-off current reference value, V12 is turned off and V14 is turned on. As a result, the current is transferred from the main branch to the auxiliary branch. After a fixed delay of , V13 is also turned off, and the current is completely transferred to the next bridge arm. In addition, in the event of a fault or measurement delay, the bridge-arm current measured by the valve control system may remain higher than the turn-off current reference value. To prevent excessively delayed turn-off of V12, a turn-off cutoff time is set, which is obtained by applying a fixed delay to the firing signal.
Figure 2.
CLCC valve firing sequence.
2.2. Fault Characteristics of Single-Phase-to-Ground Faults at the Valve Side of the Converter Transformer
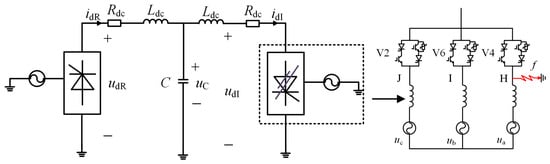
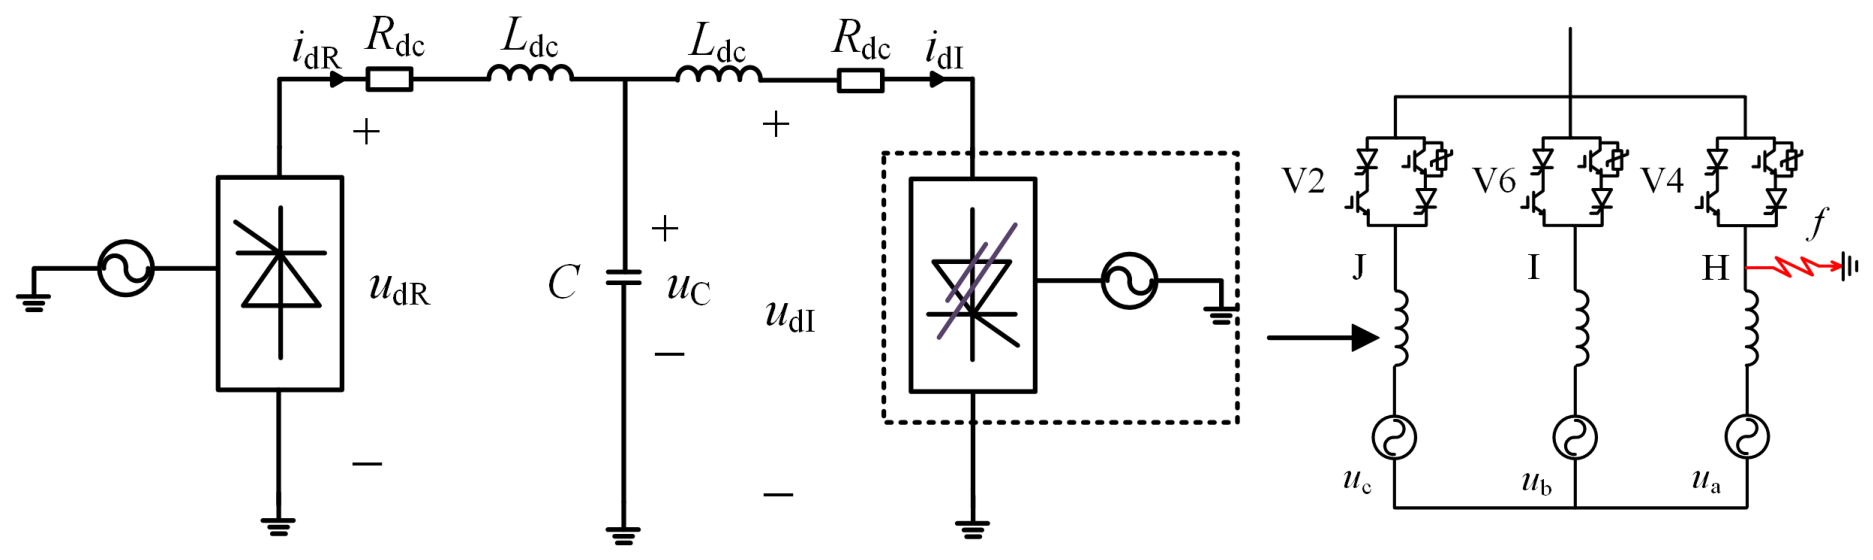
The distribution of single-phase-to-ground fault locations at the valve side of the converter transformer is shown in Figure 3. According to the neutral-point displacement theory, when a single-phase-to-ground fault occurs, the voltage of the faulted phase drops to zero, while the voltages of the healthy phases rise to line-to-line voltages, and the line-to-line voltages remain unchanged. Considering that the voltage drop across the commutation reactance is much smaller than the commutation voltage, the commutation voltage can be approximately regarded as unchanged in the subsequent analysis of the commutation process. Owing to the asymmetry of the fault, the equivalent circuit topology corresponding to the conduction of different bridge arms in the converter is different during the fault. Therefore, the transient characteristics should be discussed in stages according to the fault location and the conduction states of the valves during the fault. In this paper, a single-phase-to-ground fault at phase A on the valve side of the converter transformer is taken as an example for analysis.
Figure 3.
Fault-location distribution for a single-phase-to-ground fault at the valve side of the converter transformer.
2.2.1. Fault Analysis at K1
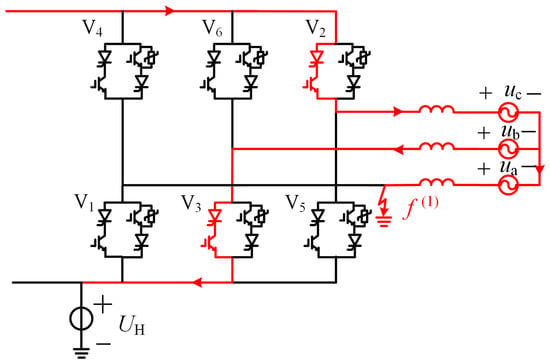
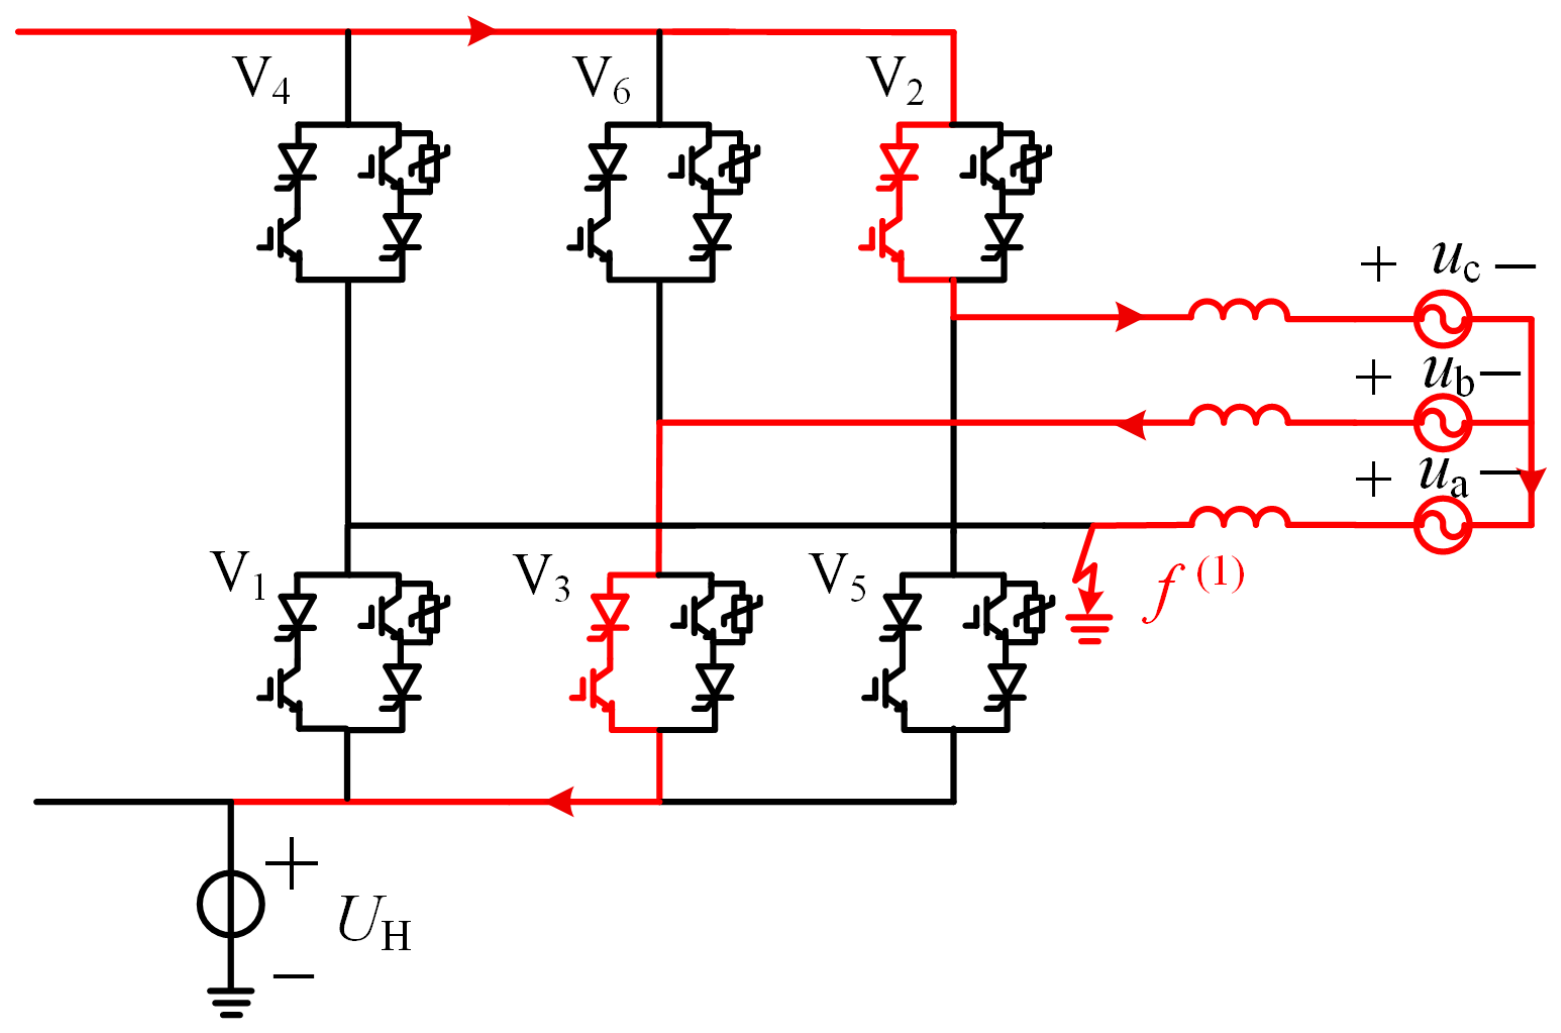
When the fault occurs at K1, the voltage established by valves V2, V3, and V4 at the fault instant can be approximately represented by an equivalent voltage . At this time, the anode potential of V1 is clamped to zero, while the anode potentials of V3 and V5 can be approximately regarded as and , respectively. Regardless of the value of t, both and are much lower than the forward voltage established by valves V2, V3, and V4. Therefore, after the fault occurs, the common-cathode valve group of valve 1 rapidly falls to zero, causing the valve group to turn off due to the large reverse voltage. Taking the conduction of V2 and V3 as an example, the equivalent circuit during the fault is shown in Figure 4.
Figure 4.
Equivalent circuit with V2 and V3 conducting during the fault.
- Transient Model of the DC System;Due to the extremely short duration of the zero-crossing turn-off process of the common-cathode valve group, its impact on the calculation accuracy of the inverter-side fault current is limited. To simplify the mathematical model and improve analysis efficiency, this process is approximately neglected when establishing the transient mathematical model of the DC system, and it is assumed that the common-cathode valve group turns off immediately after the fault occurs.The minor impact on calculation accuracy mainly stems from two factors. First, the zero-crossing turn-off process lasts only about 600 , accounting for a very small proportion of the entire post-fault transient process, so its influence on the DC current calculation throughout the whole transient period is limited. Second, the valve group provides a certain degree of voltage support for the DC system before it is fully turned off. Neglecting this process will lead to a slightly underestimated DC voltage within the first approximately 600 after the fault. However, due to the presence of the smoothing reactor in the DC line, such short-term deviation of the DC voltage has negligible effect on the rate of change of the DC current. In summary, it is justified to approximately neglect this process in DC fault current calculation.The fault current flows directly to the grounding point through the common-anode valve group, and valves 2, 3, 4 are equivalently short-circuited. The equivalent circuit of the DC system primary circuit is shown in Figure 5. In this case, the inverter-side DC voltage corresponds to the voltage from the conducting common-anode valve group to the fault point.Figure 5. Equivalent circuit of the primary DC circuit when K1 has a fault.According to the equivalent circuit, mathematical models of the primary and secondary circuits of the DC system are established as follows.
- DC line.Assuming that the DC line is represented by a T-type equivalent circuit model, the primary circuit equation of the DC line can be established according to this equivalent circuit aswhich can be rearranged aswhere is the sum of the DC line reactance and the smoothing reactor reactance; and C are the equivalent line resistance and equivalent capacitance, respectively; is the capacitor voltage; and are the DC current and DC voltage at the rectifier side, respectively; and and are the DC current and DC voltage at the inverter side, respectively.
- Secondary circuit at the rectifier side.The rectifier side adopts constant DC current control and voltage-dependent current order limiter control. The rectifier-side DC current is converted to per unit and passed through a first-order lag element, and then compared with the DC current reference. The trigger angle is generated by the PI controller, and its differential equation can be expressed aswhich can be rearranged aswhere is the time constant of the first-order lag element; denotes the firing angle on the rectifier side; and are the rectifier-side DC current and its measured value, respectively; is the DC current reference; and and are the proportional and integral coefficients of the PI controller, respectively.
- Secondary circuit at the inverter side.The inverter-side secondary circuit adopts predictive constant extinction-angle control. Based on conventional constant extinction-angle control, the DC-current derivative is introduced as a compensation term, and the control equation is expressed as [29]where is the trigger angle command; is the extinction-angle reference value; is the per-unit equivalent commutation reactance at the inverter side; is the current order; is the rated value of the DC current; is the ideal no-load DC voltage at the inverter side, and is its rated value; K is the proportional gain for current deviation; is the measured value of the DC current after passing through the first-order lag element; and is the time constant of the first-order lag element.
- Fault Segmentation and Transient Characteristic Analysis;The mathematical models of the primary and secondary circuits of the DC system established above provide a basis for solving the transient response of the DC current and the commutation process after the fault. However, to further calculate the transient characteristics of the DC current and valve current after the fault, the variation characteristics of the inverter-side DC voltage after the fault must also be clarified. Owing to the asymmetry of the fault, the equivalent circuits differ for different conduction states and commutation processes of the common-anode valve group. Therefore, the transient characteristics of the DC voltage, as well as the relationship between the valve current and the DC current, are analyzed separately for faults occurring during the non-commutation conduction period and during the commutation period.
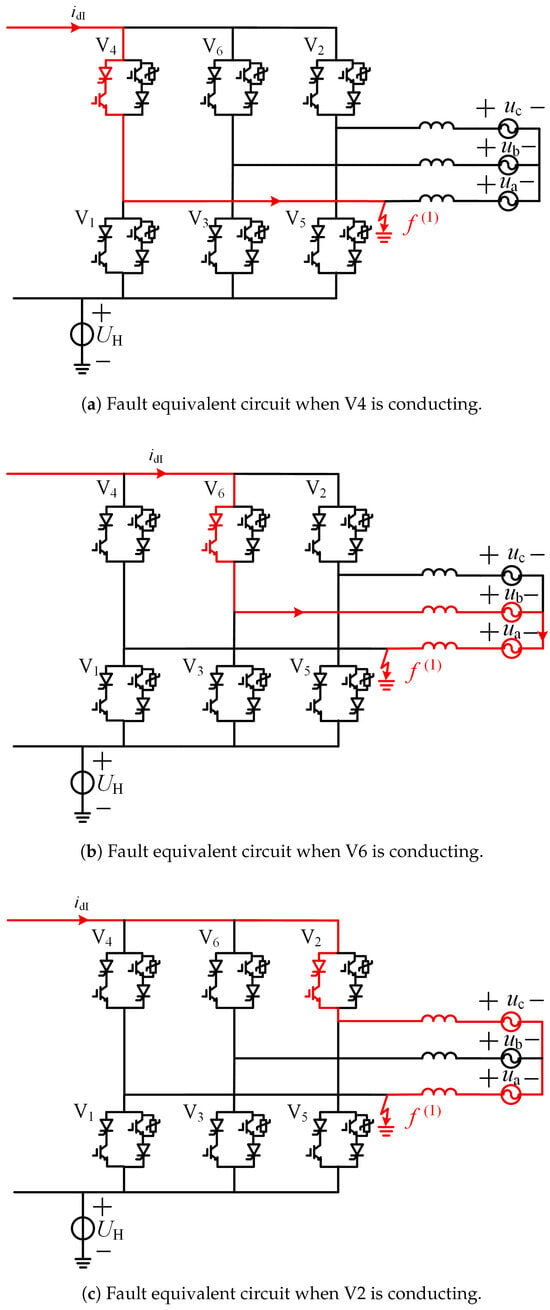
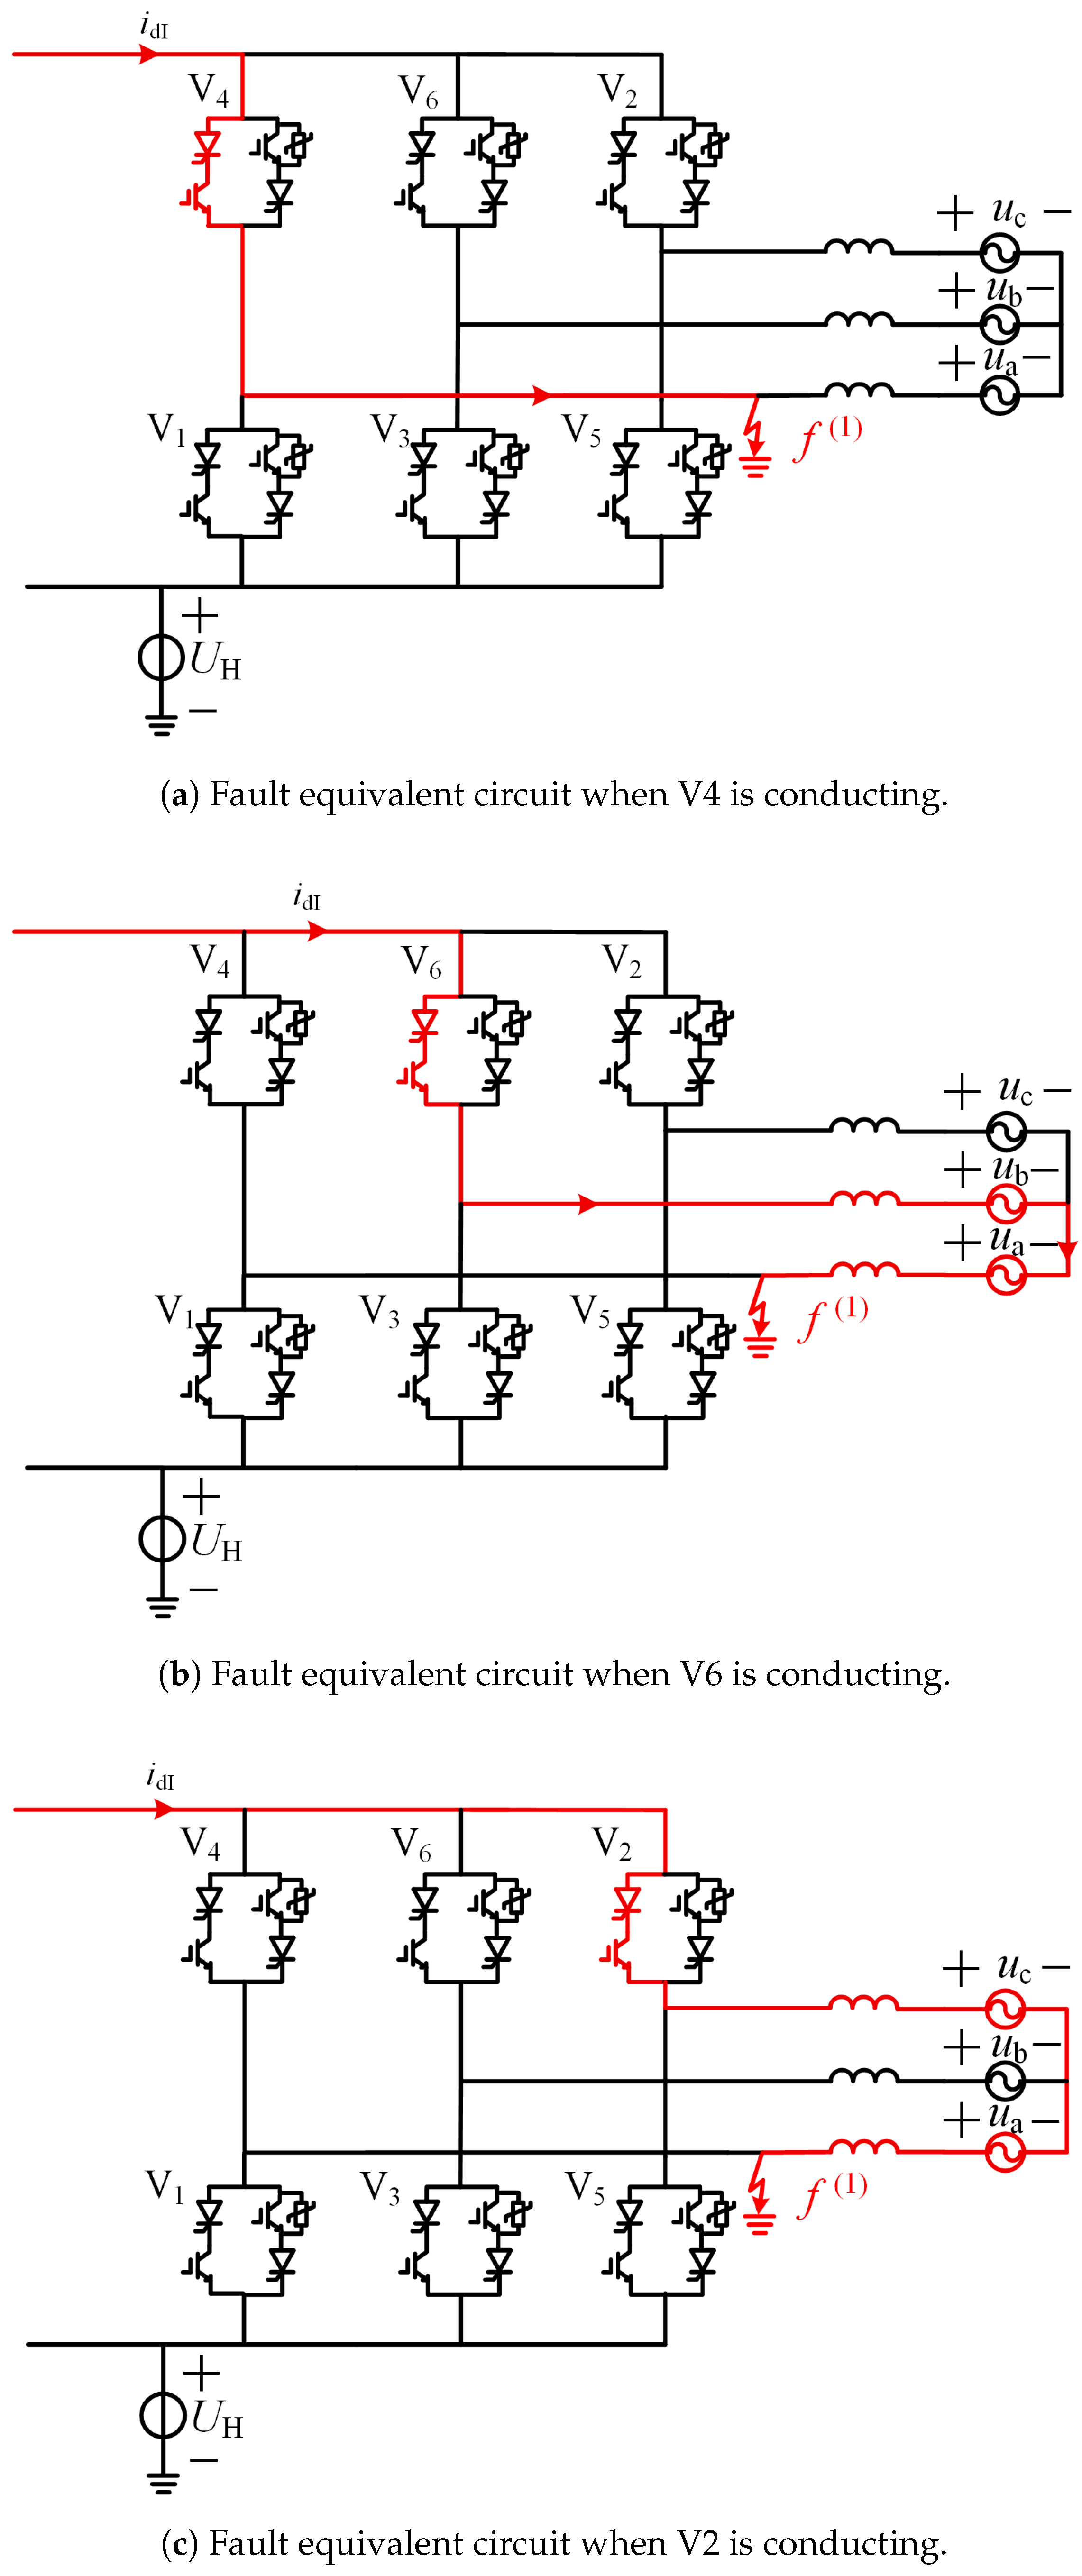
- Conduction of V4.When the fault occurs during the conduction of V4, the equivalent circuit is shown in Figure 6a. The DC current does not pass through the commutation inductor, but flows directly to the grounding point through V4. In this case, the inverter-side DC voltage is the voltage from V4 to the fault point. Since the forward voltage drop of V4 during conduction is small, can be approximated as zero.Figure 6. Fault equivalent circuits during non-commutation conduction periods. (a) Fault equivalent circuit when V4 is conducting. (b) Fault equivalent circuit when V6 is conducting. (c) Fault equivalent circuit when V2 is conducting.
- Conduction of V6.When the fault occurs during the conduction of V6, the equivalent circuit at the fault instant is shown in Figure 6b. The DC current flows through phases b and a before entering the fault point.According to the equivalent circuit, the expression of during the conduction of V6 is derived aswhere is the AC line-to-line voltage on the valve side, defined as the phase voltage of phase b minus the phase voltage of phase a, and and are defined in the same manner.
- Conduction of V2.When the fault occurs during the conduction of V2, the equivalent circuit at the fault instant is shown in Figure 6c.According to the equivalent circuit, the expression of during the conduction of V2 can be obtained as
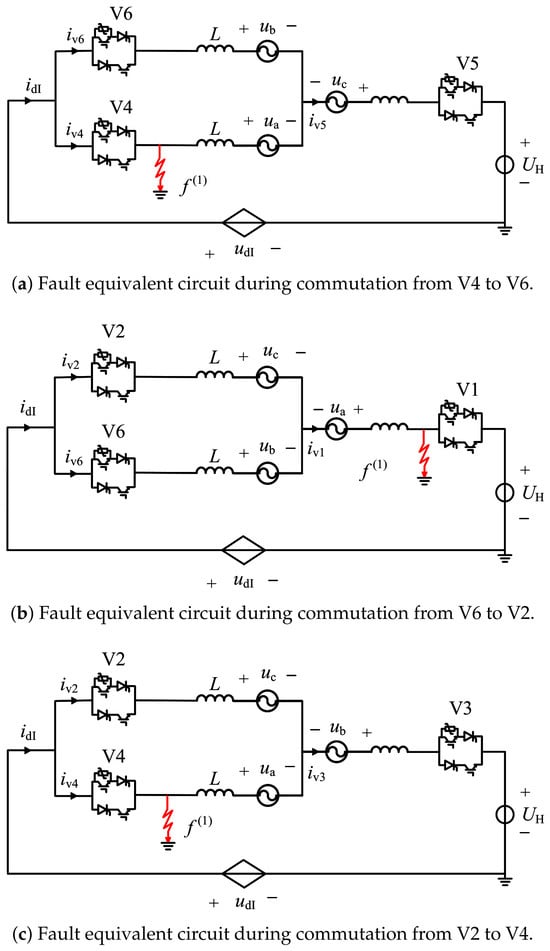
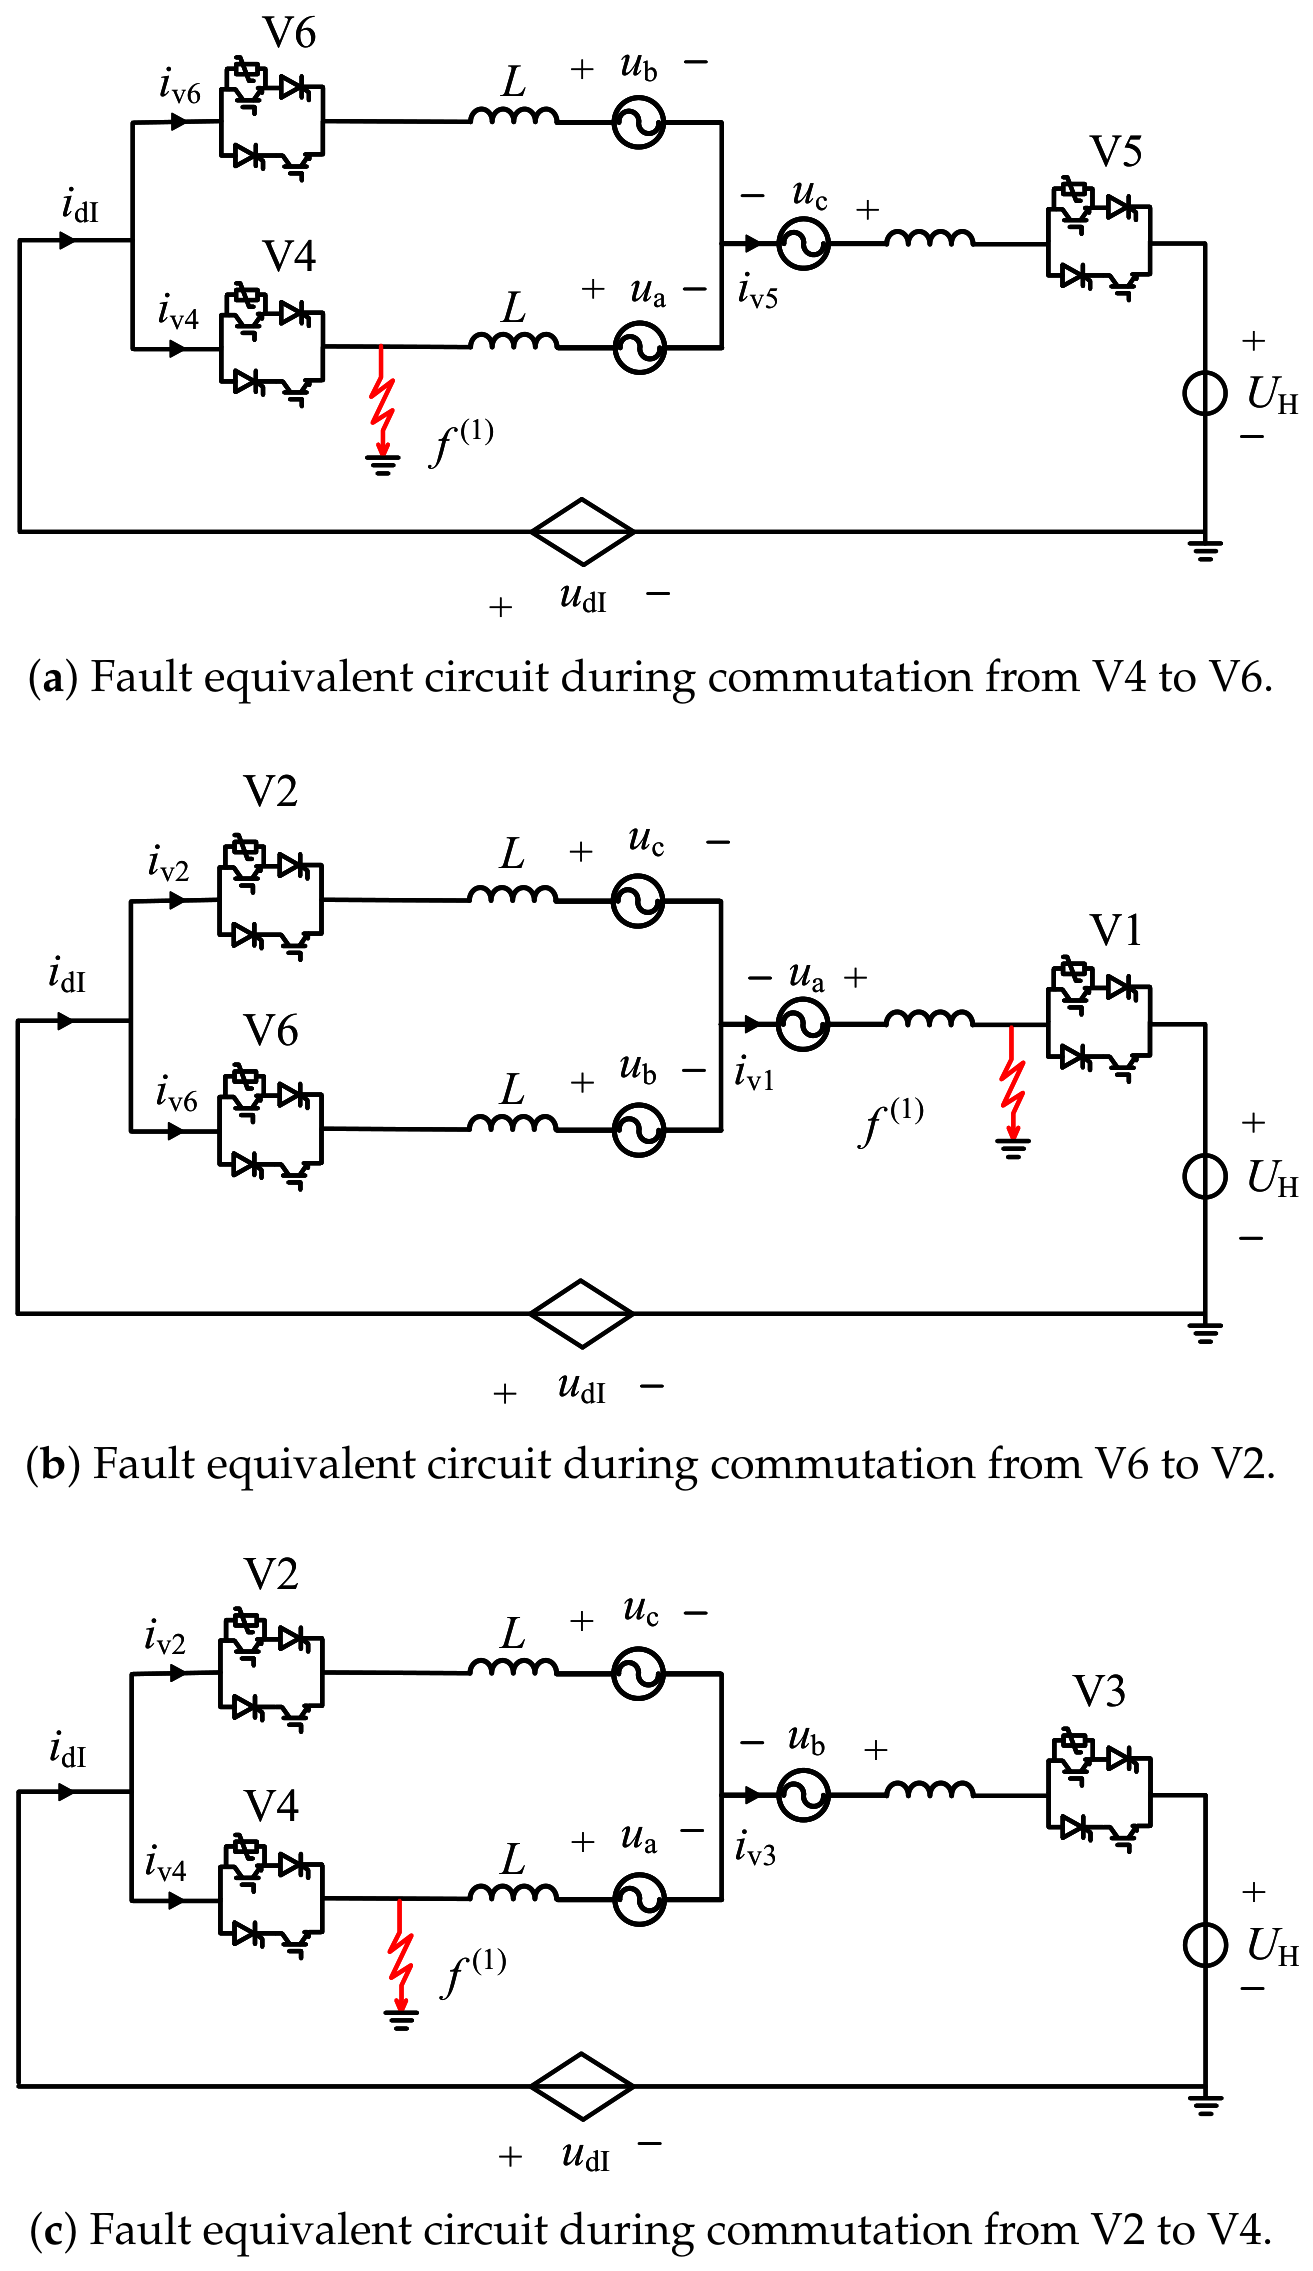
- Commutation from V4 to V6.Since the operating voltage of the CLCC arrester is higher than the peak commutation voltage, once the arrester operates, the current is rapidly transferred to the next conducting valve. Moreover, the arrester operation duration is extremely short, and its influence on the DC voltage established by the converter can also be neglected. Therefore, for the commutation process from V4 to V6, the analysis focuses on the commutation process before arrester operation and the variation characteristics of the DC voltage. Figure 7a shows the equivalent circuit of the system during commutation from V4 to V6. At this time, V4 has not yet turned off, and remains zero.Figure 7. Fault equivalent circuits during commutation periods. (a) Fault equivalent circuit during commutation from V4 to V6. (b) Fault equivalent circuit during commutation from V6 to V2. (c) Fault equivalent circuit during commutation from V2 to V4.The KVL equations for the relevant loop are given below.which can be rearranged aswhere is the current flowing through valve , .
- Commutation from V6 to V2.Figure 7b shows the equivalent circuit of the system during commutation from V6 to V2. According to the equivalent circuit, KVL equations are written for the loop from V2 to the short-circuit point, the loop from V6 to the short-circuit point, and the loop containing V2 and V6, respectively.The expression of is obtained aswhich can be rearranged as
- Commutation from V2 to V4.Figure 7c shows the equivalent circuit of the system during commutation from V2 to V4. Since V4 is conducting, is zero regardless of whether the arrester of V2 operates. Writing the KVL equations for the loop giveswhich can be rearranged as
For convenience of analysis, the phase angle of the phase-A voltage is selected as the reference. Therefore, and can be expressed aswhere is the amplitude of the valve-side phase voltage, and is the angular frequency of the AC system.Equations (9), (11), and (13) describe the differential equations of valve currents for the V4–V6, V6–V2, and V2–V4 commutation processes, respectively. To obtain the current derivatives of the outgoing valves in a unified form, the line voltage term in is equivalently transformed first. The detailed derivation of the line voltage transformation is presented as follows:By substituting the instantaneous AC line voltages into the current differential equations and rearranging the terms, the current derivative expressions of the outgoing valves for all three commutation processes are derived in a consistent form, as summarized in Equation (16).According to the preceding analysis, a single-phase-to-ground fault at the valve side of the converter transformer has little effect on the commutation voltage. Therefore, during commutation, the difference between the current variation of the valve to be turned off under fault and steady-state conditions is mainly determined by the remaining terms in the equations. When the fault occurs, the inverter-side DC voltage decreases and the DC current increases; therefore, is positive. The preceding analysis also shows that the current of the common-cathode valve group rapidly decreases to zero after the fault, so and are negative. The above equations indicate that, when a fault occurs during commutation of the common-anode valve group, the variations in the DC current and the common-cathode valve current may cause the valve current of the valve to be turned off to rise again. Among the three commutation processes, the commutation from V4 to V6 is affected most significantly by the fault, whereas the commutation from V2 to V4 is the least affected.Referring to the protection configuration of the converter protection system in the Tianguang HVDC project, the protection configurations related to single-phase-to-ground faults at the valve side of the converter transformer are listed in Table 1.Table 1. Protection configurations related to valve-side single-phase-to-ground faults of the converter transformer.In Table 1, and are the absolute maximum values of the valve-side phase currents of the Y-bridge converter and the D-bridge converter, respectively; and are the DC currents at the high-voltage side and low-voltage side of the converter, respectively; and is the maximum value of and .Among the above protection configurations, owing to the current-limiting effect of the smoothing reactor in the DC line, both the rate of rise and the magnitude of the DC current are limited during the first few milliseconds after the fault occurs. In addition, the operating thresholds of the short-circuit protection and the overcurrent protection are relatively high. Therefore, neither protection operates immediately. According to the preceding analysis, the current of the common-cathode valve group of the converter rapidly falls to zero after the fault, causing the valve group to turn off and to decrease rapidly. As a result, the difference between and increases rapidly. Overall, the fastest operating protection after the fault is the DC differential protection, with an operating delay of 5 ms.If the fault occurs exactly during the commutation stage, according to the valve control timing of the system, V12 is turned off only when the main-branch current is lower than the turn-off reference current or when the turn-off cutoff time is reached. The turn-off instant of V13 is set to be delayed by after V12 is turned off. Therefore, a delay in the turn-off of V12 further delays the instant at which the current is transferred to the arrester. If the arrester connected in parallel to V13 operates too late, the current in the valve to be turned off may fail to decay to zero before the line voltage crosses zero and becomes positive, resulting in abnormal commutation and an increase in the current transferred to the arrester. Before arrester operation, the maximum CLCC conduction duration is 3.5 ms. Therefore, before the protection operates, the CLCC sub-valves and their arresters still face certain operational risks.
2.2.2. Analysis of Faults at K2 and K3
Similar to the analysis of the K1 fault, when a fault occurs at K2, valves V3 and V4 can be approximately represented by the equivalent voltage . Since the anode potentials of V1, V3, and V5 in the common-cathode valve group are much lower than , the current of the common-cathode valve group rapidly falls to zero regardless of the conduction state inside the valve when the K2 fault occurs.
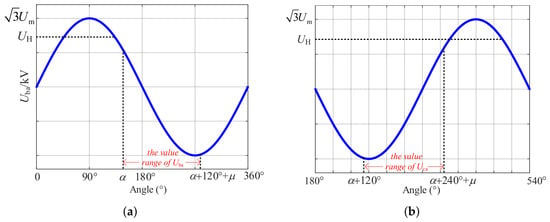
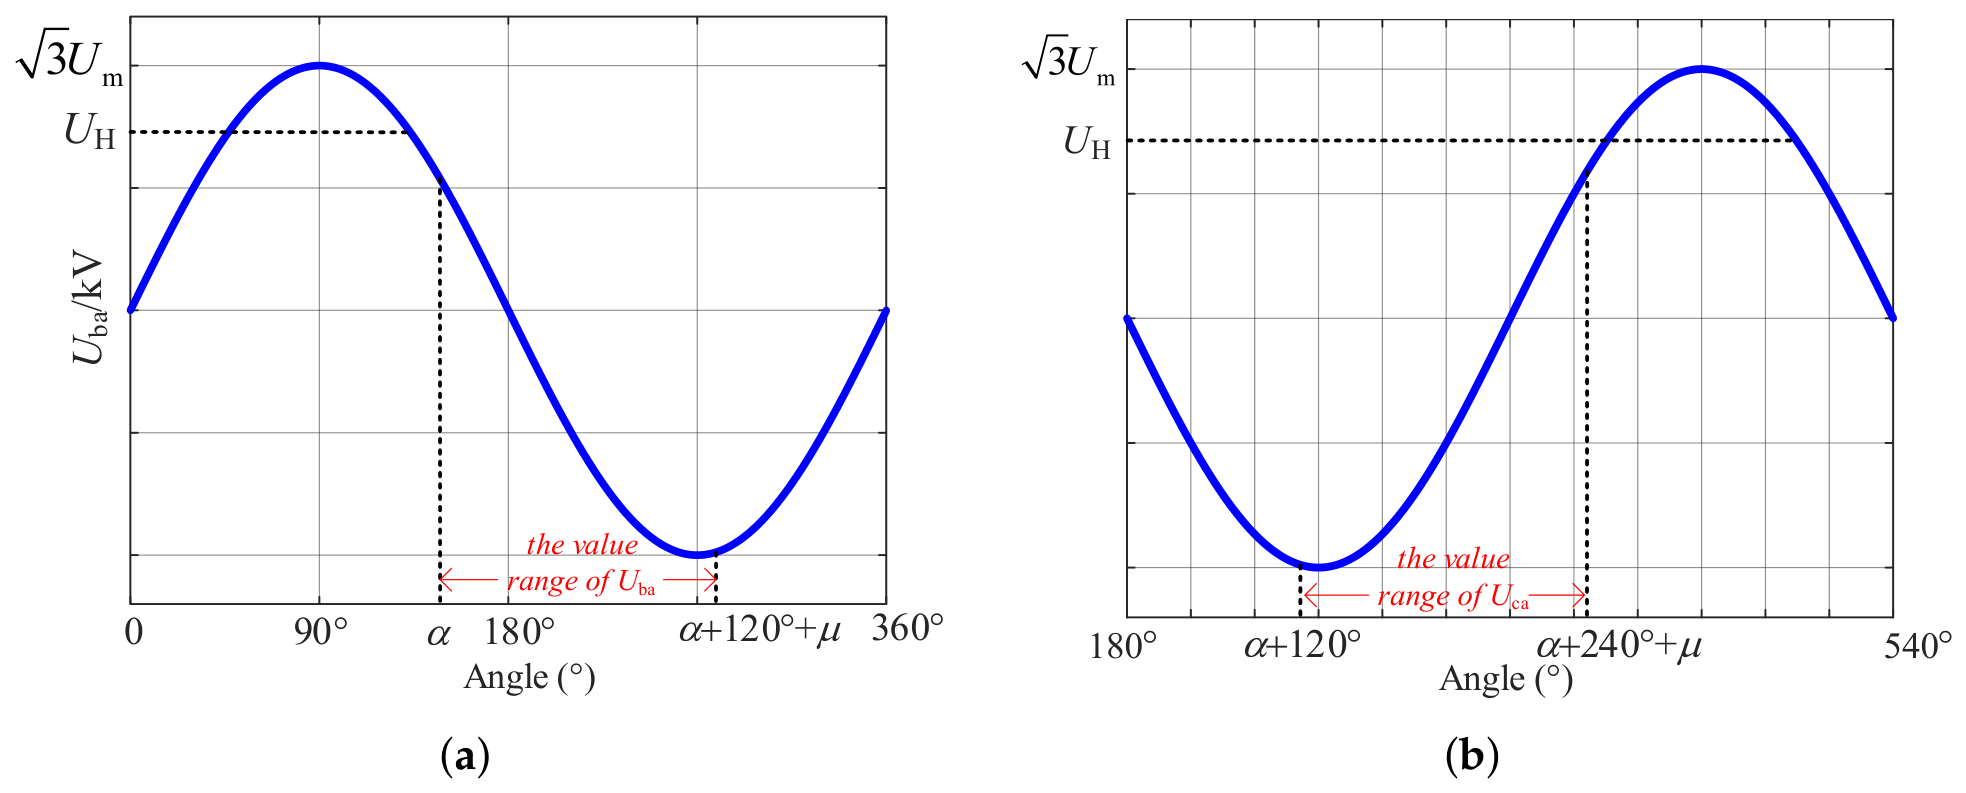
When a fault occurs at K3, valve V4 can be approximately represented by the equivalent voltage . When V3 is conducting, assuming that the trigger angle at the inverter side is , the valve voltage before V3 is triggered is the line voltage . Therefore, V3 is triggered and turned on after crosses zero, becomes positive, and then advances by an electrical angle . According to the expression of , the range of within one period during the conduction of V3 can be obtained as
where is the trigger angle, and is the commutation overlap angle.
According to the above equation, the range of during the conduction of V3 is shown in Figure 8a.
Figure 8.
Voltage ranges during valve conduction periods. (a) Range of during the V3 conduction period. (b) Range of during the V5 conduction period.
In the Figure 8 is the DC voltage established by the healthy valves below the faulty valve.
As shown in Figure 8a, V3 may conduct for a short time only when the trigger angle satisfies
Substituting the current system parameters indicates that the trigger angle must be less than . Under the current system trigger angle, when a short-circuit fault occurs at K3, V3 turns off rapidly and does not turn on again during the entire fault period.
When V5 is conducting, the range of is given by
The range of during the conduction of V5 is shown in Figure 8b.
The firing-pulse duration of the main-branch thyristor is relatively short. After the firing pulse ends, the entire bridge arm still withstands reverse voltage. Therefore, even if the valve voltage crosses zero and becomes positive near the end of the V5 conduction interval, V5 still does not conduct because no firing signal is available. Thus, V5 does not conduct throughout the entire fault period.
Based on the above analysis, when the fault location is K2 or K3, the current behavior of the common-cathode valve group is consistent with that under the K1 fault. That is, regardless of the fault occurrence instant, the current of the common-cathode valve group rapidly falls to zero, causing the valve group to turn off.
Unlike the K1 fault, the healthy valves above the faulted valve can still establish a certain DC voltage after the fault. Before the protection operates, this voltage does not change significantly and can be approximated as a steady-state constant. Therefore, the DC voltage under K2 and K3 faults can be expressed as
where and are the DC voltages established by valve V1 and valve V2, respectively.
In summary, the fault characteristics when a fault occurs at K2 or K3 are similar to those of the K1 fault. Compared with the K1 fault, however, the decrease in DC voltage and the increase in DC current after the fault are both smaller.
2.2.3. Analysis of Fault at K4
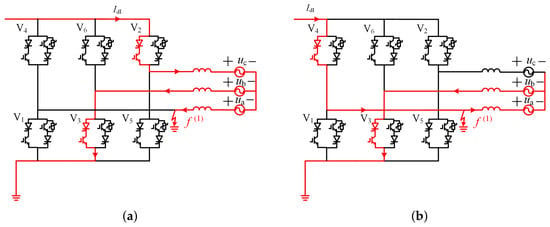
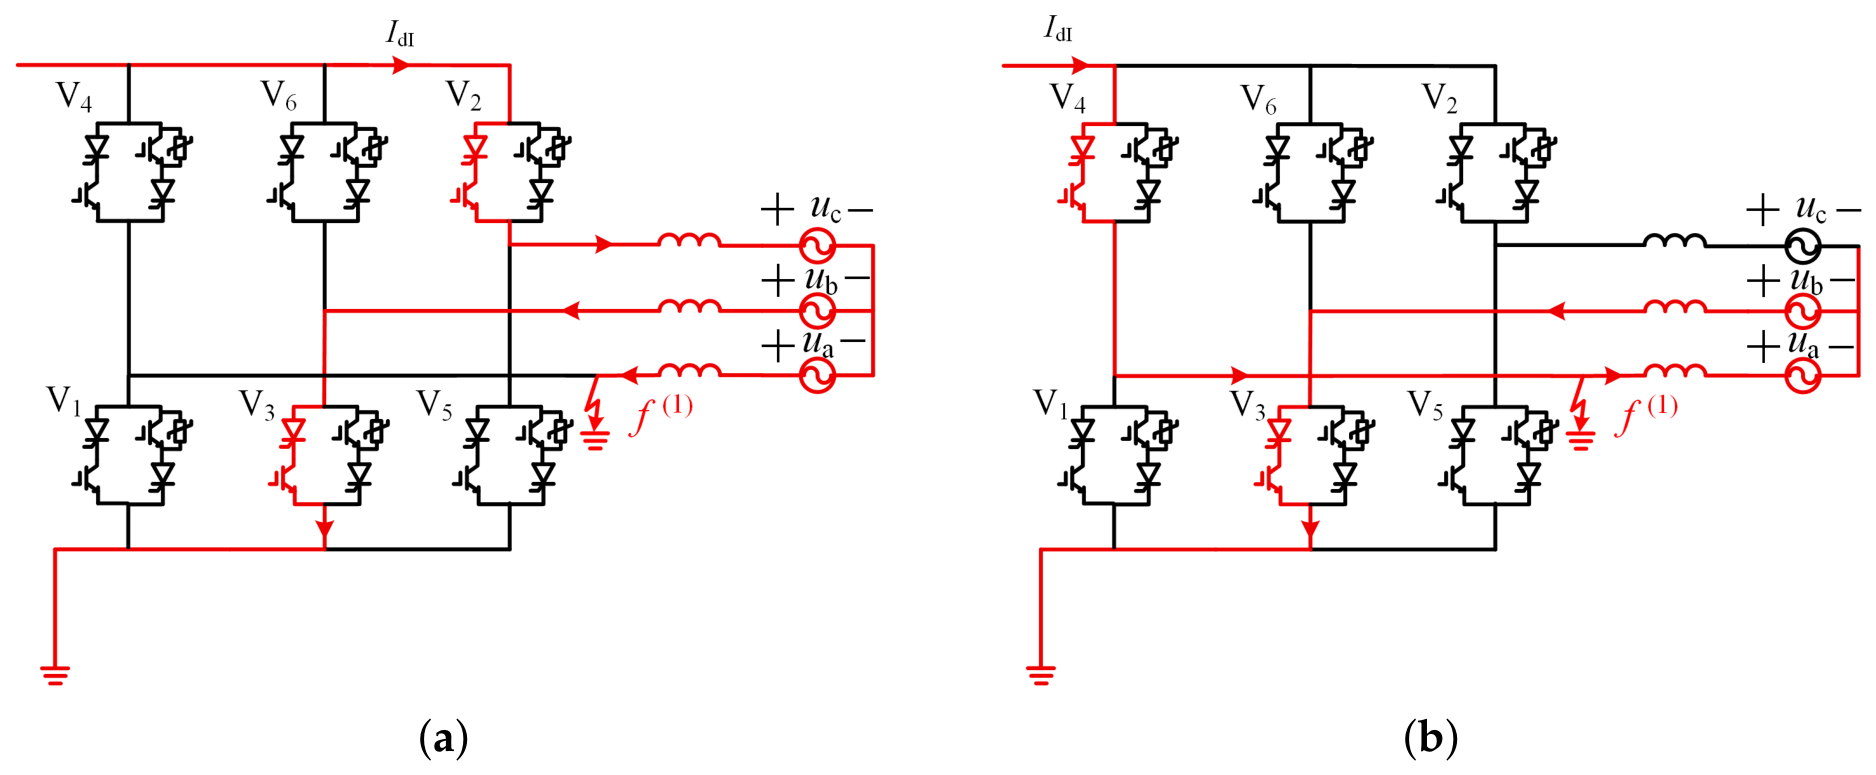
When a fault occurs at K4, the potential at point H is clamped to zero, and V1 remains blocked throughout the fault period. Whether V3 and V5 can conduct depends on the polarities of and during the firing-pulse interval of the bridge arm. As shown in Figure 8, during the firing-pulse interval of the bridge arm, changes from positive to negative, whereas remains negative. Therefore, after the fault, V5 remains blocked, while V3 conducts periodically, but its conduction duration is shorter than that under normal operation. The current paths when V2 and V3 conduct and when V3 and V4 conduct are shown in Figure 9a,b, respectively. In this case, the current flowing through V3 consists of the DC component and the AC component , and a phase-to-phase short circuit is formed between phases a and b.
Figure 9.
Current paths under the K4 fault. (a) Fault at K4 when V2 and V3 are conducting. (b) Fault at K4 when V3 and V4 are conducting.
When V3 is turned off, similar to the preceding analysis, the fault current flows through the conducting common-anode valve group directly to the fault point. If the conducting valve in the common-anode group is V6 or V2, there is no obvious difference between the equivalent circuits before and after the fault regardless of the instantaneous conduction state of the common-cathode valve group before the fault. Therefore, the DC voltage can be approximately considered unchanged before and after the fault. However, when V4 is conducting, the current flows through V4 and directly to the grounding point, causing the DC voltage to decrease and the DC current to increase. Therefore, when a fault occurs at K4, the DC current and DC voltage change significantly only when V4 is conducting. Compared with faults at K1, K2, and K3, the converter valve is subjected to the lowest electrical stress under the K4 fault.
However, because V3 conducts periodically after the K4 fault, when V3 is conducting, the current difference between the high-voltage terminal and the low-voltage terminal of the converter valve may be insufficient to satisfy the protection criterion, causing the DC differential protection to fail to operate. The most severe case occurs when V3 begins to conduct just before the DC differential protection is about to operate after the fault. By substituting the system trigger angle into Equation (18), the electrical angle from the instant when V3 conducts to the instant when the voltage changes from positive to negative is calculated to be 41 degrees. Since the threshold of the DC differential protection is extremely small, once the voltage across V3 becomes negative, the current difference between the high-voltage terminal and the low-voltage terminal of the converter valve can reach the operating setting within a very short time. Calculations show that the maximum protection operating delay can reach 12.4 ms. Therefore, although the K4 fault has the lowest severity, the delayed protection operation may cause the trigger angle to increase over time as the DC voltage drops and the DC current rises after the fault, thereby increasing the risk of abnormal CLCC commutation and device overstress.
In summary, among single-phase-to-ground faults at the valve side of the converter transformer, the fault at K1 is the most severe. Faults at K2 and K3 have characteristics similar to those of the K1 fault, but their severity is lower. Under the K4 fault, the variations in DC voltage and DC current are the smallest, but delayed protection operation may occur. When valve-side single-phase-to-ground faults occur in the converter transformer at any of the above four locations, the turn-off of the CLCC main branch may be delayed because the main-branch turn-off criterion is not satisfied, which may further lead to abnormal commutation and device overstress.
2.3. Coordinated Turn-Off Control Strategy for the Main and Auxiliary Branches Based on Valve-Current Extreme Prediction
Based on the foregoing transient-characteristic analysis, the evolution of the valve-current extreme during post-fault commutation is further analyzed, and a coordinated turn-off control strategy for the main and auxiliary branches based on valve-current extreme prediction is proposed.
When the main-branch fully controlled sub-valve does not interrupt the current, an instantaneous forward turn-off voltage cannot be established. Once a fault occurs suddenly, especially when the fault severity is relatively low, the initial fluctuation of the DC current is small, and V12 may continuously conduct during the first cycle. In this case, it cannot provide an effective reverse voltage for the thyristor in sub-valve V11, which is unfavorable for its recovery of blocking capability under reverse voltage and may lead to the risk of commutation failure. Therefore, from the perspective of fully preventing commutation failure, the main-branch fully controlled sub-valve should periodically interrupt the current.
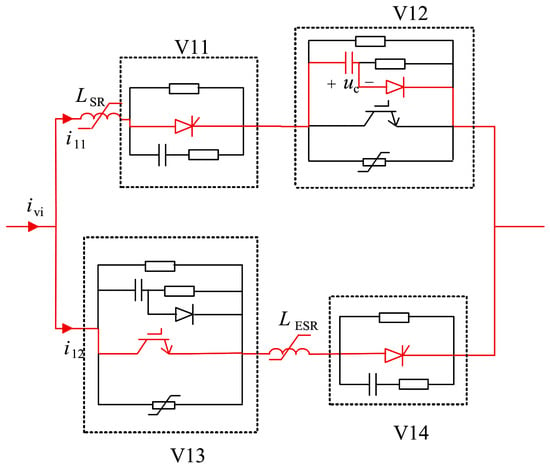
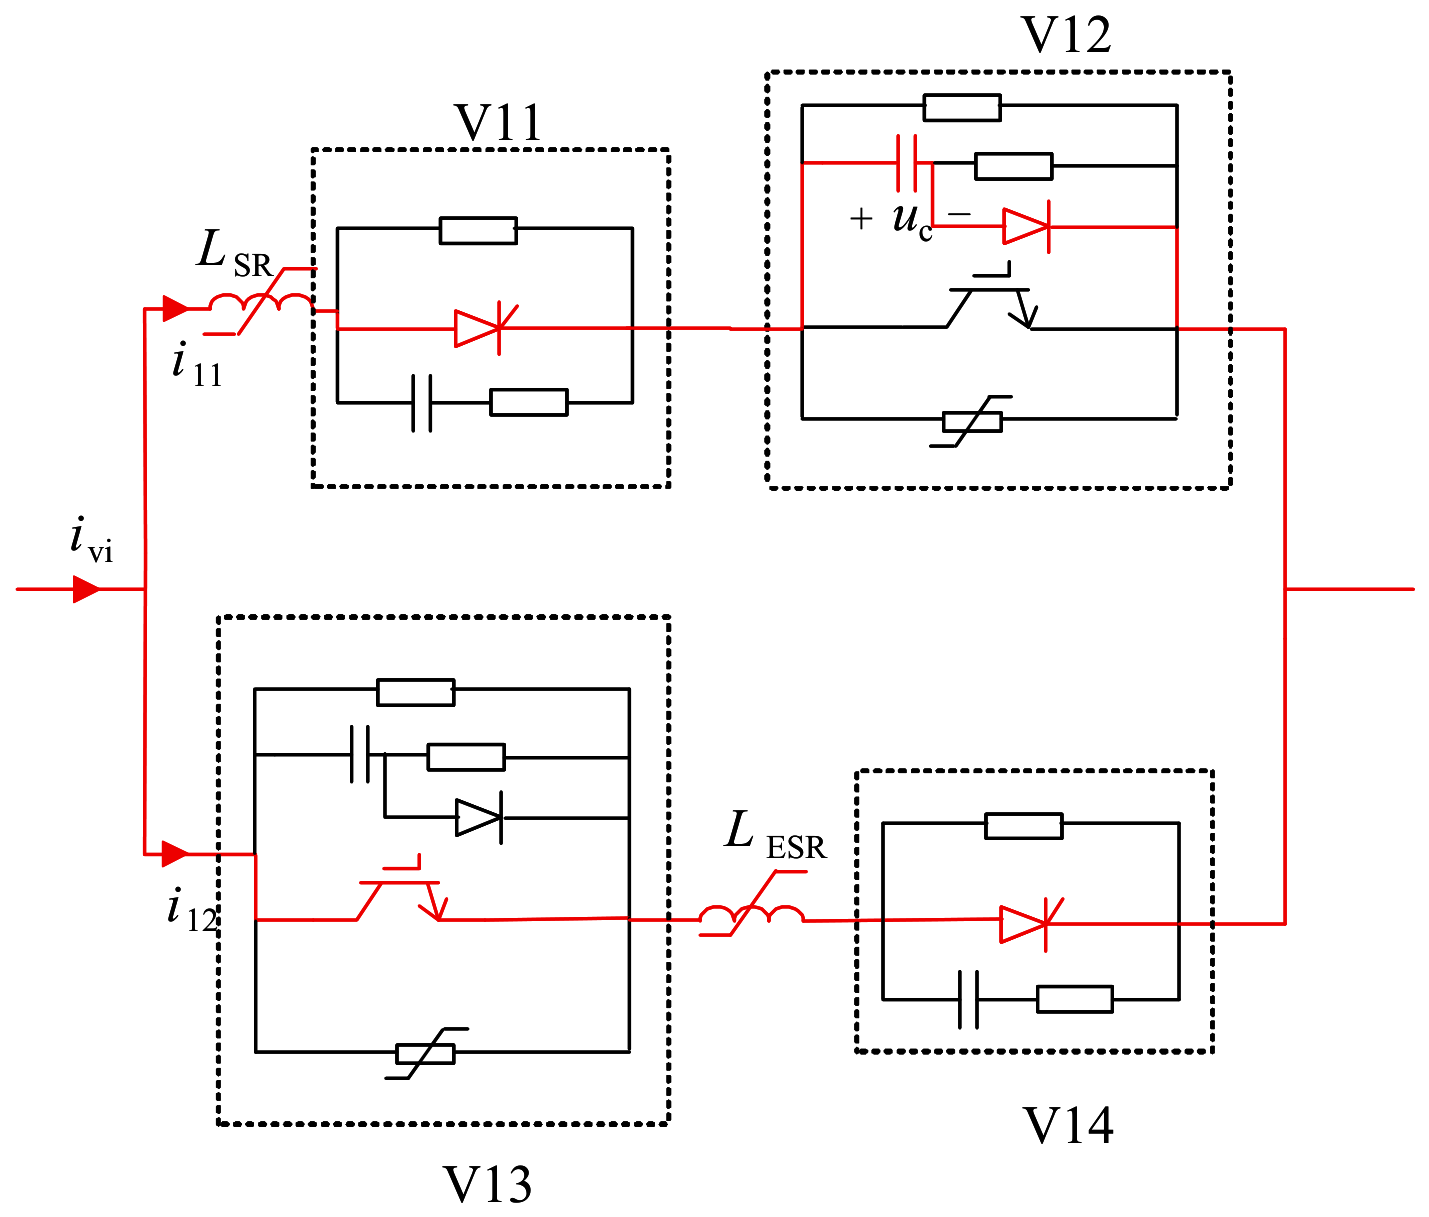
Figure 10 shows the equivalent circuit inside the valve after the main-branch IGBT interrupts the current. The relationship between the capacitor voltage and the turn-off current can be expressed as
where is the voltage of the capacitor connected in parallel with the main-branch IGBT, and C is its capacitance.
Figure 10.
Equivalent circuit for main and auxiliary branch switching.
Therefore, the larger the turn-off reference current of the main branch, the higher the turn-off voltage of sub-valve V12. In addition, the discharge loss of the V12 damping circuit is proportional to the square of the voltage. To reduce the voltage stress on the IGBT and decrease the discharge loss of the circuit, the turn-off current level of V12 should be set relatively low.
When V13 remains conducting, the turn-off voltage of V12 is applied in reverse across V11 and turns it off. Therefore, the minimum conduction time of V13 should not be shorter than the sum of the current transfer time between the main and auxiliary branches and the time required to provide reverse voltage for V11.
The current transfer time between the main and auxiliary branches is analyzed as follows. Since the capacitance connected in parallel with V12 is very small, the capacitor charging time is extremely short. Thus, it can be assumed that after the capacitor voltage reaches its peak value, the main-branch current begins to transfer to the auxiliary branch. The relationship among the main-branch current, the auxiliary-branch current, and the capacitor voltage can be expressed as
where and are the main-branch current and auxiliary-branch current in the bridge arm, respectively; represents the inductance of the saturable reactor in the main branch and other stray inductances; and represents the inductance of the saturable reactor in the auxiliary branch and other stray inductances; represents the bridge arm current.
Substituting Equation (21) into Equation (22), the differential equation for the capacitor voltage can be obtained as
The decreasing trajectory of during commutation is approximately treated as linear; therefore, can be regarded as a constant. Two intermediate variables, A and B, are defined as
Then, the differential equation of can be written as
With the initial conditions and , the expression for can be obtained by solving the differential equation as
where is the turn-off voltage of sub-valve V12, and is the turn-off reference current of the main branch.
When becomes zero, the main-branch current has been completely transferred to the auxiliary branch. Therefore, by setting , the expression for the current transfer time between the main and auxiliary branches can be obtained as
After V12 is turned off, the minimum delay time for turning off V13, denoted as , can be expressed as
where is the time during which the main-branch thyristor needs to withstand reverse voltage for turn-off, and is a margin parameter used to characterize the extension of the current switching time between the main and auxiliary branches caused by valve-current fluctuation and desaturation of the saturable reactors during faults.
According to the range of the arctangent function, the maximum value of this time is . Substituting the other system parameters into the equation yields the maximum current transfer time. Considering the increase in inductance caused by the desaturation of the saturable reactors in the main and auxiliary branches, the maximum inductances of the main and auxiliary branches are substituted into (28), giving a maximum current transfer time of . Therefore, is set to . Substituting the relevant parameters into the above equation gives . This time has the following significance: when the conduction time of is no less than , can obtain a sufficiently long reverse-voltage application time under all operating conditions, thereby avoiding turn-off failure caused by insufficient reverse-voltage duration.
Taking the commutation from V4 to V6 as an example, the expression for the valve-current extreme is derived. The valve current of V4 can be expressed as
Under steady-state conditions, . Therefore, the sign of depends on the sign of the line voltage . When increases from a negative value to zero, the V4 valve current reaches its extremum, and this instant is defined as the valve-current extreme . If the current has not decreased to zero at and the auxiliary branch V13 of V4 has not yet been turned off, the valve current of V4 will increase again until the arrester is triggered. Before V6 conducts, the voltage across V6 is . When crosses zero, becomes positive, and then advances by the electrical trigger angle , V6 is triggered and turned on. Assuming that the instant when V6 is turned on is , can be obtained from the expression of the line voltage as
Then, the expression of during the commutation from V4 to V6 can be written as
At this time, the valve-current extreme of V4 is
This expression indicates that, after this duration has elapsed from the start of commutation, the current of the valve to be turned off reaches its extremum. As long as , V13 can be turned off before the valve current increases under any steady-state operating condition.
Under fault conditions, according to the analysis in Section 2.2.1, the valve-current expression changes to Equation (16). In this case, is positive, while and are negative, causing the valve-current extreme to shift. When the fault occurs in phase A, the extremes during the turn-off of V4 and V6 move forward at the fault instant, whereas the extreme of V2 is delayed. For the cases in which the extreme moves forward, a margin coefficient should be considered when designing the turn-off delay times of V12 and V13, in order to characterize the influence of the fault on the valve-current extreme. Based on the mathematical models of the primary circuit and control system of the aforementioned DC system, the variation characteristics of the DC current during the fault transient are analyzed. Combined with (16), the effect of this variation on the prediction accuracy of the valve-current extremum is estimated. The results show that the maximum time deviation of the extremum caused by the dynamic variation in the DC current is . In addition, following the occurrence of the fault, the DC voltage drops rapidly. The low-voltage current-limiting control reduces the DC current reference , thereby increasing the firing angle on the inverter side according to (5). Owing to the communication delay within the station, the measured firing angle used for extremum prediction may lag behind its actual variation, causing the predicted extremum time to be later than the actual time. Considering the above effects and measurement errors, and allowing for a certain time margin, is set to in this paper.
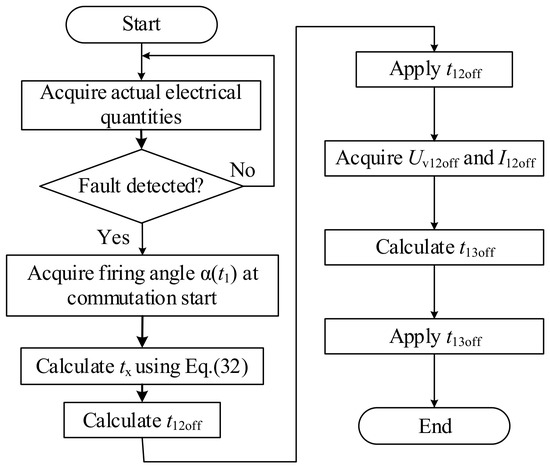
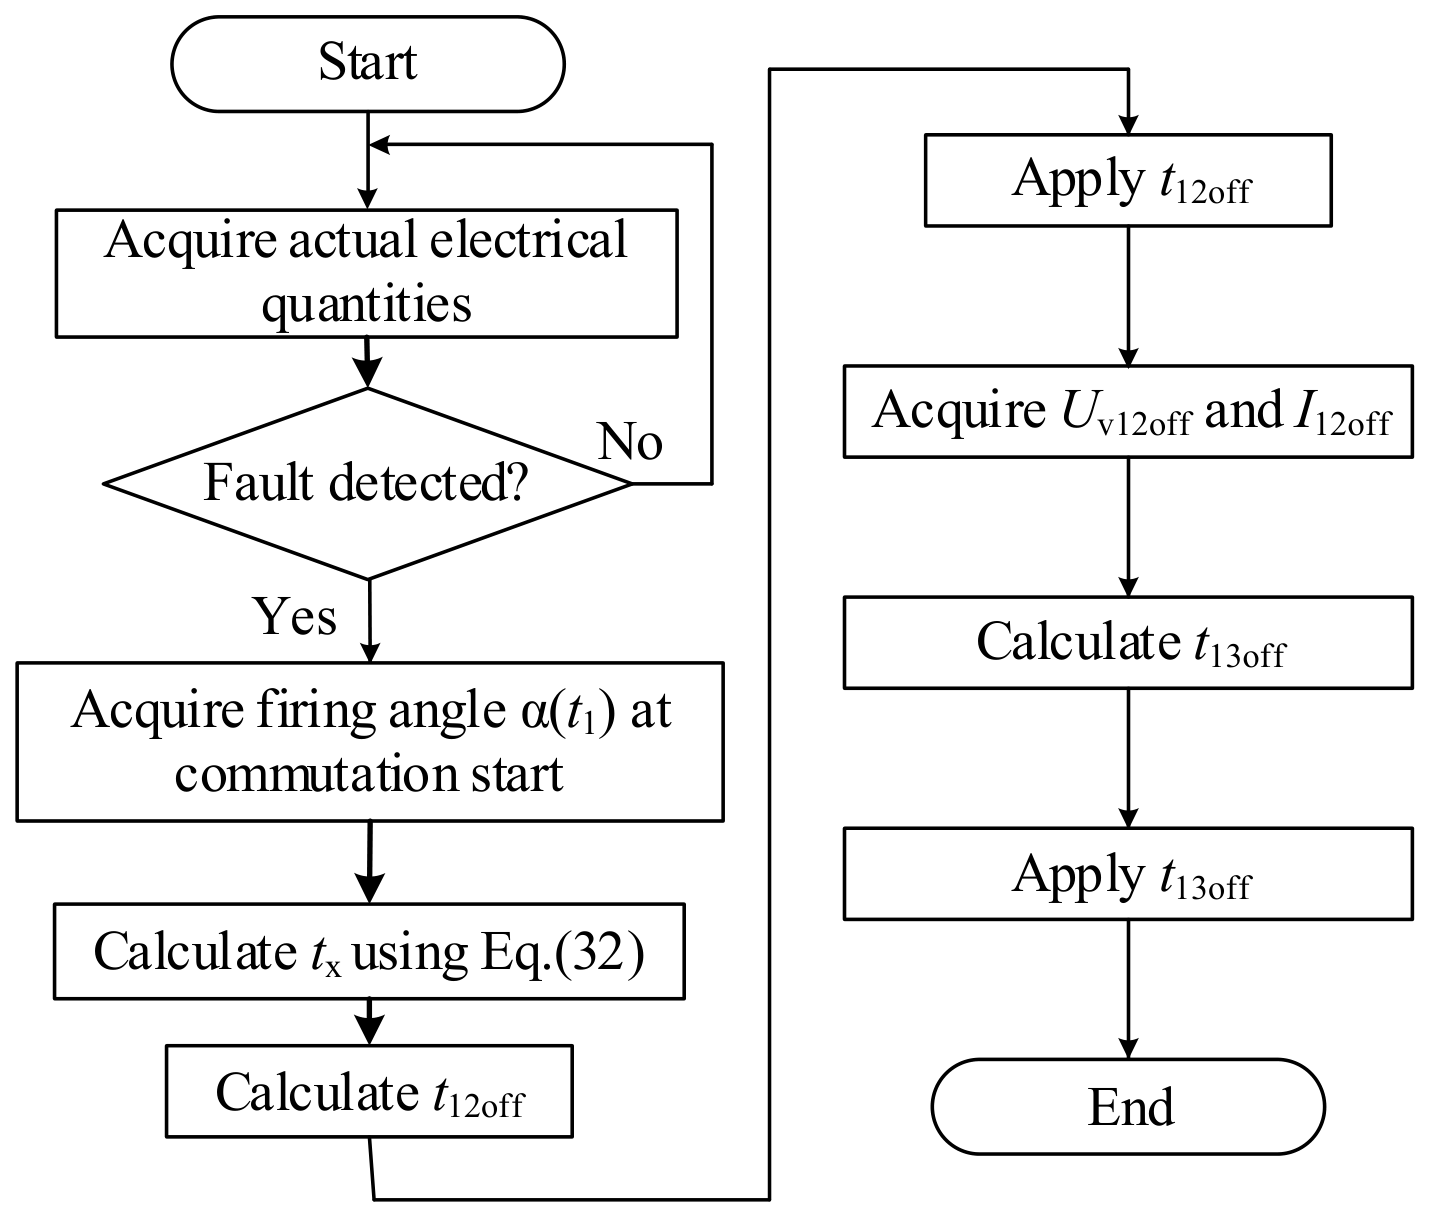
The calculation and implementation process of and under fault conditions is shown in Figure 11. This paper adopts the DC differential protection operating equation from the Tian-Guang HVDC project as the fault detection criterion. The DC-side currents at the high-voltage and low-voltage terminals are measured by current transformers, and then substituted into the operating equation in Table 1 for calculation to determine whether a fault occurs.
Figure 11.
Calculation and implementation process of the turn-off delay times for valves V12 and V13.
First, the DC currents at the high-voltage and low-voltage terminals of the converter are measured. The fault detection module then determines whether a fault has occurred. When the fault detection module detects that the current difference between the high-voltage and low-voltage terminals exceeds the operating threshold, the proposed valve control strategy is activated.
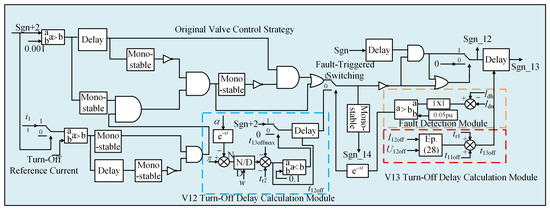
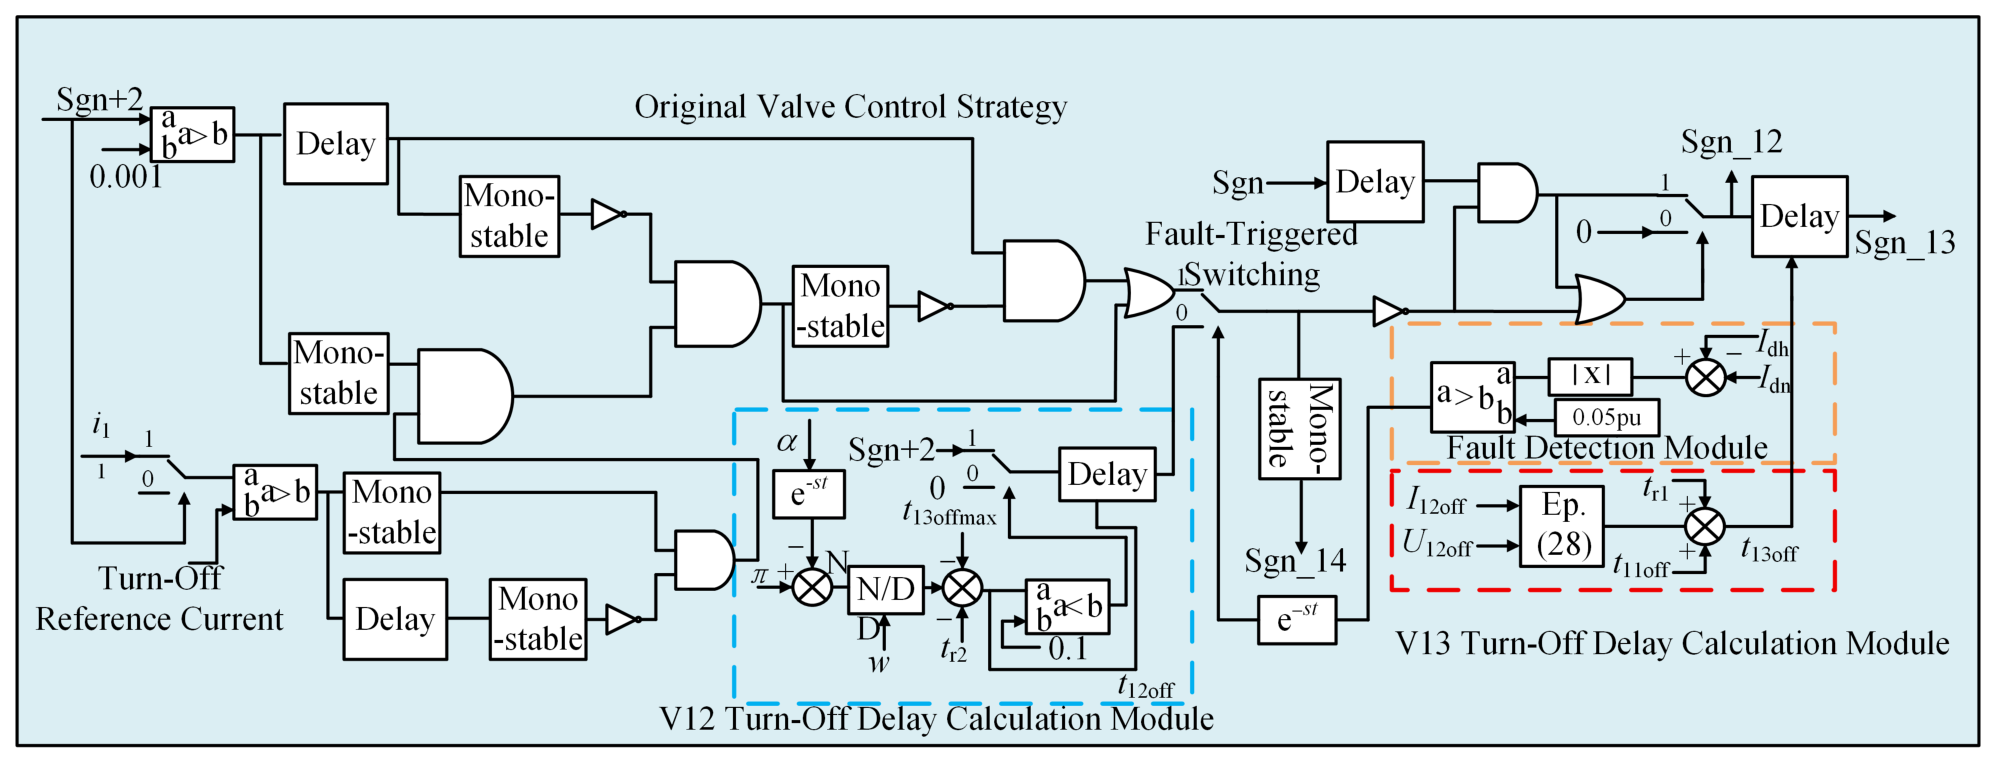
The coordinated turn-off control strategy for the main and auxiliary branches based on valve-current extreme prediction is shown in Figure 12. To emulate the delay effects of measurement, communication, and other signals in practical engineering systems, a signal delay module was integrated when developing the fault-detection and shutdown-time calculation modules. This approach provides a unified representation of the overall delay characteristics of the fault-detection and control-execution paths in the actual system.
Figure 12.
Block diagram of the proposed control strategy.
First, the instantaneous trigger angle is measured at the beginning of commutation, and the time required for the valve current to reach the extreme is calculated using . Then, the turn-off delay time of V12 under the current trigger angle is determined by subtracting the constant and the margin coefficient from . Next, by measuring the main-branch current and sub-valve voltage at the turn-off instant of V12, the current transfer time between the main and auxiliary branches is calculated according to Equation (28), and the actual turn-off delay time of V13 is further obtained. This is done to ensure that the proposed control strategy can transfer the current to the arrester before the valve current reaches its extreme under all fault conditions.
2.4. Implementation Plan for Hardware-in-the-Loop Validation of the Proposed Method
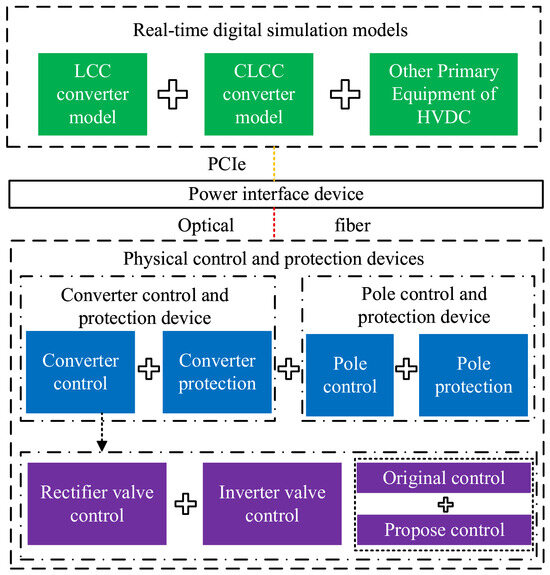
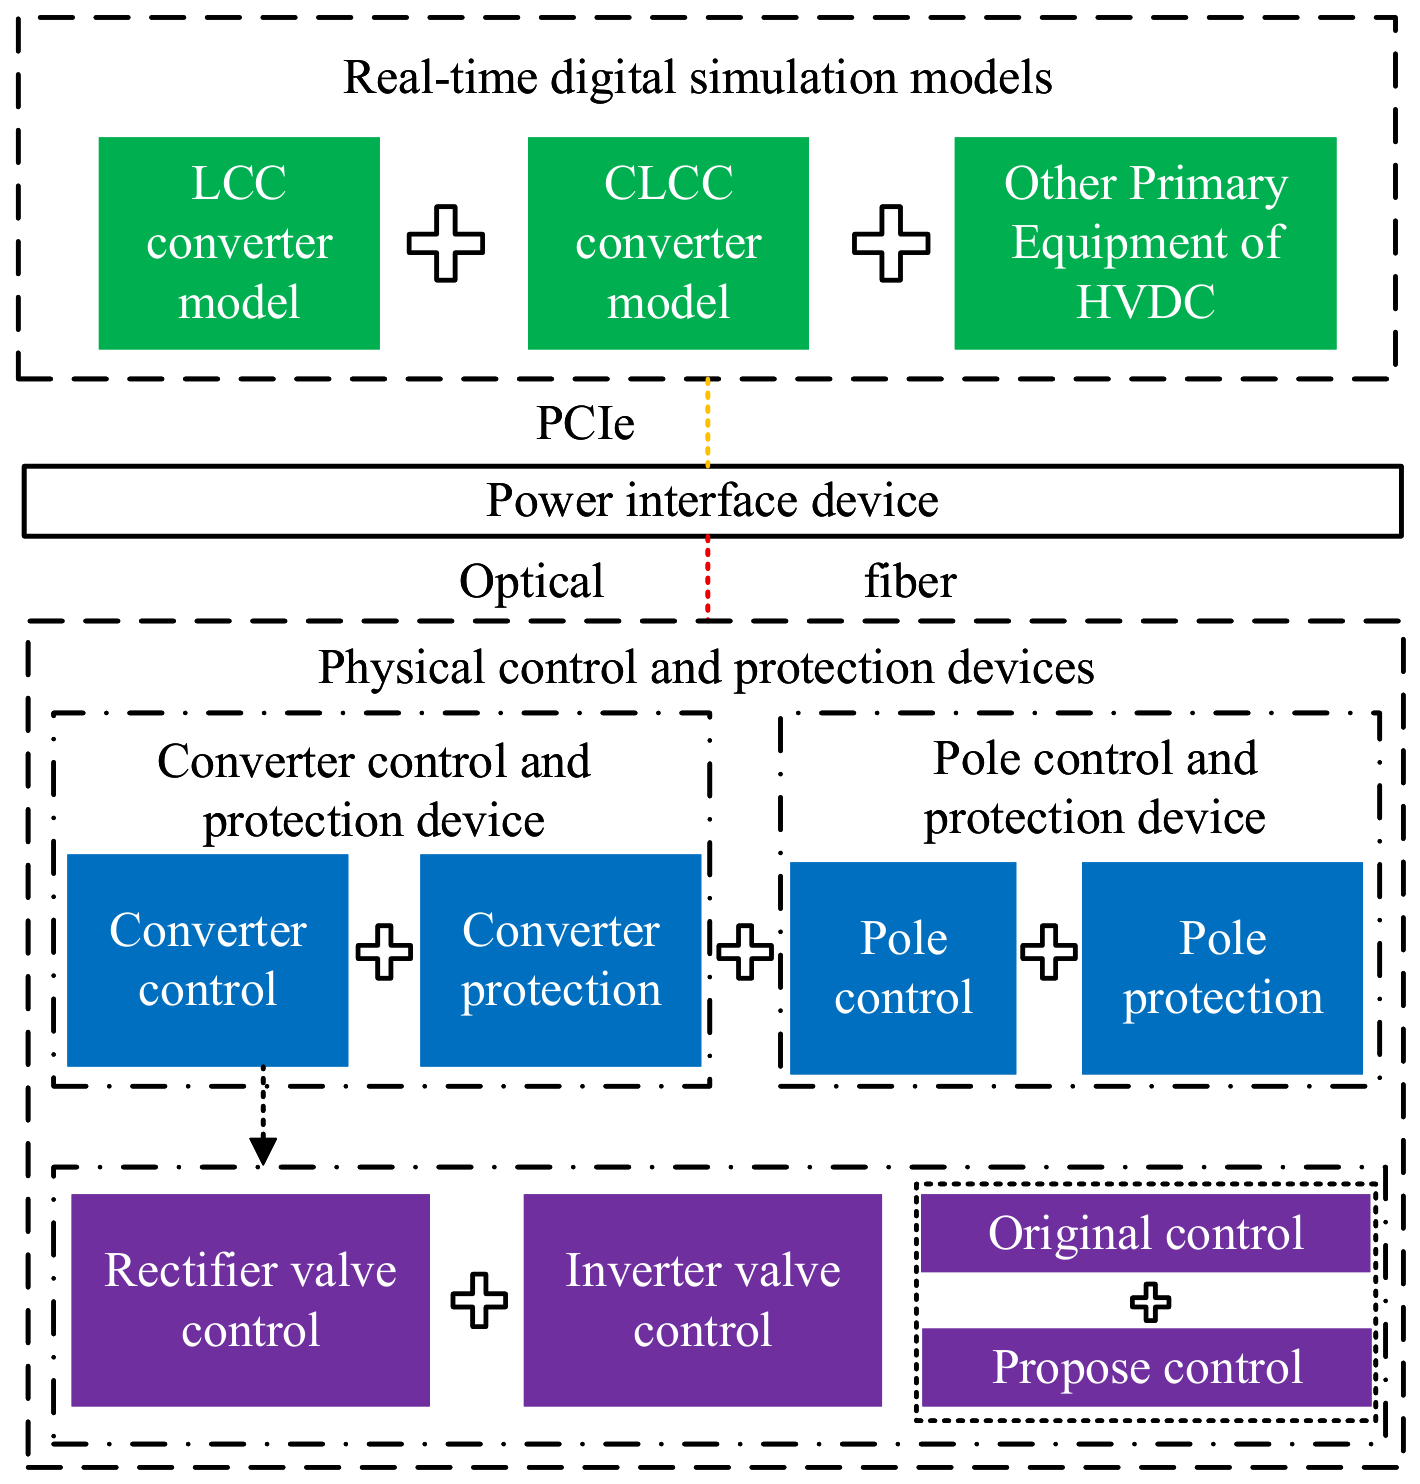
Hardware-in-the-Loop (HIL) experiments in power systems generally adopt the technical scheme of “digital simulation for the primary system and physical devices for the control and protection system”. By connecting physical control and protection devices to the digital simulation power grid, real-time simulation of electromagnetic transient conditions is carried out, which can accurately reproduce the steady-state operation and fault transient characteristics of the system. The specific HIL experimental architecture is as follows.
- Real-Time Digital Simulation ModelThe core components of the real-time digital simulation model include the line-commutated converter (LCC) model, the controllable line-commutated converter (CLCC) model, and other primary equipment of the HVDC system, covering converter transformers, smoothing reactors, DC transmission lines, electrode lines, and AC/DC filters. Each bridge arm of the LCC converter is modeled with thyristor elements, while each bridge arm of the CLCC converter is modeled with a hybrid configuration of thyristors and IGBTs. Both converter models can receive pulse firing signals output by the physical DC control and protection devices to realize on/off control of the bridge arms.To ensure the real-time performance of the simulation, the primary circuit needs to be decoupled into multiple sub-networks before the HIL experiment, and the computing tasks are reasonably allocated to multiple computing nodes for parallel operation. Decoupling points are selected at energy-storage components to limit calculation errors, following the specific principles below:
- Inductive components such as smoothing reactors and transmission lines are selected as decoupling elements to realize primary network decoupling and ensure simulation accuracy to the maximum extent.
- The 12-pulse converter is taken as the minimum decoupling unit for real-time simulation, and no further split is applied inside the converter.
- The converter transformer and the converter are not decoupled; they are bound into the same computing unit to guarantee the simulation accuracy of the commutation process.
The AC system together with its equivalent impedance is modeled separately from the AC filters and partitioned into separate sub-networks, to enhance the adaptability and scalability of power grid models with varying capacities. - Physical Control and Protection DevicesCompared with the HVDC control and protection system in practical engineering, the experimental system can be appropriately simplified. The physical control and protection devices in this experiment include functional units such as pole control, pole protection, converter control, and converter protection. The proposed control strategy will be deployed in the inverter-side control module of the converter control unit.
- Power Interface DeviceThe power interface device consists of a power amplifier and connecting lines. In accordance with the technical requirements of HIL experiments, two types of interface topologies are adopted for data interaction: one is the standard PCIe interface, and the other is the high-speed optical fiber communication interface based on the Aurora protocol. The PCIe interface is used for the connection between the real-time simulator and the power interface device, while the high-speed optical fiber interface based on the Aurora protocol is used for the connection between the power interface device and the physical control and protection devices. The above layered interface architecture realizes the hybrid digital-physical real-time simulation between the real-time simulator and the physical control and protection devices. See Figure 13.Figure 13. HIL platform schematic diagram.Based on the above experimental architecture, the HIL verification of the proposed control strategy is carried out according to the following procedure: first, start-up and shutdown tests of the HIL platform are performed to verify the reliability of the platform; then steady-state operation tests are carried out to verify the accuracy of the steady-state electrical characteristics of the platform; on this basis, a single-phase grounding fault is set on the valve side of the converter transformer on the real-time digital simulation side, to verify the fault control performance of the proposed strategy.After the control strategy is deployed on physical devices, interference factors such as measurement noise and hardware delay will cause deviations in the extraction of key variables such as the valve current extreme point and the turn-off delay of the fully-controlled valve, and further affect the actual performance of the valve control strategy. Identical fault conditions will be set in the PSCAD/EMTDC offline simulation synchronously. The results of the pure digital simulation and the HIL experiment will be compared to quantitatively analyze the difference between them, and verify the effectiveness and robustness of the strategy in a physical environment.
3. Results
To verify the accuracy of the preceding fault-characteristic analysis and quantitative calculation results, and to evaluate the effectiveness of the proposed improved valve control strategy, an 800 kV/5 kA double-twelve-pulse LCC-CLCC HVDC system simulation model is established in PSCAD/EMTDC. Based on this model, the DC current, valve current, commutation voltage, and other key electrical quantities under faults at K1–K4 are simulated and analyzed. The effectiveness of the proposed strategy in suppressing abnormal commutation and reducing the electrical stress on CLCC sub-valves and arresters is also verified. The main parameters of the DC system and the CLCC valve are listed in Table 2, Table 3, Table 4, Table 5, Table 6, Table 7 and Table 8, respectively.
Table 2.
LCC-CLCC HVDC system parameters.
Table 3.
Rectifier-side constant current controller parameters.
Table 4.
Inverter-side predictive constant extinction angle control parameters.
Table 5.
Parameters of main full-controlled valve V12.
Table 6.
Parameters of auxiliary branch full-controlled valve V13.
Table 7.
Surge arrester parameters.
Table 8.
Arrester voltage-current characteristic.
3.1. Verification of the Calculated Transient DC-Current Response Under Valve-Side Single-Phase-to-Ground Faults
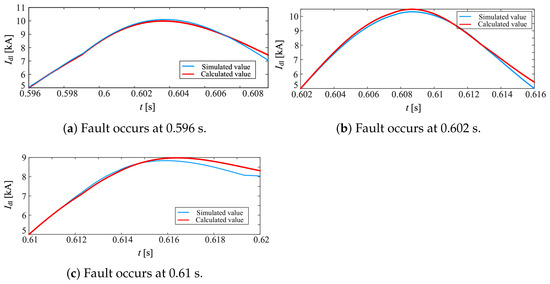
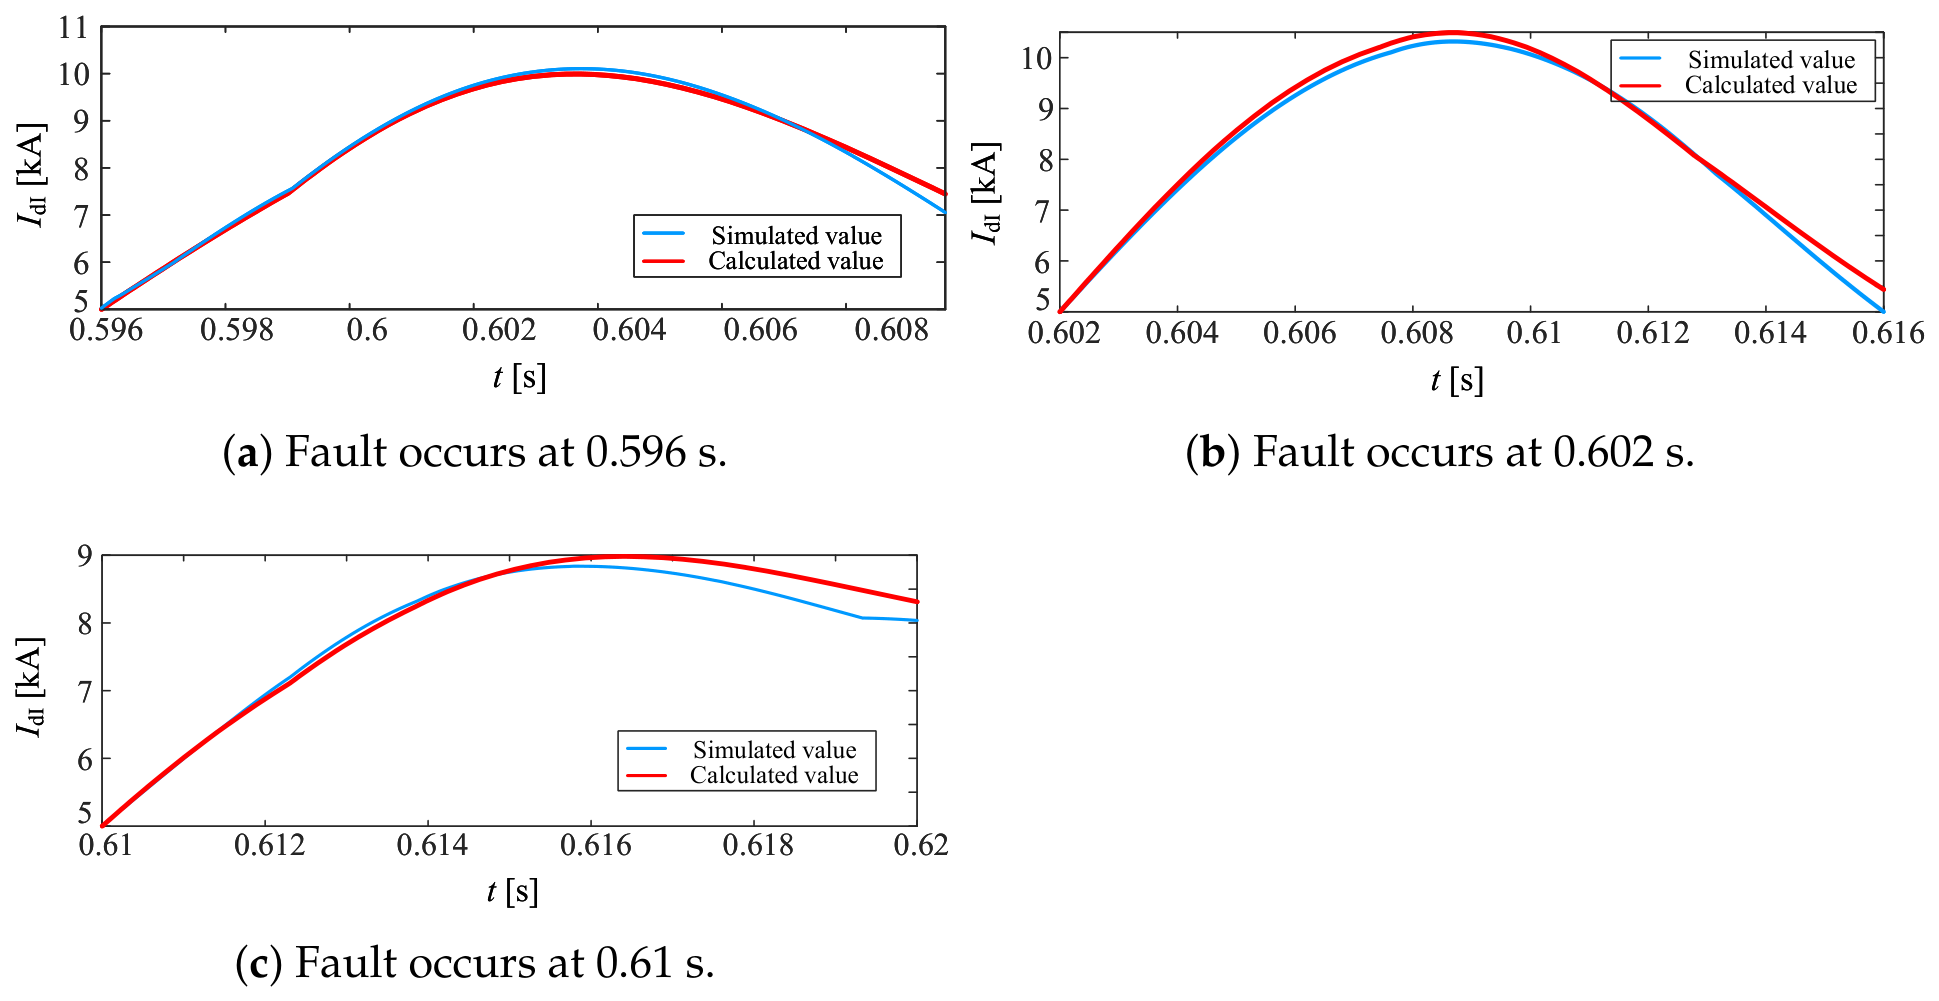
The MATLAB R2019a ode15s solver is used together with the transient DC-system model and the piecewise differential equations of the DC voltage under fault conditions to calculate the transient response of the DC current for faults occurring under different valve conduction states. In the model, the fault location is set to K1, and the fault occurrence instants are set to 0.596 s, 0.602 s, and 0.61 s, corresponding to the conduction of V2, V4, and V6, respectively. The comparisons between the calculated and simulated DC currents after the fault are shown in Figure 14.
Figure 14.
Transient response comparison of DC current for faults occurring at different instants. (a) Fault occurs at 0.596 s. (b) Fault occurs at 0.602 s. (c) Fault occurs at 0.61 s.
The quantitative error indicators are listed in Table 9. According to the calculation results, the maximum error of the DC-current peak value is 3.44%. Figure 14 shows that when the fault occurs during the conduction of V4, the DC current flows directly through V4 to the fault point after the fault, resulting in the largest drop in DC voltage and the fastest rise in DC current. This is consistent with the preceding analysis.
Table 9.
Comparison of DC current calculation accuracy under different fault initiation times.
3.2. Verification of Transient Characteristics Under Single-Phase-to-Ground Faults at the Valve Side of the Converter Transformer
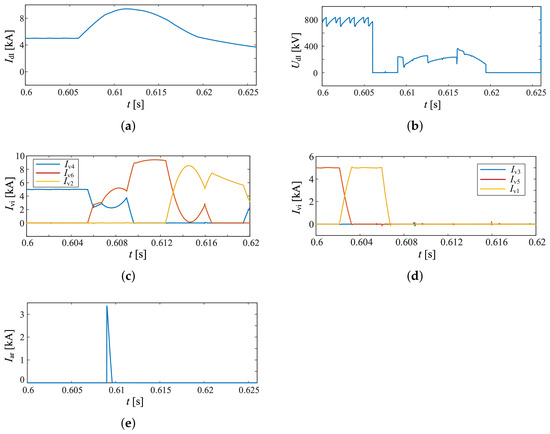
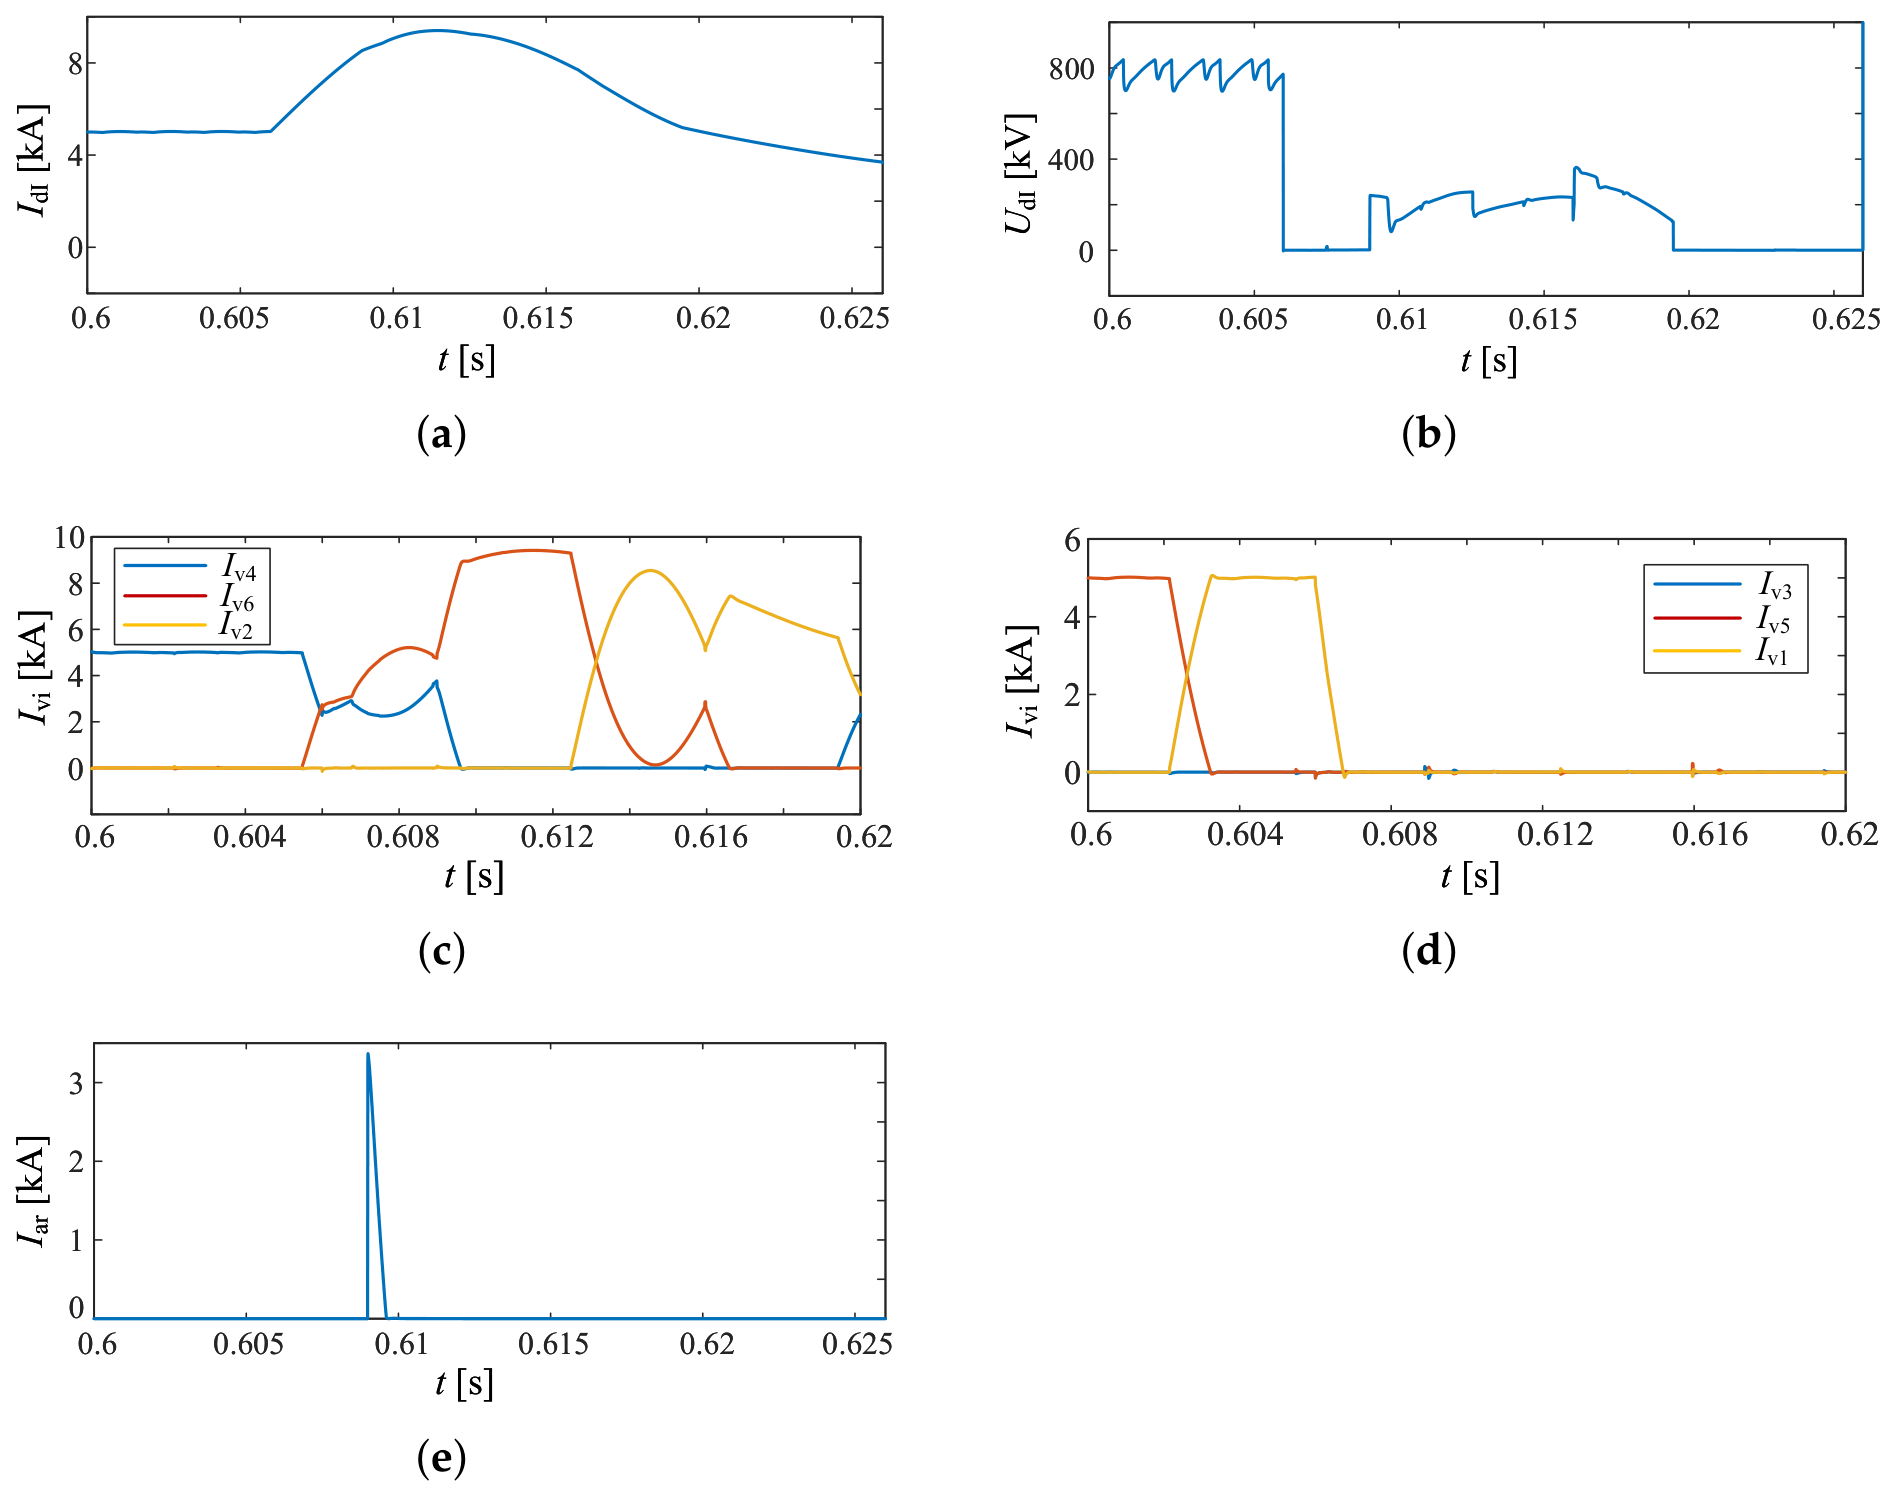
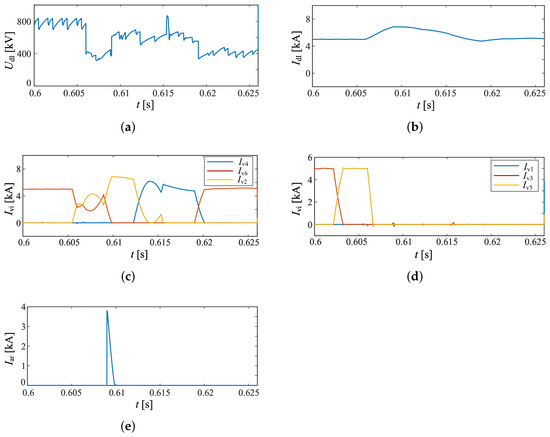
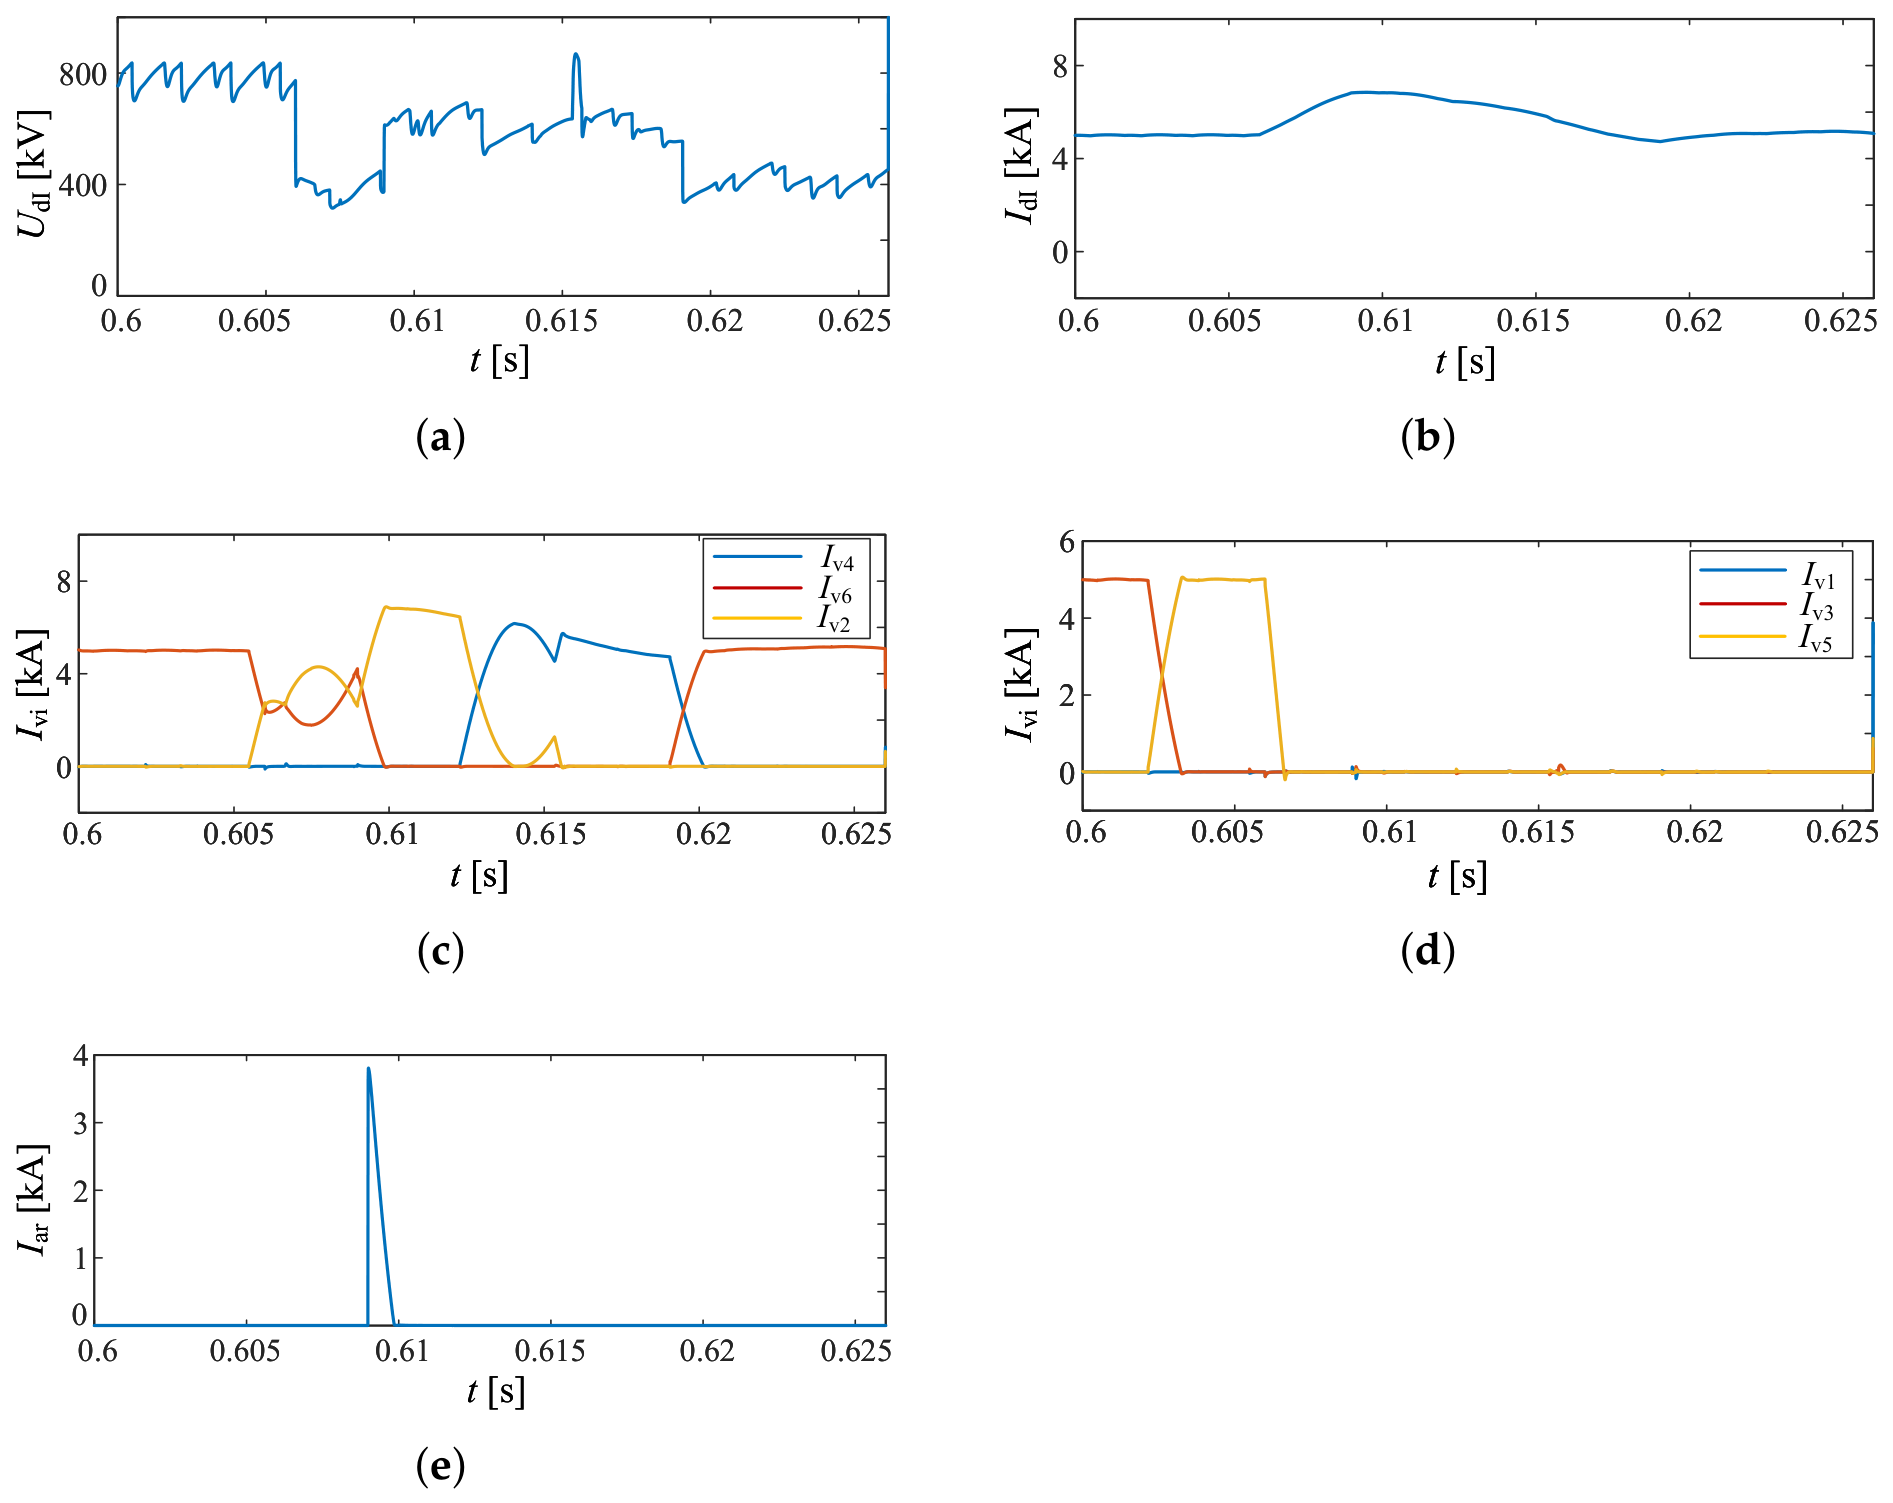
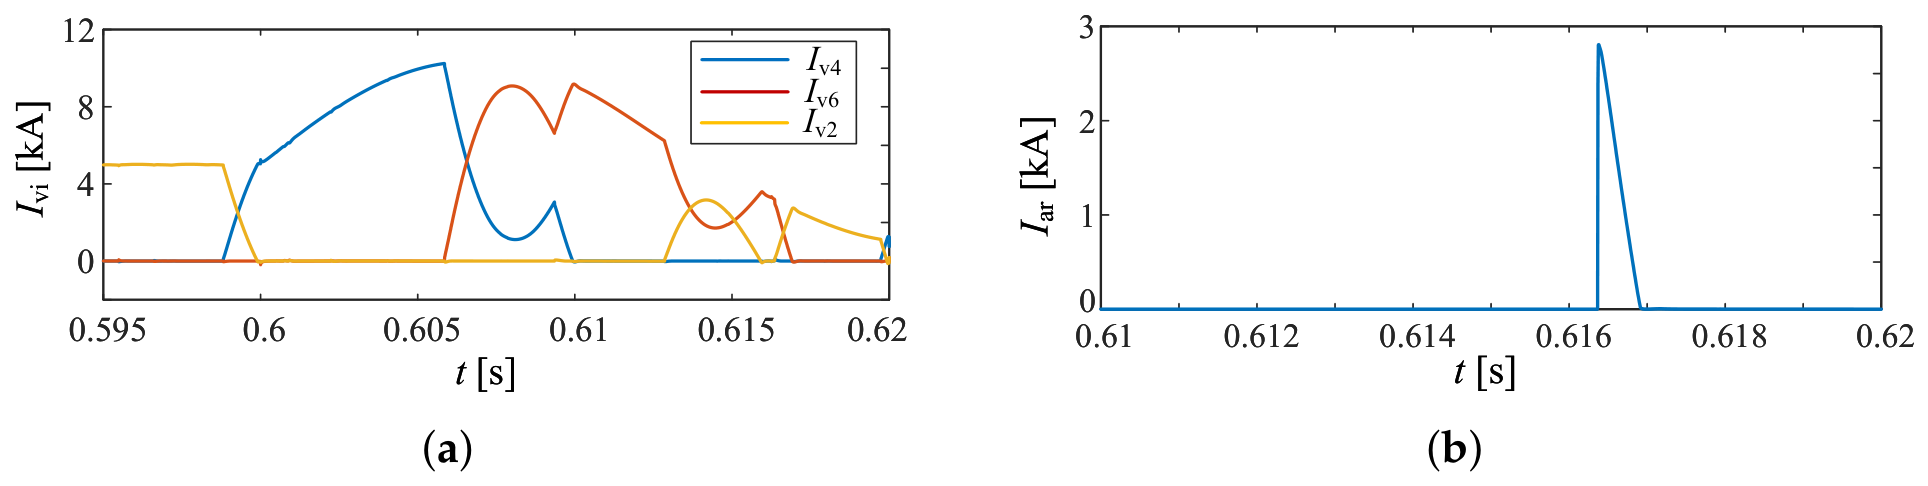
To verify the validity of the proposed fault-characteristic analysis method, a metallic ground fault is applied at K1 in the model. The fault occurrence instant is 0.606 s, the valve conduction state at the fault instant is the commutation from V4 to V6, and the fault duration is 0.02 s. The simulation results are shown in Figure 15.
Figure 15.
Transient characteristics of the system under the K1 fault. (a) Inverter-side DC current. (b) Inverter-side DC voltage. (c) Currents of the common-anode valve group (V4, V6, and V2) in six-pulse valve 1. (d) Currents of the common-cathode valve group (V1, V3, and V5) in six-pulse valve 1. (e) Arrester stress of V4 during commutation from V4 to V6.
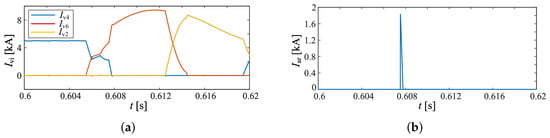
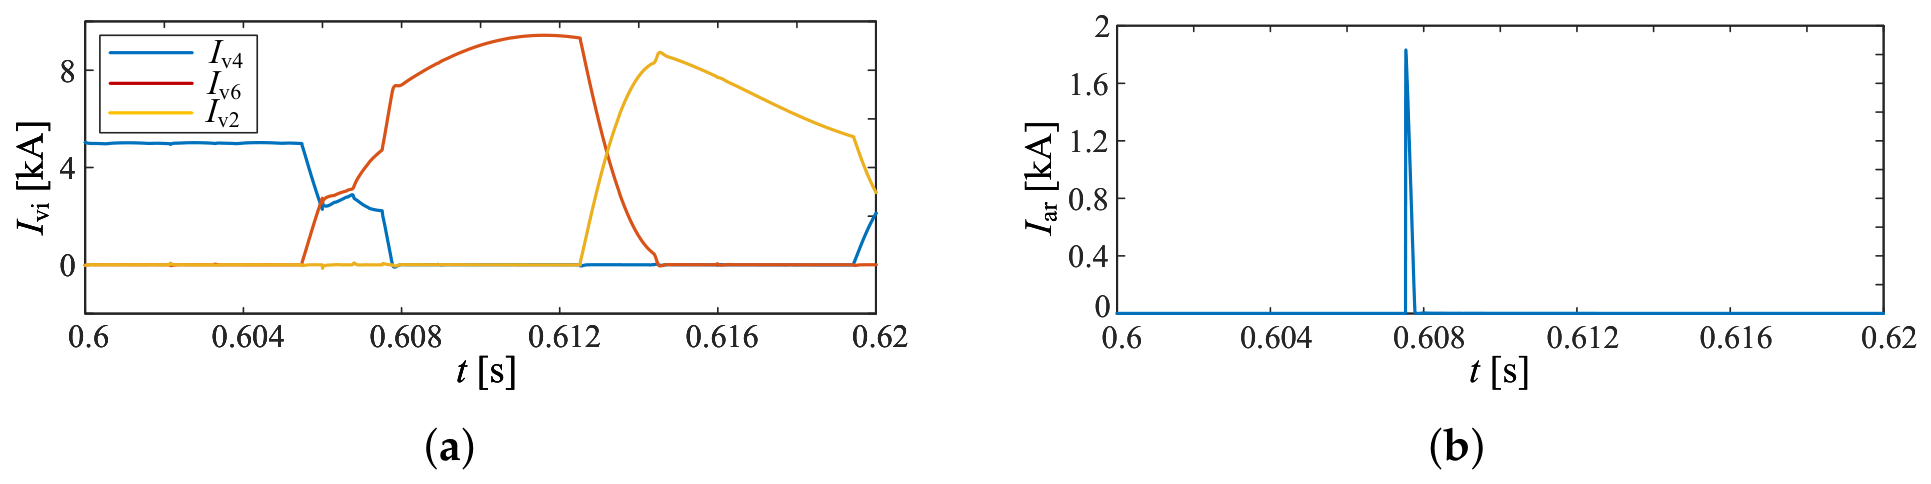
As shown in Figure 15, after the fault occurs at 0.606 s, drops sharply to zero because V4 is conducting, and the DC current starts to rise accordingly. V5 rapidly turns off under reverse voltage, and the common-cathode valve group does not conduct again throughout the fault period. According to Equation (16), both the increase in DC current and the decrease in V5 valve current affect the commutation process from V4 to V6. Therefore, a short rise in the V4 current can be observed at the initial fault instant. This rise prevents the main-branch current of V4 from decreasing to the turn-off reference current in time, causing the auxiliary branch to remain conducting when the valve current reaches its extreme. As a result, abnormal commutation occurs, the valve current rises again, and the overstress risk of the auxiliary-branch IGBT and the arrester increases. In the subsequent commutation process from V6 to V2, although the DC-current variation rate is significantly lower than that at the initial fault stage, the commutation process is prolonged because the DC current has risen to nearly twice its rated value. During the commutation from V2 to V4, although the DC current has fallen back to approximately the rated value, the abnormal commutation phenomenon becomes more severe. This is because, after the fault, the trigger angle gradually increases under inverter-side predictive constant extinction-angle control, thereby shortening the time from the beginning of commutation to the arrival of the valve-current extreme.
In addition, the key operating parameters of the IGBTs and arresters in the main and auxiliary branches under the K1 fault condition were extracted. The maximum values of these parameters are summarized in Table 10, Table 11 and Table 12, providing a reference for device selection and valve protection scheme design.
Table 10.
Parameters of V12 main full-controlled valve.
Table 11.
Parameters of V13 main full-controlled valve.
Table 12.
Parameters of surge arrester.
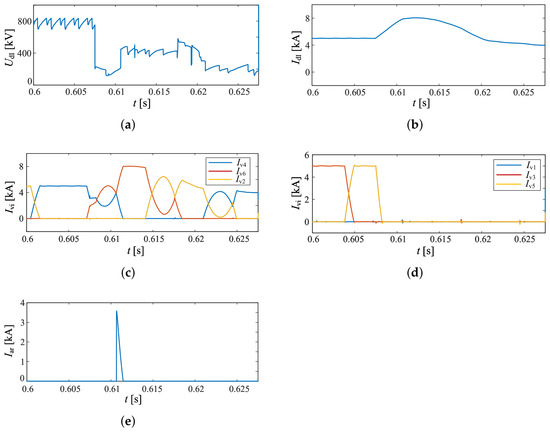
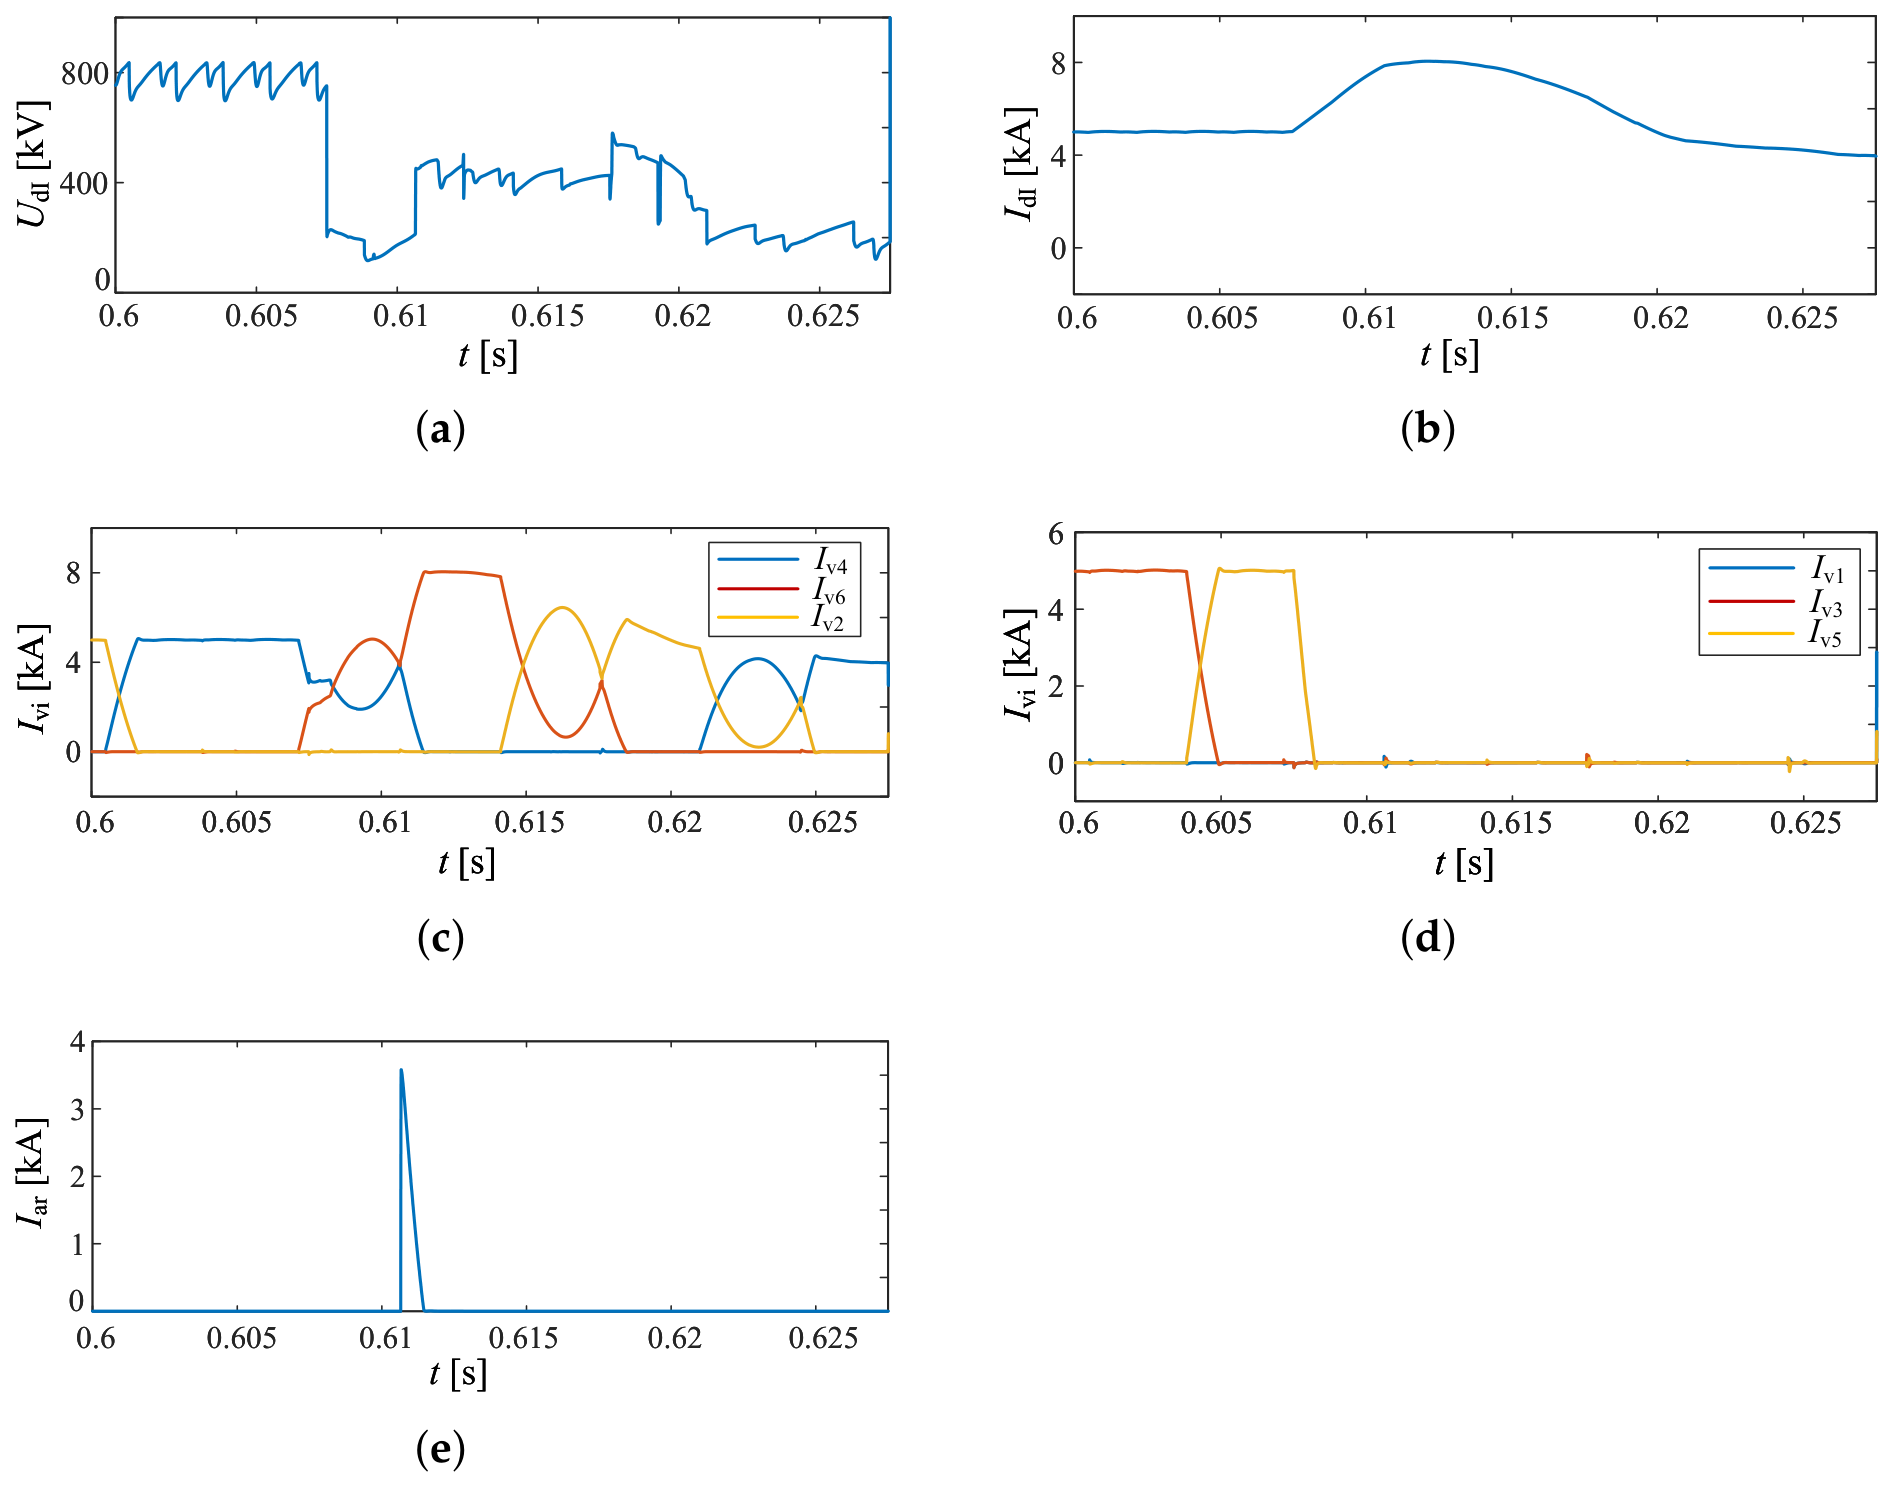
The transient characteristics under metallic ground faults at K2 and K3 are shown in Figure 16 and Figure 17, respectively. The fault occurrence instants are 0.6075 s and 0.606 s, respectively. In both cases, the valve conduction state at the fault instant is the commutation from V4 to V6, and the fault duration is 0.02 s.
Figure 16.
Transient characteristics of the system under the K2 fault. (a) Inverter-side DC current. (b) Inverter-side DC voltage. (c) Currents of the common-anode valve group (V4, V6, and V2) in six-pulse valve 2. (d) Currents of the common-cathode valve group (V1, V3, and V5) in six-pulse valve 2. (e) Arrester stress of V4 during commutation from V4 to V6.
Figure 17.
Transient characteristics of the system under the K3 fault. (a) Inverter-side DC current. (b) Inverter-side DC voltage. (c) Currents of the common-anode valve group (V4, V6, and V2) in six-pulse valve 3. (d) Currents of the common-cathode valve group (V1, V3, and V5) in six-pulse valve 3. (e) Arrester stress of V4 during commutation from V4 to V6.
As shown in Figure 16 and Figure 17, because the healthy valves above the faulted valve can still establish a certain DC voltage after the fault, the voltage drop is smaller than that under the K1 fault. Overall, the transient characteristics of faults at K2 and K3 are largely similar to those of the K1 fault and are therefore not repeated here.
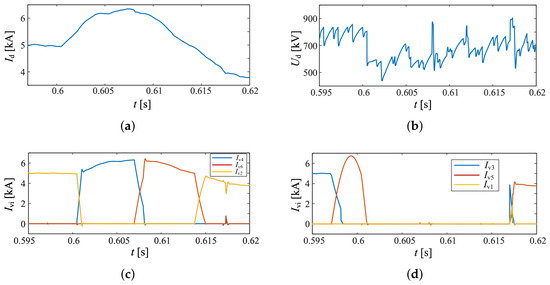
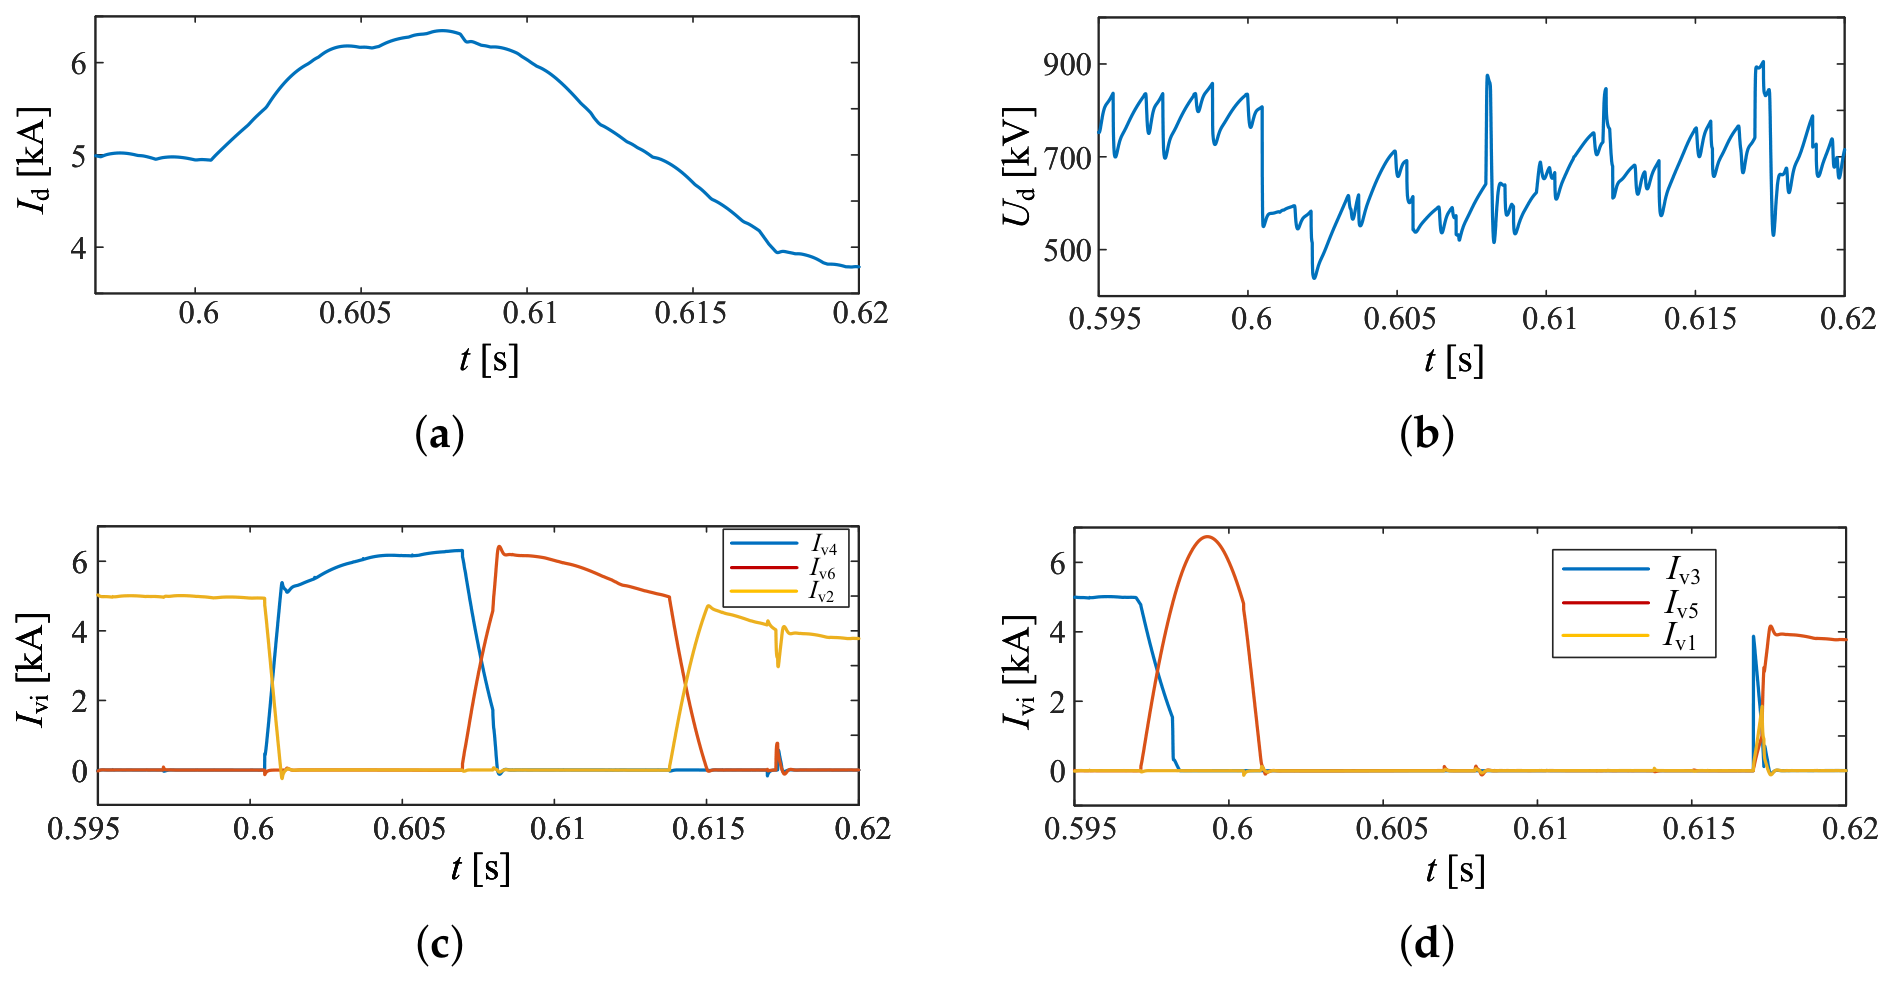
The transient characteristics under the metallic ground fault at K4 are shown in Figure 18. To verify the preceding analysis, the fault occurrence instant is set to 0.597 s, with V1 and V2 conducting in six-pulse valve 4 at the fault instant, and the fault duration is 0.02 s.
Figure 18.
Transient characteristics of the system under the K4 fault. (a) Inverter-side DC current. (b) Inverter-side DC voltage. (c) Currents of the common-anode valve group (V4, V6, and V2) in six-pulse valve 4. (d) Currents of the common-cathode valve group (V1, V3, and V5) in six-pulse valve 4.
As shown in Figure 18, V1 and V5 in the common-cathode valve group do not conduct during the fault period. After the fault occurs at 0.597 s, V3 can still be normally triggered and turned on, but its conduction duration is shorter than that under normal operation. In addition, V4 has not yet conducted at the fault instant, so the DC voltage and DC current do not change immediately until 0.6 s. When V4 conducts, the current flows through the upper bridge and directly to the grounding point, causing the DC voltage to drop significantly and the DC current to rise. This agrees with the preceding analysis of the conduction state of the common-cathode valve group.
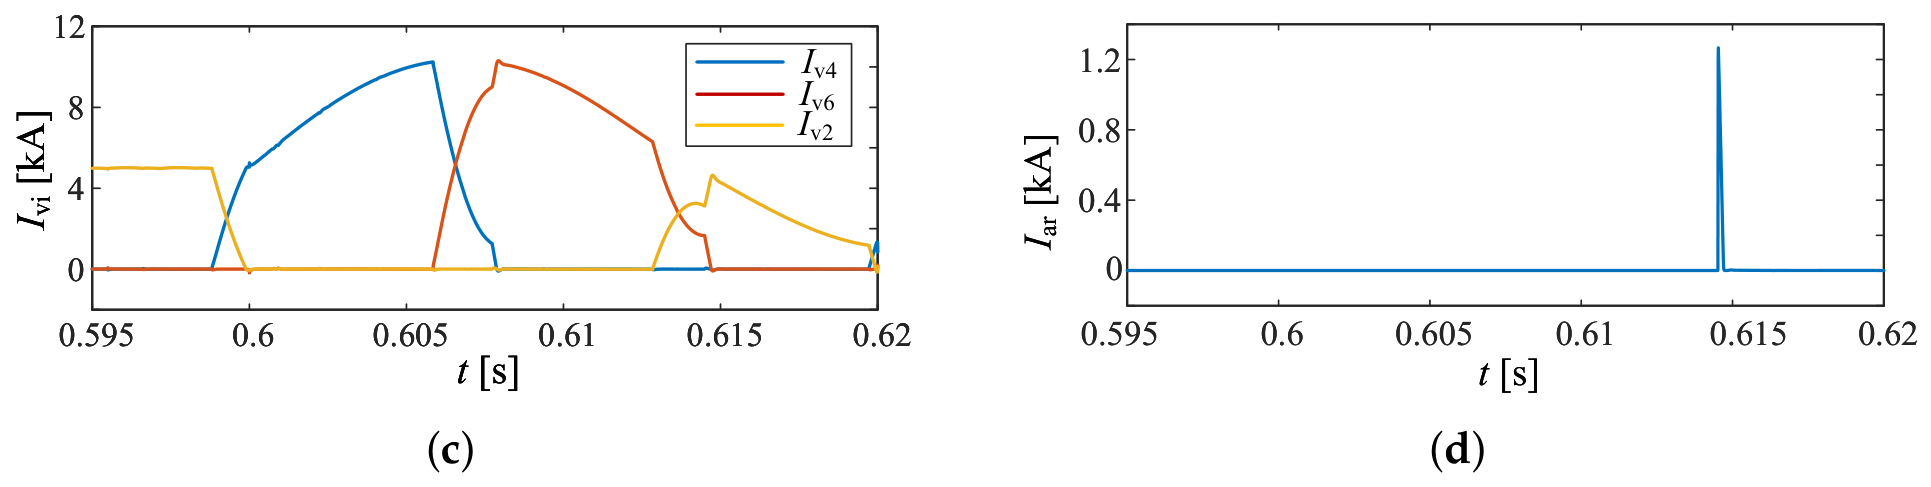
Furthermore, by comparing the valve current waveforms in Figure 15, Figure 16, Figure 17 and Figure 18, it can be observed that no obvious commutation anomaly occurs during the K4 fault under the original valve control strategy. Meanwhile, the voltage across the surge arrester does not reach its operating voltage, and the arrester is not subjected to significant electrical stress. As illustrated in the figure, the maximum voltage drop during the K4 fault is about 25%, and the maximum current is less than 1.3 p.u. Therefore, although the K4 fault may extend the protection operation time, the actual impact of the fault on system operation remains limited.
3.3. Verification of the Improved Valve Control Strategy Based on Valve-Current Extreme Prediction
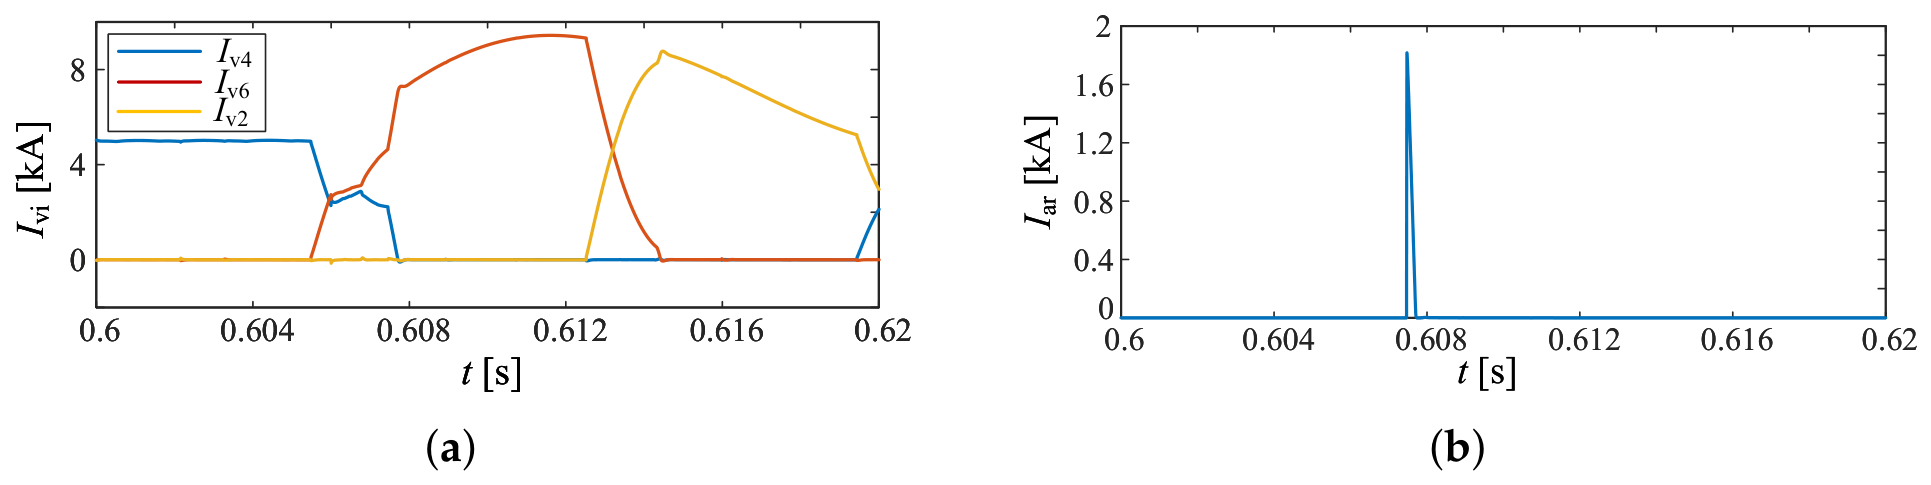
Short-circuit faults are applied at locations K1, K2, and K3, respectively. The fault initiation time and duration remain consistent with those specified in the preceding sections, and the corresponding simulation results are presented in Figure 19, Figure 20 and Figure 21.
Figure 19.
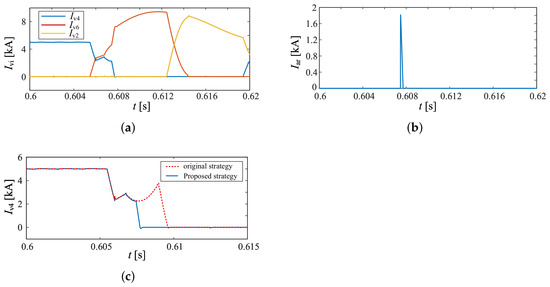
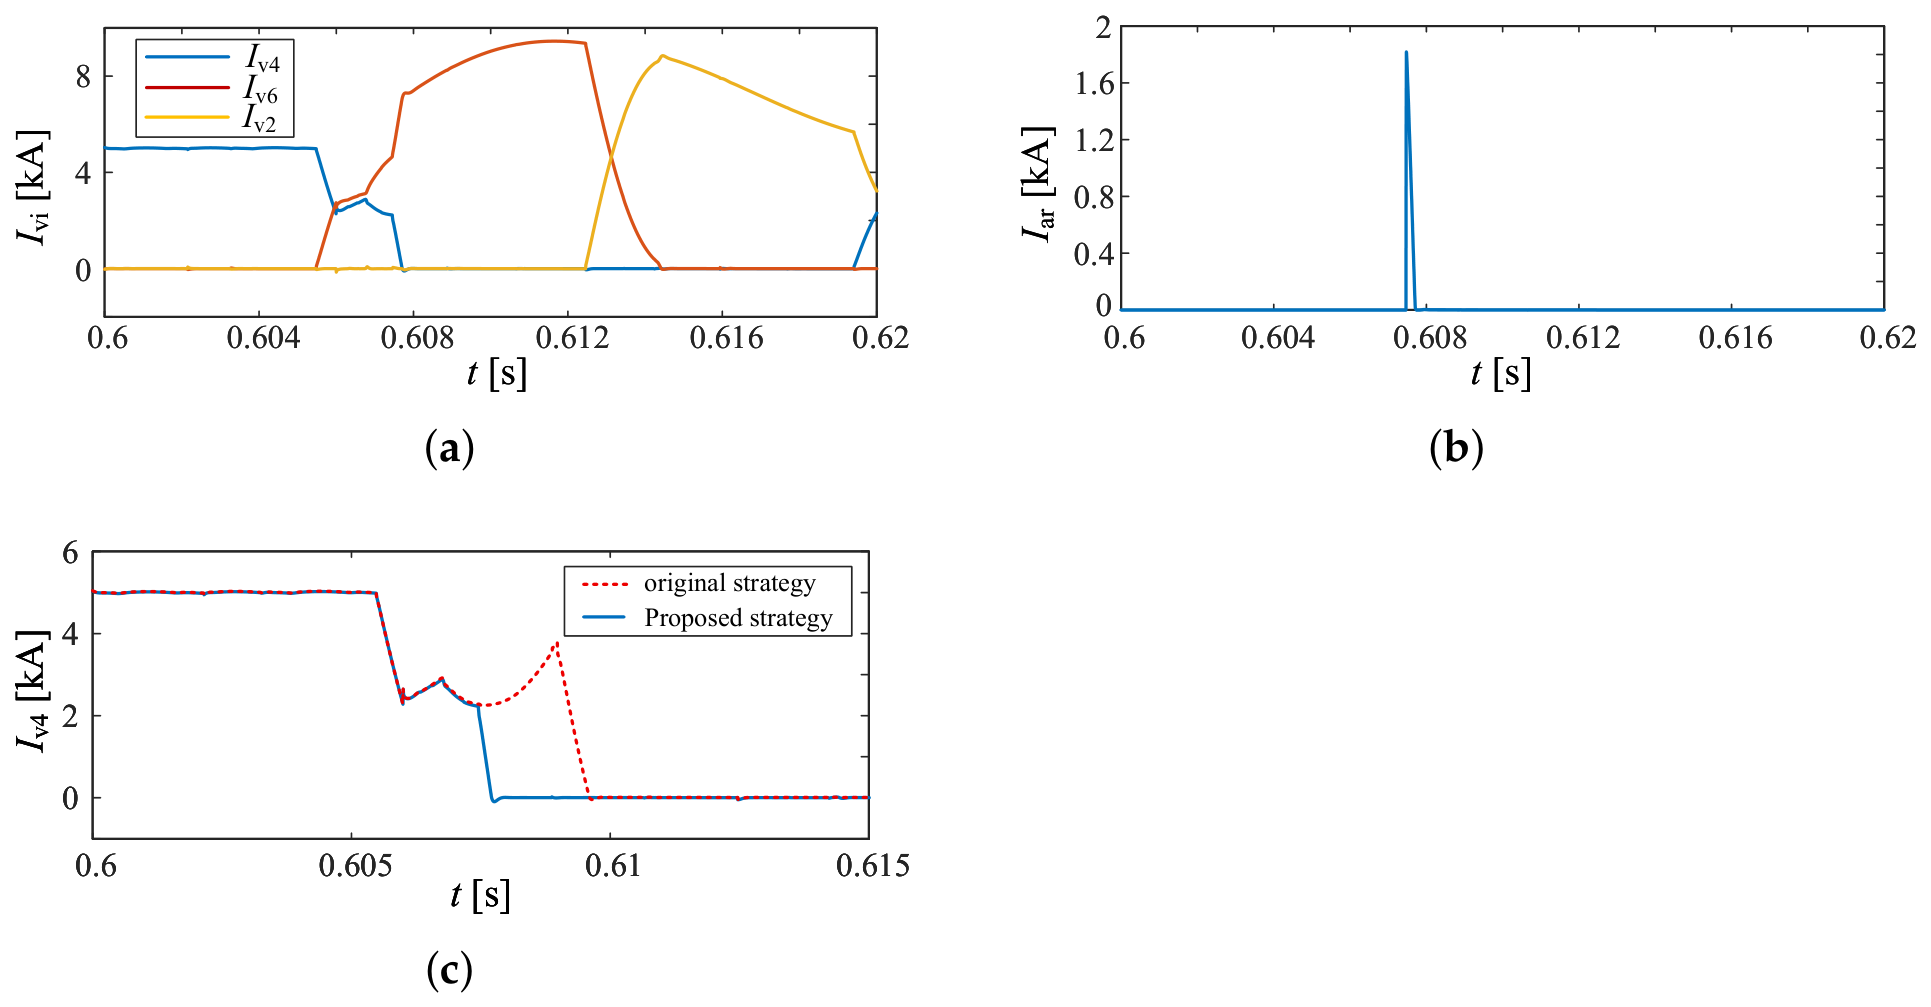
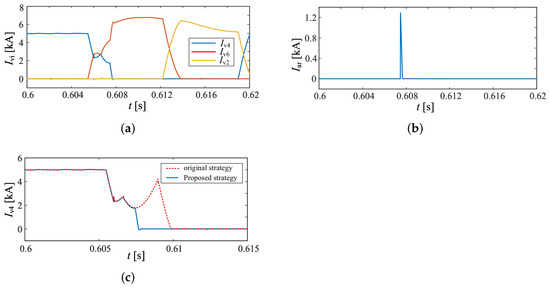
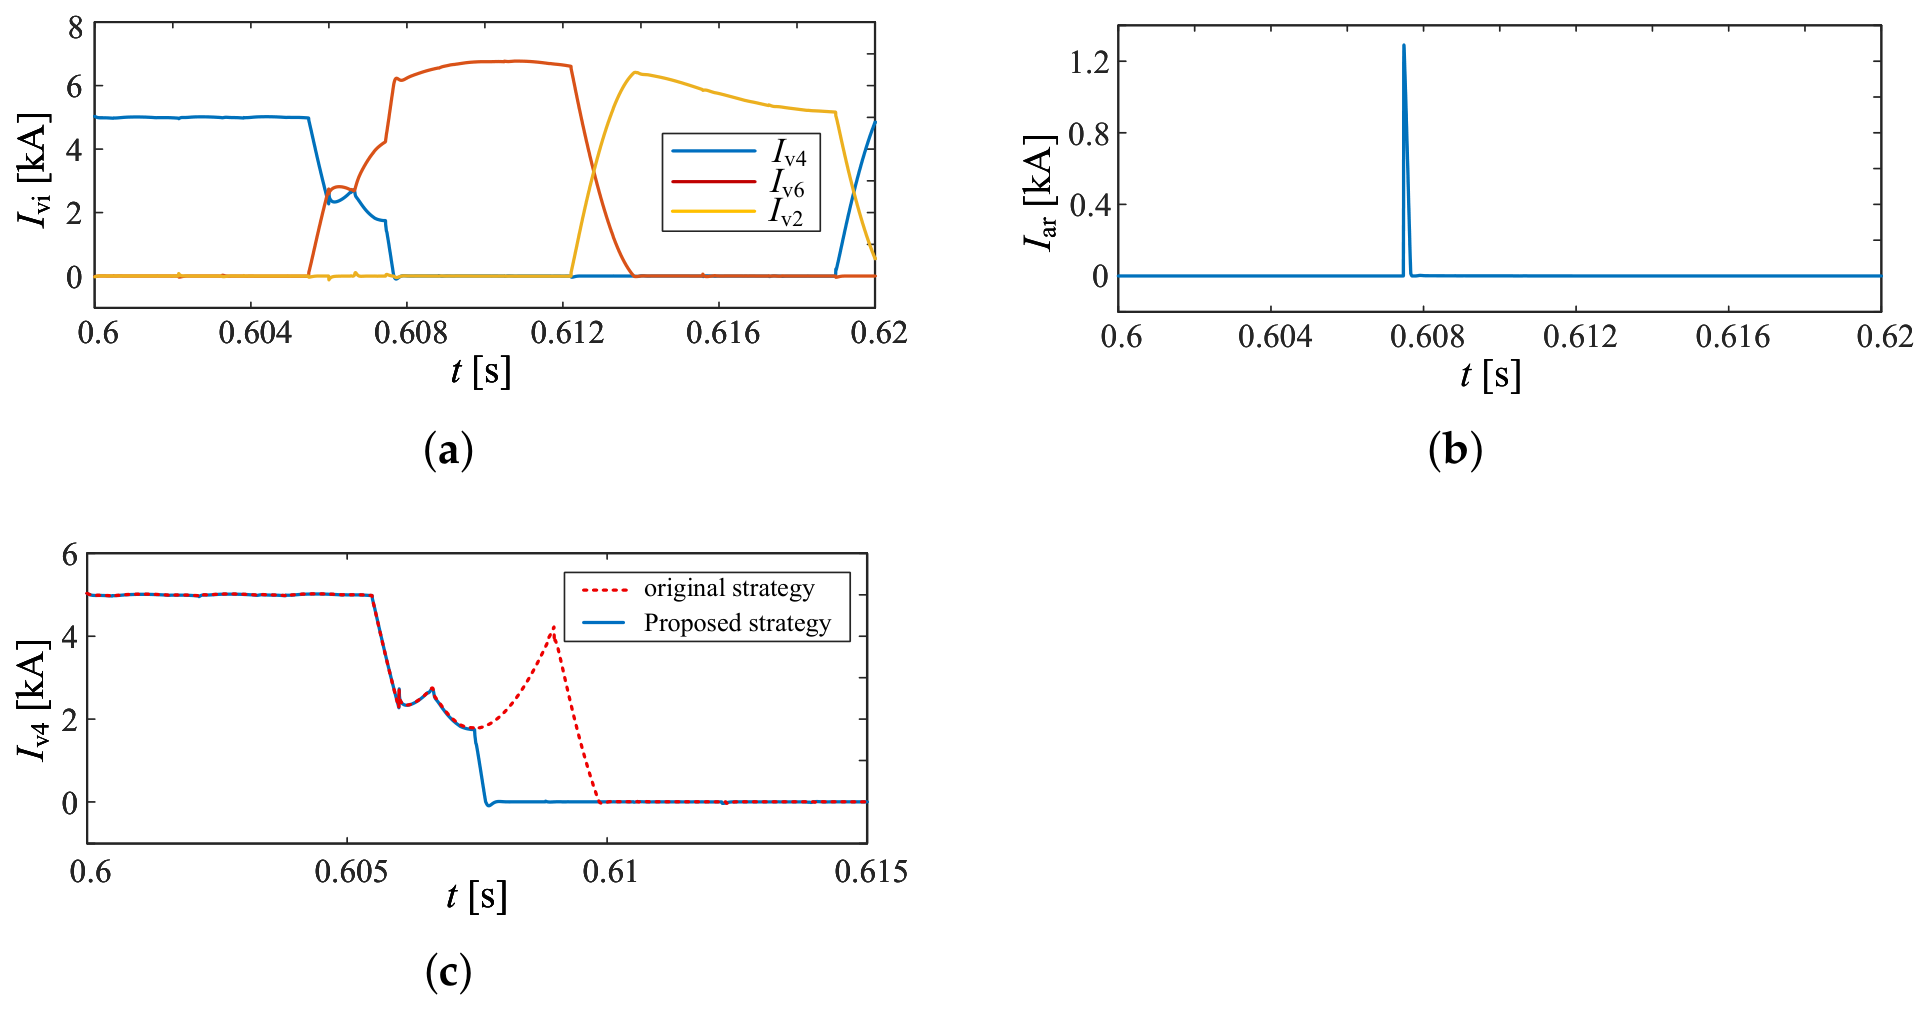
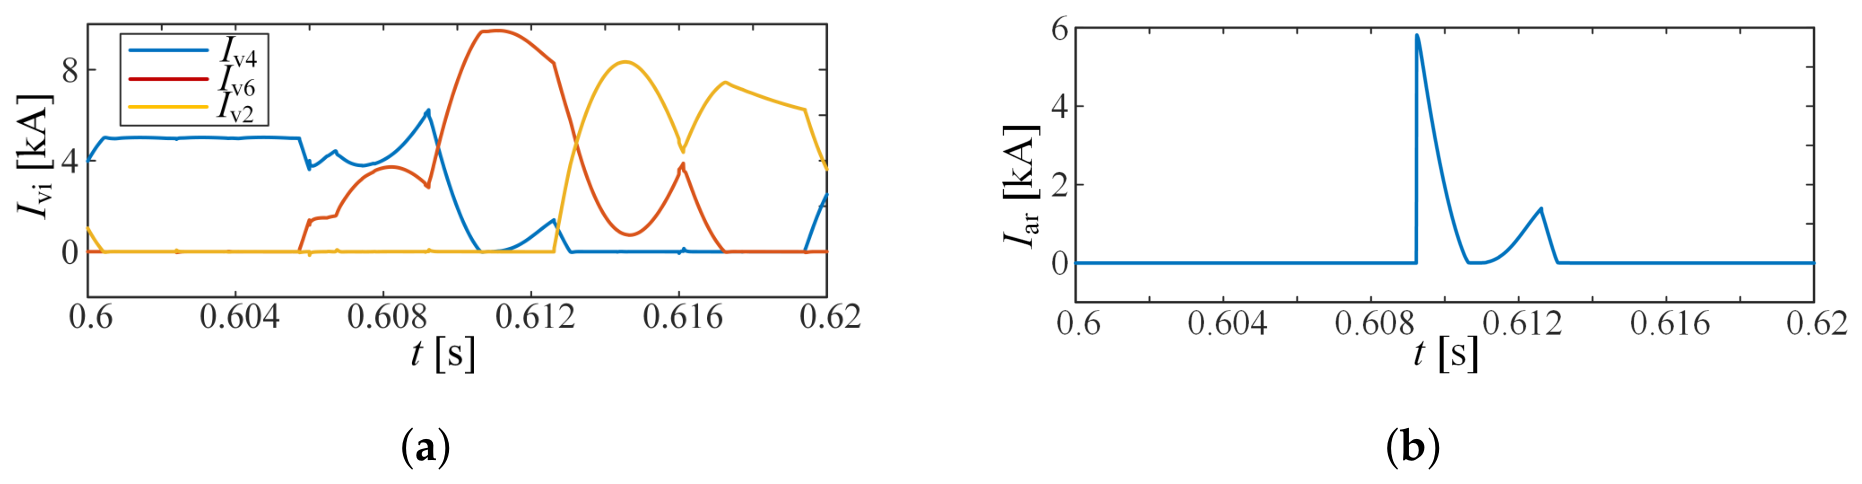
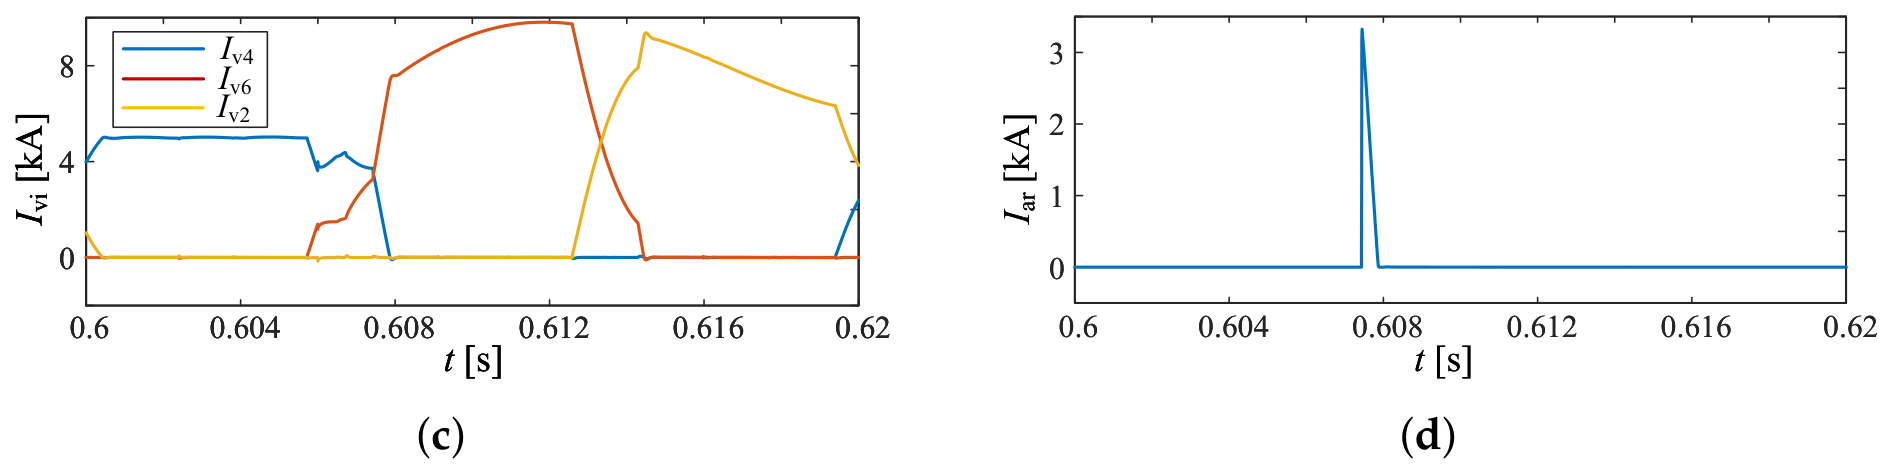
Valve current and arrester stress under the improved control strategy during the K1 fault. (a) Currents of the common-anode valve group (V4, V6, and V2) in six-pulse valve 1. (b) V4 arrester current. (c) Comparison of V4 current under the two control strategies.
Figure 20.
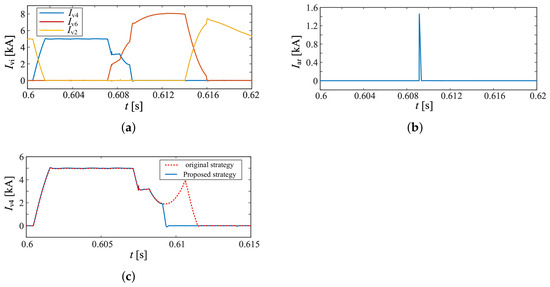
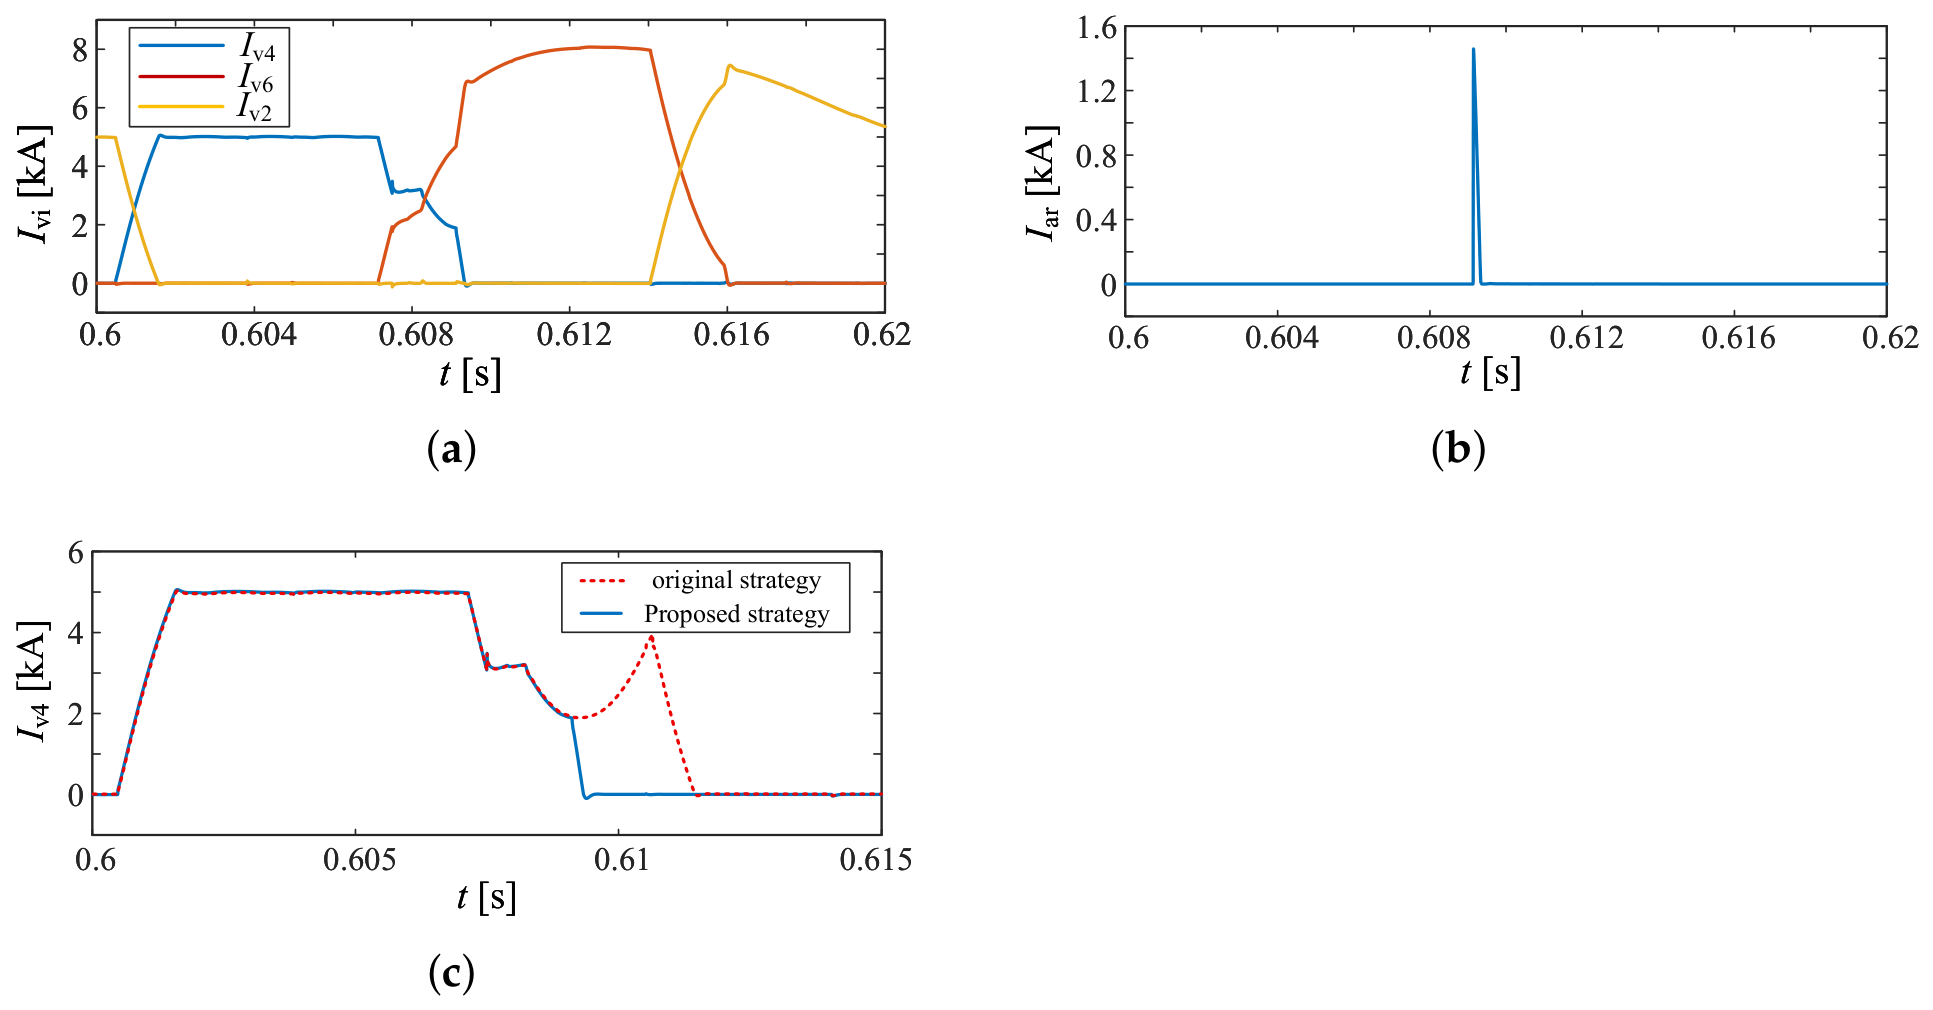
Valve current and arrester stress under the improved control strategy during the K2 fault. (a) Currents of the common-anode valve group (V4, V6, and V2) in six-pulse valve 2. (b) V4 arrester current. (c) Comparison of V4 current under the two control strategies.
Figure 21.
Valve current and arrester stress under the improved control strategy during the K3 fault. (a) Currents of the common-anode valve group (V4, V6, and V2) in six-pulse valve 3. (b) V4 arrester current. (c) Comparison of V4 current under the two control strategies.
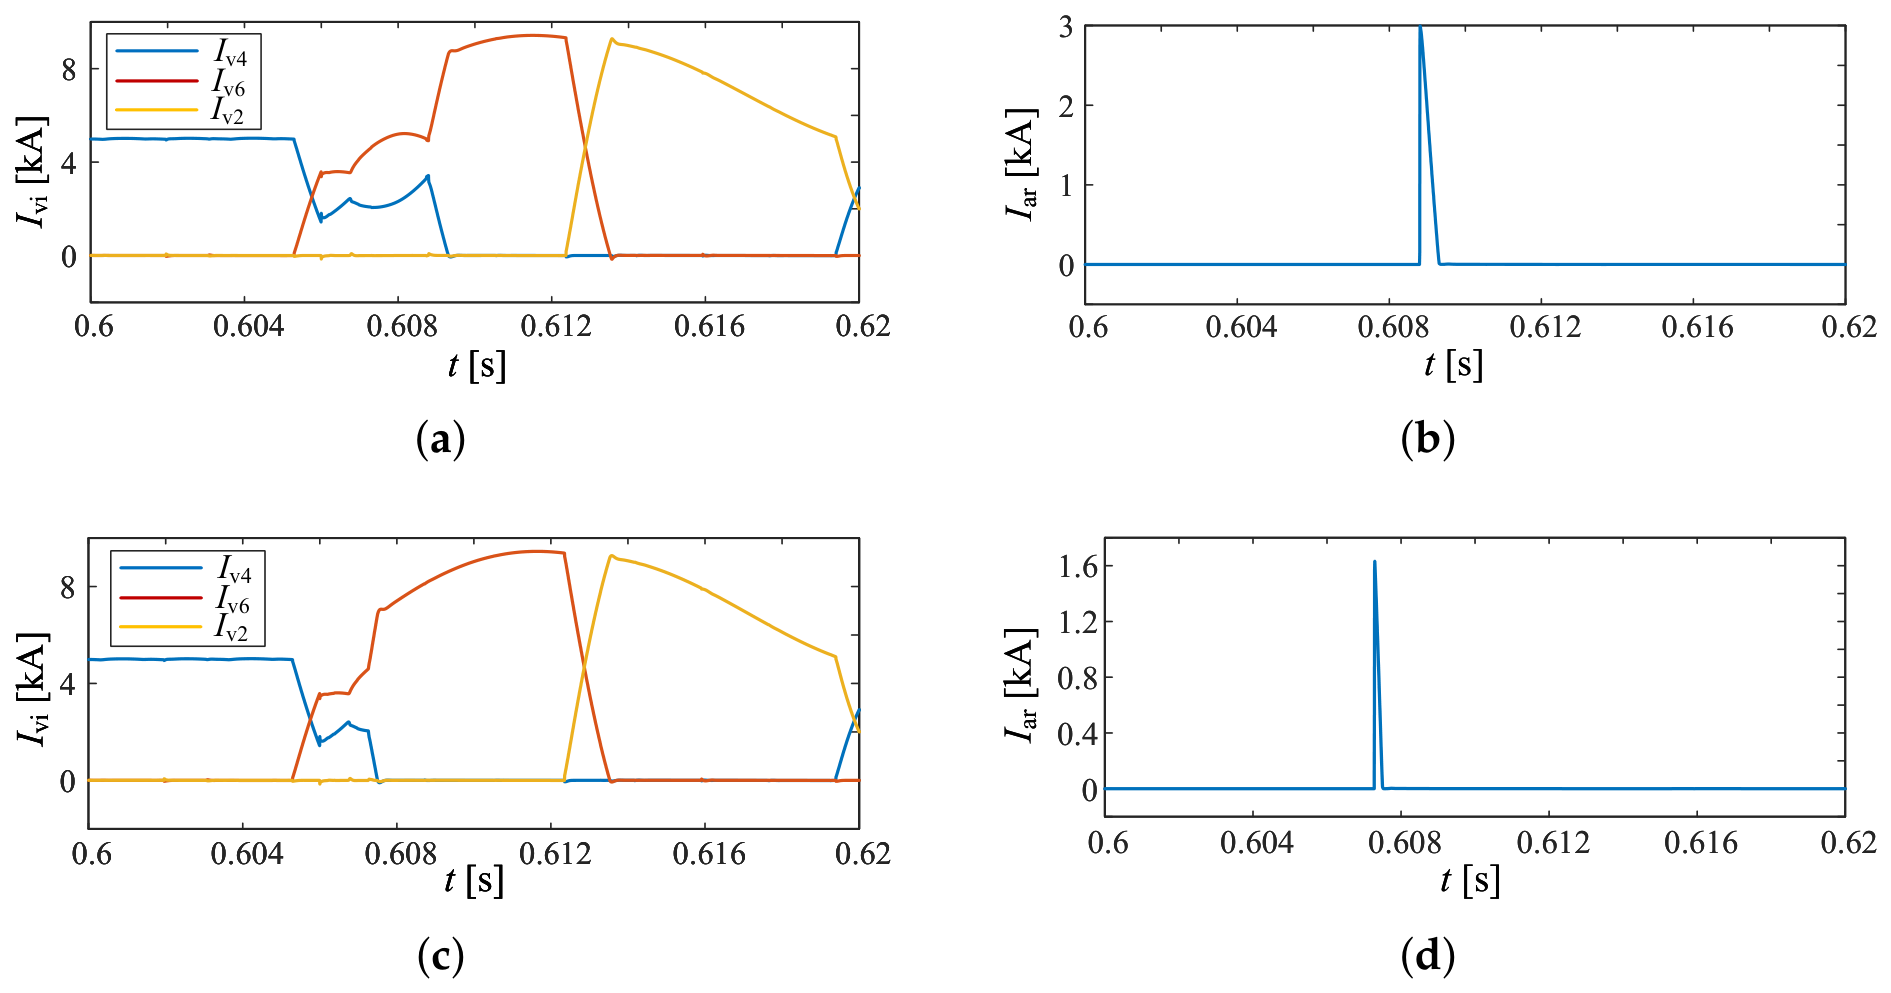
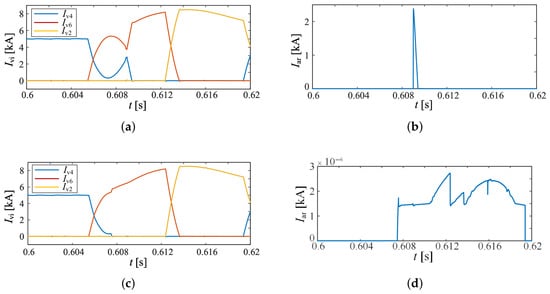
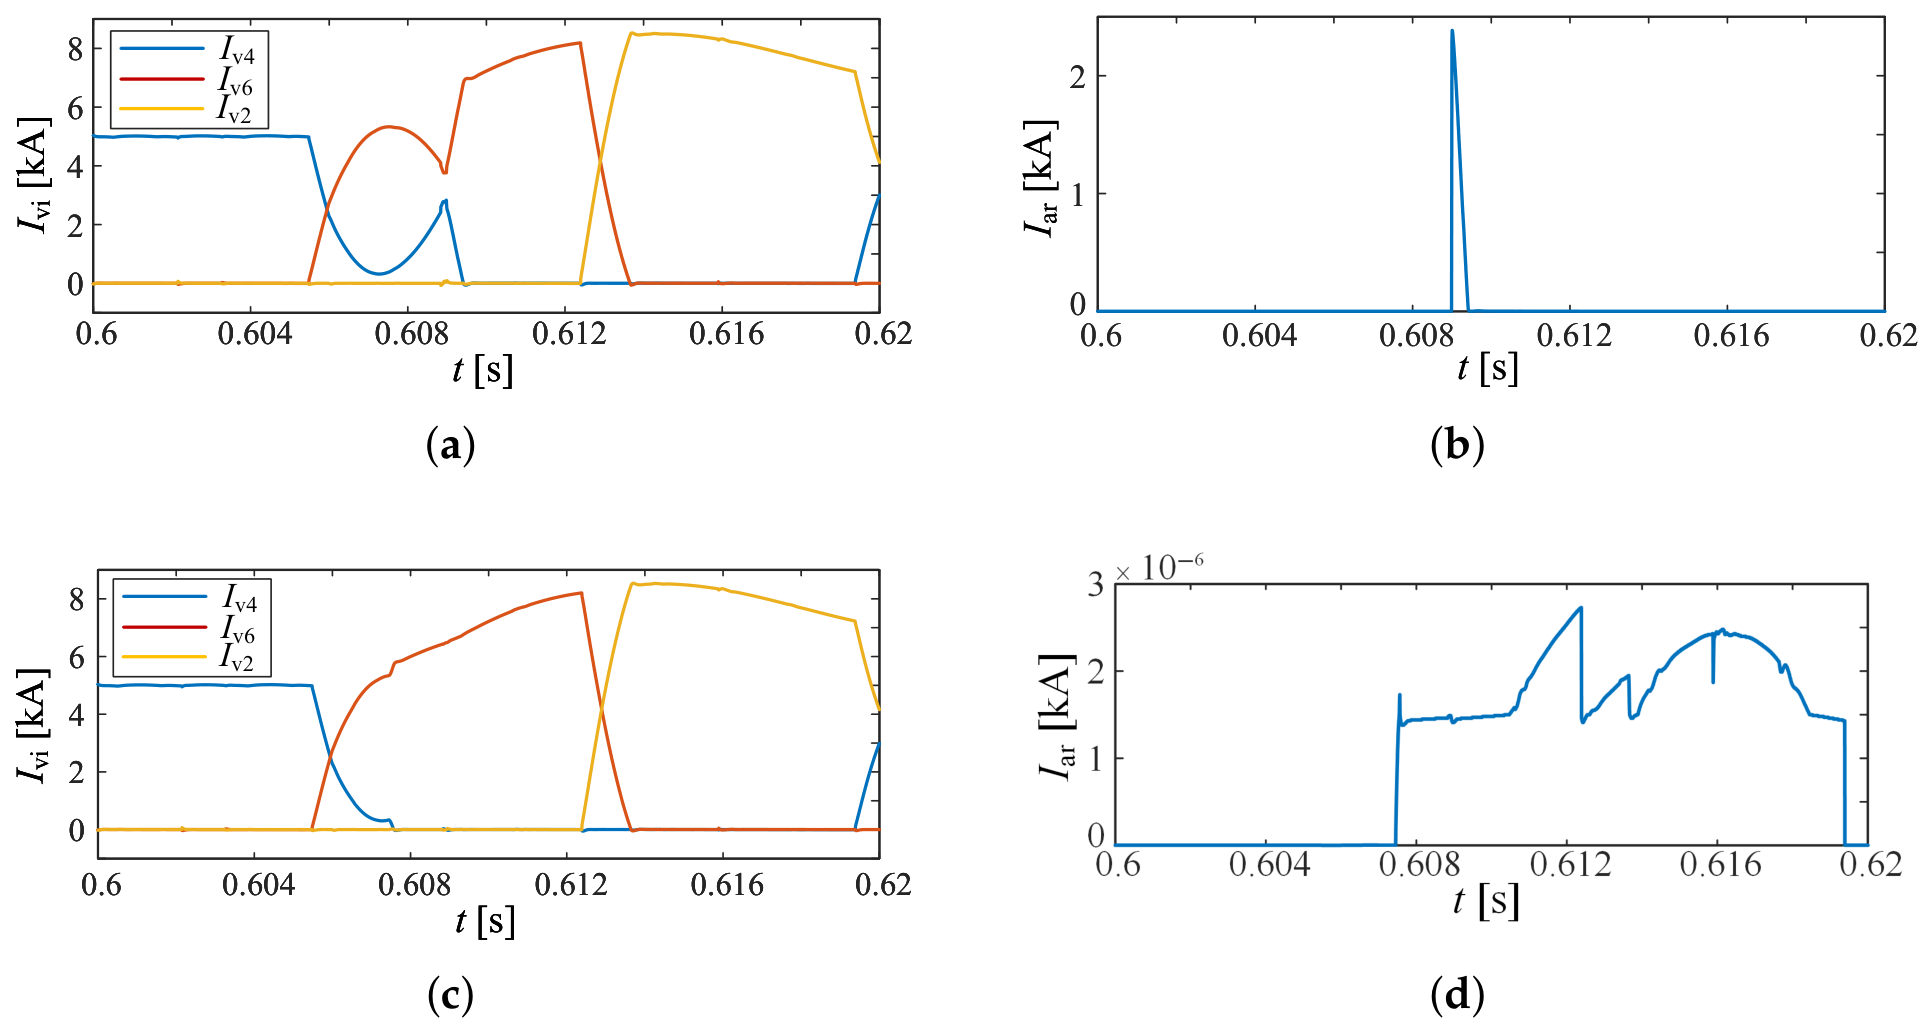
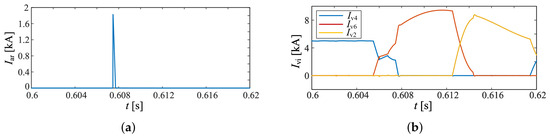
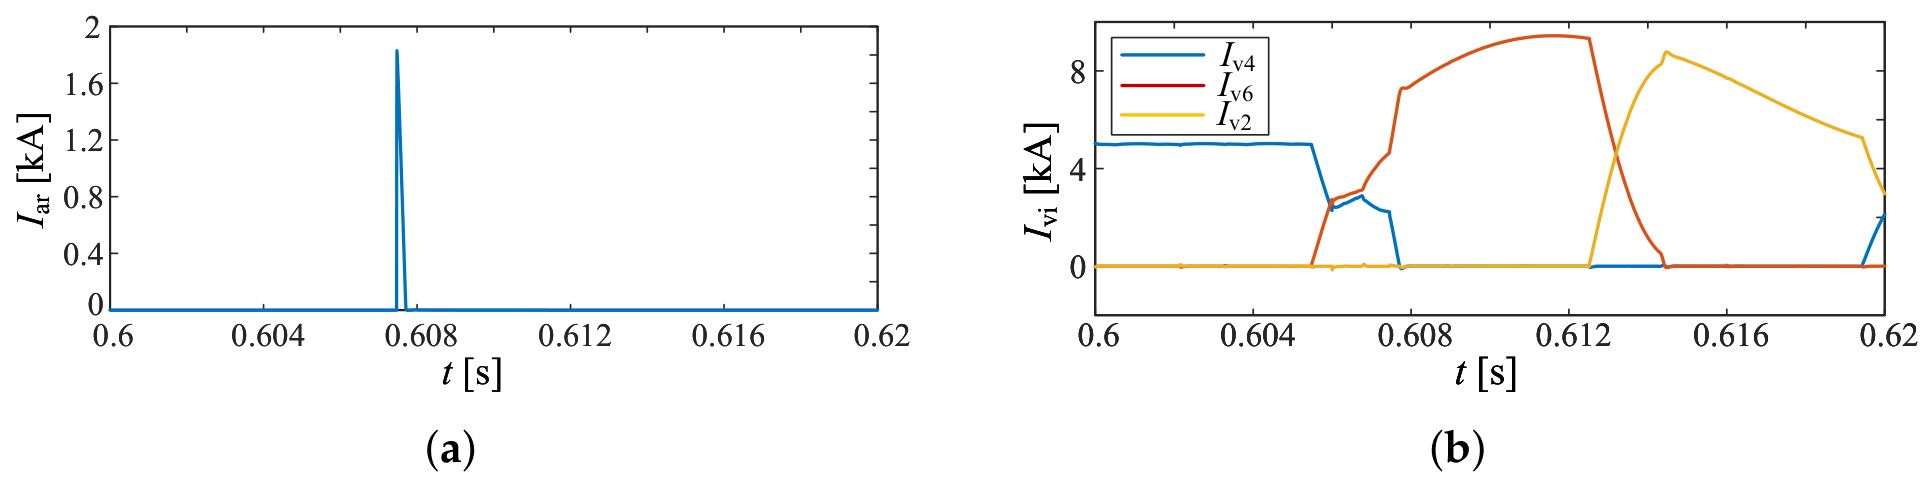
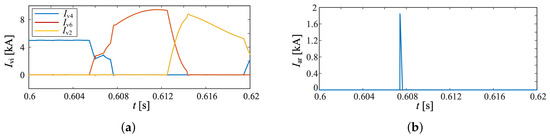
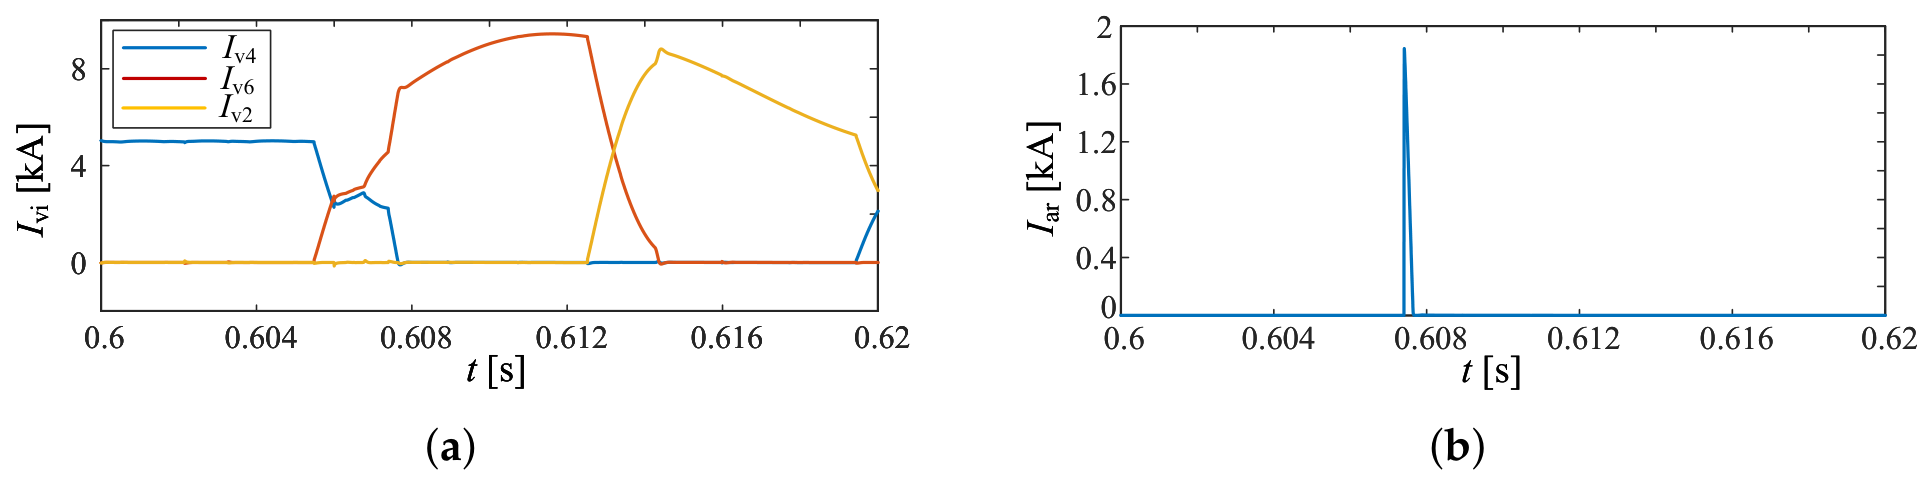
It can be observed from the comparison results in Figure 19, Figure 20 and Figure 21 that under the three fault conditions, due to the delayed turn-off of V13 in the conventional control method, the valve current rises for a period before the current is commutated to the arrester. In contrast, with the proposed control strategy, V13 can be turned off prior to the extreme point of the valve current, which minimizes the current stress borne by the arrester and improves the commutation waveforms. The prediction errors of the valve-current extreme point for K1–K3 are 0.105 ms, 0.145 ms, and 0.13 ms, respectively. Compared with the conventional method, the arrester current stress is reduced by 52.21%, 59.18%, and 66.11% under faults at K1 to K3.
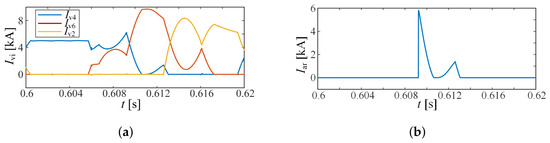
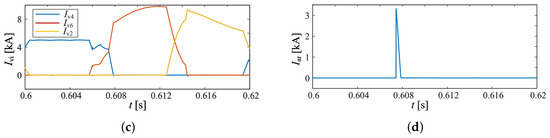
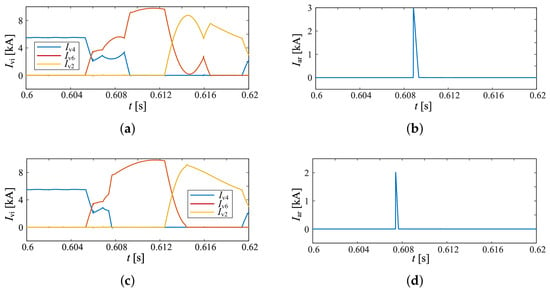
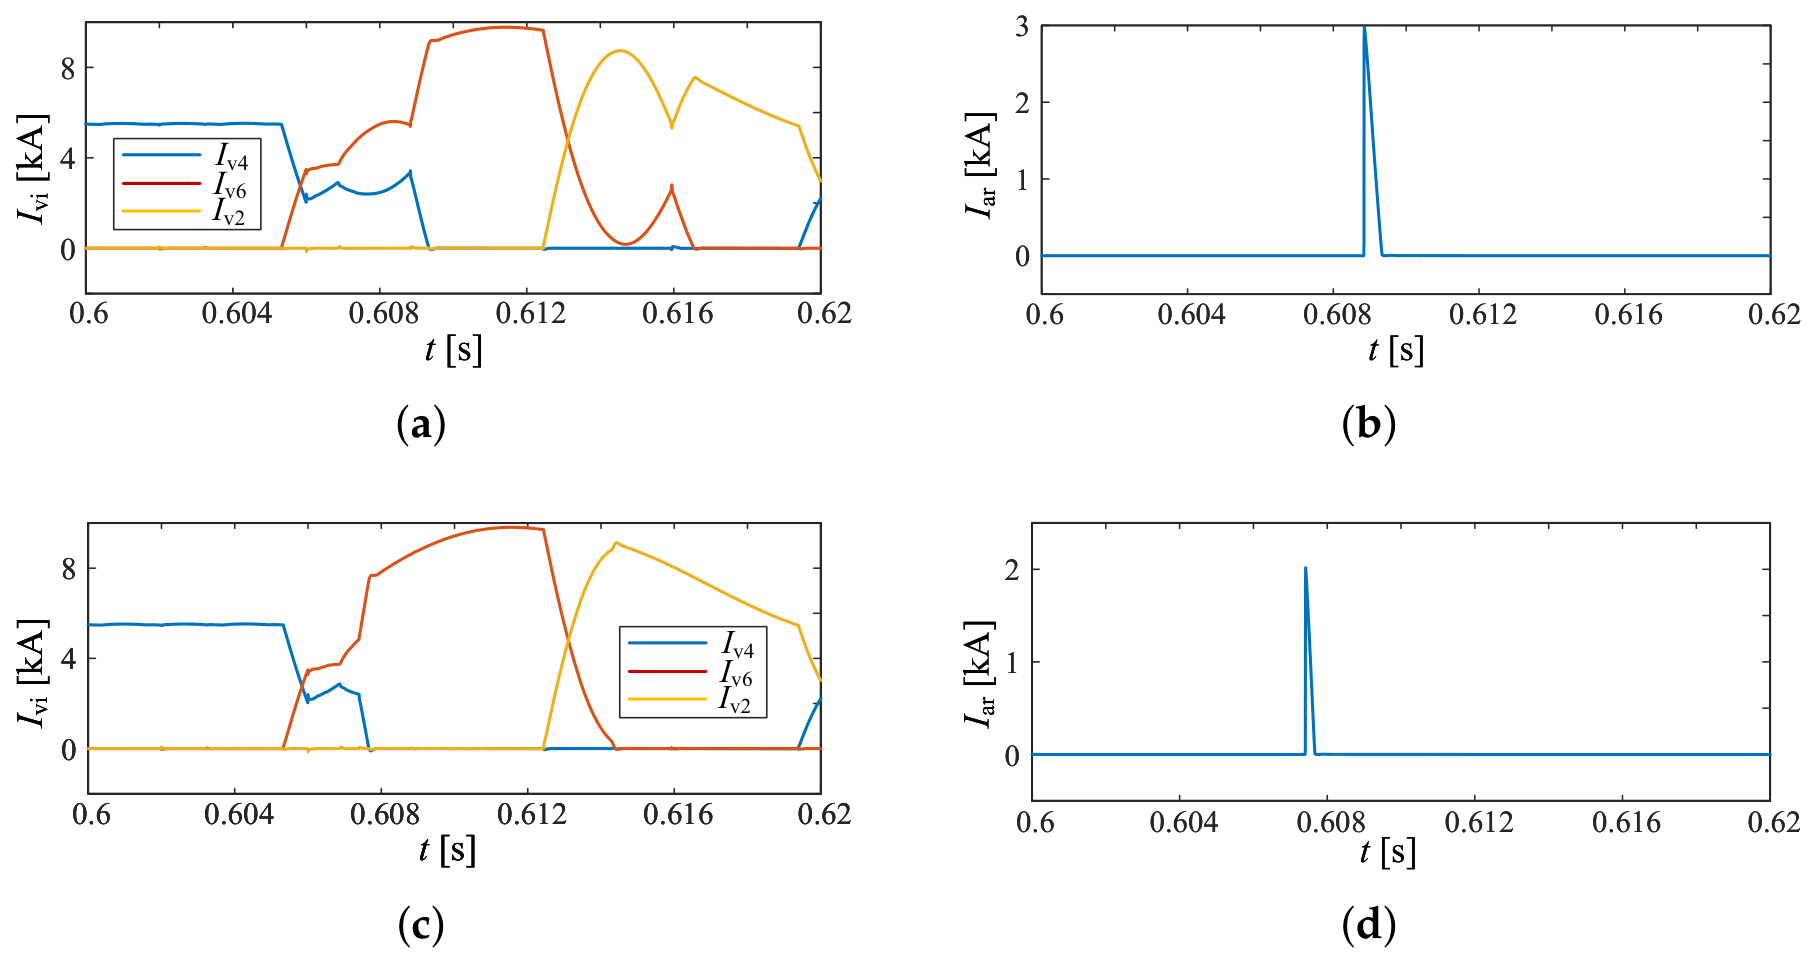
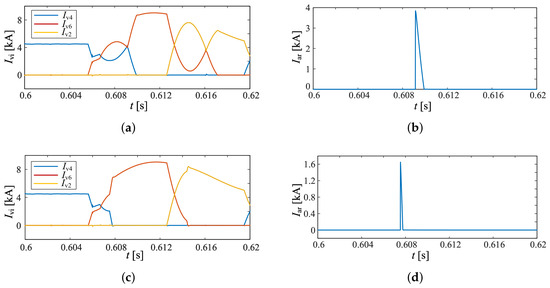
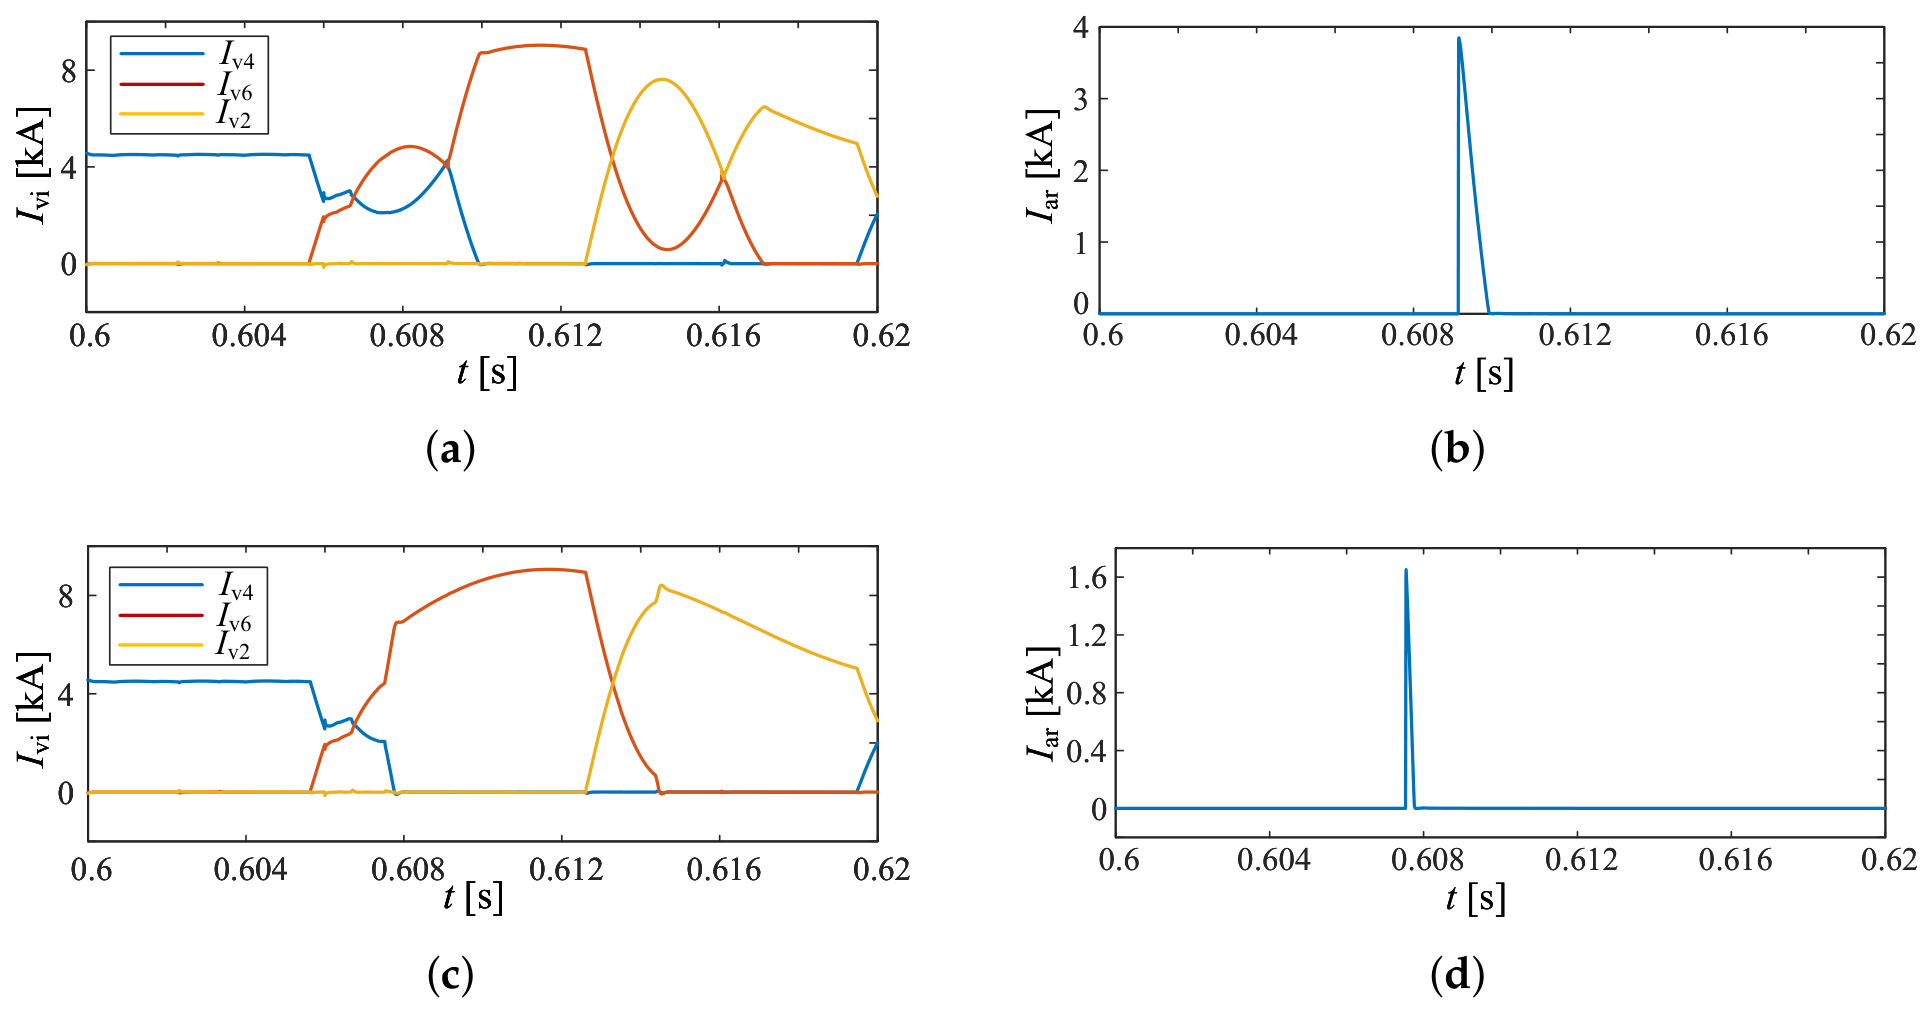
Furthermore, to verify the robustness of the proposed method, the effectiveness of the conventional control strategy and the proposed strategy were further evaluated under various operating conditions. Taking the fault at location K1, these conditions included different transmission power levels, firing angles, fault inception times, AC-system short-circuit capacities, fault severities, and variations in and , thereby providing further evidence of the control performance of the proposed method. The simulation verification results and comparative analysis are shown in Figure 22, Figure 23, Figure 24, Figure 25, Figure 26, Figure 27, Figure 28, Figure 29, Figure 30 and Figure 31.
Figure 22.
Effect verification when the steady-state firing angle is increased from to . (a) Valve currents under the conventional strategy (V4, V6, and V2). (b) Surge arrester stress under the conventional strategy. (c) Valve currents under the proposed strategy (V4, V6, and V2). (d) Surge arrester stress under the proposed strategy.
Figure 23.
Effect verification when the short-circuit capacity is reduced to 16,000 MVA. (a) Valve currents under the conventional strategy (V4, V6, and V2). (b) Surge arrester stress under the conventional strategy. (c) Valve currents under the proposed strategy (V4, V6, and V2). (d) Surge arrester stress under the proposed strategy.
Figure 24.
Effect verification when the transmission power is increased by 10%. (a) Valve currents under the conventional strategy (V4, V6, and V2). (b) Surge arrester stress under the conventional strategy. (c) Valve currents under the proposed strategy (V4, V6, and V2). (d) Surge arrester stress under the proposed strategy.
Figure 25.
Effect verification when the transmission power is decreased by 10%. (a) Valve currents under the conventional strategy (V4, V6, and V2). (b) Surge arrester stress under the conventional strategy. (c) Valve currents under the proposed strategy (V4, V6, and V2). (d) Surge arrester stress under the proposed strategy.
Figure 26.
Effect verification when the fault point is grounded through a inductor. (a) Valve currents under the conventional strategy (V4, V6, and V2). (b) Surge arrester stress under the conventional strategy. (c) Valve currents under the proposed strategy (V4, V6, and V2). (d) Surge arrester stress under the proposed strategy.
Figure 27.
Effect verification when the fault inception time is advanced from to . (a) Valve currents under the conventional strategy (V4, V6, and V2). (b) Surge arrester stress under the conventional strategy. (c) Valve currents under the proposed strategy (V4, V6, and V2). (d) Surge arrester stress under the proposed strategy.
Figure 28.
Effect verification when is increased by 20%. (a) Valve currents under the proposed strategy (V4, V6, and V2). (b) Surge arrester stress under the proposed strategy.
Figure 29.
Effect verification when is decreased by 20%. (a) Valve currents under the proposed strategy (V4, V6, and V2). (b) Surge arrester stress under the proposed strategy.
Figure 30.
Effect verification when is increased by 20%. (a) Valve currents under the proposed strategy (V4, V6, and V2). (b) Surge arrester stress under the proposed strategy.
Figure 31.
Effect verification when is decreased by 20%. (a) Valve currents under the proposed strategy (V4, V6, and V2). (b) Surge arrester stress under the proposed strategy.
It should be noted that the control strategy proposed in this paper is primarily intended to suppress commutation abnormalities and alleviate the current stress imposed on the arresters. As demonstrated by the preceding analysis and verification, K4 faults do not significantly trigger the aforementioned issues. Therefore, it is unnecessary to verify the proposed strategy under K4 fault conditions.
4. Conclusions
The transient characteristics and valve control strategy of an LCC-CLCC HVDC transmission system were investigated under single-phase-to-ground faults at the valve side of the converter transformer. A valve control strategy optimization method was also proposed. The main conclusions were as follows:
- The transient characteristics of single-phase-to-ground faults at the valve side of the converter transformer were jointly affected by the fault location and the valve conduction state at the fault instant. Under faults at K1–K3, the currents of the common-cathode valve group rapidly crossed zero and the valves turned off. When the corresponding protections were configured, even if the CLCC still adopted the original valve control timing during the fault transient before protection operation, the commutation process might still suffer from abnormal commutation due to delayed turn-off and increase the overstress risk of the IGBT and the arrester.
- Under a fault at K4, two valves in the common-cathode valve group rapidly turned off, while the other valve exhibited periodic short-time conduction. Its conduction duration was shorter than that under normal operation. When this valve conducted, it formed a phase-to-phase short circuit with the faulted phase and might delay protection operation.
- A valve control strategy optimization method was proposed for the main and auxiliary branches based on valve-current extreme prediction. The strategy adjusts the turn-off coordination between the main and auxiliary branches according to the initial commutation state, ensuring that the current commutation to the arrester always takes place before the valve current reaches its extreme point. Simulation results show that the proposed strategy can effectively suppress abnormal commutation and reduce the transient stress on fully controlled sub-valves and arresters in the CLCC. Specifically, compared with the conventional method, the arrester current stress is reduced by 52.21%, 59.18%, and 66.11% under K1 to K3 fault conditions, respectively. Furthermore, the strategy can improve the commutation waveform and enhance the operational stability of the system.
Author Contributions
T.W. contributed to conceptualization, methodology, original draft writing, and funding acquisition. L.X. and X.L. also contributed to conceptualization, methodology, and original draft writing together with T.W., Y.H. and Y.X. performed validation. Z.C. completed manuscript review and editing. Y.H., Y.X. and Z.C. supervised the whole research. All authors have read and agreed to the published version of the manuscript.
Funding
This work was supported by the Smart Grid-National Science and Technology Major Project of China (Grant No. 2024ZD0802700) and the Joint Fund Project of the National Natural Science Foundation of China (Grant No. U2066208).
Data Availability Statement
The numerical and simulation data generated by PSCAD/EMTDC and MATLAB in this study, as well as the associated simulation models and scripts, are not publicly available due to project-related intellectual property restrictions. Requests for access to the aforementioned materials for reasonable academic purposes may be addressed to the corresponding author.
Conflicts of Interest
Author Lingling Xu is employed by the State Grid Corporation of China. The remaining authors declare that the research was conducted in the absence of any commercial or financial relationships that could be construed as a potential conflict of interest.
References
- Guo, X.; Li, X.; Wang, Q.; Li, P. Development status and reflections on ultra-high voltage direct current transmission technology. New Type Power Syst. 2024, 2, 237–250. (In Chinese) [Google Scholar]
- Liu, Z.; Zhang, Q. Research on the development mode of State Grid. Proc. CSEE 2013, 33, 1–10+25. (In Chinese) [Google Scholar]
- Zhou, X.; Chen, S.; Lu, Z.; Huang, Y.; Ma, S.; Zhao, Q. Technical characteristics of China’s new-generation power system in the energy transition. Proc. CSEE 2018, 38, 1893–1904+2205. (In Chinese) [Google Scholar]
- Tang, G.; Pang, H.; He, Z. Development and application of advanced AC/DC power transmission technologies in China. Proc. CSEE 2016, 36, 1760–1771. (In Chinese) [Google Scholar]
- Li, G.; Wang, T.; Xin, Y.; Jiang, S.; Wang, W.; Liu, X. A rapid identification method for commutation failure risk area in multi-infeed high voltage direct current receiving-end power grid. Proc. CSEE 2022, 42, 140–153. (In Chinese) [Google Scholar]
- Ruan, S.; Xu, K.; Liu, D.; Lv, P.; Wang, D.; Wang, H. Statistical analysis of commutation failures in HVDC transmission systems and suggestions for mitigation measures. Autom. Electr. Power Syst. 2019, 43, 13–17+34. (In Chinese) [Google Scholar]
- Amari, A.; Moussa, M.A.; Kherfane, S.; M’hamdi, B.; Benaissa, T.; Elbar, M.; Zaitsev, I.; Kuchansky, V. Enhancing commutation failure immunity of LCC-HVDC systems with a fuzzy adaptive PI scheme and STATCOM integration. Energies 2026, 19, 2047. [Google Scholar] [CrossRef] [Scilit]
- Gao, C.; He, Z.; Yang, J.; Sheng, C.; Zhang, J.; Wang, P. A novel controllable line commutated converter topology and control strategy. Proc. CSEE 2023, 43, 1940–1950. (In Chinese) [Google Scholar]
- Gao, C.; Yang, J.; He, Z.; Tang, G.; Zhang, J.; Li, T.; He, D. Novel controllable-line-commutated converter for eliminating commutation failures of LCC-HVDC system. IEEE Trans. Power Deliv. 2022, 38, 255–267. [Google Scholar] [CrossRef] [Scilit]
- Yu, L.; Wang, P.; Zhang, J.; Gao, C.; Ding, D.; Yang, J.; Jia, P. Research on controllable line-commutated converter with shared auxiliary branch. Power Syst. Technol. 2026, 50, 3892–3900. (In Chinese) [Google Scholar] [CrossRef]
- Chen, H.; Li, J.; Huang, Z. Simplified modeling method for controllable line-commutated converters in electromagnetic transient simulation. Power Syst. Technol. 2024, 48, 3467–3475. (In Chinese) [Google Scholar]
- Zhang, J.; Gao, C.; Yang, J.; Tang, G.; Wang, C.; Shu, S. Study on working principle and electrical modeling of energy consumption mode of controllable line-commutated converter. High Volt. Eng. 2024, 50, 2784–2793. (In Chinese) [Google Scholar]
- Yuan, M.; Li, X.; Wang, F. Design of controllable line commutated converter valve control system. In Proceedings of the 6th International Conference on HVDC (HVDC 2024), Urumqi, China, 8–10 August 2024; pp. 429–432. [Google Scholar]
- Zhou, L.; Nian, H.; Liu, H.; Yang, J.; Luan, H.; Niu, Y.; Hu, J. Research and engineering application of controllable line commutated converter valve-control system. In Proceedings of the 6th International Conference on HVDC (HVDC 2024), Urumqi, China, 8–10 August 2024; pp. 574–579. [Google Scholar]
- He, Z.; Gao, C.; Zhang, J.; Sheng, C.; Wang, C.; Wang, P. Study on single valve turn-off test method of controllable line-commutated converter. Proc. CSEE 2024, 44, 8248–8258. (In Chinese) [Google Scholar]
- Zhang, M.; Yang, J.; Du, Z.; Liu, H.; Wang, Y.; Li, T. Low voltage test method for controllable line-commutated converter. High Volt. Eng. 2024, 50, 3655–3664. (In Chinese) [Google Scholar]
- He, Z.; Gao, C.; Li, Y.; Ye, H.; Li, T.; Ning, Z. Harmonic analysis and impact assessment of turn-off current source converter. Autom. Electr. Power Syst. 2026, 50, 85–94. (In Chinese) [Google Scholar]
- Xu, W.; Zhang, D.; Ma, J.; Yin, Z.; Ouyang, Z.; Guo, Q.; Zhang, H.; Zhu, M. Analysis of CLCC valve fault performance: A comparative evaluation with LCC. In Proceedings of the 2024 IEEE Industry Applications Society Annual Meeting (IAS), Phoenix, AZ, USA, 20–24 October 2024; pp. 1–6. [Google Scholar]
- Xu, W.; Ma, J.; Zhang, D.; Chen, Z.; Zhu, M. Fault characteristic analysis and countermeasure research for novel CLCC DC system. IEEE Trans. Ind. Appl. 2025, 61, 8799–8810. [Google Scholar] [CrossRef] [Scilit]
- Xin, Y.; Zhao, X.; Ding, D.; Chen, S.; Wang, C.; Wang, T. Construction of MMC-CLCC hybrid DC transmission system and its power flow reversal control strategy. Energy Eng. J. Assoc. Energy Eng. 2026, 123, 1. [Google Scholar] [CrossRef] [Scilit]
- Lian, P.; Pang, B.; Liu, W.; Zheng, C.; Xu, K. Research on fault characteristics and control optimization of novel controllable line commutated converter. Proc. CSEE 2025, 45, 679–690. (In Chinese) [Google Scholar]
- Xin, Y.; Ma, Z.; Wang, T.; Li, G.; He, Y.; Jiang, S. Analysis of CLCC multi-quadrant power regulation capability and short-term reactive power support control strategy. Proc. CSEE 2026, 46, 5358–5370. (In Chinese) [Google Scholar]
- Wen, M.; Li, B.; Jiang, Q.; Liu, T.; Zhang, Y.; Leng, M. Adaptive current deviation control and improved VDCOL for enhanced fault ride-through in CLCC-HVDC systems. IET Gener. Transm. Distrib. 2025, 19, e70128. [Google Scholar] [CrossRef] [Scilit]
- Zhu, J.; Li, Y.; Li, M.; Wu, Z. Analysis of single-phase grounding fault at converter transformer valve side considering fault duration. South. Power Syst. Technol. 2014, 8, 24–28. (In Chinese) [Google Scholar]
- Zhang, Y.; Wei, L. Study on valve-side winding fault characteristics of converter transformer in LCC-HVDC system. Electr. Power Syst. Res. 2024, 232, 110426. [Google Scholar] [CrossRef] [Scilit]
- Zheng, T.; Liu, X.; Guo, X. Analysis of fault-induced inrush current of converter transformer in LCC HVDC system considering DC control and protection. Int. J. Electr. Power Energy Syst. 2021, 125, 106536. [Google Scholar] [CrossRef] [Scilit]
- Zhang, Y.; Dong, G.; Wei, L.; Ma, J.; Du, S. Influence of the converter transformer valve-side bushing fault on commutation reactance protection and improvement scheme. Arch. Electr. Eng. 2023, 72, 715–735. [Google Scholar] [CrossRef] [Scilit]
- Shu, H.; Ren, M.; Shan, J. Fast suppression scheme of AC valve-side grounding fault current in converter station. Electr. Power Autom. Equip. 2022, 42, 61–68. (In Chinese) [Google Scholar]
- Chen, W.; Ye, Y.; Zhou, B.; Yang, J.; Wang, J.; Fu, C. Influence of constant voltage and predicted constant extinction angle control on small-signal stability of HVDC. Autom. Electr. Power Syst. 2020, 44, 98–106. (In Chinese) [Google Scholar]

Disclaimer/Publisher’s Note: The statements, opinions and data contained in all publications are solely those of the individual author(s) and contributor(s) and not of MDPI and/or the editor(s). MDPI and/or the editor(s) disclaim responsibility for any injury to people or property resulting from any ideas, methods, instructions or products referred to in the content. |
© 2026 by the authors. Licensee MDPI, Basel, Switzerland. This article is an open access article distributed under the terms and conditions of the Creative Commons Attribution (CC BY) license.