


Abstract
Partial discharge (PD) detection is a crucial means for the early warning of incipient insulation defects in arresters. However, under strong electromagnetic interference and background noise, PD signals are prone to distortion, making it difficult to accurately determine the pulse onset front and thus severely degrading the accuracy of time-delay estimation. To address the difficulty of time-delay estimation under low signal-to-noise ratio (SNR) and multi-channel aliasing conditions, this paper proposes a method for arrester PD detection and high-precision time-delay estimation based on joint denoising and improved cross-correlation. First, a joint denoising strategy that integrates singular value decomposition (SVD), variational mode decomposition adaptively optimized by the sparrow search algorithm (SSA-VMD), and the Teager energy operator (TEO) is constructed. This strategy suppresses white noise and periodic narrowband interference while effectively extracting the oscillatory onset characteristics of PD pulses. Second, an enhanced time-delay estimation method based on HB-weighted generalized quadratic cross-correlation is introduced. By employing the dual mechanisms of HB frequency-domain weighting and amplitude weighting to sharpen the correlation peak, the estimation robustness under low SNR is improved. Simulation results show that the proposed method attains an accuracy of 99.9911%, significantly outperforming conventional cross-correlation, PHAT-SCOT, and NLMS methods. Finally, experiments are conducted on a needle-plate discharge platform. In multiple comparative experiments with different spatial distance differences (ranging from <30 cm to >50 cm), the maximum relative error is kept within 0.6%, verifying the reliability and accuracy of the proposed algorithm under controlled laboratory conditions. This method can provide a new approach for online monitoring and accurate fault location of arresters in power systems.
1. Introduction
Lightning arresters [1] are core devices for overvoltage protection in AC power systems. During long-term operation, arresters are continuously subjected to the combined effects of electric fields, temperature, humidity, and environmental contamination. This can gradually lead to insulation defects such as sealing aging, internal moisture ingress, varistor degradation, interface debonding, and internal void initiation. Partial discharge (PD) is a typical manifestation of early insulation deterioration and can provide early warning of arrester faults.
Current monitoring of arresters mainly relies on traditional electrical parameters such as total current and resistive current. It is supplemented by auxiliary methods like infrared thermography [2,3]. These methods can effectively identify overall moisture ingress and large-scale varistor degradation. However, they are not sensitive enough to detect minor internal voids and early-stage interface damage [4,5,6]. In contrast, PD detection can directly capture transient signals and ultrasonic signals caused by electric field distortion in defective regions. This compensates for the limitations of conventional methods in principle. According to relevant international standards, PD detection is classified into electrical methods, ultra-high-frequency (UHF) methods, and ultrasonic methods [7,8,9]. Among these, the ultrasonic method has strong immunity to electromagnetic interference and offers the advantage of fault localization. However, its signals are susceptible to propagation attenuation and environmental clutter. This can distort the waveform and increase the difficulty of time-delay estimation. Moreover, the complex electromagnetic environment and mechanical noise in power substations can cause PD waveform distortion [10,11]. This disrupts the initial rising-edge shape of the PD pulse and directly reduces the accuracy of time-delay estimation, thereby compromising detection reliability. Therefore, effective signal denoising and precise time-delay estimation are crucial for improving PD detection performance.
Current mainstream methods for PD signal denoising include wavelet transform (WT), empirical mode decomposition (EMD) [12], adaptive filtering, singular value decomposition (SVD) [13], variational mode decomposition (VMD), and the Teager energy operator (TEO). Wavelet transform can effectively suppress white noise and extract features at multiple scales. However, there is no unified criterion for selecting the wavelet basis and decomposition level. Empirical mode decomposition is fully adaptive and requires no preset basis functions. Yet it is prone to mode mixing and endpoint effects. Adaptive filtering has a simple structure and is suitable for periodic narrowband interference. But its convergence speed and steady-state error are mutually constrained, making parameter tuning difficult. Singular value decomposition can suppress both white noise and narrowband interference simultaneously. However, the effective number of singular values is hard to determine objectively, and the computation is time-consuming. Variational mode decomposition overcomes mode mixing and has a solid mathematical foundation. Nevertheless, its modal parameters depend on manual setting, and under strong noise it is liable to over-decomposition or under-decomposition. The Teager energy operator is extremely sensitive to signal transients and has very low computational cost. It can track the onset moment of pulses. However, it has poor noise robustness. Under strong noise, its output is severely distorted, making it difficult to accurately identify the onset point. Commonly used time-delay estimation methods [14] include GCC [15,16], PHAT-SCOT [17], ESPRIT [18], and NLMS. The GCC algorithm is computationally simple and offers good real-time performance. However, its noise immunity is weak. The time-delay peak tends to shift in the presence of noise. This leads to inaccurate calculation of the pulse front-edge time delay [19,20,21]. PHAT-SCOT can achieve higher time-delay estimation accuracy under low signal-to-noise ratio (SNR) conditions compared with conventional PHAT weighting and single-SCOT weighting. However, the algorithm relies on the stationarity assumption of signals received by a microphone array. Moreover, the additional computational burden introduced by dual frequency-domain weighting is unfavorable for real-time online processing. The ESPRIT algorithm possesses the potential for super-resolution multipath time-delay resolution. Yet it has high computational complexity and is sensitive to waveform distortion. Its estimation accuracy degrades substantially when the pulse front edge is distorted [22,23,24]. The NLMS adaptive algorithm has a simple structure and can track time-delay variations online. However, the inherent conflict between convergence speed and steady-state error easily causes tracking lag [25]. This makes it difficult to achieve high-precision time-delay calibration of the pulse front edge. The aforementioned existing methods cannot readily achieve accurate identification of the PD pulse onset front and time-delay determination under strong interference conditions [26,27,28]. This bottleneck constitutes the core problem that the proposed algorithm seeks to address.
This paper carries out systematic research on partial discharge detection and time-delay estimation methods for lightning arresters. The research object is the gapless zinc oxide surge arrester (MOA) used in the high-voltage AC substation of the industrial partner, Liaoning Hongyanhe Nuclear Power Co., Ltd., with a rated voltage of 500 kV and above. To address the difficulty in calibrating the leading edge of partial discharge pulses under strong interference, this paper designs a joint denoising algorithm combining SSA-VMD and the Teager energy operator (TEO). It also proposes an HB-weighted generalized quadratic cross-correlation time-delay estimation method to improve estimation accuracy. The proposed method relies on the time-frequency features of ultrasonic partial discharge signals. These features are mainly determined by the defect type rather than the nominal voltage of the arrester. Simulation and experimental results show that the overall algorithm has good anti-interference capability and measurement accuracy. It can provide technical support for online monitoring and early warning of arrester faults. Moreover, it is expected to be applicable to MOA arresters of different voltage levels and can offer new ideas for intelligent operation and maintenance of power grid equipment.
2. Mechanism of Partial Discharge in Lightning Arresters and Principle of Time-Delay Estimation
2.1. Feature Extraction and Joint Denoising of PD Signals
First, singular value decomposition (SVD) is used as the front-end denoising step. Its energy concentration property helps remove uncorrelated white noise without phase distortion. This achieves primary noise reduction. Second, to address the parameter dependence of variational mode decomposition (VMD), the sparrow search algorithm (SSA) is introduced. Physical frequency constraints are added for adaptive optimization. This step accurately extracts the pure partial discharge characteristic waveform. Finally, to overcome the phase misalignment in time difference in arrival (TDOA) caused by high-frequency oscillations, the Teager energy operator (TEO) is applied. It performs nonlinear envelope demodulation on the target mode. TEO converts the high-frequency oscillation into a smooth energy envelope. This allows precise calibration of the PD pulse leading edge. It lays a solid foundation for subsequent nanosecond-level TDOA localization.
2.1.1. Singular Value Decomposition (SVD)
An Hankel matrix is constructed from the noisy signal. This converts the one-dimensional time series into a two-dimensional matrix. Singular value decomposition is then performed on this matrix:
where U and V are the left and right singular matrices. Both are orthogonal matrices. is the transpose of the right singular matrix. is the i-th left singular vector from U. is the i-th right singular vector from V. The main diagonal elements of are the singular values of H. They are arranged in descending order (). Larger singular values correspond to the principal components of the signal (the valid signal). Smaller singular values correspond to the noise components.
The core mechanism of SVD denoising is to truncate the small singular values after the k + 1-th one. Only the first k singular values are used to reconstruct the valid signal matrix:
where k is the truncation order of the effective singular values. It is usually determined by observing the inflection point of the singular value curve. is the approximate Hankel matrix reconstructed using only the first k singular values. By applying diagonal averaging to , we can restore the denoised one-dimensional time-domain signal.
2.1.2. Parameter Optimization of VMD Based on the Sparrow Search Algorithm (SSA)
Variational mode decomposition (VMD) transforms signal decomposition into a constrained variational problem. Its mathematical model is:
where is the partial derivative with respect to time t. is the original input signal. is the Dirac delta function. is the k-th decomposed mode. is its center frequency of the k-th mode. The symbol denotes convolution. denotes the norm.
By introducing a quadratic penalty factor and a Lagrange multiplier , the problem is solved iteratively using the alternating direction method of multipliers (ADMM). The augmented Lagrangian function is:
where denotes the inner product. is the Lagrange multiplier.
The decomposition performance of VMD depends heavily on the number of modes K and the penalty factor . To adaptively obtain the optimal parameter pair, the sparrow search algorithm (SSA) is introduced for global optimization [27]. SSA updates positions by simulating the foraging and anti-predation behavior of a sparrow population. Its core update mechanism is:
where t is the current iteration number. is the maximum number of iterations. represents the position of the i-th sparrow in the j-th dimension. is a random number. is the alert value. is the safe threshold. Q is a random number following a normal distribution. L is an all-one matrix.
However, if the minimum envelope entropy is used directly as the fitness function, SSA can be misled by spurious modes caused by high-frequency shot noise. This drives the optimization away from the true partial discharge frequency band. It also tends to push K to a large value, leading to mode splitting [28,29]. To solve these problems, an improved fitness function F is proposed. It incorporates physical prior knowledge of the ultrasonic sensor:
where MEE is the minimum envelope entropy. is a penalty factor. is the actual center frequency of the i-th IMF component. is a prior frequency penalty function introduced in this paper, defined as follows:
where = 50 kHz and = 350 kHz. These values correspond to the effective bandwidth of the ultrasonic sensor. In addition, during the SSA initialization stage, the upper bound of the search for K is strictly limited to K ≤ 5. This fundamentally prevents mode splitting. Through these improvements, the algorithm searches for the optimal parameter pair within the effective frequency band. It balances the signal-to-noise ratio and modal integrity.
2.1.3. High-Frequency Impulse Envelope Extraction Based on the Teager Energy Operator (TEO)
To accurately calibrate the onset front of PD pulses, the Teager energy operator (TEO) is introduced. It performs nonlinear envelope demodulation on the extracted target IMF component [30]. For a continuous-time signal , the TEO is defined as:
where is the first derivative of with respect to time, and is the second derivative.
For a discrete-time sequence , the discrete time TEO is given by:
The TEO tracks the instantaneous energy of a signal. It is highly sensitive to transient changes in both amplitude and frequency. At the moment of PD onset, the sharp variations in amplitude and frequency cause the TEO output to surge instantly. During quiet periods without PD activity, the output approaches zero. Through nonlinear mapping by the TEO, the originally high-frequency oscillating waveform is converted into a smooth, unipolar energy envelope. This effectively eliminates carrier phase interference. It significantly improves the identifiability of the onset point. It provides a reliable foundation for subsequent accurate time-delay estimation.
2.2. Principle of HB-Weighted Generalized Quadratic Cross-Correlation Time-Delay Estimation
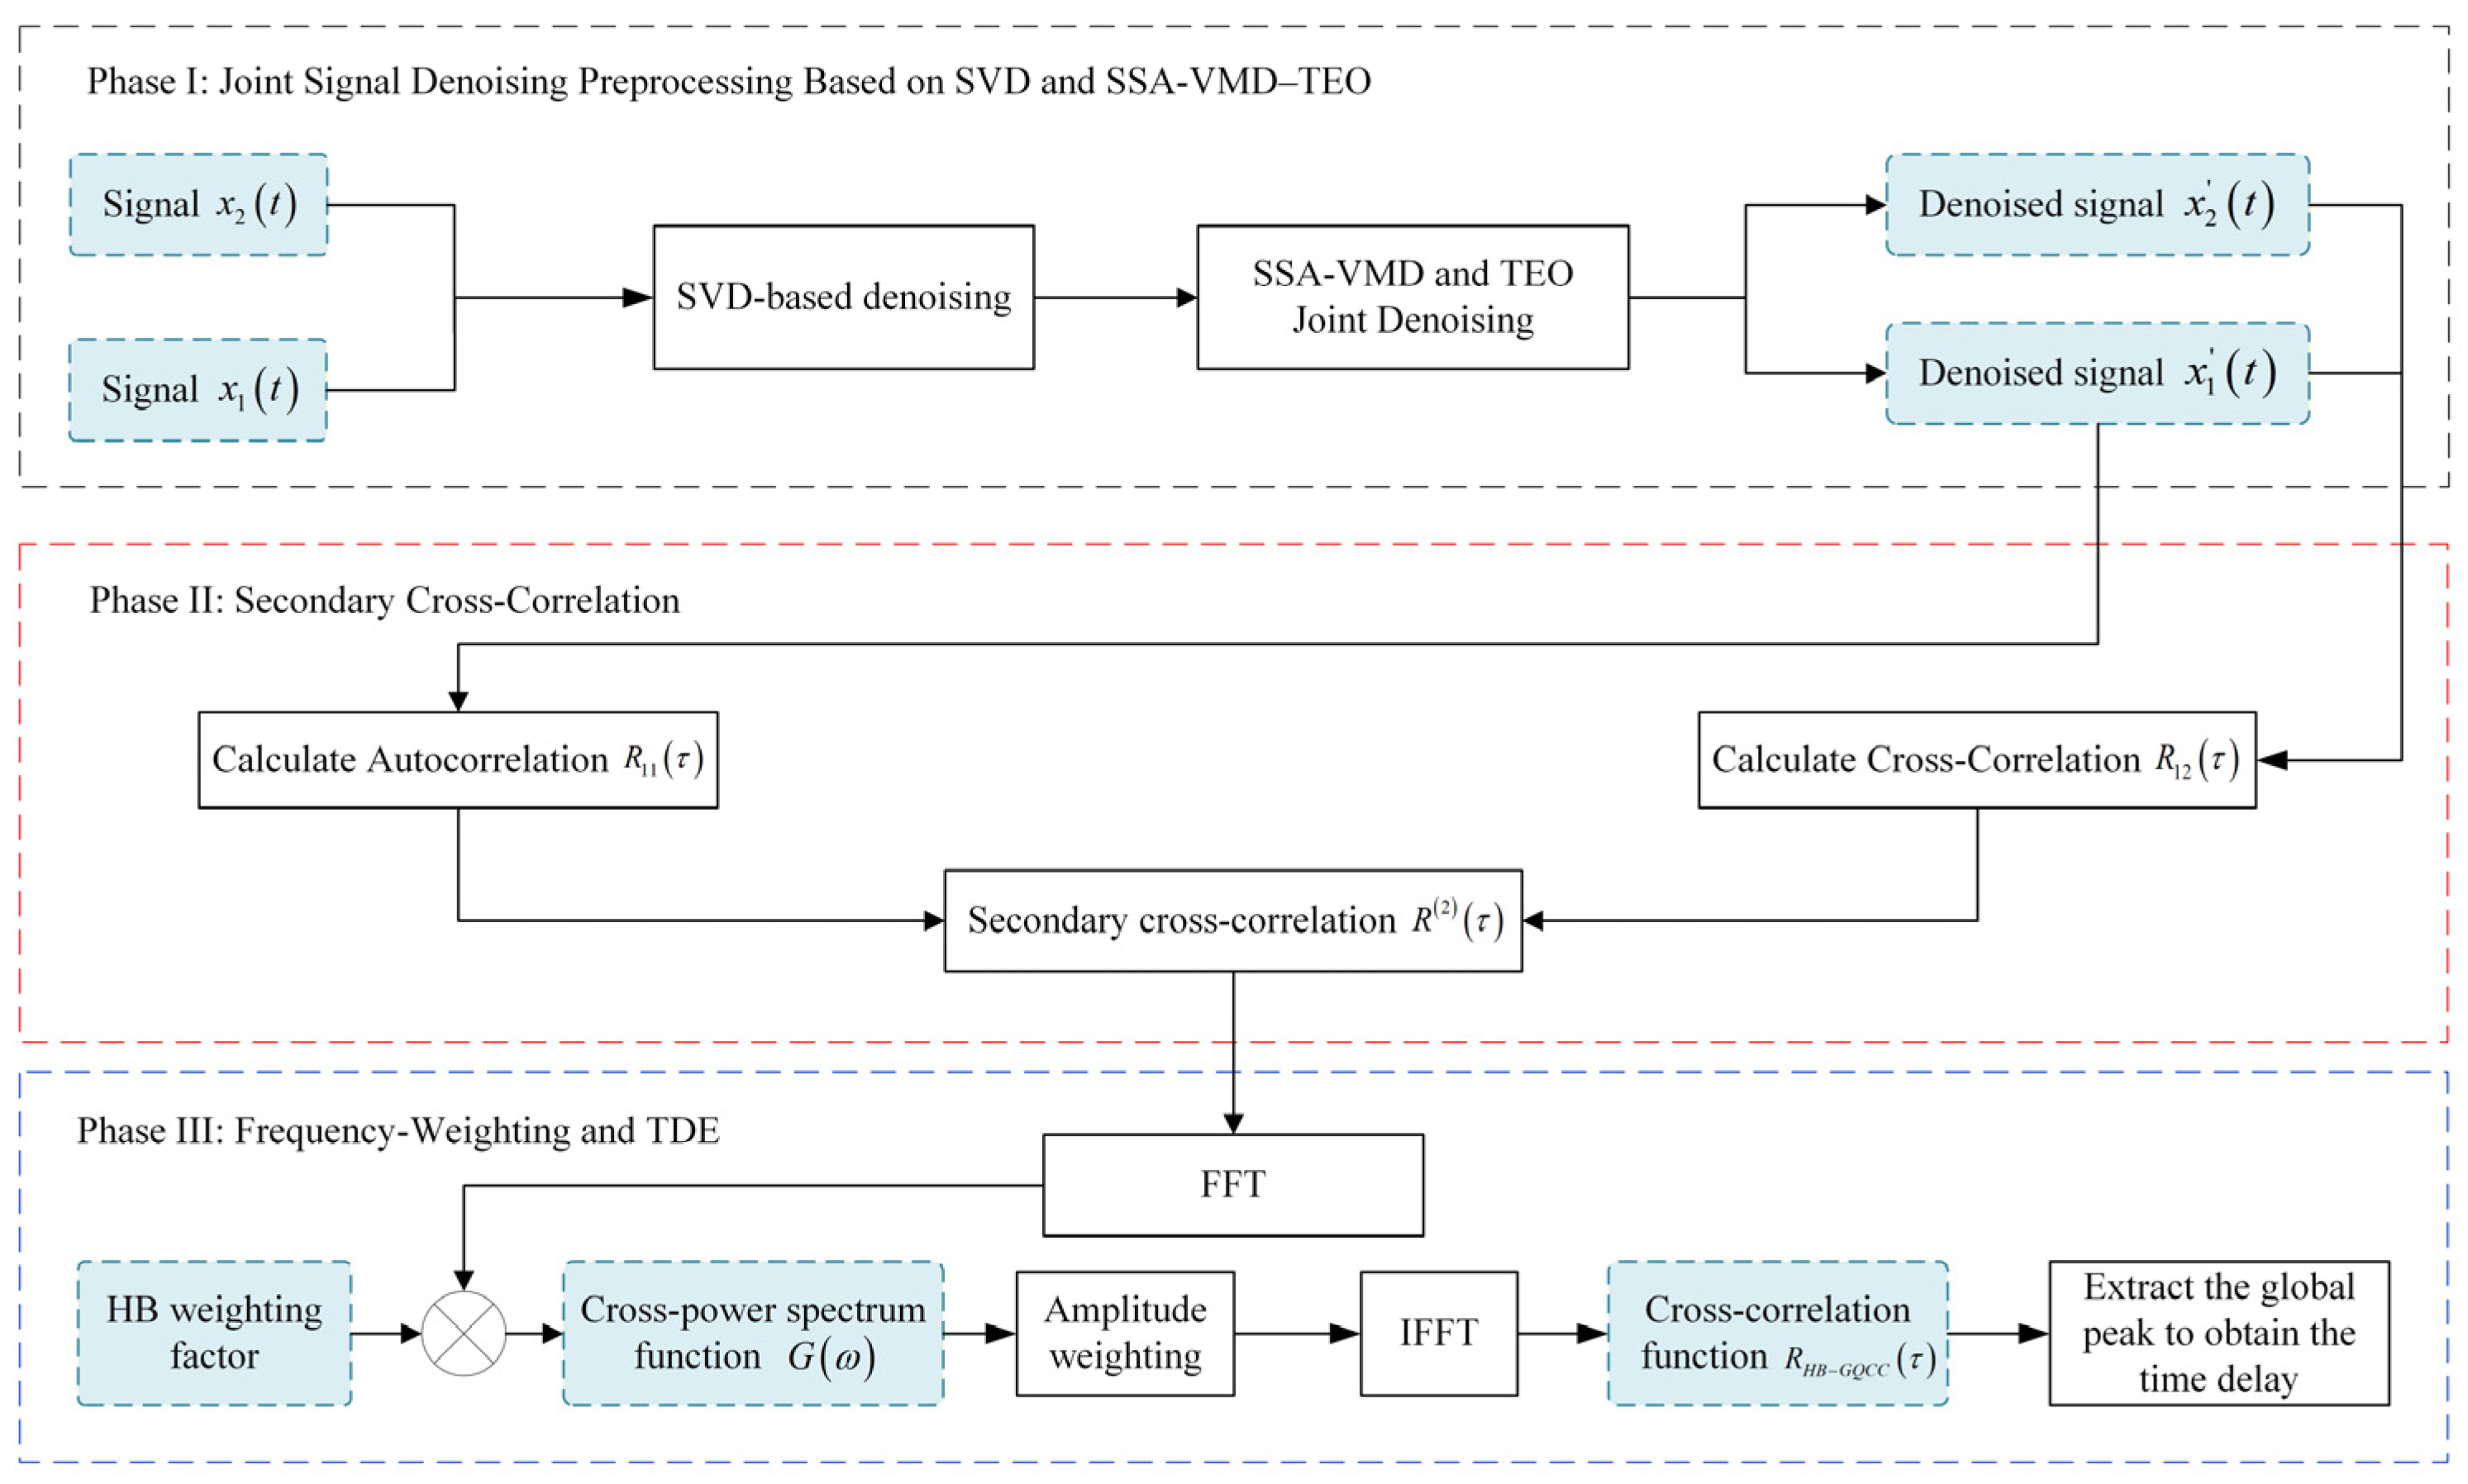
This paper adopts the HB-weighted generalized quadratic cross-correlation time-delay estimation algorithm. It combines auto-correlation and cross-correlation to suppress noise, sharpen the correlation peak, and improve estimation accuracy under low SNR [31,32,33]. The algorithm flow is shown in Figure 1. The specific steps are as follows:
- Apply SVD denoising to the acquired raw signals and to obtain the denoised signals and .
- Compute the auto-correlation of and the primary cross-correlation between and . Then obtain the quadratic cross-correlation .
- Apply FFT to the quadratic cross-correlation result. Process it in the frequency domain using the HB weighting function to obtain the cross-power spectrum function .
- After amplitude weighting of , apply IFFT to obtain the final cross-correlation function . Finally, extract its peak to obtain the time-delay estimate.
Figure 1.
Flow chart of the HB-weighted generalized quadratic cross-correlation time-delay estimation algorithm.
The signal model received by two spatially separated sensors can be expressed as:
where is the target source signal propagating in space. and are mutually uncorrelated background noises, and both are independent of . is the relative attenuation coefficient. is the true time delay of the signal arriving at the two sensors.
To suppress noise, quadratic cross-correlation is introduced on the basis of traditional cross-correlation. First, the auto-correlation function of and the primary cross-correlation function between and are computed:
Performing another cross-correlation operation between and can further reduce the residual noise interference. The quadratic cross-correlation function is defined as:
According to the Wiener–Khinchin theorem, Equation (14) is equivalent in the frequency domain to the product of the auto-power spectrum of , and the cross-power spectrum between and . The quadratic cross-power spectral density can be expressed as:
To sharpen the correlation peak and suppress noise, the HB weighting function is introduced in the frequency domain. It is typically defined in magnitude form as:
where is the auto-power spectrum of .
The equivalent frequency-domain expression for the HB-weighted generalized quadratic cross-correlation (HB-GQCC) is obtained:
The time-domain cross-correlation function is obtained via IFFT:
After obtaining the objective function, a global peak search is performed. The argument corresponding to the maximum value is the optimal time-delay estimate:
3. Simulation of the Time-Delay Estimation Algorithm for Partial Discharge Signals
3.1. Simulation Model of Noisy Partial Discharge Signals
This paper selects four typical mathematical models to represent partial discharge pulses: the single exponential decay, single exponential oscillatory decay, double exponential decay, and double exponential oscillatory decay models. These models cover the main pulse shapes of internal discharges in arresters. Their mathematical expressions are shown in Table 1.
Table 1.
Four typical types of partial discharge reference pulses.
In the above models, A is the pulse amplitude coefficient. is the decay constant. is the front rise time constant. is the tail decay time constant (typically ). is the oscillation frequency.
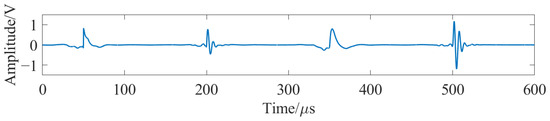
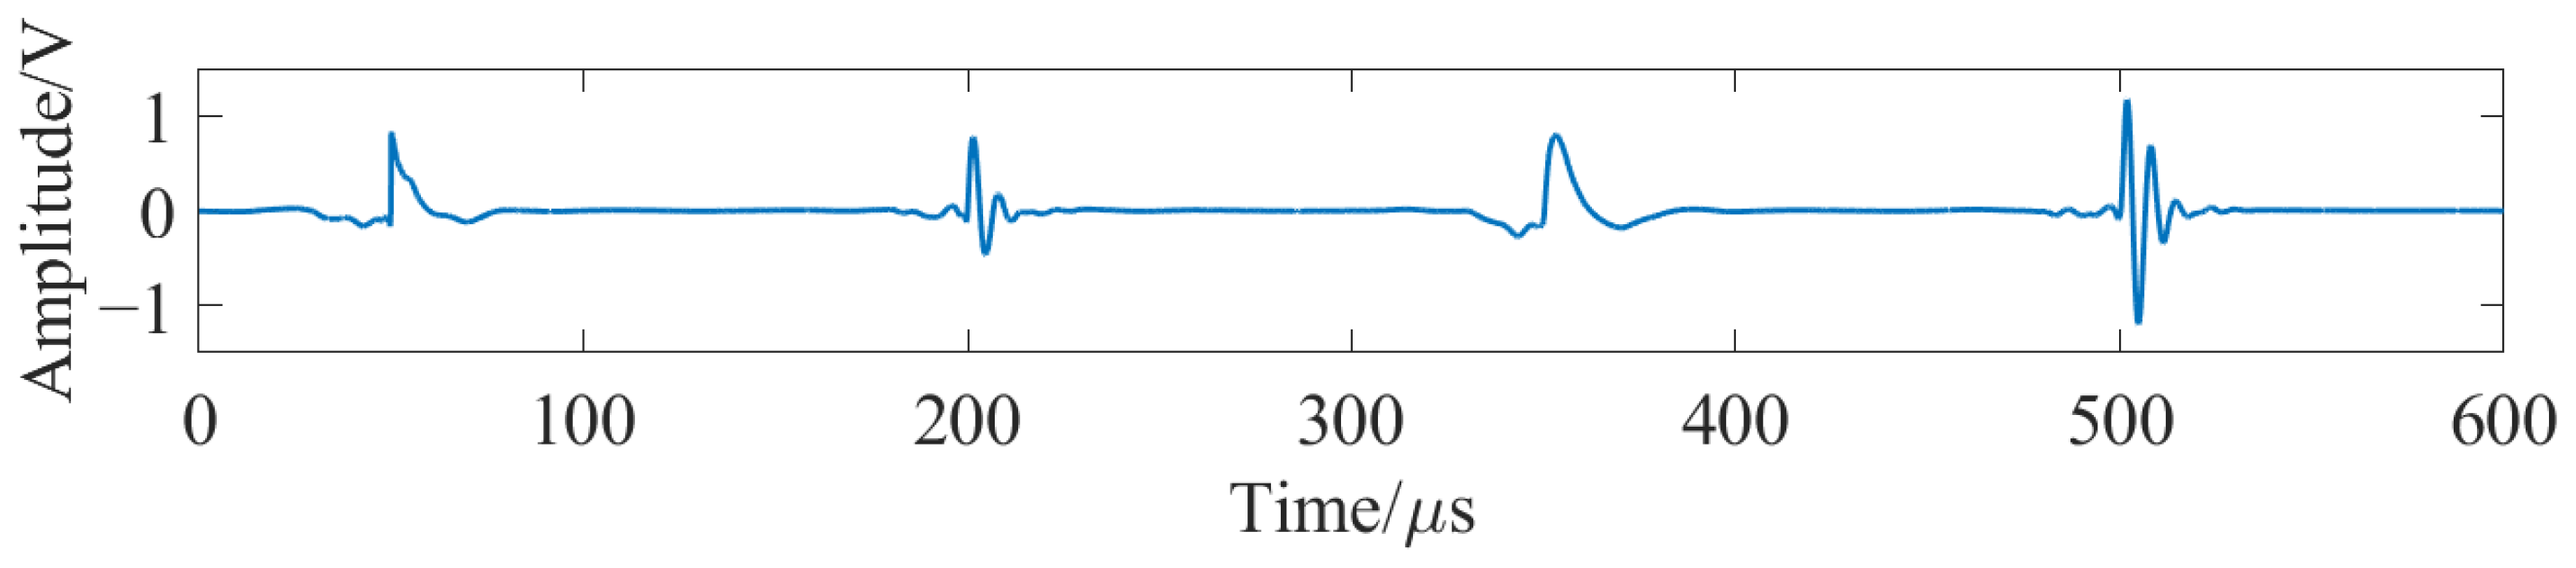
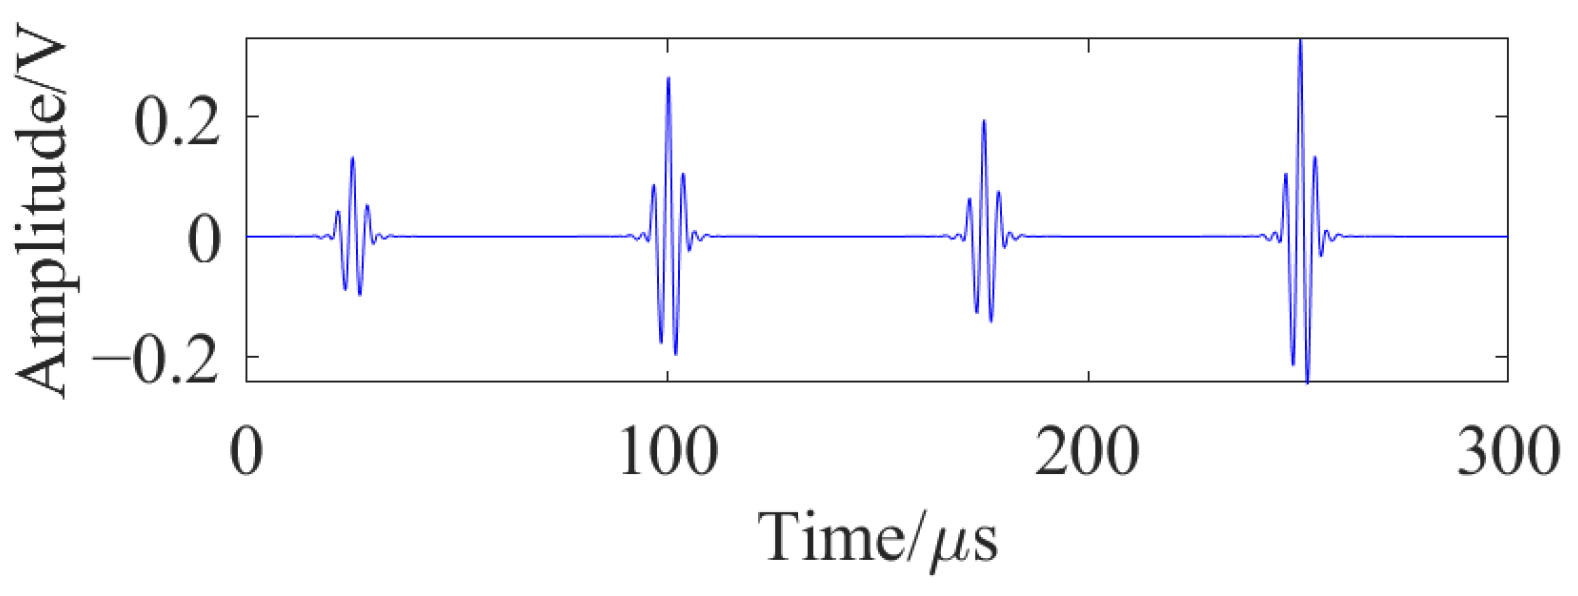
The model parameters are set as follows: sampling frequency = 10 MHz, oscillation frequency is = 0.15 MHz, number of sampling points = 6000, total duration 600 μs us, and pulse amplitude is A = 1. For the single exponential model, the decay constant is = 20 μs. For the double exponential model, the front rise time constant is = 2 μs and the tail decay time constant = 20 μs. The four pulses are triggered at 50 μs, 200 μs, 350 μs, and 500 μs. The resulting partial discharge pulse waveforms are shown in Figure 2.
Figure 2.
Partial discharge simulation signal.
The main noise types that significantly affect the detection of real partial discharge signals in arresters are white noise and periodic narrowband interference. Therefore, Gaussian white noise and periodic narrowband interference are taken as the main research objects in the noise simulation process.
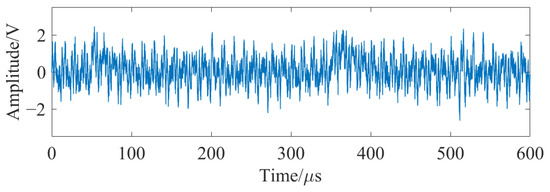
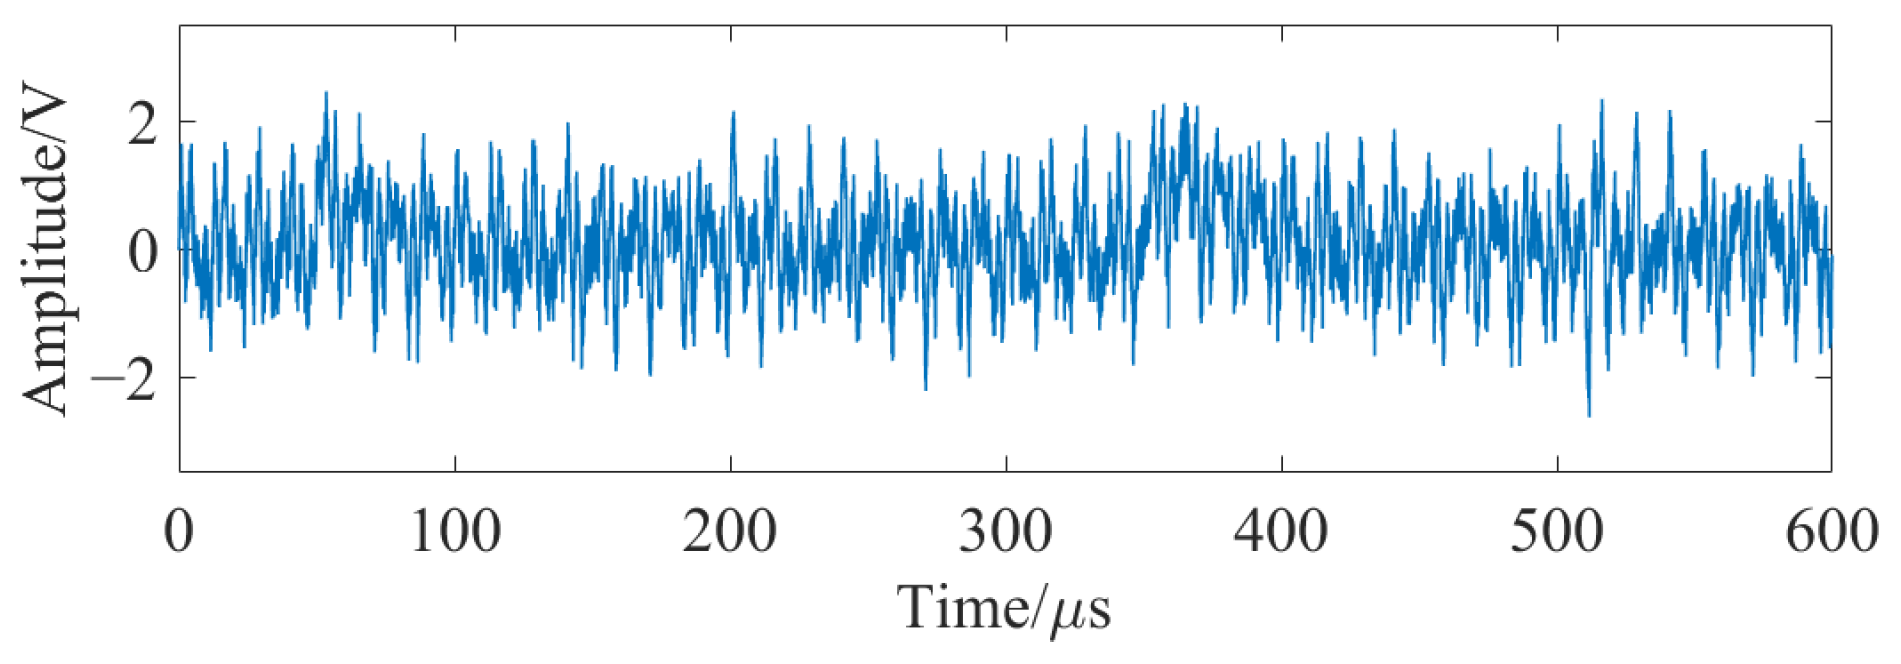
Gaussian white noise with a mean of zero and a standard deviation of 0.35 is superimposed onto the simulated PD signals. In addition, sinusoidal signals with a normalized amplitude of 0.5 and frequencies of 80 kHz, 250 kHz, and 320 kHz were added to simulate periodic narrowband interference. The waveform of the noise-contaminated simulated signal is shown in Figure 3.
Figure 3.
Simulated partial discharge pulse signal with noise.
The simulated oscillation frequency is set within the sensor bandwidth to ensure consistency with the frequency characteristics of the measured signals. In actual detection, after air propagation and sensor reception, the dominant frequency of the ultrasonic signal will attenuate into the effective bandwidth of the sensor. The frequency penalty function of SSA-VMD in the subsequent denoising process is consistent with this bandwidth.
3.2. Simulation and Analysis of the Denoising Algorithm
Based on the joint SSA-VMD-TEO denoising framework constructed in Section 2, this section verifies the denoising effect on noisy simulated signals.
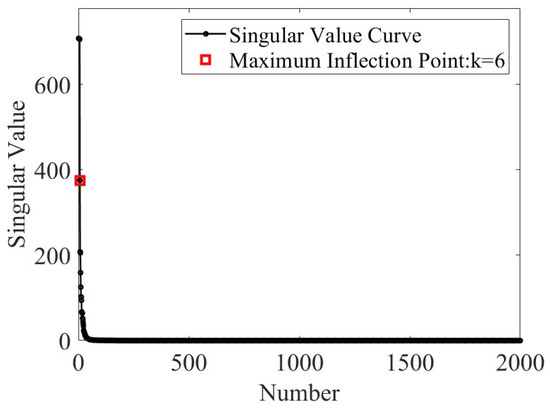
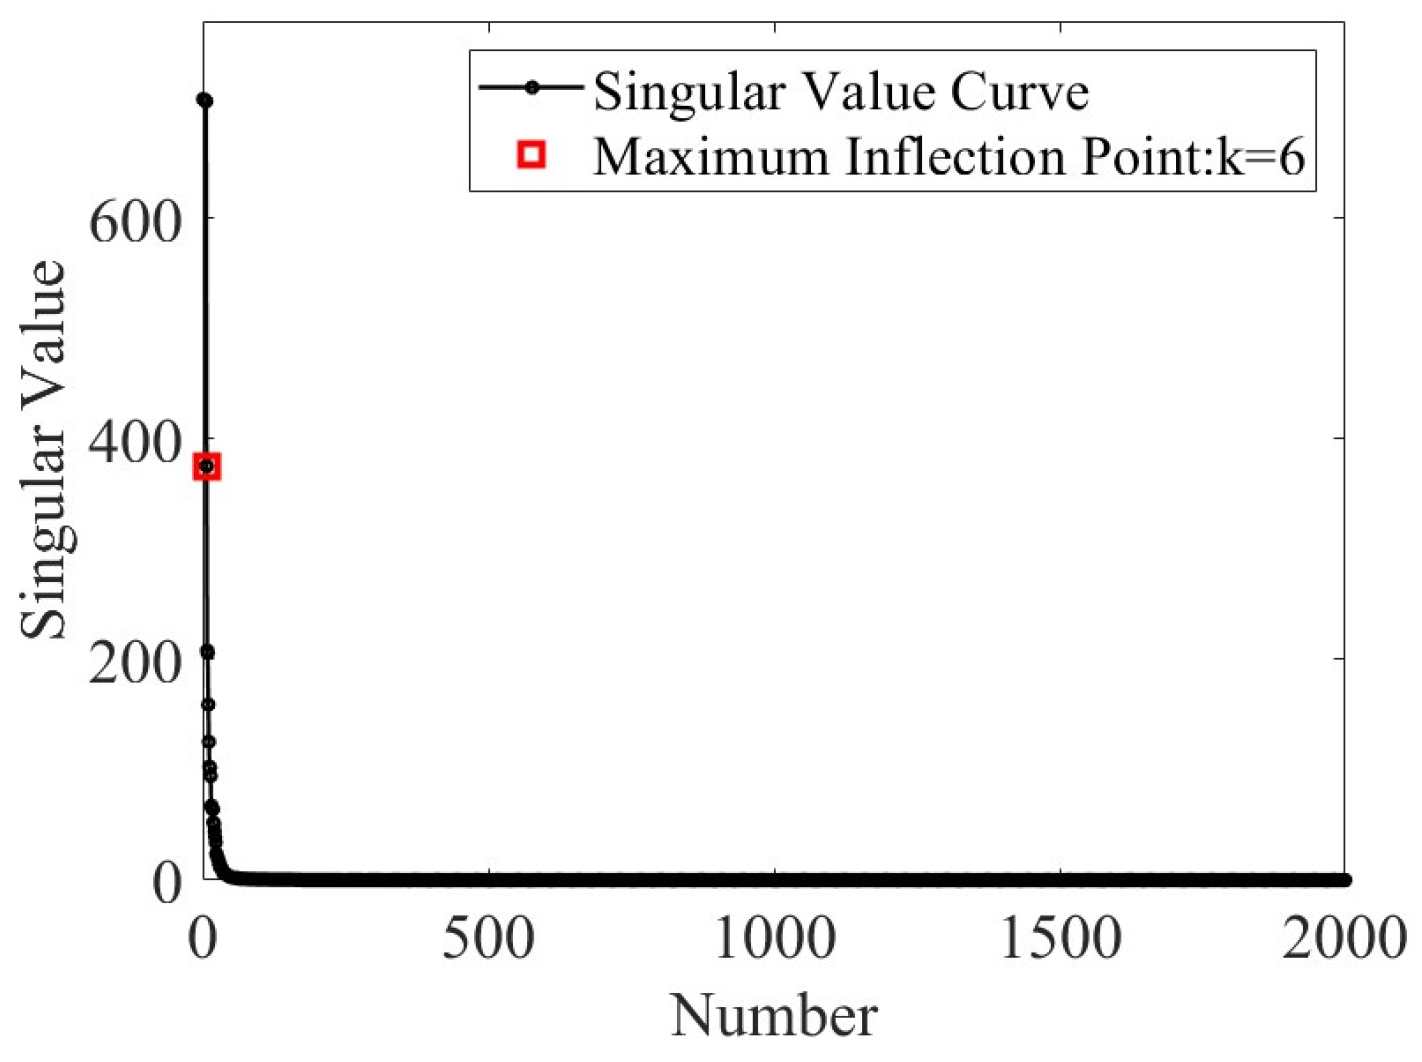
Partial discharge signals in arresters are often mixed with strong noise interference. The real discharge pulse signals are often submerged in the interference. It is difficult to capture the statistical characteristics of either the signal or the noise. Therefore, the joint noise suppression algorithm based on SVD, SSA-optimized VMD, and TEO is highly suitable for denoising PD signals contaminated by strong noise. Based on the above algorithm principle, the singular value characteristics of the simulated PD pulse signals are first studied. White noise interference and narrowband interference are filtered out. The resulting singular value distribution is shown in Figure 4.
Figure 4.
Singular value distribution of the simulated partial discharge signal.
As can be seen from Figure 4, in the simulated PD signal mainly contaminated by narrowband interference, there are six effective singular values associated with the narrowband interference. This is consistent with the number of three sinusoidal interference signals set in the simulation. By removing the first six singular values and performing singular value reconstruction on the noisy signal, the pulse waveform after further narrowband interference suppression is obtained, as shown in Figure 5. White noise and narrowband interference have been effectively suppressed.
Figure 5.
Simulated partial discharge signal after singular value decomposition denoising.
Subsequently, the PD denoising method with SSA adaptively optimizing VMD parameters is adopted. The minimum average envelope entropy (MAEE) is used as the fitness function to search for the optimal parameter pair [K, ]. The SVD-reconstructed signal is then decomposed. VMD separates the signal into several modal components in the frequency domain. The kurtosis criterion and Pearson correlation coefficient are combined to select effective modes. Figure 6 shows the extracted effective VMD modes. It can be seen that the noise modes are greatly suppressed. The PD signal waveform is completely retained.
Figure 6.
Effective variational modes of the simulated partial discharge signal after singular value decomposition denoising.
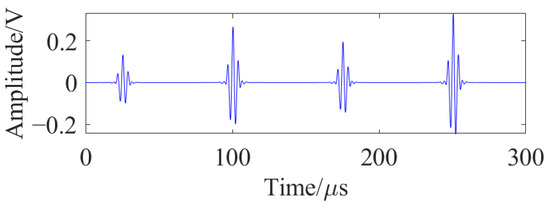
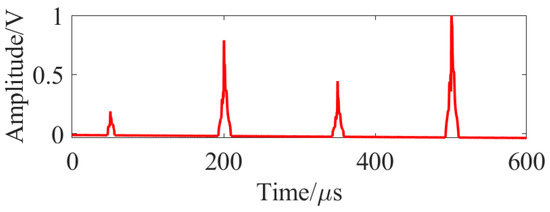
Furthermore, TEO envelope extraction is performed on the effective modes. The results are shown in Figure 7. The four energy operator envelope peaks extracted from the figure have smooth waveforms and clear onset points. This indicates that TEO effectively eliminates the phase interference caused by high-frequency oscillations. It provides high-quality input signals for subsequent time-delay estimation.
Figure 7.
TEO envelope of the effective VMD modes from the simulated PD signal.
The above results show that the proposed joint denoising method can effectively extract PD pulse features under strong noise background. The signal waveform distortion is small. The signal-to-noise ratio is significantly improved. This lays a reliable foundation for high-precision time-delay estimation.
3.3. Time-Delay Estimation for Partial Discharge Signals
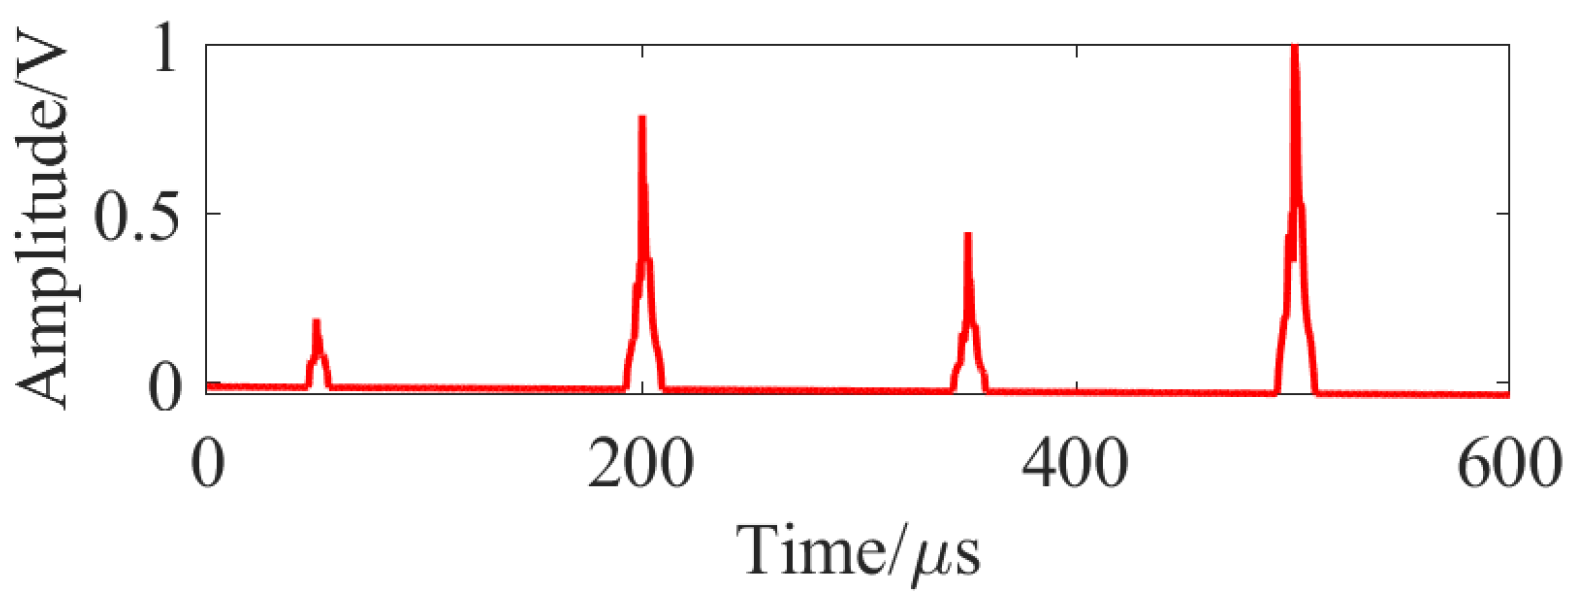
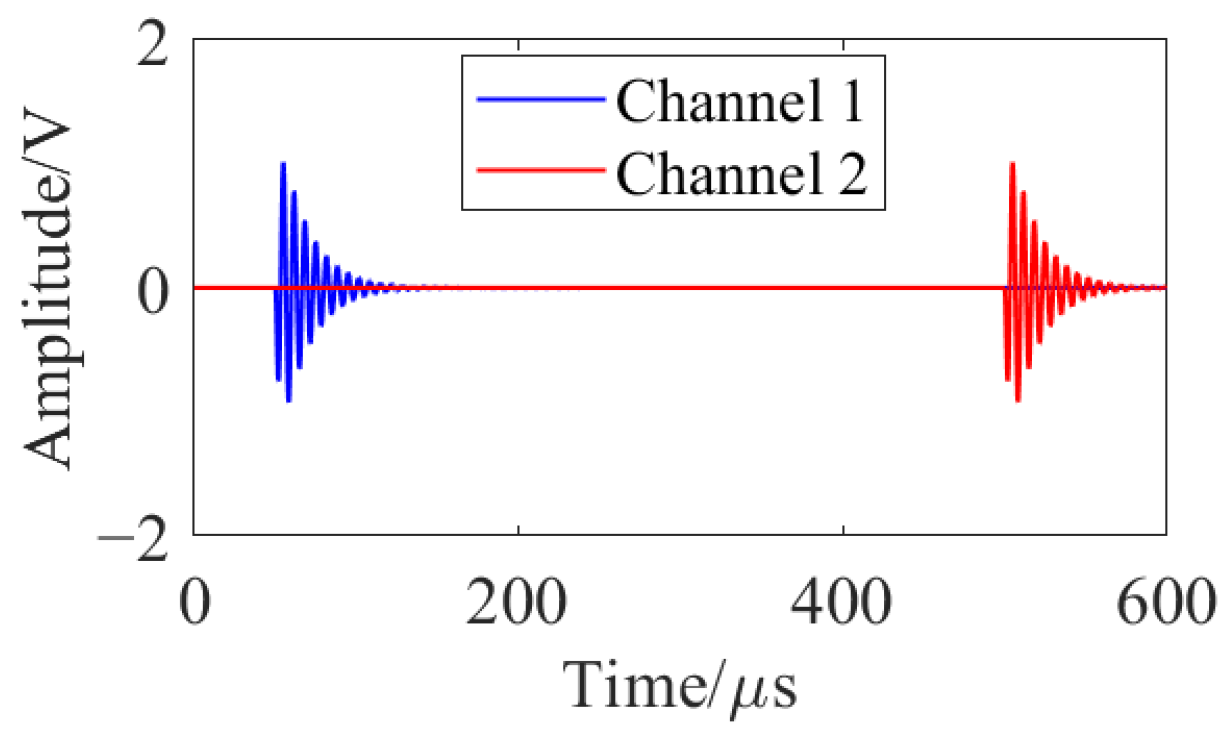
In this section, the double exponential oscillatory decay pulse from the simulation model is used as the original signal. A reference signal with a known time delay is constructed by zero-padding. The simulation parameters are consistent with those in Section 3.1: sampling frequency = 10 MHz, total duration 600 μs, oscillation frequency = 0.15 MHz, front rise time constant = 2 μs, and tail decay time constant = 20 μs. The original signal starts at 50 μs. The reference signal starts at 500 μs. The true time delay of the reference signal relative to the original signal is 450 μs. The dual-channel signals are shown in Figure 8.
Figure 8.
Dual-channel time-delayed simulated partial discharge signal.
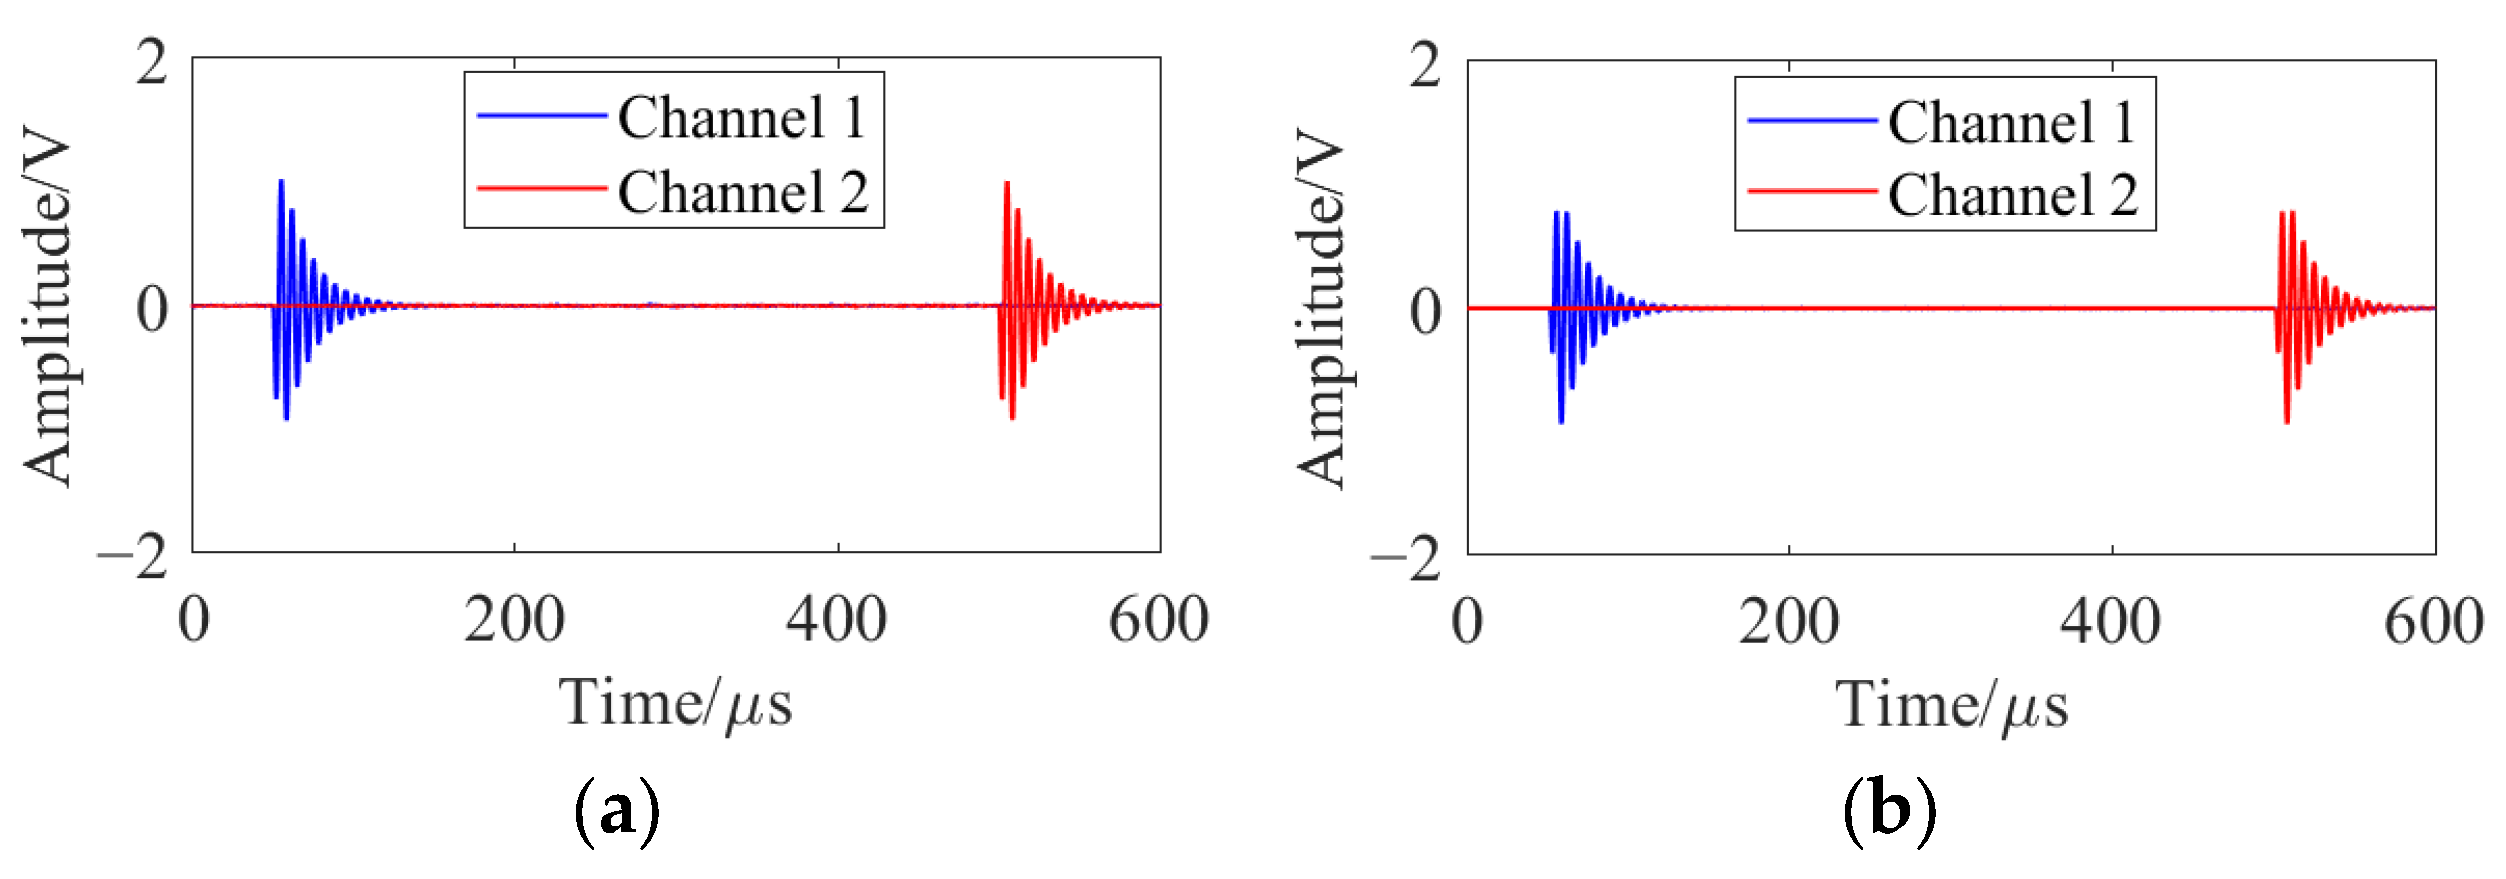
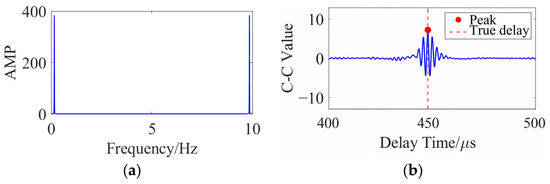
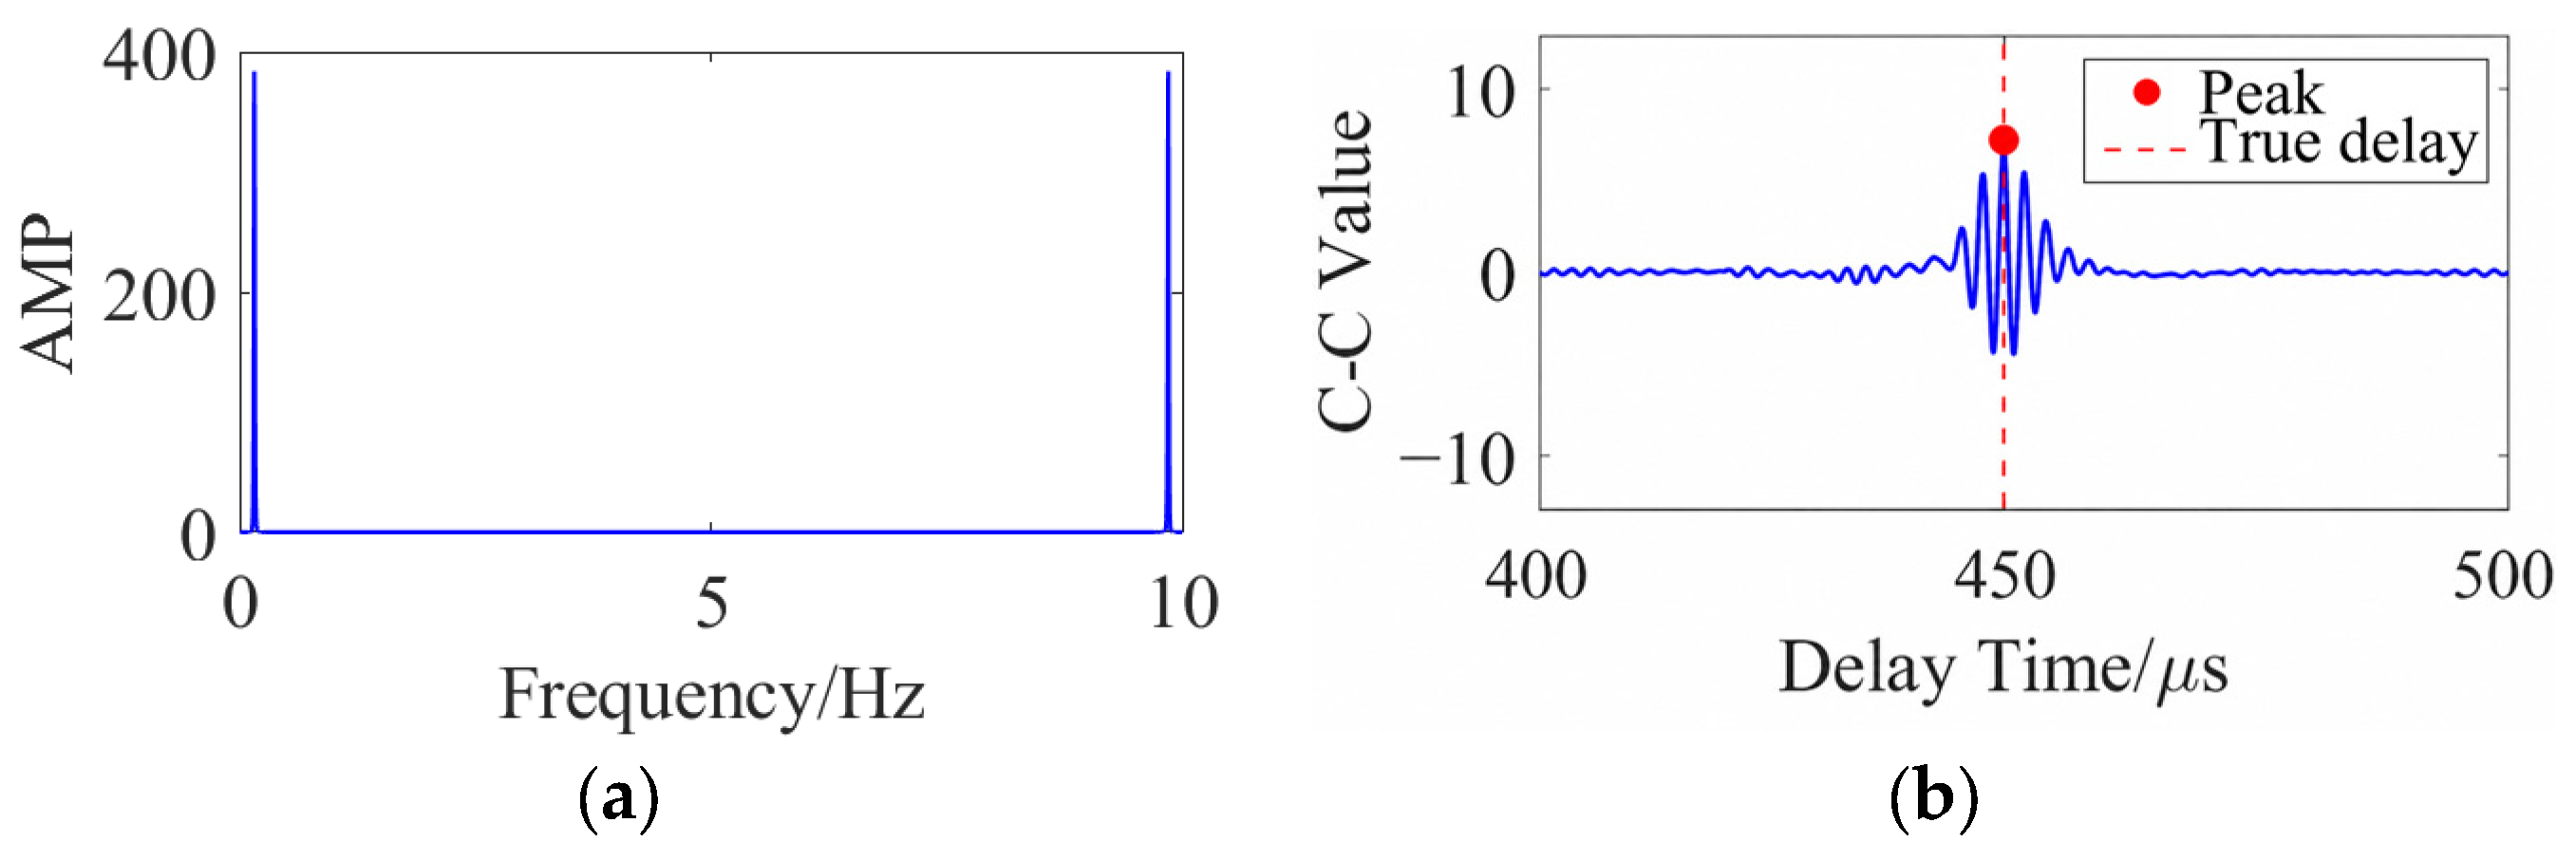
After adding Gaussian white noise and narrowband interference, the noisy dual-channel signal is shown in Figure 9a. The signal recovered by the joint denoising algorithm is shown in Figure 9b. The HB-weighted generalized quadratic cross-correlation (HB-GQCC) algorithm is then applied for time-delay estimation. The weighted cross-power spectrum magnitude is shown in Figure 10a. It can be seen that the spectral peak is significantly sharpened after the weighting process. The cross-correlation time-delay peak obtained by IFFT is shown in Figure 10b. The estimated time delay is 449.96 μs. Compared with the true delay of 450 μs, the absolute error is only 0.04 μs. The accuracy reaches 99.9911%.
Figure 9.
Waveforms of the two-channel signal before and after denoising. (a) Dual-channel time-delayed noisy simulated partial discharge signal; (b) filtered waveform of the dual-channel time-delayed noisy simulated partial discharge signal.
Figure 10.
HB-weighted power spectrum and time-delay peak of the two-channel time-delay simulated discharge signal. (a) Amplitude of the weighted cross-power spectrum; (b) cross-correlation time-delay peak.
The above simulation results demonstrate that the proposed denoising and time-delay estimation algorithm has high reliability. From the weighted cross-power spectrum magnitude curve in Figure 10a, it can be seen that after HB weighting, the effective characteristic frequency components of the PD signal are prominently highlighted. The stray spectra corresponding to noise are greatly suppressed. The algorithm can effectively filter out the spectral clutter caused by channel noise and power-frequency interference. This achieves purification of the frequency-domain features of the discharge signal. Combined with the cross-correlation time-delay peak result in Figure 10b, the peak extracted by the algorithm (marked by the red dot) is highly consistent with the true time delay marked by the dashed line. Under simulated noise interference conditions, the time-delay estimation deviation is extremely small. The propagation time delay of the dual-channel PD signals is accurately determined.
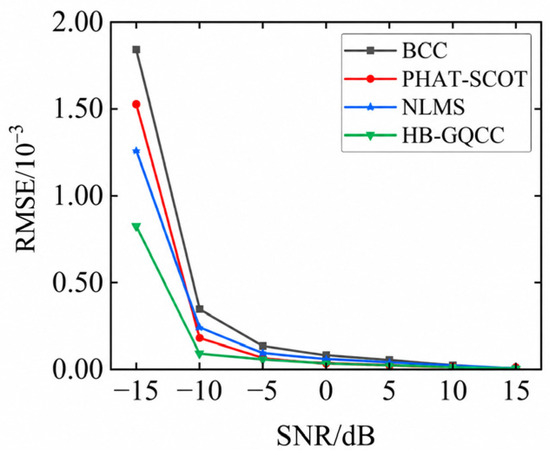
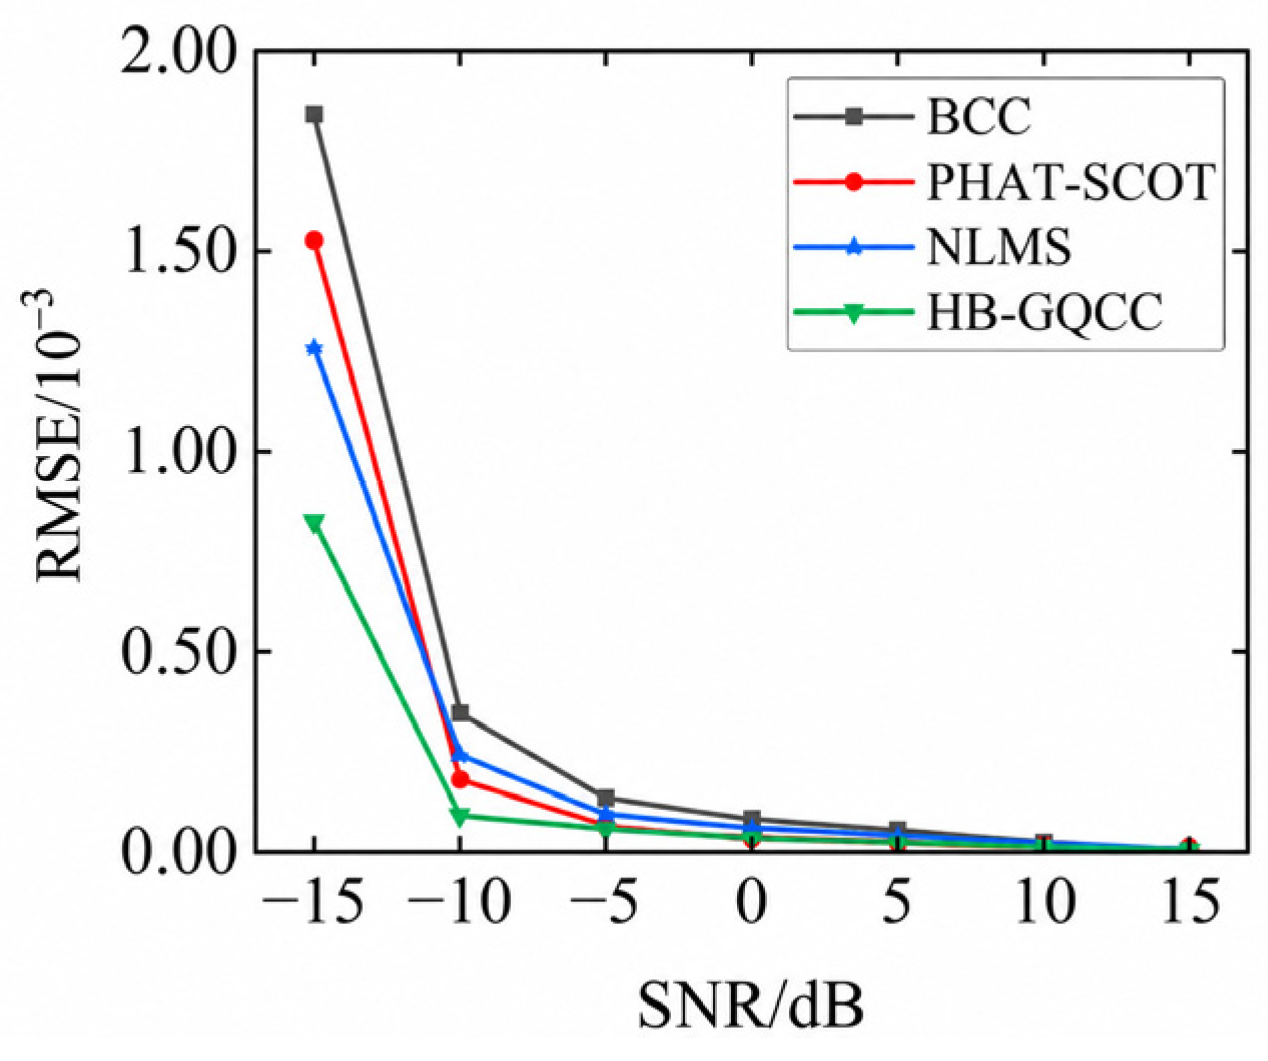
To further verify the algorithm performance, time-delay estimation is performed under SNRs of −15 dB, −10 dB, −5 dB, 0 dB, 5 dB, 10 dB, and 15 dB. Four methods are compared: the basic cross-correlation (BCC), the PHAT-SCOT weighted generalized cross-correlation (PHAT-SCOT), the NLMS adaptive time-delay estimation (NLMS), and the proposed HB-weighted generalized quadratic cross-correlation (HB-GQCC). For each SNR level, 100 independent simulation runs are conducted. The root mean square error (RMSE) is used to evaluate the estimation accuracy and stability of the four algorithms. The formula is as follows:
where N is the total number of simulation trials. is the time-delay estimate from the i-th trial. is the true time delay. The RMSE distributions of the four algorithms under different SNRs, calculated according to Equation (20), are displayed in Figure 11.
Figure 11.
Time-delay estimation error distribution of the four algorithms under different SNRs.
It can be seen from Figure 11 that compared with traditional cross-correlation methods, the HB-GQCC algorithm maintains the lowest estimation error at all SNR levels. It retains the advantages of low computational complexity and good real-time performance of the cross-correlation algorithm. Moreover, it effectively suppresses the interference of noise on the correlation peak through frequency-domain weighting. In a simulation environment that mimics complex strong electromagnetic interference on site, the time-delay estimation error is controlled at the sub-microsecond level. This meets the engineering requirements for dual-channel PD detection of arresters.
4. Experimental Results and Analysis
To validate the effectiveness of the proposed time-delay estimation method for arrester PD based on joint denoising and HB-weighted generalized quadratic cross-correlation, a PD experiment is set up using a needle-plate discharge model. The time-frequency characteristics of the acquired ultrasonic PD signals are analyzed. The denoising algorithm designed in this paper is applied to denoise the signals. A comparative analysis of the signal features before and after denoising is conducted.
4.1. Partial Discharge Signal Experiment
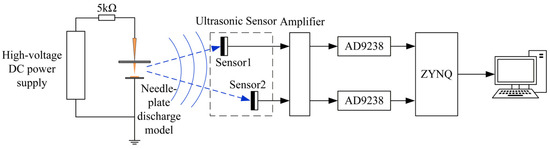
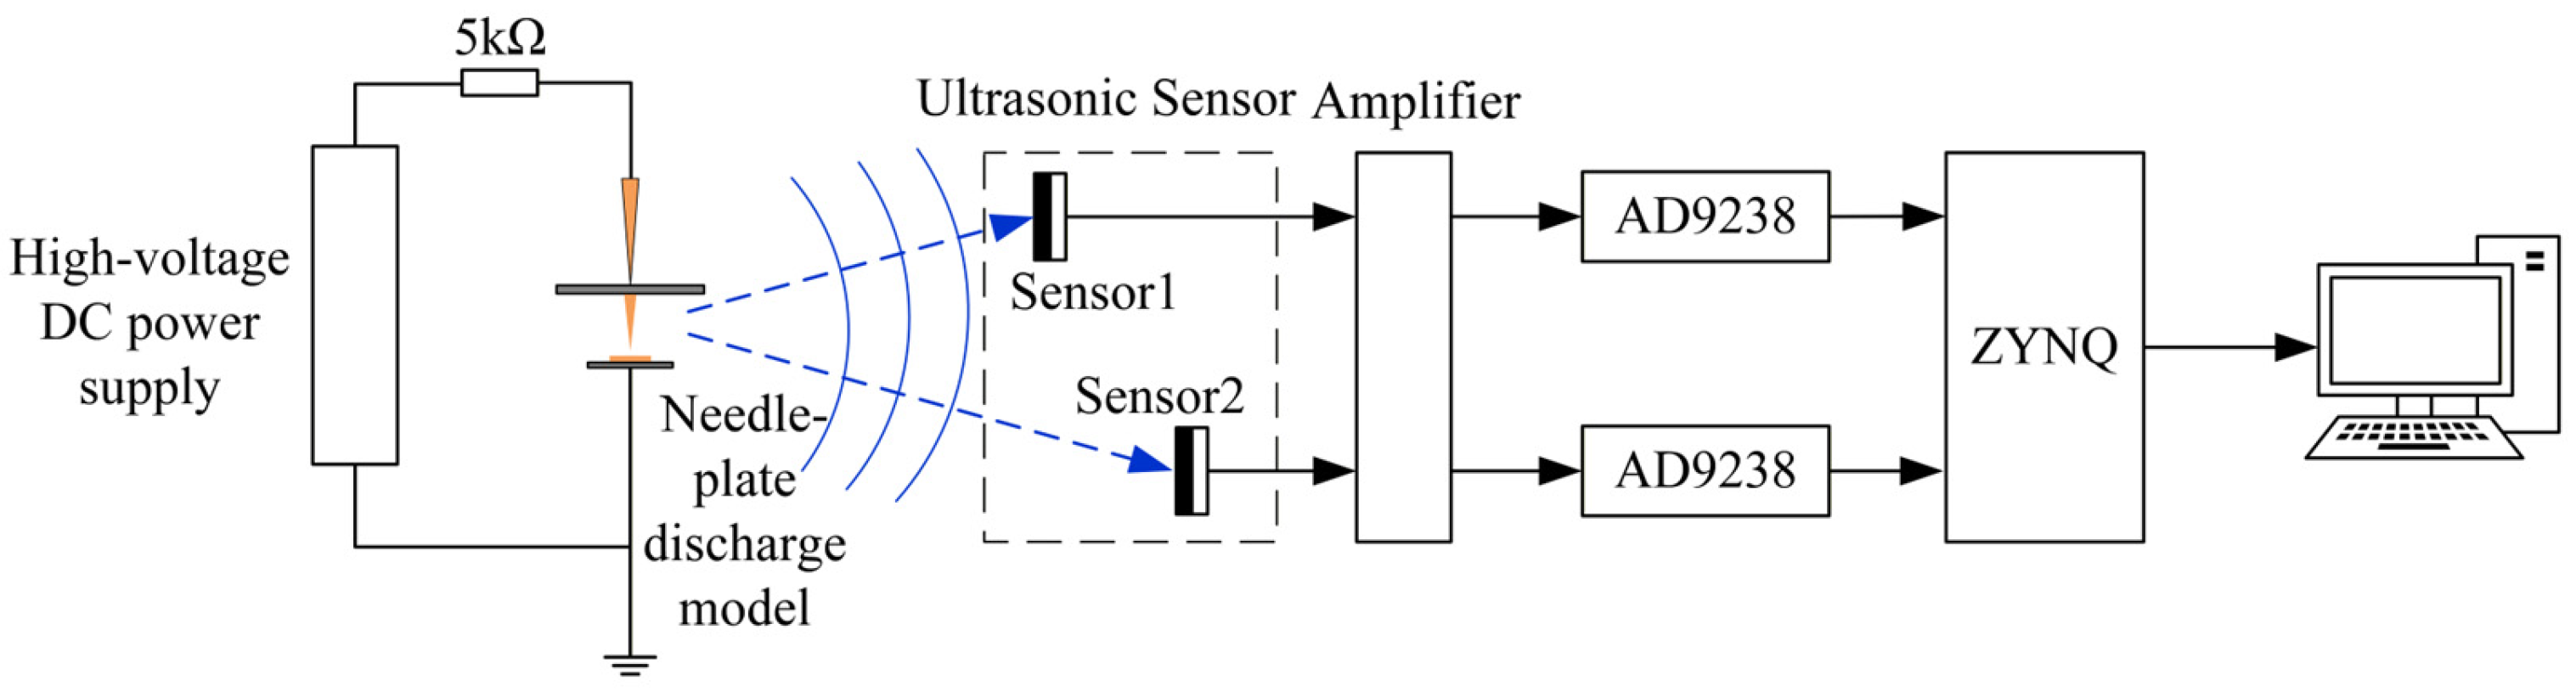
Using a needle-plate discharge model as the discharge source, a partial discharge experimental system was constructed, as depicted in Figure 12. The system mainly includes the following equipment: a Jieman Technology JMDCP20–25 mA high-voltage DC power supply, with an input of 220 V AC and a peak output of 20 kV/400 mA/8 kW (Guangdong Jieman Technology Co., Ltd., Guangdong, China), whose voltage and boost frequency are adjustable via knobs; a series 5 kΩ protection resistor for current limiting; and a needle-plate discharge model, in which the needle electrode is a copper wire with a diameter of 1 mm, the plate electrode is a copper sheet with a thickness of 5 mm, and the gap distance is 2 mm. The experiment uses PXR15 ultrasonic sensors (Changsha Pengxiang Electronic Technology Co., Ltd., Changsha, China) (sensitivity > 65 dB, frequency bandwidth 50–350 kHz, resonant frequency 150 kHz), preamplifiers, and AN9238 analog-to-digital conversion modules (Alinx Electronic Limited, Shanghai, China). Two ultrasonic sensors are installed near the needle-plate discharge model. They are used to receive the ultrasonic signals generated by partial discharge and convert the acoustic signals into electrical signals.
Figure 12.
Partial discharge experimental system block diagram.
It should be noted that the applied DC voltage of 20 kV does not directly represent the rated voltage of the arrester. Its purpose is to produce a sufficiently high local electric field across the 2 mm gap to excite stable partial discharge. This is similar to the intensified local electric field at internal defects of an in-service arrester. The needle-plate structure used in this experiment is intended to simulate early-stage insulation defects inside a metal oxide arrester, such as microscopic voids or metallic protrusions. The resulting discharge is weak and intermittent, representing the very early stage of insulation degradation, rather than a catastrophic breakdown fault.
The 500 kV mentioned in this paper refers to the actual engineering voltage level of the collaborative project. The 20 kV is only the maximum output capability of the experimental power supply. This experimental setup is not a scaled model of a 500 kV arrester. No voltage scaling relationship was used to extrapolate the experimental results. The purpose of this setup is to obtain repeatable ultrasonic transient signals with a well-defined propagation distance difference under laboratory conditions. This enables a quantitative evaluation of the proposed denoising and time-delay estimation algorithms.
It should be emphasized that the PD current pulse amplitude generated by the 20 kV DC power supply used in this experiment is far smaller than that in a real 500 kV arrester. Therefore, this model has limitations in reproducing the voltage drop caused by large current pulses across the arrester’s intrinsic inductance, as well as its influence on the pulse front, power spectrum, and phase characteristics.
The ultrasonic sensors used in this experiment have a bandwidth of 50–350 kHz. This range is consistent with the dominant frequency band of the measured PD ultra-sonic signals presented later in this paper. The sensor bandwidth determines which signal frequency components can be captured. It therefore directly affects the denoising and time-delay estimation performance. In addition, the prior frequency penalty function (50–350 kHz) adopted in the SSA-VMD method in Section 2.1.2 is aligned with this bandwidth. This ensures that the decomposition focuses on the frequency band of physical significance.
After the PD experimental platform was set up, a signal detection system was for signal acquisition. The voltage knobs of the high-voltage DC power supply were gradually adjusted to make the needle-plate model produce stable partial discharge and radiate ultrasonic waves. The acquired signals were first pre-amplified and converted into digital signals. The ZYNQ development board then completed the signal acquisition. The data were sent to the host computer via UDP communication for storage and analysis.
This experiment was conducted in a laboratory environment with relatively low background noise. The main interference came from the electromagnetic noise of the high-voltage DC power supply. To systematically evaluate the algorithm performance under more severe noise conditions, comprehensive simulations were carried out in Section 3. Gaussian white noise with an SNR ranging from −15 dB to +15 dB and periodic narrowband interference were added to the simulated signals. The simulation part verifies the noise robustness of the algorithm, while the controlled experiment in this section focuses on validating the effectiveness of the method in a real physical environment.
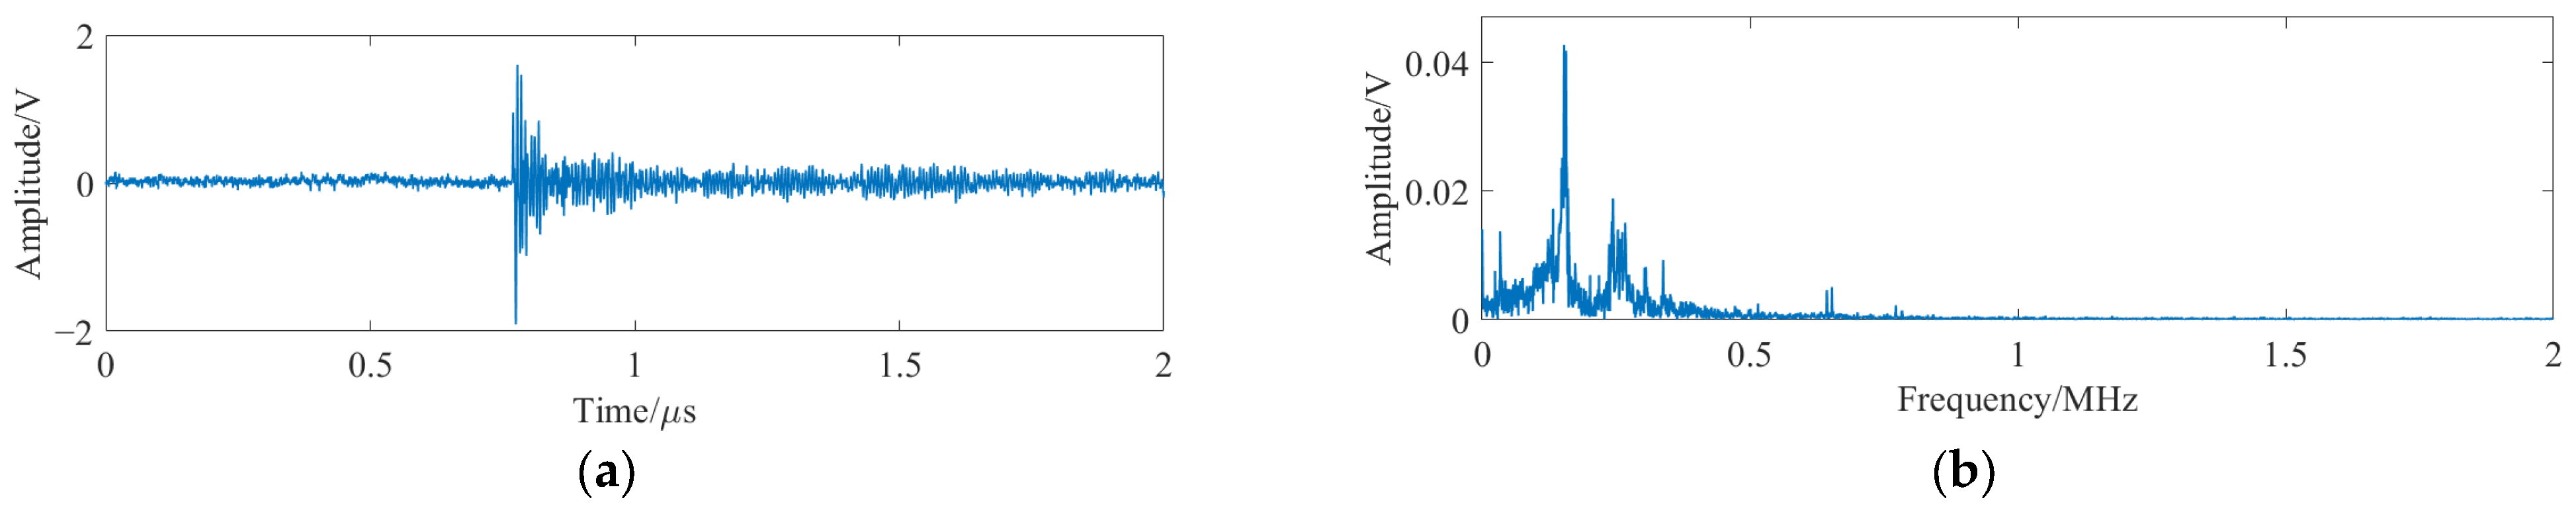
In the PD experiment, the propagation velocity of the ultrasonic wave in air, , is closely related to the ambient temperature T. The experiment was conducted at room temperature. The measured indoor temperature was 25 °C. According to the empirical formula, the theoretical propagation velocity was calculated to be = 346.4 m/s. Based on the experimental system illustrated in Figure 13, the difference in the straight-line distances from the discharge source to Sensor 1 and Sensor 2 is = 31.6220 cm. Therefore, from , the theoretical time delay between the two-channel signals was estimated to be ≈ 0.9129 ms.
Figure 13.
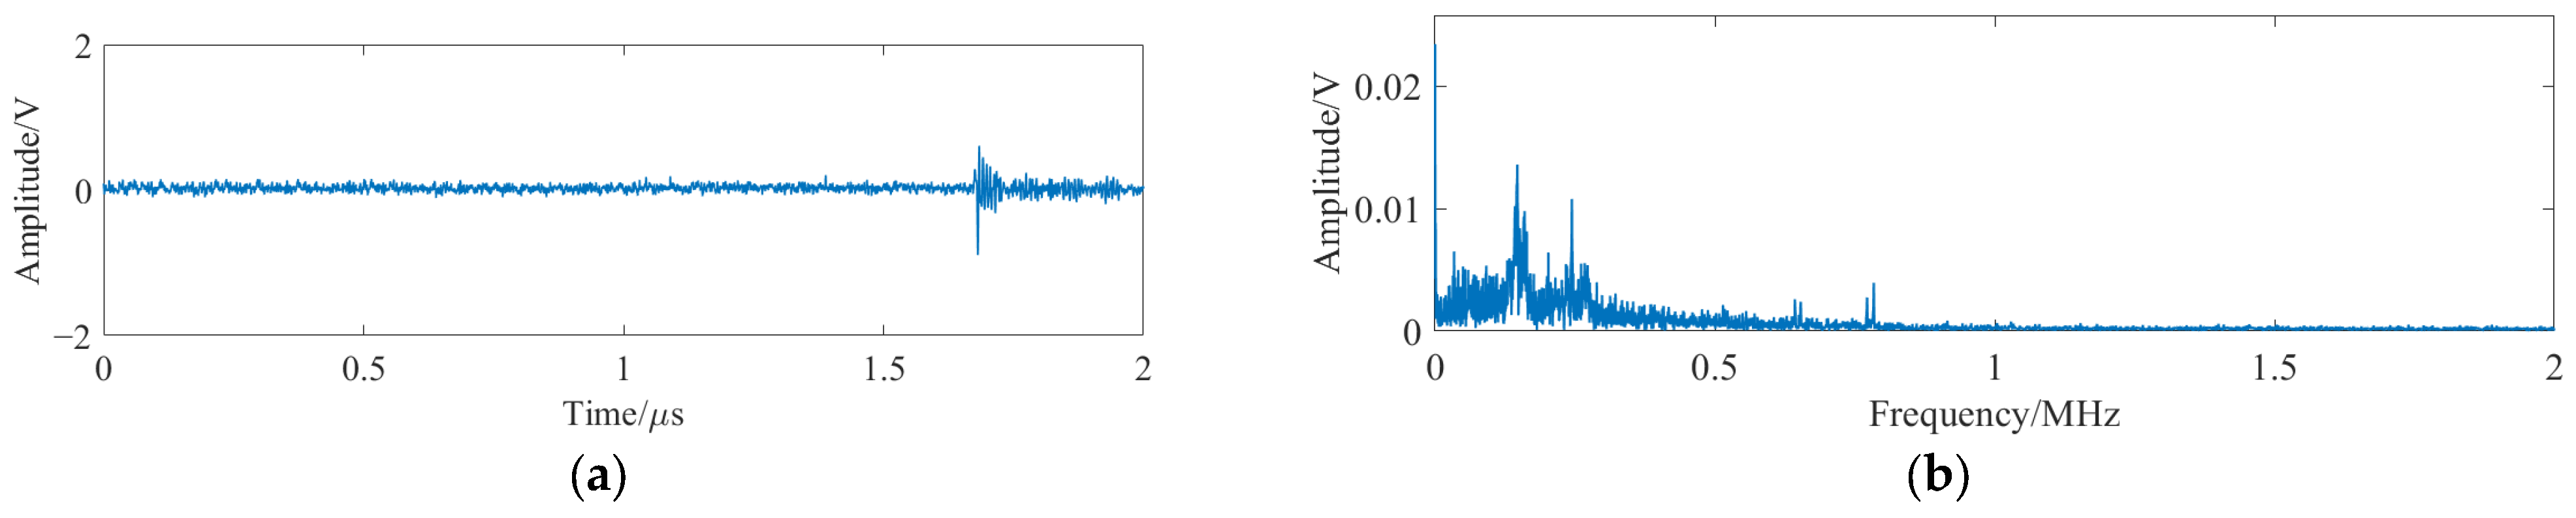
Time-frequency analysis of the Channel 1 PD signal. (a) Time-domain waveform; (b) frequency spectrum.
4.2. Characteristic Analysis of Partial Discharge Signals
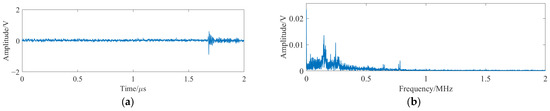
To analyze the time-frequency characteristics of the PD signals, the acquired dual-channel discharge signals are analyzed. The time-domain waveform and frequency-domain spectrum of the Channel 1 PD signal acquired by Sensor 1 are shown in Figure 13a,b, respectively. The time-domain waveform and frequency-domain spectrum of the Channel 2 PD signal acquired by Sensor 2 are shown in Figure 14a,b.
Figure 14.
Time-frequency analysis of Channel 2 PD signal. (a) Time-domain waveform; (b) frequency spectrum.
From the time-domain waveforms in Figure 13a and Figure 14a, it can be observed that the PD signal generated by the needle-plate model is a transient pulse signal. The captured ultrasonic waveform exhibits a damped oscillatory shape with a duration of approximately 0.5 ms. This results from the convolution of the original nanosecond-scale PD current pulse with the impulse response of the acoustic propagation path and the resonant ultrasonic sensor. The discharge waveform approximates an oscillatory decay signal. At the onset of a discharge cycle, the signal amplitude reaches its maximum value. Subsequently, as the discharge voltage gradually increases, the amplitude decays in an oscillatory manner until the discharge event terminates, at which point the amplitude drops to zero. From the frequency-domain spectra in Figure 13b and Figure 14b, it can be seen that the dominant frequency components are mainly concentrated in the range of 0.1–0.8 MHz, with the spectral peak appearing at around 0.15 MHz. This indicates that the ultrasonic detection method adopted in this paper can capture the effective information of the discharge signal.
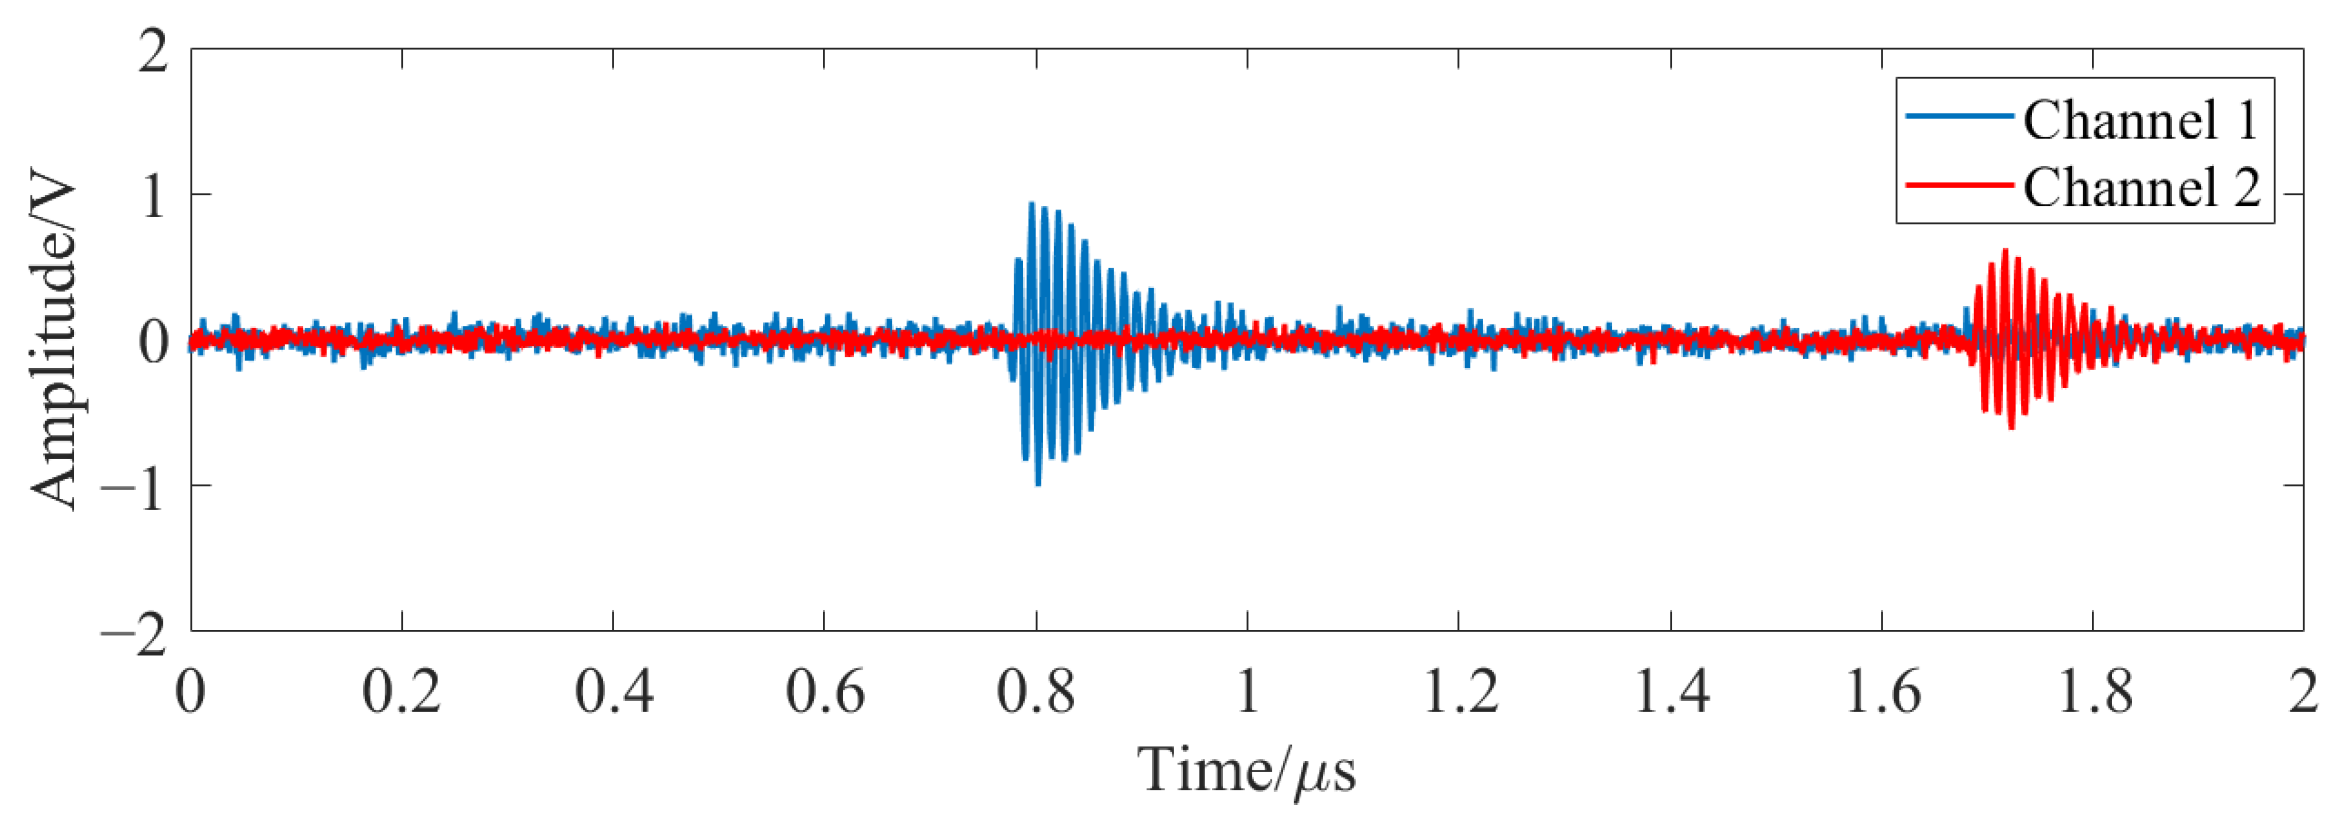
The joint denoising algorithm proposed in this paper is applied to process the dual-channel measured signals. The filtered waveforms are shown in Figure 15. It can be seen that most of the noise components in the signals have been suppressed. The filtered discharge waveforms are relatively clean.
Figure 15.
Filtered waveforms of the dual-channel measured PD signals.
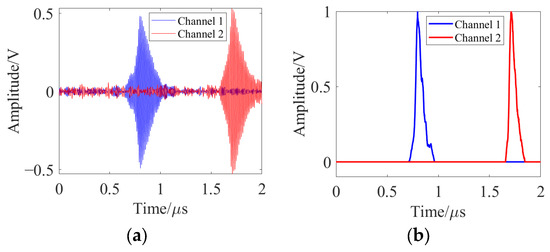
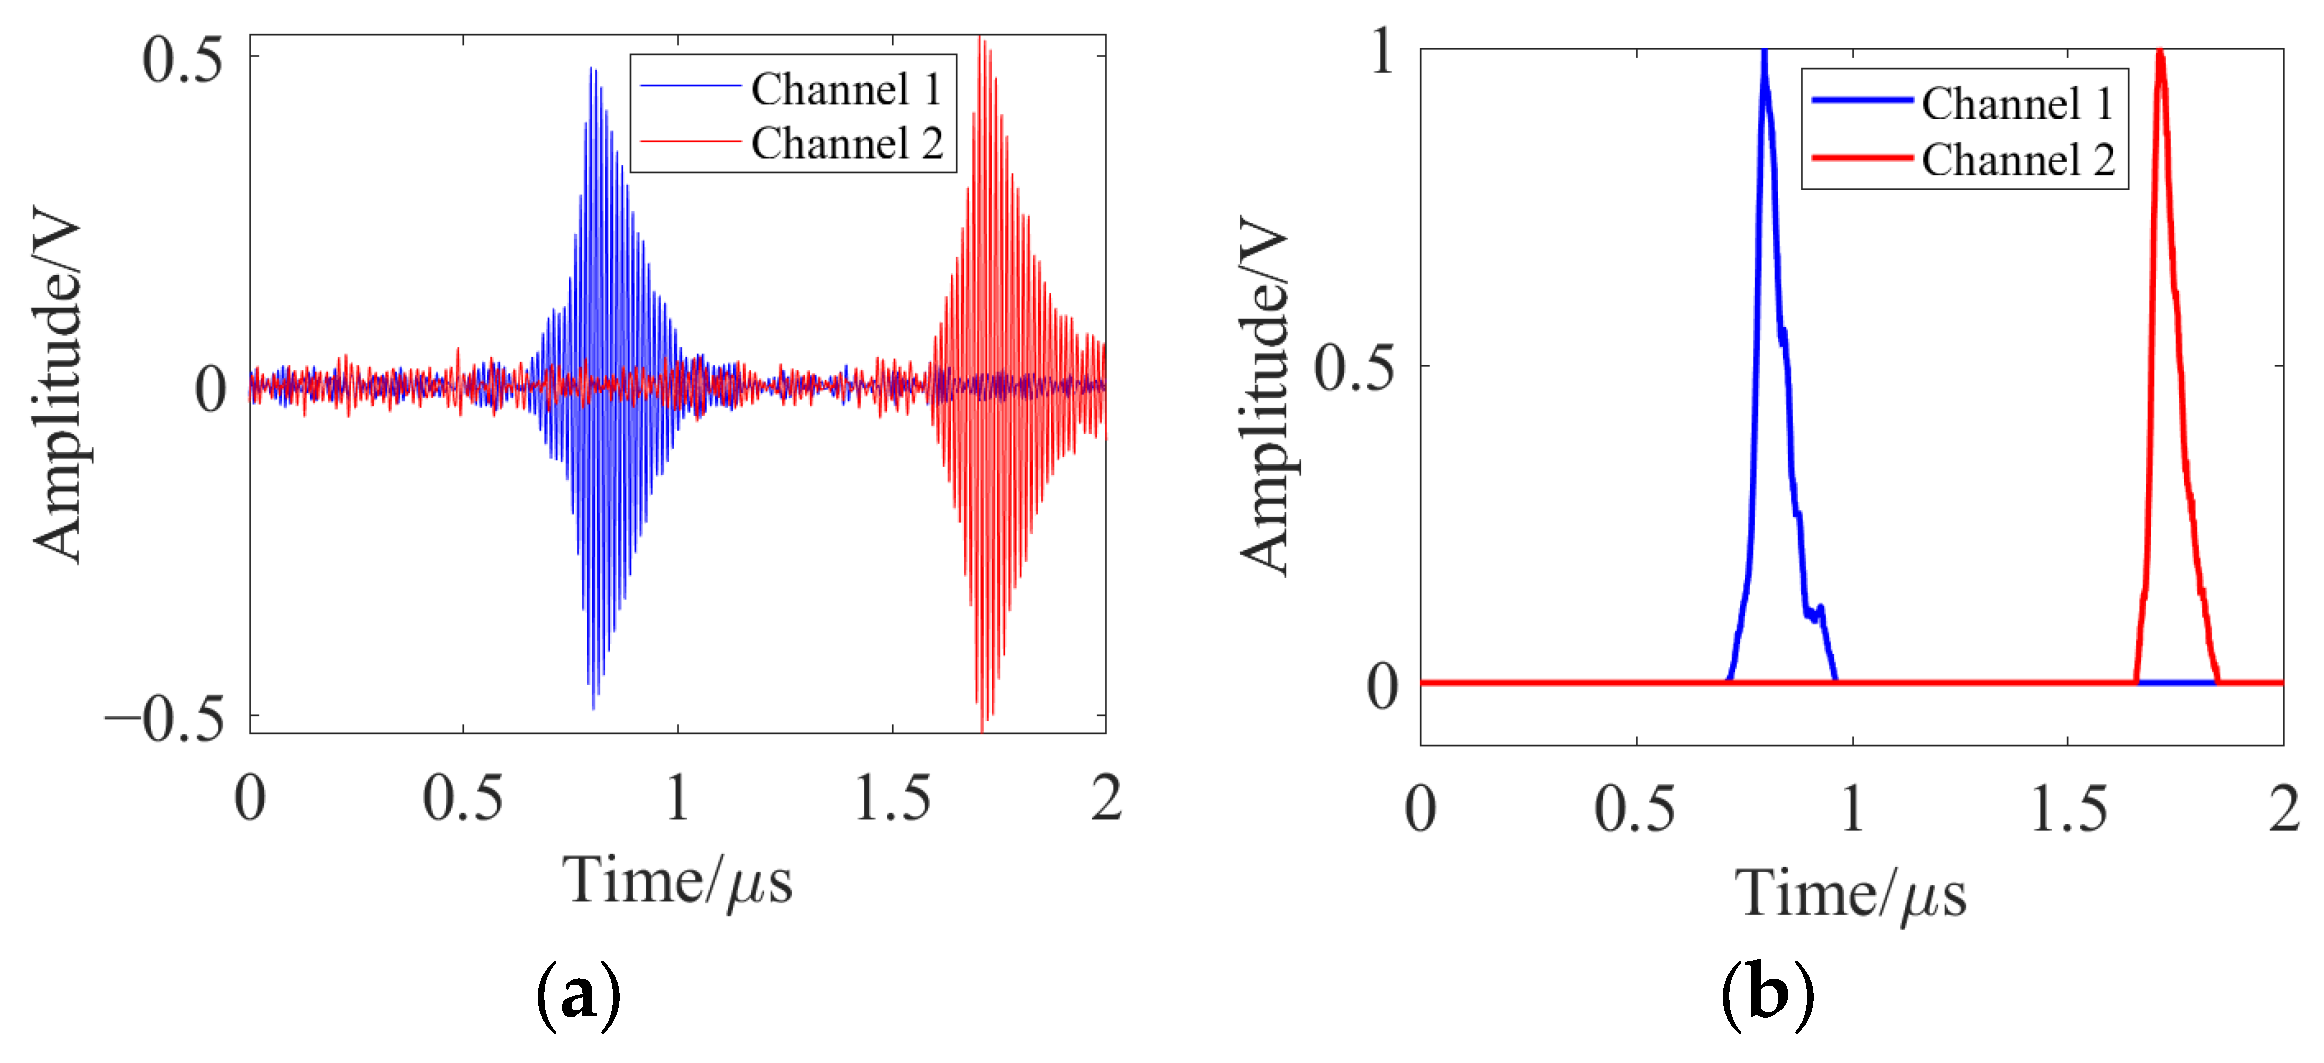
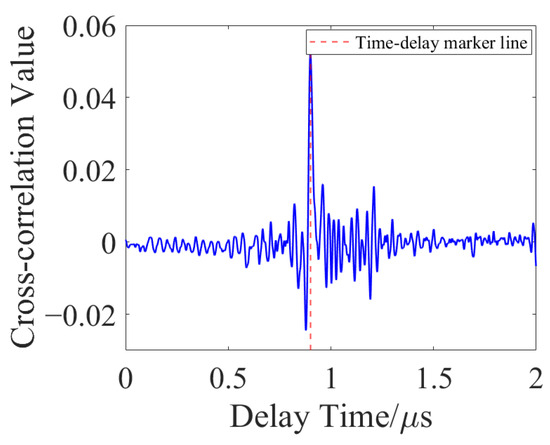
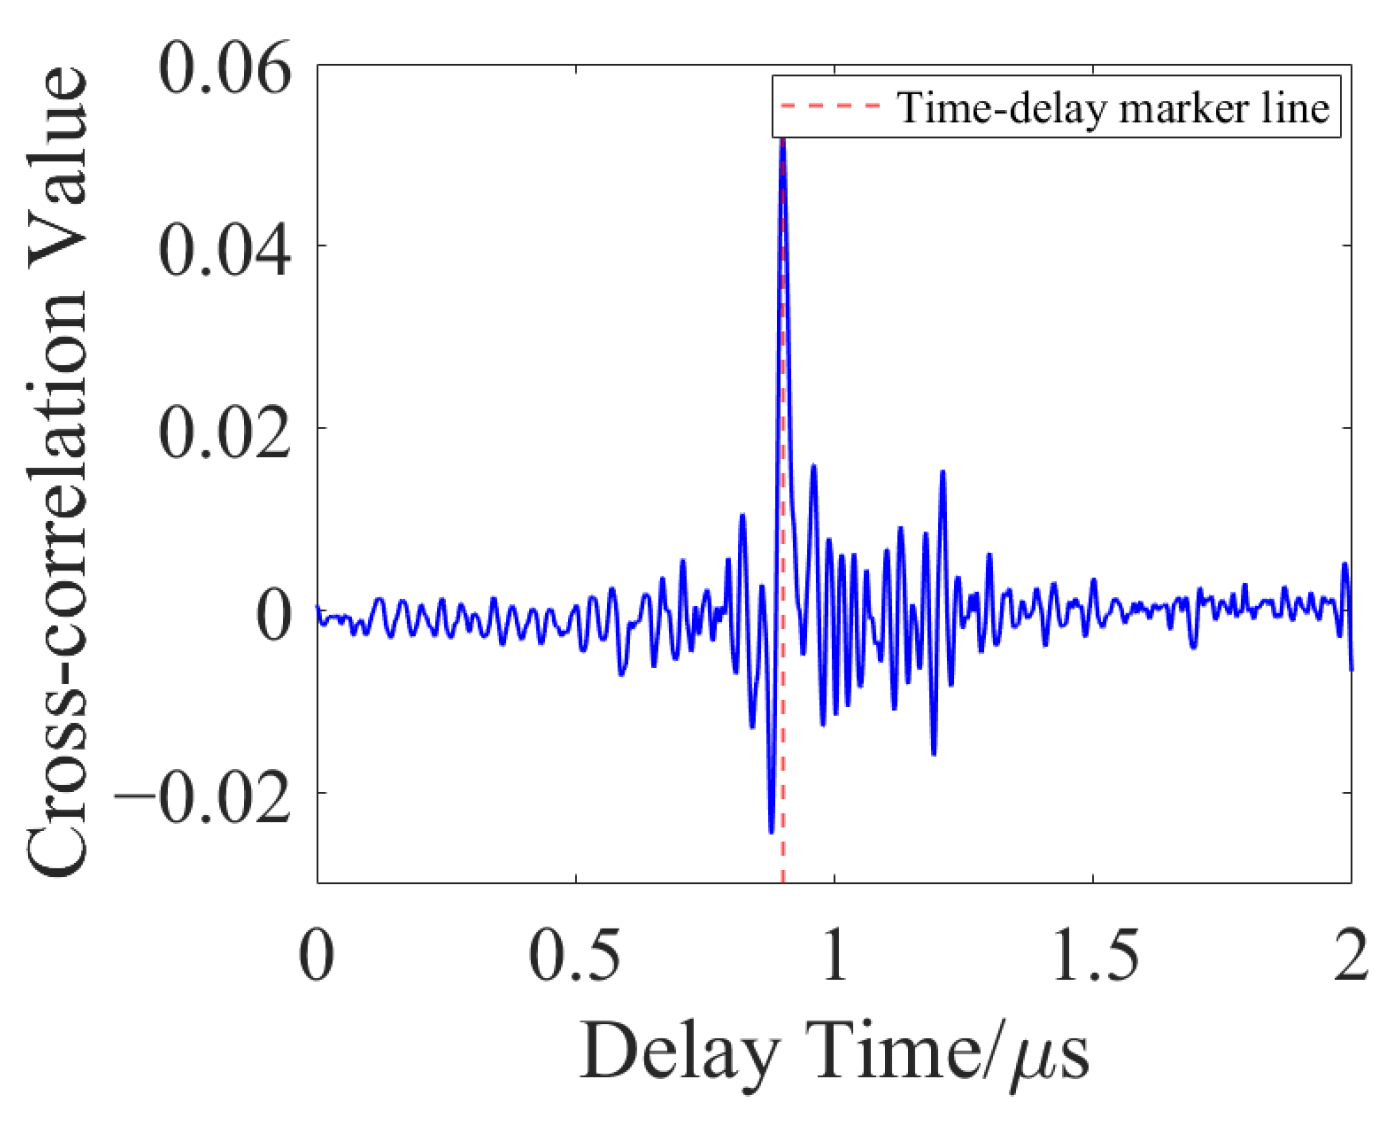
Time-delay analysis is performed on the denoised signals. The effective VMD modes and TEO envelope of the dual-channel discharge signals are shown in Figure 16. It can be seen from the figure that the effective mode components are close to the waveform of the real signal. The TEO envelope curve accurately reflects the amplitude variation pattern of the signal. The cross-correlation peak obtained based on the HB-GQCC algorithm is presented in Figure 17. The time delay of the dual-channel measured signals is calculated to be = 0.9084 ms.
Figure 16.
Effective VMD components and TEO envelope of the dual-channel discharge signals. (a) VMD mode extraction of the dual-channel time-delayed discharge signals; (b) TEO envelope of the dual-channel time-delayed discharge signals.
Figure 17.
Cross-correlation time-delay peak of the dual-channel time-delay electrical signals.
According to the theoretical analysis in Section 4.1, the theoretical time-delay estimate obtained by the proposed algorithm is ≈ 0.9129 ms. Comparing the measured value with the theoretical value , the relative error is = 0.4929%. To further verify the general applicability and robustness of the proposed algorithm under different spatial delay scales , multiple sets of comparative tests were conducted by adjusting the sensor positions. The comparison results between the theoretical calculated values and the measured values under each spatial arrangement are shown in Table 2.
Table 2.
Comparison of time-delay estimation results under different sensor spatial distance differences.
As can be seen from Table 2, under the room temperature condition of 25 °C, the measured time-delay values obtained by the proposed algorithm are highly consistent with the theoretical values for all physical arrangements. This holds for both small spacings (<30 cm) and large spacings (>50 cm). The maximum relative error is 0.5103%, and the errors of all other groups are within 0.6%. The results demonstrate that the proposed joint denoising and HB-weighted generalized quadratic cross-correlation algorithm not only achieves extremely high computational accuracy under a single condition, but also has strong adaptability and robustness across different physical spatial delay scales. It can fully meet the requirements of time-delay estimation for partial discharge in complex noisy environments.
5. Conclusions
This paper addresses several engineering challenges for metal oxide surge arresters. These challenges include the difficulty of identifying early-stage local defects, the susceptibility of discharge signals to strong on-site interference, and the inadequate accuracy of time-delay estimation under low SNR. A partial discharge detection and high-precision time-delay estimation method is proposed. The method is based on multi-level joint denoising and improved cross-correlation. First, a joint denoising framework is constructed. It integrates singular value decomposition, variational mode decomposition adaptively optimized by the sparrow search algorithm, and the Teager energy operator. This framework effectively filters out complex background noise and narrowband interference. It greatly improves the signal-to-noise ratio. Second, a generalized quadratic cross-correlation algorithm with dual HB weighting in both the frequency domain and amplitude is proposed. It significantly enhances the anti-interference capability and estimation accuracy under low SNR and multipath interference. Simulation results show that the accuracy reaches 99.9911%. Finally, a needle-plate discharge experimental platform is set up for measurement and analysis. The results show that in multiple comparative experiments with different spatial distance differences (ranging from <30 cm to >50 cm), the maximum relative error is kept within 0.6%. This verifies the reliability and accuracy of the algorithm in extracting discharge features and calculating time delays under controlled laboratory conditions.
The experiment focuses on simulating weak partial discharge signals generated by early-stage insulation defects inside the arrester. It validates the detection sensitivity of the method to incipient faults. It should be noted that the needle-plate discharge model used in this study cannot fully reproduce the electrical stress, discharge mechanism, acoustic spectrum, and propagation characteristics of a full-size arrester. The current laboratory-scale validation provides a basis for the effectiveness of the method. However, the performance of the algorithm on full-size 500 kV arresters under actual field conditions requires further investigation. In addition, the strong discharge in a 500 kV arrester can leave metastable particles and volume charges in the discharge channel, creating a noticeable memory effect that changes the conditions for subsequent discharges. This effect is difficult to reproduce in the 20 kV needle-plate experiment and should be studied specifically in future full-scale experiments. At the same time, the dissipation speed of volume charges at 20 kV is significantly faster than that at 500 kV. This difference can affect the repeatability of discharges and the statistical characteristics of signals, further limiting the extrapolation ability of the needle-plate model to actual arrester conditions. In addition, the current experiment did not perform strict partial discharge inception voltage (PDIV) calibration. It also did not combine PD current or UHF methods for cross-validation. Therefore, the verification that the detected signal is indeed partial discharge is still insufficient. In future work, the above cross-validation methods will be introduced to further improve the reliability and persuasiveness of the measurement results. Meanwhile, full-scale arrester field experiments will be carried out to promote the engineering application of this method in arrester condition monitoring.
Author Contributions
Conceptualization, H.J.; methodology, H.J.; software, X.W.; validation, H.J., X.W. and W.L.; formal analysis, X.W.; investigation, W.L.; resources, W.L.; data curation, X.W.; writing—original draft preparation, X.C. and J.X. (Jinrong Xu); writing—review and editing, J.X. (Junhong Xing); visualization, X.W.; supervision, H.J.; project administration, H.J.; funding acquisition, W.L. All authors have read and agreed to the published version of the manuscript.
Funding
This work was jointly supported by Liaoning Hongyanhe Nuclear Power Co., Ltd. under the project “Mobile Self-connecting Lead Device for 500 kV Arresters in Hongyanhe Nuclear Power Plant” (Contract No. 3100234381) and the National Key Research and Development Program of China (Grant No. 2023YFB3208402).
Data Availability Statement
The simulated signal parameters are included in the article. The simulation code used to generate the PD signals is available from the corresponding author upon reasonable request, subject to the permission of the industrial partner. The complete source code of the time-delay estimation algorithm is subject to third-party restrictions.
Conflicts of Interest
Authors Hui Jia, Xiaowei Wei and Weichao Li are employed by Liaoning Hongyanhe Nuclear Power Co., Ltd. The remaining authors declare that the research was conducted in the absence of any commercial or financial relationships that could be construed as a potential conflict of interest.
Abbreviations
The following abbreviations are used in this manuscript:
| GQCC | Generalized quadratic cross-correlation |
| HB | Hassab–Boucher weighting |
| HB-GQCC | HB-weighted generalized quadratic cross-correlation |
| MOA | Metal oxide arrester |
| PD | Partial discharge |
| SSA | Sparrow search algorithm |
| TDE | Time-delay estimation |
| TEO | Teager energy operator |
| VMD | Variational mode decomposition |
References
- Ranjbar, B.; Darvishi, A.; Dashti, R.; Shaker, H.R. A Survey of Diagnostic and Condition Monitoring of Metal Oxide Surge Arrester in the Power Distribution Network. Energies 2022, 15, 8091. [Google Scholar] [CrossRef] [Scilit]
- Gomes Zacarias, T.; Sant’Ana, W.C. A Bibliometric and Comprehensive Review on Condition Monitoring of Metal Oxide Surge Arresters. Sensors 2024, 24, 235. [Google Scholar] [CrossRef] [Scilit]
- Eckert, M.; Mraz, P.; Ballweg, C.; Pihera, J. Partial discharge behavior and insulation failures detection in electrical devices subjected to impulse voltage excitation. Int. J. Electr. Power Energy Syst. 2025, 172, 111078. [Google Scholar] [CrossRef] [Scilit]
- Grebovi, S.; Uglei, I.; Xémard, A.; Milardić, V.; Sincić, S.; Diaz, L. The principles of a new line surge arrester’s transient current measurement system. Electr. Power Syst. Res. 2023, 223, 109633. [Google Scholar] [CrossRef] [Scilit]
- Zhang, D.; Lu, H.; Xu, C.; Xu, X.; Han, R.; Cao, Y.; Wang, Z.; Gao, S. Automated Fault Diagnosis Technology for Modular Multilevel Converter Based on Infrared Temperature Measurement. In Proceedings of the 2024 IEEE 7th Eurasian Conference on Educational Innovation (ECEI), Taipei, Taiwan, 15–17 February 2024; pp. 377–381. [Google Scholar]
- Wang, L.; Liu, H.; Dai, L.V.; Liu, Y. Novel Method for Identifying Fault Location of Mixed Lines. Energies 2018, 11, 1529. [Google Scholar] [CrossRef] [Scilit]
- Romano, M.A.A.; de Morais, A.M.; Nunes, M.V.A.; Maresch, K.; Freitas-Gutierres, L.F.; Cardoso, G., Jr.; Oliveira, A.L.; Martins, E.F.; Correa, C.H.; Fontoura, H.C. A Novel Method for Online Diagnostic Analysis of Partial Discharge in Instrument Transformers and Surge Arresters from the Correlation of HFCT and IEC Methods. Energies 2024, 17, 4921. [Google Scholar] [CrossRef] [Scilit]
- Rashwan, A.; Reid, A. Improved Methods for UHF Localization of Partial Discharge in Air-Insulated Substations. Energies 2023, 16, 4221. [Google Scholar] [CrossRef] [Scilit]
- Azam, S.M.K.; Othman, M.; Illias, H.A.; Latef, T.A.; Islam, M.T.; Ain, M.F. Ultra-high frequency printable antennas for partial discharge diagnostics in high voltage equipment. Alex. Eng. J. 2023, 64, 709–729. [Google Scholar] [CrossRef] [Scilit]
- Liu, H.; Zhang, Z.; Shu, Z.; Wang, J.; Tan, H.; Song, Y.; Chen, W. Ultrasonic detection of partial discharge in oil-paper insulation based on fiber-optic dual-coupled F-P sensor. Measurement 2026, 263, 120172. [Google Scholar] [CrossRef] [Scilit]
- Jiang, X.; Zhang, C.; Zhou, Z.; Liao, X.; Fulnecek, J.; Yang, L. Partial discharge data augmentation based on wavelet coefficients and variational autoencoder. Measurement 2026, 258, 119219. [Google Scholar] [CrossRef] [Scilit]
- Wang, X.; Li, J. Cable External Breakage Source Localization Method Based on Improved Generalized Cross-Correlation Phase Transform with Multi-Sensor Fusion. Energies 2025, 18, 2628. [Google Scholar] [CrossRef] [Scilit]
- Zhu, T.; Lin, Y.; Tian, H.; Yan, Y. A Cable Partial Discharge Localization Method Based on Complete Ensemble Empirical Mode Decomposition with Adaptive Noise–Multiscale Permutation Entropy–Improved Wavelet Thresholding Denoising and Cross-Correlation Coefficient Filtering. Energies 2025, 18, 5511. [Google Scholar] [CrossRef] [Scilit]
- Wang, Z.; Xing, J.; Wang, L.; Zhang, D.; Liu, Y.; Jiao, M.; Xia, W. A partial discharge noise suppression method based on singular value decomposition and generalized S transform. Instrum. Exp. Tech. 2026, 68, 862–870. [Google Scholar] [CrossRef] [Scilit]
- Chen, S.; Illias, H.A.; Wong, J.K.R.; Mansor, N.N. Denoising of partial discharges in switchgear insulation material using hybrid wavelet denoising-optimization-machine learning. Ain Shams Eng. J. 2024, 15, 103032. [Google Scholar] [CrossRef] [Scilit]
- Chan, J.Q.; Azam, S.M.K.; Raymond, W.J.K.; Illias, H.A.; Othman, M. Compensation strategies for improved real-world deployment of deep learning-based partial discharge localization from digital twin data. Ain Shams Eng. J. 2025, 16, 103734. [Google Scholar] [CrossRef] [Scilit]
- Liu, W.; Xing, J.; Zheng, Z.; Wang, L.; Liu, Y.; Jiao, M.; Xia, W. Enhancing partial discharge localization using PHAT-SCOT time-delay estimation and hybrid DE-PSO optimization. Electr. Power Syst. Res. 2026, 258, 113123. [Google Scholar] [CrossRef] [Scilit]
- Zhang, C.; Fulnecek, J.; Yang, L.; Zhang, Y.; Zheng, J. Combining multi-level feature extraction algorithm with residual graph convolutional neural network for partial discharge detection. Measurement 2025, 242, 115531. [Google Scholar] [CrossRef] [Scilit]
- Chen, C.; Liu, K.; Jing, J.; Hu, X.; Xue, K.; Zhang, D.; Du, Z.; Li, G.; Xu, T.; Jiang, J.; et al. Wide-Frequency vibration positioning of asymmetric interferometers based on dual endpoint detection and iterative VMD. Opt. Laser Technol. 2025, 187, 112351. [Google Scholar] [CrossRef] [Scilit]
- Grządziel, A. Method of Time Estimation for the Bathymetric Surveys Conducted with a Multi-Beam Echosounder System. Appl. Sci. 2023, 13, 10139. [Google Scholar] [CrossRef] [Scilit]
- Cao, C.; Huang, H. Super-resolution multiple-parameter estimation for the OFDM-based passive radar with ULA using unitary parallel factor direct method. Digit. Signal Process. 2026, 168, 105654. [Google Scholar] [CrossRef] [Scilit]
- Khodsuz, M.; Teymourian, M.H.; Seyyedbarzegar, S. New criteria for metal oxide surge arrester condition monitoring based on leakage current analysis: Considering non-uniform pollution effect. IET Gener. Transm. Distrib. 2024, 18, 892–905. [Google Scholar] [CrossRef] [Scilit]
- Jiang, C.; Li, Y.; Huang, Y. Reference-periodic-similarity based reweighted singular value decomposition signal denoising scheme and its application for weak fault feature diagnosis in industrial rotating machinery. Mech. Syst. Signal Process. 2025, 238, 110021. [Google Scholar] [CrossRef] [Scilit]
- Du, C.P.; Yu, S.W.; Yin, H.T.; Sun, Z. Microseismic time delay estimation method based on continuous wavelet. Sensors 2022, 22, 2931. [Google Scholar] [CrossRef] [Scilit]
- Yao, L.; Yu, C.; Xiao, Y.; Dai, H.; Cui, G.; Fei, Z.; Wang, T. An improved variational mode decomposition neural network intelligent diagnosis method for battery connection faults based on real vehicle data. J. Energy Storage 2025, 139, 118791. [Google Scholar] [CrossRef] [Scilit]
- Chen, W.; Yang, Z.; Song, J.; Zhou, L.; Xiang, L.; Wang, X.; Hao, C.; Fan, X. A High-Resolution Defect Location Method for Medium-Voltage Cables Based on Gaussian Narrow-Band Envelope Signals and the S-Transform. Energies 2024, 17, 2218. [Google Scholar] [CrossRef] [Scilit]
- Dragomiretskiy, K.; Zosso, D. Variational Mode Decomposition. IEEE Trans. Signal Process. 2014, 62, 531–544. [Google Scholar] [CrossRef] [Scilit]
- Awadallah, M.A.; Al-Betar, M.A.; Al-Naymat, G. Recent Versions and Applications of Sparrow Search Algorithm. Arch. Comput. Methods Eng. 2023, 30, 2831–2858. [Google Scholar] [CrossRef] [Scilit]
- Tao, L.; Meng, X.Q. Hybrid Strategy Improved Sparrow Search Algorithm in the Field of Intrusion Detection. IEEE Access 2023, 11, 32134–32151. [Google Scholar] [CrossRef] [Scilit]
- Cao, W.; Zhang, F.; Chen, X.; Zhang, B.; Li, J.; Xu, M. A Study on Fault Localization Method of Three-Terminal Multi-Section Overhead Line–Cable Hybrid Line Using MEEMD Combined with Teager Energy Operator Algorithm. Processes 2024, 12, 1360. [Google Scholar] [CrossRef] [Scilit]
- Wang, S.Z.; Li, Z.J.; Chen, H.D. Optimization Algorithm for Delay Estimation Based on Singular Value Decomposition and Improved GCC-PHAT Weighting. Sensors 2022, 22, 7254. [Google Scholar] [CrossRef] [Scilit]
- Hao, Q.; Qun, W.; Hui, N.; Wang, Z.; Zheng, J. A Partial Discharge Localization Method Based on the Improved Artificial Fish Swarms Algorithm. Energies 2023, 16, 2928. [Google Scholar] [CrossRef] [Scilit]
- Liu, Y.; Guo, J.; Gao, W.; Wen, H.; Cai, G.; Jin, Y.; Wang, K. Time Delay Estimation for Acoustic Temperature Measurement of Loose Coal Based on Quadratic Correlation PHAT-β Algorithm. Fire 2024, 7, 228. [Google Scholar] [CrossRef] [Scilit]



Disclaimer/Publisher’s Note: The statements, opinions and data contained in all publications are solely those of the individual author(s) and contributor(s) and not of MDPI and/or the editor(s). MDPI and/or the editor(s) disclaim responsibility for any injury to people or property resulting from any ideas, methods, instructions or products referred to in the content. |
© 2026 by the authors. Licensee MDPI, Basel, Switzerland. This article is an open access article distributed under the terms and conditions of the Creative Commons Attribution (CC BY) license.