


Abstract
Horizontal well fracturing and thermal injection co-stimulation is widely regarded as a key technology for enhancing the development potential of gas hydrates in the Shenhu Area of the South China Sea, yet its economic feasibility has not been systematically evaluated. In this study, an improved net present value (NPV) economic evaluation model integrating the entire development process of drilling, fracturing, and injection-production was developed, and a techno-economic assessment was conducted based on field-scale numerical simulation data. The results show that neither fracturing nor thermal stimulation alone can achieve positive economic returns; although their combination significantly improves gas production performance, its economic viability is highly dependent on heat source cost and horizontal section length. When the heat source cost decreases from 0.8 to 0.2 RMB/kWh, and the horizontal section length increases from 300 to 1500 m, the NPV increases from –28.99 to 41.88 million RMB. Sensitivity analysis reveals that gas price is the most sensitive factor affecting NPV (variation range of 59.71 to 103.5 million RMB), followed by gas–liquid separation efficiency. It is recommended that prioritizing low-cost heat sources (e.g., geothermal or industrial waste heat), combined with long horizontal section design and downhole water control technologies, is the key strategy to ensure project profitability. Even for the direct warm seawater injection scheme, the horizontal section length should not be less than 1000 m.
1. Introduction
Natural gas hydrate (NGH) is an ice-like crystalline compound formed by gas molecules and water molecules under low-temperature and high-pressure conditions [1]. The total organic carbon stored in global NGH is approximately twice that of all conventional fossil fuel reserves [2,3,4], positioning NGH as a highly promising clean energy source that will play a pivotal role in future energy supply and climate change mitigation.
The NGH in the Shenhu Area of the South China Sea is hosted in clayey silt sediments with extremely low effective permeability (0.001–0.1 mD), exhibiting the typical characteristics of low gas production efficiency [5,6,7]. To enhance the productivity, various stimulation techniques have been proposed, ranging from physical methods such as horizontal well technology, multiple-well systems [8,9,10] and reservoir reconstruction techniques encompassing hydraulic fracturing and boundary sealing, to thermal methods including hot water/fluid injection, geothermal-assisted extraction, electrical heating, and microwave heating [11,12,13,14], to chemical/thermodynamic methods such as CO2-CH4 replacement [15] and inhibitor injection [16], as well as combined stimulation strategies that integrate multiple approaches [17,18,19,20,21]. The combination of thermal stimulation and hydraulic fracturing is widely regarded as one of the most promising strategies for enhancing productivity from low-permeability hydrate deposits. Although NGH deposits, as non-lithified and weak/unconsolidated sedimentary formations, were initially considered difficult to fracture, recent experimental and numerical studies have confirmed their fracability. Ito et al. [22] observed macroscopic fractures in sandy sediments through true triaxial fracturing tests. Konno et al. [23] further demonstrated that fracture permeability in hydrate-bearing sands can be largely maintained after reconsolidation. In our previous work, a multilayer perceptron–analytic hierarchy process (MLP-AHP) fracability evaluation method was developed [24], and three distinct fracture propagation patterns across interlayers were identified through three-dimensional XFEM-based cohesive zone simulations [25]. Beyond fracture propagation, the stimulation efficacy of fractured thermal injection has also been rigorously evaluated. Ju et al. [26] found that fractures significantly enhance hot-fluid injectivity, substantially improving thermal stimulation efficiency. Zhong et al. [27] reported that the combination of network fracturing and thermal injection could increase gas production by more than tenfold, offering a pathway toward commercial hydrate development. Li et al. [21] revealed that the synergistic effect of “fracturing + thermal stimulation” achieves a “1 + 1 > 2” enhancement in production performance. Bazaluk et al. [28] evaluated the potential recoverable gas volume in structurally heterogeneous deposits using an integrated methodological approach. These efforts have confirmed the technical feasibility of the combined “fracturing + thermal stimulation” scheme from a physical mechanism perspective. However, for a technology to transition from “physically effective” to “engineeringly feasible,” a critical question must be addressed: can the productivity gains offset the additional costs? Both hydraulic fracturing and thermal stimulation involve substantial investment increases—fracturing requires expenditures on fracturing fluids, proppants, and operational services, while thermal stimulation necessitates the construction of heating equipment and the consumption of significant energy to heat seawater to the target temperature. This issue is particularly prominent in the context of high deepwater operational costs.
Several approaches have been developed for the economic evaluation of energy projects, including discounted cash flow (DCF), energy return on investment (EROI), and commercial production capacity threshold methods [27,29,30]. Among these, the DCF method with net present value (NPV) as the primary decision-making criterion is the most widely adopted in the oil and gas industry, as it offers the advantage of directly quantifying the monetary value creation over the entire project life cycle while systematically accounting for the time value of money and capital costs. Preliminary explorations on the economic feasibility of NGH development have been conducted. Walsh et al. [31] evaluated the production cost of marine NGH using the discounted cash flow (DCF) method and found that it was US$3.1–3.5 per MMBtu higher than that of conventional natural gas. The Japanese Research Consortium for Methane Hydrate Resources [32] pointed out that a 6% internal rate of return could be achieved for the NGH in the Nankai Trough under the conditions of a single-well daily production rate of 5.56 × 10⁴ m3, a total of 49 production wells, and a production period of 15 years. Kong et al. [33] assessed the energy return on investment for NGH in the South China Sea, indicating that a standard energy return ratio of 1.25 could be attained if a single well maintains a daily output of 2.3 × 10⁴ m3 for a stable production period of 12 years. Deepak et al. [34] conducted a techno-economic evaluation of NGH extraction in the Krishna–Godavari Basin using the DCF method. They suggested that commercial exploitation would become viable at a natural gas market price of US$7.67/MMBtu, provided that 120 production wells yield a total daily production of 1.8 × 10⁷ m3 over a stable period of 10 years. Chen et al. [35] argued that for China, Japan, and the United States to achieve industrial-scale NGH production, the minimum in-place economically recoverable methane resources would need to be 3.62 × 10¹² m3, 5.58 × 10¹² m3, and 9.31 × 10¹² m3, respectively. Based on current pilot production tests and technological capabilities in China, Ning et al. [36] proposed that hydrate reservoirs suitable for commercial development should satisfy four key criteria: an average hydrate saturation exceeding 30%, a thickness of no less than 40 m, an average effective permeability greater than 5 mD, and an average effective porosity exceeding 30%. These studies provide valuable references for NGH economic development; nevertheless, there are still certain limitations. First, most evaluations rely on assumed production data or estimates, which weakens the connection between evaluation results and actual engineering practices. Second, the evaluation schemes predominantly focus on single depressurization or thermal stimulation routes, with limited understanding of the combined stimulation mode of “fracturing + thermal”.
This study aims to evaluate the economic feasibility of fracturing-assisted thermal stimulation for hydrate extraction in the Shenhu Area and to identify the key engineering and market conditions under which this combined stimulation strategy becomes profitable. To this end, we develop an integrated techno-economic framework that couples field-scale numerical simulation with an improved economic evaluation model, encompassing the full development chain from drilling and fracturing to injection and production. The novelty of this work is twofold. First, we extend the evaluation from productivity assessment to economic viability analysis, demonstrating that while “fracturing + thermal” co-stimulation substantially enhances gas production, its profitability is highly sensitive to heat source cost and horizontal section length—two parameters that have not been systematically quantified in previous economic studies. Second, we delineate the critical engineering thresholds under which the co-stimulation scheme becomes economically viable, providing practical optimization strategies such as minimum horizontal section length, optimal injection temperature range, and the maximum affordable heat source cost for break-even operation. These findings offer a quantitative basis for field-scale engineering design and technology selection in hydrate development.
2. Methodology
The economic evaluation in this study consists of three closely linked stages, following the standard techno-economic assessment workflow widely adopted in the oil and gas industry [33,34,35]. In Stage 1, numerical simulations are performed using the TOUGH+HYDRATE simulator for the designed scenarios to obtain annual injection-production data over a 20-year production period. In Stage 2, the production data are substituted into an improved economic evaluation model. In Stage 3, multi-factor sensitivity analyses are conducted to examine the impact of key parameters, thereby identifying the key controlling factors.
2.1. Development Scheme Design
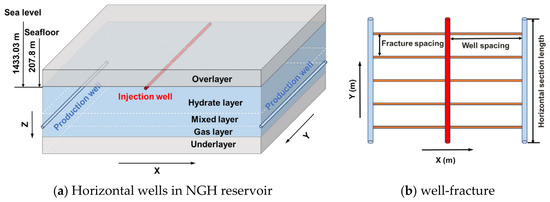
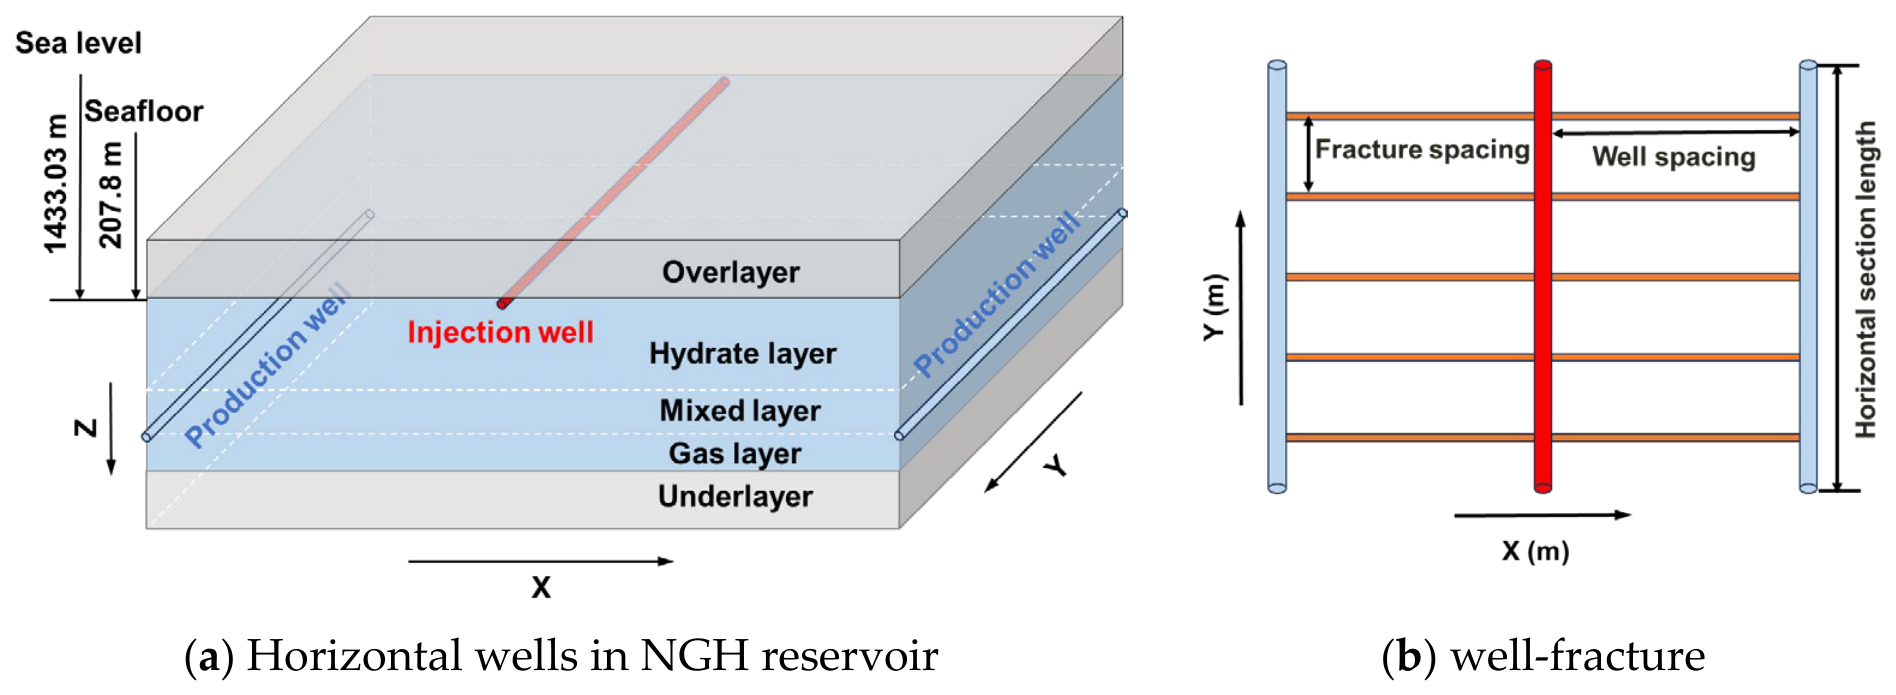
The Shenhu second NGH test site was taken as the geological prototype. The water depth at this site is 1225.23 m, and it is a typical clayey silt multi-layered NGH reservoir, consisting from top to bottom of the overlayer (OL), hydrate layer (HL), mixed layer (ML), gas layer (GL), and underlayer (UL) [10,37]. A three-spot horizontal well pattern was adopted, with the hot-water injection well at the top of the hydrate layer and production wells at the bottom of the mixed layer, as shown in Figure 1. This well pattern configuration has been proven to achieve maximum hot water sweep efficiency [20].
Figure 1.
Schematic diagram of fracturing and thermal co-stimulation in the NGH reservoir.
Four development plans are designed in this study: plan HD adopts no stimulation measures and produces only through horizontal well depressurization, serving as the baseline for economic comparison; plan HDF adds fracturing to evaluate the contribution of fracturing to productivity enhancement and its economics; plan HDT adds hot-water injection to evaluate the economic feasibility of thermal stimulation alone; plan HDFT employs both fracturing and hot-water injection to evaluate the co-stimulation economic feasibility. The numerical simulation scenarios are presented in Table 1.
Table 1.
Numerical simulation scenarios.
2.2. Numerical Simulation
The TOUGH+HYDRATE numerical simulator developed by the Lawrence Berkeley National Laboratory was employed in this study. This code is capable of modeling phase transitions during NGH development as well as non-isothermal multiphase, multi-component fluid flow [38]. It is one of the most widely applied hydrate simulators internationally and has been fully validated for accuracy [39]. The mass and energy conservation equations for each component (water, methane, hydrate) are expressed as:
where is the mass or energy accumulation terms; is the mass or energy fluxes; and is the source/sink terms.
The well spacing and fracture stage spacing were both set to 60 m, resulting in a model size of 60 m × 60 m × 149.2 m. This configuration assumes homogeneity along the horizontal direction and employs a single fracture stage and a single production unit to represent the system. This assumption is primarily justified by the current lack of detailed characterization of hydrate spatial distribution in the Shenhu reservoir. Under this assumption, production and injection data can be reliably scaled proportionally—a practice that greatly reduces computational cost while maintaining accuracy [18,40]. The model was discretized into 33,800 grid blocks, with element sizes controlled within 2.5 m × 2.5 m and refined to 0.2 m × 0.2 m near the wellbore. Dirichlet boundary conditions were imposed at the top and bottom boundaries to represent the infinite-acting OL and UL. Fractures were represented as porous media with a high permeability of 4 D, and the fracture half-length, width, and height were 60, 0.05, and 70.20 m, respectively [20,21,41]. To reduce the error of calculating pipe flow in wells using Darcy’s law and simplify the solution, the permeability, porosity, and capillary pressure of the well grid were set to 5000 D, 1.0, and 0 MPa, respectively; this equivalent approach maintains the error within 5% [38,42]. Both the production well and the injection well were operated at specified bottom-hole pressures (BHP). The production wells were maintained at a constant BHP of 3 MPa to sustain the depressurization driving force for hydrate dissociation. The injection well was maintained at a constant BHP of 20 MPa to overcome the initial reservoir pressure and to drive the hot water into the reservoir. Key reservoir parameters and other model parameters are summarized in Table 2.
Table 2.
Numerical model parameters.
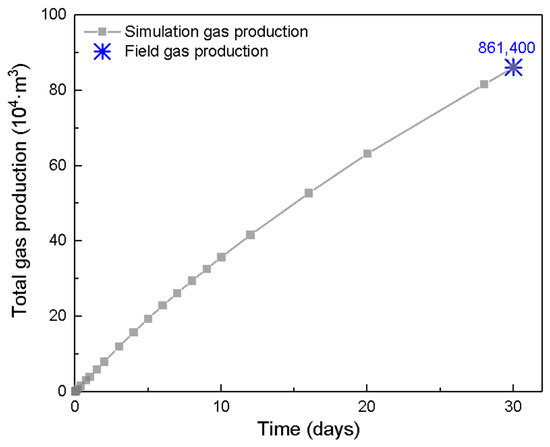
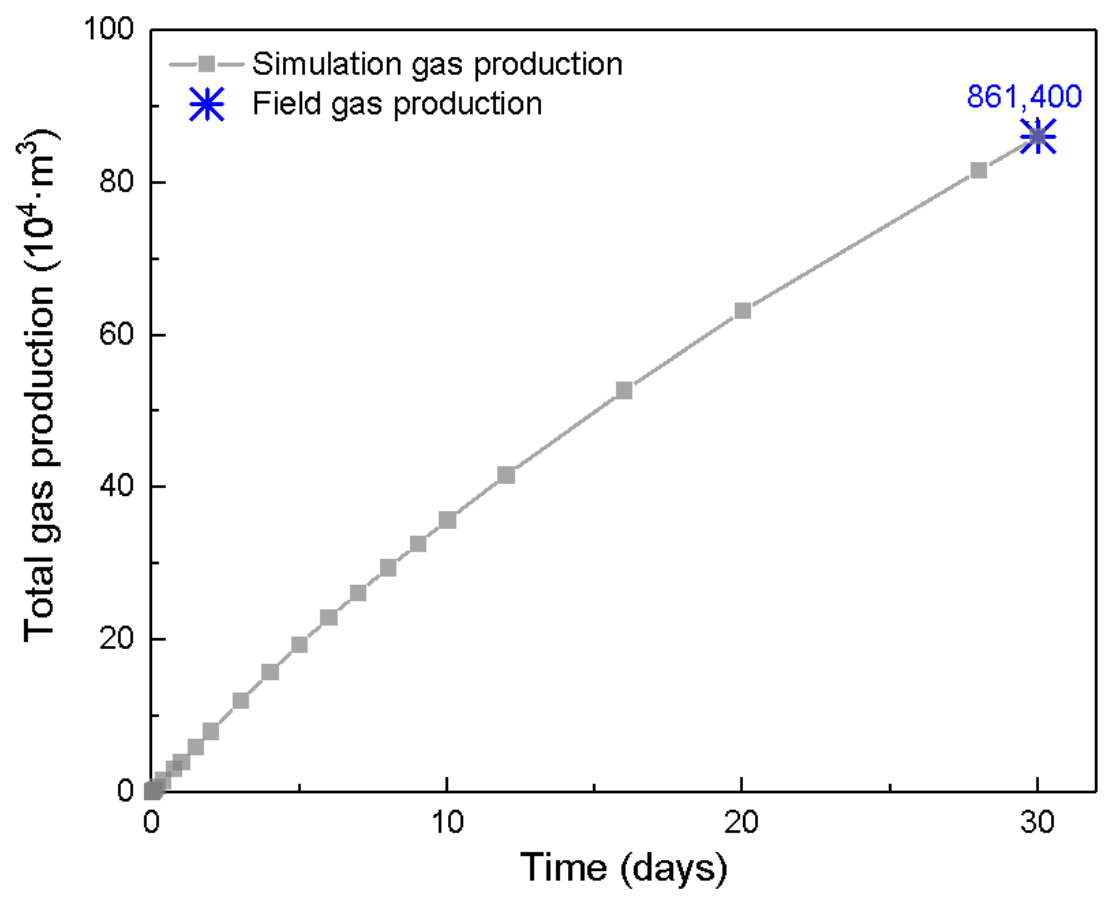
The numerical model was validated against the 30-day gas production data from the Shenhu second production test, as shown in Figure 2. In the simulation, gas production per unit horizontal length (1 m) was modeled and then scaled to match the field production rate. A horizontal length of approximately 260 m was required to reproduce the field gas production over 30 days—a value that falls within the reported range of 250–300 m for the test well [10]. This agreement confirms that the model captures the short-term production behavior at the reservoir scale. Notably, this validation is limited to a 30-day production period and does not guarantee the accuracy of 20-year forecasts. Long-term predictions are subject to significant uncertainties, including reservoir heterogeneity, pressure depletion evolution, hydrate dissociation front advancement, and potential fracture conductivity degradation. These uncertainties are inherent to the current pilot-production stage of hydrate development, where only short-term field data are available, and are commonly acknowledged in similar numerical studies. Consequently, the economic conclusions in this study are drawn based on relative comparisons between schemes rather than absolute production forecasts [15]. To partially mitigate this, extensive sensitivity analyses have been conducted to assess the impact of key uncertainties on economic outcomes, and conclusions are drawn based on relative comparisons between schemes rather than absolute predictions.
Figure 2.
Comparison of test and simulated gas production in the Shenhu Area.
2.3. Mathematical Model for Economic Evaluation
DCF is a valuation method based on expected future cash flows and discount rates, and it is also one of the most widely applied economic evaluation approaches. Among its outputs, the NPV is the most critical analysis result, defined as the sum of the present values of cash inflows and outflows over the production period of a project. NPV is currently a key economic indicator for assessing whether a project is profitable over its production life. The calculation formula for NPV is as follows:
Discounted net cash flow is obtained by the following equation:
Cash inflow is derived from natural gas sales:
Cash outflow includes capital expenditure, energy cost, and operation and maintenance (O&M) cost:
Capital expenditure is a one-time upfront investment incurred only in the first year, and consists of four components: drilling cost, fracturing cost, production system investment, and thermal injection system investment:
The drilling cost consists of a fixed cost and a variable cost that varies with the horizontal section length. The fixed cost mainly covers mobilization, platform positioning, blowout preventer installation, and wellhead installation. The variable cost increases as horizontal section length increases, and the rate of increase accelerates progressively—as the horizontal section extends further, wellbore cleaning becomes more difficult, drill string friction increases, and casing running complexity intensifies, leading to increasing marginal drilling costs. A power-law model is employed:
The fracturing cost consists of a fixed cost and a variable cost that varies with fracturing stage number. The fixed cost covers fracturing fleet mobilization, equipment commissioning, high-pressure manifold installation, QHSE, and other costs independent of stage count. The variable cost covers fracturing fluid, proppant, pumping services, and other costs that increase with fracturing stage number. In continuous operations, economies of scale arise from bulk procurement and process optimization, resulting in a declining unit-stage cost as stage count increases. A scale exponent model is used:
The number of fracturing stages is determined by:
Production system investment includes electric submersible pumps (ESPs), wellhead equipment, subsea manifolds, flowlines, and control systems, and is treated as a fixed value:
Thermal injection system investment includes water heating boilers/heat exchangers, downhole injection strings, and temperature monitoring systems. The injection equipment investment is treated as a fixed cost. For plan HDFT, considering the investment savings from sharing platform foundations, wellhead equipment, and subsea manifolds between thermal injection and fracturing, a share coefficient of 0.85 is introduced:
The energy cost is divided into three components: fixed ESP operating cost, production water lifting energy cost, and heating energy cost:
The production water lifting energy cost is the monetary cost of the energy required to lift the formation water to the platform, and is determined by:
Heat losses during injection are minimized by the use of insulated tubing, which maintains the injected water temperature at the target level—a standard practice in deepwater thermal injection operations. The heating energy cost can be calculated by:
O&M cost includes fixed maintenance costs and variable costs linked to annual gas production, water production, and hot-water injection:
The economic evaluation parameters employed are presented in Table 3.
Table 3.
Economic evaluation parameters.
3. Results and Discussion
3.1. Injection-Production Performance
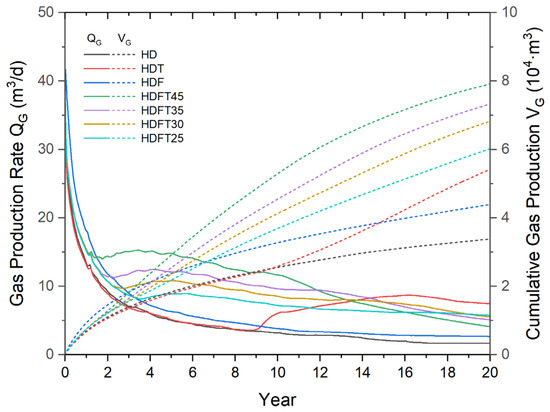
Figure 3 presents the gas production rate QG and cumulative gas production VG per unit horizontal section. The HD case exhibits continuous production decline, with a final VG of only 3.38 × 10⁴ m3. The HDF case shows a similar trend but with moderate improvement, reaching a final VG of 4.39 × 10⁴ m3, as fractures provide high-conductivity pathways for pressure propagation. In the HDT case, gas production begins to rise after approximately 9 years, indicating that gas released from hydrate dissociation by thermal injection starts flowing into the production well, with a final VG of 5.42 × 10⁴ m3. The HDFT cases show significantly higher gas production than the other plans, entering a relatively stable high-yield period after 1–2 years. HDFT45 achieves a maximum VG of 7.92 × 10⁴ m3, which is 1.46–2.34 times that of the other three plans, as fractures serve as dual-purpose conduits for both pressure propagation and hot water convection. Even HDFT25 (direct warm seawater injection) reaches a final VG of 6.02 × 10⁴ m3, 1.11–1.78 times that of the other plans. This indicates that fracturing provides efficient thermal convection channels for heat injection, substantially expanding the effective thermal stimulation zone. The comparison across HDFT cases reveals that the marginal gain from raising injection temperature from 35 to 45 °C is relatively limited compared to the temperature rise itself, suggesting diminishing returns at higher temperatures where additional heat input is increasingly dissipated to non-productive formation components.
Figure 3.
Gas production rate and cumulative gas production per unit horizontal section.
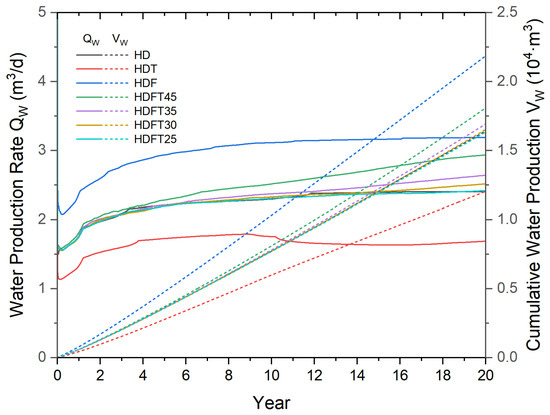
Figure 4 shows water production rate QW and cumulative water production VW per unit horizontal section. It can be seen that the HDF case exhibits the highest water production (VW = 2.19 × 10⁴ m3), while the HDT case shows the lowest (VW = 1.20 × 10⁴ m3), indicating that fracturing significantly increases water production as fractures connect to formation water-bearing zones and enhance water mobility. HDFT25 has water production comparable to the HD case (VW = 1.63–1.64 × 10⁴ m3), suggesting that low-temperature injection does not exacerbate water production issues—a favorable finding for field applications. However, as injection temperature increases from 25 to 45 °C, the final VW increases from 1.63 to 1.80 × 10⁴ m3, which is attributed to more efficient hydrate dissociation creating additional pore space and permeability enhancement that accelerates inter-well connectivity.
Figure 4.
Water production rate and cumulative water production per unit horizontal section.
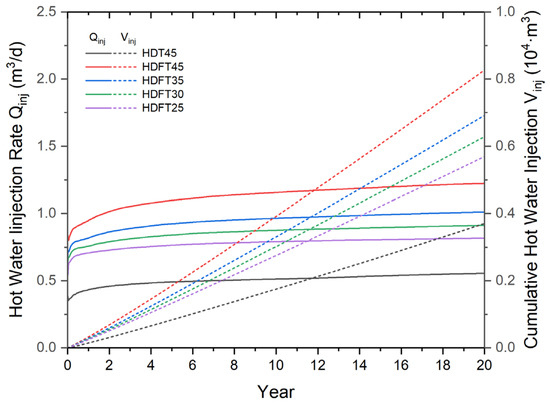
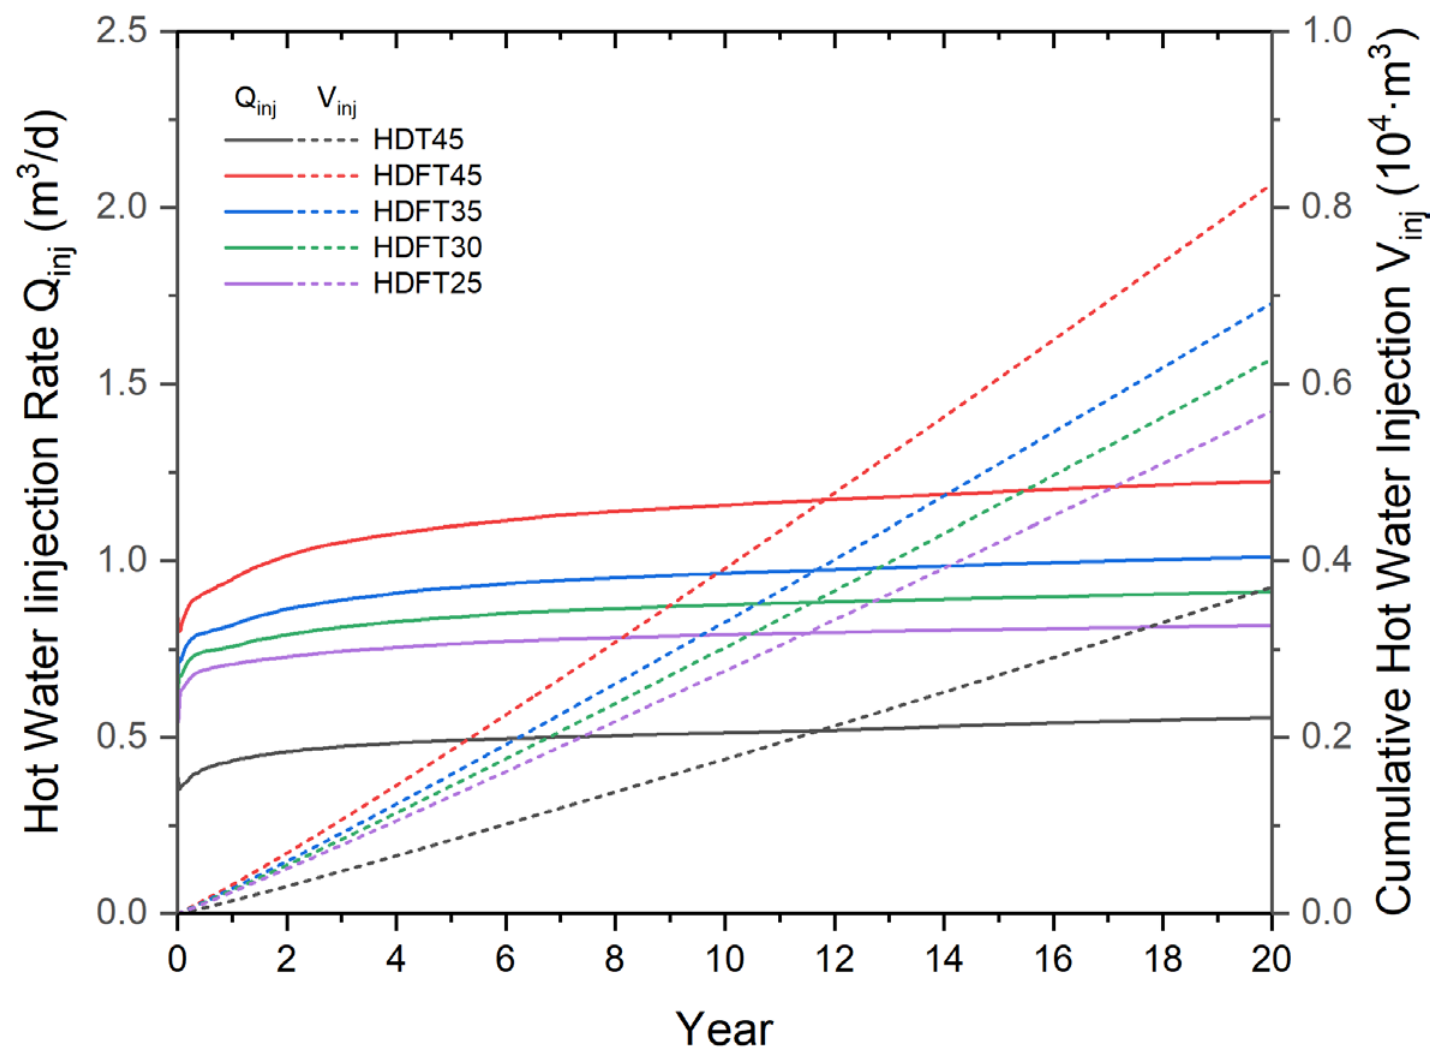
Figure 5 shows the hot-water injection rate Qinj and cumulative hot-water injection Vinj per unit horizontal section. The Qinj of HDFT cases is significantly higher than that of the HDT case, directly demonstrating that fracturing enhances injectivity by providing high-conductivity pathways for hot water. Without fractures, the injected hot water cannot penetrate the low-permeability matrix efficiently, leading to poor thermal sweep efficiency. As injection temperature increases from 25 to 45 °C, the final Vinj increases from 0.57 to 0.83 × 10⁴ m3, which is 1.54–2.24 times that of the HDT case. This is attributed to more efficient hydrate dissociation accelerating thermal breakthrough.
Figure 5.
Hot-water injection rate and cumulative hot-water injection per unit horizontal section.
The coupled analysis of gas production, water production, and injection characteristics indicates that the core role of fracturing is to overcome the “poor injectivity” problem in low-permeability NGH reservoirs. The gas production of HDFT45 is 1.46 times that of HDT, demonstrating the critical value of fractures as thermal convection channels. However, fracturing simultaneously increases water production, suggesting that water control functions should be incorporated into future development design.
3.2. Economic Evaluation
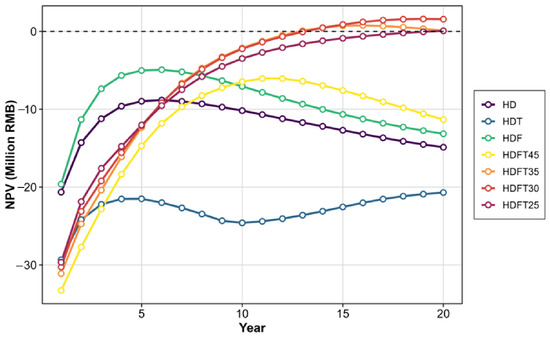
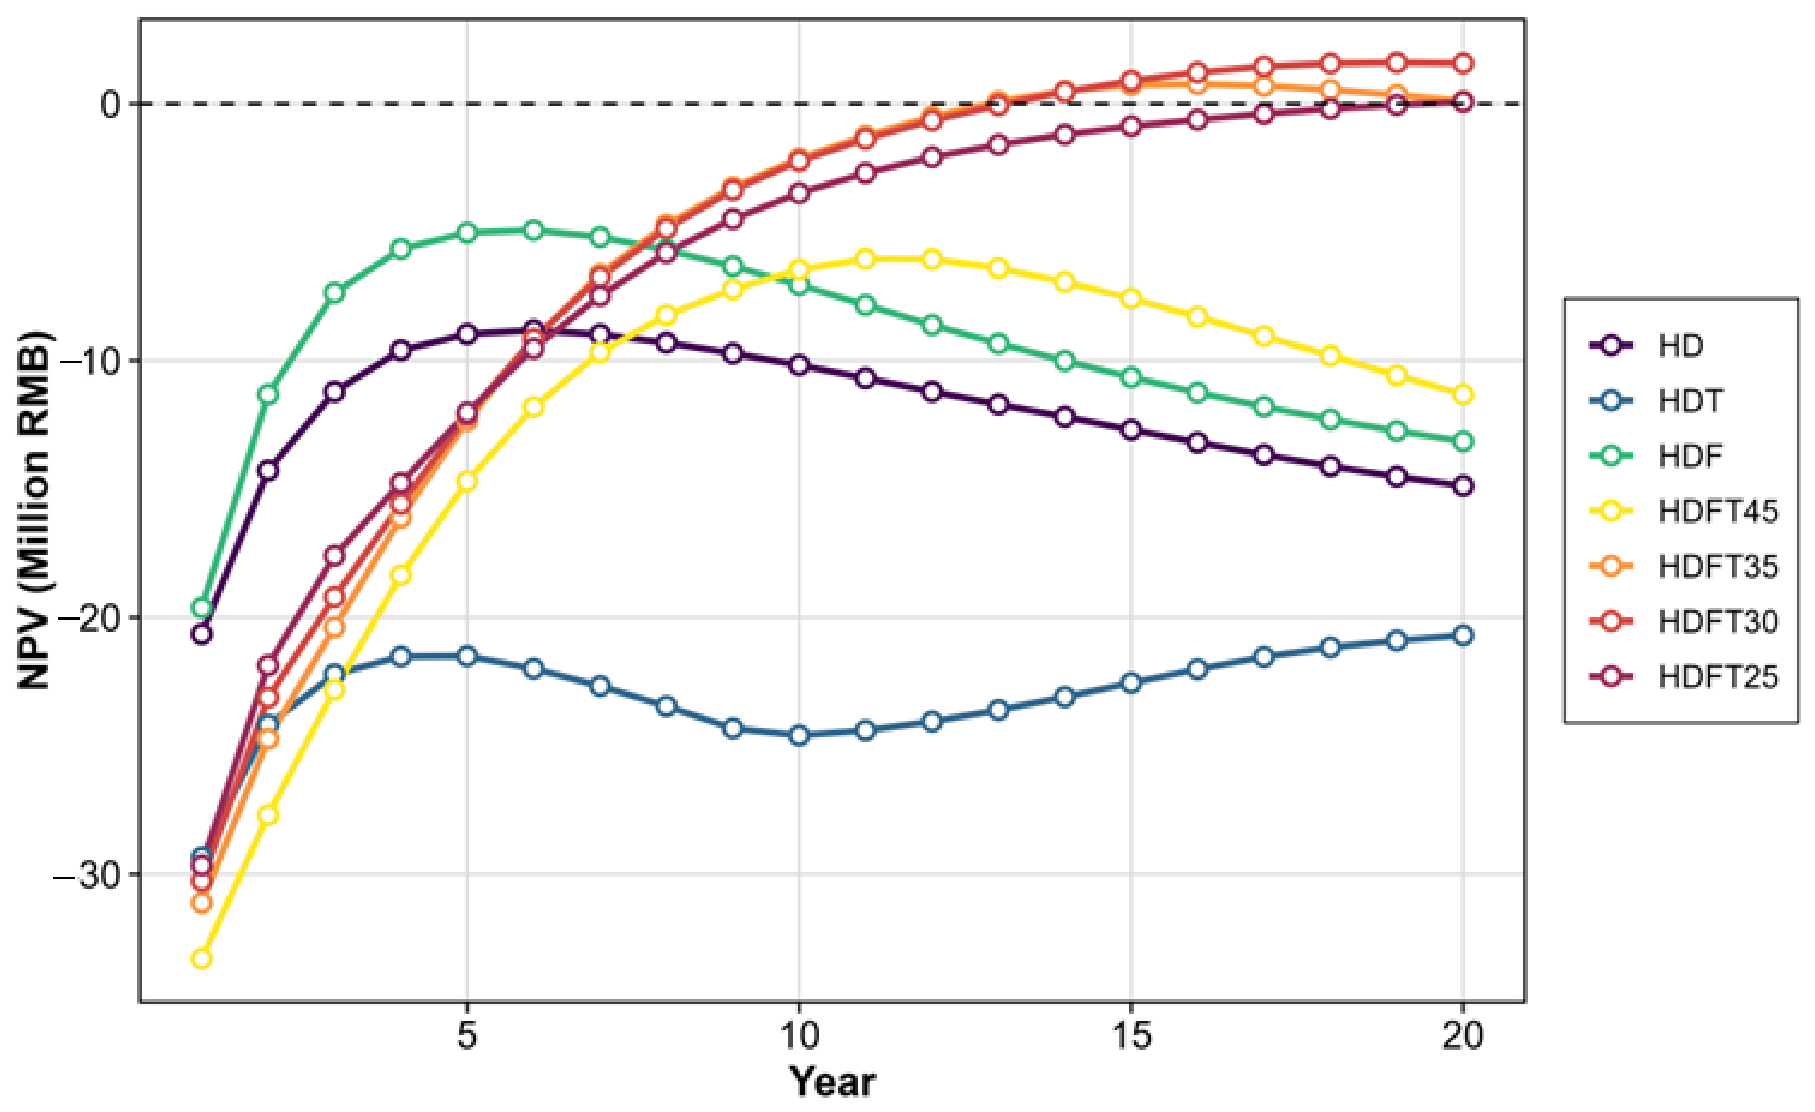
Figure 6 presents the 20-year NPV curves for all cases. The HD reaches a peak NPV of −8.81 million RMB (year 6) and an ultimate NPV of −14.88 million RMB, indicating economic infeasibility. The HDF shows slight improvement but remains unviable, with a maximum NPV of −4.92 million RMB (year 6) and an ultimate NPV of −13.15 million RMB. The HDT performs worst, with a maximum NPV below −20 million RMB. HDFT45 reaches a peak NPV of −6.03 million RMB (year 11), remaining negative despite its highest gas production, due to excessive heating costs. However, when injection temperature is reduced to 35 °C or below, positive returns become achievable, with an ultimate NPV of 0.07–1.58 million RMB, an internal rate of return (IRR) of 12.06–13.22%, and a payback period (PBP) of 13–20 years (Table 4). Furthermore, there is an optimal injection temperature (30 °C) that balances output and input.
Figure 6.
The 20-year NPV curves: different cases are represented by dots and lines of different colors; see the legend.
Table 4.
Comparison of key economic indicators for all plans.
Additionally, the economic indicators in Table 4 show that, for the low-permeability NGH deposits in the Shenhu Area, economic extraction is difficult to achieve without reservoir stimulation or using a single production strategy—a situation that differs from the high-permeability sandy hydrate deposits in the Nankai Trough [32].
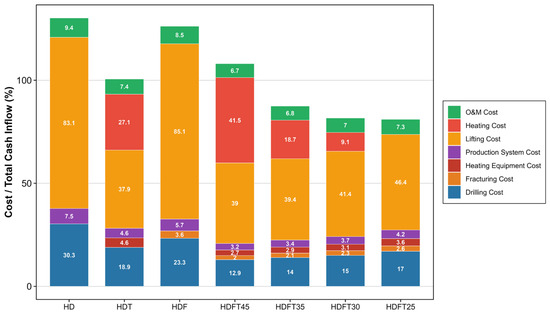
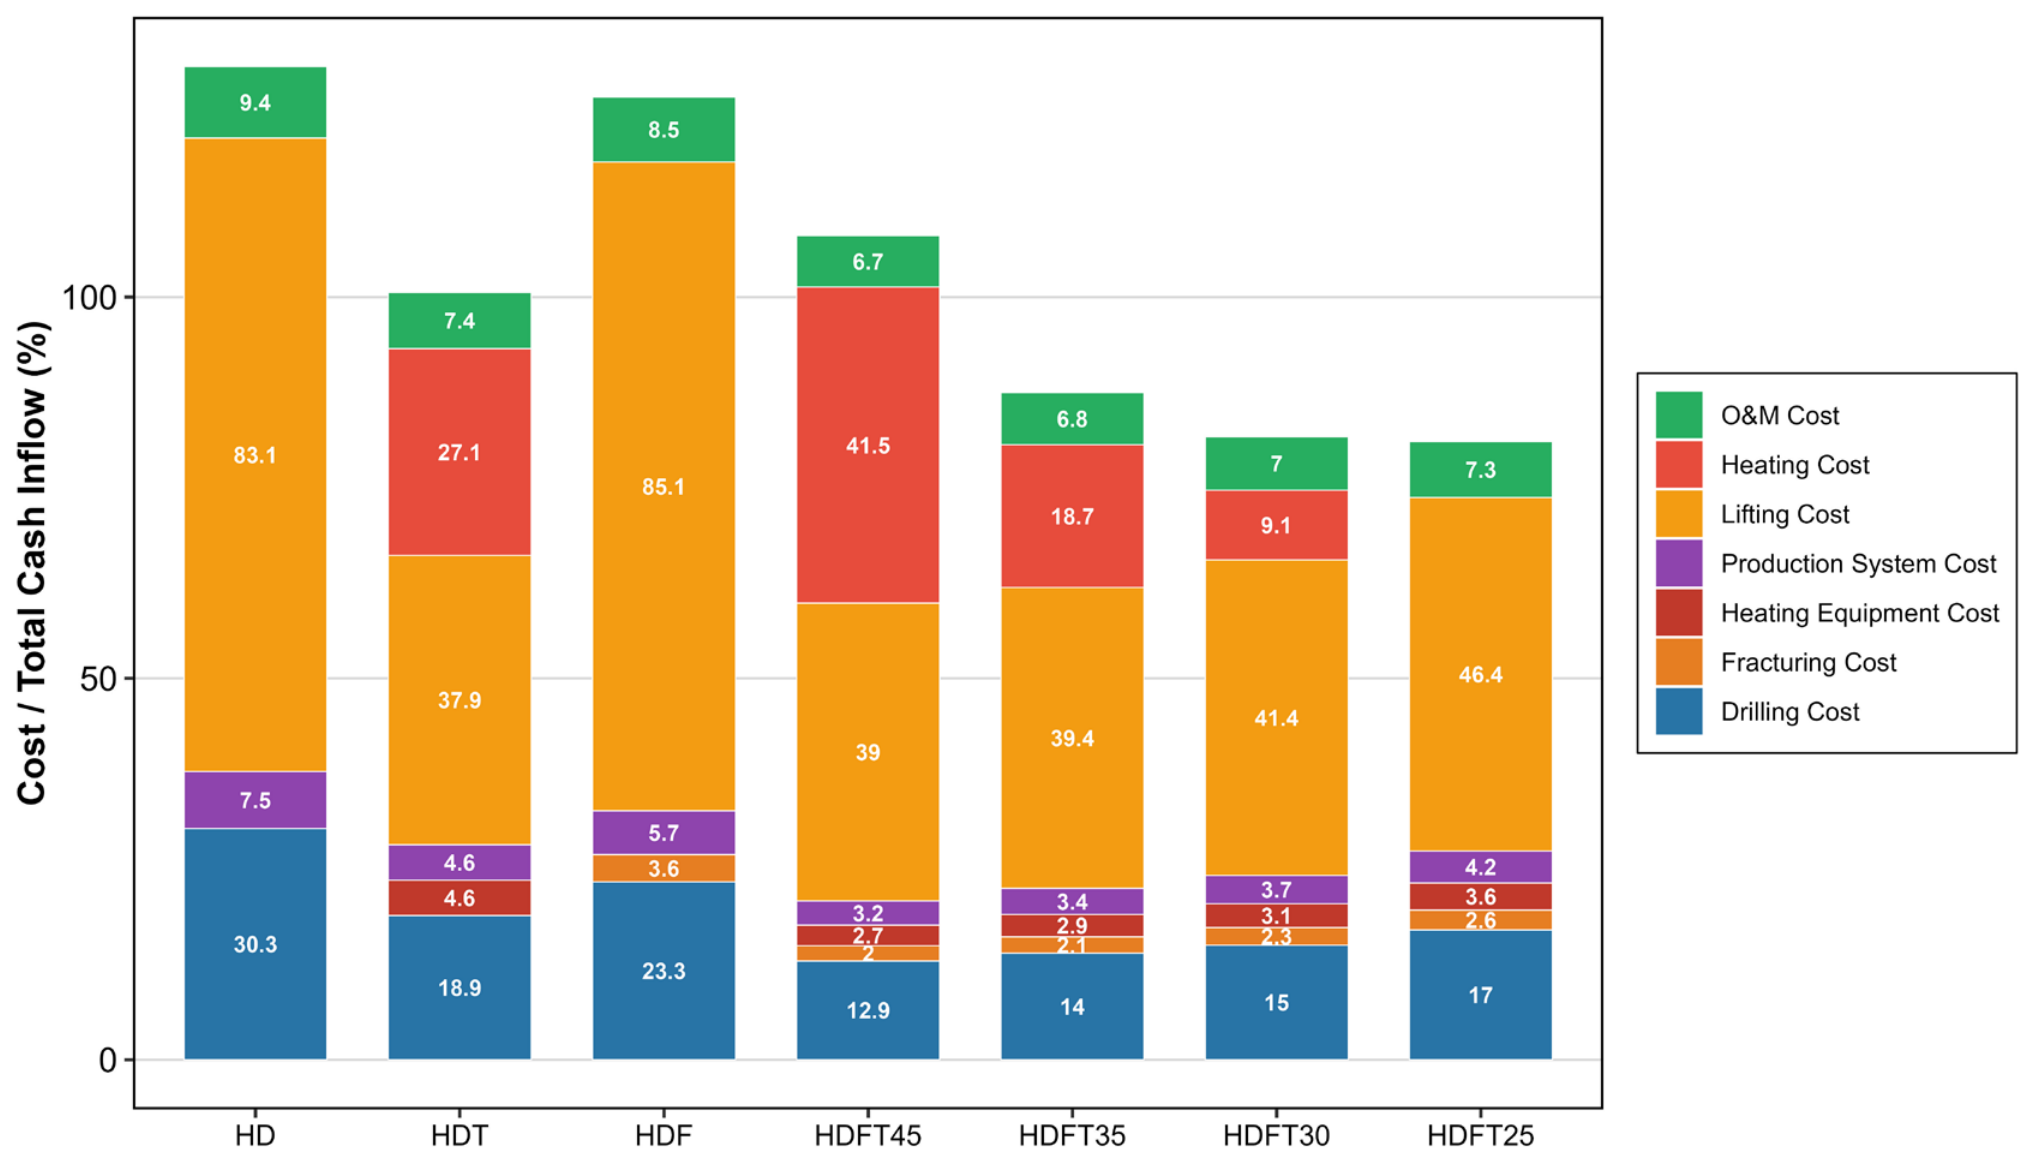
Figure 7 shows the operating cost breakdown for all cases. It can be seen that lifting cost accounts for the largest proportion across all cases (39–85%), reaching 83.1% and 85.1% in HD and HDF, respectively. This highlights that water control is important for deep-sea NGH development. For thermal stimulation cases, the heating cost share increases greatly with injection temperature, rising from 9.1% (HDFT25) to 41.5% (HDFT45), even exceeding lifting cost in HDFT45. Drilling cost accounts for 14–30.3%, while operation and maintenance costs are relatively minor. Collectively, energy consumption and drilling investment are the key factors influencing final NPV.
Figure 7.
The operating cost breakdown for all cases. Notably, for each case, the cost shares are normalized to 100% to enable clear comparison of the proportional cost structure across different development schemes.
The dominant role of energy costs (lifting + heating) is a defining feature of the cost structure. These two energy costs together exceed 70% of total costs, indicating that NGH development is essentially an “energy-driven process.” The high cost of lifting suggests that water control is equally important as productivity enhancement. Furthermore, in the absence of economical heat sources, the economic viability of high-temperature injection is questionable, necessitating sensitivity analysis on heat source cost.
3.3. The Effect of Horizontal Section Length
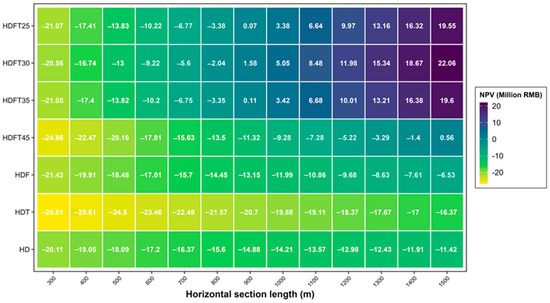
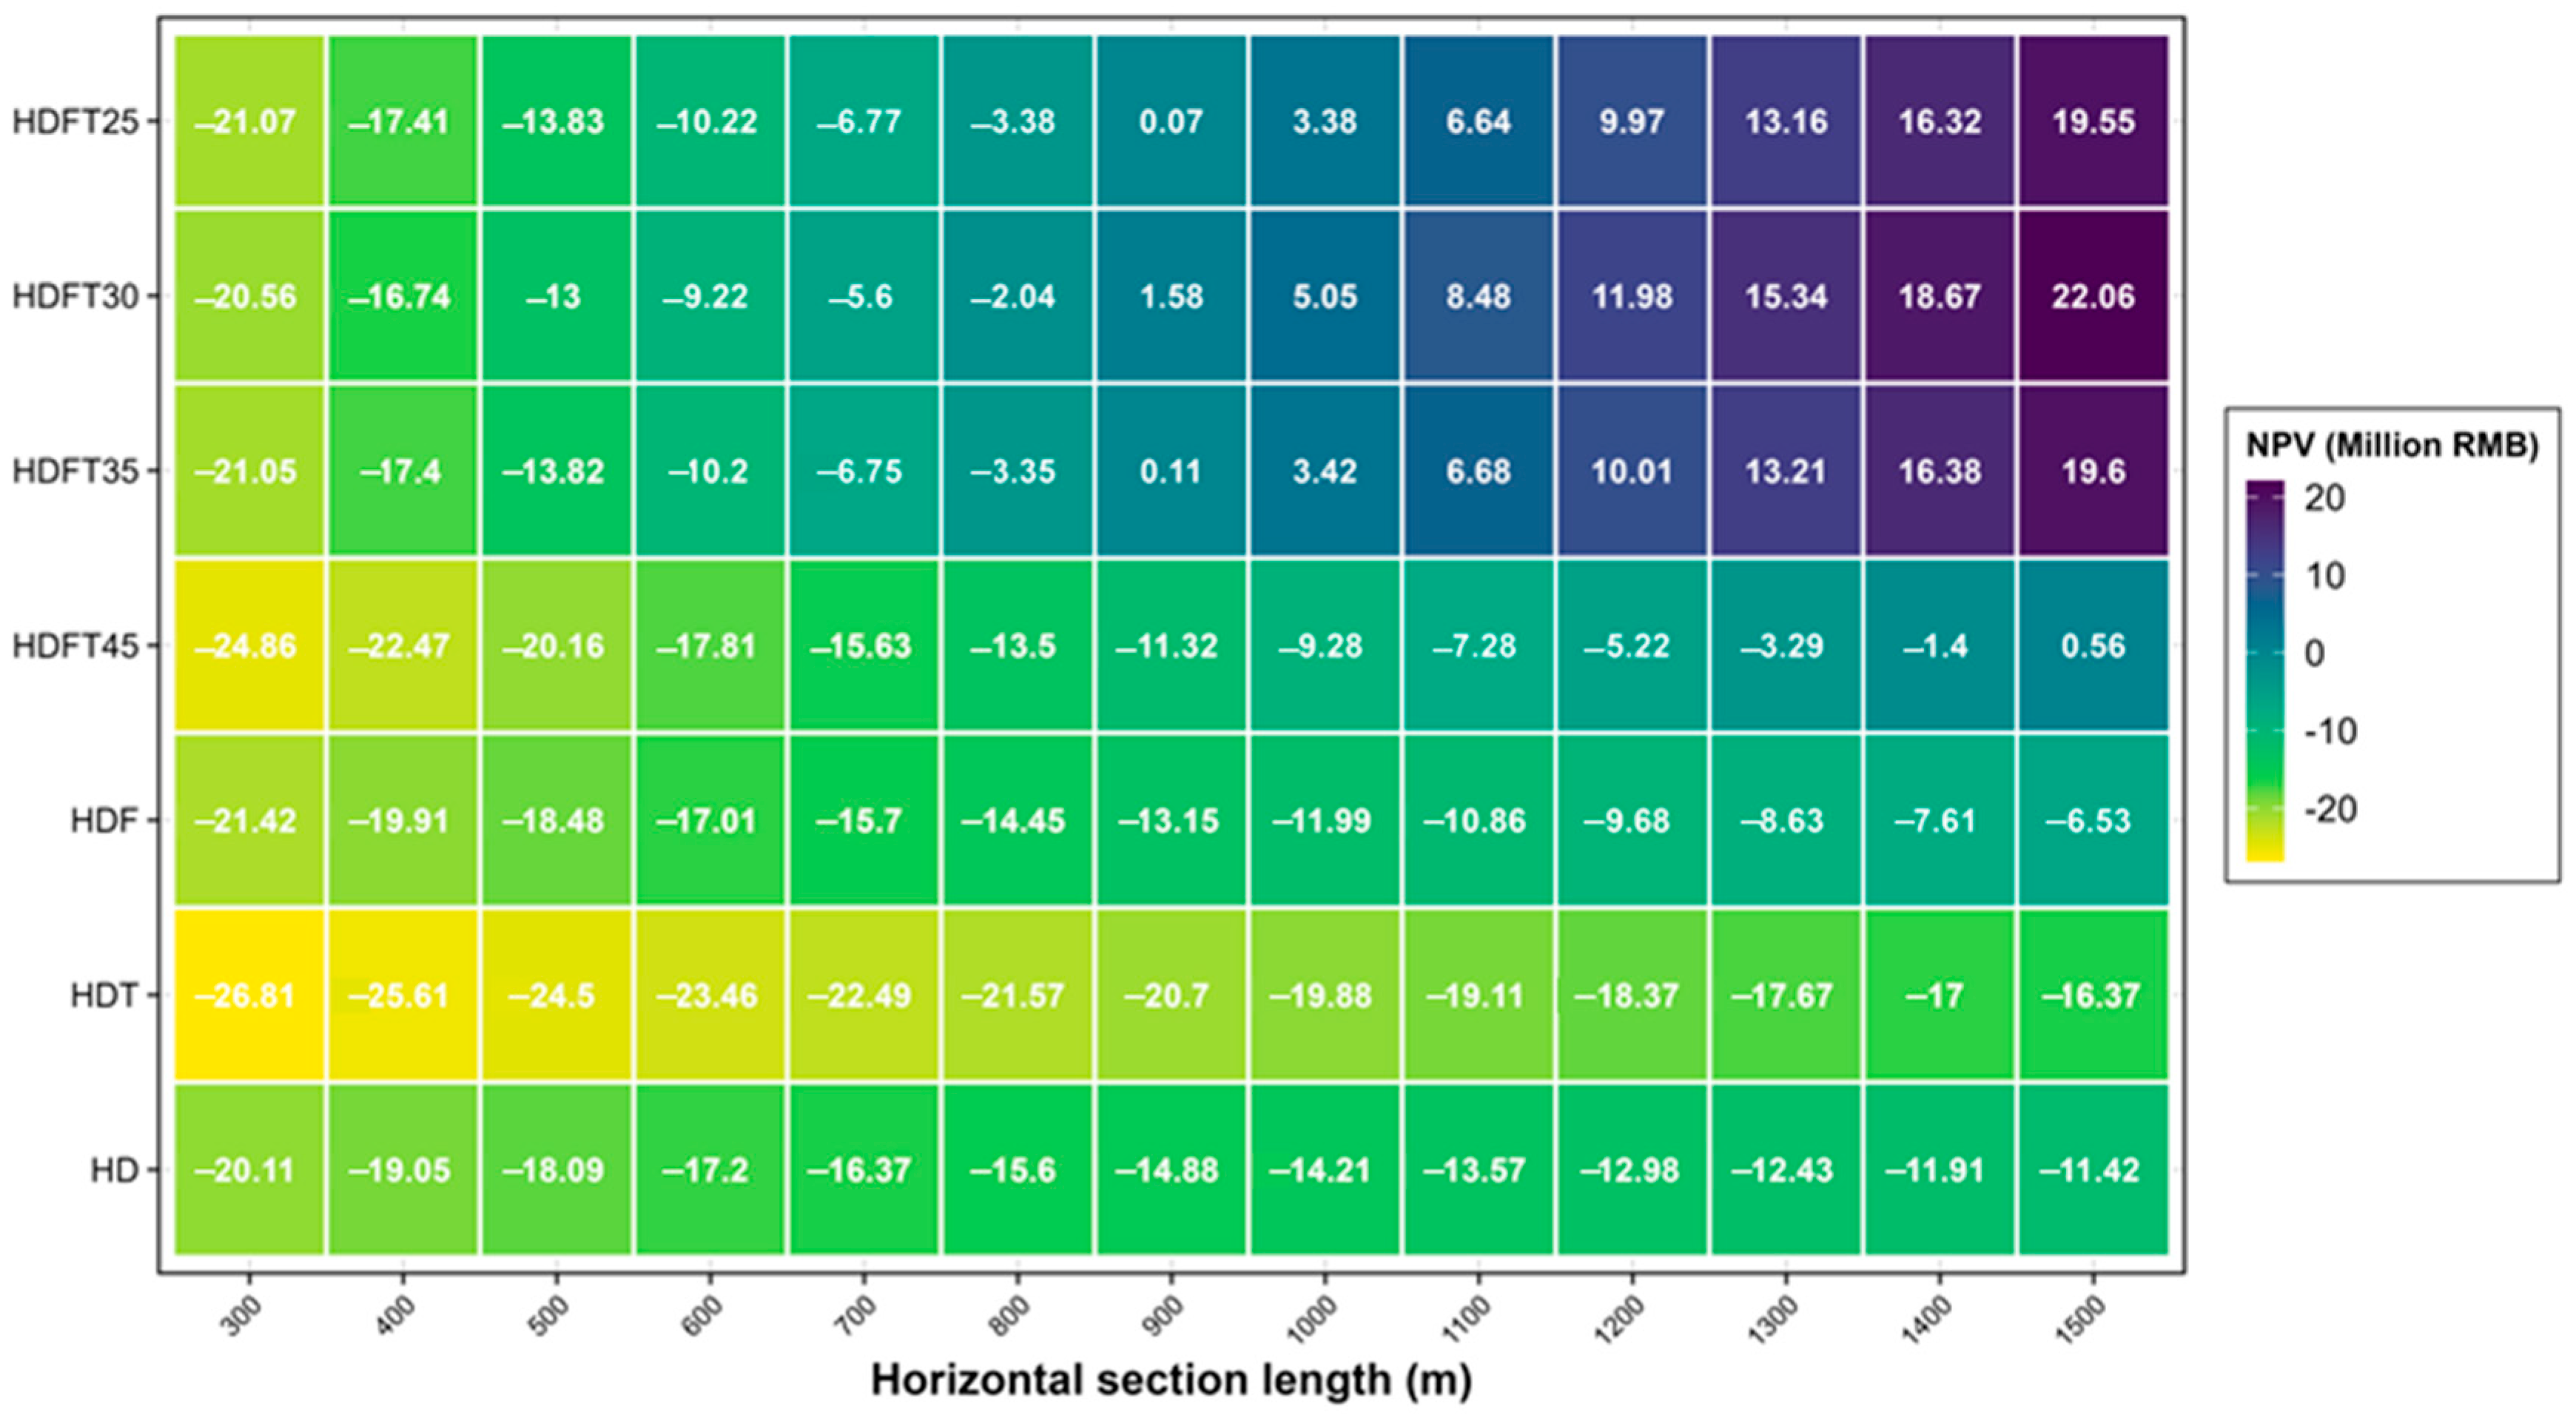
Figure 8 presents the NPV heat map for all cases under different horizontal section lengths. It can be observed that NPV increases with horizontal well length. This result aligns with previous findings that extending horizontal well length is essential for achieving commercial gas production rates [27]. For the HD, HDT, and HDF cases, even at L = 1500 m, NPV remains below −6 million RMB. For the HDFT cases, except for HDFT45, which approaches break-even only at 1500 m, the other schemes achieve break-even at 900 m and reach NPVs of 19.55–22.06 million RMB at 1500 m, demonstrating that the influence of horizontal section length on the economic performance of HDFT is far greater than for other plans. Overall, it is recommended that horizontal section length ≥ 1200 m and injection temperature ≤ 35 °C to fully realize the scale benefits.
Figure 8.
NPV heat map for all cases under various horizontal section lengths.
3.4. The Effect of Heat Cost
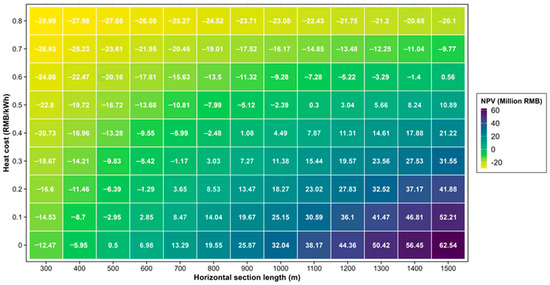
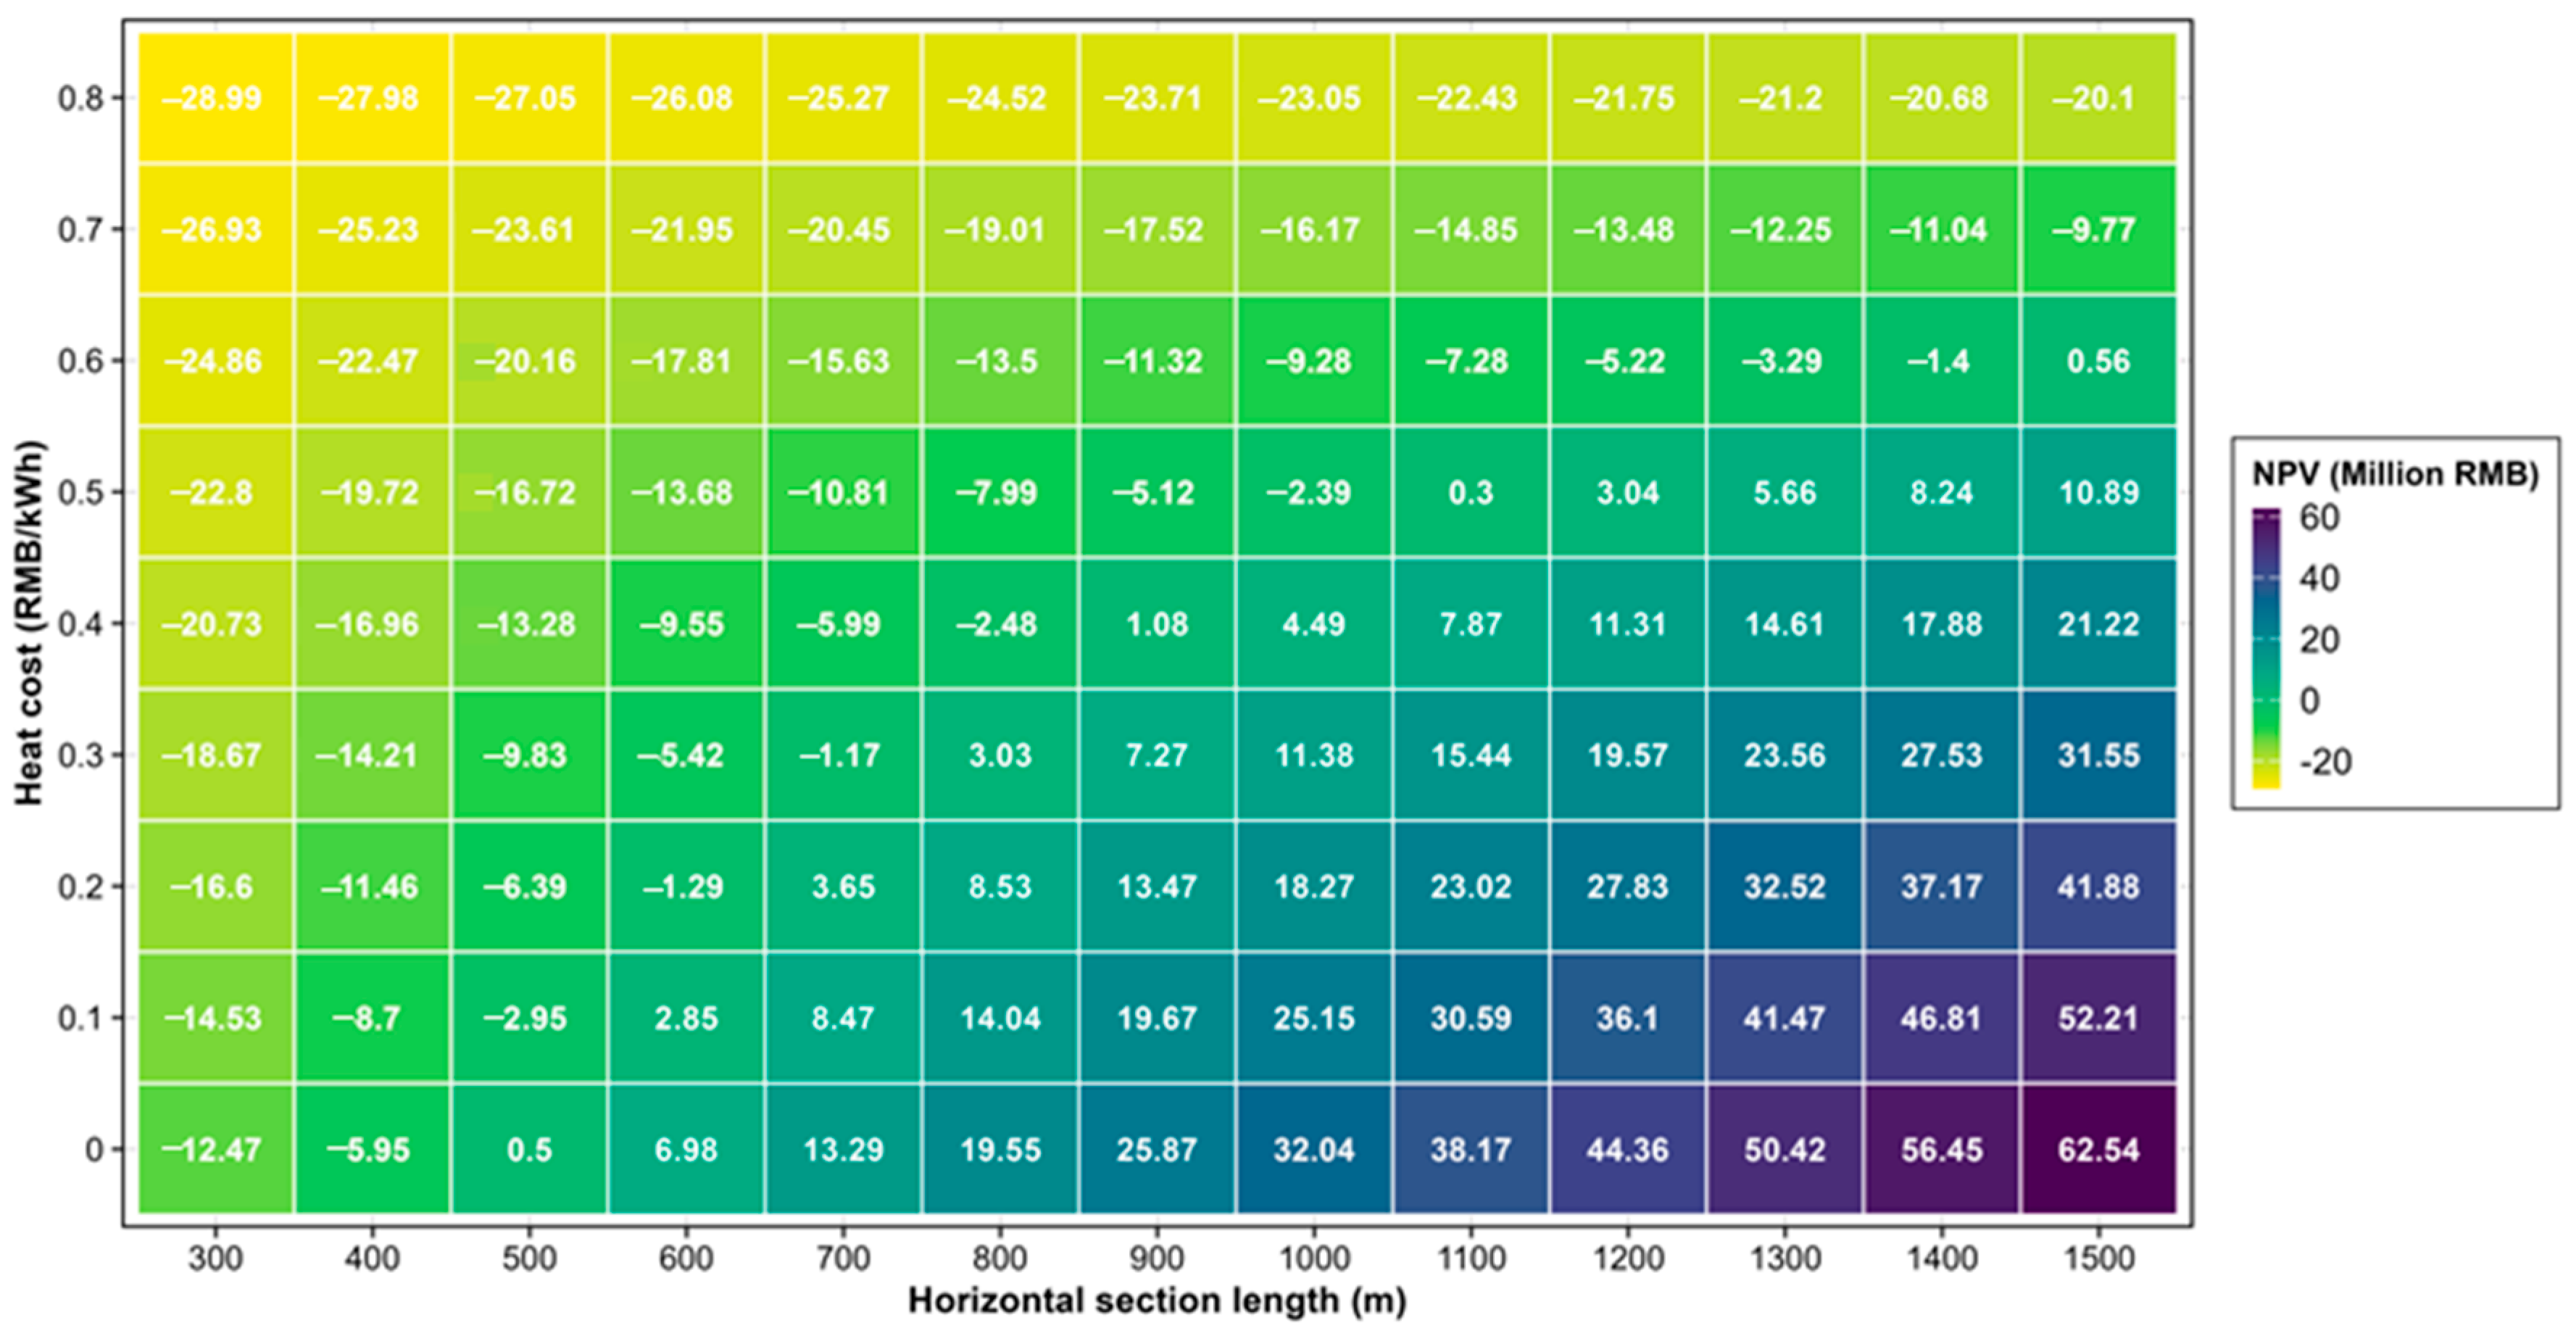
Figure 9 presents the NPV heat map for HDFT45 under various horizontal section lengths and heat source costs. It can be observed that NPV increases significantly with decreasing heat source cost and increasing horizontal section length. Specifically, as heat source cost decreases from 0.8 to 0 RMB/kWh and horizontal section length increases from 300 to 1500 m, the NPV increases from −28.99 to 62.54 million RMB. When an economical heat source is available (0.2 RMB/kWh), profitability can be achieved at a horizontal section length of 700 m, substantially reducing engineering difficulty. However, with electric heating (0.8 RMB/kWh), even at 1500 m, the project remains unprofitable. Therefore, reducing heat source cost is critical for economic development.
Figure 9.
NPV heat map for HDFT45 under various horizontal section lengths and heat source costs.
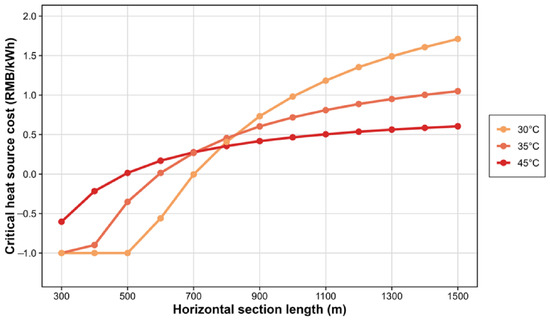
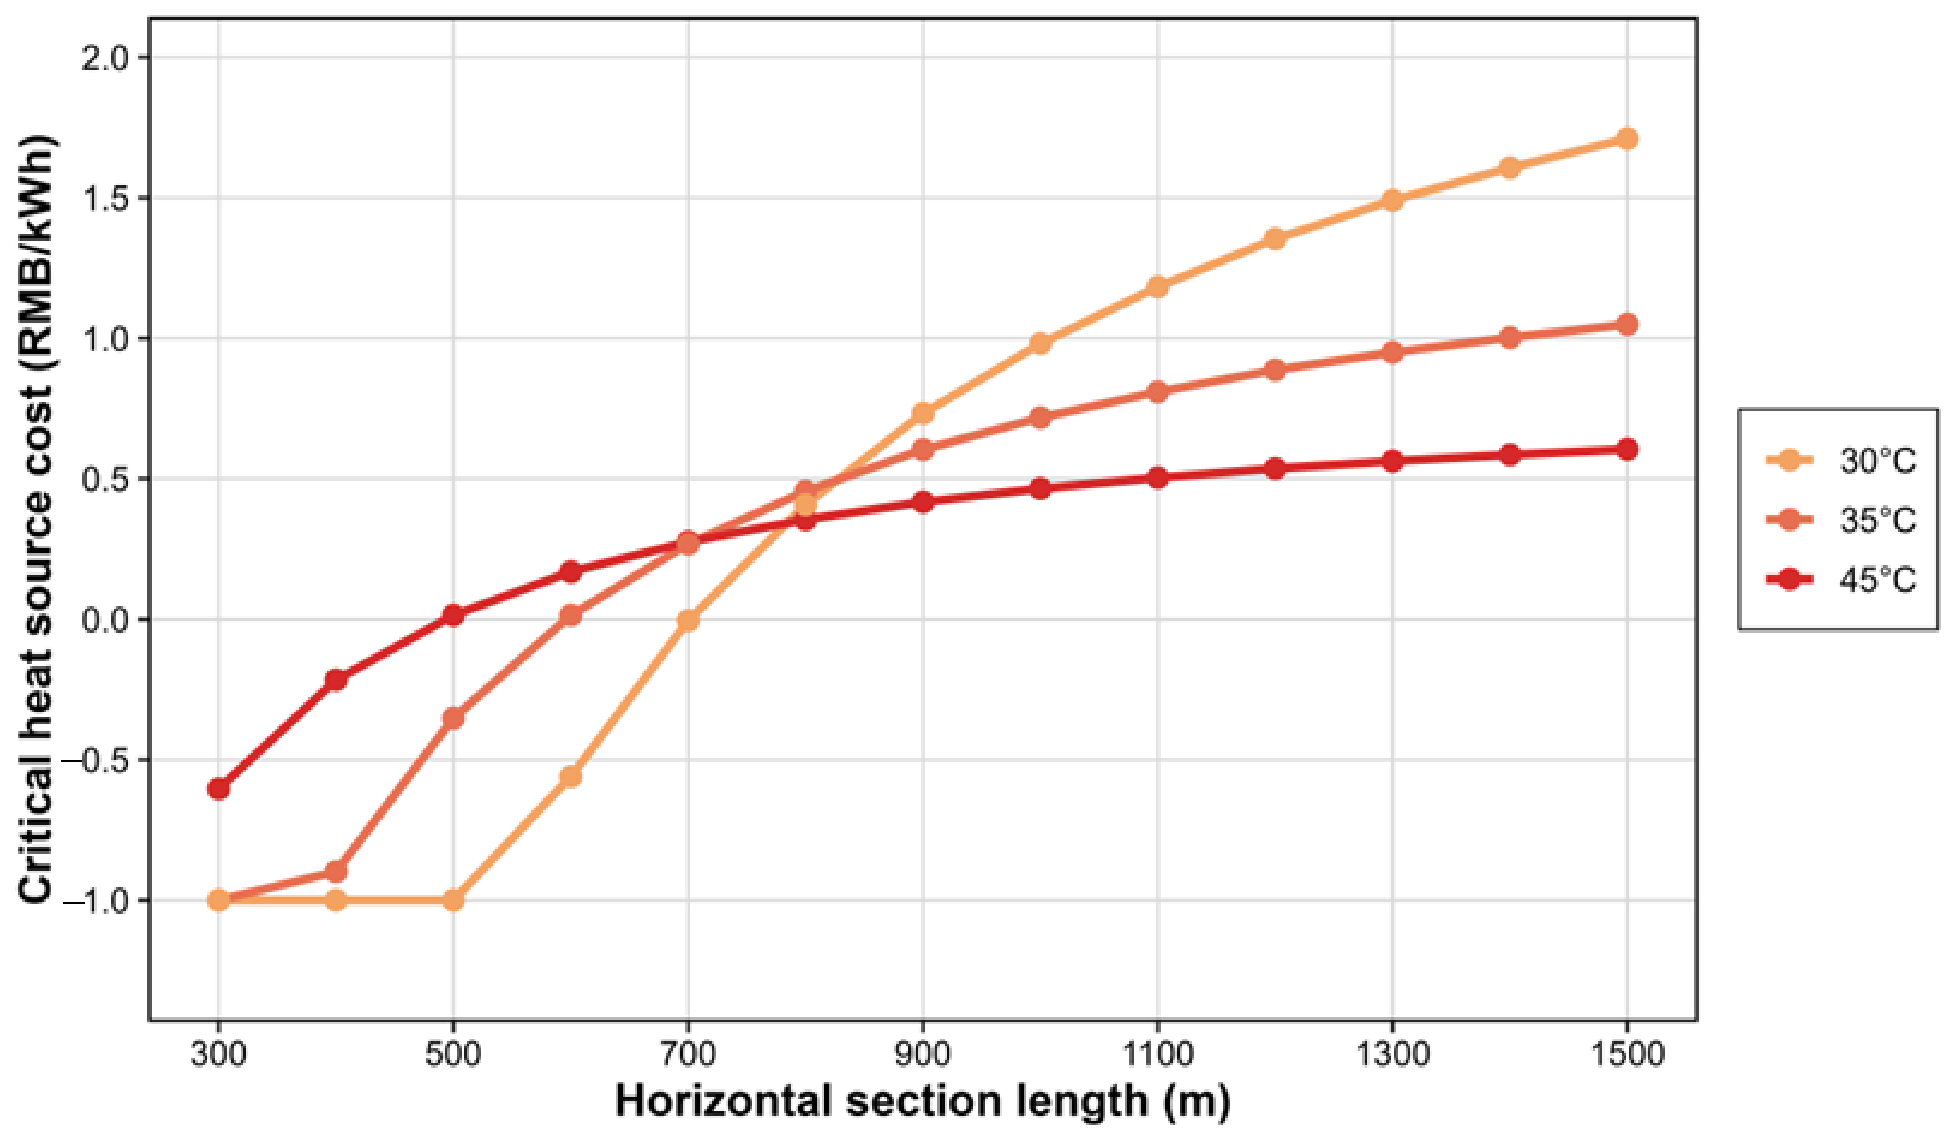
Figure 10 presents the critical heat source cost at various horizontal section lengths. It can be observed that the critical heat source cost increases with horizontal section length, indicating that thermal injection becomes more feasible with longer horizontal sections. Furthermore, beyond 800 m, the critical heat source cost decreases with increasing injection temperature—for instance, at 1300 m it decreases from 1.48 to 0.54 RMB/kWh—indicating that low-temperature thermal stimulation offers higher economic feasibility. Electric heating becomes viable when injection temperature is below 35 °C with L > 1200 m, or when injection temperature is below 30 °C with L > 1000 m. In the absence of economical heat sources, direct warm seawater injection (heat source cost approaching zero) is recommended, with horizontal section length controlled above 1000 m.
Figure 10.
Critical heat source cost at various horizontal section lengths. Notably, negative values indicate that the case is economically unviable even when the heat source is free (i.e., NPV remains negative at zero heat source cost). Positive values represent the maximum affordable heat source cost for break-even operation (i.e., the heat source cost at which NPV = 0).
The above analysis reveals a key trade-off: horizontal section length and injection temperature can substitute for each other. At L = 1300 m, the critical heat source cost for 45 °C injection is 0.54 RMB/kWh, while for 30 °C injection it is 1.48 RMB/kWh. This implies that in the absence of low-cost heat sources, the deficiency can be compensated by extending horizontal section length or reducing injection temperature. The practical implication for the Shenhu Area is that if geothermal or industrial waste heat is unavailable, the strategy of “long horizontal section (>1200 m) + low-temperature thermal injection (25–35 °C)” should be prioritized over short-section high-temperature injection. Notably, the break-even lengths reported in this section (700 m, 1000 m, and 1200 m) are derived from the proportional scaling of unit-fracture-stage simulation results based on the number of fracture stages corresponding to each horizontal length. While this scaling approach is widely adopted in hydrate reservoir simulations where field data for different horizontal lengths are not available, the resulting thresholds should be interpreted as indicative values for engineering decision support rather than as precise field specifications.
3.5. Multi-Parameter Sensitivity Ranking
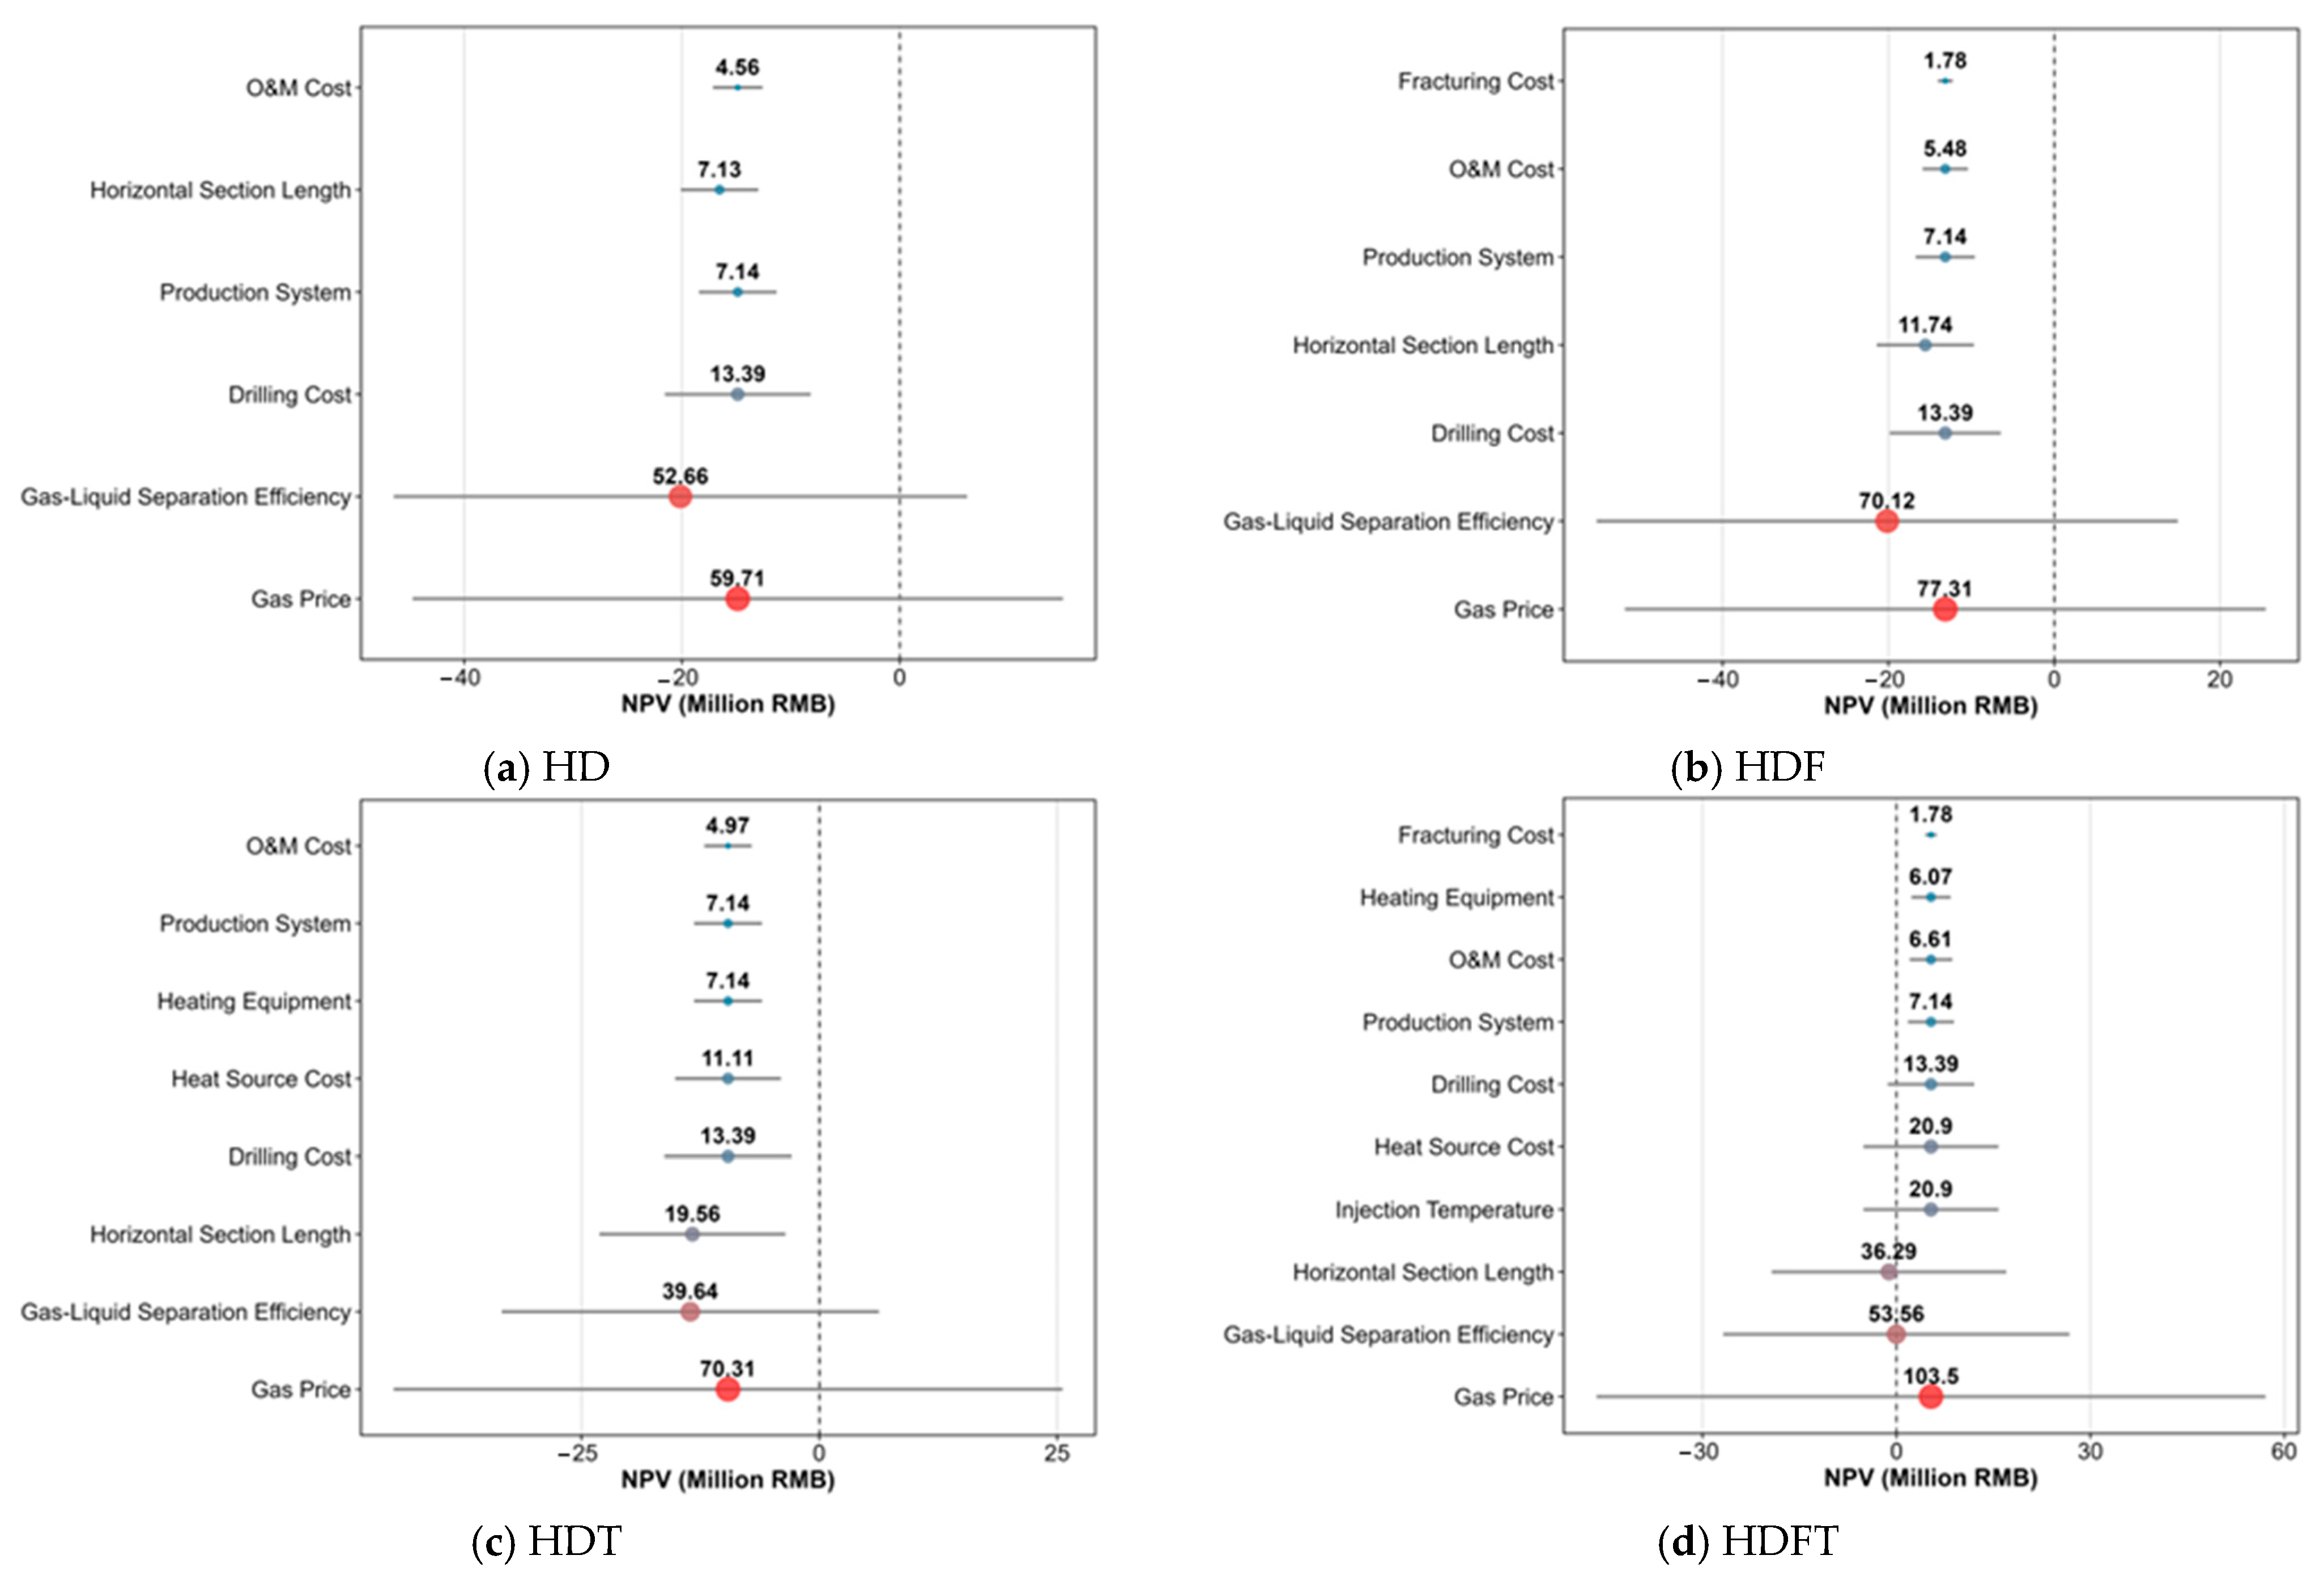
Figure 11 shows the parameter influence ranking based on sensitivity analysis. It can be found that gas price is the most critical factor affecting NPV across all cases (variation range: 59.71–103.5 million RMB). This finding is consistent with the observations of Ref. [31]. Downhole gas–liquid separation efficiency ranks second, with an impact range of 39.64–70.12 million RMB. Horizontal section length has a relatively minor impact on NPV in the HD and HDF (7.13–11.74 million RMB), but its impact in HDT and HDFT (19.56–36.29 million RMB) ranks third. Additionally, heat source cost also exerts a non-negligible influence in HDT and HDFT (11.11–20.9 million RMB).
Figure 11.
Parameter influencing ranking based on sensitivity analysis.
The dominant influence of gas price indicates that the economic viability of hydrate development is inherently constrained by natural gas market conditions. Every 1 RMB/m3 change in gas price alters NPV by approximately 20 million RMB. This implies that during periods of low gas prices (<2.5 RMB/m3), even the optimal technology may fail to achieve profitability; during high-gas-price periods (>4 RMB/m3), multiple schemes may become profitable. The high sensitivity of gas–liquid separation efficiency suggests that water treatment technology may be the most influential engineering variable after market factors. Therefore, future hydrate development must not only achieve breakthroughs in drilling, fracturing, and injection-production technologies but also fully account for market risks. Synergistic development with geothermal resources or deep gas resources is also worth exploring. Under conditions where both technology and market are suboptimal, direct warm seawater injection (heat cost approaching zero) combined with long horizontal section design may represent the most robust initial strategy.
4. Conclusions
This work evaluated the economic feasibility of Shenhu hydrate development under reservoir stimulation. The main conclusions are as follows:
- (1)
- Fracturing and thermal co-stimulation are effective in enhancing productivity, but their economic viability depends critically on both the heat source cost and the injection temperature. HDFT45 achieves the highest gas production (7.92 × 10⁴ m3) yet yields a negative NPV due to excessive heating costs. Additionally, reducing the injection temperature to 35 °C can turn NPV positive, demonstrating that the physical stimulation effect of hot-water injection does not automatically translate into economic benefit, and an optimal temperature range of approximately 25–35 °C exists where productivity gain and energy cost are best balanced.
- (2)
- Lifting cost and heating cost constitute the primary economic burdens in hydrate development. Lifting cost accounts for 39–85% of total costs across all schemes, reaching 83–85% in non-thermal schemes. The heating cost share increases with injection temperature from 9.1% (HDFT25) to 41.5% (HDFT45). Combined energy costs exceed 70% of total costs in HDFT45, indicating that the economic viability of hydrate development is governed by two major energy expenditures. Thus, reducing water production and lowering heat source cost are the two core directions for improving economic performance.
- (3)
- Gas price is the most sensitive economic factor, with a variation range of 59.71–103.5 million RMB, followed by gas–liquid separation efficiency (39.64–70.12 million RMB). Horizontal section length exerts a significant influence on thermal injection cases (19.56–36.29 million RMB), ranking third. This sensitivity hierarchy implies that under low-gas-price conditions, even optimal stimulation technologies may fail to achieve profitability. Hence, priority should be given to securing favorable gas price mechanisms and advancing downhole gas–liquid separation technologies.
- (4)
- Long horizontal wells and low-cost heat sources are key to the profitability of fracturing and thermal co-stimulation. The recommended engineering portfolio is: horizontal section length ≥ 1200 m, injection temperature ≤ 35 °C. With low-cost heat sources (≤0.2 RMB/kWh), profitability can be achieved at a horizontal section length of 700 m. Priority should be given to utilizing geothermal or industrial waste heat. If directly injecting warm seawater, the horizontal section length should be ≥1000 m.
This study provides an economic perspective on the feasibility of co-stimulation technologies for hydrate development. Nevertheless, several limitations should be acknowledged. The production data were derived from relatively idealized numerical simulations that did not fully capture reservoir heterogeneity and engineering uncertainties. While a commodity rate of 0.98 was adopted to account for overall gas losses, gas carryover during gas–liquid separation was not explicitly modeled—a factor that would slightly reduce absolute NPVs without affecting the relative ranking of the schemes. The economic evaluation did not incorporate environmental externality costs (e.g., seafloor subsidence, methane leakage), the economies of scale associated with multi-well development, or the cost of produced water disposal (reinjection or discharge), as reliable data for NGH production operations remain limited. As a result, future research should refine the model based on field production test data and extend it to an integrated technical–productivity–economic–environmental assessment framework.
Author Contributions
Conceptualization, S.N.; Methodology, K.L.; Software, S.N. and X.Z.; Formal analysis, D.P.; Investigation, Y.F.; Data curation, Y.F.; Writing—original draft, K.L.; Funding acquisition, D.P. All authors have read and agreed to the published version of the manuscript.
Funding
This research was funded by National Natural Science Foundation of China, grant number 42562030.
Data Availability Statement
Data is contained within the article.
Conflicts of Interest
The authors declare no conflicts of interest.
References
- Soloviev, V.; Ginsburg, G.D. Formation of submarine gas hydrates. Bull. Geol. Soc. Den. 1994, 41, 86–94. [Google Scholar] [CrossRef] [Scilit]
- Kvenvolden, K.A. Methane hydrate—A major reservoir of carbon in the shallow geosphere? Chem. Geol. 1988, 71, 41–51. [Google Scholar] [CrossRef] [Scilit]
- Klauda, J.B.; Sandler, S.I. Global Distribution of Methane Hydrate in Ocean Sediment. Energy Fuels 2005, 19, 459–470. [Google Scholar] [CrossRef] [Scilit]
- Chong, Z.R.; Yang, S.H.B.; Babu, P.; Linga, P.; Li, X.-S. Review of natural gas hydrates as an energy resource: Prospects and challenges. Appl. Energy 2016, 162, 1633–1652. [Google Scholar] [CrossRef] [Scilit]
- Lu, H.; Hong, C.; Fang, C.; Liao, Z. Mineralogy of the Sediments from Gas-hydrate Drilling Sites, Shenhu Area, South China Sea. Geol. Res. S. China Sea 2009, 20, 28–39. [Google Scholar]
- Sun, X.; Luo, H.; Luo, T.; Song, Y.; Li, Y. Numerical study of gas production from marine hydrate formations considering soil compression and hydrate dissociation due to depressurization. Mar. Pet. Geol. 2019, 102, 759–774. [Google Scholar] [CrossRef] [Scilit]
- Wei, J.; Yang, L.; Liang, Q.; Liang, J.; Lu, J.; Zhang, W.; Zhang, X.; Lu, X. Geomechanical properties of gas hydrate-bearing sediments in Shenhu Area of the South China Sea. Energy Rep. 2021, 7, 8013–8020. [Google Scholar] [CrossRef] [Scilit]
- Li, B.; Liang, Y.; Li, X.; Zhou, L. A pilot-scale study of gas production from hydrate deposits with two-spot horizontal well system. Appl. Energy 2016, 176, 12–21. [Google Scholar] [CrossRef] [Scilit]
- Feng, Y.; Chen, L.; Suzuki, A.; Kogawa, T.; Okajima, J.; Komiya, A.; Maruyama, S. Numerical analysis of gas production from layered methane hydrate reservoirs by depressurization. Energy 2019, 166, 1106–1119. [Google Scholar] [CrossRef] [Scilit]
- Ye, J.; Qin, X.; Xie, W.; Lu, H.; Ma, B.; Qiu, H.; Liang, J.; Lu, J.; Kuang, Z.; Lu, C.; et al. The second natural gas hydrate production test in the South China Sea. China Geol. 2020, 3, 197–209. [Google Scholar] [CrossRef] [Scilit]
- Li, B.; Liu, S.; Liang, Y.; Liu, H. The use of electrical heating for the enhancement of gas recovery from methane hydrate in porous media. Appl. Energy 2018, 227, 694–702. [Google Scholar] [CrossRef] [Scilit]
- Liang, Y.; Liu, S.; Wan, Q.; Li, B.; Liu, H.; Han, X. Comparison and Optimization of Methane Hydrate Production Process Using Different Methods in a Single Vertical Well. Energies 2019, 12, 124. [Google Scholar] [CrossRef] [Scilit]
- Wan, Q.; Si, H.; Li, B.; Li, G. Heat transfer analysis of methane hydrate dissociation by depressurization and thermal stimulation. Int. J. Heat Mass Transf. 2018, 127, 206–217. [Google Scholar] [CrossRef] [Scilit]
- Liang, D.; He, S.; Li, D. Effect of microwave on formation/decomposition of natural gas hydrate. Sci. Bull. 2009, 54, 965–971. [Google Scholar] [CrossRef] [Scilit]
- Li, X.; Xu, C.; Zhang, Y.; Ruan, X.; Li, G.; Wang, Y. Investigation into gas production from natural gas hydrate: A review. Appl. Energy 2016, 172, 286–322. [Google Scholar] [CrossRef] [Scilit]
- Lee, J. Experimental Study on the Dissociation Behavior and Productivity of Gas Hydrate by Brine Injection Scheme in Porous Rock. Energy Fuels 2010, 24, 456–463. [Google Scholar] [CrossRef] [Scilit]
- Ma, X.; Sun, Y.; Liu, B.; Guo, W.; Jia, R.; Li, B.; Li, S. Numerical study of depressurization and hot water injection for gas hydrate production in China’s first offshore test site. J. Nat. Gas Sci. Eng. 2020, 83, 103530. [Google Scholar] [CrossRef] [Scilit]
- Zhong, X.; Pan, D.; Zhai, L.; Zhu, Y.; Zhang, H.; Zhang, Y.; Wang, Y.; Li, X.; Chen, C. Evaluation of the gas production enhancement effect of hydraulic fracturing on combining depressurization with thermal stimulation from challenging ocean hydrate reservoirs. J. Nat. Gas Sci. Eng. 2020, 83, 103621. [Google Scholar] [CrossRef] [Scilit]
- Ning, F.; Chen, Q.; Sun, J.; Wu, X.; Cui, G.; Mao, P.; Li, Y.; Liu, T.; Jiang, G.; Wu, N. Enhanced gas production of silty clay hydrate reservoirs using multilateral wells and reservoir reformation techniques: Numerical simulations. Energy 2022, 254, 124220. [Google Scholar] [CrossRef] [Scilit]
- Nie, S.; Li, J.; Liu, K.; Zhong, X.; Wang, Y. Numerical Evaluation of Commingled Production Potential of Marine Multilayered Gas Hydrate Reservoirs Using Fractured Horizontal Wells and Thermal Fluid Injection. J. Mar. Sci. Eng. 2024, 12, 365. [Google Scholar] [CrossRef] [Scilit]
- Li, H.; Zheng, L.; Nie, S.; Zhong, X.; Guo, Q.; Gan, M.; Liu, K. Development Efficiency Assessment of Challenging Hydrates Under Reservoir Fracturing and Thermal Stimulation Using an XGBoost-SHAP Framework. J. Mar. Sci. Eng. 2026, 14, 778. [Google Scholar] [CrossRef] [Scilit]
- Ito, T.; Igarashi, A.; Suzuki, K.; Nagakubo, S.; Matsuzawa, M.; Yamamoto, K. Laboratory Study of Hydraulic Fracturing Behavior in Unconsolidated Sands for Methane Hydrate Production. In Proceedings of the Offshore Technology Conference, Houston, TX, USA, 5–8 May 2008. [Google Scholar]
- Konno, Y.; Jin, Y.; Yoneda, J.; Uchiumi, T.; Shinjou, K.; Nagao, J. Hydraulic fracturing in methane-hydrate-bearing sand. RSC Adv. 2016, 6, 73148–73155. [Google Scholar] [CrossRef] [Scilit]
- Nie, S.; Zhong, X.; Song, J.; Tu, G.; Chen, C. Experimental study on hydraulic fracturing in clayey-silty hydrate-bearing sediments and fracability evaluation based on multilayer perceptron-analytic hierarchy process. J. Nat. Gas Sci. Eng. 2022, 106, 104735. [Google Scholar] [CrossRef] [Scilit]
- Nie, S.; Liu, K.; Zhong, X.; Wang, Y.; Yang, B.; Song, J. Research on Hydraulic Fracture Propagation Patterns in Multilayered Gas Hydrate Reservoirs Using a Three-Dimensional XFEM-Based Cohesive Zone Method. Energy Fuels 2024, 38, 5106–5123. [Google Scholar] [CrossRef] [Scilit]
- Ju, X.; Liu, F.; Fu, P.; White, M.D.; Settgast, R.R.; Morris, J.P. Gas Production from Hot Water Circulation through Hydraulic Fractures in Methane Hydrate-Bearing Sediments: THC-Coupled Simulation of Production Mechanisms. Energy Fuels 2020, 34, 4448–4465. [Google Scholar] [CrossRef] [Scilit]
- Zhong, X.; Pan, D.; Zhu, Y.; Wang, Y.; Tu, G.; Nie, S.; Ma, Y.; Liu, K.; Chen, C. Commercial production potential evaluation of injection-production mode for CH-Bk hydrate reservoir and investigation of its stimulated potential by fracture network. Energy 2022, 239, 122113. [Google Scholar] [CrossRef] [Scilit]
- Bazaluk, O.; Sai, K.; Lozynskyi, V.; Petlovanyi, M.; Saik, P. Research into Dissociation Zones of Gas Hydrate Deposits with a Heterogeneous Structure in the Black Sea. Energies 2021, 14, 1345. [Google Scholar] [CrossRef] [Scilit]
- Yu, T.; Guan, G.; Abudula, A. Production performance and numerical investigation of the 2017 offshore methane hydrate production test in the Nankai Trough of Japan. Appl. Energy 2019, 251, 113338. [Google Scholar] [CrossRef] [Scilit]
- Li, Z. Basic Theory and Technology of Waterflooding Oilfield Development; Science Press: Beijing, China, 2019; pp. 68–70. [Google Scholar]
- Walsh, M.R.; Hancock, S.H.; Wilson, S.J.; Patil, S.L.; Moridis, G.J.; Boswell, R.; Collett, T.S.; Koh, C.A.; Sloan, E.D. Preliminary report on the commercial viability of gas production from natural gas hydrates. Energy Econ. 2009, 31, 815–823. [Google Scholar] [CrossRef] [Scilit]
- Consortium, M.R. 2017. Available online: http://www.mh21japan.gr.jp/mh21wp/wp-content/uploads/mh21form2017_doc01.pdf (accessed on 18 May 2026).
- Kong, Z.; Jiang, Q.; Dong, X.; Wang, J.; Wan, X. Estimation of China’s production efficiency of natural gas hydrates in the South China Sea. J. Clean. Prod. 2018, 203, 1–12. [Google Scholar] [CrossRef] [Scilit]
- Deepak, M.; Kumar, P.; Singh, K.; Yadav, U.S. Techno-economic forecasting of a hypothetical gas hydrate field in the offshore of India. Mar. Pet. Geol. 2019, 108, 741–746. [Google Scholar] [CrossRef] [Scilit]
- Chen, X.; Lu, H.; Gu, L.; Shang, S.; Zhang, Y.; Huang, X.; Zhang, L. Preliminary evaluation of the economic potential of the technologies for gas hydrate exploitation. Energy 2022, 243, 123007. [Google Scholar] [CrossRef] [Scilit]
- Ning, F.; Liang, J.; Wu, N.; Zhu, Y.; Wu, S.; Liu, C.; Wei, C.; Wang, D.; Zhang, Z.; Xu, M. Reservoir characteristics of natural gas hydrates in China. Nat. Gas Ind. 2020, 40, 1–24. [Google Scholar] [CrossRef] [Scilit]
- Qin, X.-W.; Lu, J.-A.; Lu, H.-L.; Qiu, H.-J.; Liang, J.-Q.; Kang, D.-J.; Zhan, L.-S.; Lu, H.-F.; Kuang, Z.-G. Coexistence of natural gas hydrate, free gas and water in the gas hydrate system in the Shenhu Area, South China Sea. China Geol. 2020, 3, 210–220. [Google Scholar] [CrossRef] [Scilit]
- Moridis, G.; Kowalsky, M.; Pruess, K. TOUGH + Hydrate V1.0 User’s Manual; Report LBNL-0149E; Lawrence Berkeley National Laboratory: Berkeley, CA, USA, 2008. [Google Scholar]
- Moridis, G.J.; Collett, T.S. Strategies for Gas Production from Hydrate Accumulations Under Various Geological and Reservoir Conditions; Report LBNL-52568; Lawrence Berkeley National Laboratory: Berkeley, CA, USA, 2002. [Google Scholar]
- Ma, X.; Sun, Y.; Guo, W.; Jia, R.; Li, B. Numerical simulation of horizontal well hydraulic fracturing technology for gas production from hydrate reservoir. Appl. Ocean Res. 2021, 112, 102674. [Google Scholar] [CrossRef] [Scilit]
- Nie, S.; Liu, K.; Xu, K.; Zhong, X.; Tang, S.; Song, J.; Zhang, H.; Li, J.; Wang, Y. Numerical study on the stimulation effect of boundary sealing and hot water injection in marine challenging gas hydrate extraction. Sci. Rep. 2024, 14, 15280. [Google Scholar] [CrossRef] [Scilit] [PubMed]
- Moridis, G.J.; Sloan, E.D. Gas production potential of disperse low-saturation hydrate accumulations in oceanic sediments. Energy Convers. Manag. 2007, 48, 1834–1849. [Google Scholar] [CrossRef] [Scilit]

Disclaimer/Publisher’s Note: The statements, opinions and data contained in all publications are solely those of the individual author(s) and contributor(s) and not of MDPI and/or the editor(s). MDPI and/or the editor(s) disclaim responsibility for any injury to people or property resulting from any ideas, methods, instructions or products referred to in the content. |
© 2026 by the authors. Licensee MDPI, Basel, Switzerland. This article is an open access article distributed under the terms and conditions of the Creative Commons Attribution (CC BY) license.