


Abstract
Energy labeling converts otherwise difficult-to-observe product energy performance into standardized and comparable information, thereby reshaping market incentives for energy-efficient production; however, whether these incentives translate into more effective utilization of firms’ quasi-fixed productive capacity remains insufficiently understood. This study examines the impact of the China Energy Label (CEL) on firm-level capacity utilization using 41,106 firm-year observations for 3862 Chinese A-share listed firms from 2001 to 2024. Exploiting the staggered inclusion of product categories in the CEL catalogue, we estimate a multi-period difference-in-differences model with firm and year fixed effects, with capacity utilization (CU) measured using a stochastic frontier production function. We also conduct a battery of identification and robustness checks, including event-study tests, the Sun–Abraham estimator, and leave-one-batch-out analyses. The results show that CEL increases CU by approximately 1.2 percentage points under a specification that accounts for time-varying city- and industry-level shocks. The positive effect persists across a range of identification and robustness checks. Mechanism analyses provide suggestive evidence that CEL is positively associated with green managerial cognition, breakthrough innovation, and internationalization. These findings are consistent with these factors serving as potential channels through which CEL may improve CU. The effect is more pronounced among state-owned and loss-making firms. Overall, the findings indicate that energy labeling can improve production-side efficiency by promoting more effective use of firms’ existing productive capacity.
1. Introduction
Growing energy demand, tightening resource constraints, and mounting pressures to reduce emissions have made improvements in energy efficiency increasingly important for sustainable economic development [1,2]. This issue is particularly relevant in China, where energy demand is heavily concentrated in the industrial sector. Industry accounts for approximately 60% of the country’s electricity consumption, substantially higher than the OECD average of around 32%, and contributed nearly half of the increase in China’s electricity demand between 2022 and 2024. At the same time, the CU rate of China’s industrial enterprises above the designated size was 75.0% in 2024, with the manufacturing sector recording a similar rate of 75.2%. These patterns highlight the dual imperative of improving industrial energy efficiency and CU, making China a particularly relevant setting for examining how energy-efficiency improvements are associated with the use of existing productive capacity. As firms’ production decisions largely determine the energy performance of end-use products, enhancing energy efficiency at the firm level is critical for achieving more sustainable production. Information asymmetry is a key constraint. Energy-efficiency decisions can be hindered by imperfect information, consumers’ misperceptions of energy costs, and incentive problems [3,4]. Energy labeling provides a direct policy response to this information asymmetry by converting complex energy performance information into standardized, comparable signals. Ref. [5] shows that consumers respond to certification and detailed energy-efficiency information. Such demand-side responses may, in turn, strengthen market incentives for firms to supply and upgrade energy-efficient products. China subsequently established CEL to reduce information barriers surrounding product energy performance and promote energy-efficient production. Over time, the scheme has expanded substantially in both scope and market coverage. By 2024, CEL covered 44 product categories, involving more than 26,000 manufacturers and 3.65 million registered product models. This expansion has also been accompanied by sizeable energy-saving effects: official estimates indicate that CEL had contributed to cumulative electricity savings of more than 2.5 trillion kWh by 2021. These developments suggest that CEL has become more than a product-information instrument; it has evolved into an important mechanism shaping the market environment for energy-efficient production.
Environmental regulation can affect firms well beyond their immediate environmental objectives by reshaping technological choices, production decisions, and resource allocation. While regulatory requirements may impose compliance costs, appropriately designed environmental policies can also stimulate innovation and encourage efficiency improvements [6]. Ref. [7], using China’s 11th Five-Year Plan as a quasi-natural experiment, find that more stringent environmental regulation induces firms’ patenting activity. Environmental regulation can also influence productivity, although the effect varies with firms’ technological position and ability to adjust [8]. Ref. [9] show that environmental regulation can improve firms’ capacity utilization by promoting technological progress and alleviating market distortions, although higher production costs may weaken this effect. Using China’s emissions trading system as a policy setting, Ref. [10] likewise document a positive effect of environmental regulation on firms’ capacity utilization. These findings suggest that the effects of environmental regulation depend not only on regulatory stringency, but also on how policy requirements are transmitted into firms’ decisions. Energy labeling is particularly relevant because standardized energy-performance information makes efficiency more visible to consumers and translates it into market signals for producers. This mechanism distinguishes energy labeling from more direct forms of environmental regulation.
Energy labeling represents an important information-based policy instrument. By making energy performance more visible and comparable, energy labels reduce information barriers and help consumers incorporate future energy costs into product choices. Ref. [11] show experimentally that the information presented on energy-efficiency labels materially affects household energy-efficiency decisions, while Ref. [12] find that displaying future energy consumption in monetary rather than physical units increases consumers’ ability to identify appliances with lower lifetime costs. Related evidence from the refrigerator market also highlights the role of imperfect consumer valuation of future energy costs in energy-efficiency choices [13]. These information effects can generate corresponding incentives on the supply side. More generally, disclosure and certification can influence seller behavior as well as consumer choice [14]. In the Chinese context, Ref. [15] show that manufacturer compliance is central to the effective enforcement of appliance energy-efficiency standards and labeling programs. More directly, Ref. [16] find that China’s energy-efficiency labeling system promotes energy-saving technological innovation and redirects technological progress toward energy-efficient technologies. The firm-level consequences of labeling may also extend beyond innovation: Ref. [17] find that environmental labeling certification improves both firm performance and total factor productivity among Chinese listed manufacturing firms. Taken together, these studies suggest that labeling policies can affect not only consumer demand and product energy performance, but also firms’ technological and productive responses. However, while existing studies have documented the effects of energy labeling on market responses and firms’ strategic decisions, much less is known about its impact on firms’ internal production efficiency. Improving product energy efficiency may require adjustments in production processes, equipment use, and operational coordination, which can in turn affect the utilization of existing productive capacity. Yet, whether these production-side adjustments translate into higher capacity utilization remains largely unexplored. This gap motivates our focus on firm-level CU as a production-side outcome of energy labeling.
Against this background, this study exploits the staggered expansion of CEL across product categories to examine its effect on firm-level capacity utilization. Using firm-level panel data from 2001 to 2024, we estimate a multi-period difference-in-differences model. The results show that CEL significantly improves firm-level capacity utilization, with additional evidence consistent with green managerial cognition, breakthrough innovation, and internationalization as potential channels. The effect is stronger among state-owned and loss-making firms. This study makes three contributions. First, it extends the energy-labeling literature from consumer responses, product energy efficiency, and technological innovation to firm-level capacity utilization, thereby highlighting the production-side effects of energy-efficiency information policies. Second, it exploits the staggered expansion of the China Energy Label across product categories within a multi-period DID framework and measures firm-level capacity utilization using a stochastic frontier approach, enabling a more rigorous assessment of the policy effect. Third, it documents substantial heterogeneity in the effects of CEL across firms, providing evidence for more targeted energy-efficiency interventions and for incorporating capacity utilization into policy evaluation.
2. Conceptual Framework and Hypotheses
Energy efficiency is a technical attribute that is difficult for market participants to observe directly. The China Energy Label reduces this information friction by making product energy performance standardized, visible, and comparable. Once energy performance becomes more observable and comparable, consumers can more readily differentiate products according to their energy-efficiency attributes. Evidence from China shows that consumers respond to energy-efficiency grades and exhibit heterogeneous preferences for energy-efficient appliances [18]. Such consumer responses can strengthen the expected market return to energy-efficient products, and thereby increase firms’ incentives to expand the production of labeled products. However, firms’ productive capacity is relatively fixed in the short and medium run. Installed equipment, production lines, labor organization, and other capacity-related resources cannot be expanded immediately in response to increased market opportunities [19]. Under this constraint, firms are more likely to respond by raising the operating intensity of their existing productive capacity. This involves better production scheduling, fewer idle resources, and more efficient transformation of given inputs into effective output [20]. Since CU reflects the ratio of actual output to potential productive capacity, an increase in actual output under quasi-fixed capacity directly implies a higher level of CU. Therefore:
Hypothesis 1.
Exposure to CEL increases firms’ CU.
Green managerial cognition (GMC) represents a potential internal organizational channel through which CEL may affect firms’ CU. According to upper echelons theory, managers’ cognitive bases and value orientations shape firms’ strategic choices and organizational behavior [21]. Prior evidence shows that executives’ green cognition is positively associated with corporate green innovation [22], indicating that managerial environmental cognition can shape firms’ strategic and technological responses. More broadly, improved management practices and integrated manufacturing practices can enhance productivity and manufacturing performance [23,24]. We therefore argue that stronger GMC may facilitate the coordination and implementation of energy-related production activities, helping firms utilize existing productive capacity more effectively.
CEL strengthens such GMC by transforming energy-efficiency performance into a standardized, traceable, and compliance-related managerial concern. For firms whose major products are covered by CEL, compliance is not limited to attaching a label to the product. Rather, firms are required to ensure the accuracy of energy-efficiency information, complete product filing procedures, and assume responsibility for label-related information. To fulfill these requirements, managers must coordinate product design, testing, production, documentation, and quality-control processes so that the disclosed energy-efficiency information is consistent with actual production and testing outcomes. By embedding energy-efficiency compliance into routine production management, CEL increases managerial attention to green production issues, and thereby strengthens GMC. Therefore, we propose the following hypothesis:
Hypothesis 2.
CEL improves firms’ CU by strengthening GMC.
Breakthrough innovation (BI) represents a technological upgrading channel through which CEL improves firms’ CU. According to Schumpeterian models of innovation and creative destruction, technological innovation can displace existing technologies and generate new sources of productivity growth and competitive advantage [25]. Firms with stronger BI capabilities are more likely to develop technologies that depart from their existing technological trajectories [26]. These technologies can help firms upgrade core production processes and improve product energy-efficiency performance [27]. Energy-efficiency improvements may also generate operational benefits beyond direct energy savings by affecting production resources and multiple dimensions of shop-floor operational performance [28]. As a result, firms can generate more effective output from a given stock of quasi-fixed productive capacity, thereby improving CU. For products included in the CEL catalogue, energy-efficiency grades are not based on firms’ self-declaration, but must be determined according to mandatory standards and verified through testing. Therefore, achieving a compliant and competitive energy-efficiency grade requires firms to align product design, core components, process control, and testing outcomes with the required level of energy performance. When existing technologies are insufficient to meet these requirements, firms cannot rely only on routine compliance or minor operational adjustments. Prior evidence shows that the CEL system induces energy-saving technological innovation and directs technological progress toward energy-saving technologies [16]. Breakthrough innovation, meanwhile, is commonly associated with technological search that departs from familiar technological domains [29]. Therefore, we propose the following hypothesis:
Hypothesis 3.
CEL improves firms’ CU by promoting BI.
Internationalization depth reflects the intensity of a firm’s involvement in overseas markets, as captured by the relative importance of overseas business in its overall operations. Deeper international involvement can provide firms with a more sustained source of external demand and reduce their dependence on domestic market conditions alone. When overseas sales account for a larger and more persistent share of business activity, firms are better able to maintain a relatively stable flow of orders and organize production around a broader demand base. This can improve production planning, reduce interruptions caused by insufficient demand, and lower the incidence of idle equipment and other underutilized productive resources. More stable external demand may also facilitate more consistent production scheduling and input allocation, allowing firms to operate existing production lines at a higher and more continuous intensity. In this sense, deeper international market participation can contribute to higher CU by strengthening the scale and continuity of demand faced by the firm.
CEL may deepen firms’ international market involvement through both information and capability effects. First, CEL requires firms to disclose standardized and verifiable information on product energy performance, reducing the information asymmetry faced by overseas customers when evaluating product energy efficiency and firms’ ability to maintain consistent product quality. For firms already operating internationally, such standardized information disclosure can complement existing market certifications and improve the transparency of production and quality-management practices. Second, compliance with CEL requires firms to develop capabilities in energy-performance testing, quality control, documentation, and production management. These capabilities do not replace the energy-efficiency standards or certification requirements of destination countries, but they can improve firms’ ability to understand and adapt to such requirements and reduce the adjustment costs associated with serving overseas markets. Together, greater information transparency and stronger compliance capabilities can support repeated transactions, larger overseas sales, and more sustained participation in existing foreign markets, thereby increasing the relative importance of overseas business in firms’ overall operations and deepening internationalization.
Hypothesis 4.
CEL improves firms’ CU by increasing internationalization depth.
3. Research Design
3.1. Sample Selection and Data Sources
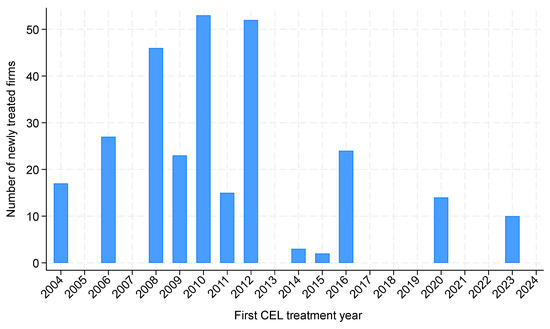
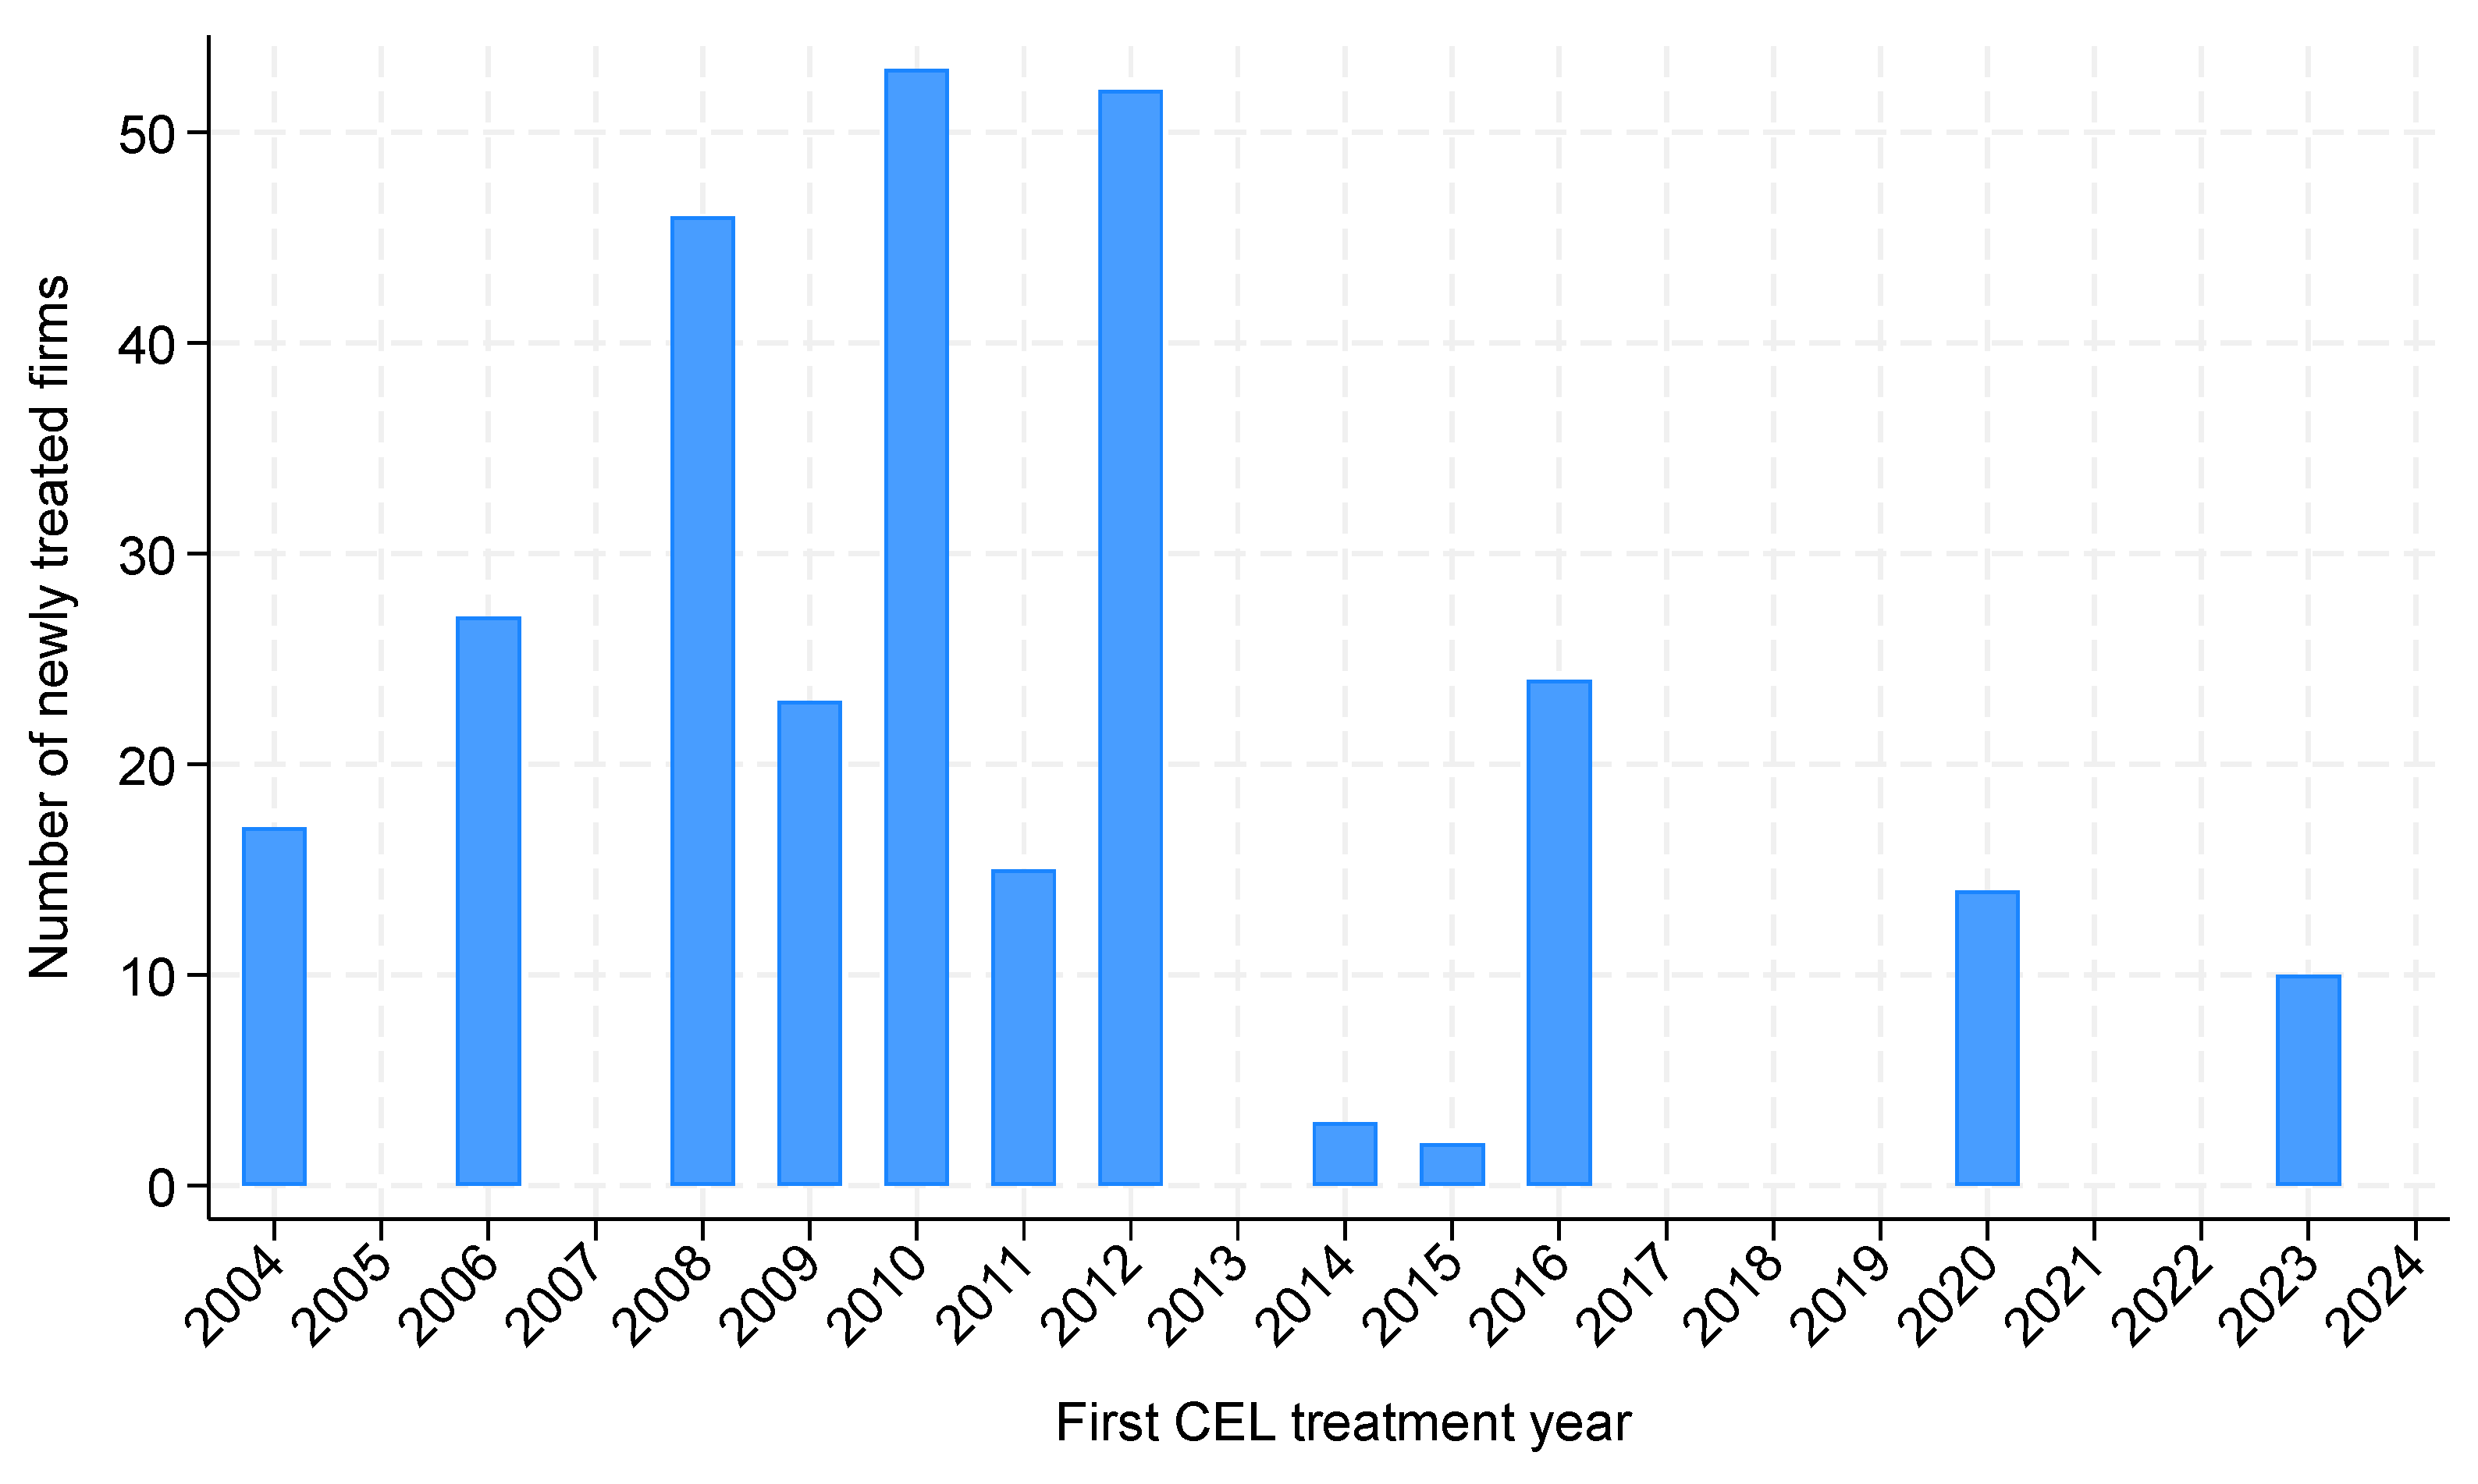
This study uses Shanghai- and Shenzhen-listed A-share firms from 2001 to 2024, with firm-level data obtained from the CSMAR database and annual reports. CEL follows a catalogue-based regulatory design in which product coverage is defined through official catalogues and implementation rules, targeting energy-using product categories with substantial energy-saving potential and widespread use. Importantly, CEL inclusion is not determined by firms’ existing energy-efficiency performance; rather, it follows product-category-level regulatory criteria. We collect 16 batches of CEL product-category inclusions from official policy documents and match the covered categories to firms’ major products to construct the firm-year treatment variable. A firm is treated from the first year in which at least one of its major products becomes subject to CEL. The binary treatment indicator captures whether a firm becomes exposed to CEL through at least one explicitly disclosed major product, rather than the share of its total output covered by the regulation. As a robustness check for heterogeneous exposure intensity, we construct a revenue-share-weighted CEL measure and report the results in Supplementary Table S7. To ensure data quality, the sample is processed as follows. First, firms under special treatment (ST or *ST) are excluded. Second, observations with missing or abnormal key financial indicators are removed. Third, all continuous variables are winsorized at the 1st and 99th percentiles to mitigate the influence of extreme observations. After applying the above sample construction procedure, the final sample comprises 3862 listed firms and 41,106 firm-year observations. Among these firms, 286 are ever exposed to CEL during the sample period, contributing 3148 firm-year observations in total. Figure 1 shows the number of firms newly affected by CEL in each year, confirming the staggered nature of firm-level policy exposure. The zero-treatment years shown in the figure arise for two reasons. In 2013, 2018–2019, and 2021–2022, no new CEL catalogue batch was introduced. In 2017, although a new batch was issued, the affected firms had already been treated because other major products in their portfolios had entered the CEL catalogue earlier. Supplementary S1 provides details on the CEL rollout, policy sources, treatment timing, and product-to-firm matching procedure.
Figure 1.
Distribution of firms by first year of CEL exposure.
3.2. Variable Measurement
3.2.1. Dependent Variable: Capacity Utilization
Capacity utilization generally refers to the ratio of actual output to potential production capacity at the firm or industry level. Following the stochastic frontier framework of Ref. [30] and its application to capacity measurement in Ref. [31], we estimate firm-level CU using a stochastic frontier production function and define CU as actual output relative to estimated frontier output. Since listed firms do not disclose gross industrial output, this study uses the main business revenue as a proxy. The stochastic production frontier is then constructed using firms’ main business revenue, total assets, and number of employees, from which the level of CU for listed firms is calculated. The three variables are logarithmically transformed and winsorized at the 1st and 99th percentiles before estimation.
Specifically, the baseline SFA is estimated as a pooled common frontier over the available firm-year observations. We estimate the following Cobb–Douglas stochastic production frontier:
Here, denotes the main business revenue of firm i in year t, denotes total assets, and denotes the number of employees. The composite disturbance consists of a symmetric random-noise component and a non-negative inefficiency component. Specifically,
And
where the two components are assumed to be independent. Thus, the composite error term is
Following estimation of the stochastic frontier, firm-year CU is obtained from the conditional technical-efficiency prediction:
The resulting CU measure lies between zero and one, with a value closer to one indicating that the firm operates closer to its estimated production frontier. To evaluate the adequacy of the stochastic-frontier specification, we report the estimated standard deviations = 0.535 and = 0.567, together with
as well as the log-likelihood and the likelihood-ratio test of H0: = 0 (LR statistic ≈ 460, p < 0.001), in Supplementary Table S2. The conventional firm-clustered standard errors in the baseline DID treat the estimated CU values as given, and therefore do not explicitly propagate uncertainty from the first-stage stochastic-frontier estimation. To address this issue, we implement a full two-stage firm-level cluster bootstrap with 500 replications. In each replication, firms are resampled with replacement, the stochastic frontier is re-estimated, firm-year CU is regenerated, and the baseline DID model is re-estimated. The resulting bootstrap standard error is 0.007, and the percentile-based 95% confidence interval is [0.004, 0.032]. The confidence interval remains entirely above zero, indicating that accounting for first-stage estimation uncertainty does not alter the statistical inference regarding the positive effect of CEL on CU. Detailed results are reported in Supplementary Table S3. A further concern is that firms subsequently exposed to CEL also enter the estimation sample used to locate the baseline stochastic frontier. If CEL-induced changes in treated firms’ output or technology affect the estimated frontier, the constructed CU measure could mechanically depend on treatment status. To examine this possibility, we re-estimate the stochastic frontier using only firms that are never exposed to CEL during the sample period, thereby preventing never-treated firms from determining the location of the alternative frontier. We then use this alternative frontier to reconstruct firm-year CU and re-estimate the baseline DID specification. The resulting CEL coefficient is 0.023, with a firm-clustered standard error of 0.008 and a p-value of 0.004. The alternative estimate remains positive and statistically significant, with a magnitude broadly comparable to the baseline estimate of 0.018. Thus, excluding never-treated firms from the frontier-estimation sample does not alter the statistical inference, and suggests that the positive association between CEL and CU is not driven by treated firms mechanically shifting the estimated production frontier. Detailed results are reported in Supplementary Table S4.
3.2.2. Mediator Variable
Green Managerial Cognition (GMC): Adapting corporate textual-analysis methods [32] and prior research on executive green cognition [33], we construct a firm-year GMC measure from the textual content of listed firms’ annual reports. Specifically, the keyword dictionary covers three dimensions of managerial green cognition: green competitive-advantage cognition, corporate social-responsibility cognition, and perceived external environmental pressure. We identify the frequency of GMC-related keywords in each annual report. To account for differences in document length across firms and years, the GMC measure is calculated as the frequency of GMC-related words divided by the total number of words in the annual report and multiplied by 100. A higher value indicates stronger disclosed managerial attention to green and environmental issues.
Breakthrough Innovation (BI): Building on the patent-based technological-space literature [34] and research linking departures from established technological domains to breakthrough innovation [26], we construct patent-based measures of technological trajectory deviation. Specifically, we represent each firm-year patent portfolio using International Patent Classification (IPC) technology classes and calculate its technological similarity to the firm’s prior patent portfolio. Lower intertemporal technological similarity indicates a greater departure from the firm’s established technological trajectory, and is therefore interpreted as stronger breakthrough-oriented innovation. For robustness, technological similarity is calculated at three levels of IPC aggregation: section, class, and subclass. Accordingly, lower values of all three indicators correspond to stronger breakthrough-oriented technological deviation.
Internationalization Depth: Internationalization depth mainly reflects the extent to which a listed company penetrates existing overseas markets. We operationalize internationalization depth using the ratio of overseas business revenue to total business revenue, which corresponds to the foreign-sales dimension of Sullivan’s [35] multidimensional measure of firm internationalization.
3.2.3. Controlled Variable
To alleviate potential omitted-variable bias, this paper includes a set of firm-level control variables covering financial characteristics, governance structure, and lifecycle features. Detailed definitions and measurements of these variables are reported in Table 1.
Table 1.
Variable types and definitions.
3.3. Identification Strategy and Threats to Identification
The identification strategy exploits the staggered inclusion of product categories in the official CEL catalogues. A firm becomes treated when at least one of its major products is covered by CEL, allowing identification of within-firm changes in CU before and after CEL relative to firms that are not yet treated or never treated.
The main identification threat is that product-category inclusion may not be random. Categories may be covered earlier because of stronger demand growth, faster technological upgrading, greater regulatory attention, or more severe overcapacity problems. These factors can affect CU independently of CEL. In addition, CEL-covered products may be concentrated in particular industries or cities that experience contemporaneous policy, demand, or supply-chain shocks. Finally, because CEL was introduced in multiple cohorts, conventional two-way fixed-effects estimates may be biased by comparisons between early- and late-treated firms.
We address these concerns in several ways. Firm and year fixed effects absorb time-invariant firm characteristics and common macroeconomic shocks. Event-study estimates examine whether treated firms followed different CU trends before CEL exposure. Industry-by-year and city-by-year fixed effects absorb time-varying sectoral and local shocks that may coincide with CEL rollout. We also interact pre-policy CU levels and pre-policy CU trends with year fixed effects to account for differential CU dynamics across firms. To account for heterogeneous treatment effects under staggered treatment timing, we additionally implement the Sun and Abraham event-study estimator [36] as a supplementary dynamic diagnostic, allowing treatment effects to vary across exposure cohorts and event time.
These tests address the main threats in the CEL setting: non-random product-category inclusion, differential pre-treatment trends, local and sectoral shocks, and biases from staggered treatment timing. However, they cannot fully rule out product-category-specific shocks that occur simultaneously with CEL inclusion. Therefore, the causal interpretation relies on a conditional parallel-trends assumption after controlling for firm characteristics, common shocks, local and sectoral trends, and pre-policy CU dynamics.
3.4. Research Model
To estimate the effect of CEL on firm-level capacity utilization, we employ a multi-period difference-in-differences (DID) framework that exploits the staggered timing of CEL exposure. As a benchmark, we estimate a conventional two-way fixed-effects DID model, as shown in Equation (7):
In Equation (7), subscripts and denote firm and year, respectively. The dependent variable represents the CU of firm in year . The key explanatory variable is a firm-level treatment indicator derived from product-level policy. Specifically, equals 1 if at least one of the main products produced by firm is covered by CEL requirements in year , and 0 otherwise. is a vector of firm-level control variables. and denote firm fixed effects and year fixed effects, respectively, which absorb unobservable time-invariant firm heterogeneity and common macro-shocks. is the error term. The coefficient captures the average effect of CEL on firms’ CU. Standard errors in the baseline specification are clustered at the firm-level. Identification relies on the conditional parallel-trends assumption that, after accounting for the included controls and fixed effects, treated and untreated firms would have followed similar CU trends in the absence of CEL exposure. The DID design is particularly suitable for the CEL setting. Firm-level exposure is triggered by the inclusion of product categories in official CEL catalogues rather than by firms’ voluntary participation. The DID approach has two policy-specific advantages in the CEL setting. First, CEL exposure is determined by official catalogue inclusion rather than firms’ voluntary participation, reducing concerns about self-selection into policy treatment. Second, matching catalogue coverage to firms’ major products translates the product-level rollout into firm-specific treatment timing, and allows the analysis to exploit successive catalogue expansions rather than a single policy date. The approach also has limitations. Catalogue inclusion may be correlated with demand, technological, or regulatory conditions that also affect CU, and conventional two-way fixed-effects estimates may be biased when treatment effects vary across staggered cohorts. These limitations motivate the additional identification and robustness checks described below.
Because CEL exposure occurs across multiple product-category cohorts, several identification concerns may affect the baseline estimate, including differential pre-treatment trends, time-varying industry and local shocks, and potential bias from staggered treatment timing. We therefore conduct a series of identification and robustness checks. First, an event-study specification is used to examine pre-treatment trends and the dynamic effects of CEL. Second, we introduce industry-by-year and city-by-year fixed effects and further account for differences in firms’ pre-policy CU levels and trends. Third, to address potential bias arising from heterogeneous treatment effects under staggered adoption, we supplement the baseline model with [36] estimator. We also conduct a leave-one-batch-out analysis to assess whether the results are driven by any particular CEL catalogue batch. Additional robustness checks, with detailed specifications and results reported in Supplementary Tables S5 and S6, Figure S1, examine whether the baseline findings remain robust to excluding low-tail CU observations, replacing the clustering level, and using a stacked DID estimator. The coefficient on the baseline CEL indicator should be interpreted as the average effect associated with becoming exposed to CEL rather than as the effect of complete CEL coverage of a firm’s output. Because treated firms may differ in the economic importance of their CEL-covered product lines, Supplementary Table S7 additionally reports estimates using a continuous, revenue-share-weighted measure of CEL exposure.
4. Results and Discussion
4.1. Descriptive Statistics
The descriptive statistics of the main variables are reported in Table 2. The mean value of CU is 0.698, indicating that the average CU of listed firms is 69.8%. The mean value of CEL is 0.058, suggesting that approximately 5.8% of firm-year observations are exposed to CEL. The control variables are generally within reasonable ranges, with no obvious out-of-bound values. Notably, CU ranges from 0.056 to 0.902, indicating the presence of a small number of low-tail observations. Since CU is measured as the ratio of actual output to stochastic frontier output, very low CU values are possible, but may indicate severe capacity underuse or firm-year-specific shocks. To ensure that these low-tail observations do not drive the baseline results, we conduct additional robustness checks by excluding extreme low-CU observations, as reported in Supplementary Table S5. Institutional ownership is defined as the ratio of institutional investors’ holdings to tradable shares. This measure captures institutional investors’ relative participation in the actively traded shareholder base, which is more closely related to their potential market-based monitoring role. In China’s A-share market, total shares include non-tradable shares that historically have been subject to transfer restrictions and are primarily associated with controlling shareholders rather than market-oriented institutional participation. Therefore, using tradable shares as the denominator allows us to better capture institutional investors’ relative presence among shareholders who actively participate in capital market transactions. Nevertheless, we acknowledge that institutional ownership based on total shares outstanding captures an alternative dimension of ownership structure. We therefore construct this alternative measure and report the results in Supplementary Table S9.
Table 2.
Descriptive statistics.
4.2. Benchmark DID Estimates
The baseline estimates support the main hypothesis that CEL increases CU, as reported in Table 3. The CEL coefficient is 0.020 in Model (1) and falls only slightly to 0.018 after firm-level controls are added in Model (2); both estimates are statistically significant at the 1% level. Model (3) uses standard errors two-way clustered by firm and year, and the coefficient is virtually unchanged at 0.018. The point estimate is remarkably stable across the three specifications, regardless of whether firm-level controls are included or standard errors are clustered in one or two dimensions. To better understand the magnitude of this effect, it is useful to compare our estimate with those reported for other environmental policies in China. Using China’s emissions trading system as a quasi-natural experiment, Ref. [10] examine 1037 Chinese A-share-listed firms over 2004–2020 and document a significant increase in firm-level capacity utilization following ETS implementation. Ref. [37] report a positive baseline DID coefficient of 0.0332 for green finance policy using total asset turnover as a financial proxy for firm capacity utilization. Given the differences in the measurement of CU across studies, these estimates should be interpreted as qualitative benchmarks rather than directly comparable effect magnitudes. Ref. [38] report a coefficient of 0.004 for green factory certification and estimate that a one-standard-deviation increase in the certification indicator corresponds to approximately a 0.132-percentage-point increase in CU. These estimates provide a useful quantitative benchmark for assessing the economic magnitude of the CEL effect. Given that installed equipment, production lines, and other capacity-related inputs are largely quasi-fixed over the short-to-medium-run, a 1.8 percentage-point increase in CU represents a meaningful improvement in the use of installed capacity. In economic terms, CEL-exposed firms operate closer to their estimated production frontier. These results provide support for Hypothesis 1.
Table 3.
Benchmark DID estimates.
4.3. Robustness Checks
This section reports the main identification diagnostics. Supplementary S2 reports additional checks, including exclusion of low-tail CU observations, alternative clustering of standard errors, stacked DID estimates, and tabulated event-study estimates.
4.3.1. Event-Study Evidence on Parallel Trends
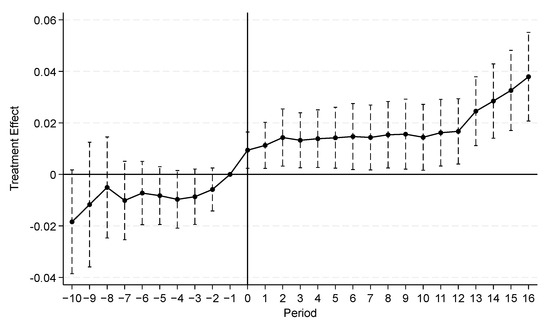
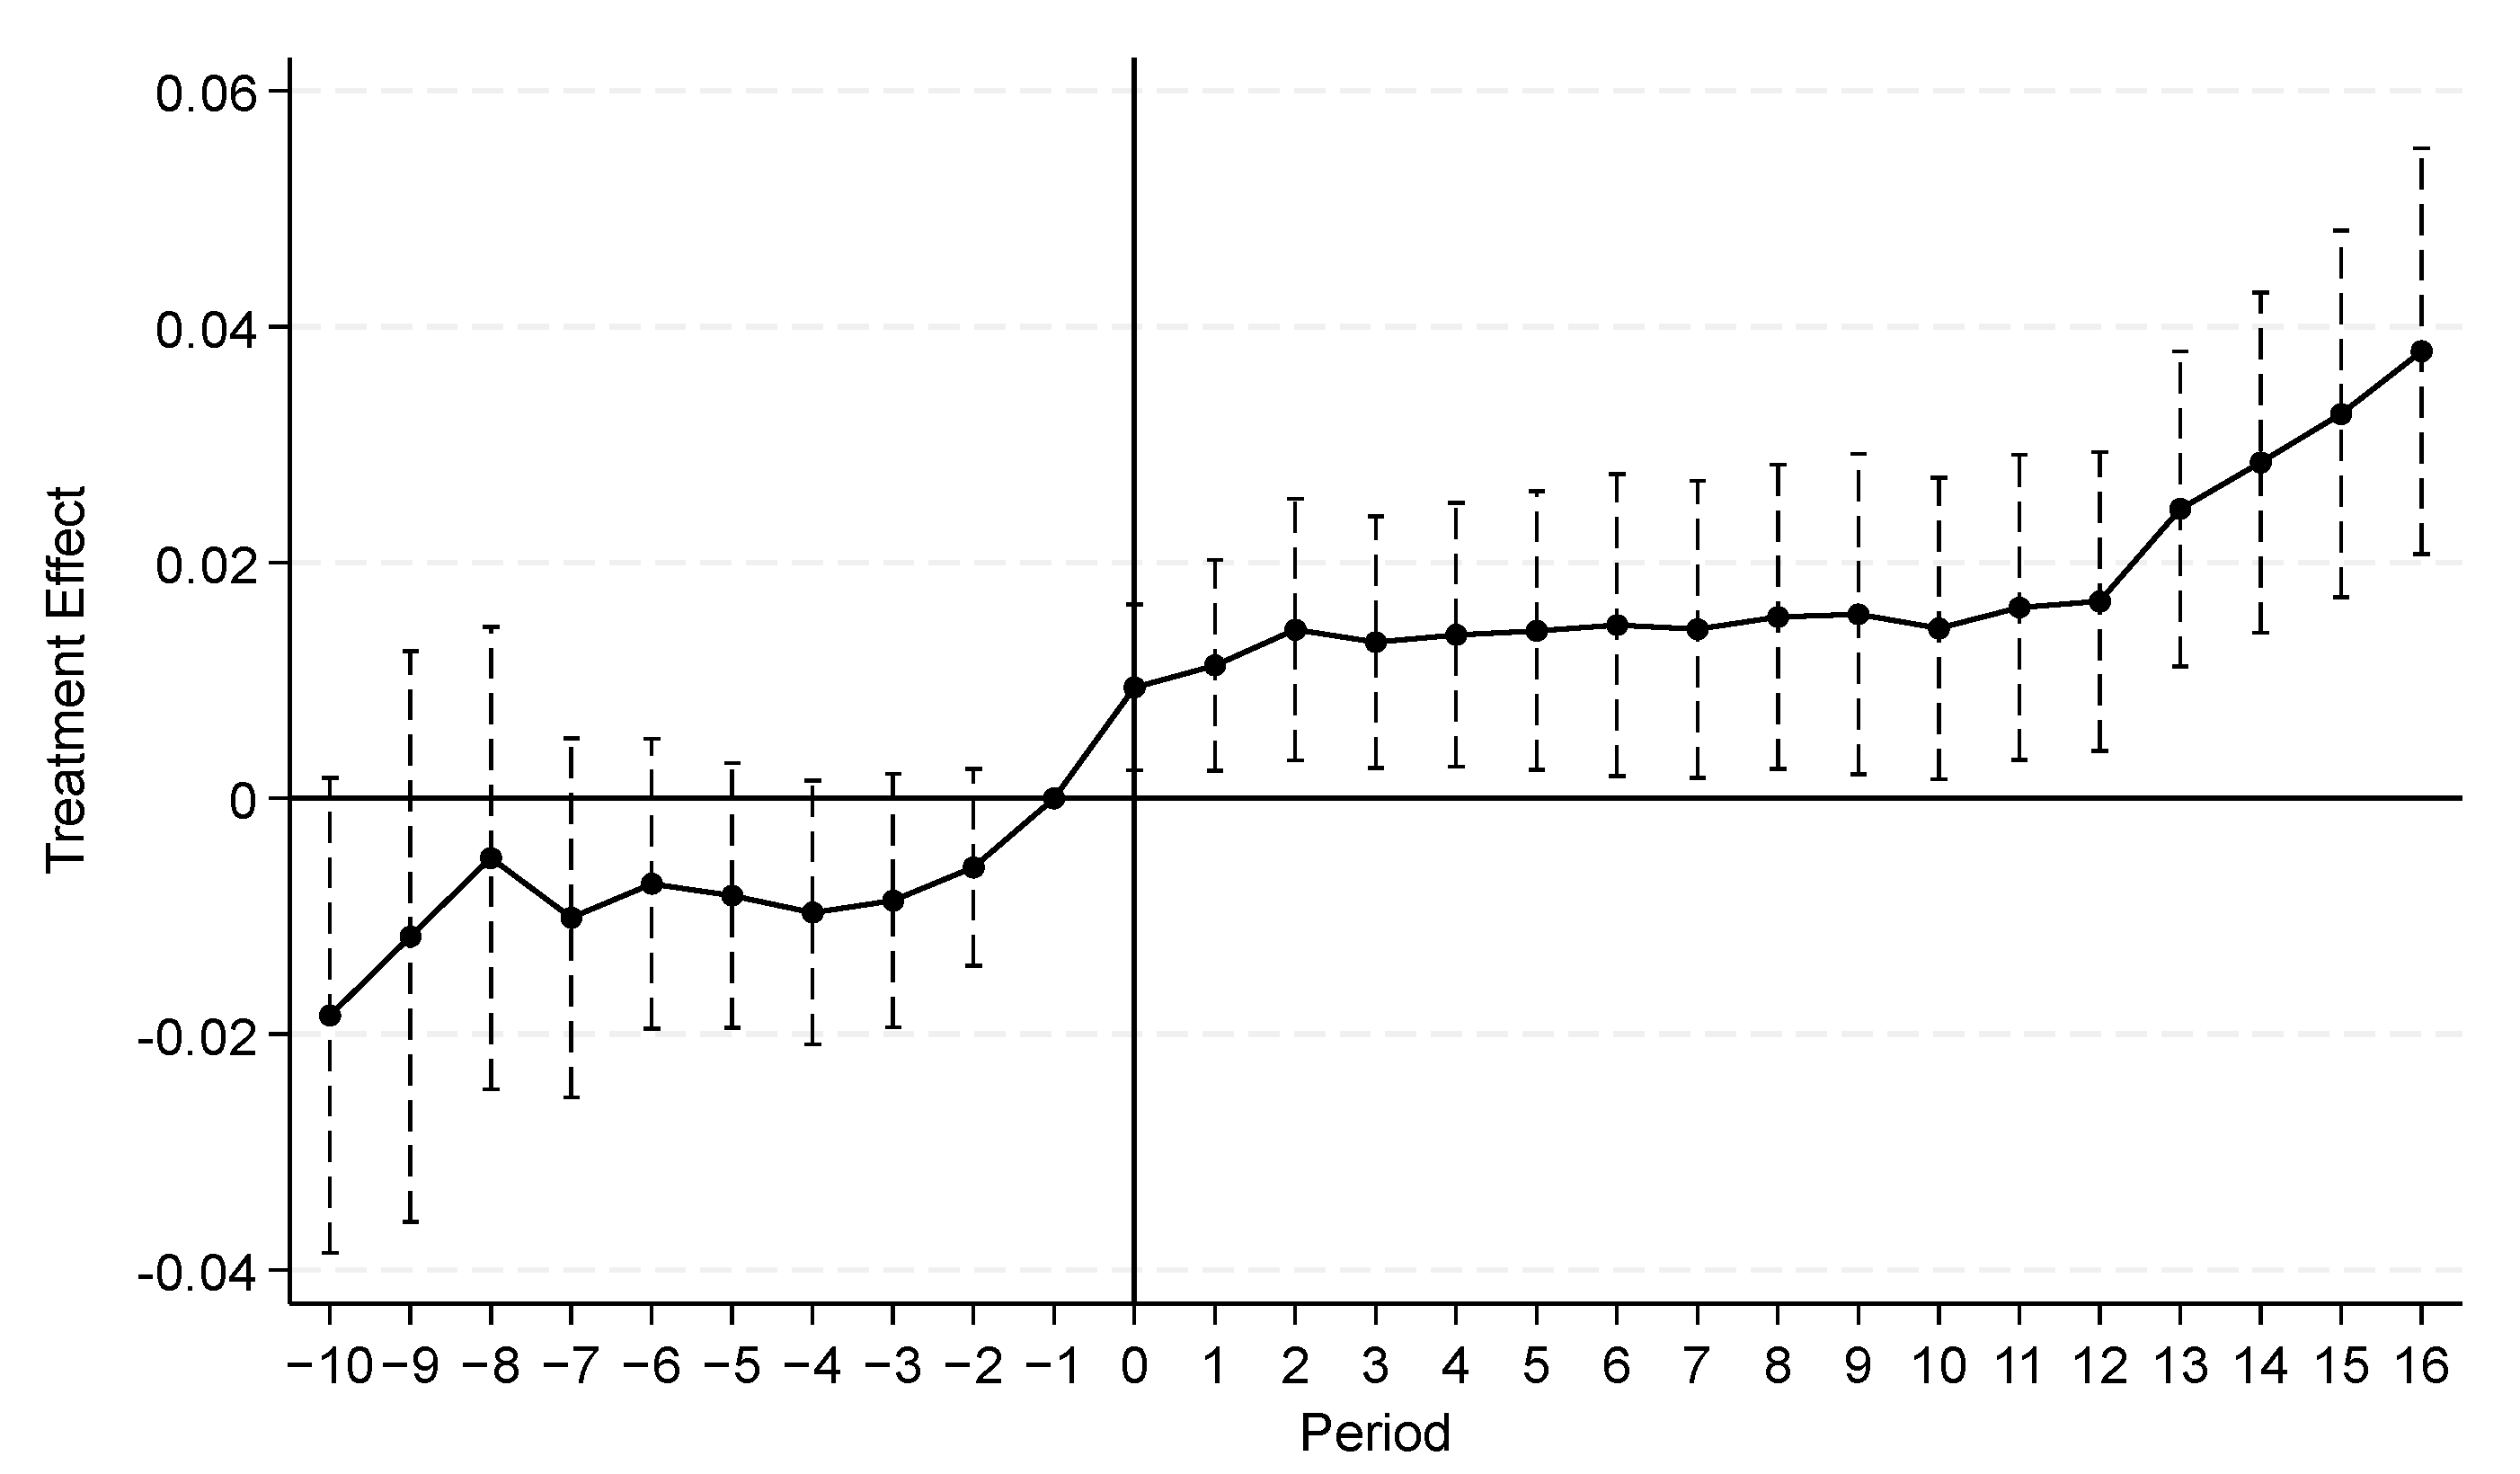
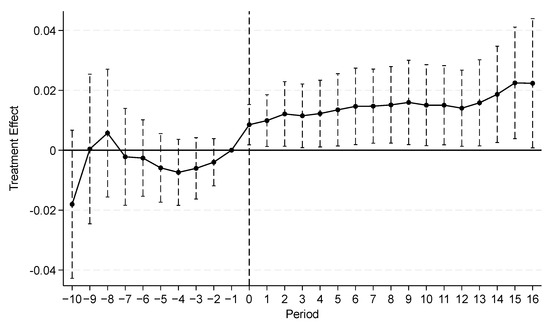
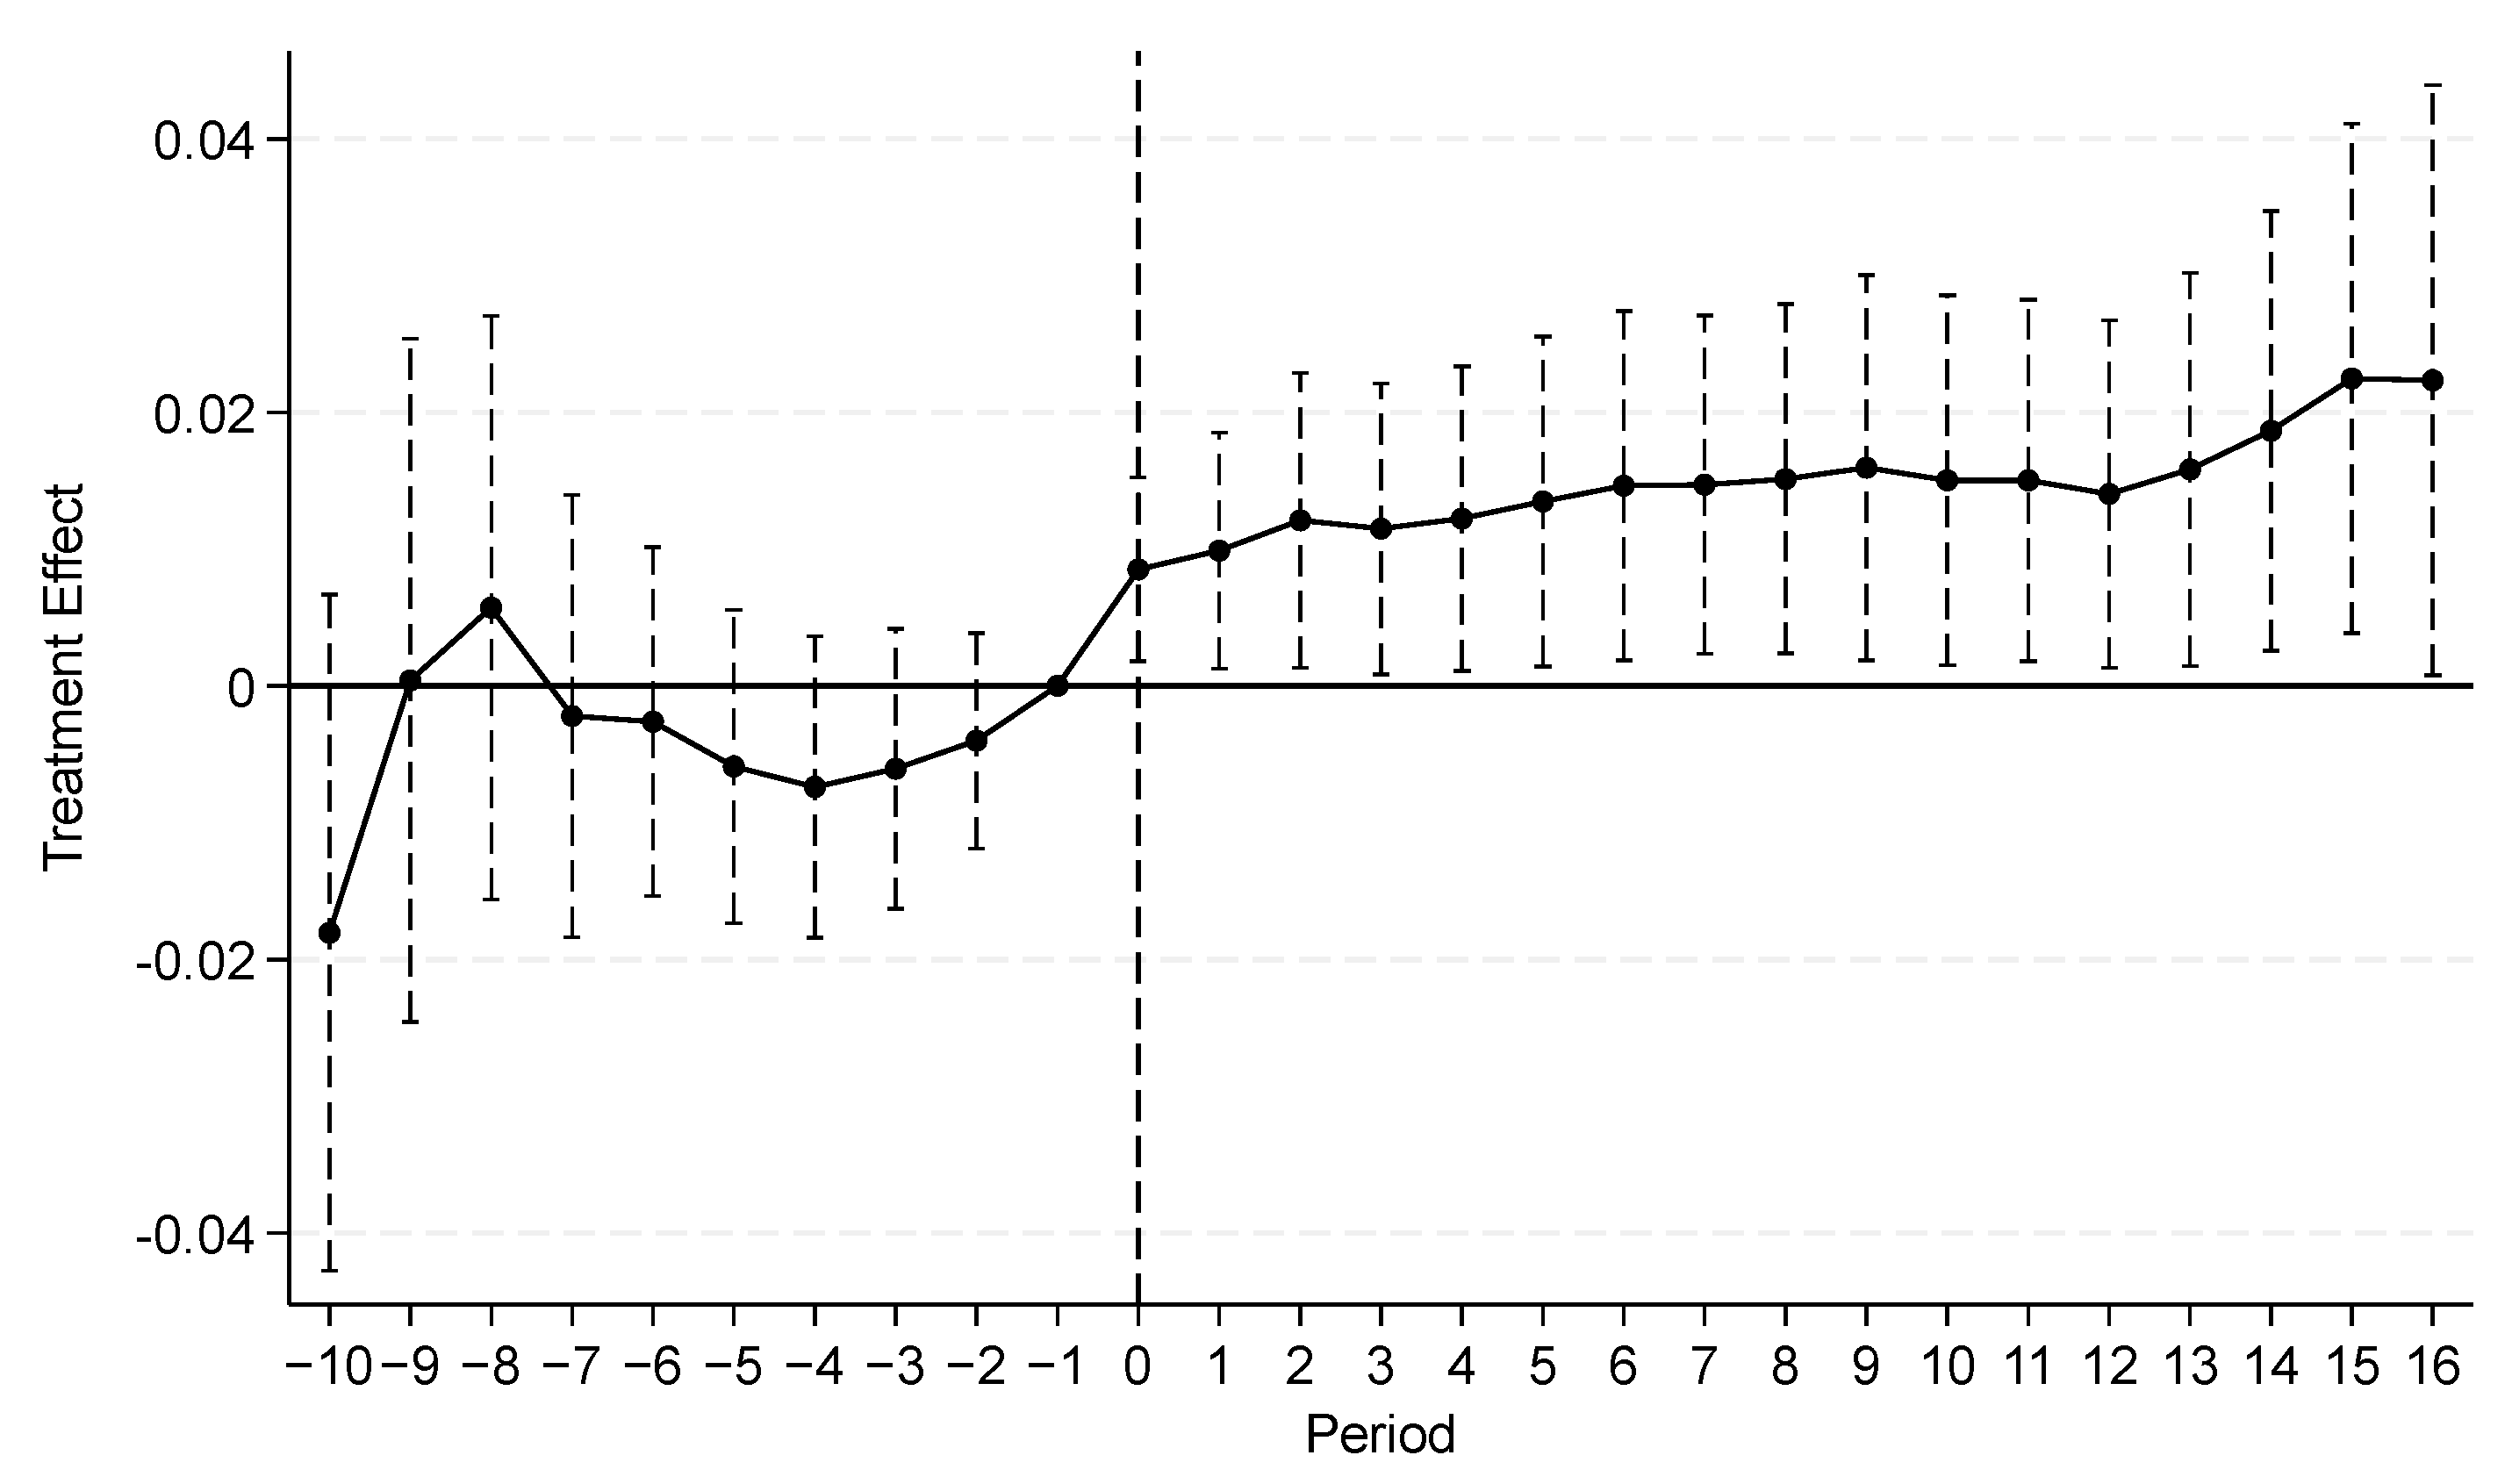
We examine the dynamic effects of CEL exposure on firms’ CU using an event-study specification based on the CEL announcement date, as shown in Figure 2. The year immediately before the CEL announcement is used as the omitted benchmark period. To reduce noise from sparse observations in distant event years, we bin event times earlier than −10 into period −10, and event times later than +16 into period +16. The pre-treatment coefficients fluctuate around zero and are mostly statistically insignificant, providing little evidence of systematic differential trends before the CEL announcement. After the announcement, the coefficients become generally positive and increase over time, a pattern more consistent with a gradual response to CEL exposure than with an immediate discrete jump. Because the data are observed annually, the event-study design cannot separately identify short-term adjustments between the CEL announcement and the statutory effective date. We therefore redefine treatment timing using the statutory effective date and report the corresponding DID and event-study estimates in Supplementary Figure S2 and Table S8. The estimates are similar when treatment is dated by the statutory effective date, so the results do not depend materially on the choice of treatment timing.
Figure 2.
Event-study evidence on parallel trends.
4.3.2. Addressing Time-Varying Industry and Local Shocks
The primary identification concern is that CEL-covered product categories may be located in industries or cities experiencing contemporaneous shocks to capacity utilization. To address this concern, Table 4 adds city-by-year and industry-by-year fixed effects. With both sets of fixed effects included, the estimated CEL coefficient is 0.012 and significant at the 10% level. Although the estimate is smaller than the baseline coefficient of 0.018, it is obtained after controlling for a much broader set of local and sectoral shocks. The positive estimate under these more demanding controls makes it less likely that the benchmark result is driven by contemporaneous city- or industry-specific shocks.
Table 4.
Robustness tests with alternative fixed-effect specifications.
4.3.3. Differential Trends by Pre-Policy CU
Table 5 examines whether firms with different pre-policy CU conditions follow different annual paths. Pre-policy CU level is measured as the firm’s average CU over 2001–2003, while pre-policy CU trend is measured as the firm-specific linear trend over the same period. The corresponding group indicators are interacted with year fixed effects. The smaller sample reflects the data requirements for constructing these pre-policy measures, particularly the trend measure, which requires non-missing CU observations throughout 2001–2003. This leaves 13,599 firm-year observations from firms with sufficiently complete pre-policy CU histories. Of the 286 never-treated firms in the full sample, 73, or 25.5%, are retained. The CEL coefficient is positive and statistically significant in all four specifications.
Table 5.
Differential trends by pre-policy CU.
4.3.4. Sun and Abraham Event-Study Estimates
We implement [36] event-study estimator using Stata 18’s eventstudyinteract command, with never-treated firms serving as the control cohort. The specification includes firm and year fixed effects, and standard errors are clustered at the firm-level. This test examines the dynamic effects of CEL while accounting for the staggered timing of treatment across cohorts. This is useful in the CEL setting because treatment is introduced across product-category cohorts, and firms may adjust at different speeds after their products enter the CEL catalogue. Figure 3 shows that the pre-treatment estimates are small and statistically insignificant in most periods, indicating no systematic evidence of differential CU dynamics before treatment. The post-treatment estimates are generally positive, suggesting that the improvement in CU appears after CEL exposure and is not merely a continuation of pre-existing trends.
Figure 3.
SA event-study estimates.
4.3.5. Leave-One-Batch-Out Test
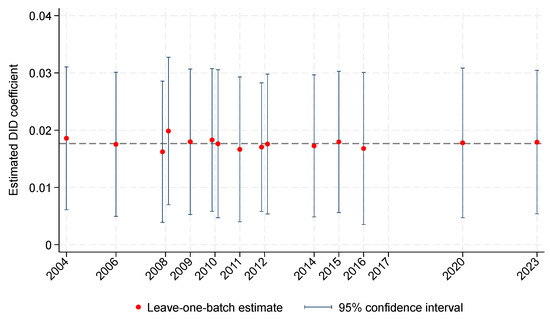
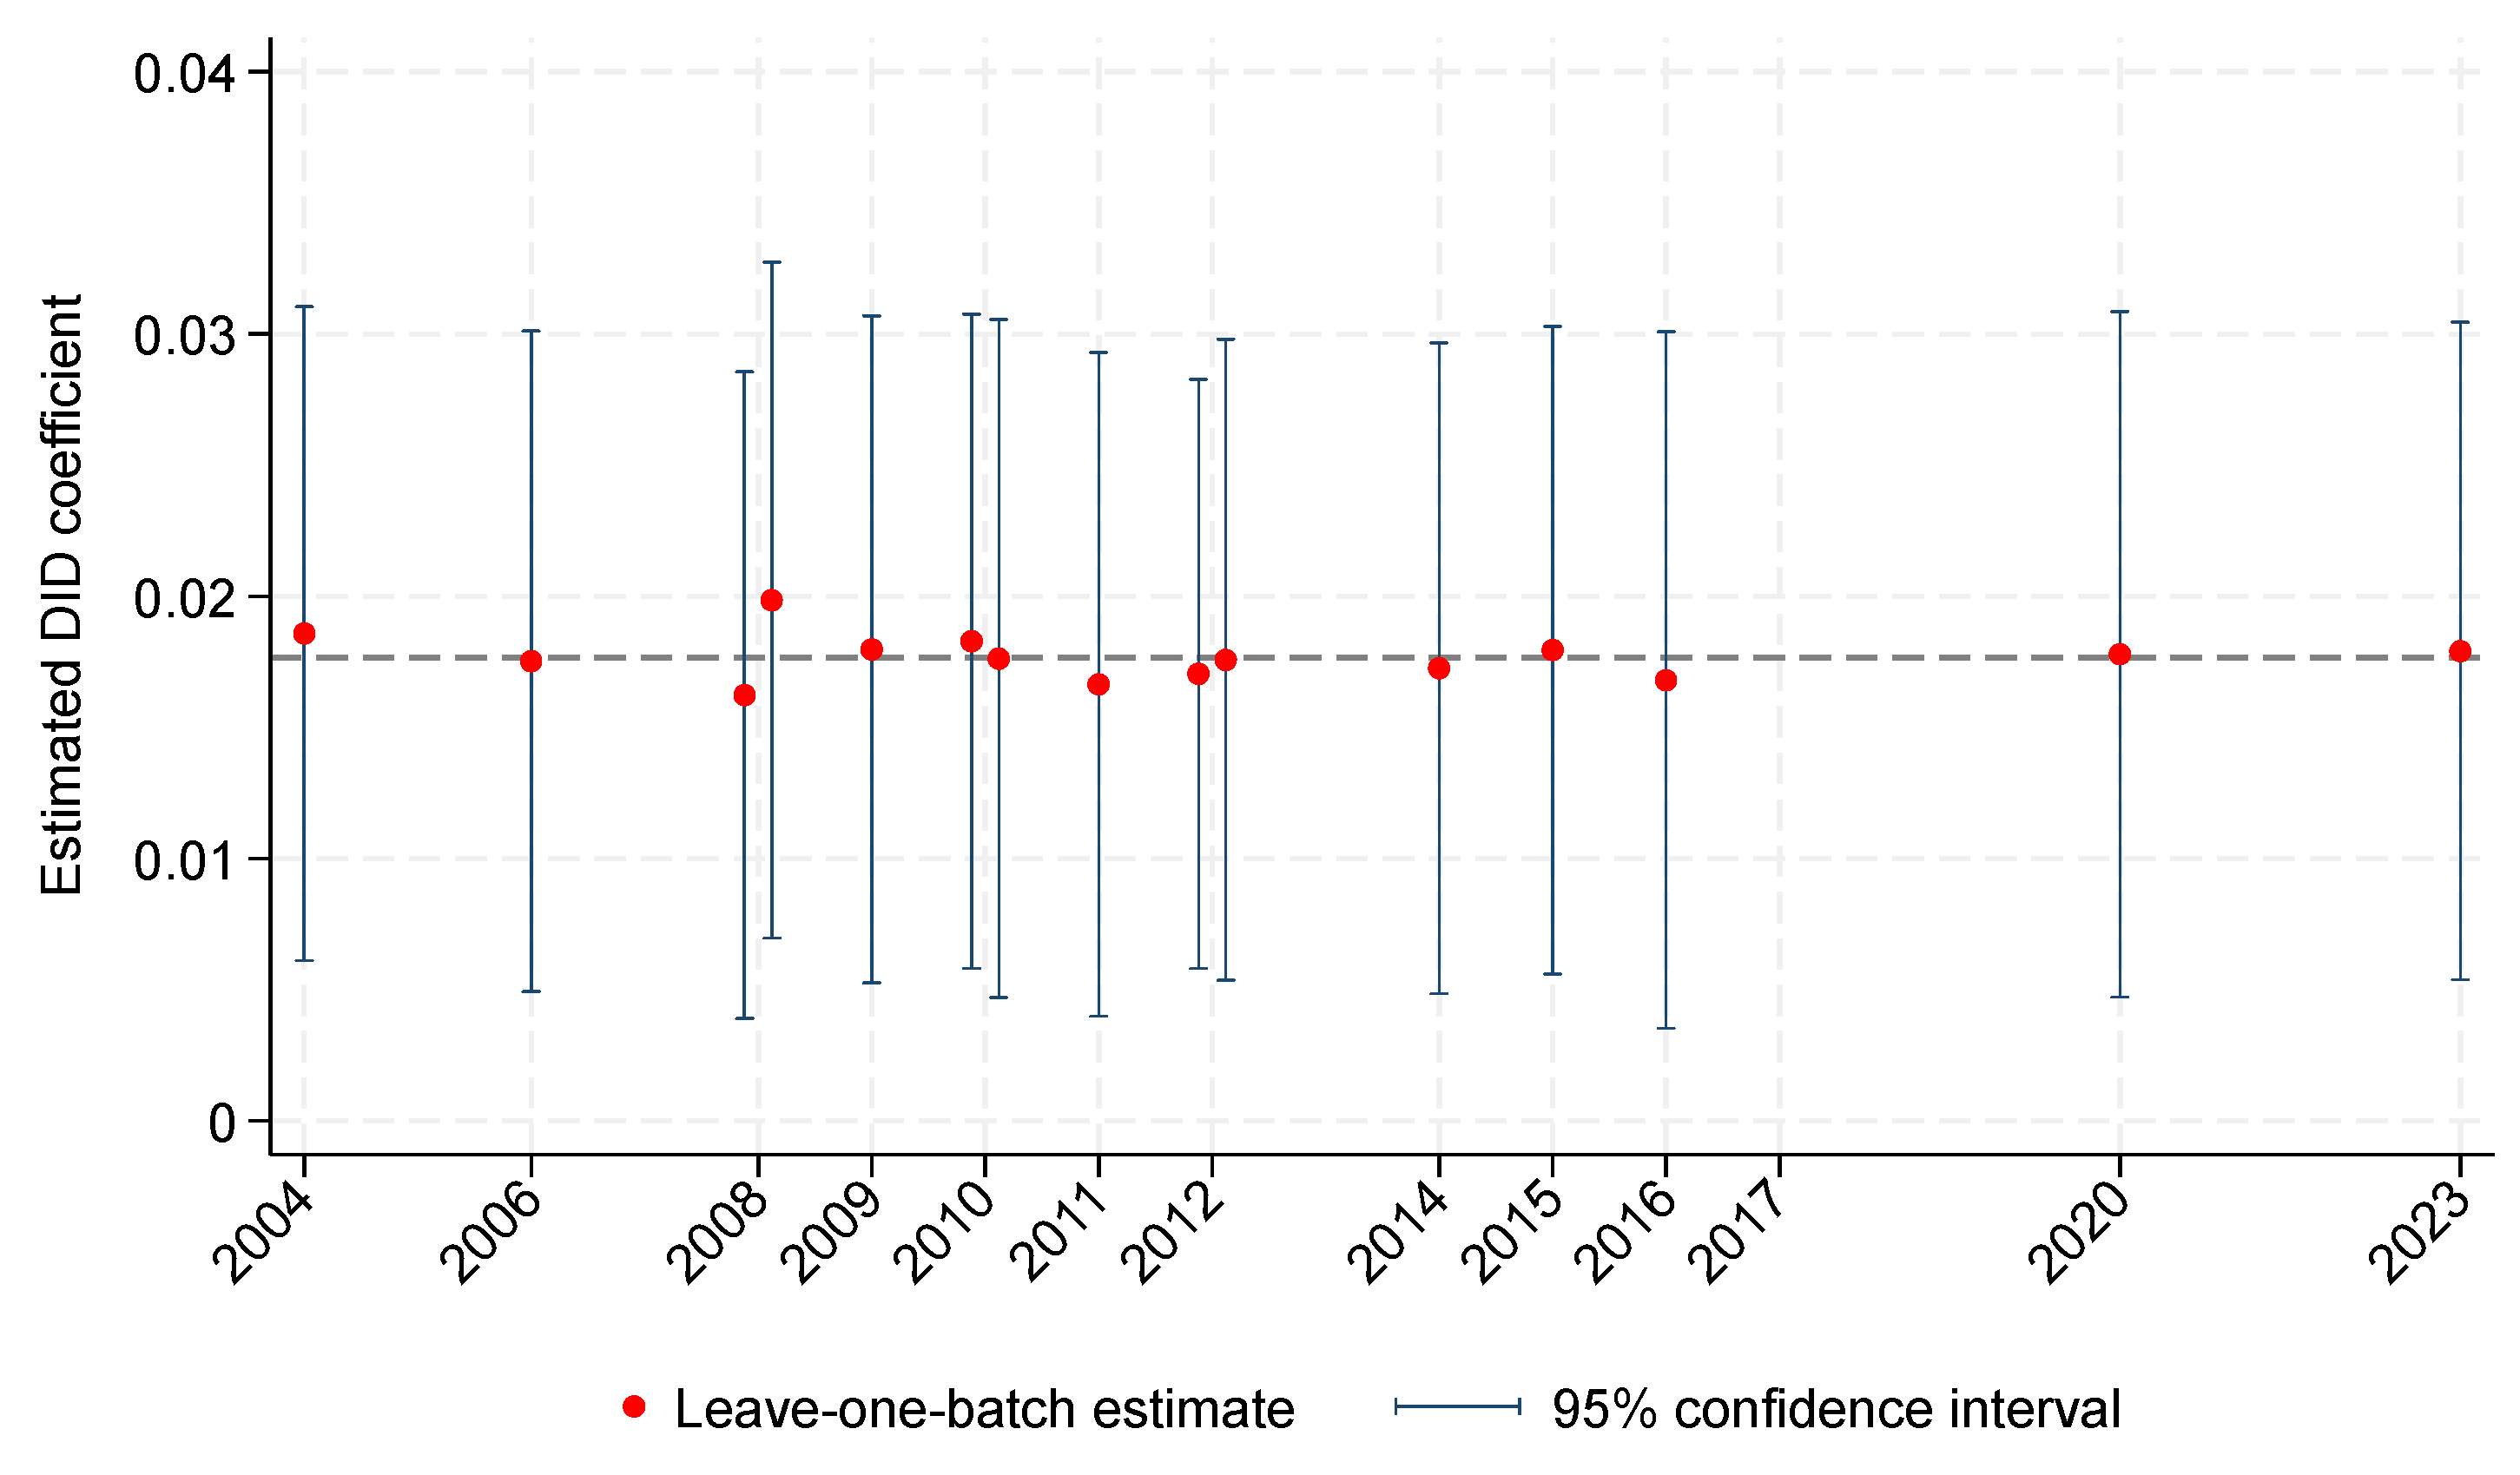
Since CEL is implemented through successive product-catalogue batches, the baseline estimate may be sensitive to a particular implementation batch. To address this concern, we sequentially exclude firms exposed through each CEL catalogue batch and re-estimate the baseline DID model. Figure 4 reports the resulting coefficients and 95% confidence intervals. The dashed horizontal line represents the baseline estimate. The coefficients remain positive and close to the baseline estimate across all exclusions, and the confidence intervals stay above zero. This suggests that the positive effect of CEL on CU is unlikely to be driven by any single catalogue batch.
Figure 4.
Leave-one-batch-out estimates.
4.4. Mechanism Tests
This section examines the proposed channels through which CEL may affect firms’ CU. First, Panel A of Table 6 examines whether CEL exposure is systematically associated with the proposed mechanism variables. Second, following the broader differential-exposure logic used in prior interaction-based studies [39,40], we employ these interaction specifications only as exploratory channel-relevance diagnostics. This second step serves as a supplementary channel-relevance test that links CEL exposure along each mechanism dimension to capacity utilization. If a proposed channel is empirically relevant, the channel-specific CEL exposure measure should be systematically associated with CU.
Table 6.
Mechanism tests: CEL effects and channel-specific exposure.
Specifically, for each proposed mechanism , we construct a channel-specific exposure measure as:
We then estimate:
where denotes the baseline control variables, while and denote firm and year fixed effects, respectively. In this auxiliary specification, and the corresponding mechanism variable are combined into the channel-specific exposure term and are not entered separately as constituent terms. Accordingly, captures the association between CU and CEL exposure weighted by the corresponding mechanism dimension. This specification is therefore interpreted as a supplementary channel-relevance test rather than as a conventional moderation regression that estimates an interaction effect conditional on the separate main effects of CEL and .
Panel A of Table 6 reports the effects of CEL exposure on the variables in the proposed mechanism. Model (1) shows that the coefficient on CEL is positive and statistically significant for GMC, indicating that CEL exposure is associated with stronger managerial attention to environmental and energy-efficiency issues. This result is consistent with the argument that energy labeling embeds energy-efficiency considerations into firms’ internal management and strengthens green managerial cognition. Models (2)–(4) examine breakthrough innovation (BI) using three alternative measures of intertemporal technological similarity. Because lower technological similarity indicates stronger BI, the negative and statistically significant coefficients on CEL suggest that CEL-exposed firms are more likely to pursue technological trajectories that depart from their existing knowledge base. These findings are consistent with the technological-upgrading channel proposed in Hypothesis 3. Model (5) examines internationalization depth. The positive and statistically significant coefficient indicates that CEL is associated with deeper international engagement, consistent with the view that standardized energy-efficiency information may reduce information frictions and facilitate firms’ participation in overseas markets. Overall, Panel A provides evidence that CEL exposure is systematically associated with the managerial, technological, and internationalization dimensions proposed in Hypotheses 2–4.
To provide a closer empirical link between the proposed mechanism variables and CU, Panel B further examines the channel-specific exposure measures defined in Equation (8). The coefficient on CEL × GMC is positive and statistically significant, indicating that CU is positively associated with CEL exposure weighted by green managerial cognition. The coefficients on CEL interacted with the three technological-similarity measures are all negative and statistically significant. Since lower technological similarity represents stronger breakthrough innovation, these results are consistent with greater CU along the breakthrough-innovation dimension of CEL exposure. The coefficient on CEL × internationalization depth is also positive and statistically significant, providing additional evidence consistent with the international-market channel. Taken together, Panel B provides supplementary evidence linking CEL exposure along the proposed managerial, technological, and internationalization dimensions to capacity utilization.
The positive effect of CEL on GMC is consistent with previous evidence that environmental regulation can shape managerial environmental perceptions, and that such perceptions influence firms’ environmental responses [22,41,42]. In the context of CEL, this cognitive response is particularly relevant because energy-efficiency requirements are incorporated into product testing, production, and compliance activities. Taken together, the GMC evidence provides suggestive support for Hypothesis 2. Beyond this managerial response, the innovation results point to a deeper form of technological adjustment. Previous research shows that CEL redirects innovation toward energy-saving technologies [16], focusing primarily on the direction of technological change. Our results capture a different dimension: the novelty of innovation relative to firms’ existing technological knowledge base. Unlike incremental innovation, which improves technologies along established trajectories, breakthrough innovation involves a substantial departure from those trajectories. The decline in technological similarity therefore suggests that CEL exposure is associated with more fundamental technological change rather than merely incremental refinement of existing technologies. The consistent results across the three BI measures therefore provide suggestive support for Hypothesis 3. The market-side evidence provides a complementary perspective. Previous empirical studies have mainly assessed the external-market effects of environmental information through export participation or export performance. Ref. [43] find that environmental information disclosure significantly increases firm export value and export intensity, while Zhou et al. [44] show that environmental labeling certification promotes firm exports in China. Our measure focuses on a related but distinct dimension of firms’ external-market engagement—internationalization depth. The coefficient on CEL in Model (5) indicates that CEL exposure is associated with a higher share of overseas business revenue. The positive association with CEL is therefore consistent with deeper participation in overseas markets. This evidence provides suggestive support for the internationalization channel proposed in Hypothesis 4.
4.5. Heterogeneity Analysis
The heterogeneity analysis shows that the positive effect of CEL on CU differs across ownership types, as reported in Table 7. Specifically, the effect is significantly stronger for state-owned enterprises than for non-state-owned enterprises, and the coefficient difference between the two groups is statistically significant. This may reflect the fact that state-owned enterprises are more sensitive to policy signals and face stronger incentives to comply with government-led environmental regulation. When the sample is further divided by operating status, the effect of CEL is stronger for loss-making firms than for non-loss-making firms. Loss-making firms generally face greater productive slack, implying more room for improvement in capacity utilization. At the same time, persistent losses may expose these firms to stronger monitoring and performance pressure from creditors, controlling shareholders, and other stakeholders, which may strengthen their incentives to respond to regulatory requirements and pursue efficiency improvements. CEL may therefore induce more pronounced technological and production adjustments among these firms, allowing them to realize larger improvements in the utilization of existing capacity.
Table 7.
Heterogeneity analysis.
The heterogeneity results should be interpreted in light of this study’s sample coverage. The sample is restricted to Shanghai and Shenzhen A-share listed firms, which may differ systematically from the broader population of Chinese manufacturers in firm size, governance structures, disclosure practices, and access to resources. These characteristics may also shape firms’ responses to CEL and the composition of the SOE and loss-making subsamples. Accordingly, the heterogeneous effects documented here should primarily be interpreted as differences within the listed-firm population, and their generalizability to non-listed manufacturers remains to be established.
5. Conclusions and Implications
This study provides systematic evidence that CEL improves firms’ capacity utilization. Exploiting the staggered expansion of CEL across product categories, we employ a multi-period difference-in-differences framework and find that CEL exposure increases firm-level CU by approximately 1.8 percentage points. The effect remains positive at about 1.2 percentage points after accounting for time-varying city- and industry-level shocks. The mechanism analyses provide suggestive evidence consistent with three potential channels: green managerial cognition, breakthrough innovation, and internationalization. The heterogeneity analysis further shows that the effect of CEL on CU is stronger among state-owned and loss-making firms. Taken together, these findings show that improving the transparency of energy-efficiency information can ultimately translate into more effective utilization of firms’ existing productive capacity.
Building on the main findings of this study, this section outlines several policy implications for strengthening the production-side value of the CEL system. Existing research has largely emphasized the demand-side effects of energy labeling. Our findings complement this literature by showing that CEL can also affect firms’ capacity utilization, providing a production-side basis for policy design.
First, the evaluation of energy-labeling policies should extend beyond product compliance to firms’ production-side performance. Our baseline results show that CEL improves firm-level capacity utilization, while the heterogeneity analysis reveals stronger effects among state-owned and loss-making firms. These findings suggest that the production-side gains from CEL are not uniform across firms. Regulators could therefore incorporate indicators such as capacity utilization, equipment operating efficiency, and energy use per unit of output into policy evaluation. Implementation could also be more differentiated. Firms with greater productive slack, particularly state-owned and loss-making firms, may benefit more from complementary support for energy-saving retrofits and production-process optimization.
Second, energy-labeling policies can be complemented by measures that strengthen firms’ managerial and technological responses. Our mechanism analysis provides suggestive evidence that green managerial cognition and breakthrough innovation are potential channels associated with the improvement in capacity utilization. Policymakers could therefore strengthen energy-management guidance and provide efficiency diagnostics for firms covered by CEL. Support for technological upgrading could also be better coordinated with labeling requirements, helping firms translate energy-efficiency signals into improvements in production processes and resource use.
Third, policy support can be strengthened to help firms deepen their engagement in international markets. Our results show that CEL exposure is positively associated with internationalization depth, suggesting that credible energy-efficiency information may facilitate stronger and more sustained participation in overseas markets. Policymakers could therefore provide targeted guidance on foreign energy-efficiency standards, certification procedures, and market-access requirements, particularly for firms with limited experience in international operations. Complementary support through compliance consulting, certification assistance, and international market information services could further reduce regulatory and informational frictions and help firms strengthen their existing overseas business relationships.
Although our empirical estimates are derived from China, the underlying mechanism is not inherently country-specific. By reducing information asymmetry and strengthening market incentives around energy performance, energy-labeling policies can influence firms’ production decisions and the utilization of existing capacity. The findings are especially relevant for emerging industrial economies that are expanding energy-labeling systems while facing pressures to improve both energy efficiency and capacity use, but the broader implications also extend to other economies where energy-performance information meaningfully affects market competition. For these countries, the Chinese experience suggests that policy evaluation should extend beyond consumer responses and product energy performance to include production-side outcomes, and that implementation should account for firms’ heterogeneous capacity for adjustment. The exact magnitude of the effect, however, should not be mechanically extrapolated across countries, as it may vary with industrial structure, regulatory enforcement, market responsiveness, and baseline capacity conditions.
Several limitations of the present study warrant further consideration and point to important directions for future research. First, the sample is restricted mainly to Chinese A-share-listed firms, which may differ systematically from smaller or non-listed manufacturers in resource availability, organizational structure, and regulatory responsiveness. Given the heterogeneous effects identified across firm types, the estimated average effect may not fully represent firms with different organizational and resource conditions. Future research could extend the analysis to broader firm populations and plant-level samples.
Second, capacity utilization is estimated using a stochastic frontier approach rather than directly observed. Accordingly, our CU measure should be interpreted as an economic measure of utilization relative to an estimated production frontier, rather than as a direct engineering measure of physical capacity use. The measure may also depend on the specification of the production frontier and the use of revenue as the output proxy, which reflects both quantities and prices. Although the full two-stage bootstrap and the alternative frontier based on never-treated firms support the robustness of our findings, they cannot eliminate all measurement concerns. Future studies could validate the results using physical output, installed capacity, equipment utilization, and energy-consumption data.
Third, although the identification tests address several major confounding factors, product-category-specific shocks coinciding with CEL inclusion cannot be completely ruled out. Changes in product demand, technological upgrading, or regulatory attention may occur simultaneously with catalogue inclusion and independently affect firms’ capacity utilization. Future studies could combine more detailed product-level data with alternative identification strategies to better distinguish the CEL effect from these contemporaneous shocks.
Supplementary Materials
The following supporting information can be downloaded at: https://www.mdpi.com/article/10.3390/en19184252/s1, References [45,46] are cited in Supplementary File.
Author Contributions
Conceptualization, P.Y.; Methodology, P.Y. and G.W.; Validation, G.W.; Investigation, P.Y.; Resources, Z.Z.; Data curation, G.W.; Writing—original draft, P.Y.; Writing—review & editing, P.Y. and Z.Z.; Project administration, Z.Z.; Funding acquisition, Z.Z. All authors have read and agreed to the published version of the manuscript.
Funding
This work was supported by the National Social Science Fund of China under Grant [23BGJ050].
Data Availability Statement
The original contributions presented in this study are included in the article/Supplementary Materials. Further inquiries can be directed to the corresponding author. The datasets generated and/or analyzed during the current study are not publicly available due to the specific data processing and compilation procedures involved in this research. The datasets include integrated information collected from multiple sources and further processed to meet the requirements of this study. However, the data supporting the findings of this study are available from the corresponding author upon reasonable request.
Conflicts of Interest
The authors declare no conflict of interest.
Abbreviations
The following abbreviations are used in this manuscript:
| CEL | China Energy Label |
| CU | Capacity utilization |
| GMC | Green managerial cognition |
| BI | Breakthrough innovation |
| CSMAR | China Stock Market and Accounting Research Database |
| IPC | International Patent Classification |
| ROA | Return on assets |
| SOEs | State-owned enterprises |
References
- Lin, B.; Zhu, J. Impact of energy saving and emission reduction policy on urban sustainable development: Empirical evidence from China. Appl. Energy 2019, 239, 12–22. [Google Scholar] [CrossRef] [Scilit]
- Bai, X.; Zhong, J.; Huang, D. Economic instruments for natural resource efficiency: The role of carbon taxation and fiscal policy. Resour. Policy 2024, 89, 104614. [Google Scholar] [CrossRef] [Scilit]
- Allcott, H. Consumers’ perceptions and misperceptions of energy costs. Am. Econ. Rev. 2011, 101, 98–104. [Google Scholar] [CrossRef] [Scilit]
- Gillingham, K.; Harding, M.; Rapson, D. Split incentives in residential energy consumption. Energy J. 2012, 33, 37–62. [Google Scholar] [CrossRef] [Scilit]
- Houde, S. How consumers respond to product certification and the value of energy information. RAND J. Econ. 2018, 49, 453–477. [Google Scholar] [CrossRef] [Scilit]
- Ambec, S.; Cohen, M.A.; Elgie, S.; Lanoie, P. The Porter hypothesis at 20: Can environmental regulation enhance innovation and competitiveness? Rev. Environ. Econ. Policy 2013, 7, 2–22. [Google Scholar] [CrossRef] [Scilit]
- Li, X.; Du, K.; Ouyang, X.; Liu, L. Does more stringent environmental regulation induce firms’ innovation? Evidence from the 11th Five-year plan in China. Energy Econ. 2022, 112, 106110. [Google Scholar] [CrossRef] [Scilit]
- Albrizio, S.; Kozluk, T.; Zipperer, V. Environmental policies and productivity growth: Evidence across industries and firms. J. Environ. Econ. Manag. 2017, 81, 209–226. [Google Scholar] [CrossRef] [Scilit]
- Li, M.; Du, W. Opening the black box of capacity governance: Environmental regulation and capacity utilization of microcosmic firms in China. Econ. Model. 2022, 108, 105766. [Google Scholar] [CrossRef] [Scilit]
- Han, Z.; Wang, L.; Zhao, F. Can emission trading system improve capacity utilization? A quasi-natural experiment in Chinese listed firms. J. Clean. Prod. 2023, 385, 135719. [Google Scholar] [CrossRef] [Scilit]
- Newell, R.G.; Siikamäki, J. Nudging energy efficiency behavior: The role of information labels. J. Assoc. Environ. Resour. Econ. 2014, 1, 555–598. [Google Scholar] [CrossRef] [Scilit]
- Blasch, J.; Filippini, M.; Kumar, N. Boundedly rational consumers, energy and investment literacy, and the display of information on household appliances. Resour. Energy Econ. 2019, 56, 39–58. [Google Scholar] [CrossRef] [Scilit]
- Cohen, F.; Glachant, M.; Söderberg, M. Consumer myopia, imperfect competition and the energy efficiency gap: Evidence from the UK refrigerator market. Eur. Econ. Rev. 2017, 93, 1–23. [Google Scholar] [CrossRef] [Scilit]
- Dranove, D.; Jin, G.Z. Quality disclosure and certification: Theory and practice. J. Econ. Lit. 2010, 48, 935–963. [Google Scholar] [CrossRef] [Scilit]
- Khanna, N.Z.; Zhou, N.; Fridley, D.; Fino-Chen, C. Evaluation of China’s local enforcement of energy efficiency standards and labeling programs for appliances and equipment. Energy Policy 2013, 63, 646–655. [Google Scholar] [CrossRef] [Scilit]
- Gong, Y.; Liu, Z.; Wu, S.; Pu, S.; Zhang, X.; Chen, L. Study on the technological inductive effects of product information label: Evidence from the energy-efficiency labeling system in China. Sage Open 2023, 13, 21582440231194141. [Google Scholar] [CrossRef] [Scilit]
- Wen, H.; Lee, C.-C. Impact of environmental labeling certification on firm performance: Empirical evidence from China. J. Clean. Prod. 2020, 255, 120201. [Google Scholar] [CrossRef] [Scilit]
- Zha, D.; Yang, G.; Wang, W.; Wang, Q.; Zhou, D. Appliance energy labels and consumer heterogeneity: A latent class approach based on a discrete choice experiment in China. Energy Econ. 2020, 90, 104839. [Google Scholar] [CrossRef] [Scilit]
- Dibiasi, A.; Mikosch, H.; Sarferaz, S. Uncertainty Shocks, Adjustment Costs, and Firm Beliefs: Evidence from a Representative Survey. Am. Econ. J. Macroecon. 2025, 17, 36–73. [Google Scholar] [CrossRef] [Scilit]
- Coad, A.; Domnick, C.; Flachenecker, F.; Harasztosi, P.; Janiri, M.L.; Pal, R.; Teruel, M. Capacity constraints as a trigger for high growth. Small Bus. Econ. 2022, 59, 893–923. [Google Scholar] [CrossRef] [Scilit]
- Hambrick, D.C.; Mason, P.A. Upper echelons: The organization as a reflection of its top managers. Acad. Manag. Rev. 1984, 9, 193–206. [Google Scholar] [CrossRef] [Scilit]
- Liu, Y.; Chen, Y. Executives’ green cognition and corporate green innovation: Evidence from China. Total Qual. Manag. Bus. Excell. 2024, 35, 1054–1075. [Google Scholar] [CrossRef] [Scilit]
- Bloom, N.; Eifert, B.; Mahajan, A.; McKenzie, D.; Roberts, J. Does management matter? Evidence from India. Q. J. Econ. 2013, 128, 1–51. [Google Scholar] [CrossRef] [Scilit]
- Cua, K.O.; McKone, K.E.; Schroeder, R.G. Relationships between implementation of TQM, JIT, and TPM and manufacturing performance. J. Oper. Manag. 2001, 19, 675–694. [Google Scholar] [CrossRef] [Scilit]
- Aghion, P.; Howitt, P. A model of growth through creative destruction. Econometrica 1992, 60, 323–351. [Google Scholar] [CrossRef] [Scilit]
- Ahuja, G.; Morris Lampert, C. Entrepreneurship in the large corporation: A longitudinal study of how established firms create breakthrough inventions. Strateg. Manag. J. 2001, 22, 521–543. [Google Scholar] [CrossRef] [Scilit]
- Gerstlberger, W.; Knudsen, M.P.; Dachs, B.; Schröter, M. Closing the energy-efficiency technology gap in European firms? Innovation and adoption of energy efficiency technologies. J. Eng. Technol. Manag. 2016, 40, 87–100. [Google Scholar] [CrossRef] [Scilit]
- Cagno, E.; Accordini, D.; Trianni, A.; Katic, M.; Ferrari, N.; Gambaro, F. Understanding the impacts of energy efficiency measures on a Company’s operational performance: A new framework. Appl. Energy 2022, 328, 120118. [Google Scholar] [CrossRef] [Scilit]
- Randle, D.K.; Pisano, G.P. The evolutionary nature of breakthrough innovation: An empirical investigation of firm search strategies. Strategy Sci. 2021, 6, 290–304. [Google Scholar] [CrossRef] [Scilit]
- Aigner, D.; Lovell, C.K.; Schmidt, P. Formulation and estimation of stochastic frontier production function models. J. Econom. 1977, 6, 21–37. [Google Scholar] [CrossRef] [Scilit]
- Kirkley, J.; Paul, C.J.M.; Squires, D. Deterministic and stochastic capacity estimation for fishery capacity reduction. Mar. Resour. Econ. 2004, 19, 271–294. [Google Scholar] [CrossRef] [Scilit]
- Li, F. The information content of forward-looking statements in corporate filings—A naïve Bayesian machine learning approach. J. Account. Res. 2010, 48, 1049–1102. [Google Scholar] [CrossRef] [Scilit]
- Hao, X.; Miao, E.; Wen, S.; Wu, H.; Xue, Y. Executive green cognition on corporate greenwashing behavior: Evidence from A-share listed companies in China. Bus. Strategy Environ. 2025, 34, 2012–2034. [Google Scholar] [CrossRef] [Scilit]
- Jaffe, A.B. Technological Opportunity and spillovers of R&D: Evidence from firms’ patents, profits, and market value. Am. Econ. Rev. 1986, 76, 984–1001. [Google Scholar]
- Sullivan, D. Measuring the degree of internationalization of a firm. J. Int. Bus. Stud. 1994, 25, 325–342. [Google Scholar] [CrossRef] [Scilit]
- Sun, L.; Abraham, S. Estimating dynamic treatment effects in event studies with heterogeneous treatment effects. J. Econom. 2021, 225, 175–199. [Google Scholar] [CrossRef] [Scilit]
- Cai, X.; Chen, G.; Wang, F. How does green finance policy affect the capacity utilization rate of polluting enterprises? Sustainability 2023, 15, 16927. [Google Scholar] [CrossRef] [Scilit]
- Wang, X.; Duan, Y.; Jiang, D. Building Long-Term Sustainability: The Impact of Green Factory Certification Policy on Enterprise Capacity Utilization. Sustainability 2026, 18, 7327. [Google Scholar] [CrossRef] [Scilit]
- Rajan, R.G.; Zingales, L. Financial dependence and growth. Am. Econ. Rev. 1998, 88, 559–586. [Google Scholar] [CrossRef] [Scilit]
- Choi, S.; Willems, T.; Yoo, S.Y. Revisiting the monetary transmission mechanism through an industry-level differential approach. J. Monet. Econ. 2024, 145, 103556. [Google Scholar] [CrossRef] [Scilit]
- López-Gamero, M.D.; Molina-Azorín, J.F.; Claver-Cortés, E. The potential of environmental regulation to change managerial perception, environmental management, competitiveness and financial performance. J. Clean. Prod. 2010, 18, 963–974. [Google Scholar] [CrossRef] [Scilit]
- Peng, X.; Liu, Y. Behind eco-innovation: Managerial environmental awareness and external resource acquisition. J. Clean. Prod. 2016, 139, 347–360. [Google Scholar] [CrossRef] [Scilit]
- Xie, D.; Li, X.; Zhou, D. Does environmental information disclosure increase firm exports? Econ. Anal. Policy 2022, 73, 620–638. [Google Scholar] [CrossRef] [Scilit]
- Zhou, L.; Ren, S.; Du, L.; Tang, F.; Li, R. Is environmental labeling certification a “green passport” for firm exports in emerging economies? Evidence from China. Int. Bus. Rev. 2023, 32, 102171. [Google Scholar] [CrossRef] [Scilit]
- Caldara, D.; Iacoviello, M.; Molligo, P.; Prestipino, A.; Raffo, A. The economic effects of trade policy uncertainty. J. Monet. Econ. 2020, 109, 38–59. [Google Scholar] [CrossRef] [Scilit]
- Mertens, K.; Ravn, M.O. Empirical evidence on the aggregate effects of anticipated and unanticipated US tax policy shocks. Am. Econ. J. Econ. Policy 2012, 4, 145–181. [Google Scholar] [CrossRef] [Scilit]

Disclaimer/Publisher’s Note: The statements, opinions and data contained in all publications are solely those of the individual author(s) and contributor(s) and not of MDPI and/or the editor(s). MDPI and/or the editor(s) disclaim responsibility for any injury to people or property resulting from any ideas, methods, instructions or products referred to in the content. |
© 2026 by the authors. Licensee MDPI, Basel, Switzerland. This article is an open access article distributed under the terms and conditions of the Creative Commons Attribution (CC BY) license.