


Abstract
This study presents a hybrid CFD–ε–NTU–neural network framework for evaluating the thermal performance of compact heat exchangers installed in confined nacelle environments under severe space and weight constraints. Airflow was simulated using steady Reynolds-Averaged Navier–Stokes (RANS) equations with the shear stress transport (SST) k–ω turbulence model, while heat-exchanger performance was evaluated using the effectiveness–number of transfer units (ε–NTU) method. To provide a continuous functional interface between the analytical model and the CFD solver, a neural network was employed as a representation of ε–NTU-based thermal performance. The proposed framework was validated against wind tunnel experiments, showing good agreement with measured data, with a maximum deviation of approximately 2.2 °C in coolant outlet temperature. Using the validated framework, a multi-objective redesign of a compact heat exchanger was performed under practical installation constraints. The selected design achieved a 28.4% reduction in heat exchanger mass while maintaining cooling performance comparable to the baseline design. Installation performance was evaluated numerically in a modified nacelle configuration, where the redesigned heat exchanger increased the air mass flow rate by approximately 13% under identical fan operating conditions because of its reduced air-side flow resistance. The proposed framework provides a practical and efficient approach for system-level design and installation analysis of compact heat exchangers for aircraft thermal management systems.
1. Introduction
The increasing interest in hybrid-electric propulsion systems for aviation is driven by the necessity to reduce fuel consumption, greenhouse gas emissions, and noise while maintaining high propulsion efficiency. Hybrid-electric architectures combine conventional engines with electric powertrains, resulting in higher power density and increased heat generation from electrical components such as motors, inverters, and batteries. Consequently, effective thermal management systems (TMS) have become a critical enabling technology for hybrid-electric aircraft applications [1,2,3]. Unlike conventional propulsion systems, hybrid-electric configurations often lack sufficient passive heat rejection capability, making active cooling systems based on liquid loops and compact heat exchangers (HX) essential. These heat exchangers must operate under severe constraints regarding available space, weight, and allowable pressure losses, particularly when installed inside confined enclosures such as nacelles or equipment bays [4]. Designing such systems requires accurate and robust prediction of cooling performance while accounting for complex airflow patterns and installation effects.
Extensive research has been conducted on thermal management strategies for hybrid-electric aircraft, consistently identifying TMS as one of the key technical challenges limiting overall system scalability [1,2]. To analyze such thermal management issues, computational fluid dynamics (CFD) has been widely employed as a primary tool for evaluating airflow and heat transfer characteristics in confined environments, particularly for systems incorporating compact heat exchangers installed under severe space constraints [5]. However, the internal geometries of compact heat exchangers are highly complex and characterized by fine-scale features. Fully resolving these geometries in three-dimensional CFD simulations often results in excessive computational cost and convergence difficulties. As a result, many recent numerical studies have adopted simplified representations of heat exchangers, such as porous media models or reduced-order models, to improve computational efficiency [6,7]. While these simplified approaches are effective in capturing overall airflow characteristics, coupling a reduced heat-exchanger performance model with an iterative CFD solver requires an appropriate representation of the thermal response as the local operating conditions evolve. For heat exchanger performance prediction, the effectiveness–number of transfer units (ε–NTU) method has been widely favored due to its strong physical foundation and high computational efficiency [8,9,10]. Nevertheless, direct implementation of an ε–NTU-based performance model within an iterative CFD solver requires repeated evaluation of the thermal response as the local operating conditions evolve. Because the ε–NTU formulation involves piecewise definitions such as the selection of the minimum heat-capacity rate, local changes in the response gradient may occur as operating conditions vary, which can complicate iterative coupling with the CFD solver.
Neural networks and other data-driven methods have been increasingly applied to thermal and fluid-flow systems for performance prediction and computationally efficient analysis. Neural networks have been used to model compact heat-exchanger performance [11], and data-driven approaches have also been combined with CFD for thermal-system analysis and optimization [12,13]. More recently, Zhang et al. [14] employed CFD-generated heat-transfer and pressure-drop data to construct a neural-network model for multi-objective optimization of a tube-fin heat exchanger, while Farajollahi et al. [15] used both artificial neural networks and response-surface methodology to represent numerically obtained thermo-hydraulic responses of a finned-tube heat exchanger for optimization. These studies demonstrate the utility of data-driven models as efficient functional representations of thermal-system responses.
In the present framework, however, the neural network serves a specific interfacing role. It does not replace either the CFD solution or the underlying ε–NTU heat-exchanger model. The nacelle airflow field is resolved by CFD, while the heat-exchanger thermal response is generated using the physics-based ε–NTU method. The neural network is used as a nonlinear continuous functional representation of the ε–NTU performance map for coupling the heat-exchanger thermal response with the CFD solver. Thus, the contribution of the present approach lies in the coupling architecture that integrates installed-flow CFD, a physics-based heat-exchanger model, and a continuous data-driven interface, rather than in the neural-network formulation itself.
In this study, a hybrid CFD–ε–NTU–neural network framework is proposed for the thermal performance evaluation of compact heat exchangers installed in confined enclosures. The neural network provides a smooth continuous functional representation of ε–NTU-based heat-exchanger performance for coupling with the CFD solver. The objectives of this study are to (i) develop and validate the coupled framework through wind tunnel experiments; (ii) perform a multi-objective redesign of a compact heat exchanger using the ε–NTU method; and (iii) evaluate the installed cooling performance of the baseline and redesigned heat exchangers within a common modified nacelle configuration. The results demonstrate that, within the modified nacelle configuration, replacement of the baseline heat exchanger with the redesigned heat exchanger increases the air mass flow rate by approximately 13% under identical fan operating conditions. The detailed research methodology and the specific integration process are described in the following section.
2. Numerical Methodology
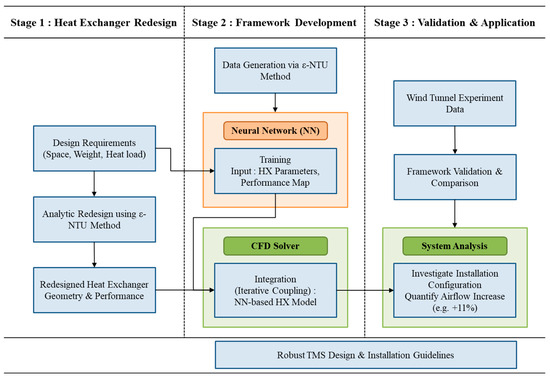
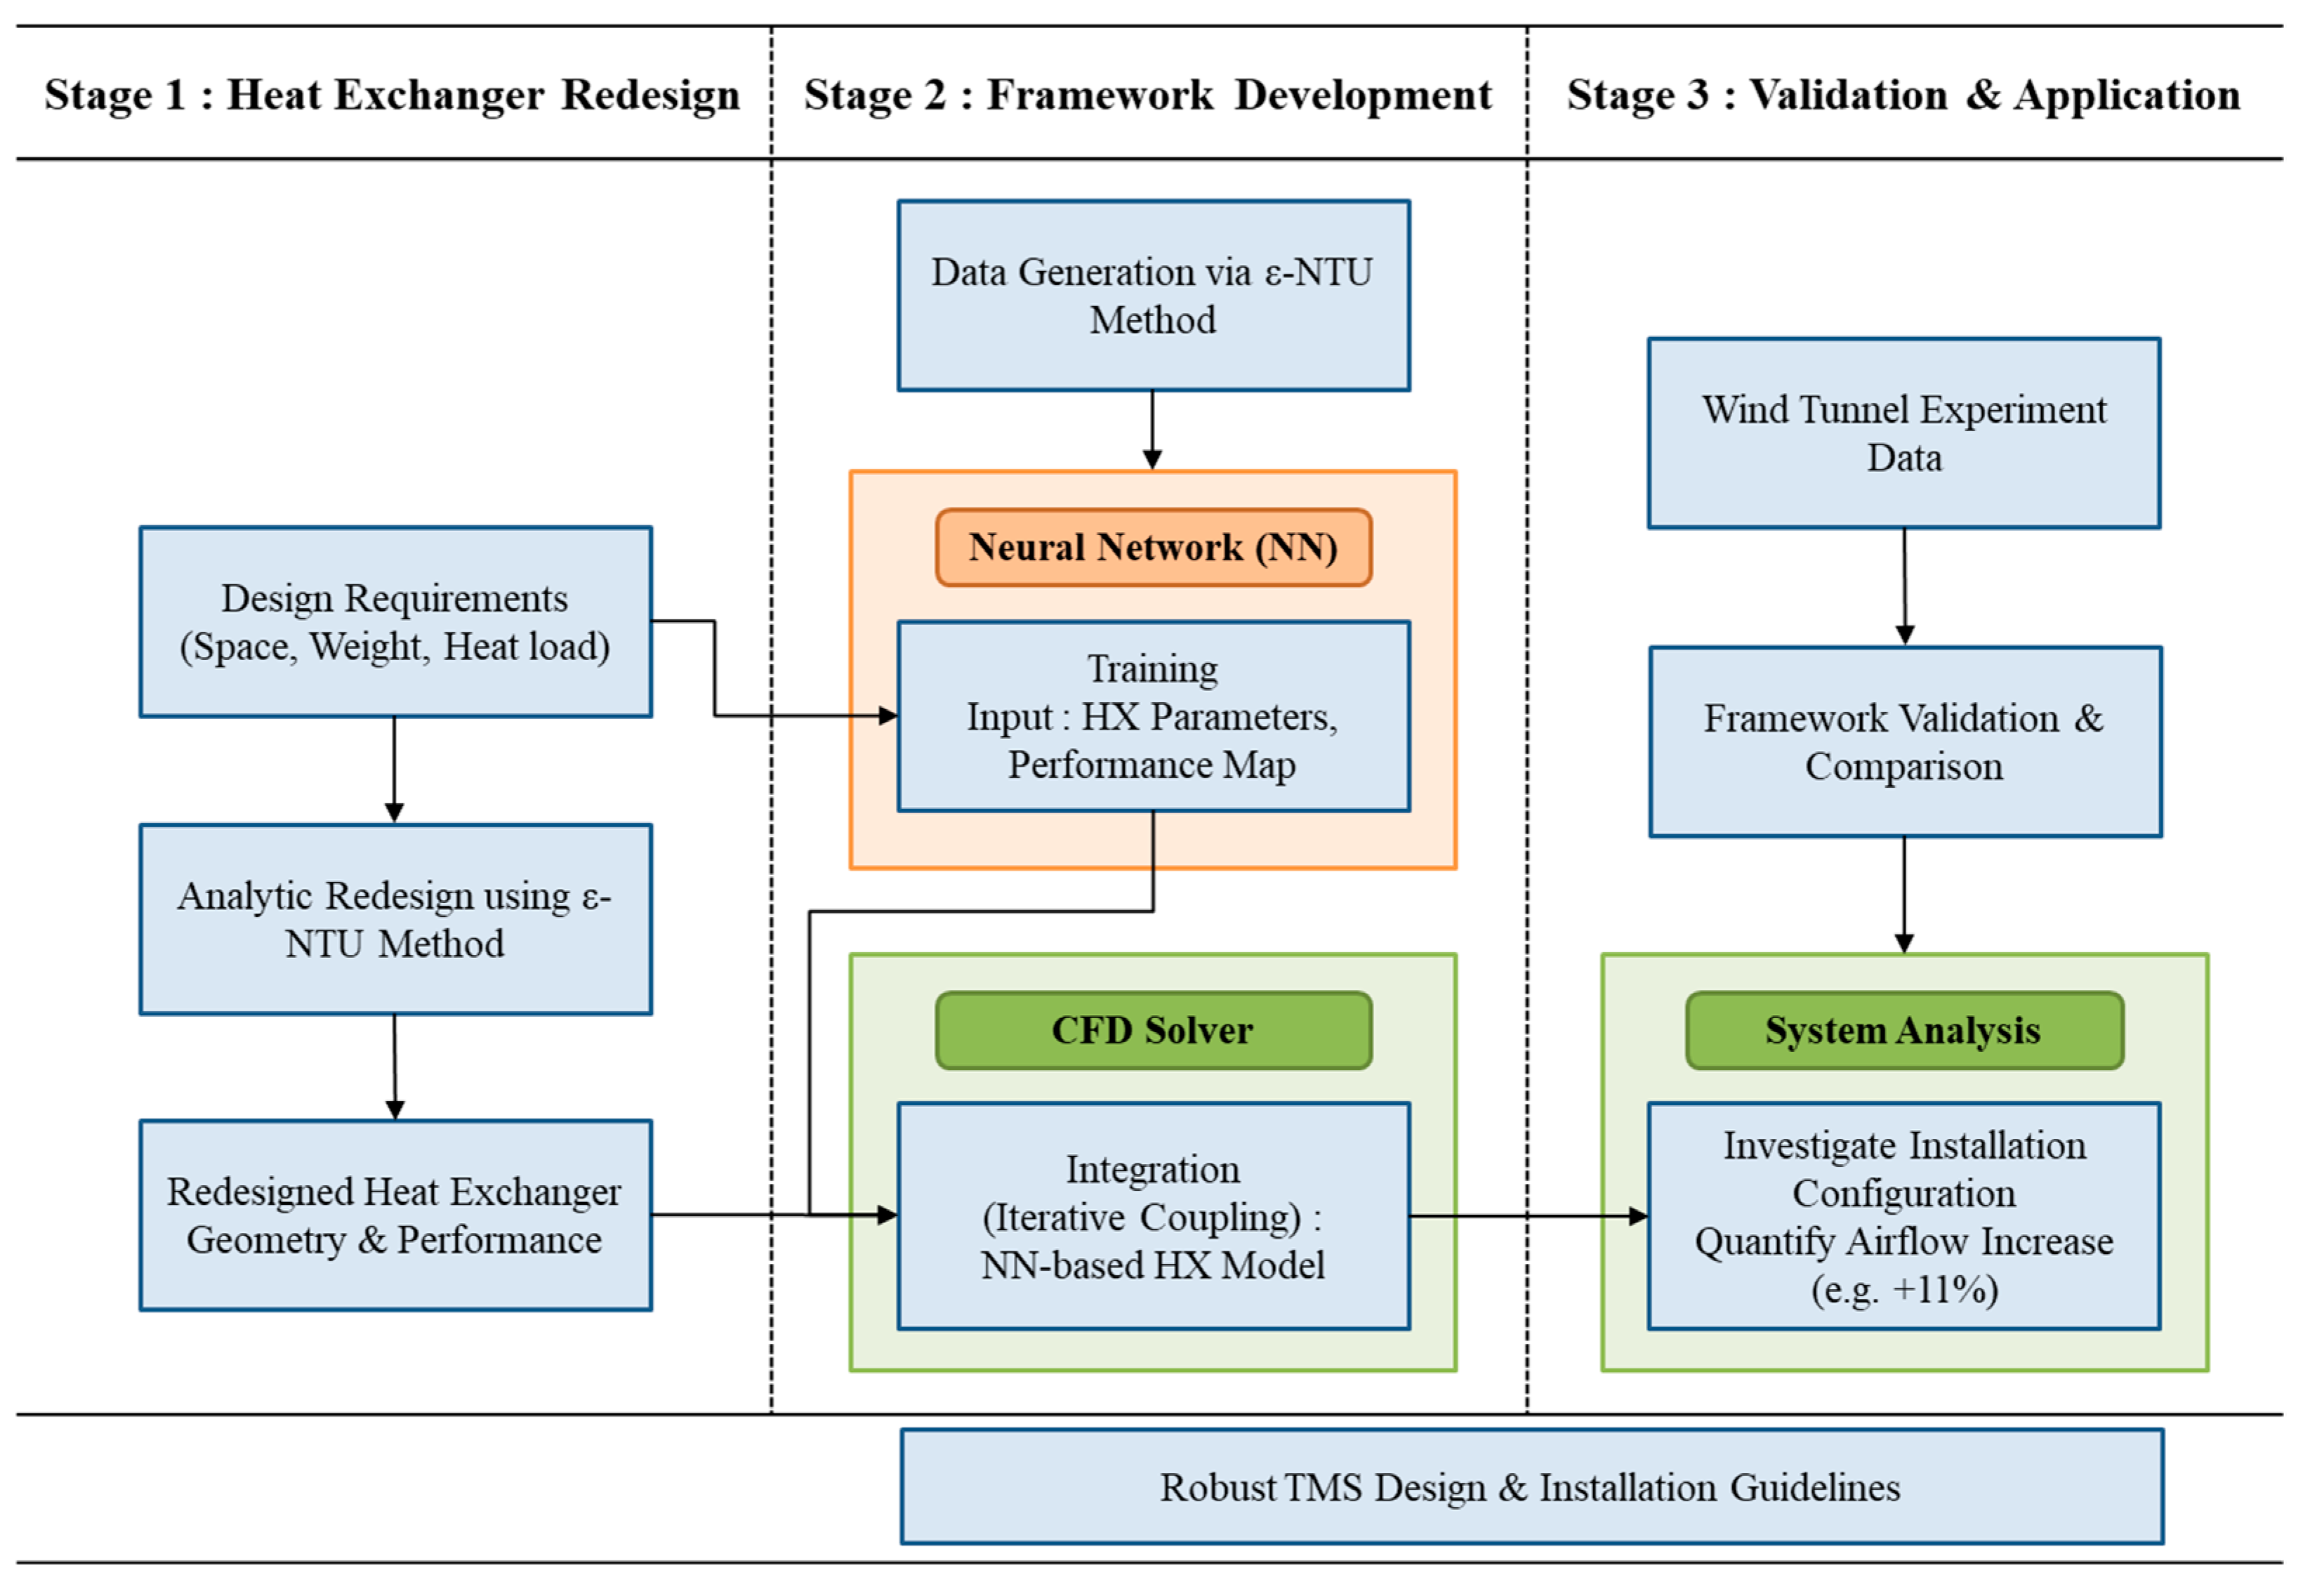
To achieve a high-fidelity performance evaluation of the redesigned compact heat exchanger, a systematic hybrid framework was developed. Figure 1 summarizes the overall framework adopted in this study, including heat exchanger redesign, framework development, experimental validation, and subsequent installation analysis. In the first stage, the HX is geometrically optimized using the ε–NTU method to satisfy the weight and volume constraints of hybrid-electric aircraft. The second stage involves the construction of a performance database and the training of a neural network to serve as a functional interface between the analytic model and the CFD solver. Finally, the integrated framework is validated against wind tunnel test results and applied to analyze the mounting effects within a confined enclosure.
Figure 1.
Overall research methodology and integration of the CFD–ε–NTU–neural network framework.
2.1. Description of the Cooling System and Heat Exchanger
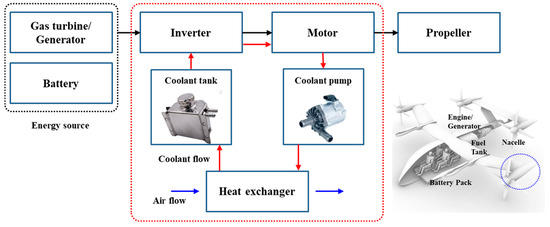
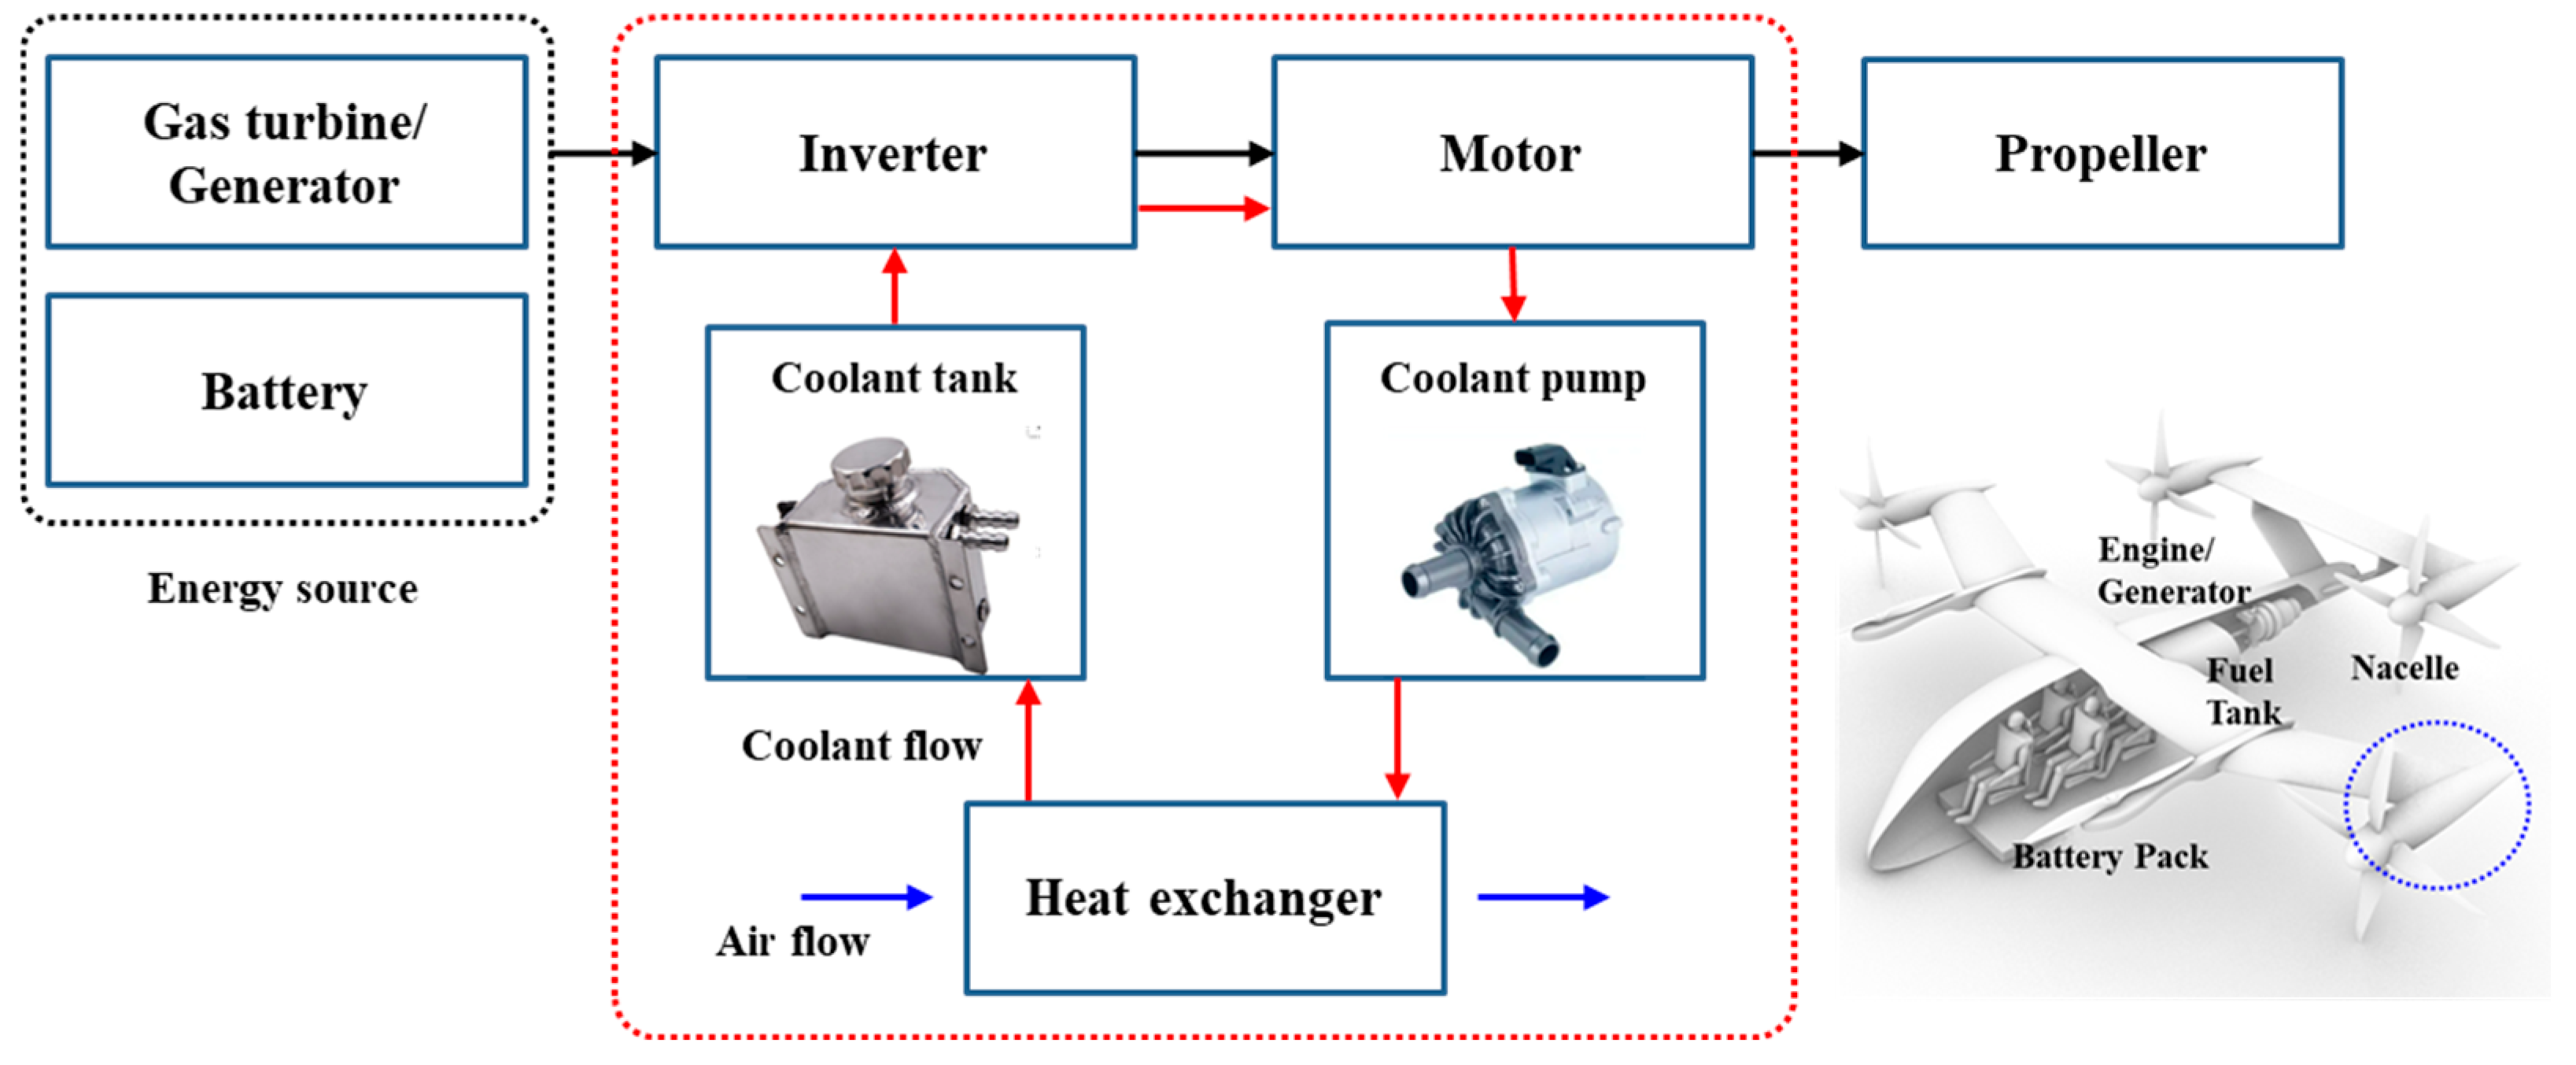
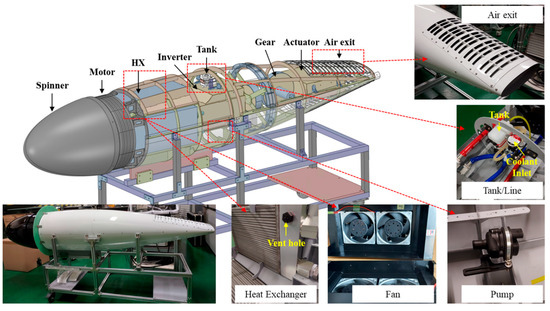
This section describes the configuration of the cooling system and heat exchangers installed within the nacelle of a hybrid-electric propulsion system. As illustrated in Figure 2, the nacelle-integrated thermal management system includes the electric motor, inverter, and associated cooling components. The cooling system operates under severe space and weight constraints and is essential for maintaining the thermal integrity of high-power electrical components.
Figure 2.
Thermal management architecture within the nacelle of the hybrid-electric propulsion system. The red dotted rectangle indicates the thermal management system.
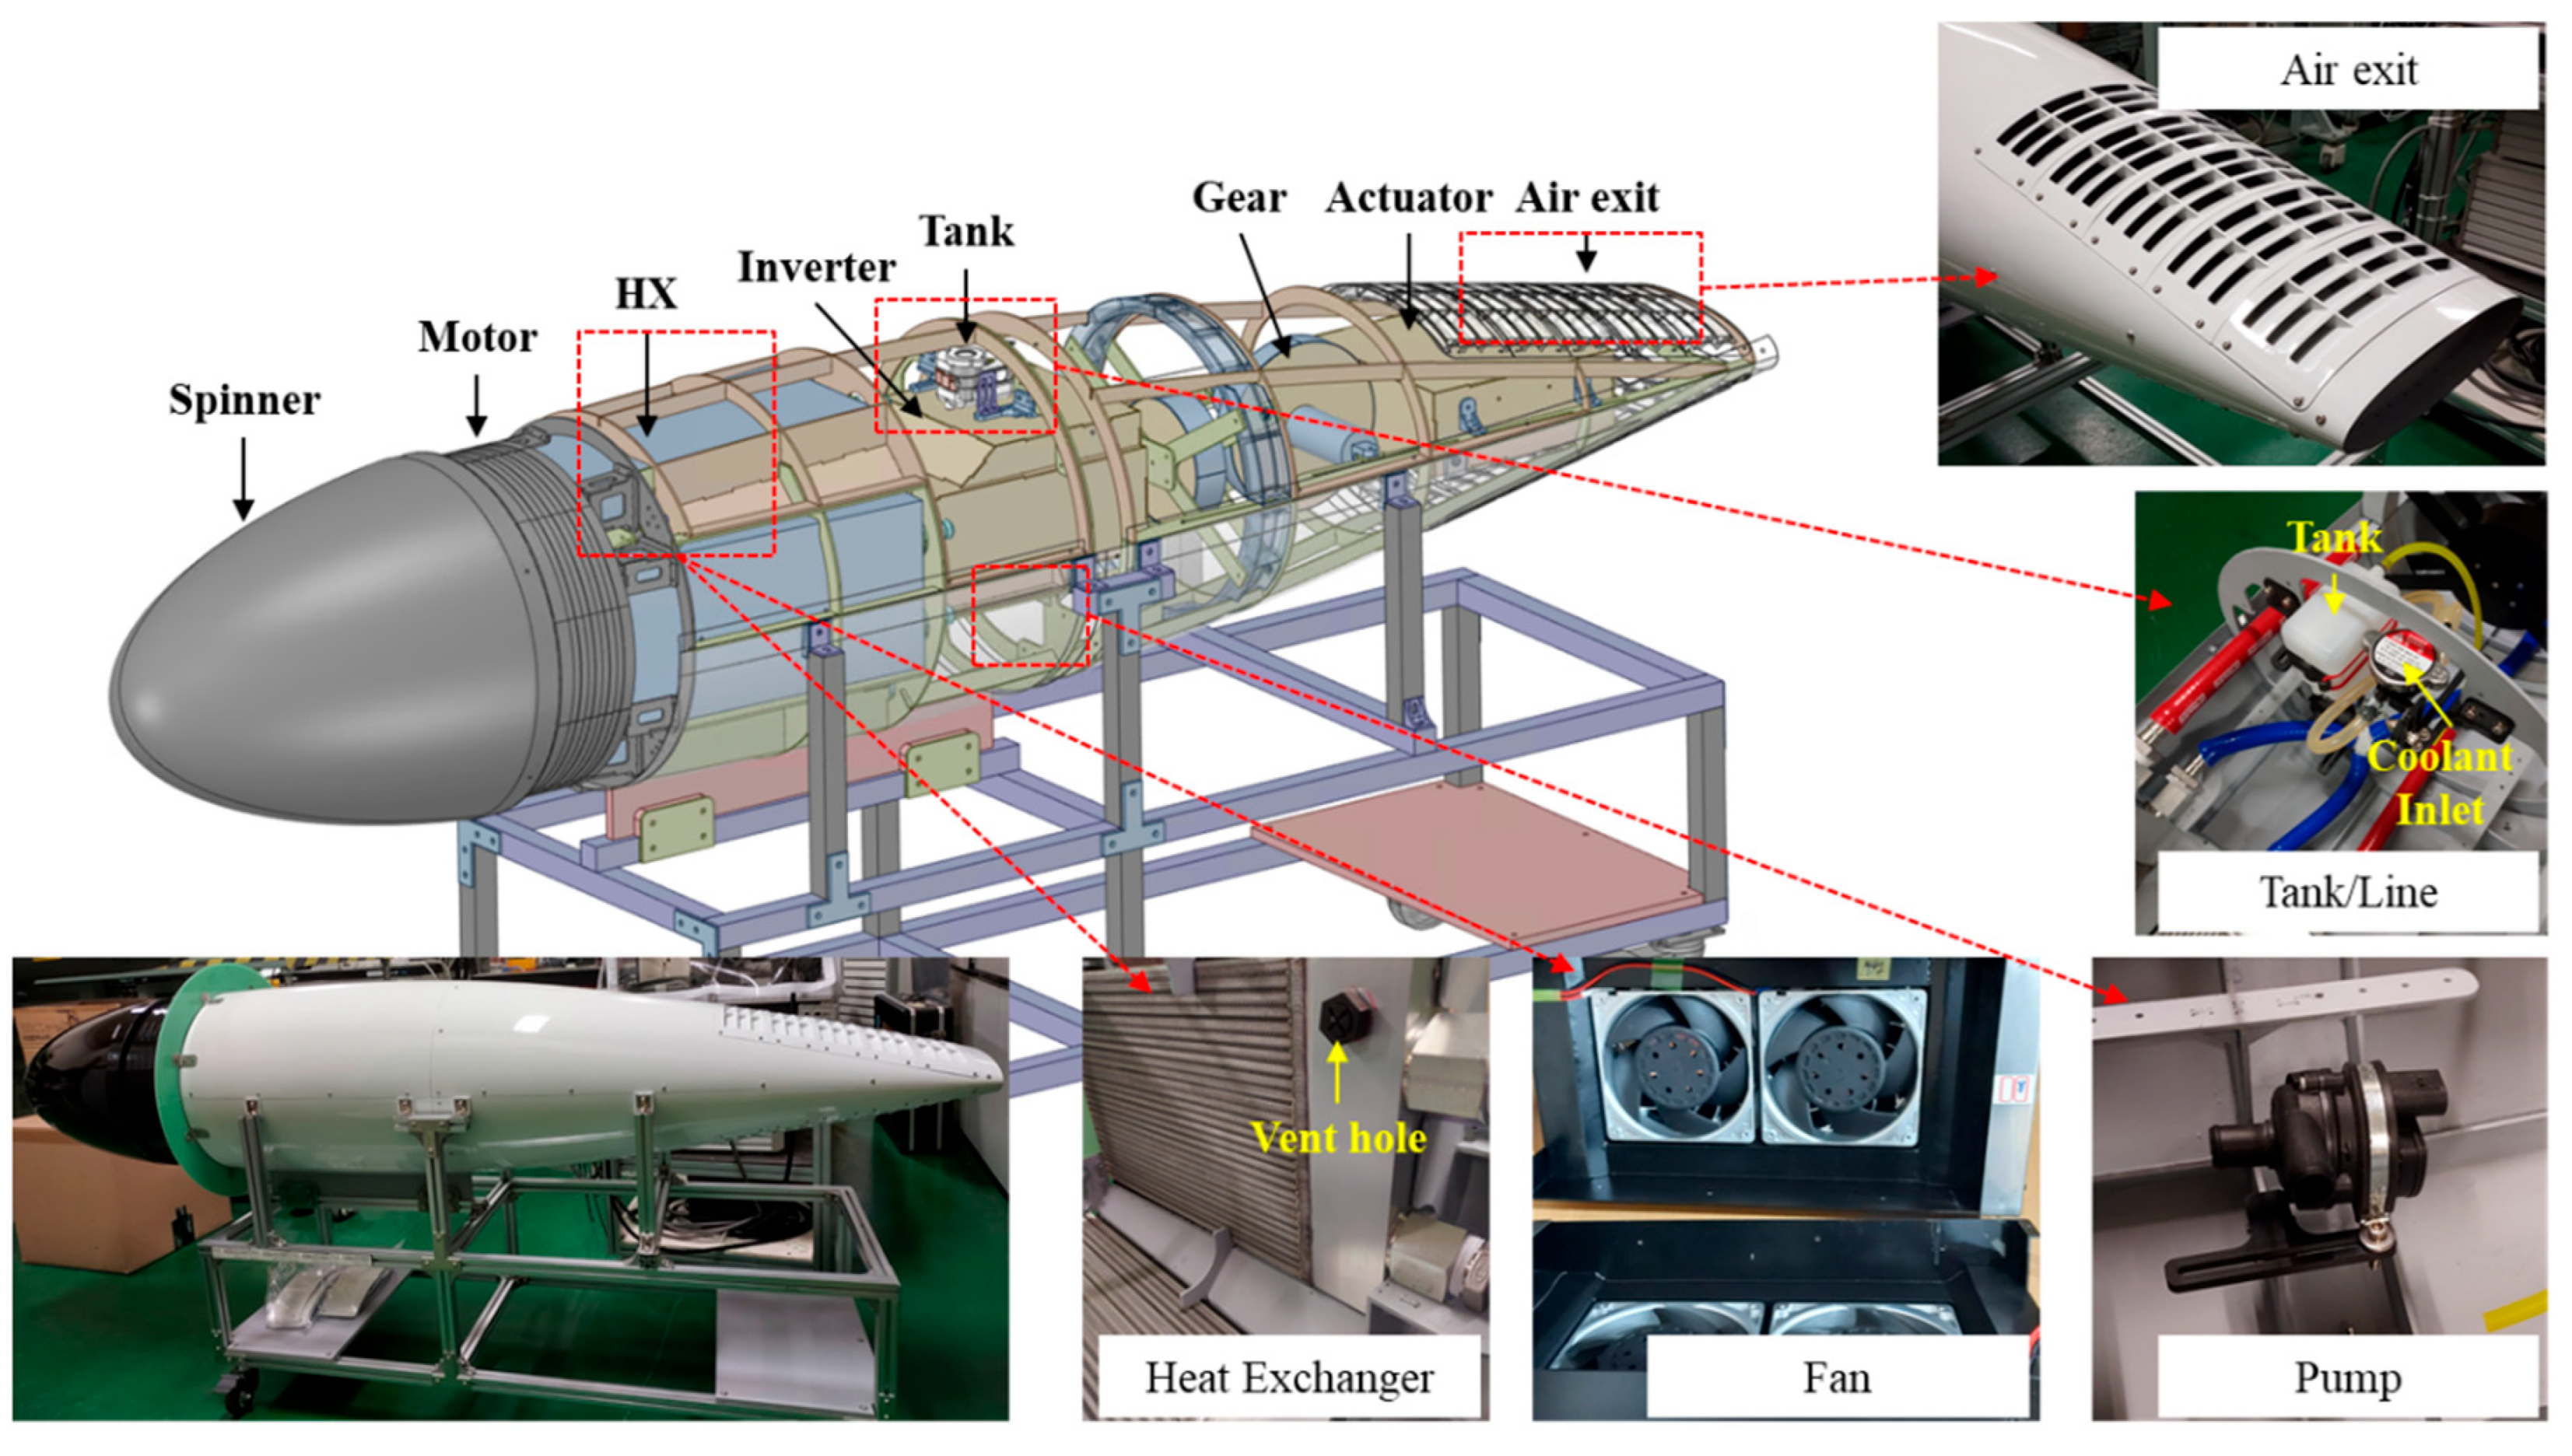
Figure 3 shows the internal configuration of the nacelle, illustrating the arrangement of major components and cooling system elements considered in the present study. A spinner is located at the upstream end, followed by the electric motor. Downstream of the motor, four compact liquid-to-air heat exchangers with offset strip fins are arranged in an annular configuration around the nacelle axis. Auxiliary components, including the inverter, coolant pump, coolant tank, coolant inlet port, and tilting mechanism, are installed between the heat exchangers, forming a confined and highly integrated internal layout.
Figure 3.
Internal configuration of the nacelle, showing the arrangement of major components and cooling system elements.
The air intake of the heat exchangers is located in the annular region between the electric motor and the heat exchangers, while the air outlet is positioned at the rear of the nacelle in the form of louvers. Ambient air enters the nacelle through the intake region downstream of the motor and is guided toward the heat exchangers by the confined internal flow path. As the air passes through the heat exchanger cores, heat is rejected from the liquid coolant to the air stream. The heated air subsequently flows past internal components, including the inverter and the tilting mechanism, before exiting the nacelle through the louvered outlet. Due to the confined geometry and the arrangement of internal components, installation effects strongly influence the air-side mass flow rate through the heat exchangers and, consequently, the overall cooling performance.
The coolant loop configuration is illustrated in Figure 3. The liquid coolant is circulated by a pump installed within the nacelle and supplied to the heat exchangers for heat rejection. After passing through the heat exchangers, the coolant is first delivered to the inverter and subsequently to the electric motor before returning to the heat exchangers, forming a closed-loop system. To ensure the reliable operation of the power electronics, the coolant temperature supplied to the inverter is required to remain below 50 °C under all operating conditions. The geometric specifications and operating conditions of the baseline heat exchanger are summarized in Table 1. This system configuration represents the baseline operational layout and serves as the foundation for the numerical analysis described in the following sections.
Table 1.
Geometric and operating parameters of the heat exchanger.
2.2. CFD Modeling and Computational Domain for Wind Tunnel Validation
To validate the proposed numerical framework, CFD simulations were conducted under conditions corresponding to the wind tunnel experiments. The same governing equations, turbulence model, and heat exchanger modeling approach used throughout this study were applied, while the computational domain was constructed to replicate the wind tunnel test configuration.
The simulations were performed using ANSYS CFX (Release 2023 R1) [16], which solves the three-dimensional compressible Reynolds-Averaged Navier–Stokes (RANS) equations. The shear stress transport (SST) k–ω turbulence model with automatic near-wall treatment was employed, and steady-state simulations were conducted for all validation cases. To reproduce the wind tunnel conditions, a total-pressure boundary condition was prescribed at the inlet for the wind-off condition, whereas a uniform velocity boundary condition corresponding to the wind tunnel operating condition was applied for the wind-on cases. A static-pressure boundary condition was imposed at the wind tunnel outlet. The detailed boundary conditions and turbulence specifications are summarized in Table 2.
Table 2.
Boundary conditions and modeling parameters applied in the wind tunnel validation simulations.
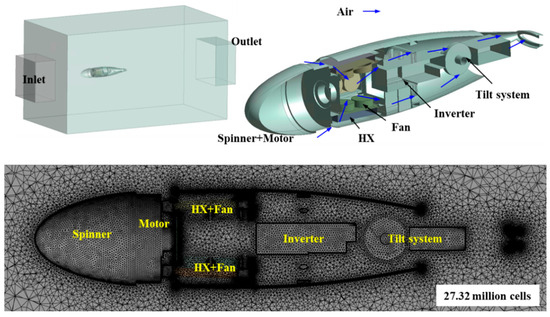
As illustrated in Figure 4, the computational domain reproduced the wind tunnel test section and the nacelle installed within it. Only the nacelle was modeled, excluding propeller-induced flow effects. Internal nacelle components, including the motor, inverter, and tilting mechanism, were represented using simplified geometries to account for their blockage effects. The cooling fans installed downstream of the heat exchangers were represented using pressure-jump models without explicitly resolving the fan blades. For the validation calculations, a prescribed pressure rise corresponding to each experimental fan operating condition was applied at the fan outlet.
Figure 4.
Computational domain used for wind tunnel validation, including the nacelle geometry and unstructured grid system.
The heat exchangers were represented as porous domains to account for the air-side pressure loss. The streamwise momentum loss was modeled using linear and quadratic resistance terms, while the transverse resistance coefficients were specified to be ten times the corresponding streamwise values to suppress nonphysical cross-flow through the porous core. The thermal behavior of each heat exchanger was coupled to the CFD solution through the neural-network representation described in Section 2.4. The air mass flow rate and air temperature obtained from the CFD solution were supplied to the neural network, while the coolant flow rate and thermal load were prescribed according to each test condition. The neural network predicted the overall heat-transfer conductance per unit heat-transfer area (UA/A), the volumetric heat-transfer rate (Q/V), and the coolant inlet and outlet temperatures. The predicted UA/A and Q/V values were directly supplied to the porous heat-exchanger domain through the expression functionality of ANSYS CFX as the effective heat-transfer coefficient and volumetric heat source, respectively. These quantities were subsequently applied to the porous heat-exchanger domain.
An unstructured mesh consisting of approximately 27 million cells was generated for the computational domain. Local mesh refinement was applied around the heat exchangers, cooling fans, and internal structures. Near-wall inflation layers were applied with a first-layer height of 0.1 mm and a growth ratio of 1.2. The wall (y+) was below approximately 11 over most of the computational domain, although locally higher values occurred near the fan pressure-jump regions and downstream of the heat exchangers. A mesh-sensitivity assessment confirmed that the baseline mesh provided sufficiently mesh-independent predictions of the principal thermal and flow quantities.
Convergence was assessed based on the RMS residual histories, mass and energy conservation imbalances, and the stabilization of the monitored flow and thermal quantities. A residual target of 10−6 was specified, while the overall convergence was determined by considering the residual behavior together with the conservation imbalances and the variation in the monitored quantities.
2.3. ε–NTU-Based Heat Exchanger Thermal Performance Model
The thermal performance of the heat exchangers installed within the nacelle was evaluated using the ε–NTU method. The ε–NTU approach provides a physically consistent and computationally efficient means of predicting heat exchanger performance without explicitly resolving detailed internal fin geometries, making it well suited for system-level thermal analysis and subsequent integration with CFD simulations.
In the present study, the heat exchangers operate under crossflow conditions, with the hot and cold working fluids flowing without mixing. For a given operating condition, the heat transfer rate (Q) is expressed as
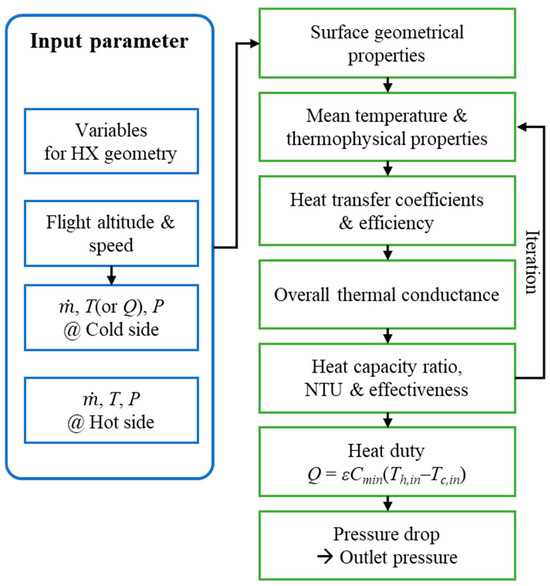
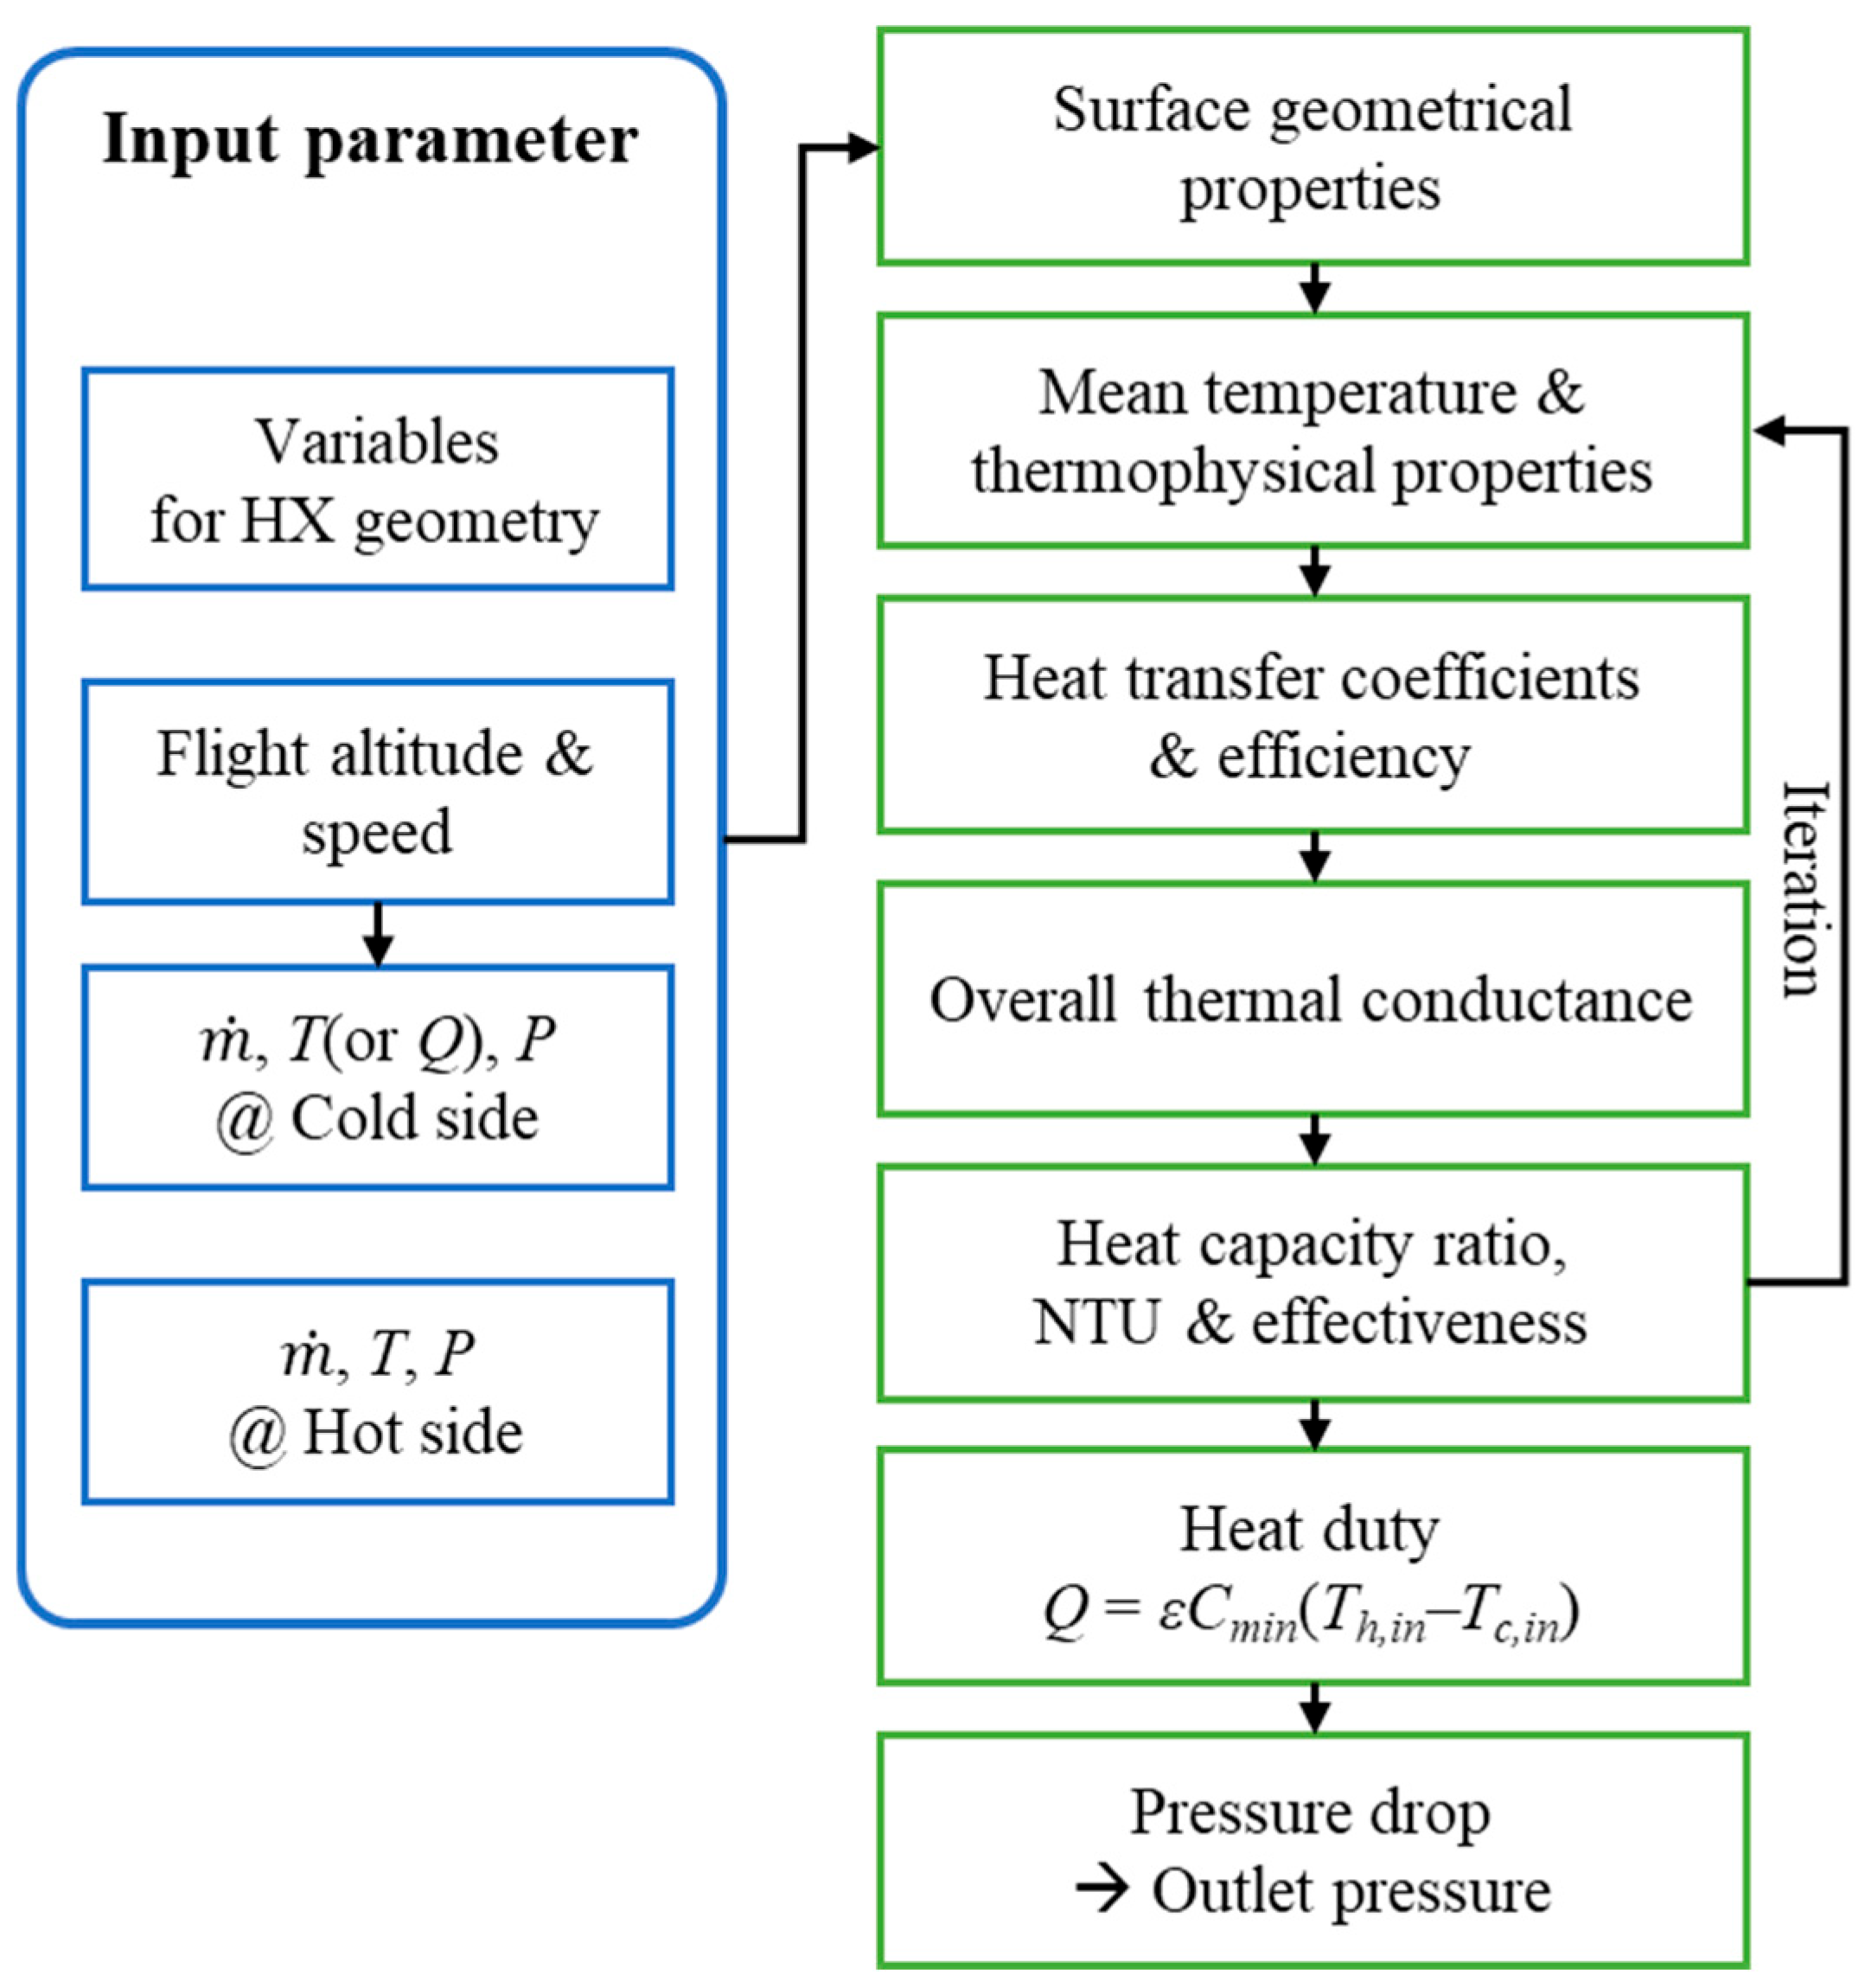
where ε denotes the heat exchanger effectiveness, Cmin is the minimum heat capacity rate, and Th,in and Tc,in are the inlet temperatures of the hot and cold fluids, respectively. The effectiveness is obtained as a function of the number of transfer units (NTU) and the heat capacity rate ratio using standard ε–NTU correlations for crossflow heat exchangers [10]. The NTU value is calculated from the overall heat transfer conductance (UA) and the minimum heat capacity rate. Once the heat transfer rate is determined, the inlet and outlet temperatures of the coolant and air are calculated based on energy balance relations. The overall calculation procedure, including the relationships between flow conditions, NTU, effectiveness, and thermal performance outputs, is summarized in Figure 5. Detailed formulations of the ε–NTU method can be found in Reference [10].
Figure 5.
Overall calculation procedure of the ε–NTU method used for heat exchanger performance evaluation.
For a fixed heat exchanger geometry, the thermal performance can be predicted solely based on the flow conditions of the coolant and air. The coolant was assumed to be incompressible, and the thermal load corresponding to the heat absorbed from the inverter and motor was prescribed as an input parameter. The coolant flow rate was specified according to the cooling system configuration described in Section 2.1. The air-side mass flow rate and inlet temperature at the heat exchanger were obtained from the CFD simulations described in Section 2.2. Based on these operating conditions, the ε–NTU calculations provide thermal-performance quantities including the overall heat-transfer conductance (UA), heat rejection rate (Q), and coolant inlet and outlet temperatures. For construction of the neural-network database and subsequent CFD coupling, UA and Q were expressed on a volumetric/geometric basis as UA/A and Q/V, respectively. Accordingly, UA/A, Q/V, coolant inlet temperature, and coolant outlet temperature were used as the neural-network outputs described in Section 2.4. These parameters characterize the thermal behavior of the heat exchanger under given air-side and coolant-side operating conditions. Among these quantities, UA/A and Q/V serve as the key quantities for coupling with the CFD solver, while the coolant inlet and outlet temperatures are used to ensure thermal consistency of the cooling-system model. These ε–NTU-based thermal performance results form the basis for the neural network-based functional representation described in the following section.
2.4. Neural Network-Based Functional Representation and Coupling Strategy
During the CFD simulations, airflow around the nacelle is resolved using Reynolds-Averaged Navier–Stokes (RANS) equations, including both the external flow around the nacelle and the internal flow through the nacelle cooling passages. As the CFD solution iteratively converges, the air-side flow conditions at the heat exchanger domain vary, whereas the coolant-side operating conditions remain prescribed according to the cooling system configuration described in Section 2.1. Consequently, ε–NTU-based thermal performance information must be supplied to the CFD solver as a continuous functional relationship over the range of operating conditions encountered during the iterative solution. In the ε–NTU formulation, the minimum heat-capacity rate is defined as , and the fluid stream that determines can therefore switch as the operating condition changes. Although the ε–NTU solution remains physically consistent, this piecewise definition can introduce local changes in the response gradient near the switching region. Because the air-side operating condition is continuously updated during CFD iterations, such local changes in the ε–NTU response were considered a potential source of difficulty for iterative convergence. To provide a smooth functional representation of the resulting thermal-performance map, a neural-network model was constructed from ε–NTU-generated data. The neural network does not replace the ε–NTU method; rather, it represents the ε–NTU-based thermal response in a smooth and continuous functional form for integration with the CFD solver.
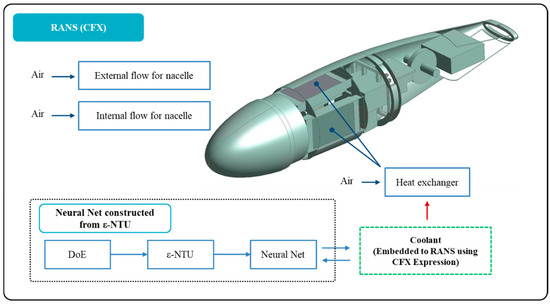
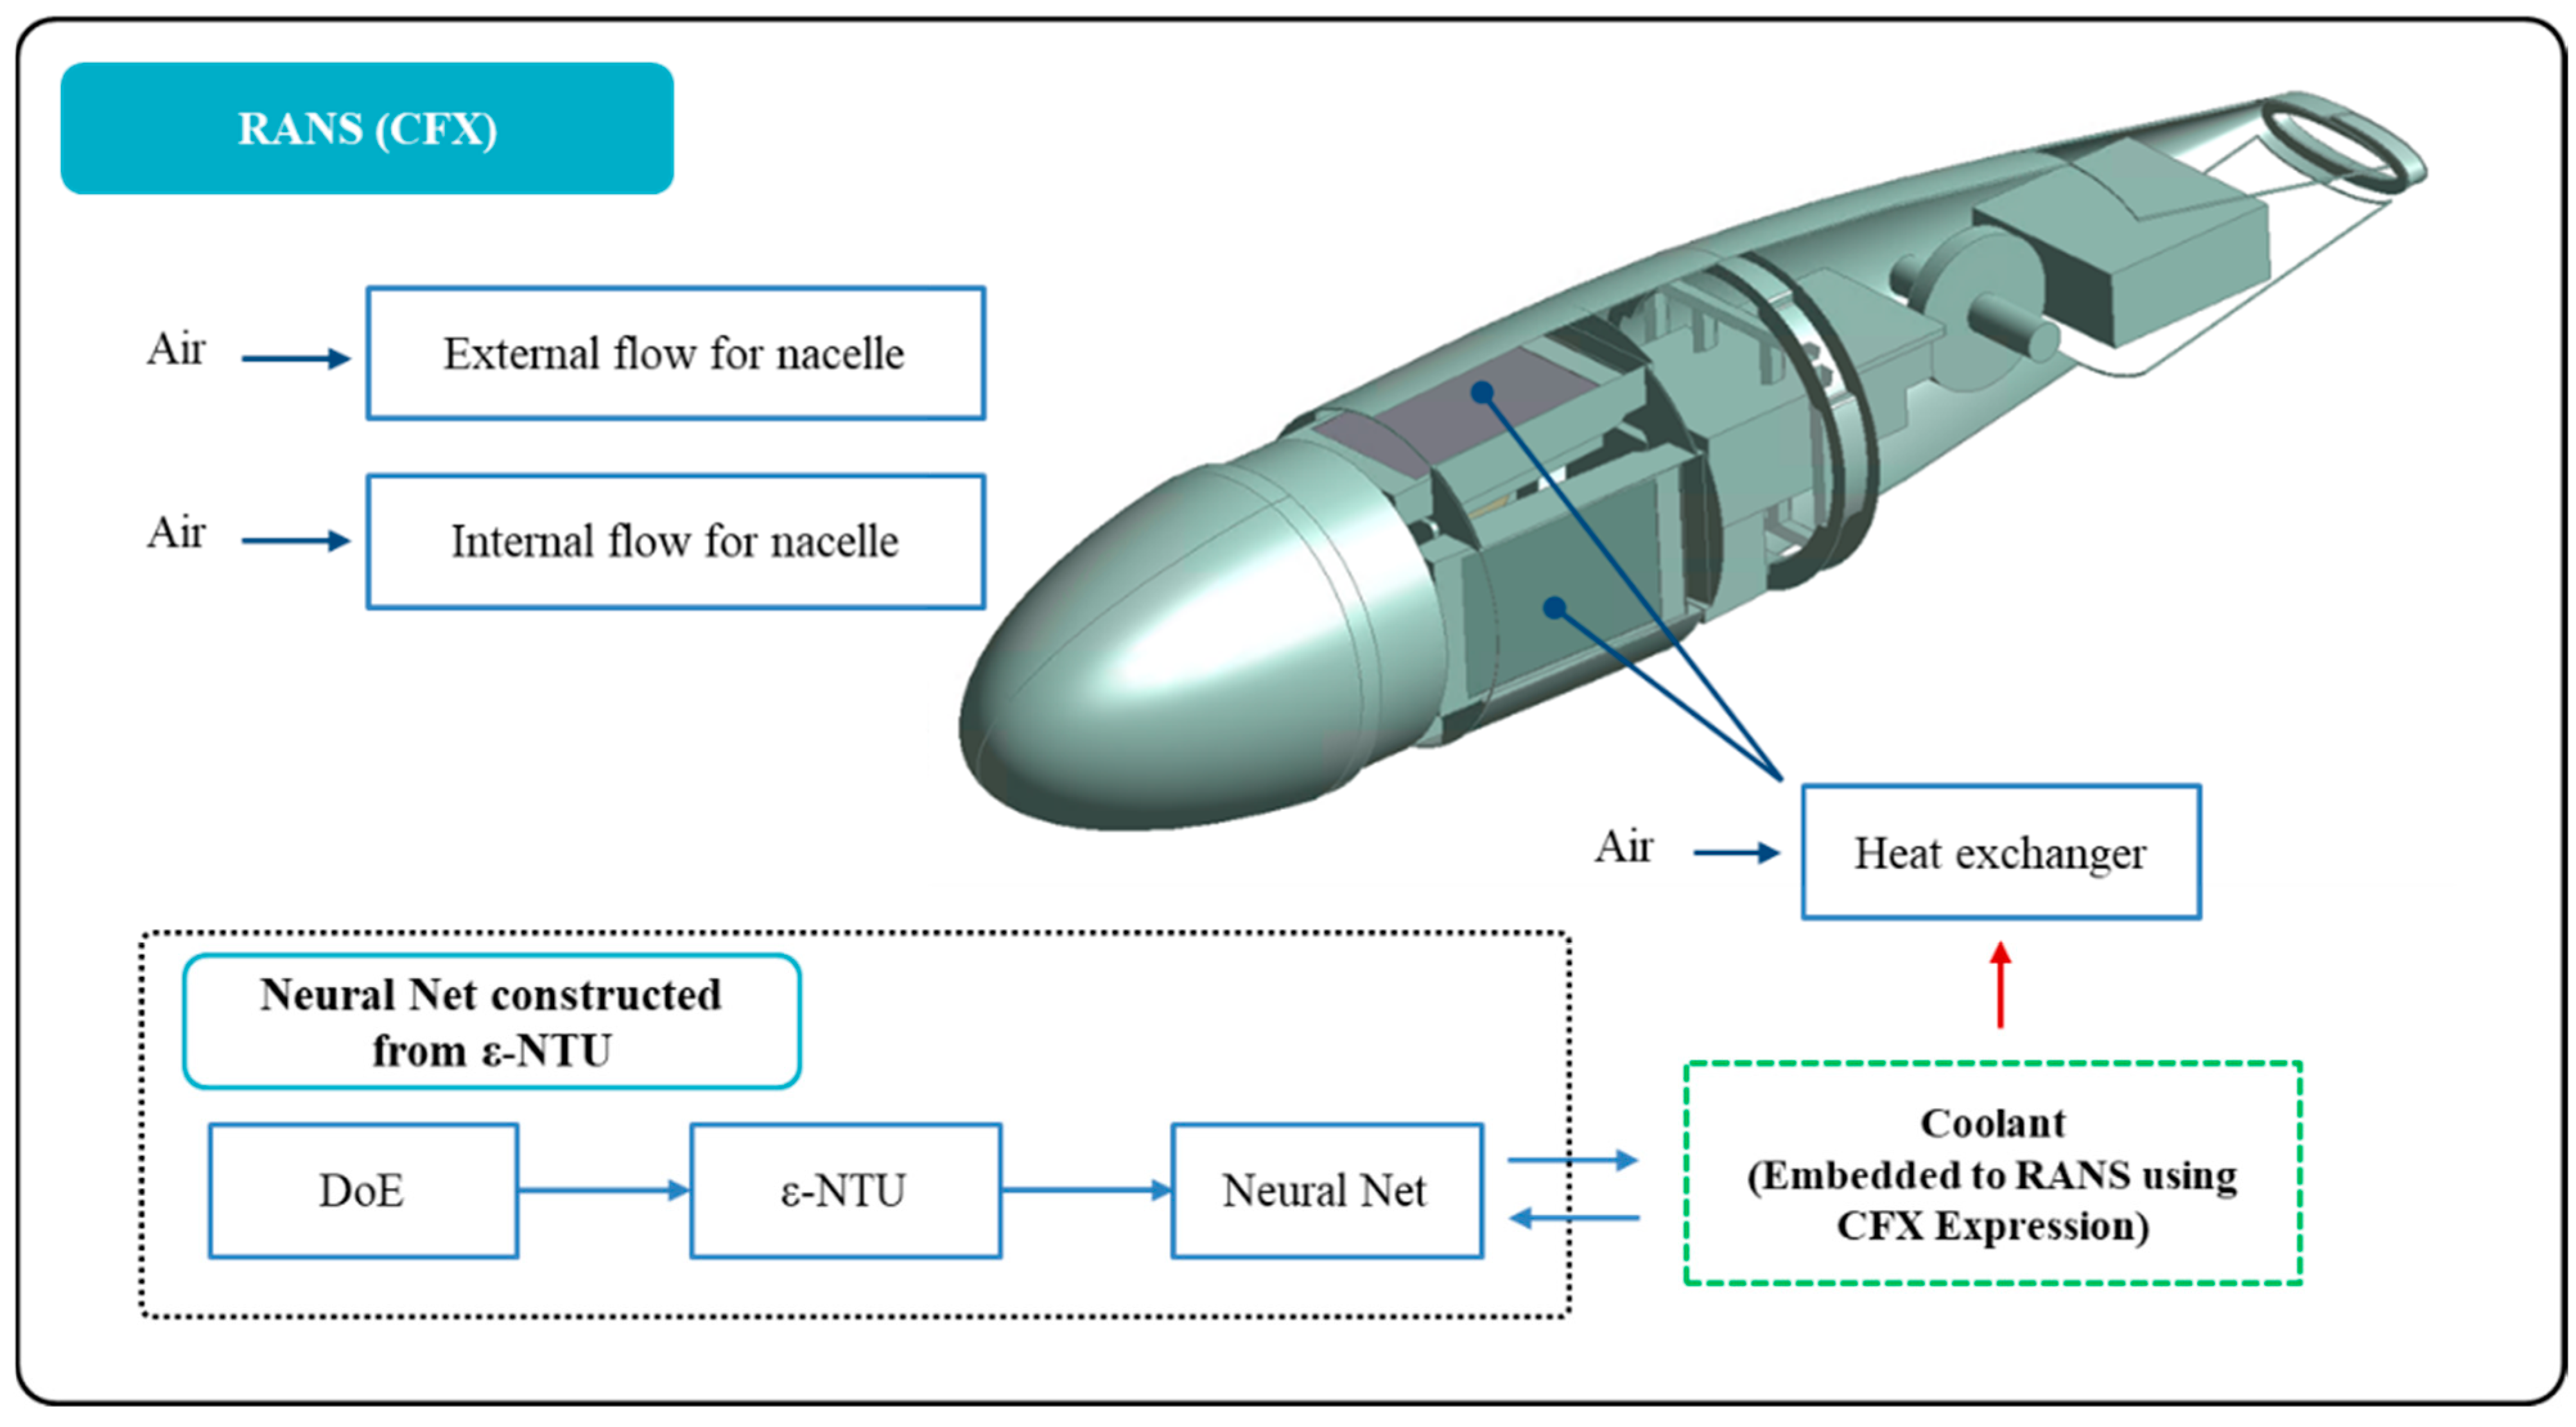
The overall coupling framework adopted in this study is illustrated in Figure 6. In this framework, both the external and internal airflow fields around the nacelle are solved using RANS-based CFD. The air-side mass flow rate and inlet temperature at the heat exchanger are extracted from the CFD solution and supplied to the neural network. The neural network was constructed using ε–NTU-based data generated through a design of experiments (DoE) and provides four thermal-performance outputs: the overall heat-transfer conductance per unit heat-transfer area (UA/A), volumetric heat-transfer rate (Q/V), coolant inlet temperature, and coolant outlet temperature. Among these outputs, UA/A and Q/V are embedded into the CFD solver using the expression functionality of ANSYS CFX, while the coolant temperatures are used to maintain thermal consistency of the cooling-system model. In this approach, only the air-side flow is explicitly solved in CFD, whereas the coolant-side thermal behavior is represented through the ε–NTU-based neural network model without explicitly resolving the coolant flow domain.
Figure 6.
Coupling strategy between the CFD solver and the ε–NTU-based neural network model for the analysis of nacelle-integrated heat exchangers. The light blue arrows indicate the flow of information through the ε–NTU-based neural-network model generation and the bidirectional coupling between the neural-network model and the CFD solver.
The neural-network database consisted of 581 ε–NTU-based samples, including 81 points generated using a four-factor, three-level full-factorial design (34 = 81) and 500 additional randomly sampled operating points. The four input variables were the air mass flow rate, air inlet temperature, coolant mass flow rate, and coolant thermal load. The ranges and the three levels used for the full-factorial design are summarized in Table 3. The neural-network models were developed using the Neural platform in JMP® 18 [17]. A single hidden layer with six nodes was employed, while all other neural-network settings were retained at the JMP default values. In JMP, the hidden-layer activation function is the hyperbolic tangent (TanH) function. The default holdback validation proportion of 0.3333 was used, resulting in 387 samples for training and 194 samples for validation. No additional user-defined normalization or covariate transformation was applied. The detailed fitting algorithm, loss formulation, and stopping procedure followed the standard implementation of the JMP Neural platform described in the JMP documentation [17]. The neural network had four outputs: the overall heat-transfer conductance per unit heat-transfer area (UA/A), volumetric heat-transfer rate (Q/V), coolant inlet temperature, and coolant outlet temperature.
Table 3.
Input ranges and levels used to generate the ε–NTU database for neural-network modeling.
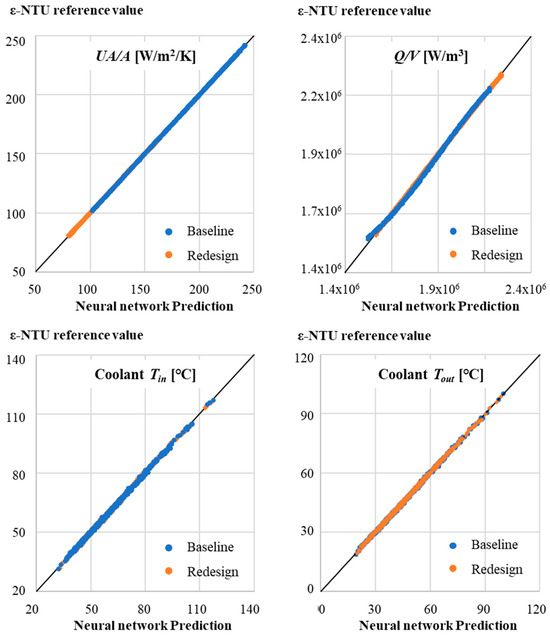
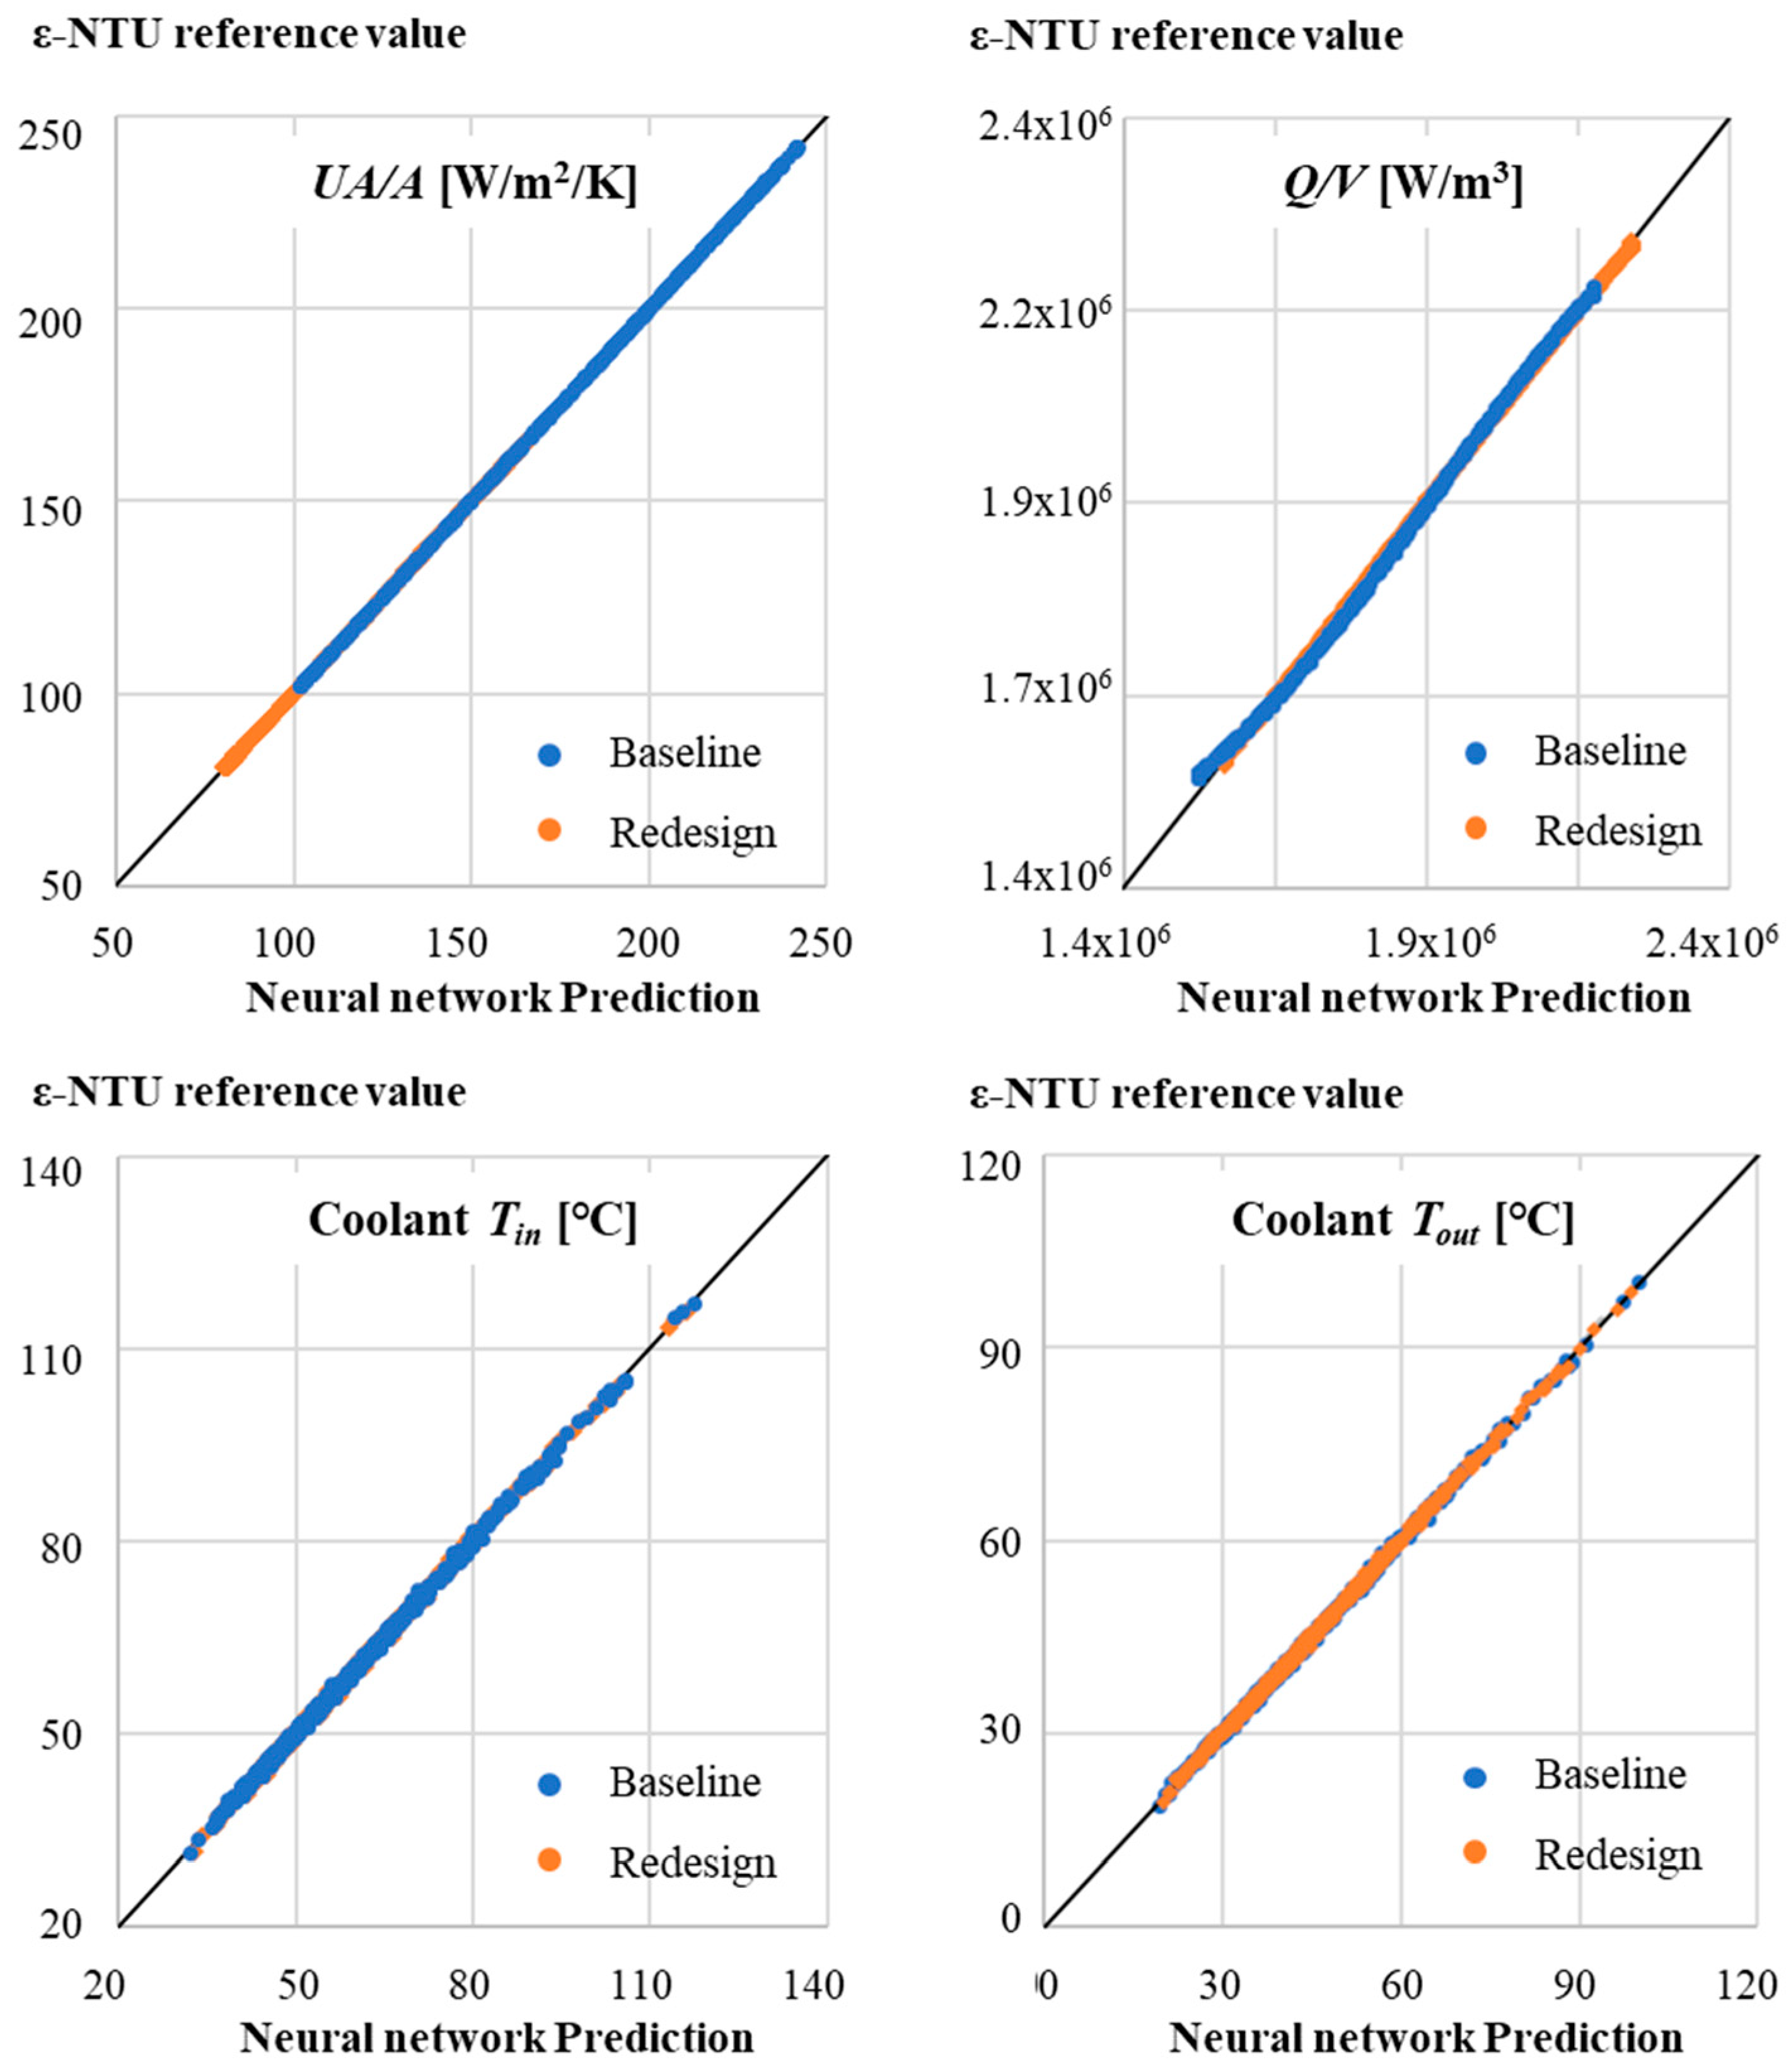
The accuracy of the neural-network-based functional representation was assessed using both the complete ε–NTU database and the holdback validation data. Figure 7 compares the neural-network predictions with the corresponding ε–NTU values for all 581 samples in the generated database, providing an overall view of the agreement across the modeled operating range. Quantitative validation metrics were evaluated separately using the 194-sample holdback validation set. In addition to the coefficient of determination (R2), the root average squared error (RASE) and mean absolute deviation were used to quantify the prediction errors. The validation statistics for the baseline and redesigned heat-exchanger models are summarized in Table 4. The validation R2 values ranged from 0.9974 to 1.0000 for the baseline heat exchanger and from 0.9985 to 0.9999 for the redesigned heat exchanger, demonstrating close agreement between the neural-network predictions and the ε–NTU reference values over the range of operating conditions considered.
Figure 7.
Comparison between neural-network predictions and reference ε–NTU values for all 581 samples in the generated database. The diagonal line represents the 1:1 relationship between the neural-network predictions and ε–NTU reference values.
Table 4.
Validation statistics of the neural-network models for the baseline and redesigned heat exchangers.
All analyses presented in this study were conducted within the operating ranges used to construct the neural-network database. Therefore, the predictive reliability of the neural-network model outside these ranges has not been established. Application to substantially different heat-exchanger configurations or operating regimes would require additional ε–NTU data generation followed by retraining and validation of the neural-network model.
3. Experimental Setup and Model Validation
3.1. Wind Tunnel Experimental Setup
Wind tunnel experiments were conducted to validate the proposed CFD–ε–NTU–neural network framework by evaluating the cooling performance of the nacelle-mounted heat exchanger under controlled airflow conditions. These experiments were performed in a closed-circuit subsonic wind tunnel at Chungnam National University, featuring a test section of 1.8 m × 1.8 m × 5.2 m (width × height × length), a contraction ratio of 2.8:1, and an operating velocity range from 3 to 35 m/s. The flow non-uniformity and turbulence intensity in the test section were maintained below 0.5% and 0.4%, respectively [18].
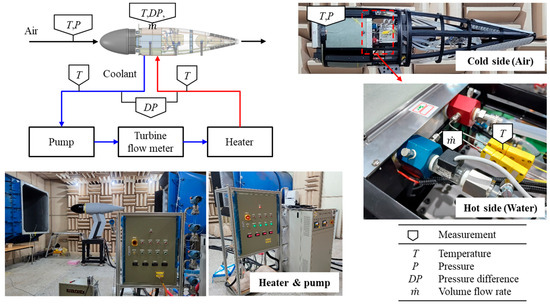
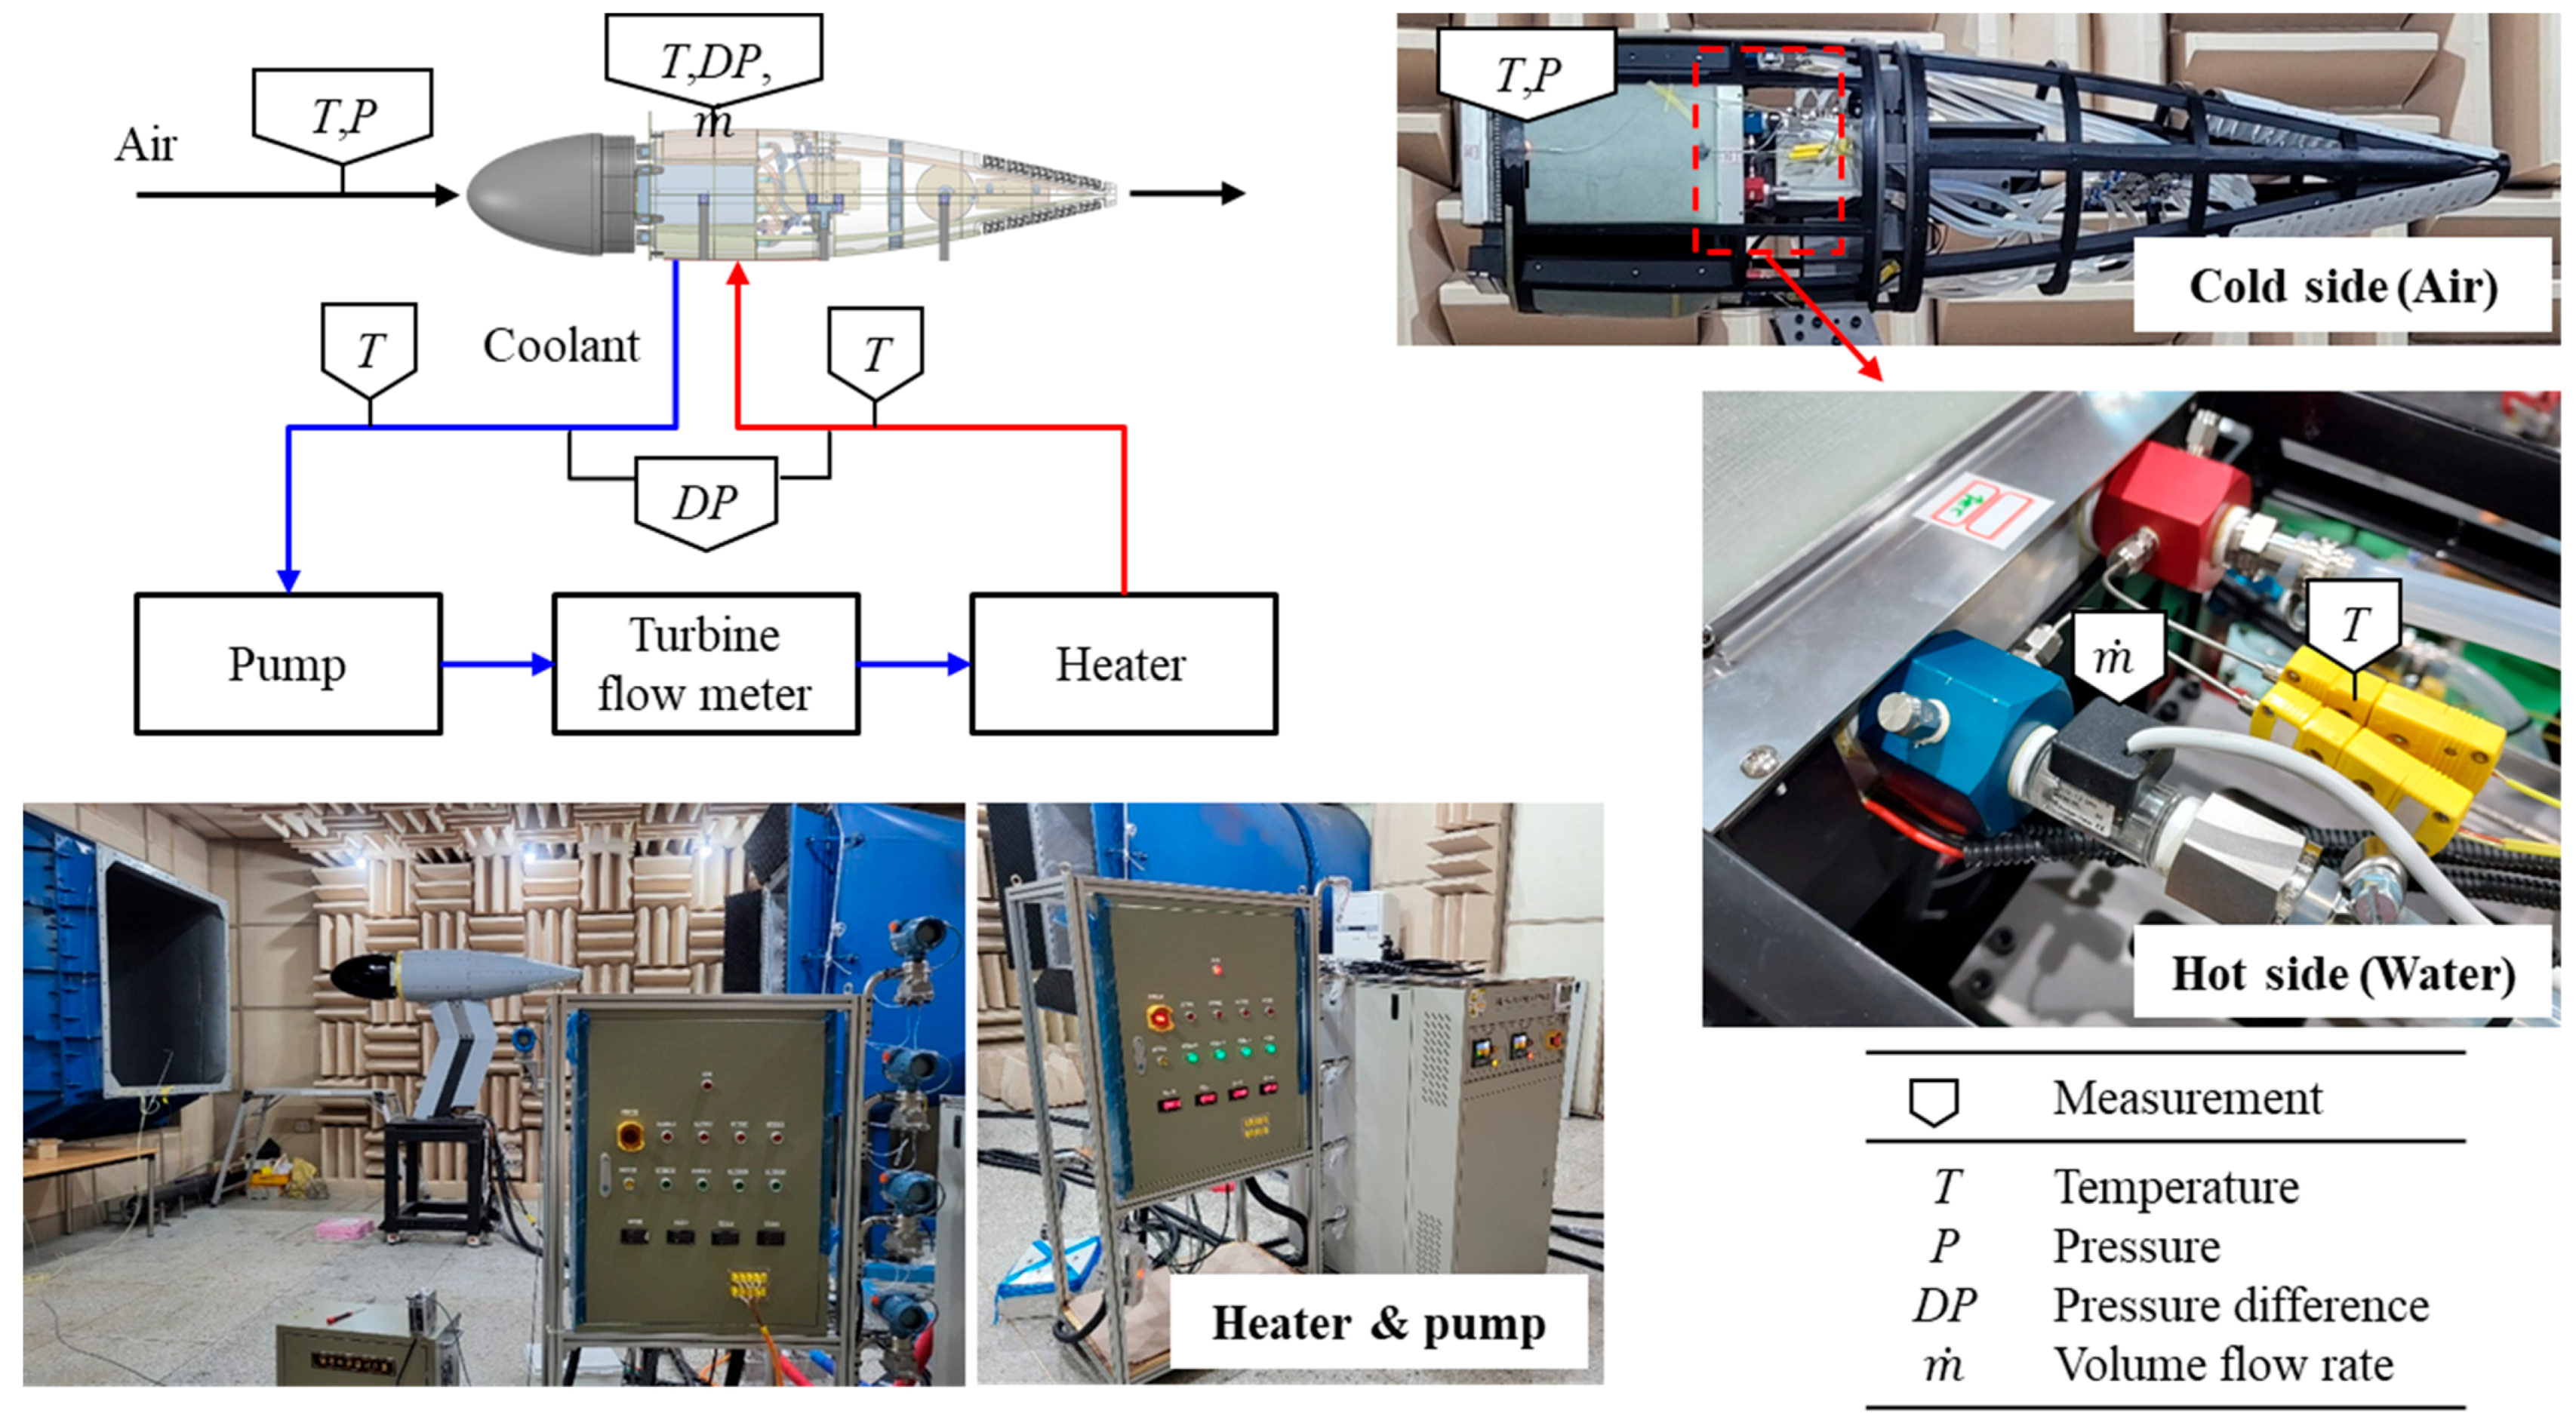
Figure 8 illustrates the wind tunnel test configuration and measurement locations. To ensure consistency with the numerical validation approach, only the nacelle assembly was tested without a propeller. The nacelle was installed in the test section, and a uniform airflow was supplied to the nacelle inlet. In the actual hybrid-electric propulsion system, the coolant absorbs heat generated by the motor and inverter before rejecting heat through the nacelle-mounted heat exchangers. In the wind tunnel experiment, the motor and inverter were not physically installed. Instead, an external coolant circulation loop consisting of a pump and an electric heater was used to supply coolant with a prescribed mass flow rate and thermal load.
Figure 8.
Wind tunnel test configuration and measurement locations for air-side and coolant-side parameters. The red and blue arrows indicate the hot-coolant supply path and the cooled-coolant return path, respectively.
The coolant inlet and outlet temperatures were measured using OmegaK-type thermocouples (OMEGA Engineering, Inc., Norwalk, CT, USA). Based on the calibration results, the expanded uncertainty of the temperature measurements was 0.7 °C at a 95% confidence level (k = 2). The coolant volumetric flow rate was measured using a turbine flow meter (BV2000TRN050B; OMEGA Engineering, Inc., Norwalk, CT, USA) with a manufacturer-specified accuracy of ±3% of the reading. The air-side inlet temperature was measured immediately upstream of the heat exchanger, while the downstream air temperature was measured at the mid-section of the nacelle. Two thermocouples were used at both the air inlet and outlet locations, and their mean values were used in the data reduction. The heat rejection rate of each heat exchanger was calculated from the measured coolant volumetric flow rate and coolant inlet and outlet temperatures using temperature-dependent coolant density and specific heat. The total heat rejection rate was obtained by summing the contributions from the four heat exchangers. The air mass flow rate was then estimated from an energy balance using the total coolant-side heat rejection rate and the measured air-side temperature rise. A first-order uncertainty propagation analysis was performed for the heat rejection rate and air mass flow rate. The thermocouple calibration uncertainty was converted to a standard uncertainty using k = 2, while the ±3% flow-meter accuracy was treated as a bounded uncertainty with a rectangular probability distribution. The temperature dependence of the coolant properties was included in the propagation through the measured coolant temperature, whereas uncertainty associated with the property correlations themselves was not considered. The resulting expanded uncertainties (k = 2) were 3.70–3.87% for the heat rejection rate and 6.03–9.00% for the air mass flow rate over the validation conditions. All measurements were recorded under steady-state conditions, and the experimental data were used to validate the numerical predictions obtained using the framework described in Section 2.
3.2. Comparison Between Experimental and Numerical Results
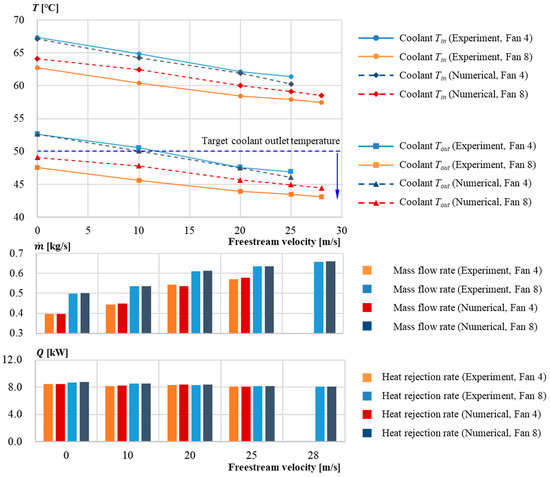
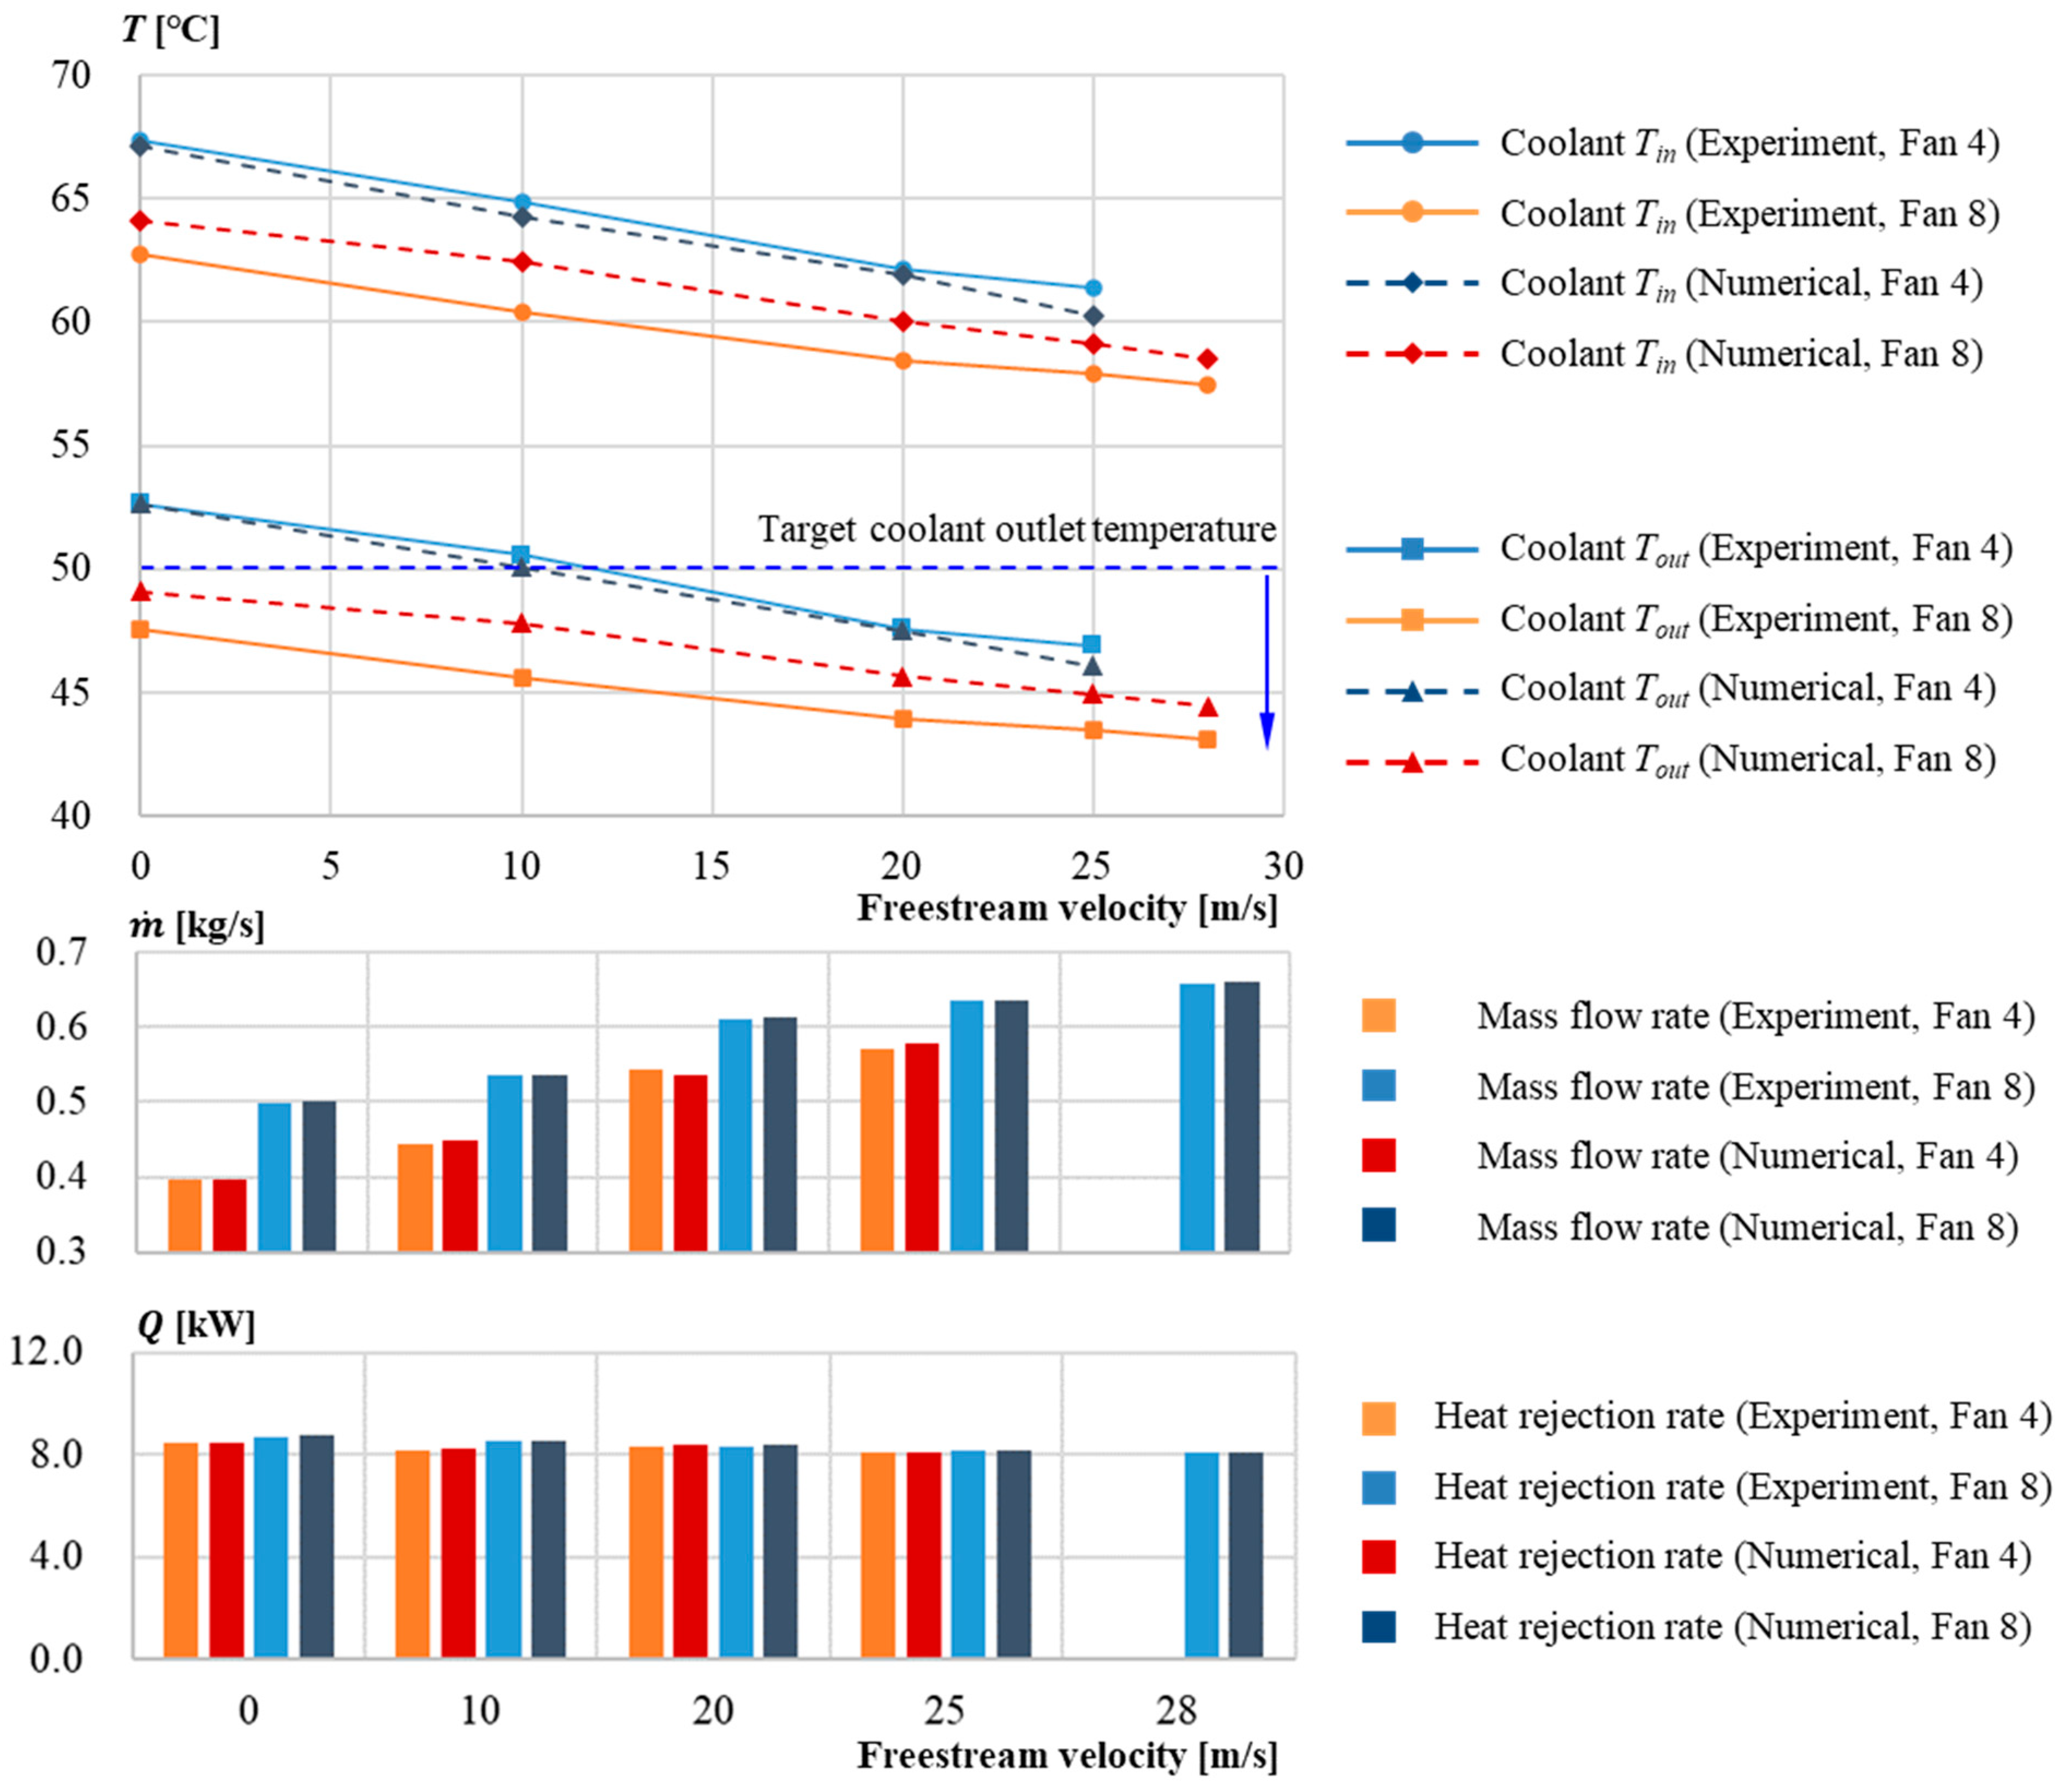
The numerical predictions obtained using the proposed CFD–ε–NTU–neural network framework were validated against the wind tunnel experimental data described in Section 3.1. Figure 9 presents a comparison between experimental measurements and numerical predictions of the coolant inlet and outlet temperatures, air mass flow rate, and heat rejection rate as functions of freestream velocity under different fan operating conditions. The numerical results closely follow the experimental trends over the entire velocity range considered, indicating that the coupled framework accurately captures the influence of external airflow conditions on the thermal performance of the nacelle-mounted heat exchanger.
Figure 9.
Comparison of experimentally measured and numerically predicted coolant temperatures, air mass flow rate, and heat rejection rate under four- and eight-fan operation at freestream velocities of 0–28 m/s and a total coolant flow rate of 8 L/min. The nominal thermal load was 8 kW, with the thermal load for each CFD case set to the experimentally measured value at the corresponding operating condition. Solid and dashed lines represent the experimental and numerical results, respectively.
A quantitative assessment of the agreement between experimental and numerical results for selected operating conditions is provided in Table 5. The table presents the measured and predicted values of air mass flow rate, coolant inlet and outlet temperatures, and heat rejection rate. Across all tested conditions, the mean absolute relative errors in air mass flow rate and heat rejection rate were 0.54% and 0.29%, respectively. The mean absolute errors in coolant inlet and outlet temperatures were 1.06 °C and 1.07 °C, respectively, with maximum absolute deviations of 2.05 °C and 2.18 °C. Overall, the differences in the evaluated quantities remained small over the tested operating range, indicating good agreement between the experimental measurements and numerical predictions. The numerical deviations in air mass flow rate and heat rejection rate were also smaller than the corresponding experimental expanded uncertainty ranges for all validation conditions.
Table 5.
Quantitative comparison between experimental measurements and numerical predictions under selected operating conditions.
The agreement demonstrated in Figure 9 and Table 5 supports the applicability of the proposed framework for predicting the thermal performance of heat exchangers installed in confined nacelle environments within the range of conditions considered in the present validation, providing a basis for the design and installation studies presented in the following section.
4. Results and Discussion
4.1. Heat Exchanger Design Problem Definition and ε–NTU-Based Redesign
Following the experimental validation presented in Section 3, an improved heat exchanger design was developed to satisfy the thermal requirements of the hybrid-electric propulsion system under the mass and space constraints imposed by nacelle integration. The heat exchanger design was performed exclusively using the ε–NTU method, which enables rapid and physically consistent evaluation of thermal performance without resolving detailed flow fields. CFD was not employed during the heat exchanger design stage; instead, it was applied subsequently to assess installation effects at the nacelle level.
4.1.1. Design Problem Formulation and ε–NTU-Based Optimization
The heat exchanger design problem was formulated as a multi-objective optimization problem aimed at identifying feasible design candidates that satisfy cooling performance requirements under constrained operating conditions. The design objectives were defined to minimize the coolant outlet temperature, the heat exchanger mass, and the required air mass flow rate, while ensuring sufficient heat rejection rate under the prescribed design operating conditions. The total heat load generated by the motor and inverter was 8 kW, which therefore defined the required heat rejection rate of the overall cooling system. Because two identical heat exchangers were considered in the redesigned nacelle configuration, the required heat rejection rate was set to 4 kW per heat exchanger. The coolant outlet temperature was required not to exceed 50 °C, and the relative pressure losses on both the coolant and air sides were constrained to be less than 3%, where the relative pressure loss was defined as . The coolant flow rate was prescribed as 4 L/min per heat exchanger, consistent with the cooling system configuration described in Section 2. In contrast to conventional design approaches that often assume a fixed core envelope, the external dimensions of the heat exchanger core in this study were treated as design variables. These dimensions were allowed to vary within specific bounds dictated by the available internal space and installation requirements of the nacelle.
A plate-fin heat exchanger with offset strip fins was selected as the baseline configuration, following established compact heat exchanger design practices [10]. The design variables included the external core dimensions as well as the internal fin geometric parameters on both the hot and cold sides, such as fin height, fin pitch, and offset length. The air mass flow rate was also treated as a design variable. The fin thickness was kept constant to reflect manufacturing and structural constraints. The lower and upper bounds of the ten continuous design variables are summarized in Table 6. The optimization process was carried out exclusively using the ε–NTU method, which enables rapid and physically consistent evaluation of thermal performance without resolving detailed flow fields. A multi-objective evolutionary algorithm, namely the Non-dominated Sorting Genetic Algorithm II (NSGA-II), was employed to explore the design space and identify Pareto-optimal solutions [19]. The NSGA-II optimization was performed using a population size of 100, with a predefined maximum of 100 generations. For each design candidate generated during the optimization process, the ε–NTU method was applied to evaluate the thermal performance, including the overall heat transfer conductance, heat rejection rate, coolant outlet temperature, and pressure losses. The optimization produced a set of Pareto-optimal solutions representing trade-offs among thermal performance, mass, and air-side flow requirements. Convergence was assessed retrospectively by monitoring the evolution of the feasible non-dominated solution set and its hypervolume. During the final 20 generations, the mean generation-to-generation change in hypervolume was approximately 0.44%, while the minimum heat exchanger mass and minimum required air mass flow rate remained unchanged, indicating stabilization of the Pareto solution set before the termination.
Table 6.
Design variables and bounds used in the NSGA-II optimization.
4.1.2. Selection of Representative Design and Redesign Outcome
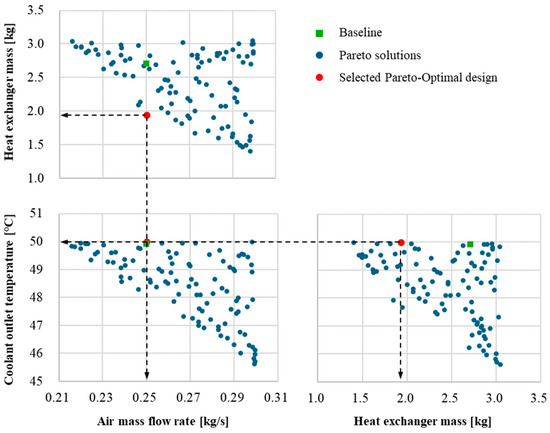
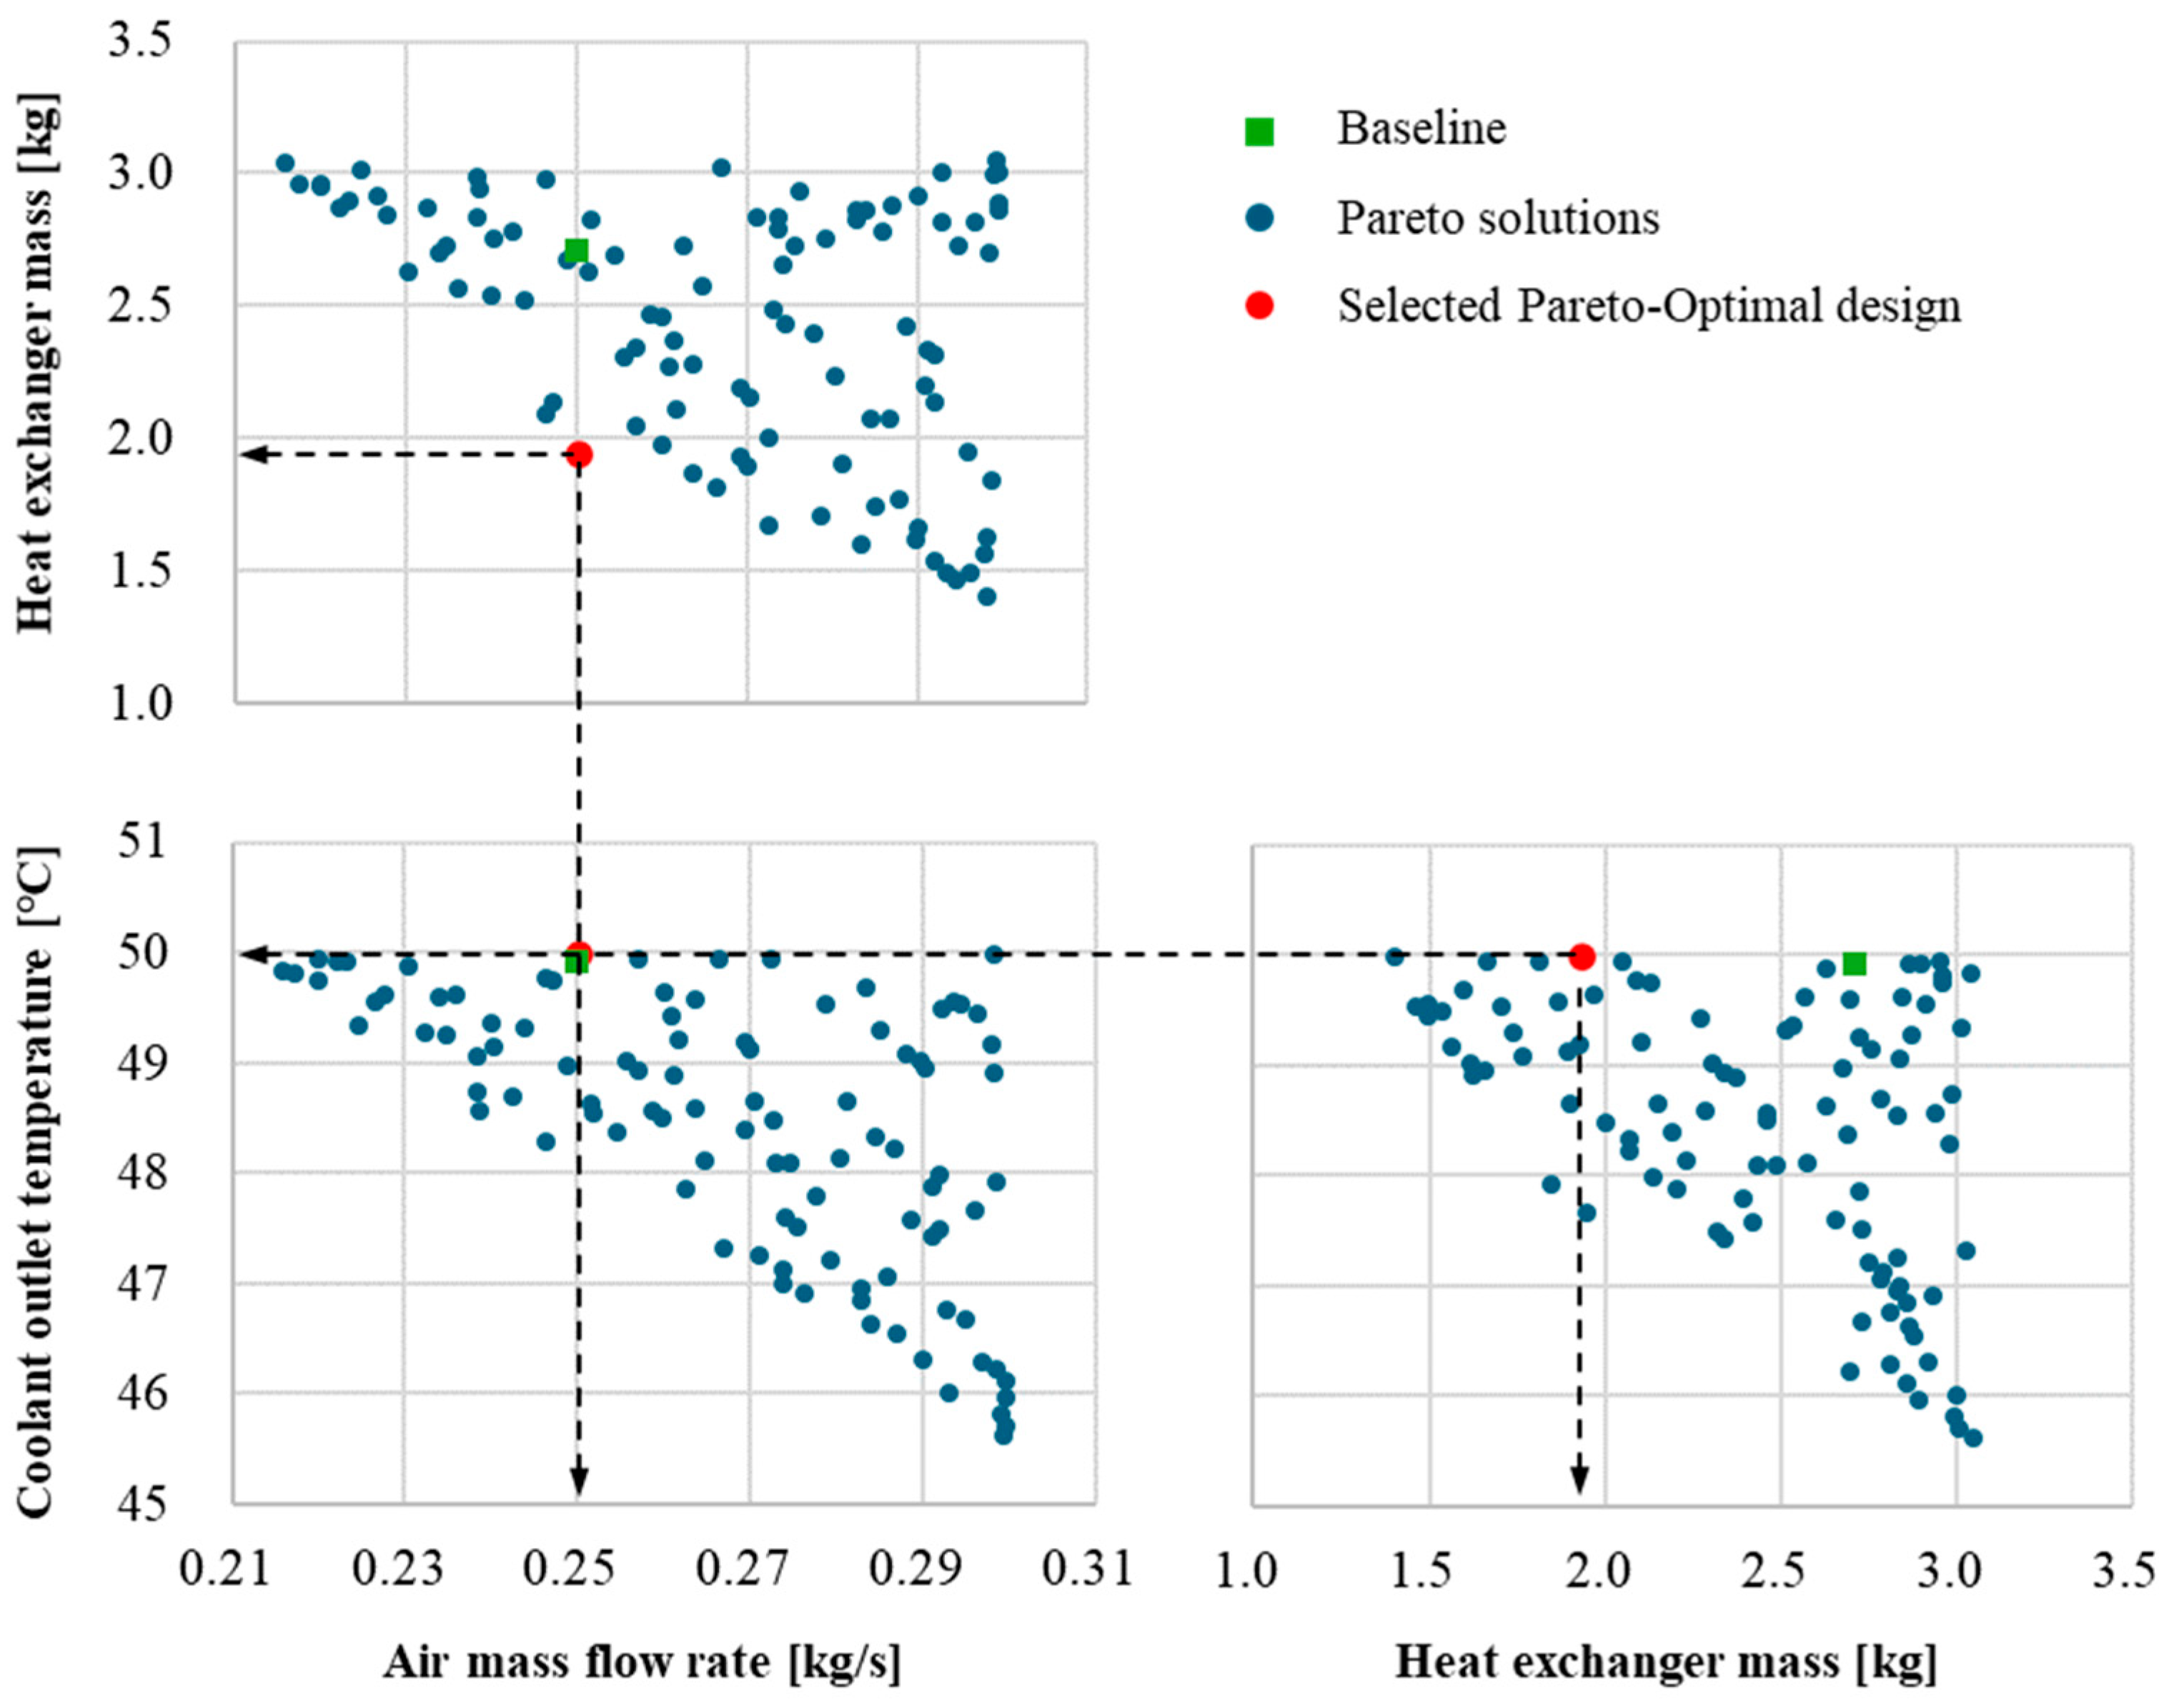
From the Pareto-optimal solution set obtained through the ε–NTU-based multi-objective optimization, a representative heat exchanger design was selected using a constraint-based criterion derived from the fan-induced airflow capability and thermal requirements of the cooling system. Figure 10 illustrates the Pareto front, revealing trade-offs among coolant outlet temperature, heat exchanger mass, and required air mass flow rate.
Figure 10.
Pairwise projections of the Pareto-optimal solutions obtained from the ε–NTU-based multi-objective optimization in terms of required air mass flow rate, heat-exchanger mass, and coolant outlet temperature. The baseline and selected designs are highlighted for comparison. The selected design corresponds to the minimum-mass solution satisfying the fan-induced airflow constraint of approximately 0.25 kg/s per heat exchanger, a coolant outlet temperature not exceeding 50 °C, and a required heat rejection rate of 4 kW per heat exchanger. Black dashed lines indicate the objective values of the selected design.
In selecting a representative solution from the Pareto front, a reference condition for the air mass flow rate was first established based on wind tunnel measurements. During the experiments conducted without external freestream velocity, the operation of the cooling fans alone induced an air mass flow rate of approximately 0.5 kg/s into the nacelle. This condition represents a conservative, fan-driven baseline airflow that can be expected even in the absence of ram air effects. Since two identical heat exchangers are employed in the present system configuration, the corresponding reference air mass flow rate per heat exchanger was taken as 0.25 kg/s. Accordingly, Pareto-optimal solutions requiring an air mass flow rate greater than approximately 0.25 kg/s per heat exchanger were excluded from consideration. Among the remaining solutions satisfying the coolant outlet temperature requirement of 50 °C and the required heat rejection rate of 4 kW per heat exchanger, the solution with the minimum heat-exchanger mass was selected as the representative design. This constraint-based selection rule provides an explicit system-level criterion for identifying the representative design from the Pareto-optimal solution set.
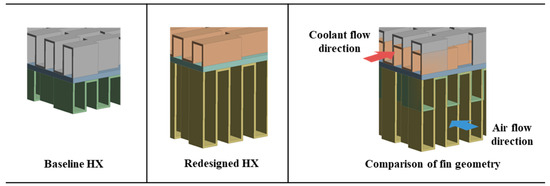
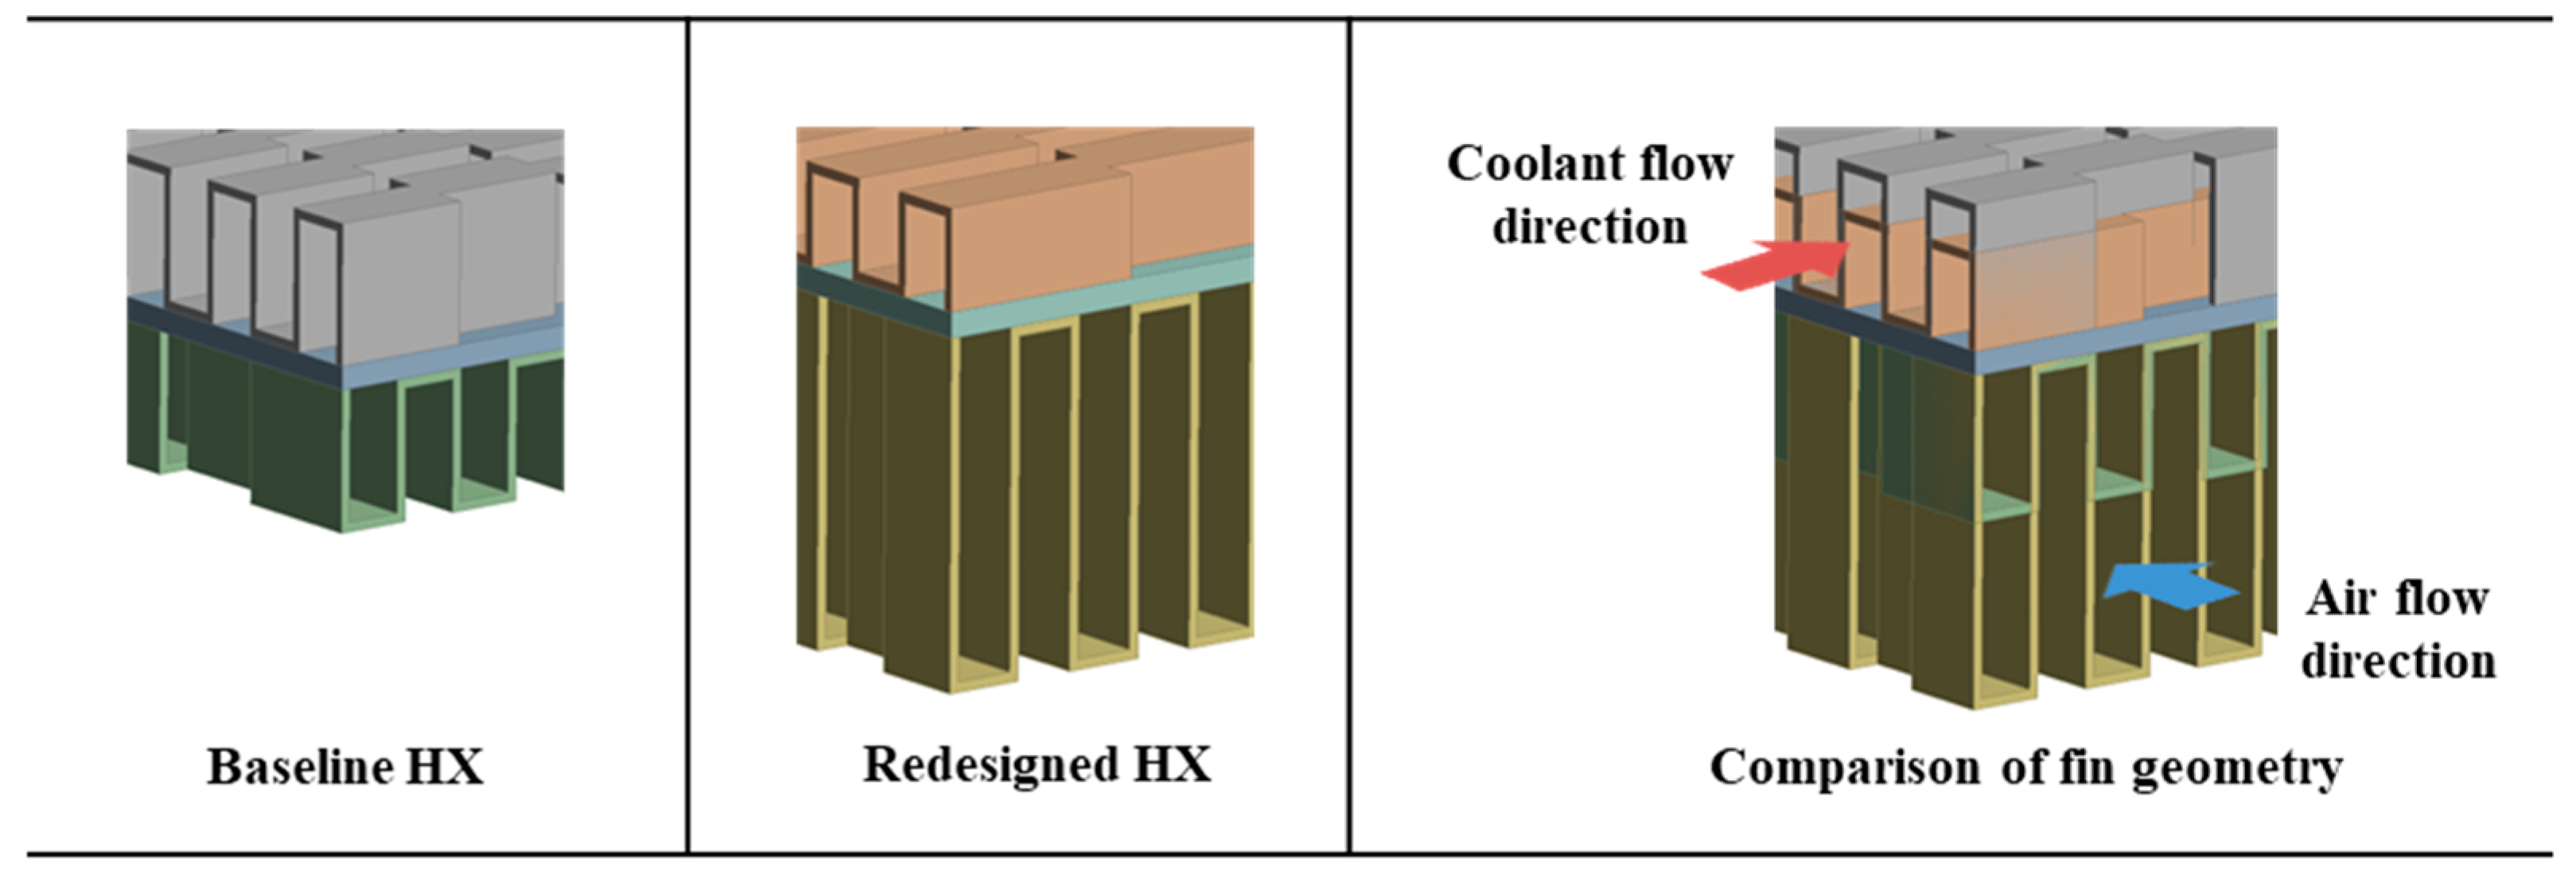
Although the heat exchanger redesign was originally pursued with the objectives of reducing mass and enhancing thermal performance, the Pareto-based design exploration revealed that significant improvements in thermal performance were difficult to achieve without increasing the required air mass flow rate. Consequently, the selected design represents the minimum-mass solution satisfying the prescribed airflow and thermal constraints within the Pareto-optimal solution set. A qualitative comparison of the fin configurations between the baseline and redesigned heat exchangers is shown in Figure 11. The redesigned configuration employs modified internal fin geometries together with adjusted core dimensions, including increased fin height on the air side and reduced fin height on the coolant side, while the fin thickness was kept constant to satisfy manufacturing and structural constraints. These geometric changes redistributed the effective heat transfer surface area between the two fluid streams without degrading the overall cooling capacity. A quantitative comparison of the geometric parameters and thermal performance between the baseline and redesigned heat exchangers is summarized in Table 7, where the key geometric parameters modified during the redesign process are highlighted in bold. Under the fan-induced baseline air mass flow rate of approximately 0.25 kg/s per heat exchanger, the redesigned heat exchanger satisfied the required heat rejection rate of 4 kW per unit and maintained thermal performance comparable to that of the baseline design. At the same time, the total mass of the heat exchanger was reduced from 2.71 kg to 1.94 kg, corresponding to a reduction of approximately 28.4%.
Figure 11.
Comparison of the baseline and redesigned heat exchanger geometries obtained from the ε–NTU-based optimization.
Table 7.
Comparison of geometric parameters and thermal performance between the baseline and redesigned heat exchangers.
The redesigned heat exchanger was subsequently adopted for nacelle-level analyses to investigate installation effects on airflow distribution and cooling performance, which are discussed in the following subsection.
4.2. Effect of Nacelle Installation on Cooling Performance
4.2.1. Modified Nacelle Internal Layout and Flow Configuration
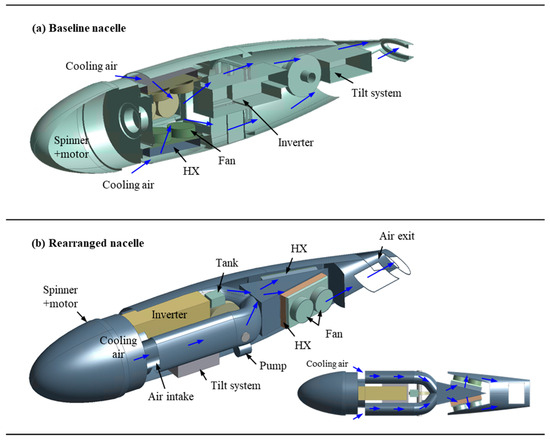
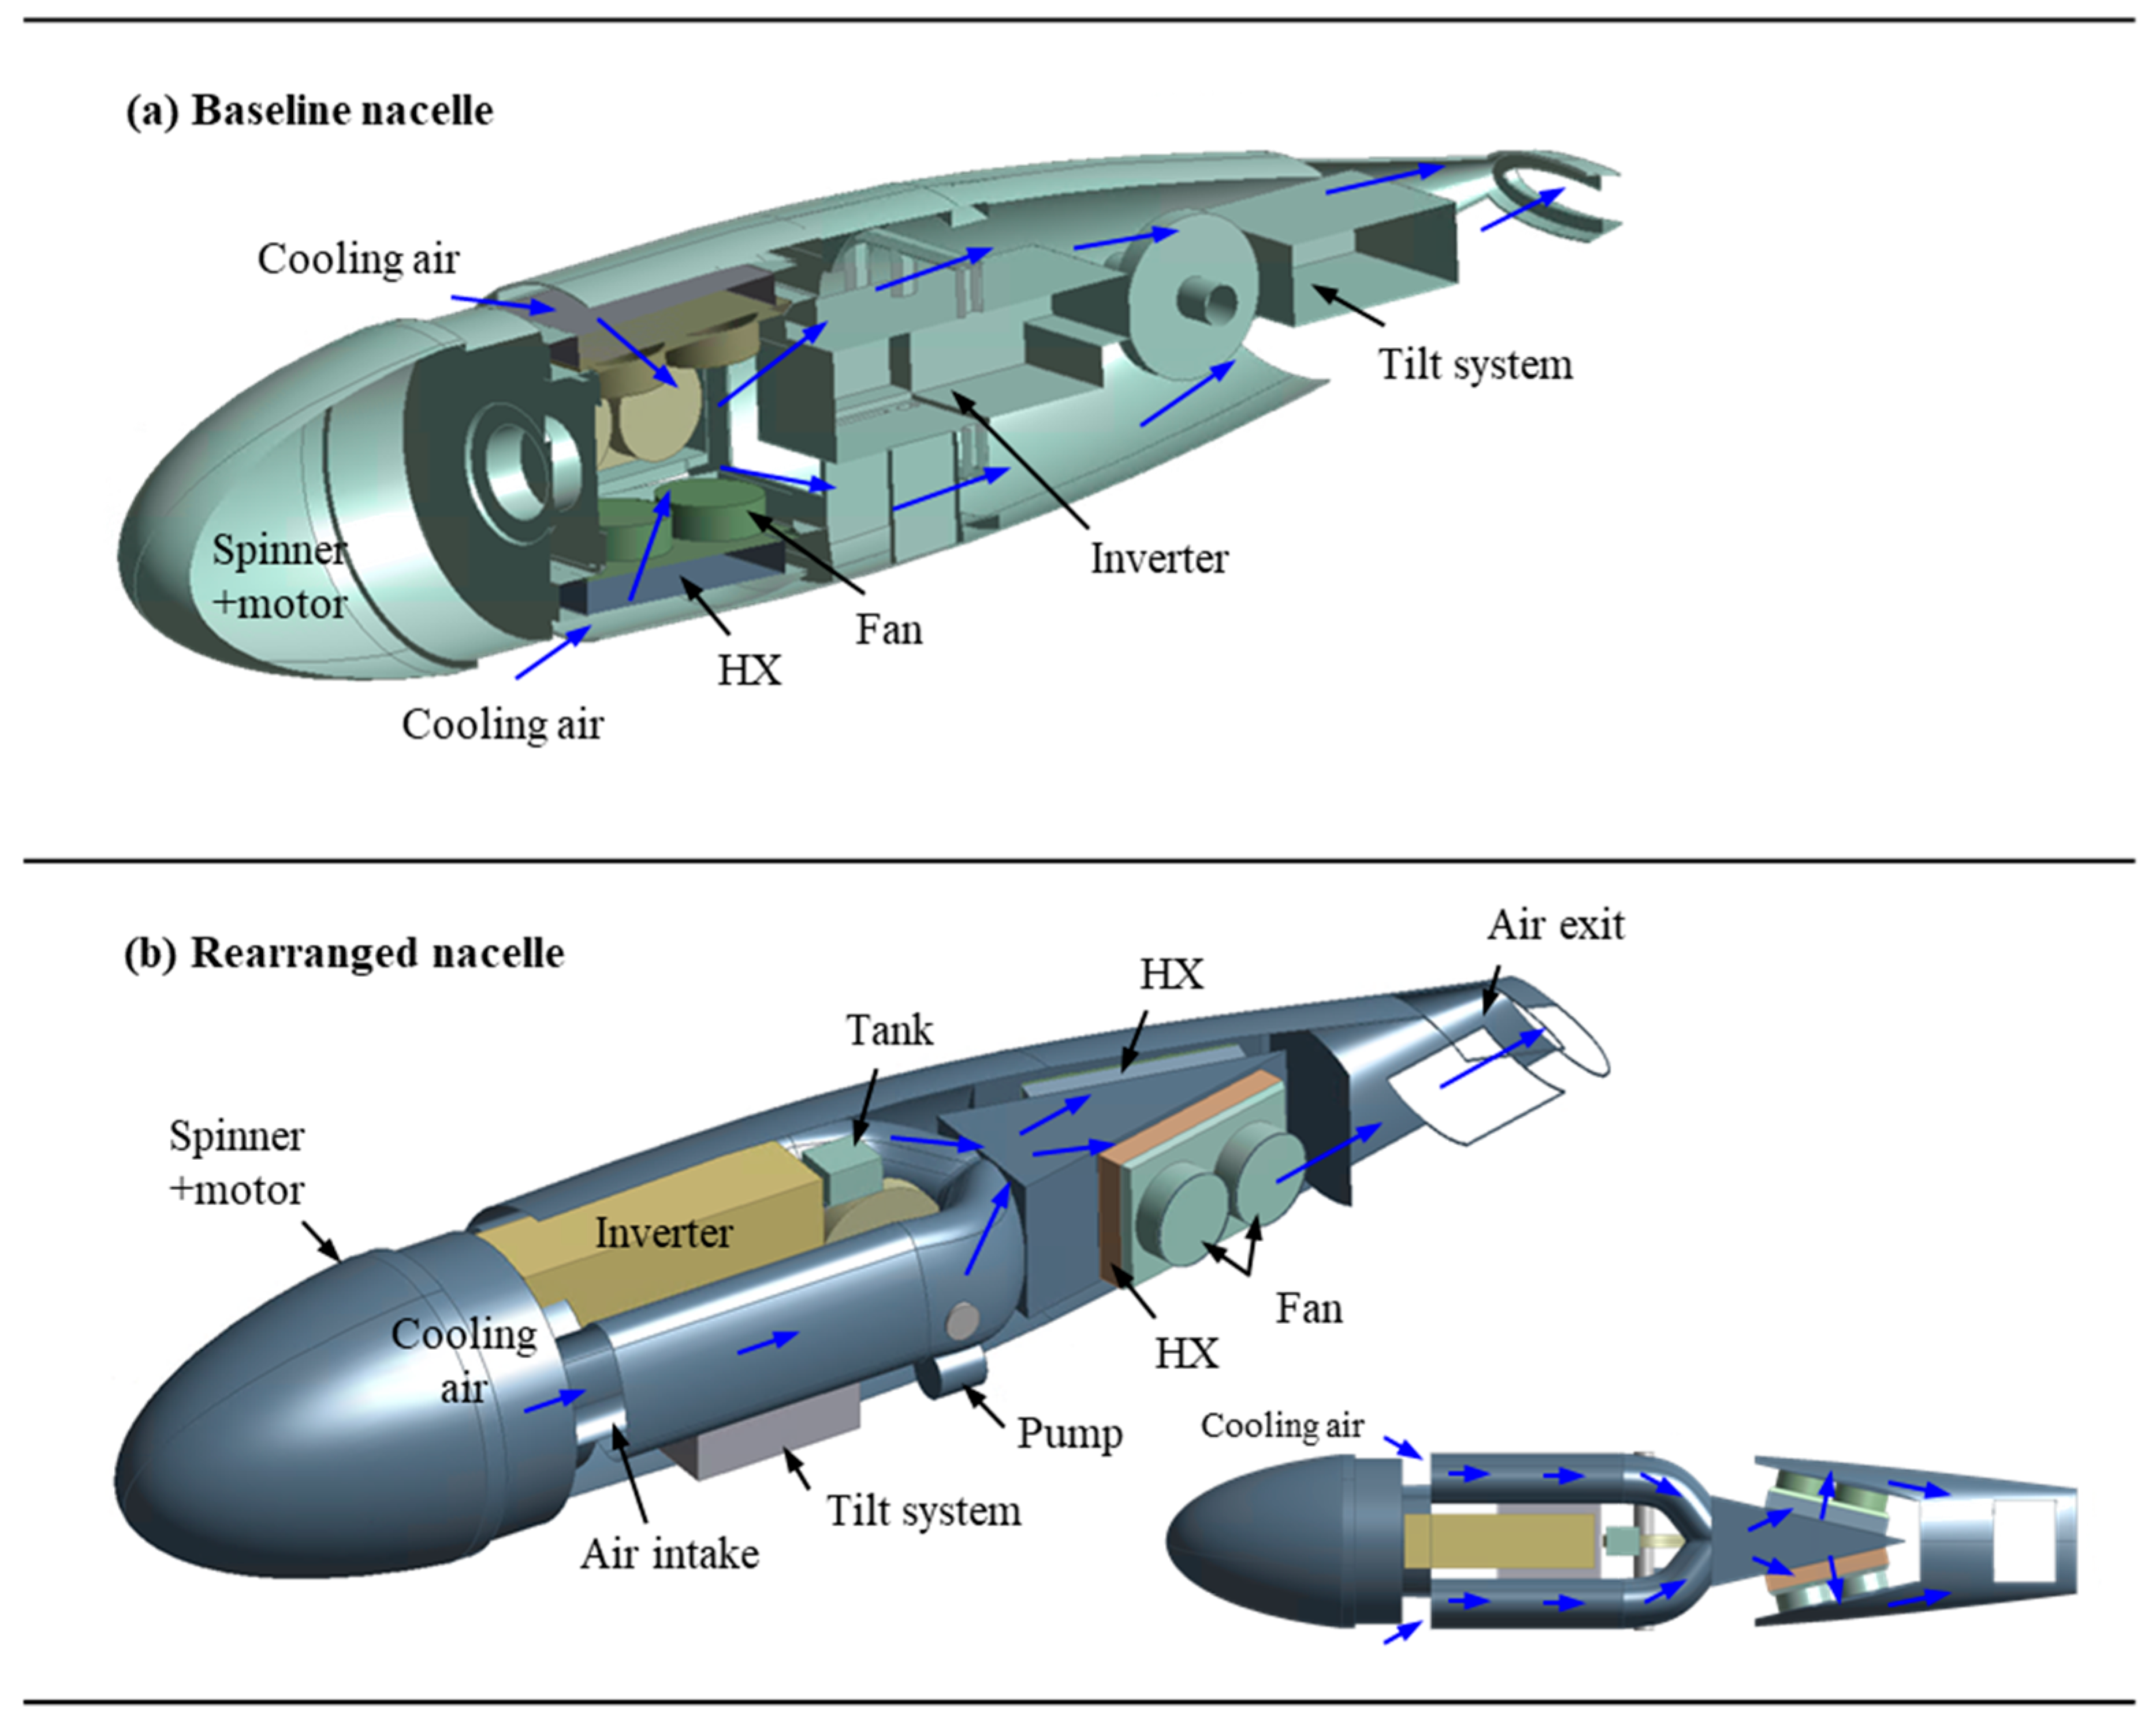
The internal nacelle layout considered in this section differs from the configuration used for experimental validation in Section 3. This modification was introduced to reflect practical system integration requirements identified during the heat exchanger redesign process. In particular, the number of heat exchangers installed in the nacelle was reduced from four to two, and the inverter was relocated to a position immediately downstream of the electric motor. These changes were driven by packaging constraints, system simplification considerations, and the need to accommodate the redesigned heat exchangers while maintaining sufficient inlet flow area within the nacelle.
Figure 12 compares the baseline nacelle internal layout with the modified configuration considered in the present analysis. In the modified layout, the heat exchangers are positioned downstream of the inverter, and the internal components are rearranged to preserve an effective flow cross-sectional area comparable to that of the baseline intake. The modified layout was not obtained through a dedicated optimization of the internal flow path; rather, it represents a feasible and practical arrangement that satisfies system-level integration requirements.
Figure 12.
Comparison of the baseline and rearranged internal nacelle layouts, illustrating the redistribution of internal components and the resulting modification of airflow paths due to the reduced number of heat exchangers and the relocation of the inverter.
The validated CFD–ε–NTU–neural network framework was subsequently applied to the modified nacelle configuration to evaluate the installed performance of the heat exchangers. In the following comparison, the modified nacelle layout was maintained unchanged for both the baseline and redesigned heat exchanger configurations, thereby allowing the effect of the heat exchanger design on the installed airflow and cooling performance to be evaluated under a common installation configuration.
4.2.2. Comparison of Installation Performance with Baseline and Redesigned Heat Exchangers
Using the modified nacelle internal layout described in Section 4.2.1, the installed performance of the baseline and redesigned heat exchangers was numerically evaluated and compared. In both cases, two identical heat exchangers were installed in the same nacelle configuration. The same prescribed operating conditions were applied, including a thermal load of 4 kW per heat exchanger, a coolant flow rate of 4 L/min per heat exchanger, and the same fan P–Q characteristic. The thermal load prescribed in the CFD calculation was also provided as an input to the neural-network model. The coolant inlet and outlet temperatures listed in Table 8 are outputs predicted by the neural-network model and were not prescribed as CFD boundary conditions. Therefore, the differences in coolant temperature between the two configurations represent the predicted thermal response of each heat exchanger rather than differences in the prescribed operating conditions.
Table 8.
Comparison of installed cooling performance between the baseline and redesigned heat exchangers in the modified nacelle layout.
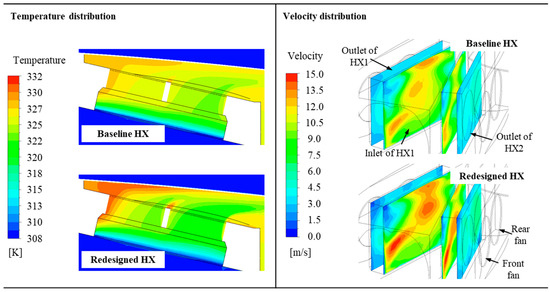
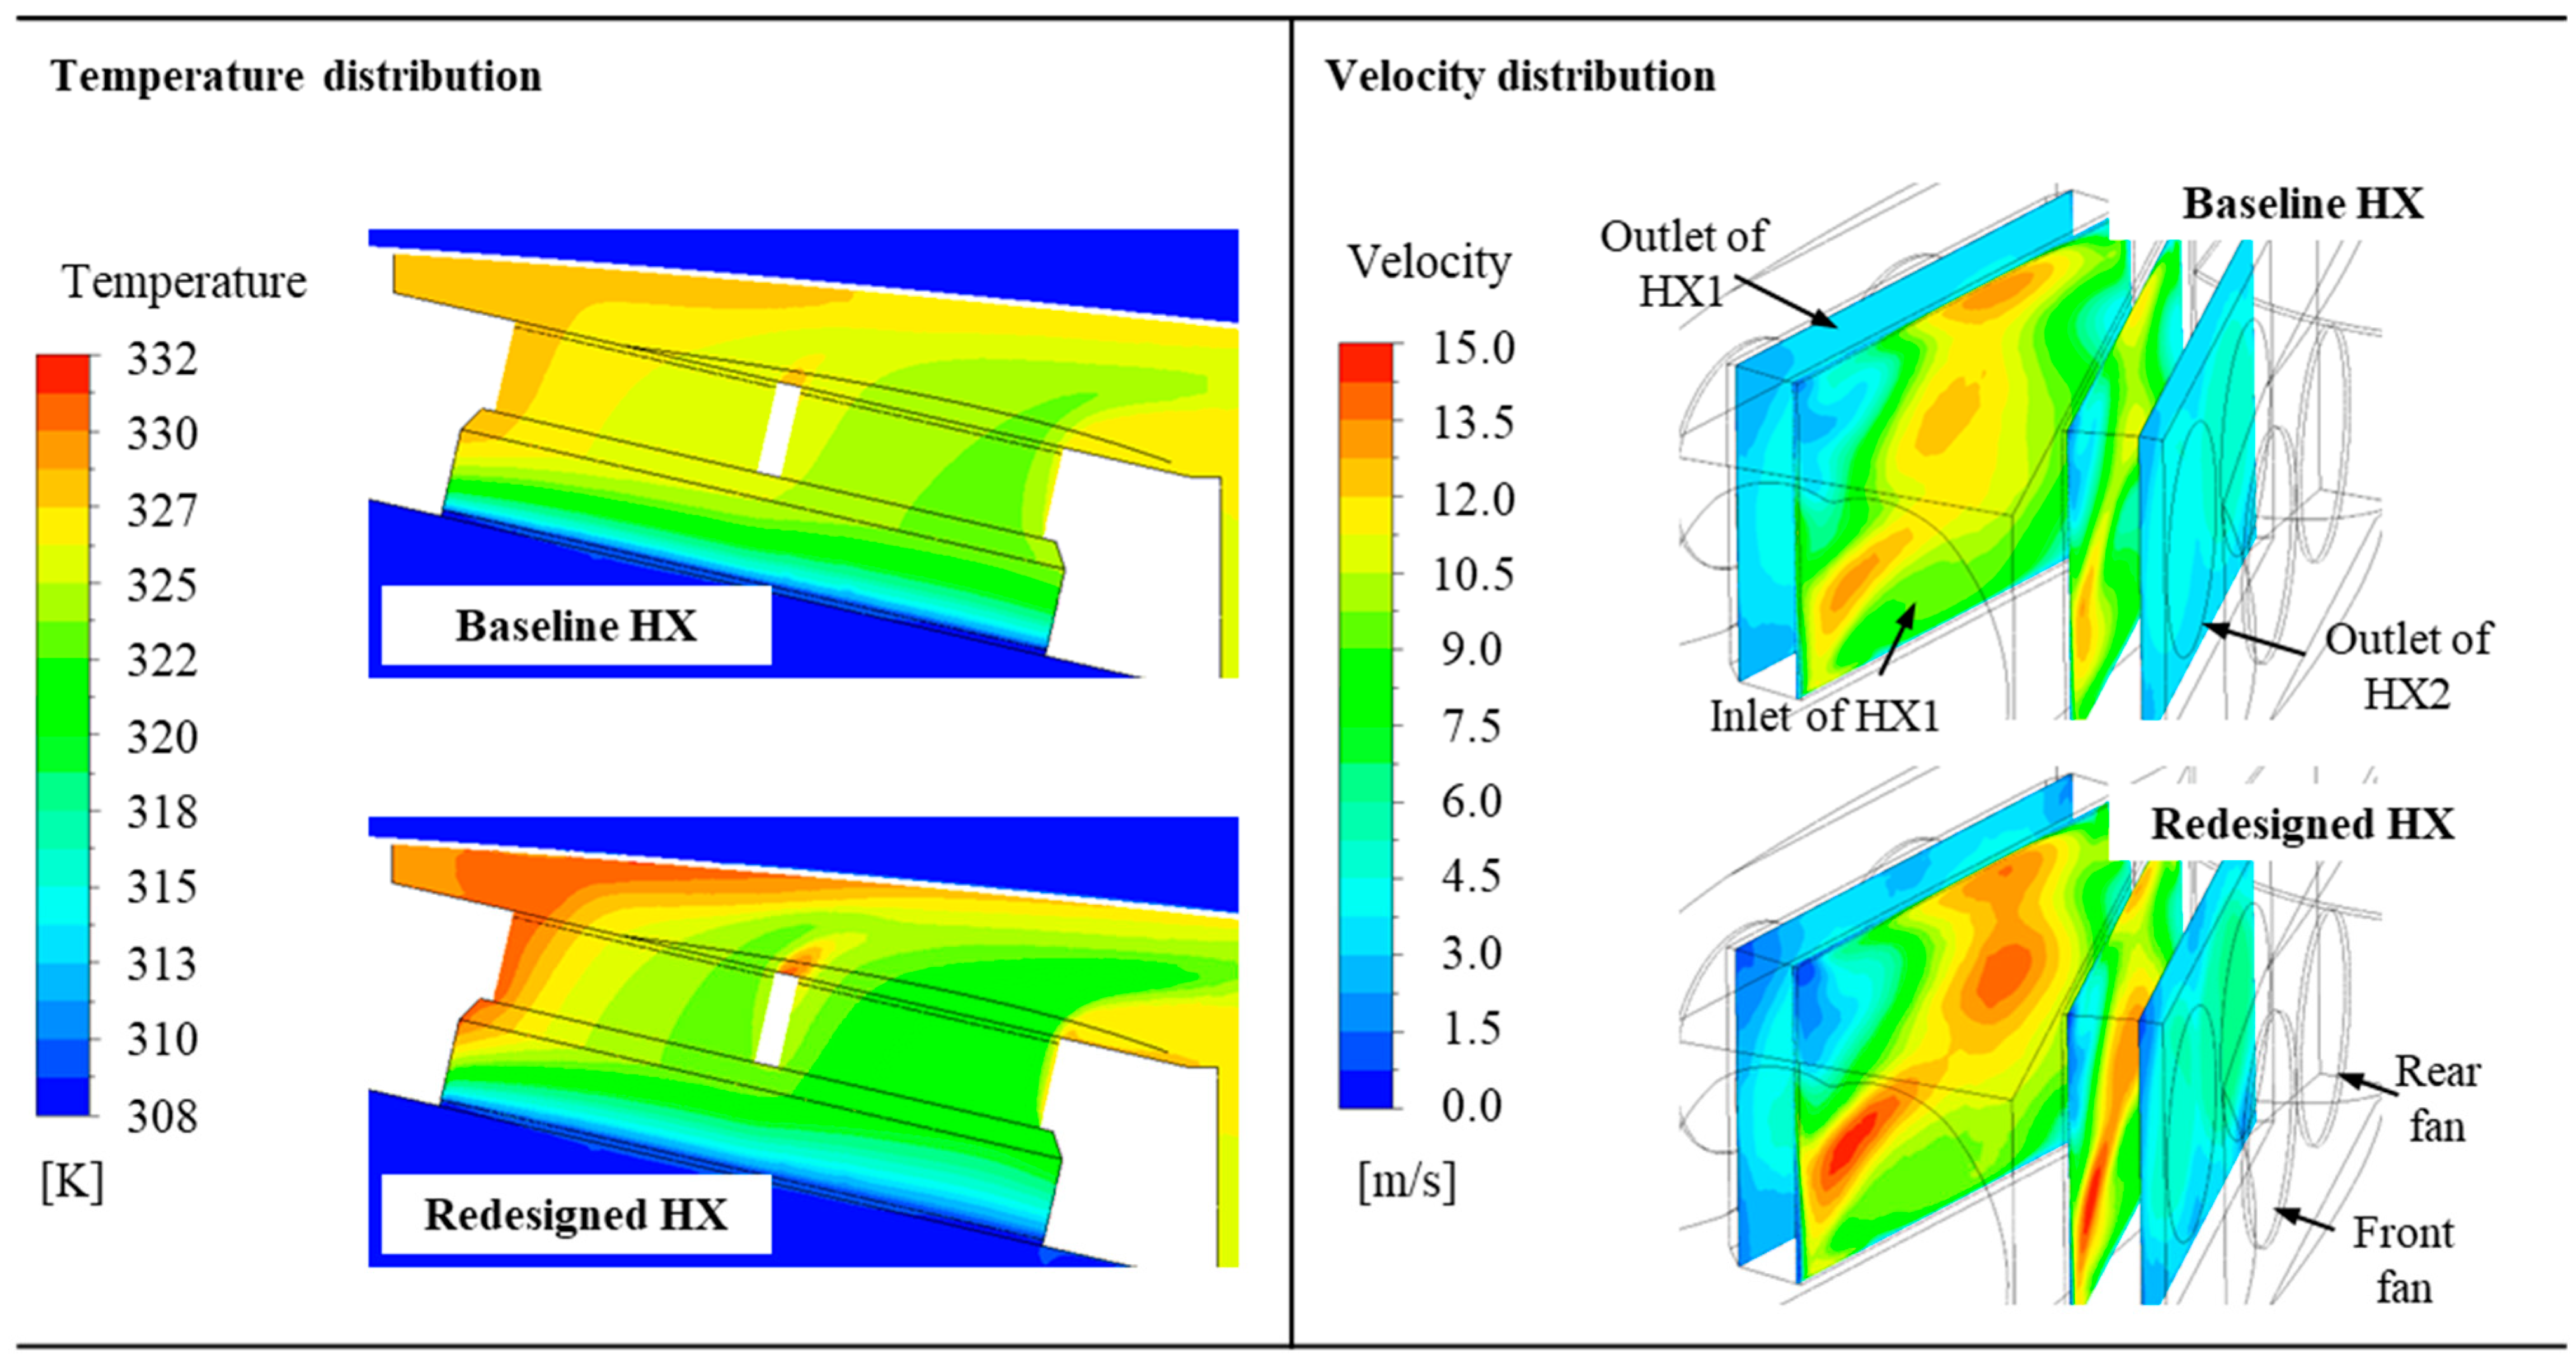
Compared to the baseline configuration, the redesigned heat exchanger exhibits a lower air-side flow resistance because of its modified fin geometry and increased air-side porosity. As summarized in Table 8, the mean total-pressure loss across the heat exchangers decreased from 546 Pa for the baseline configuration to 320 Pa for the redesigned configuration. With the same fan P–Q characteristic applied to both configurations, the reduced system resistance shifted the fan operating points and resulted in a higher air mass flow rate through the redesigned heat exchangers. The corresponding temperature and velocity fields around the heat exchanger region are shown in Figure 13.
Figure 13.
Temperature and velocity distributions for the baseline and redesigned heat exchanger configurations under the wind-off condition (0 m/s), with the same fan P–Q characteristic, a thermal load of 4 kW per heat exchanger, and a coolant flow rate of 4 L/min per heat exchanger. Temperature and velocity contours are shown on the longitudinal heat exchanger mid-plane and air-side heat exchanger surfaces, respectively.
To quantitatively assess the airflow distribution, the flow uniformity at each heat exchanger inlet was evaluated using the coefficient of variation (CV) of the normal velocity. The CV was defined as the area-weighted standard deviation of the inlet normal velocity divided by its area-weighted mean value. For the baseline configuration, the CV values were 0.146 and 0.146 for HX1 and HX2, respectively, whereas the corresponding values for the redesigned configuration were 0.270 and 0.276. These results indicate that the increased airflow through the redesigned heat exchanger was not accompanied by an improvement in inlet-flow uniformity.
The installed cooling performance of the two configurations is summarized in Table 8. With the same fan P–Q characteristic applied to both configurations, the air mass flow rate through the redesigned heat exchangers increased from 0.23 kg/s to 0.26 kg/s compared to the baseline configuration. The redesigned heat exchanger also exhibited a lower predicted coolant outlet temperature and achieved a heat rejection rate of approximately 4 kW per unit, despite its reduced mass. The baseline heat exchanger, on the other hand, exhibited a slightly lower air mass flow rate and correspondingly higher coolant outlet temperature under the same installation conditions. It should be emphasized that the observed improvement in installed cooling performance does not stem solely from an intrinsic enhancement of the heat exchanger thermal characteristics. Rather, the lower air-side flow resistance of the redesigned heat exchanger shifted the fan operating points and increased the air mass flow rate through the heat exchangers. Within this fixed modified nacelle layout, the improved installed cooling performance is therefore attributed primarily to the increased airflow enabled by the reduced air-side flow resistance of the redesigned heat exchanger, rather than to improved flow uniformity. These results demonstrate the importance of considering the interaction between heat exchanger flow resistance and fan characteristics when evaluating the installed cooling performance of nacelle-integrated thermal management systems. It should be noted that the redesigned heat exchanger and the modified two-heat-exchanger nacelle configuration considered in this section were not experimentally validated. Therefore, the present results should be interpreted as numerical predictions based on the experimentally validated framework rather than as direct experimental validation of the redesigned configuration.
Several limitations of the present analysis should be noted. The experimental validation included wind-tunnel freestream conditions up to 28 m/s, thereby accounting for the influence of external airflow on nacelle cooling performance. However, the tested freestream range and ground-level atmospheric conditions do not fully represent the ram-air and atmospheric conditions associated with typical cruise or climb operation. In addition, the CFD simulations were performed under steady-state assumptions without propeller-induced flow, and the internal nacelle components were represented using simplified geometries. Environmental heat losses were also neglected. These assumptions may affect the predicted airflow and thermal performance under actual flight conditions. Furthermore, all conditions evaluated in the present study remained within the range represented by the neural-network training data. Therefore, the results presented in this study do not involve extrapolation beyond the training range; however, the predictive reliability of the neural-network model outside this range has not been established. Further validation under representative flight conditions, including relevant aerodynamic and thermal effects, is required to assess the broader applicability of the proposed framework.
The present framework was demonstrated using compact heat exchangers with offset strip fins and a prescribed combined thermal load from the motor and inverter. Extension to other fin structures would require appropriate heat-transfer and pressure-loss correlations and regeneration of the ε–NTU performance database over the relevant design and operating ranges. Likewise, application to systems with multiple independently varying heat sources would require the corresponding thermal-load and coolant-system interactions to be incorporated into the thermal model. These extensions would also require retraining and validation of the functional representation for the expanded operating space.
5. Conclusions
This study presented a hybrid CFD–ε–NTU–neural network framework for evaluating and designing compact heat exchangers integrated within a confined nacelle environment for hybrid-electric propulsion systems. The proposed approach enables coupling between system-level heat exchanger performance prediction and three-dimensional CFD simulations without explicitly resolving detailed internal fin geometries.
The framework was first validated against wind tunnel experiments using a nacelle configuration representative of the test setup. Across the tested conditions, the mean absolute relative errors in air mass flow rate and heat rejection rate were 0.54% and 0.29%, respectively, while the mean absolute errors in coolant inlet and outlet temperatures were 1.06 °C and 1.07 °C, respectively. These results demonstrate good agreement between the numerical predictions and experimental measurements within the investigated operating range.
Based on the validated framework, an ε–NTU-based multi-objective design study was conducted to redesign the compact heat exchanger. The design exploration revealed clear trade-offs among heat exchanger mass, coolant outlet temperature, and required air mass flow rate. A representative design was selected from the Pareto front by imposing practical airflow constraints derived from fan-induced baseline operating conditions. The redesigned heat exchanger maintained thermal performance comparable to the baseline design while achieving a mass reduction of approximately 28.4%.
The redesigned heat exchanger was subsequently evaluated under installed conditions within a modified nacelle internal layout that reflects practical system integration requirements. The modified nacelle layout served as a common installation configuration for comparing the baseline and redesigned heat exchangers. With the same fan P–Q characteristic applied to both configurations, the mean total-pressure loss across the heat exchangers decreased by approximately 41%, resulting in an increase in air mass flow rate from 0.23 kg/s to 0.26 kg/s per heat exchanger. This result indicates that the increased airflow was primarily attributable to the reduced air-side flow resistance of the redesigned heat exchanger. However, the redesigned heat exchanger and modified two-heat-exchanger nacelle configuration were not experimentally validated in the present study. Accordingly, the installed-performance results for the modified configuration should be regarded as numerical predictions based on the validated framework. Experimental validation of the redesigned heat exchanger and modified nacelle configuration remains a subject for future work.
The results demonstrate that installation effects can play a significant role in determining the cooling performance of nacelle-integrated thermal management systems. The present study highlights the importance of evaluating component-level designs within a realistic installation context and shows that the proposed hybrid CFD–ε–NTU–neural network framework provides a practical and efficient tool for such analyses. The methodology can be extended to support future design studies involving alternative heat exchanger configurations, internal layouts, and operating conditions for advanced aircraft thermal management applications. Such extensions beyond the operating ranges represented by the present neural-network database would require additional ε–NTU data generation and subsequent retraining and validation of the functional representation.
Author Contributions
Conceptualization, S.J. and S.Y.L.; methodology, S.J., S.Y.L. and J.-S.H.; investigation, S.J., S.Y.L. and B.J.L.; visualization, S.J. and P.M.P.; writing—original draft preparation, S.J.; writing—review, B.J.L., P.M.P. and J.-S.H. All authors have read and agreed to the published version of the manuscript.
Funding
This work was supported by the Technology Development Program of Hybrid Electric Propulsion Systems for Manned Future Air Mobility, funded by the Korea Aerospace Research Institute (KARI) and the Korea AeroSpace Administration (KASA), Republic of Korea (grant No. 2800000845).
Data Availability Statement
The data presented in this study are available from the corresponding author upon request.
Conflicts of Interest
The authors declare no conflicts of interest.
Nomenclature
| Symbols | |
| A | Heat-transfer area |
| Ccold | Cold-side heat-capacity rate |
| Chot | Hot-side heat-capacity rate |
| Cmin | Minimum heat-capacity rate |
| k | Coverage factor |
| Pin | Inlet pressure |
| Pout | Outlet pressure |
| Q | Heat rejection rate |
| Q/V | Volumetric heat-transfer rate |
| R2 | Coefficient of determination |
| Tc,in | Cold-fluid inlet temperature |
| Th,in | Hot-fluid inlet temperature |
| UA | Overall heat-transfer conductance |
| UA/A | Overall heat-transfer conductance per unit heat-transfer area |
| y+ | Dimensionless wall distance |
| ε | Heat-exchanger effectiveness |
| Abbreviations | |
| CFD | Computational fluid dynamics |
| CV | Coefficient of variation |
| DoE | Design of experiments |
| HX | Heat exchanger |
| NN | Neural network |
| NSGA-II | Non-dominated Sorting Genetic Algorithm II |
| NTU | Number of transfer units |
| RANS | Reynolds-Averaged Navier–Stokes |
| RASE | Root average squared error |
| SST | Shear stress transport |
| TanH | Hyperbolic tangent |
| TMS | Thermal management system |
References
- Pornet, C.; Isikveren, A.T. Conceptual design of hybrid-electric transport aircraft. Prog. Aerosp. Sci. 2015, 79, 114–135. [Google Scholar] [CrossRef] [Scilit]
- Friedrich, C.; Robertson, P.A. Hybrid-electric propulsion for aircraft. J. Aircr. 2015, 52, 176–189. [Google Scholar] [CrossRef] [Scilit]
- Asli, M.; König, P.; Sharma, D.; Pontika, E.; Huete, J.; Konda, K.R.; Mathiazhagan, A.; Xie, T.; Höschler, K.; Laskaridis, P. Thermal management challenges in hybrid-electric propulsion aircraft. Prog. Aerosp. Sci. 2023, 144, 100967. [Google Scholar] [CrossRef] [Scilit]
- Potamiti, M.; Gkoutzamanis, V.G.; Kalfas, A.I. Thermal management system design for a series hybrid-electric propulsion architecture. Aeronaut. J. 2024, 128, 1532–1555. [Google Scholar] [CrossRef] [Scilit]
- Torri, F.; Berni, F.; Giacalone, M.; Mantovani, S.; Defanti, S.; Colombini, G.; Bassoli, E.; Merulla, A.; Fontanesi, S. A methodology to reduce the computational effort in 3D-CFD simulations of plate-fin heat exchangers. Appl. Therm. Eng. 2024, 245, 122843. [Google Scholar] [CrossRef] [Scilit]
- Batista, J.; Trp, A.; Lenic, K. Experimentally validated numerical modeling of heat transfer in crossflow air-to-water fin-and-tube heat exchanger. Appl. Therm. Eng. 2022, 212, 118528. [Google Scholar] [CrossRef] [Scilit]
- Kim, W.S.; Than, P.T.; Kim, B.K. CFD simulations of plate–fin cross-counter flow compact heat exchanger. J. Mech. Sci. Technol. 2024, 38, 969–978. [Google Scholar] [CrossRef] [Scilit]
- Incropera, F.P.; DeWitt, D.P.; Bergman, T.L.; Lavine, A.S. Fundamentals of Heat and Mass Transfer, 6th ed.; John Wiley & Sons: New York, NY, USA, 2007. [Google Scholar]
- Kays, W.M.; London, A.L. Compact Heat Exchangers, 2nd ed.; McGraw-Hill: New York, NY, USA, 1964. [Google Scholar]
- Shah, R.K.; Sekulić, D.P. Fundamentals of Heat Exchanger Design; John Wiley & Sons: Hoboken, NJ, USA, 2003. [Google Scholar]
- Tan, C.K.; Ward, J.; Wilcox, S.J.; Payne, R. Artificial neural network modelling of the thermal performance of a compact heat exchanger. Appl. Therm. Eng. 2009, 29, 3609–3617. [Google Scholar] [CrossRef] [Scilit]
- Brunton, S.L.; Noack, B.R.; Koumoutsakos, P. Machine learning for fluid mechanics. Annu. Rev. Fluid Mech. 2020, 52, 477–508. [Google Scholar] [CrossRef] [Scilit]
- Li, A.; Yuen, A.C.Y.; Wang, W.; Chen, T.B.Y.; Lai, C.S.; Yang, W.; Wu, W.; Chan, Q.N.; Kook, S.; Yeoh, G.H. Integration of Computational Fluid Dynamics and Artificial Neural Network for Optimization Design of Battery Thermal Management System. Batteries 2022, 8, 69. [Google Scholar] [CrossRef] [Scilit]
- Zhang, T.; Chen, L.; Wang, J. Multi-objective optimization of elliptical tube fin heat exchangers based on neural networks and genetic algorithm. Energy 2023, 269, 126729. [Google Scholar] [CrossRef] [Scilit]
- Farajollahi, A.; Vaferi, K.; Baharvand, M. Analyzing tube arrangements of a finned-tube heat exchanger to optimize overall efficiency using artificial neural network and response surface methodology. Case Stud. Therm. Eng. 2024, 63, 105302. [Google Scholar] [CrossRef] [Scilit]
- ANSYS Inc. ANSYS CFX Introduction, Release 2023 R1; ANSYS Inc.: Canonsburg, PA, USA, 2023. [Google Scholar]
- JMP Statistical Discovery LLC. Using JMP 18; JMP Statistical Discovery LLC: Cary, NC, USA, 2024. [Google Scholar]
- Lee, S.H.; Lee, S.G.; Ryi, J.H.; Choi, J.S. Design optimization of wind turbine blades for reduction of airfoil self-noise. J. Mech. Sci. Technol. 2013, 27, 413–420. [Google Scholar] [CrossRef] [Scilit]
- Deb, K.; Pratap, A.; Agarwal, S.; Meyarivan, T. A fast and elitist multiobjective genetic algorithm: NSGA-II. IEEE Trans. Evol. Comput. 2002, 6, 182–197. [Google Scholar] [CrossRef] [Scilit]

Disclaimer/Publisher’s Note: The statements, opinions and data contained in all publications are solely those of the individual author(s) and contributor(s) and not of MDPI and/or the editor(s). MDPI and/or the editor(s) disclaim responsibility for any injury to people or property resulting from any ideas, methods, instructions or products referred to in the content. |
© 2026 by the authors. Licensee MDPI, Basel, Switzerland. This article is an open access article distributed under the terms and conditions of the Creative Commons Attribution (CC BY) license.