


Abstract
Photovoltaic (PV) power generation, as a renewable energy system, contributes to global decarbonization efforts. Wind load is one of the dominant loads acting on PV arrays, and the wind load shape coefficient is a parameter characterizing the non-uniform wind-pressure effect on PV modules, which directly affects the estimation and distribution of wind loads. The coefficient is influenced by aerodynamic interference among PV modules and environmental boundary conditions. However, systematic research on the wind load shape coefficient for mega-scale PV arrays and its influencing factors remains limited. A computational fluid dynamics (CFD) model was developed and verified in Ansys Fluent to investigate the shielding effect on the wind load shape coefficient of mega-scale PV arrays. This study clarifies how PV panel module arrangement, terrain shielding height difference, and wind direction angle affect the shielding effect. The influence of PV panel module arrangements (linear and columnar configurations) on the shielding effect was investigated, focusing on the impact on the wind load shape coefficient of mega-scale PV arrays under varying terrain shielding height differences and wind direction angles. Recommended values were proposed for different wind load shape coefficient zones across PV panel modules. The findings showed that under full terrain shielding conditions, the effects of terrain shielding height difference and wind direction could be neglected, allowing a uniform wind load shape coefficient of 0.3 for all PV panel modules within the array. In contrast, without terrain shielding, the wind direction angle must be considered. In this case, the wind load shape coefficient values were determined as 1.1 for the windward zone, 0.55 for the edge zone, and 0.5 for the internal zone.
1. Introduction
Photovoltaic (PV) power generation is a clean and renewable energy source [1,2]. With the significant increase in the installed capacity of individual PV power stations, the arrangement density of PV arrays has significantly improved, and the structural safety and stability of PV systems have received increasing attention [3,4]. Wind load is one of the important factors affecting the safety and stability of PV systems [5,6]. The wind load shape coefficient is a parameter used to characterize the non-uniform wind-pressure effect on the surface of a structural or PV-panel system [7]. It reflects the spatial variation of wind pressure and directly affects the estimation and distribution of wind loads on PV arrays. The wind load shape coefficient of a PV module is determined from the difference between the windward and leeward pressure effects. In the present study, the coefficient is therefore evaluated based on the calculated pressure distribution on the two surfaces of the PV module. The resulting coefficient is subsequently used to characterize the spatial variation of wind loads within the PV array. It directly affects the peak estimation and distribution form of wind loads and has a decisive influence on the design of the support structure for PV panels [8], the optimization of wind resistance performance, and the reliability throughout the life cycle. Hu et al. [8] further investigated critical wind direction angles and edge-module vulnerability in fixed double-row PV arrays using CFD simulations. Their results highlight the importance of oblique wind directions for the aerodynamic response of edge modules. These findings provide a useful reference for interpreting the wind-direction-dependent shielding effects investigated in the present study.
With the increase in the scale of PV arrays [9], the spatial differentiation and dynamic amplification of the wind load shape coefficient caused by aerodynamic interference effects have become increasingly prominent. The wind load shape coefficient of mega-scale PV arrays is increasingly influenced by a variety of multi-scale factors, including inclination angles [10,11], wind direction angles [12,13], array arrangements [14,15], and environmental boundary conditions [16,17].
In recent years, many scholars have conducted research on the wind load shape coefficients and their influencing factors of PV arrays (Table 1). Wang et al. [18] employed field tests to investigate the wind and thermal microenvironment of a distributed PV array in a high-altitude cold region, and analyzed the wind speed, roof and PV panel temperatures, and wind loads. Li et al. [19] conducted a numerical analysis of the average wind pressure of PV arrays using the computational fluid dynamics (CFD) method and proved the group wind load shielding effect of PV arrays. Xu et al. [20] employed the CFD method to investigate the effects of the inclination angle of panel modules, height above the ground, and array arrangement on the wind load shape coefficient of PV arrays. The study revealed that the shielding of peripheral PV panel modules led to a varying degree of reduction in the wind load experienced by the internal panel modules. Lou et al. [21] investigated the wind load shape coefficient of mega-scale PV arrays and its influencing factors through a combination of wind tunnel tests and CFD numerical simulations and rationally partitioned the PV arrays based on the differences in wind load shape coefficients. Zhang et al. [22] investigated the variation of the wind load shape coefficient of PV arrays by the CFD method under the influence of inclination angle, spacing ratio, wind direction angle, height from the ground, and environmental conditions. The proposed values for the regional wind load shape coefficient were established under each wind direction angle, and a wind load calculation formula was developed that incorporated both the height coefficient and the spacing ratio coefficient. Debnath et al. [23] proposed a novel integrated methodology combining wind tunnel experiments, CFD, and Finite element analysis (FEA) to thoroughly evaluate wind-induced effects on ground-PV tracking systems, as well as established the practical, verified design wind load shape coefficients for mega-scale ground-mounted PV arrays. Abdallah and Zisis [24] evaluated the aerodynamic performance of PV panels mounted on gable roofs, examining the effects of panel size, orientation, and coverage on wind-induced loads. The findings indicated that larger PV arrays, especially when installed in landscape orientation with full roof coverage, generally exhibit lower uplift coefficients (normalized per unit area) and smoother pressure distributions than smaller ones. However, the research primarily concentrated on small-scale PV panels or arrays, whereas studies pertaining to mega-scale PV arrays have been relatively limited. Despite these investigations, the wind load characteristics of mega-scale PV arrays remain affected by multiple interacting factors, including array arrangement, terrain shielding, and wind direction. In particular, the spatial zoning of wind load shape coefficients considering the shielding effect within mega-scale PV arrays has not yet been sufficiently clarified. Therefore, further investigation is needed to establish a practical understanding of the spatial variation of wind load shape coefficients under different shielding conditions.
Table 1.
Summary of the existing data on the wind load shape coefficient.
Fishery-photovoltaic complementarity (FPC) is an innovative model of land composite utilization that combines photovoltaic power generation with aquaculture in a synergistic manner, both physically and ecologically [25,26]. Mega-scale PV arrays are installed in the space above fish ponds, lakes, reservoirs, and other aquaculture water areas for power generation, while aquaculture is carried out normally in the water areas below. Through scientific design, resource efficiency, economic viability, and environmental sustainability can be improved. To investigate the shielding effect associated with the wind load shape coefficient of mega-scale PV arrays, a CFD numerical model of PV arrays was established and verified using Ansys Fluent software (Ansys Fluent 2024) based on an actual FPC power generation project. The influence of PV panel module arrangements on the shielding effect was systematically examined. Focusing on the arrangement of fixed PV arrays, the impact of the shielding effect on the wind load shape coefficient of mega-scale PV arrays was investigated under different terrain shielding height differences and wind direction angles. A zoning classification for the wind load shape coefficients of mega-scale PV arrays was established, along with proposed values for their respective wind load shape coefficients.
2. PV Array Configuration
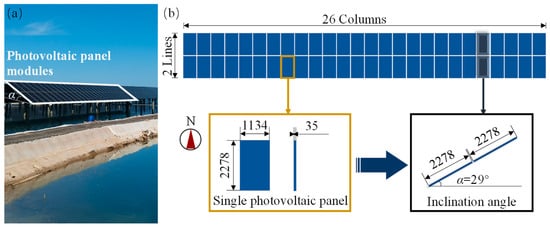
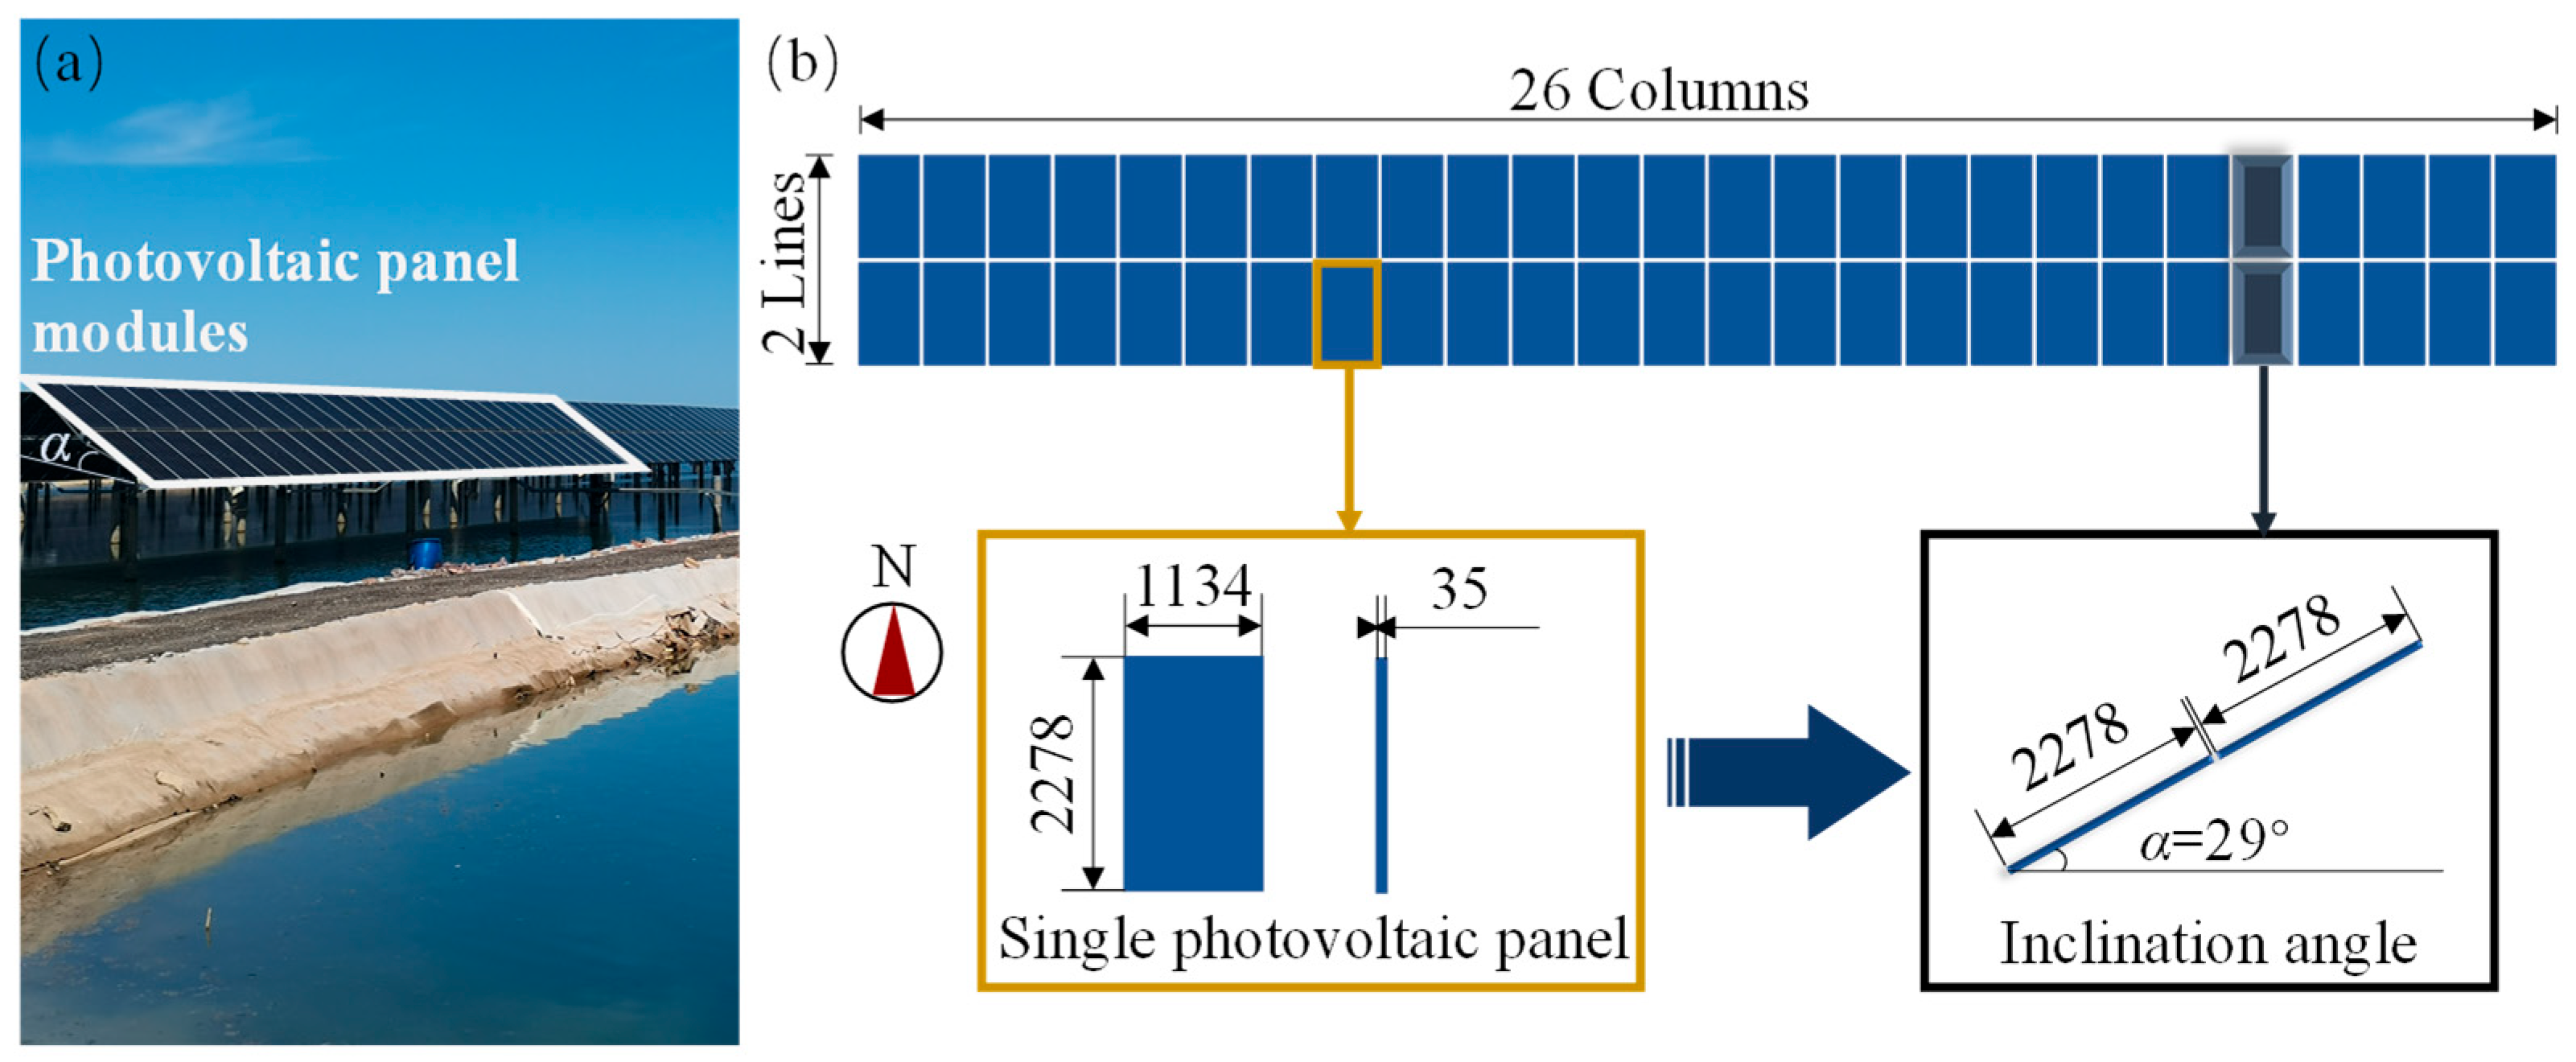
The PV-array configuration investigated in this study was established based on an actual fishery-photovoltaic complementarity project in China. The project-specific information used in the present CFD analysis mainly includes the geometric parameters of the PV modules and their arrangement, which are directly relevant to the aerodynamic investigation. The installed capacity of the direct current (DC) side of this project is 264 MWp, consisting of 64 arrays, and it qualifies as a mega-scale PV power generation system, all made in China (Figure 1a). The size of a single PV panel is 2278 mm × 1134 mm × 35 mm (length × width × thickness). A single PV panel module is composed of 2 lines and 26 columns of PV panels, resulting in a total of 52 PV panels (Figure 1b). The specific planar arrangement of the mega-scale PV panels is as follows: Two PV panels are along the south and north directions of a single PV panel module, and 26 PV panels are along the east and west directions. The inclination angle of the modules is 29°, with a minimum clearance of 4500 mm from the ground. The column and line spacings between PV panel modules are 1 m and 10 m, respectively. The present study focuses on the aerodynamic characteristics of the PV array configuration rather than the electrical performance of the PV system. Therefore, the geometric parameters directly relevant to the aerodynamic analysis, including the module dimensions, inclination angle, clearance, and spacing, are specified in detail. Other electrical-system parameters, such as inverter manufacturer and electrical connection configuration, are not included because they do not directly affect the CFD-based wind-load analysis.
Figure 1.
PV panel modules: (a) Physical picture; (b) Detail drawing (Unit: mm).
3. CFD Simulation
3.1. Modeling
3.1.1. Model Size
Referring to the model in existing literature [27], a five-line and three-column PV array model was established by using Ansys Fluent software and compared with the original model. To simplify the CFD calculation and focus on the large-scale aerodynamic interaction among PV modules, the PV panel module was represented as a plane surface using Ansys Fluent software. The effects of structural components, such as columns, and the thickness of the PV modules were not explicitly modeled. This simplification reduces the computational complexity but may influence the prediction of local flow separation, vortex shedding, and pressure distribution near structural components and module edges. Therefore, the present model is primarily intended to investigate the overall wind-load distribution and shielding effect of the PV array rather than the detailed structural response. The column and line spacings between PV panel modules were 1 m and 10 m, respectively, and the total width of the windward side was 33 m.
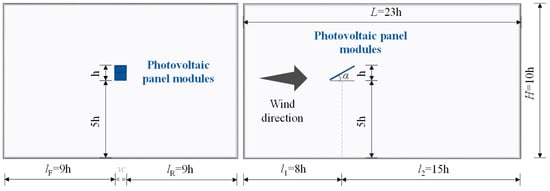
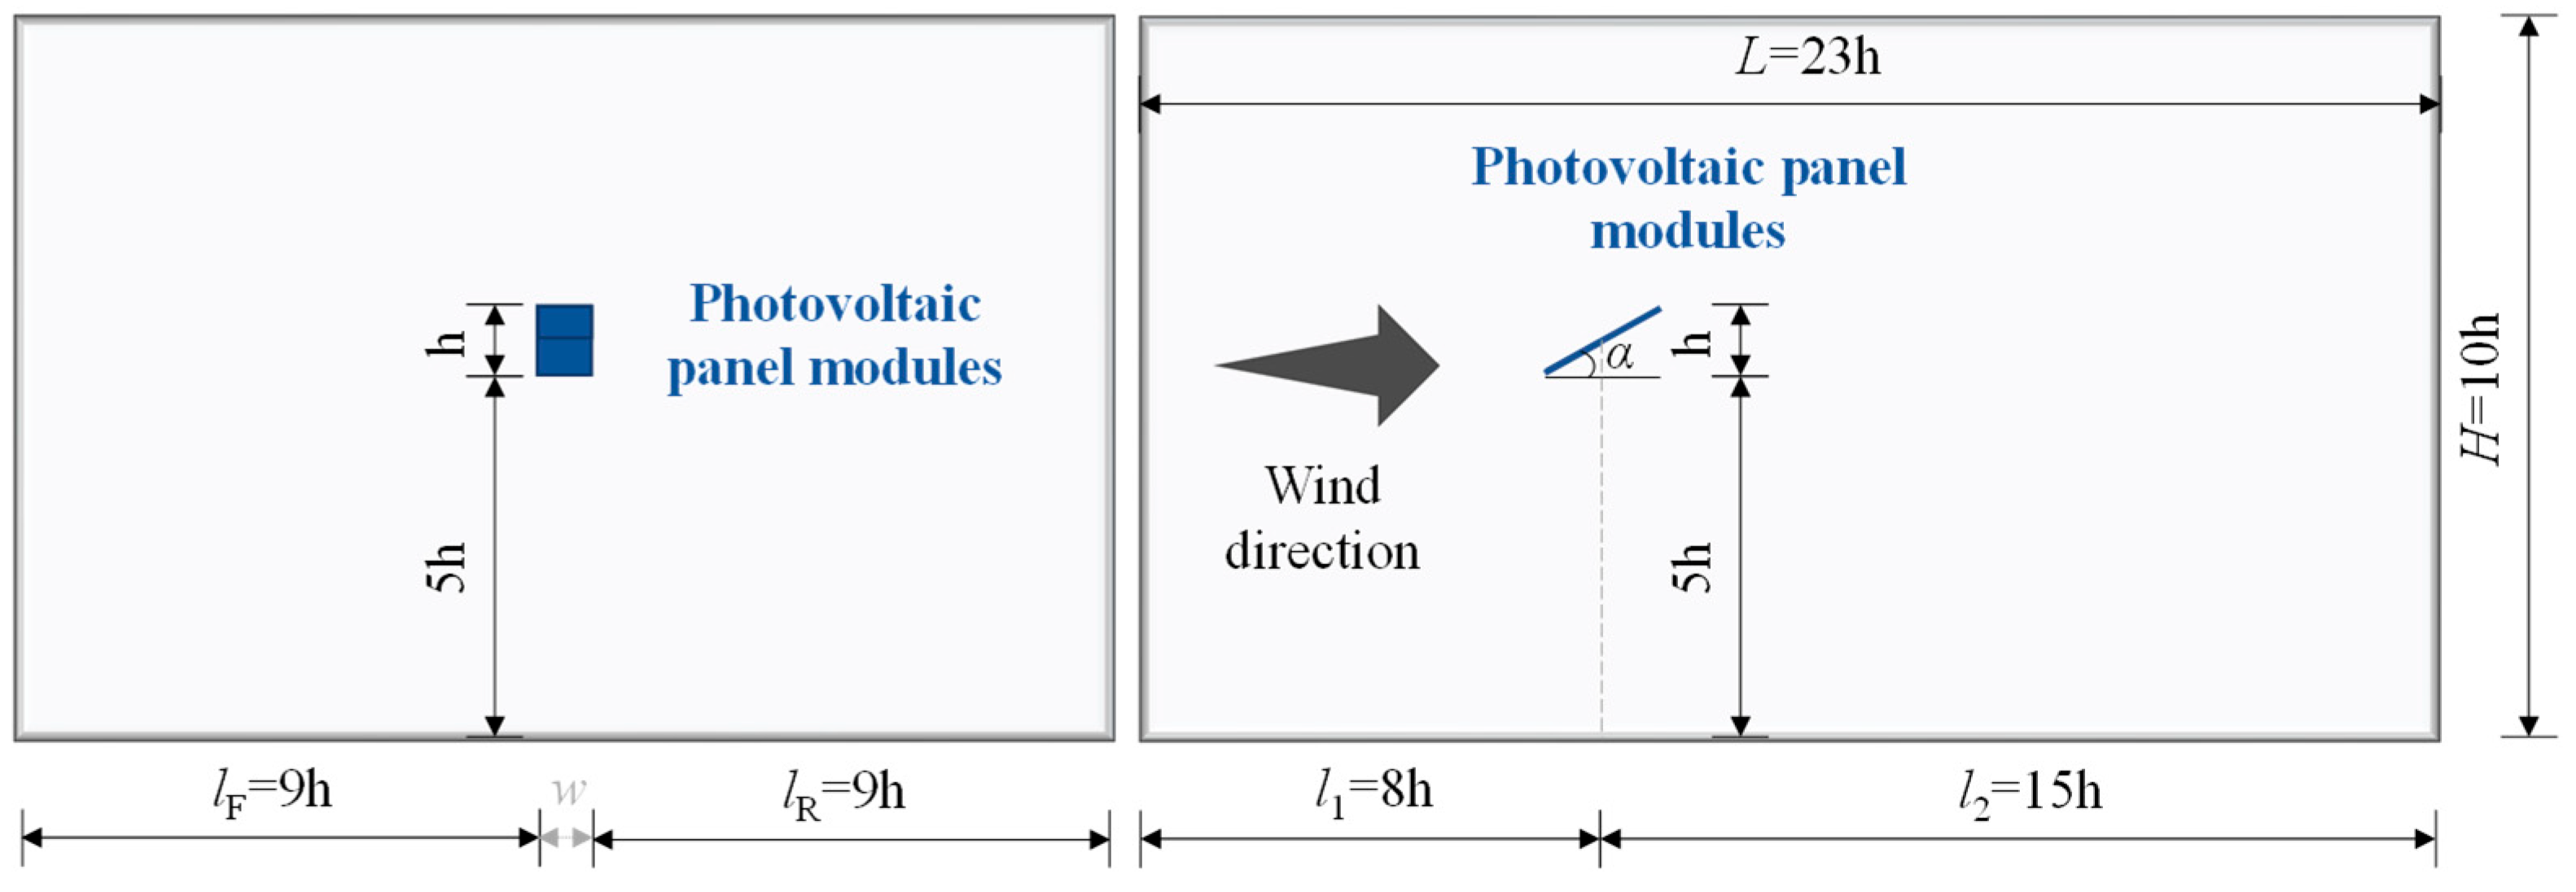
To mitigate the influence of the basin boundary on the wind field, the calculation domain adopted a cuboid. The left and right sides of the model extended 9 h in width (lF and lR), while it measured 10 h in height (H). The upstream length of the calculation domain l1 was 8 h, and the downstream length l2 was 15 h. Here, h was the vertical projection height of PV panel modules, and α was the inclination angle of PV panel modules (set to 30°). The calculation domain size (length-L × width-W × height-H) was shown in Figure 2. According to the relevant suggestions, the blocking rates of the calculated models all met the requirement of being less than 3% [28,29].
Figure 2.
Calculation domain (w, the total width of PV panel modules).
3.1.2. Mesh Generation
The Poly-Hexcore meshing method was adopted. Tetrahedral meshes were initially generated near the wall surfaces and subsequently transitioned to polyhedral meshes. The minimum and maximum mesh sizes were 0.3 m and 3 m, respectively, with local mesh refinement applied near the PV-module surfaces. The computational domain contained approximately 3.46 million cells. A systematic mesh-independence analysis was not performed in the present study. Therefore, the selected mesh should be regarded as the numerical discretization adopted for the present investigation rather than as a mesh-independent solution. A systematic mesh-sensitivity assessment will be conducted in future work.
3.1.3. Model Parameter
The turbulence model employed was the standard wall function Realizable k-ε model. The air model utilized was the ideal incompressible air model, while the velocity and pressure within the flow field were coupled using the SIMPLEC algorithm. The inlet boundary condition was defined as a Velocity-inlet with a uniform velocity of 30 m/s, while the outlet boundary condition was Outflow. The lower boundary of the basin wall and the PV array model were modeled as non-slip walls (Wall), whereas the upper boundary was Symmetry.
Equation (1) converts the area-averaged pressure coefficient computed at the CFD module height to the equivalent shape coefficient referenced to the 10 m standard height, ensuring consistency with the design wind pressure definition in the Chinese load code. Equation (2) shows that the shape coefficient μs directly scales the design wind pressure on the structural surface, and is therefore the key output of the present CFD study.
where, μs is the shape coefficient; Cp is the area-averaged pressure coefficient on the PV module surface, referenced to the dynamic pressure at the module height; qref,h is the reference dynamic pressure at the module height; qref,∞ is the reference dynamic pressure at the standard reference height (10 m, as defined in GB 50009 [30]).
where, βgz is the gust effect factor; μs is the shape coefficient (Equation (1)); μz is the height coefficient at the module height (per GB 50009, with z denoting the height above ground) w0 is the reference wind pressure at the standard reference height (10 m).
3.2. Model Verification
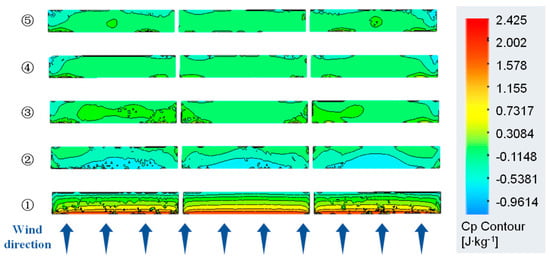
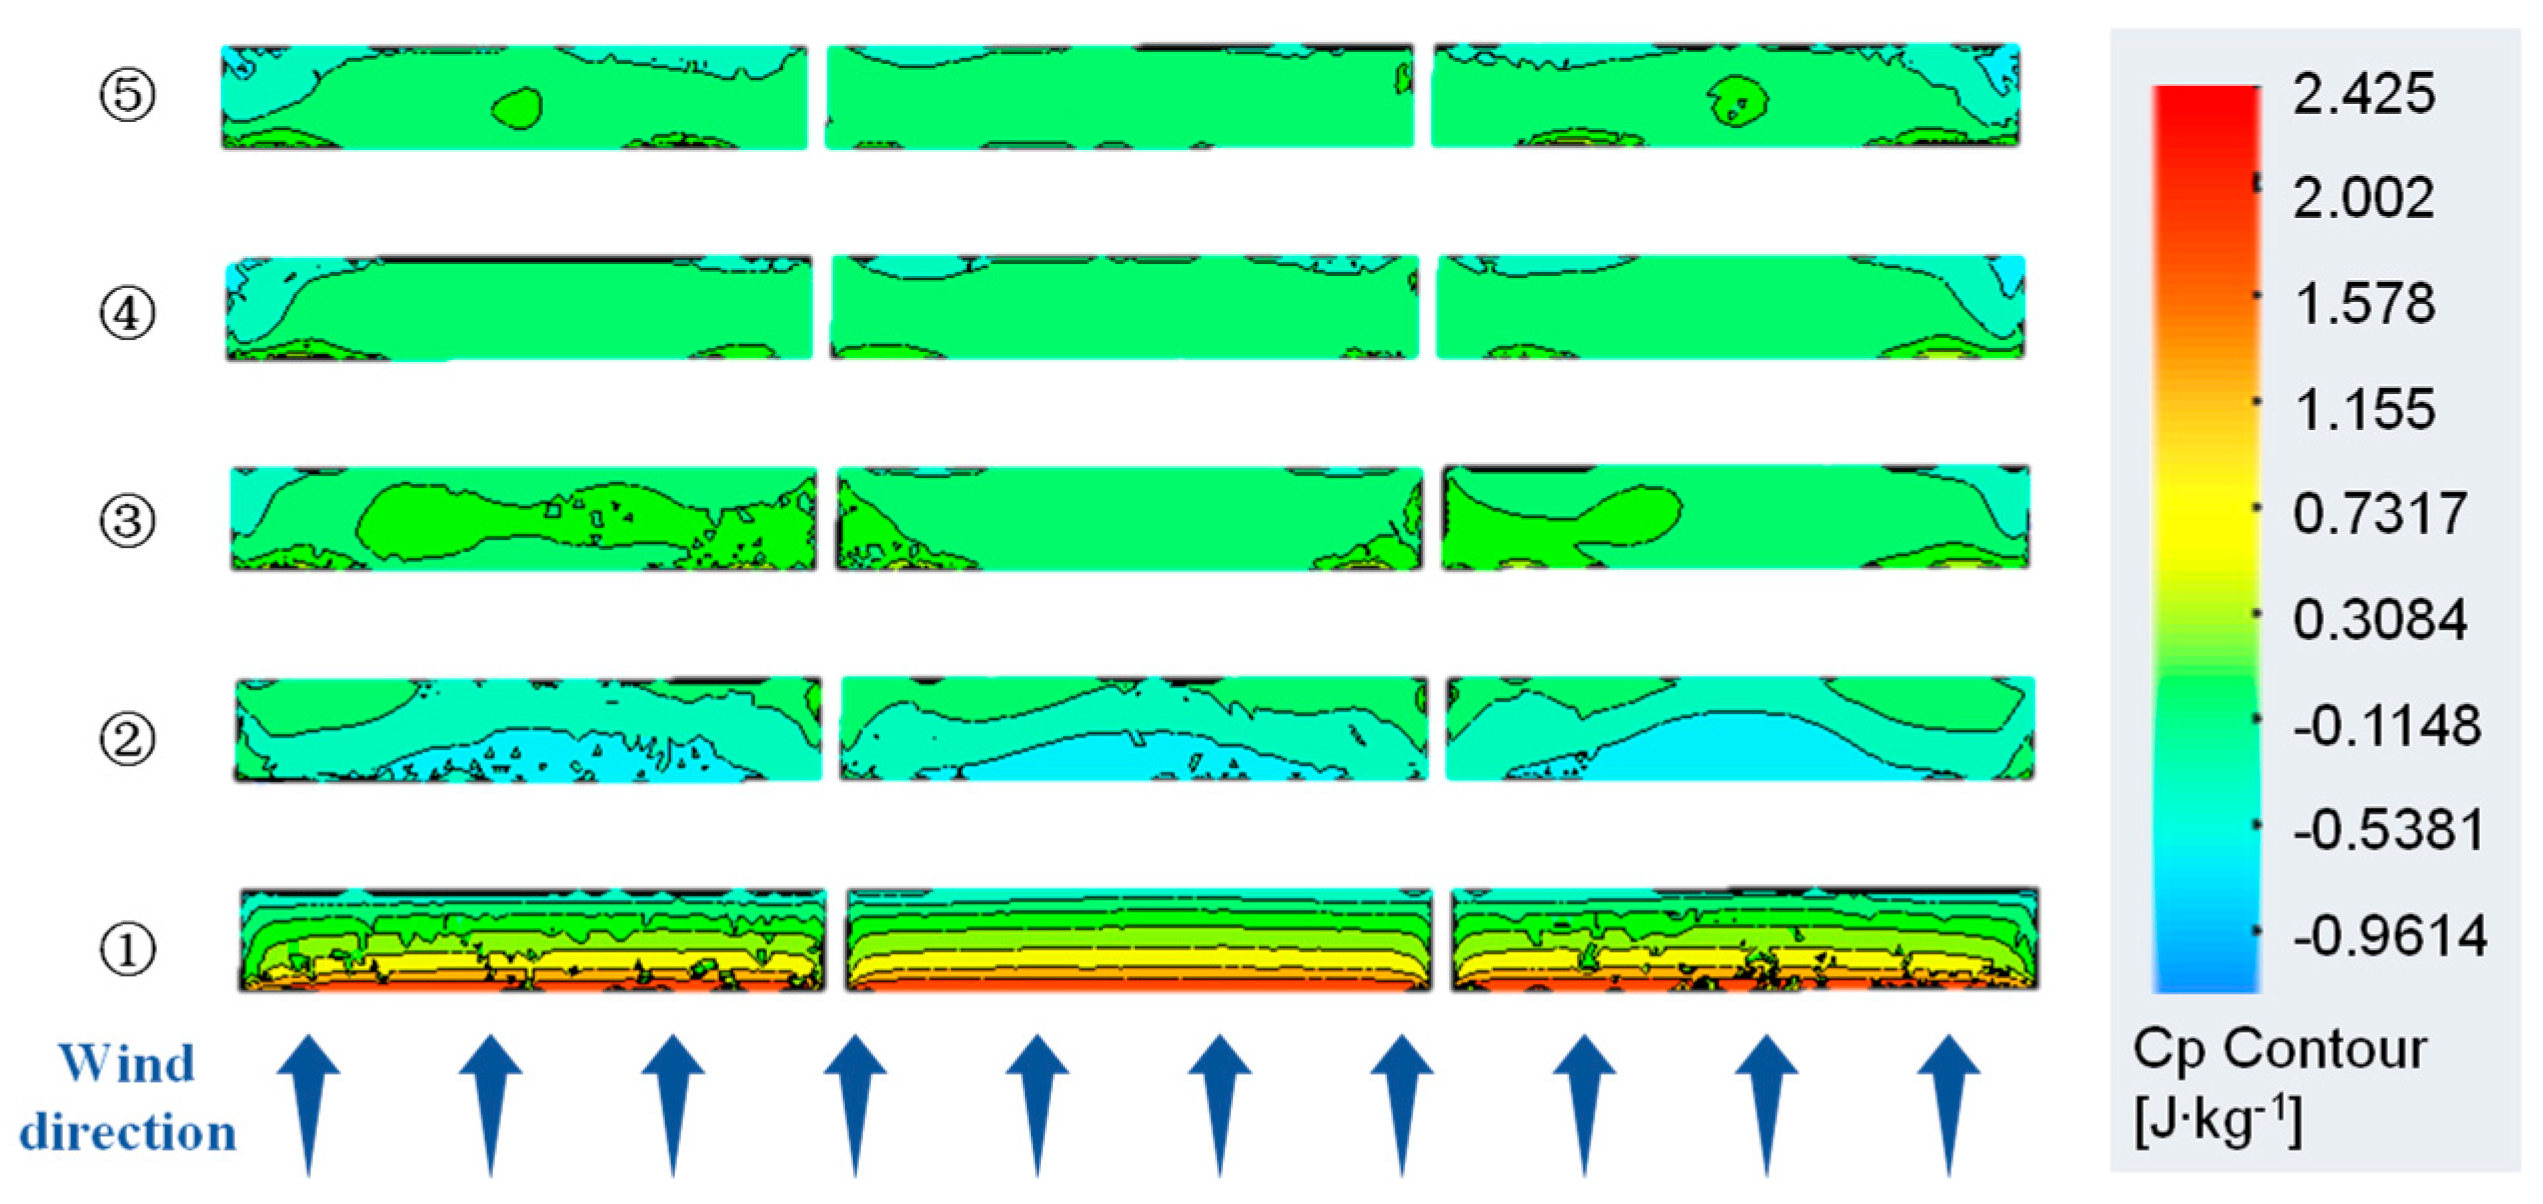
The wind load shape coefficient distribution of the five-line and three-column PV array model is shown in Figure 3. The research findings indicated that the wind load shape coefficient of the PV panel modules in the first line was most significantly affected by the wind load effect, with the most value. The wind load shape coefficient of the PV panel modules in the second line fluctuated, with a comparatively lower value. The wind load shape coefficients of the PV panel modules from the third line to the fifth line gradually stabilized within the range of 0.3 to 0.5.
Figure 3.
Wind load shape coefficient distribution of the five-line and three-column PV array (wind velocity = 30 m/s).
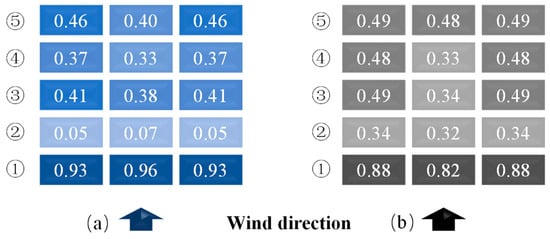
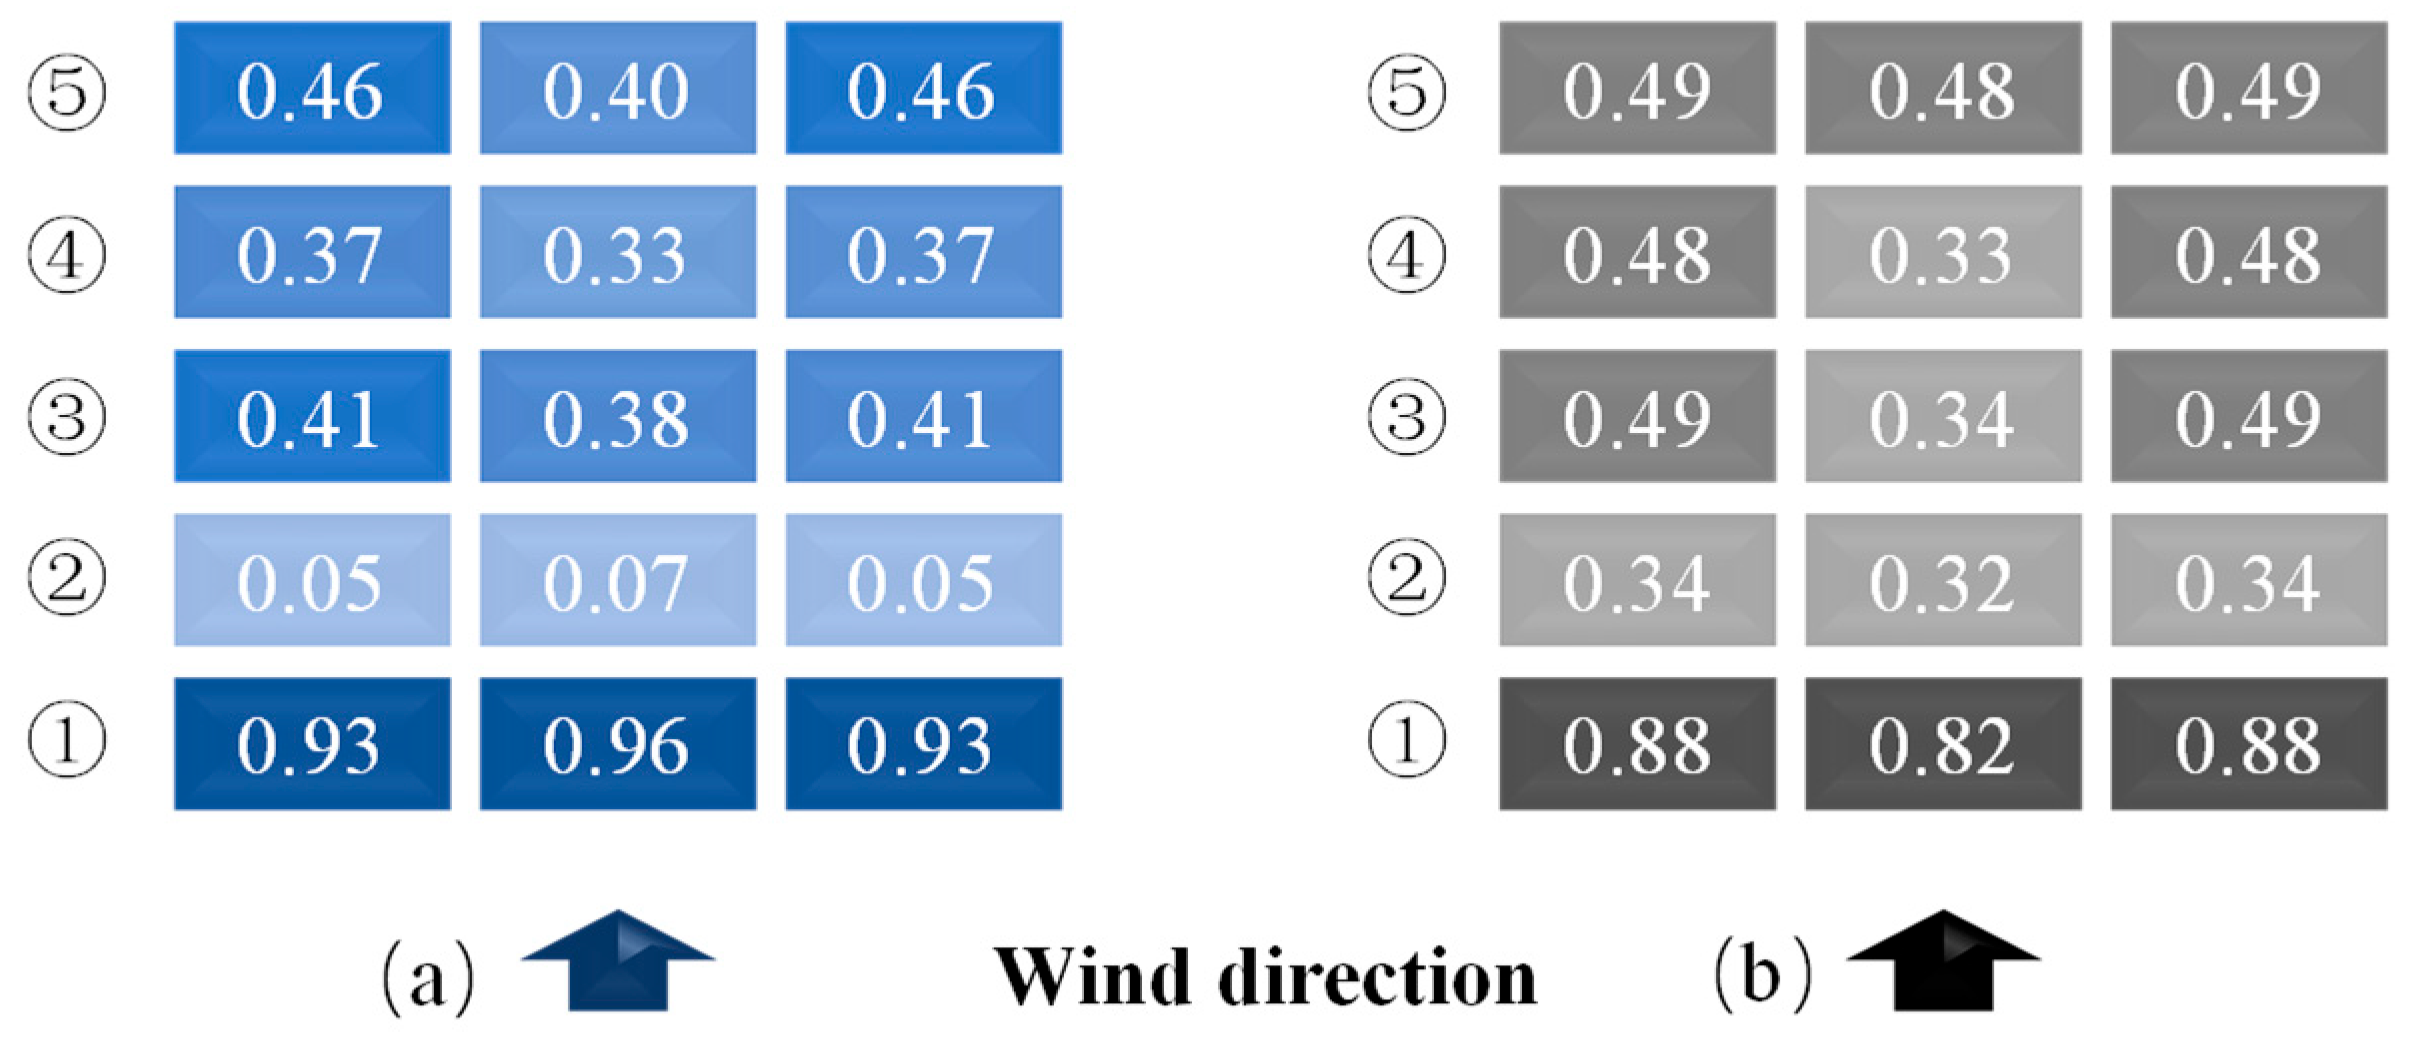
The comparison of the wind load shape coefficients of each PV panel module in this simulation with those in the original literature is shown in Figure 4.
Figure 4.
Comparison of the wind load shape coefficient of the five-line and three-column PV array: (a) Simulation results; (b) Literature results (wind velocity = 30 m/s).
Research showed that the simulated results of the wind load shape coefficient of PV arrays were consistent with the trend of the literature results, specifically manifested as follows: (1) The wind load shape coefficient of PV panel modules in the same line was symmetrical on both sides and slightly larger than that in the middle. (2) The wind load shape coefficient of the PV panel modules in the same line was the largest in the windward direction for the first line, the smallest for the second line, and within the range of 0.3 to 0.5 for the third to fifth lines. Furthermore, the research found that the wind load shape coefficients of the PV panel modules on both sides of the third line in the simulated results were not completely symmetrical. The analysis suggested that this was mainly because the modules in this line were in the turbulent zone formed after the airflow passed over the modules in the second line. The uncertainty associated with turbulence and the overall variation in the wind load shape coefficients of PV panel modules remained within a reasonable range. The simulated results exhibited the same overall variation trends as the published results, including the relatively large wind load shape coefficient in the windward line, the reduced coefficient in the second line, and the relatively stable values in the subsequent lines. These similarities provide a reference-based assessment of the applicability of the adopted modeling approach for the present investigation. However, because no dedicated experimental validation or systematic mesh-independence analysis was performed, the present comparison should not be interpreted as a complete validation of the numerical model. The model was therefore used for the subsequent parametric investigation within the geometric and boundary-condition ranges considered in this study.
4. Parameter Analysis
4.1. Influence of the Arrangement of PV Panels on the Shielding Effect
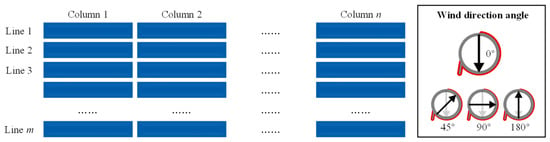
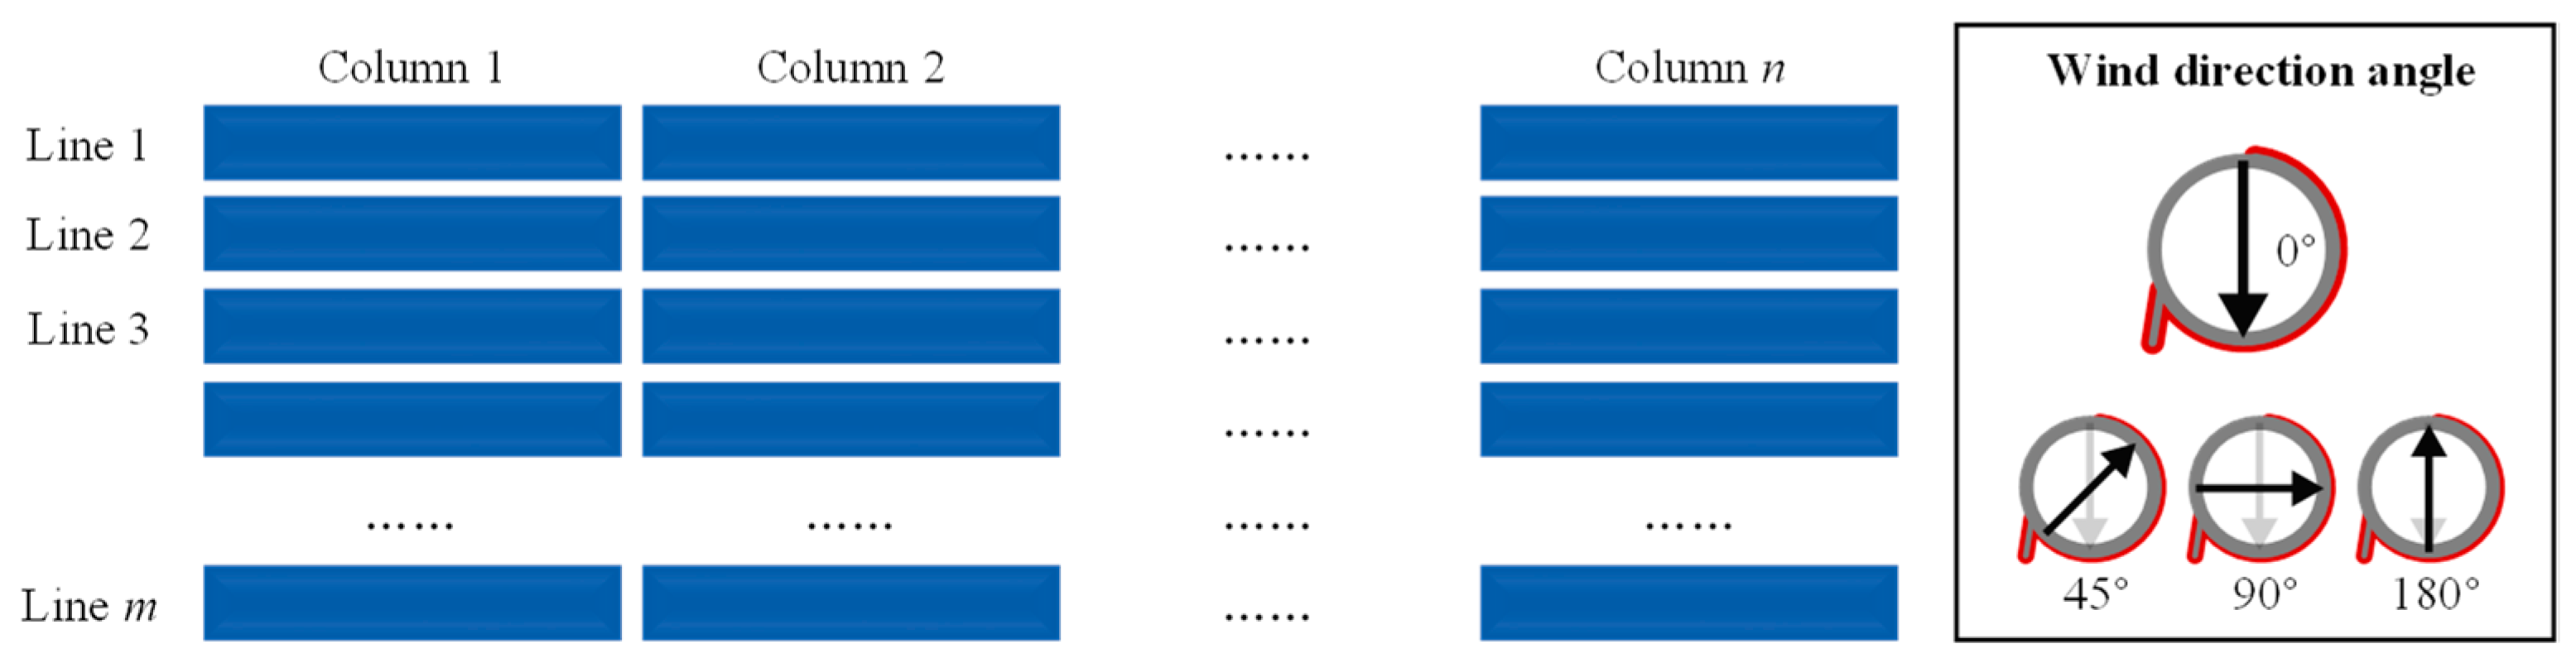
As shown in Figure 5, a 0° wind direction angle is the positive wind direction, and a 180° wind direction angle is the negative wind direction. In PV arrays, the arrangement of panel modules parallel to the wind direction was called a column, and that perpendicular to the wind direction was called a line.
Figure 5.
Legend of lines, columns and wind direction angles.
Mega-scale PV arrays were usually composed of multiple lines and columns of PV panel modules with a relatively large number of arrangements. For the convenience of calculation and analysis, one-line and multi-column, as well as one- column and multi-line PV arrays were adopted for this study, respectively. Among them, the size of a single PV panel module was 30 m × 4.5 m (length × width), and the column and line spacings between PV panel modules were 1 m and 10 m, respectively.
4.1.1. Column Number
Taking columns as the variable, a one-line and 32-column PV array model was established. To simplify the calculation, a 0° wind direction angle was adopted without occlusion. The research found that there was no difference in the influence of wind load on different columns of PV panel modules in the same line under a 0° wind direction angle and without occlusion, and the wind load shape coefficients of each PV panel module were all close to 1.3.
4.1.2. Line Number
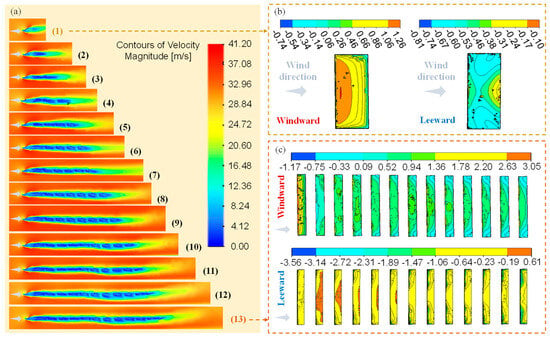
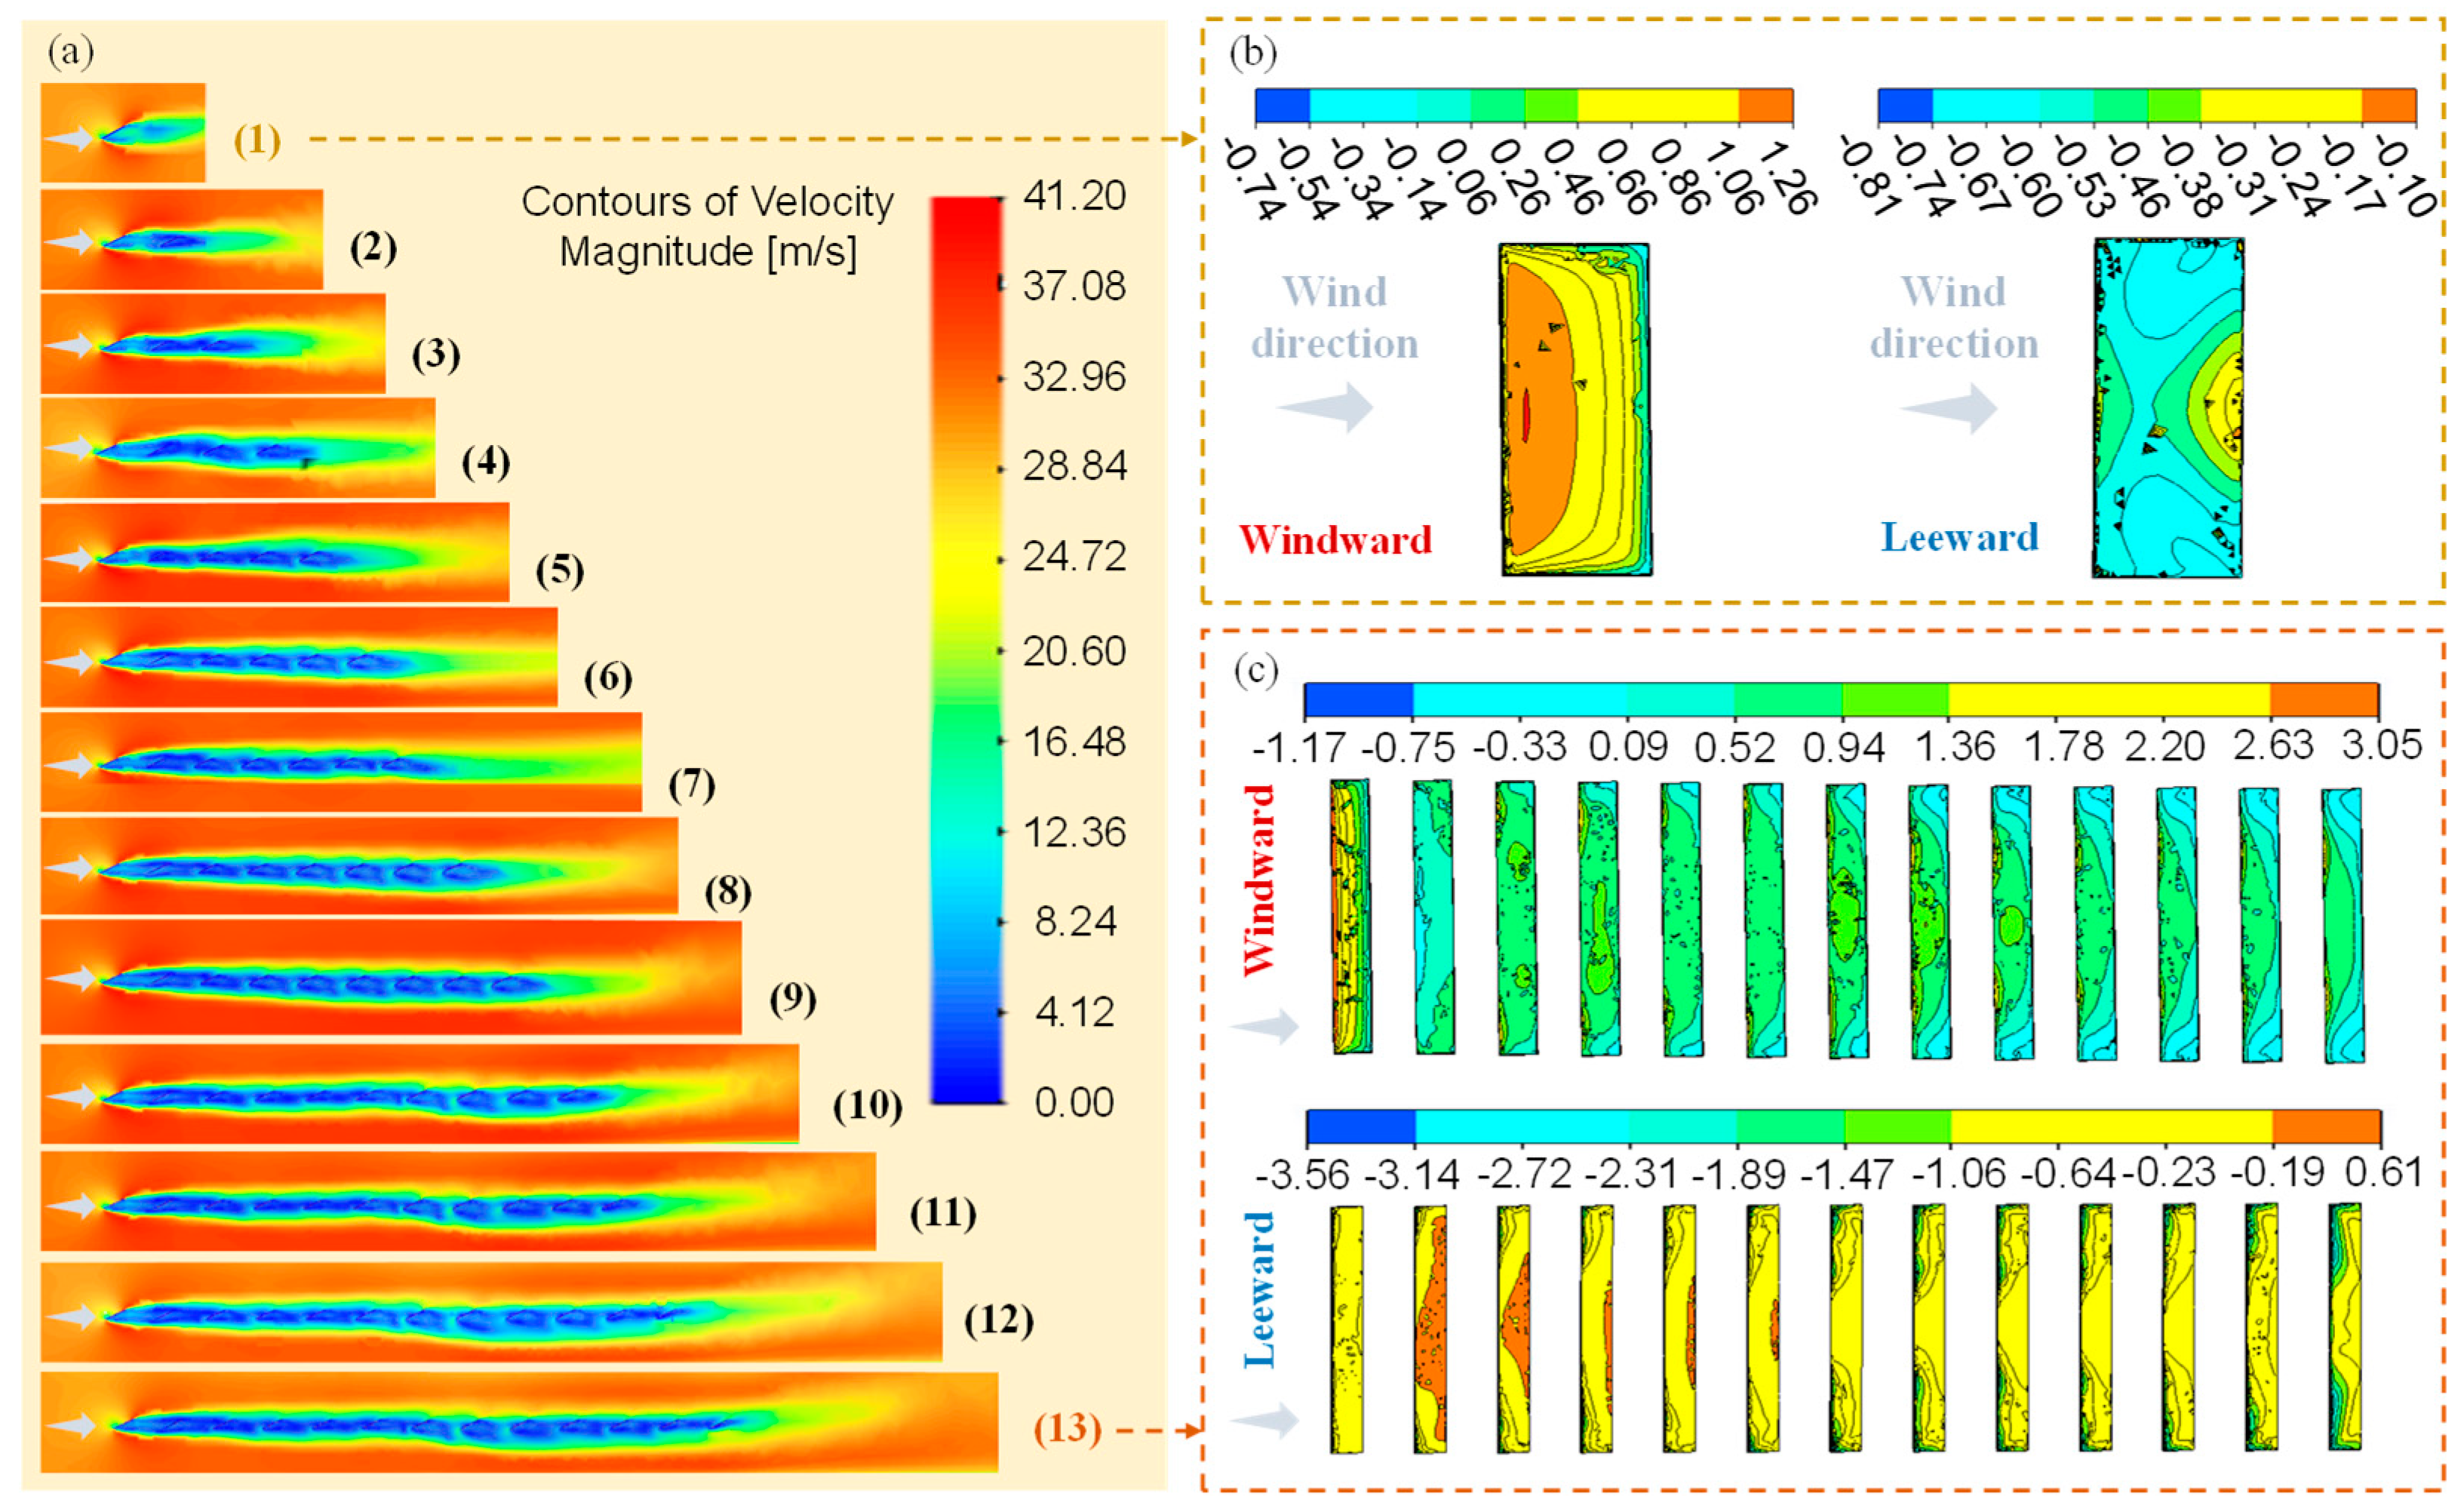
To investigate the shielding of the front line on the back line of PV panel modules, a one-column and multi-line model was established with lines as the variable for comparison, and the number of lines was varied from 1 to 13 (Figure 6).
Figure 6.
One-column and multi-line PV array model: (a) Flow field (1~13); (b,c) are the wind load shape coefficient distribution of the one-column of one-line and 13-line PV arrays, respectively (wind velocity = 30 m/s).
The flow field of the one-column and multi-line PV array models (lines 1 to 13) is shown in Figure 6a. The research revealed that the airflow was obstructed by the PV panel modules, resulting in a significant reduction in flow velocity within the surrounding area. During the interval from the second-line panel module to the eighth-line panel module, the gas was significantly blocked by the front line of the PV panel module, and the gas flow velocity within the interval of the panel module was close to 0. Starting from the ninth-line panel module, the airflow velocity near the rear panel module remained relatively consistent, with its direction appearing to be nearly parallel to that of the PV panel module in an upward orientation and with no obvious difference.
The wind load shape coefficient distribution of the one-line and one-column PV array model is shown in Figure 6b. At a 0° wind direction angle, the upper surface of the PV panel module was the windward side, the lower edge of the upper surface was the windward leading edge, and the wind load shape coefficient was the smallest. Due to the separation phenomenon of the wind, the higher up the windward side, the larger the wind load shape coefficient value. However, the values of the majority of zones within the panel modules exhibited no significant differences, with only the edge zones displaying relatively pronounced changes. The overall wind load shape coefficient of the windward side was approximately 0.85. The overall wind load shape coefficient of the leeward side of the PV panel module was approximately −0.55, and the wind suction phenomenon was most obvious at the lower end of the leeward side. The net wind pressure of the entire PV panel module was positive pressure, with a wind load shape coefficient approximating 1.4.
The wind load shape coefficient distribution of the one-column and 13-line PV array model is shown in Figure 6c. At a 0° wind direction angle, the majority zone of the windward side of the PV panel module was significantly subjected to wind pressure, and there was a significant gradient in the edge zone. The wind load shape coefficient value gradually decreased from the lower edge upwards. Affected by the line spacing of the panel modules, most of the airflow directly passed over the second-line panel module, resulting in a very small wind load on the second-line panel module, even lower than the wind load shape coefficient of the third-line and fourth-line panel modules behind.
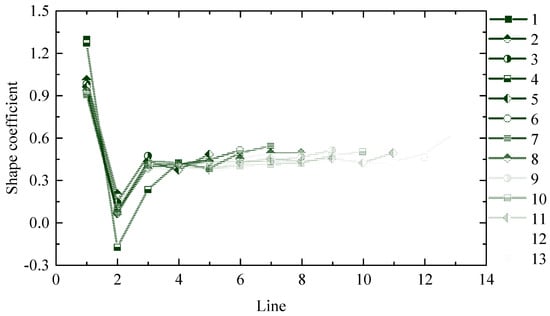
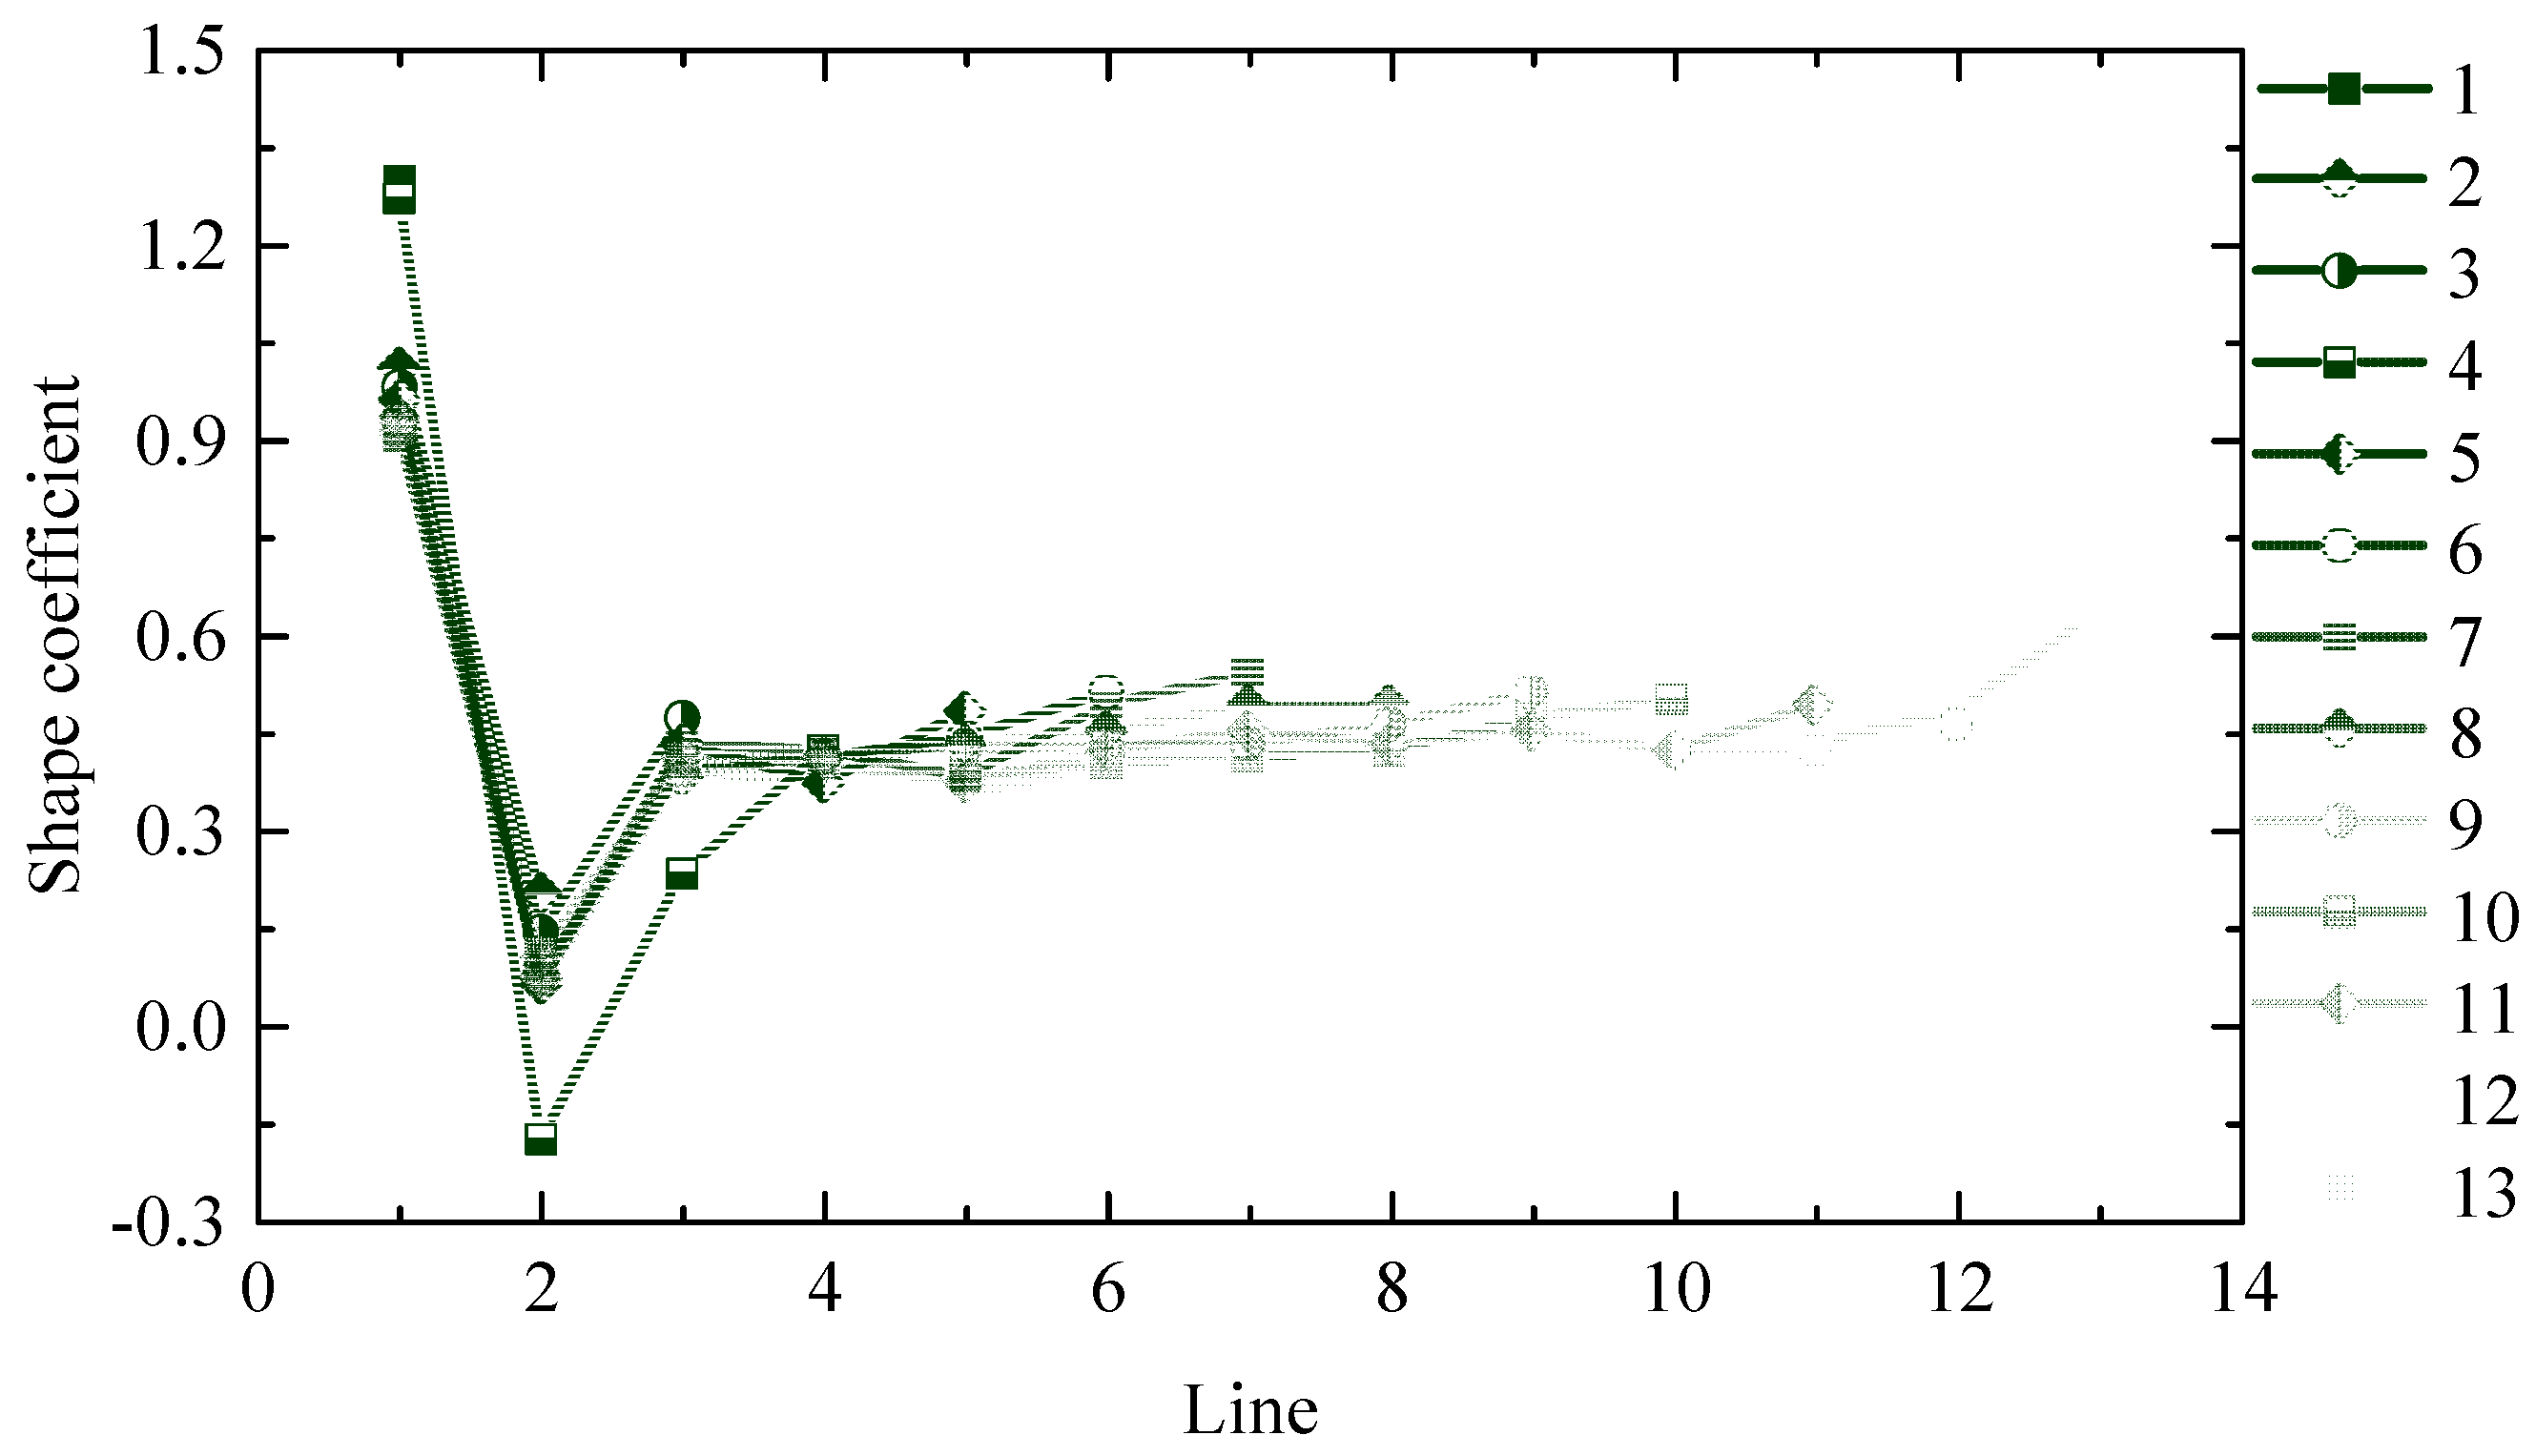
The wind load shape coefficient variation of each module in the one-column and multi-line PV array models (lines 1 to 13) is shown in Figure 7. Under a 0° wind direction angle and without occlusion, the PV arrays could be roughly divided into edge zones and stable zones. The first line is the edge zone. The wind load shape coefficient of the first-line panel modules ranged from 0.9 to 0.95, with a design recommendation of 0.95. The second line would experience sudden changes. Affected by the shielding effect of the first-line panel modules, the wind load shape coefficient always dropped sharply to a very low level. Considering the inherent randomness of actual working conditions and the necessity for safety redundancy, the abrupt variation in the wind load shape coefficient of the second-line panel modules was overlooked. The second line and the rear line were defined as the stable zone. The wind load shape coefficient of the panel modules ranged from 0.35 to 0.5, with a design recommendation of 0.5.
Figure 7.
Wind load shape coefficient variation of each module in the one-column and multi-line PV array models (wind velocity = 30 m/s).
4.2. Influence of Terrain Shielding on the Wind Load Shape Coefficient of PV Arrays
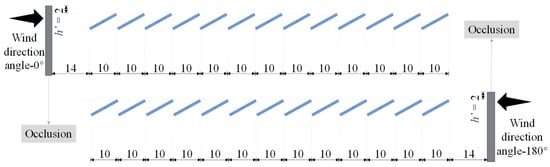
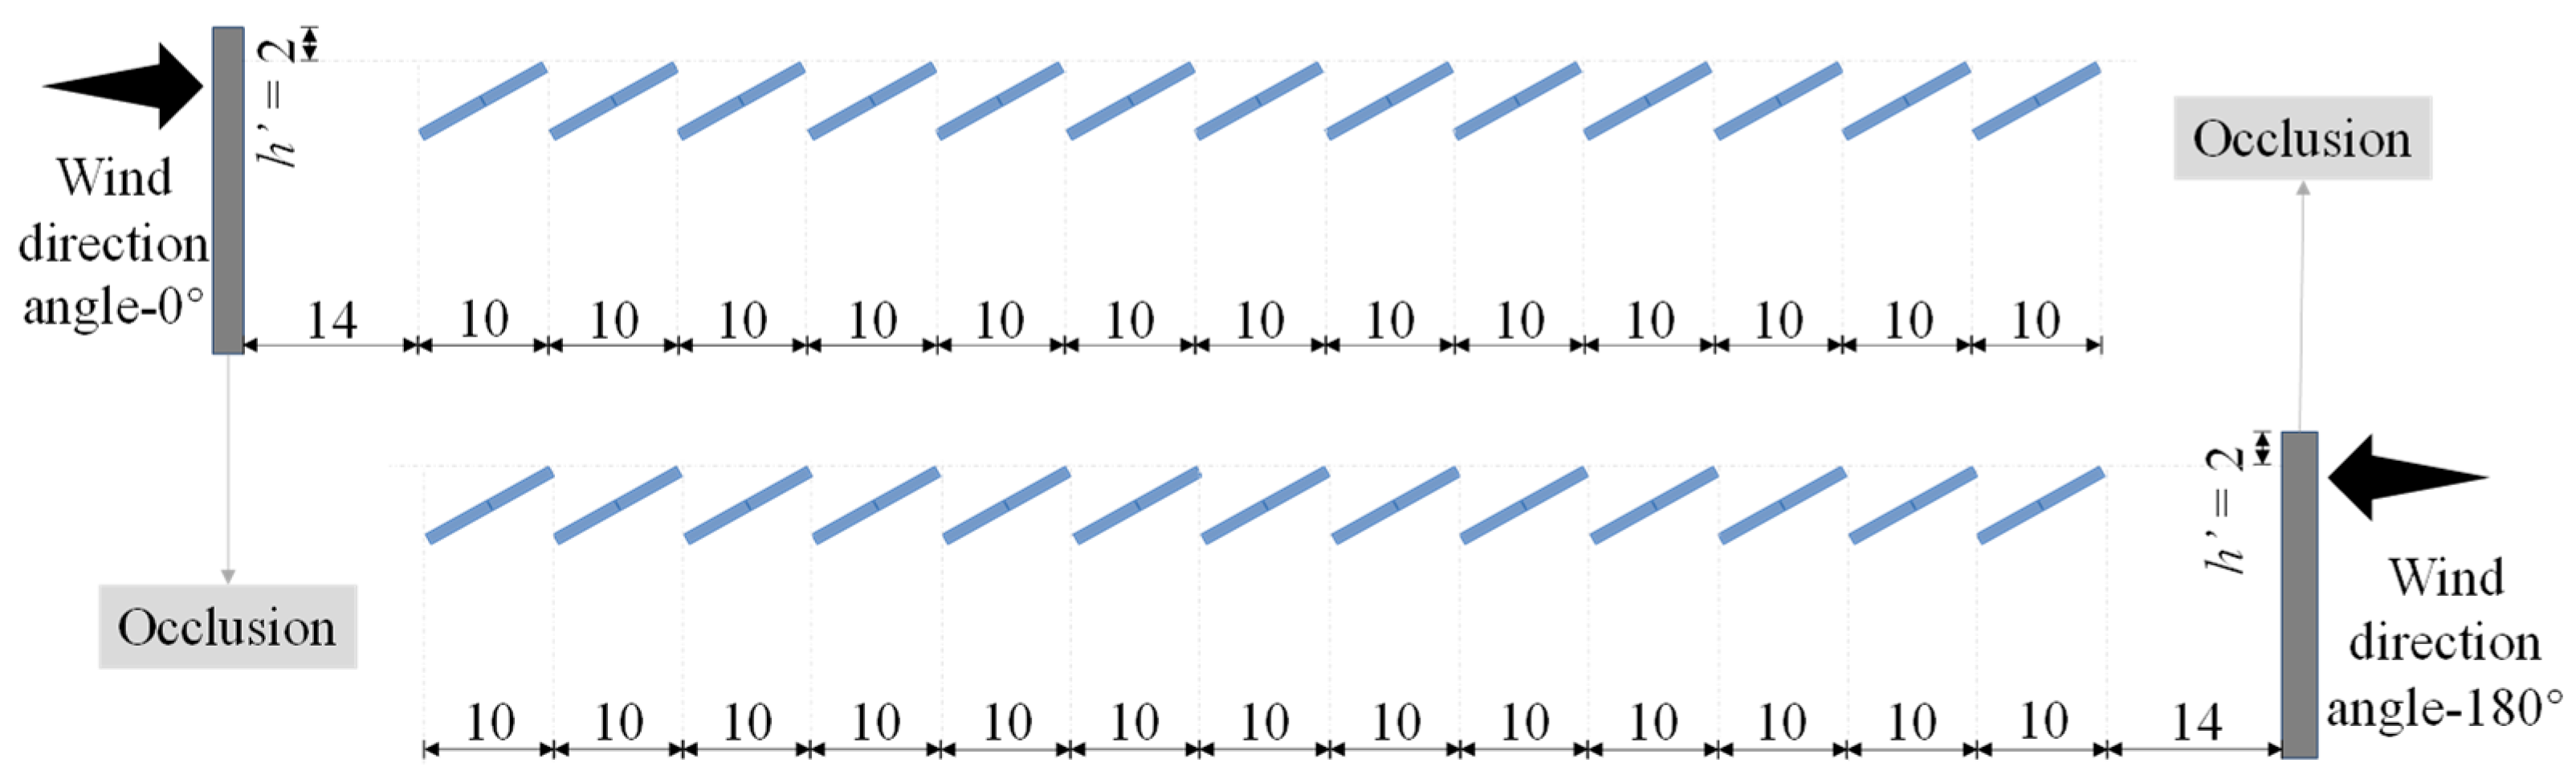
Terrain shielding is the main reason affecting the wind load shape coefficient of mega-scale PV arrays. Although wind direction is variable under actual operating conditions, the present terrain-shielding analysis focuses on the two opposite principal flow directions normal to the PV-array configuration. Accordingly, 0° and 180° were selected to represent the two opposite shielding directions. These two directions were selected specifically to examine the influence of terrain shielding from the upstream side of the array and should not be interpreted as representing all possible real-world wind directions. Thus, occlusion was established on the front and back sides of the PV panel modules, and the airflow velocity was perpendicular to the occlusion. To determine the influence of terrain shielding on different lines of PV panel modules, based on Section 4.1, a one-column and 13-line PV array model was established, with a total width of 33 m on the windward side. A rectangular occlusion was established 14 m in front of the first line of PV panel modules close to the wind direction. The occlusion was 2 m higher than the highest elevation of the PV panel modules to simulate the terrain shielding. Considering the wind direction angles of 0° and 180°, models of both occlusion directions were established, respectively (Figure 8).
Figure 8.
Unilateral occlusion model of the one-column and 13-line PV array with occlusion under different wind direction angles (Unit: m).
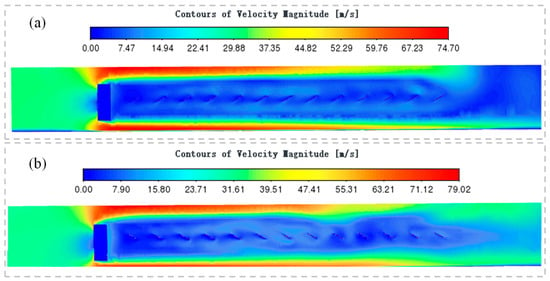
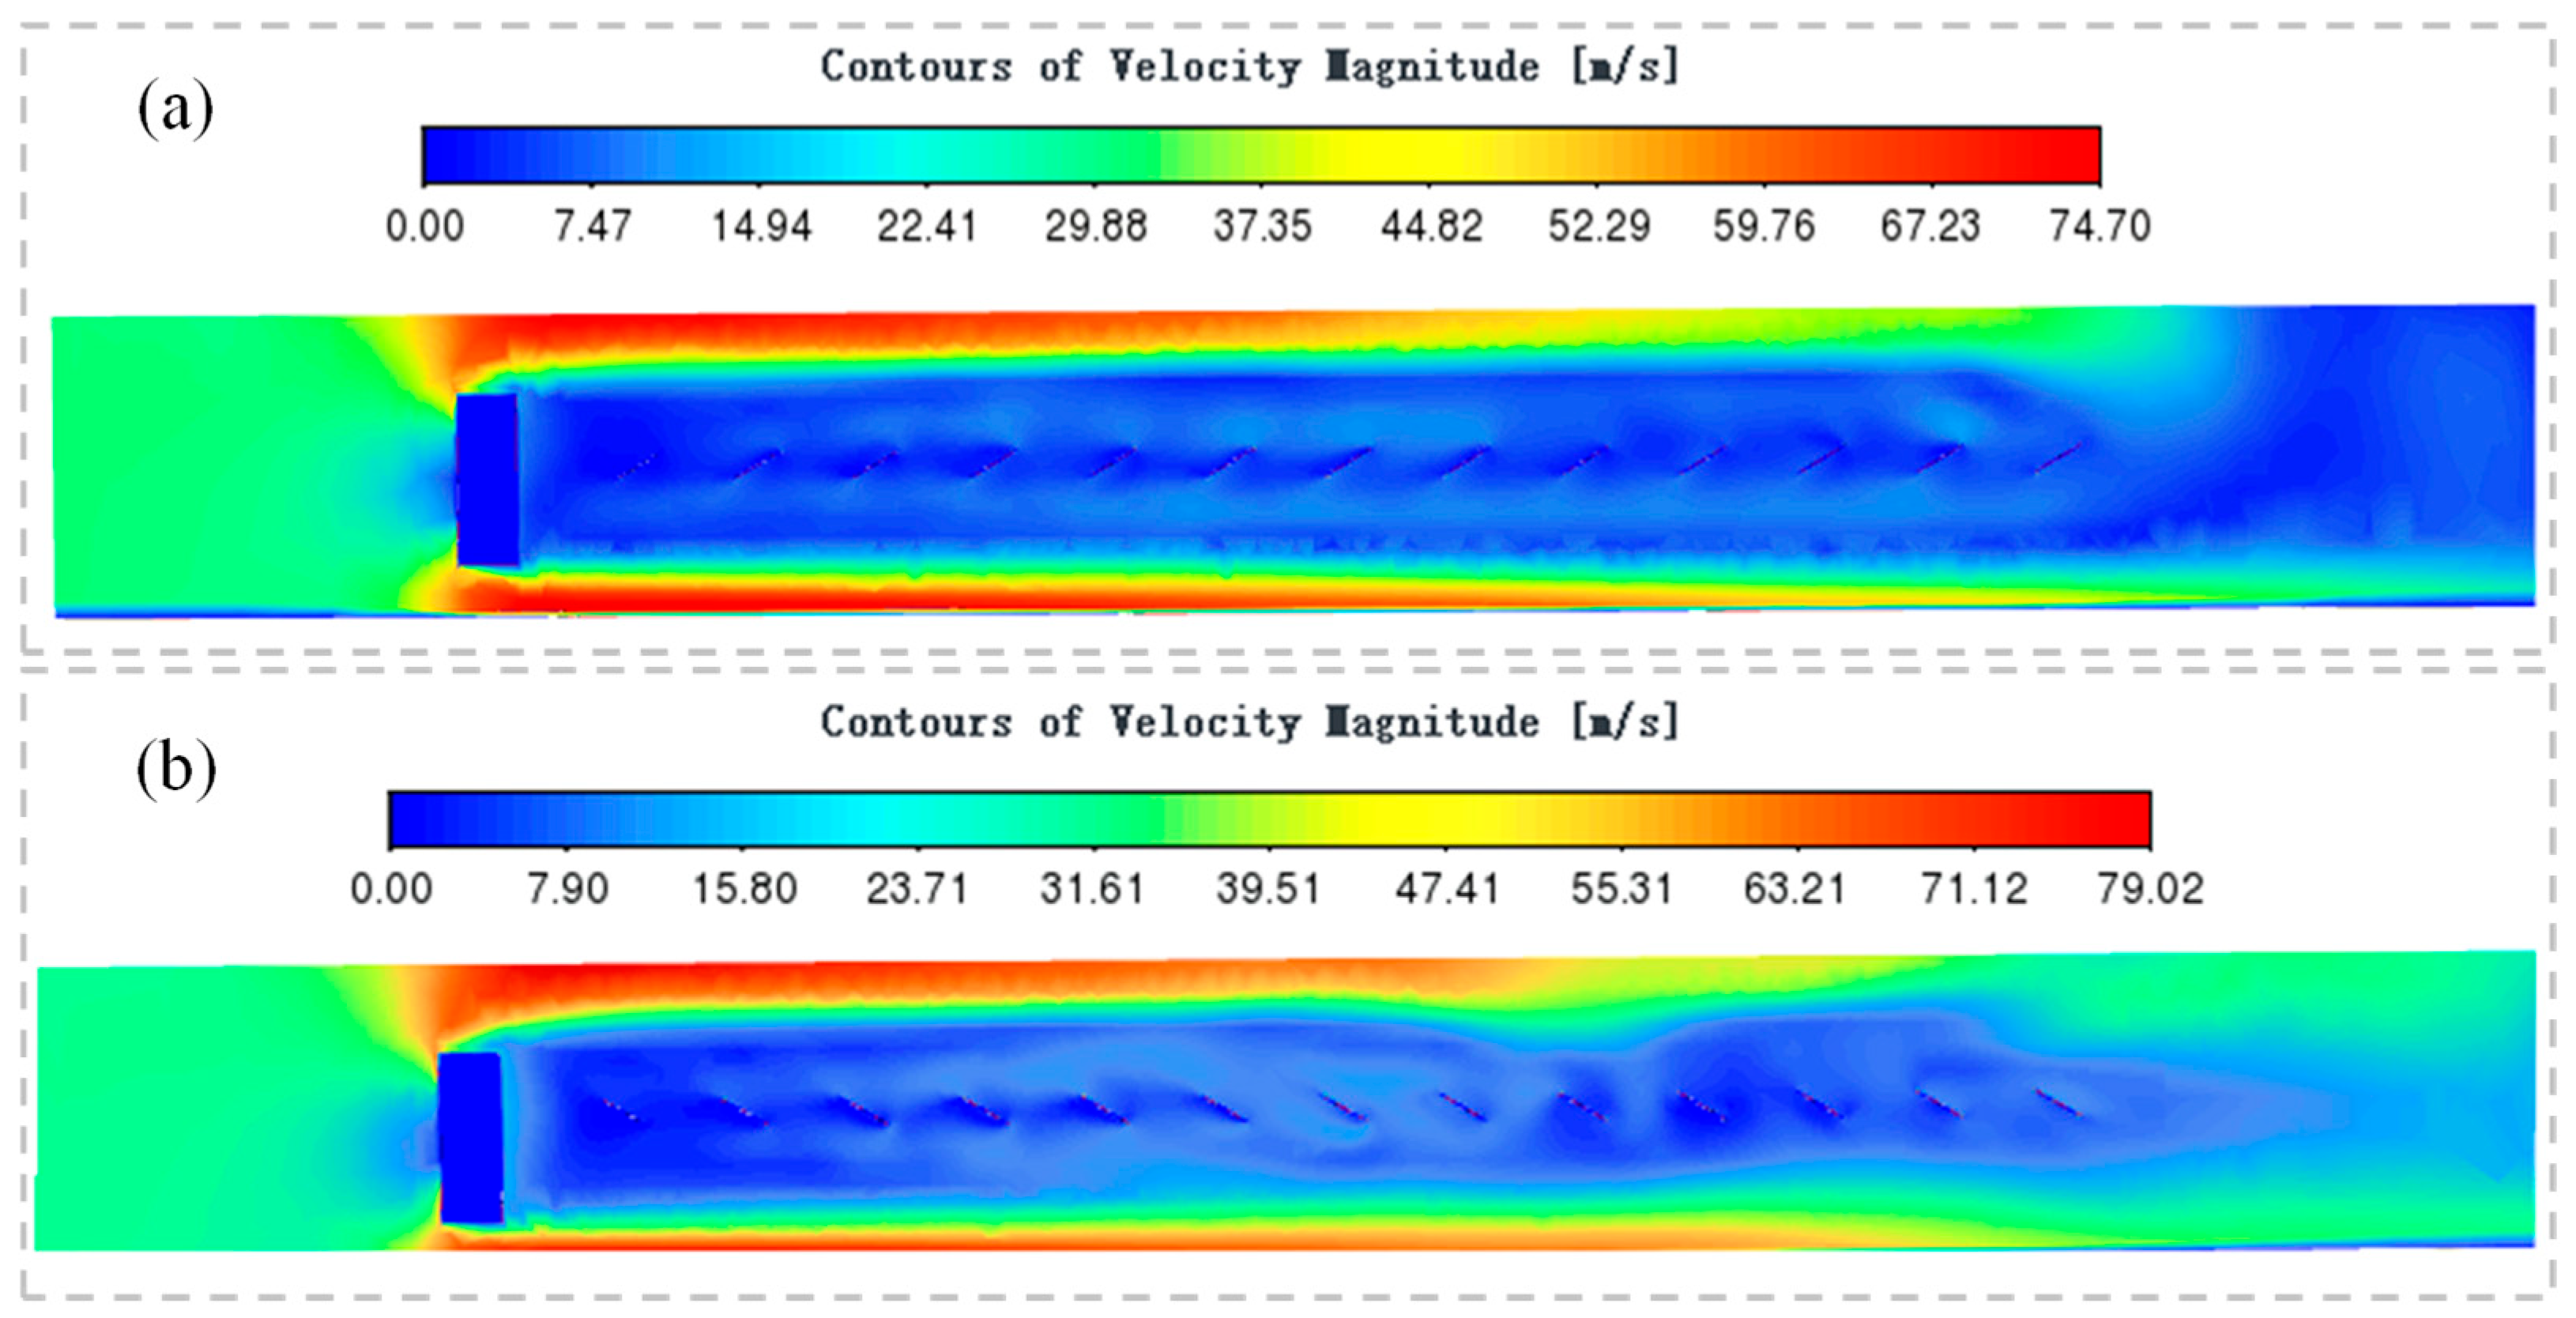
The flow field of the one-column and 13-line PV arrays with occlusion under different wind direction angles is shown in Figure 9. The research indicated that the airflow was considerably obstructed by the occlusion. The flow velocity in the area following terrain shielding experienced a significant reduction. Most of the airflow flowed above the occlusion, and only a few airflows could descend to the gap of the PV panel modules. In the gaps of the first few lines of PV panel modules close to the terrain shielding, the gas blocking effect was obvious, and the gas flow velocity in the gaps of the PV panel modules was all less than 10 m/s. Unlike in the case of no occlusion, the wind velocity on the lower side of the PV panel modules with occlusion was higher than that on the upper side, which indicated that this part of the PV panel modules was subjected to wind suction force in the opposite direction to that in the case of no occlusion.
Figure 9.
Flow field of the one-column and 13-line PV arrays with occlusion under different wind direction angles: (a) 0°; (b) 180°.
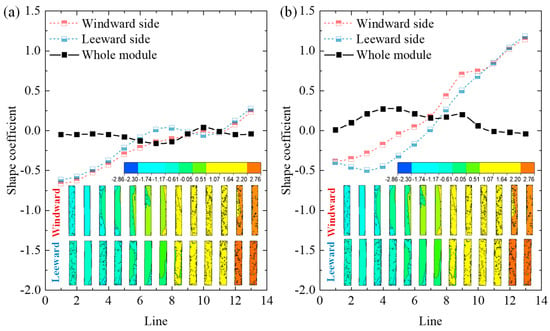
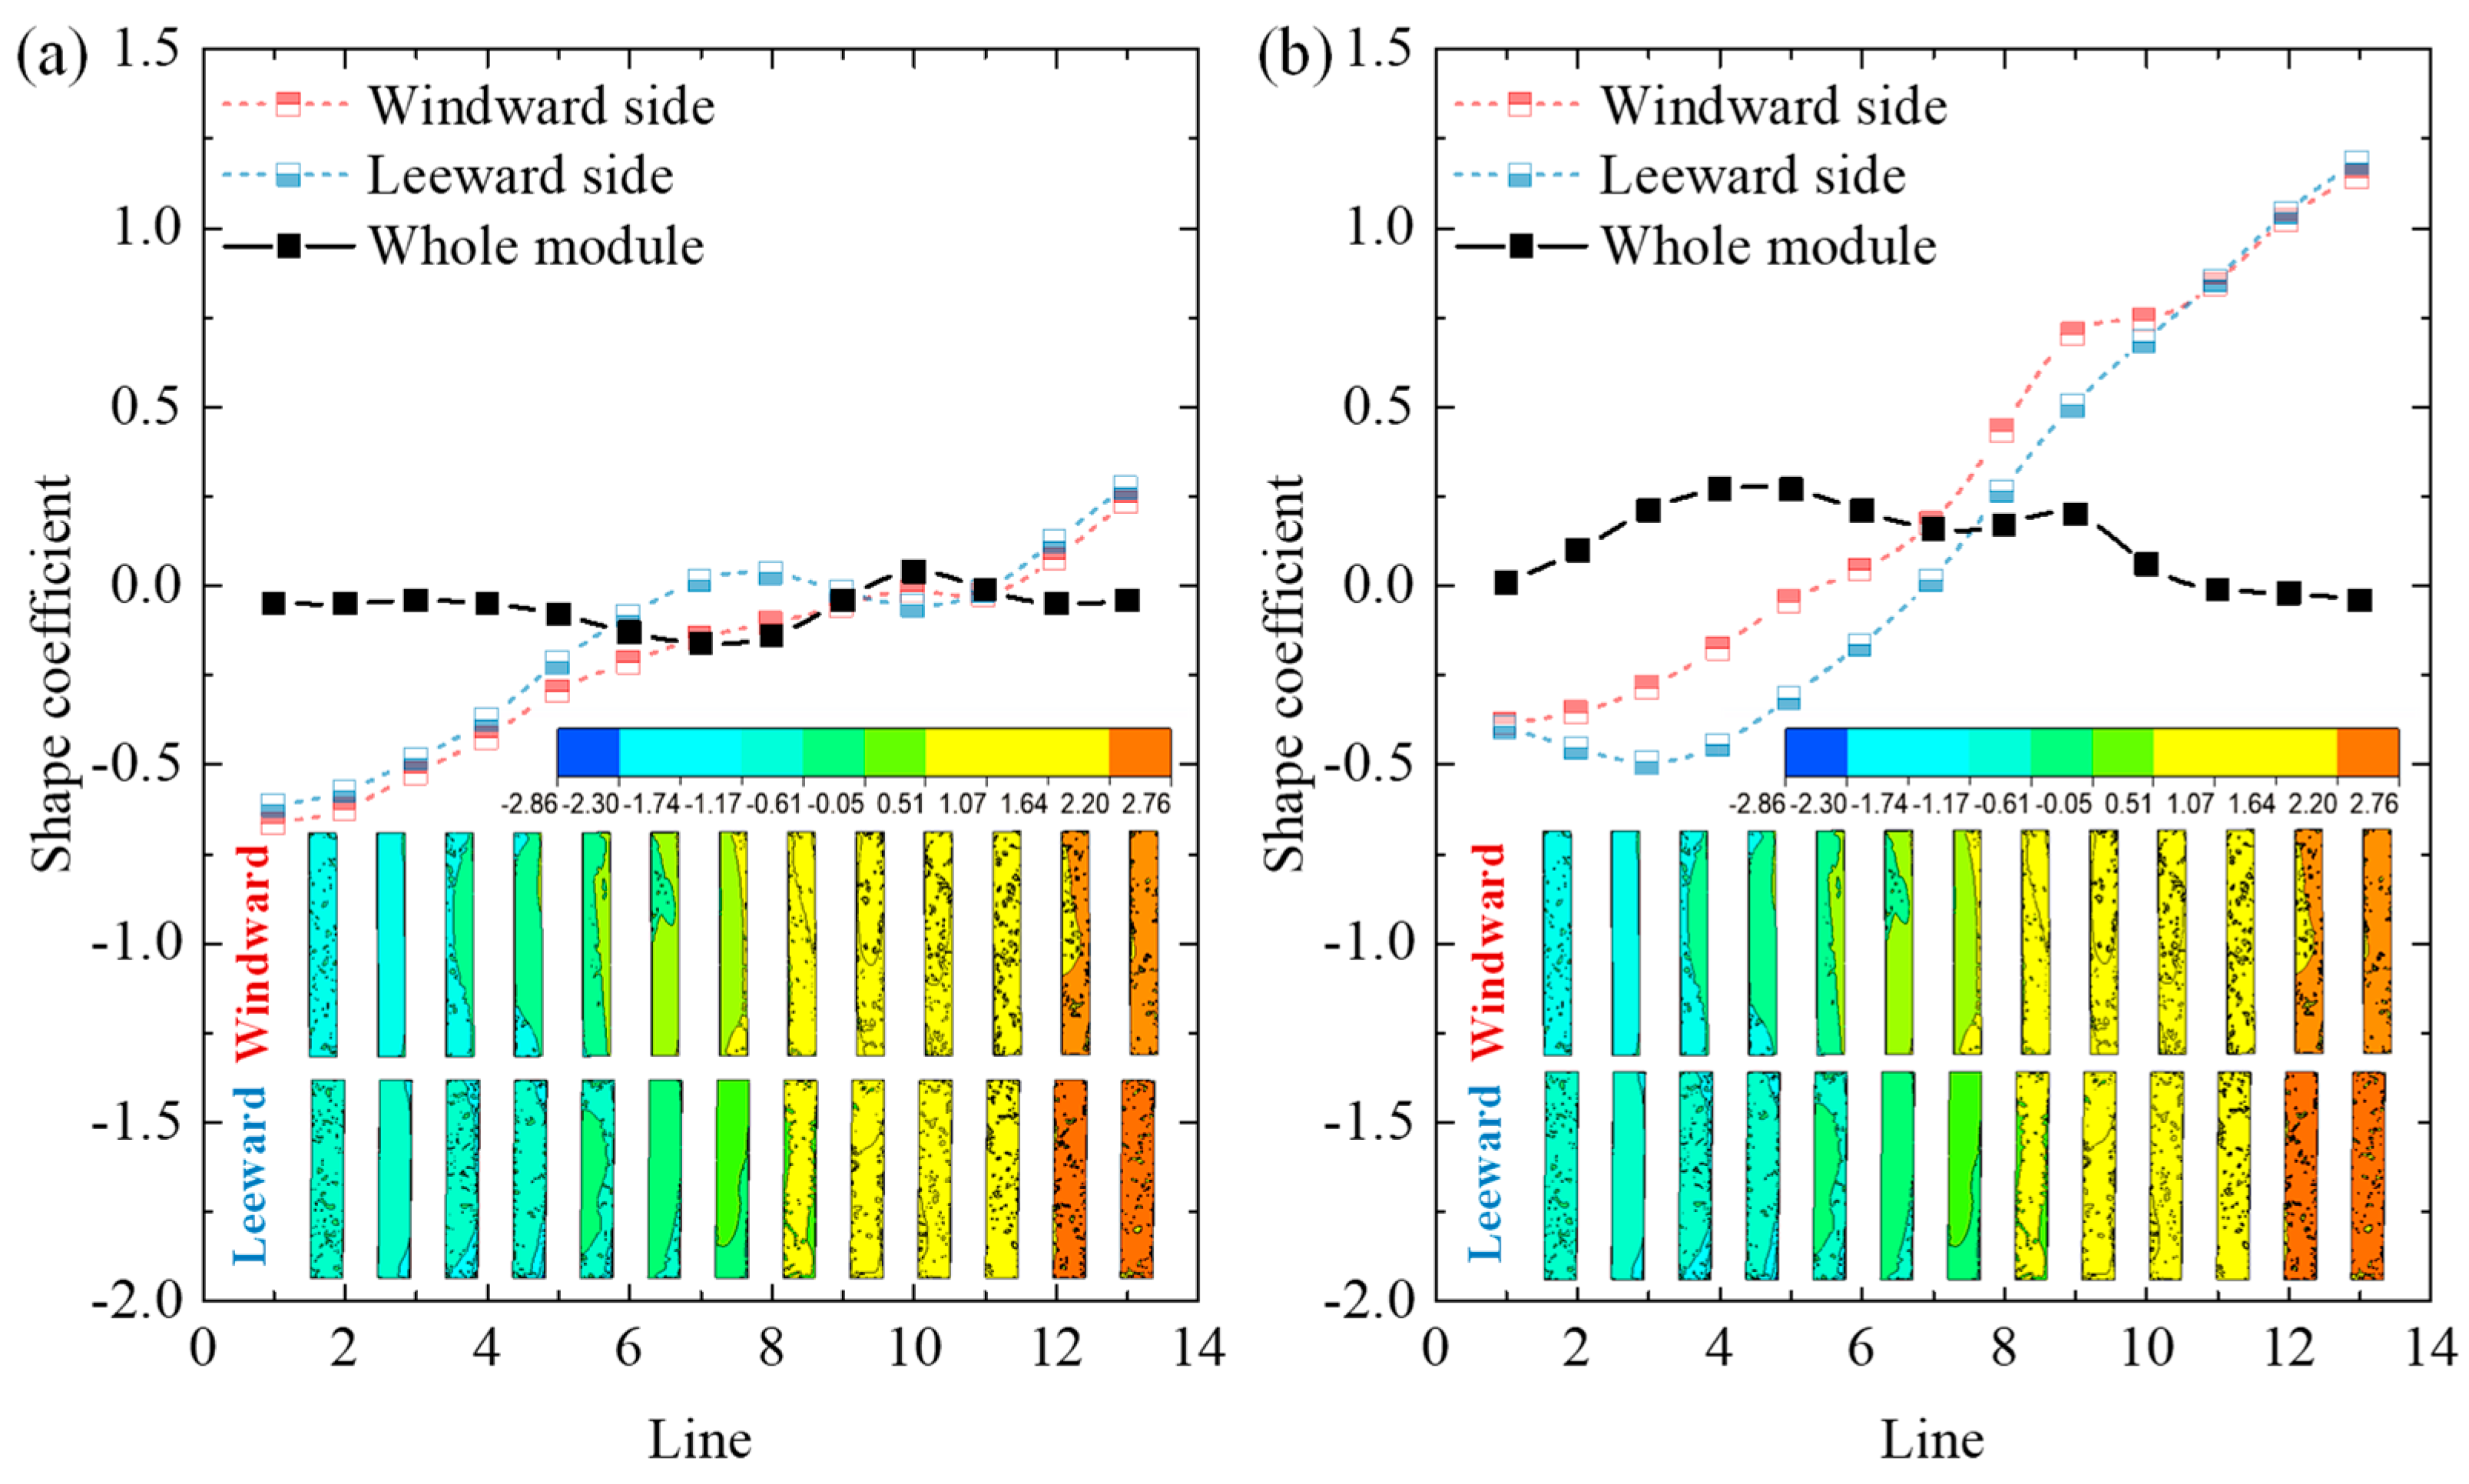
The distribution and variation of wind load shape coefficients of each module of the one-column and 13-line PV arrays with occlusion under different wind direction angles are shown in Figure 10. It was found that:
Figure 10.
The distribution and variation of wind load shape coefficients of each module of the one-column and 13-line PV arrays with occlusion under different wind direction angles: (a) 0°; (b) 180° (wind velocity = 30 m/s).
(1) The initial nine lines of PV panel modules close to the terrain shielding all experienced force conditions different from those on the windward side. Under a 0° wind direction angle, the PV panel modules that should have borne wind pressure without occlusion were subjected to wind suction, while under a 180° wind direction angle without occlusion, the PV panel modules that should have borne wind suction were subjected to wind pressure.
(2) Under different wind direction angles, both wind suction and wind pressure could act on the same surface of PV panel modules. Thus, the whole wind load shape coefficient of the modules was defined as the absolute value of the difference between the windward and the leeward sides. Combining the two conditions of 0° and 180° wind direction angles, there were one or two peaks in the wind load shape coefficient of the PV panel modules in the first nine lines, with the peaks not exceeding 0.3. Thus, it was essential to consider wind suction effects in these initial nine lines. In contrast, from lines ten to thirteen, the wind load shape coefficients of PV panel modules were comparatively small. Thus, the wind pressure effects needed to be taken into consideration. Under the combined effects of wind suction and wind pressure, the absolute values of the wind load shape coefficients of PV panel modules ranged from −0.2 to 0.3, with a relatively narrow variation range. Considering safety and convenience, the wind load shape coefficients of PV panel modules under complete occlusion could be uniformly 0.3. In addition, compared to without occlusion, the wind load shape coefficient of PV panel modules with occlusions was significantly reduced.
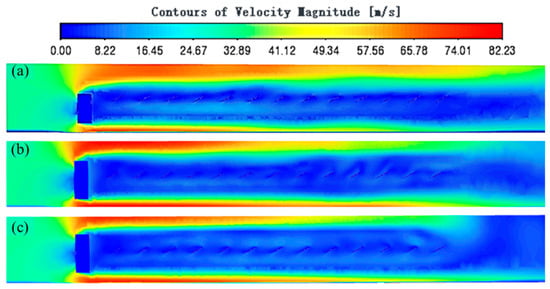
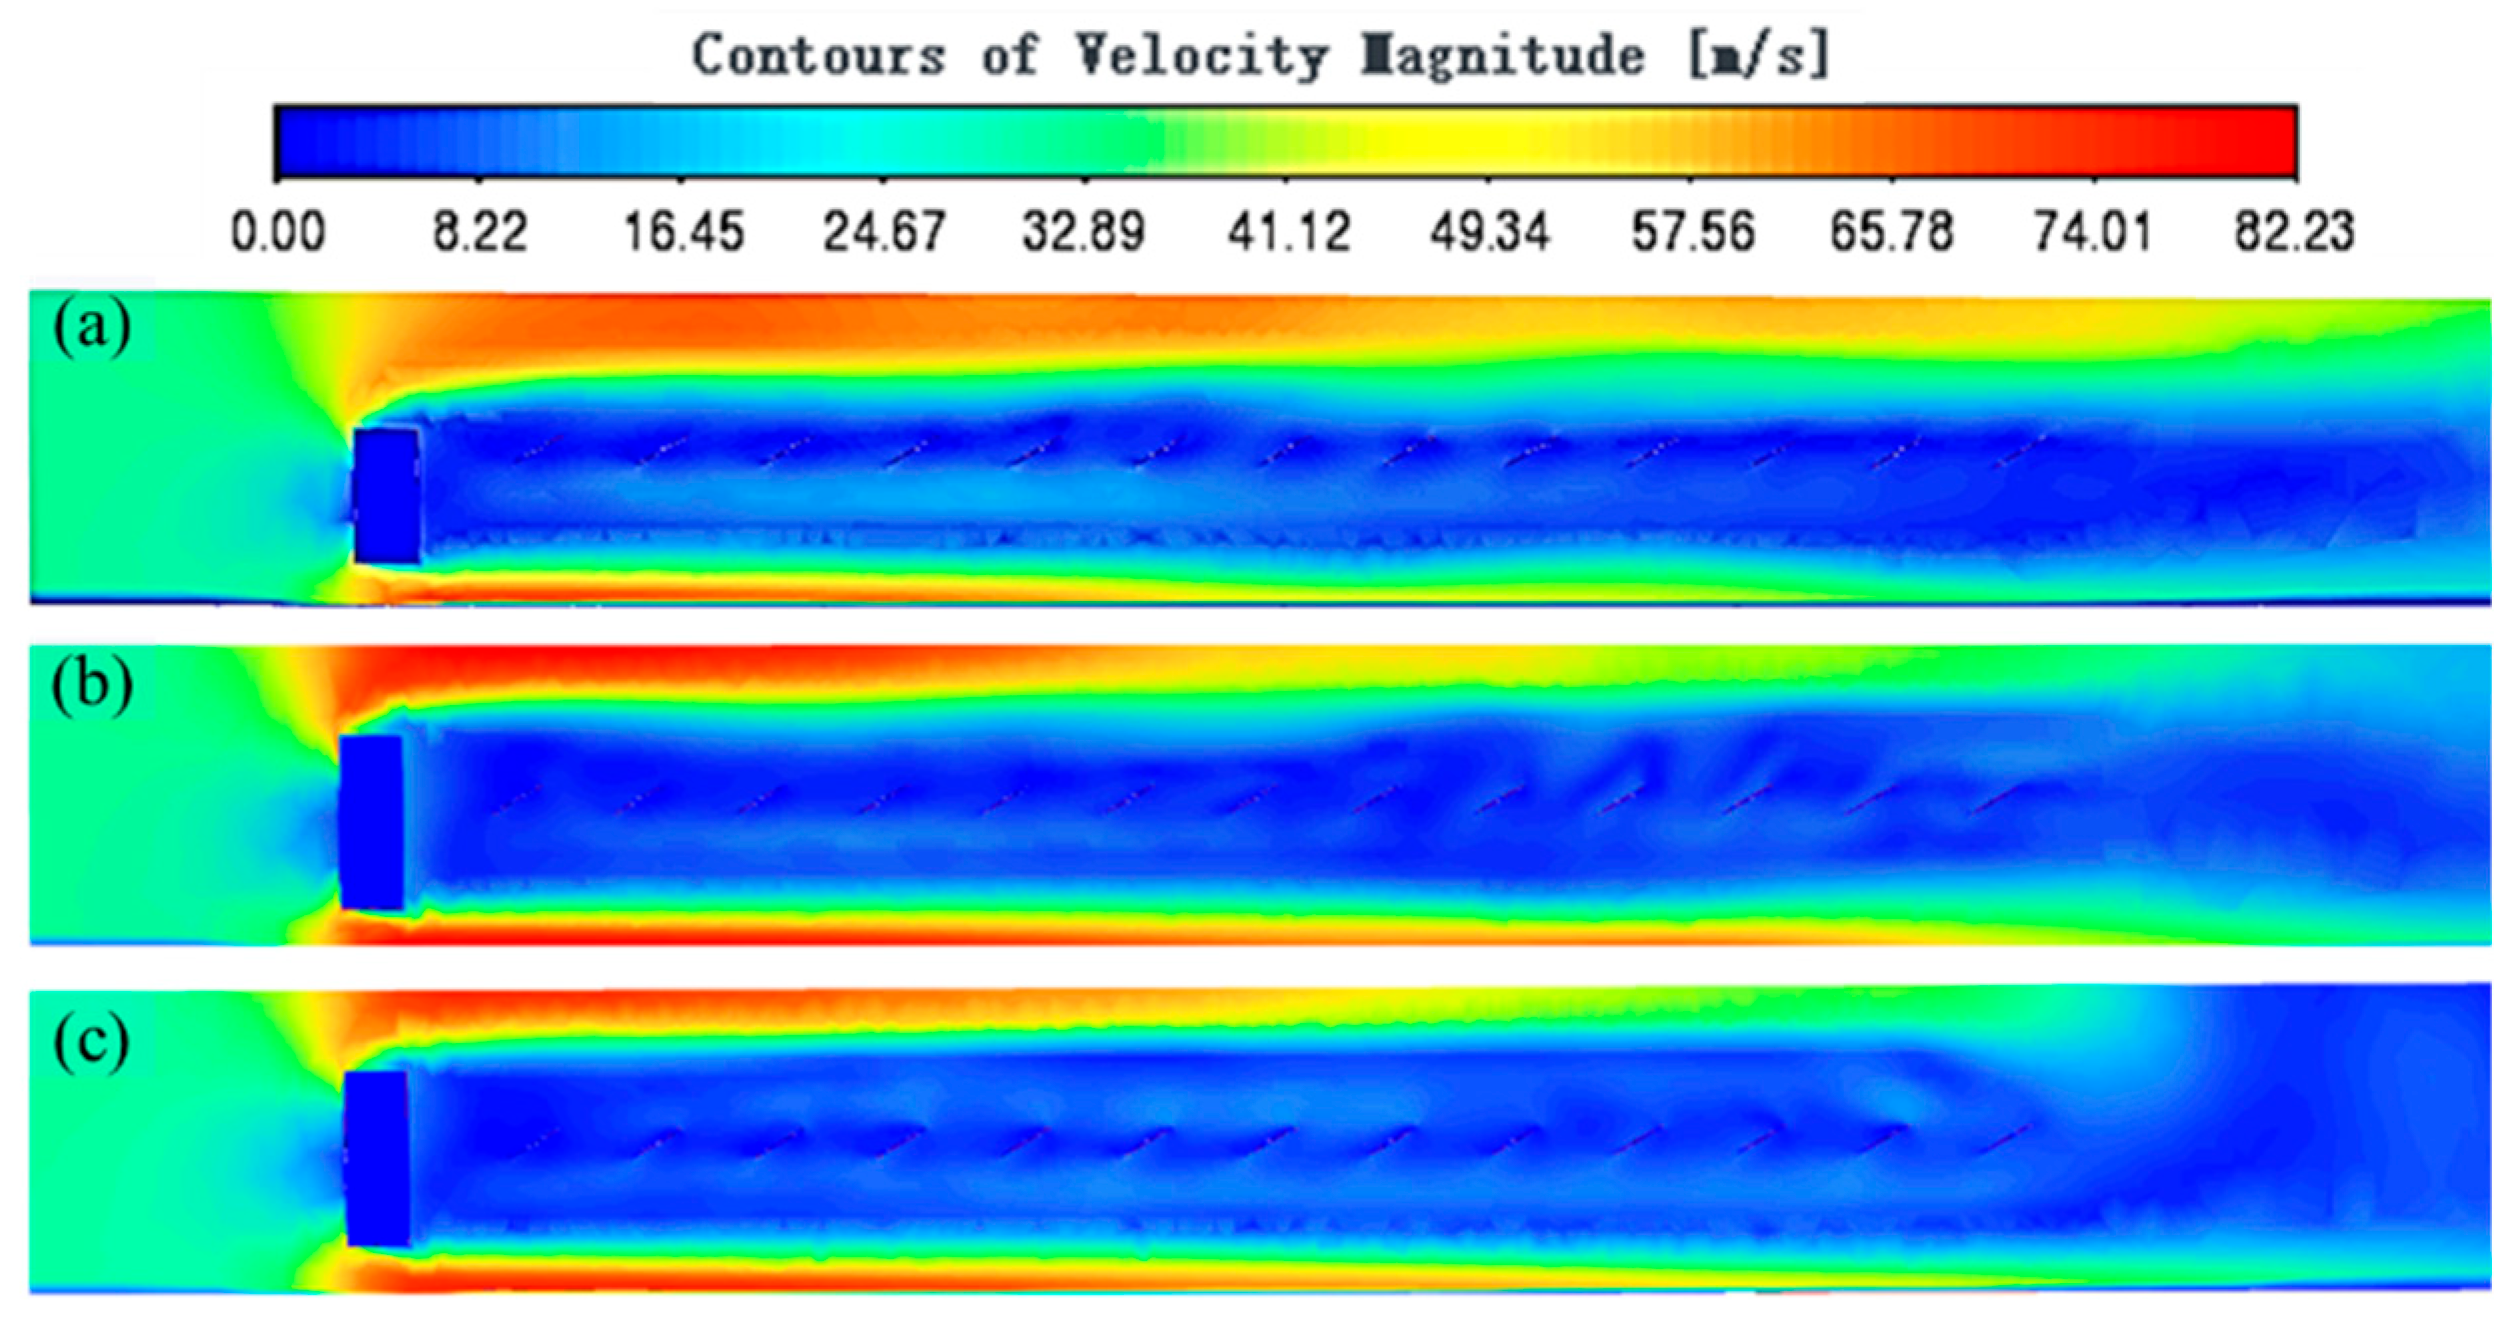
To explore the influence of occlusion height on the wind load shape coefficient of PV panel modules under complete occlusion, the shielding height differences (h’) were 0 m, 1.5 m, and 3 m, respectively, while the other parameters remained unchanged. The flow field of each module of the one-column and 13-line PV arrays under different shielding height differences is shown in Figure 11. The research revealed that the airflow rarely showed a downward trend over a long distance after occlusion. Under complete occlusion, the difference in shielding height did not affect the wind load on the rear PV panel modules.
Figure 11.
Flow field of each module of the one-column and 13-line PV arrays under different shielding height differences: (a) 0 m; (b) 1.5 m; (c) 3 m.
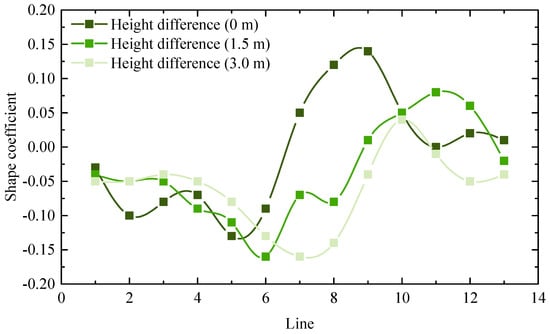
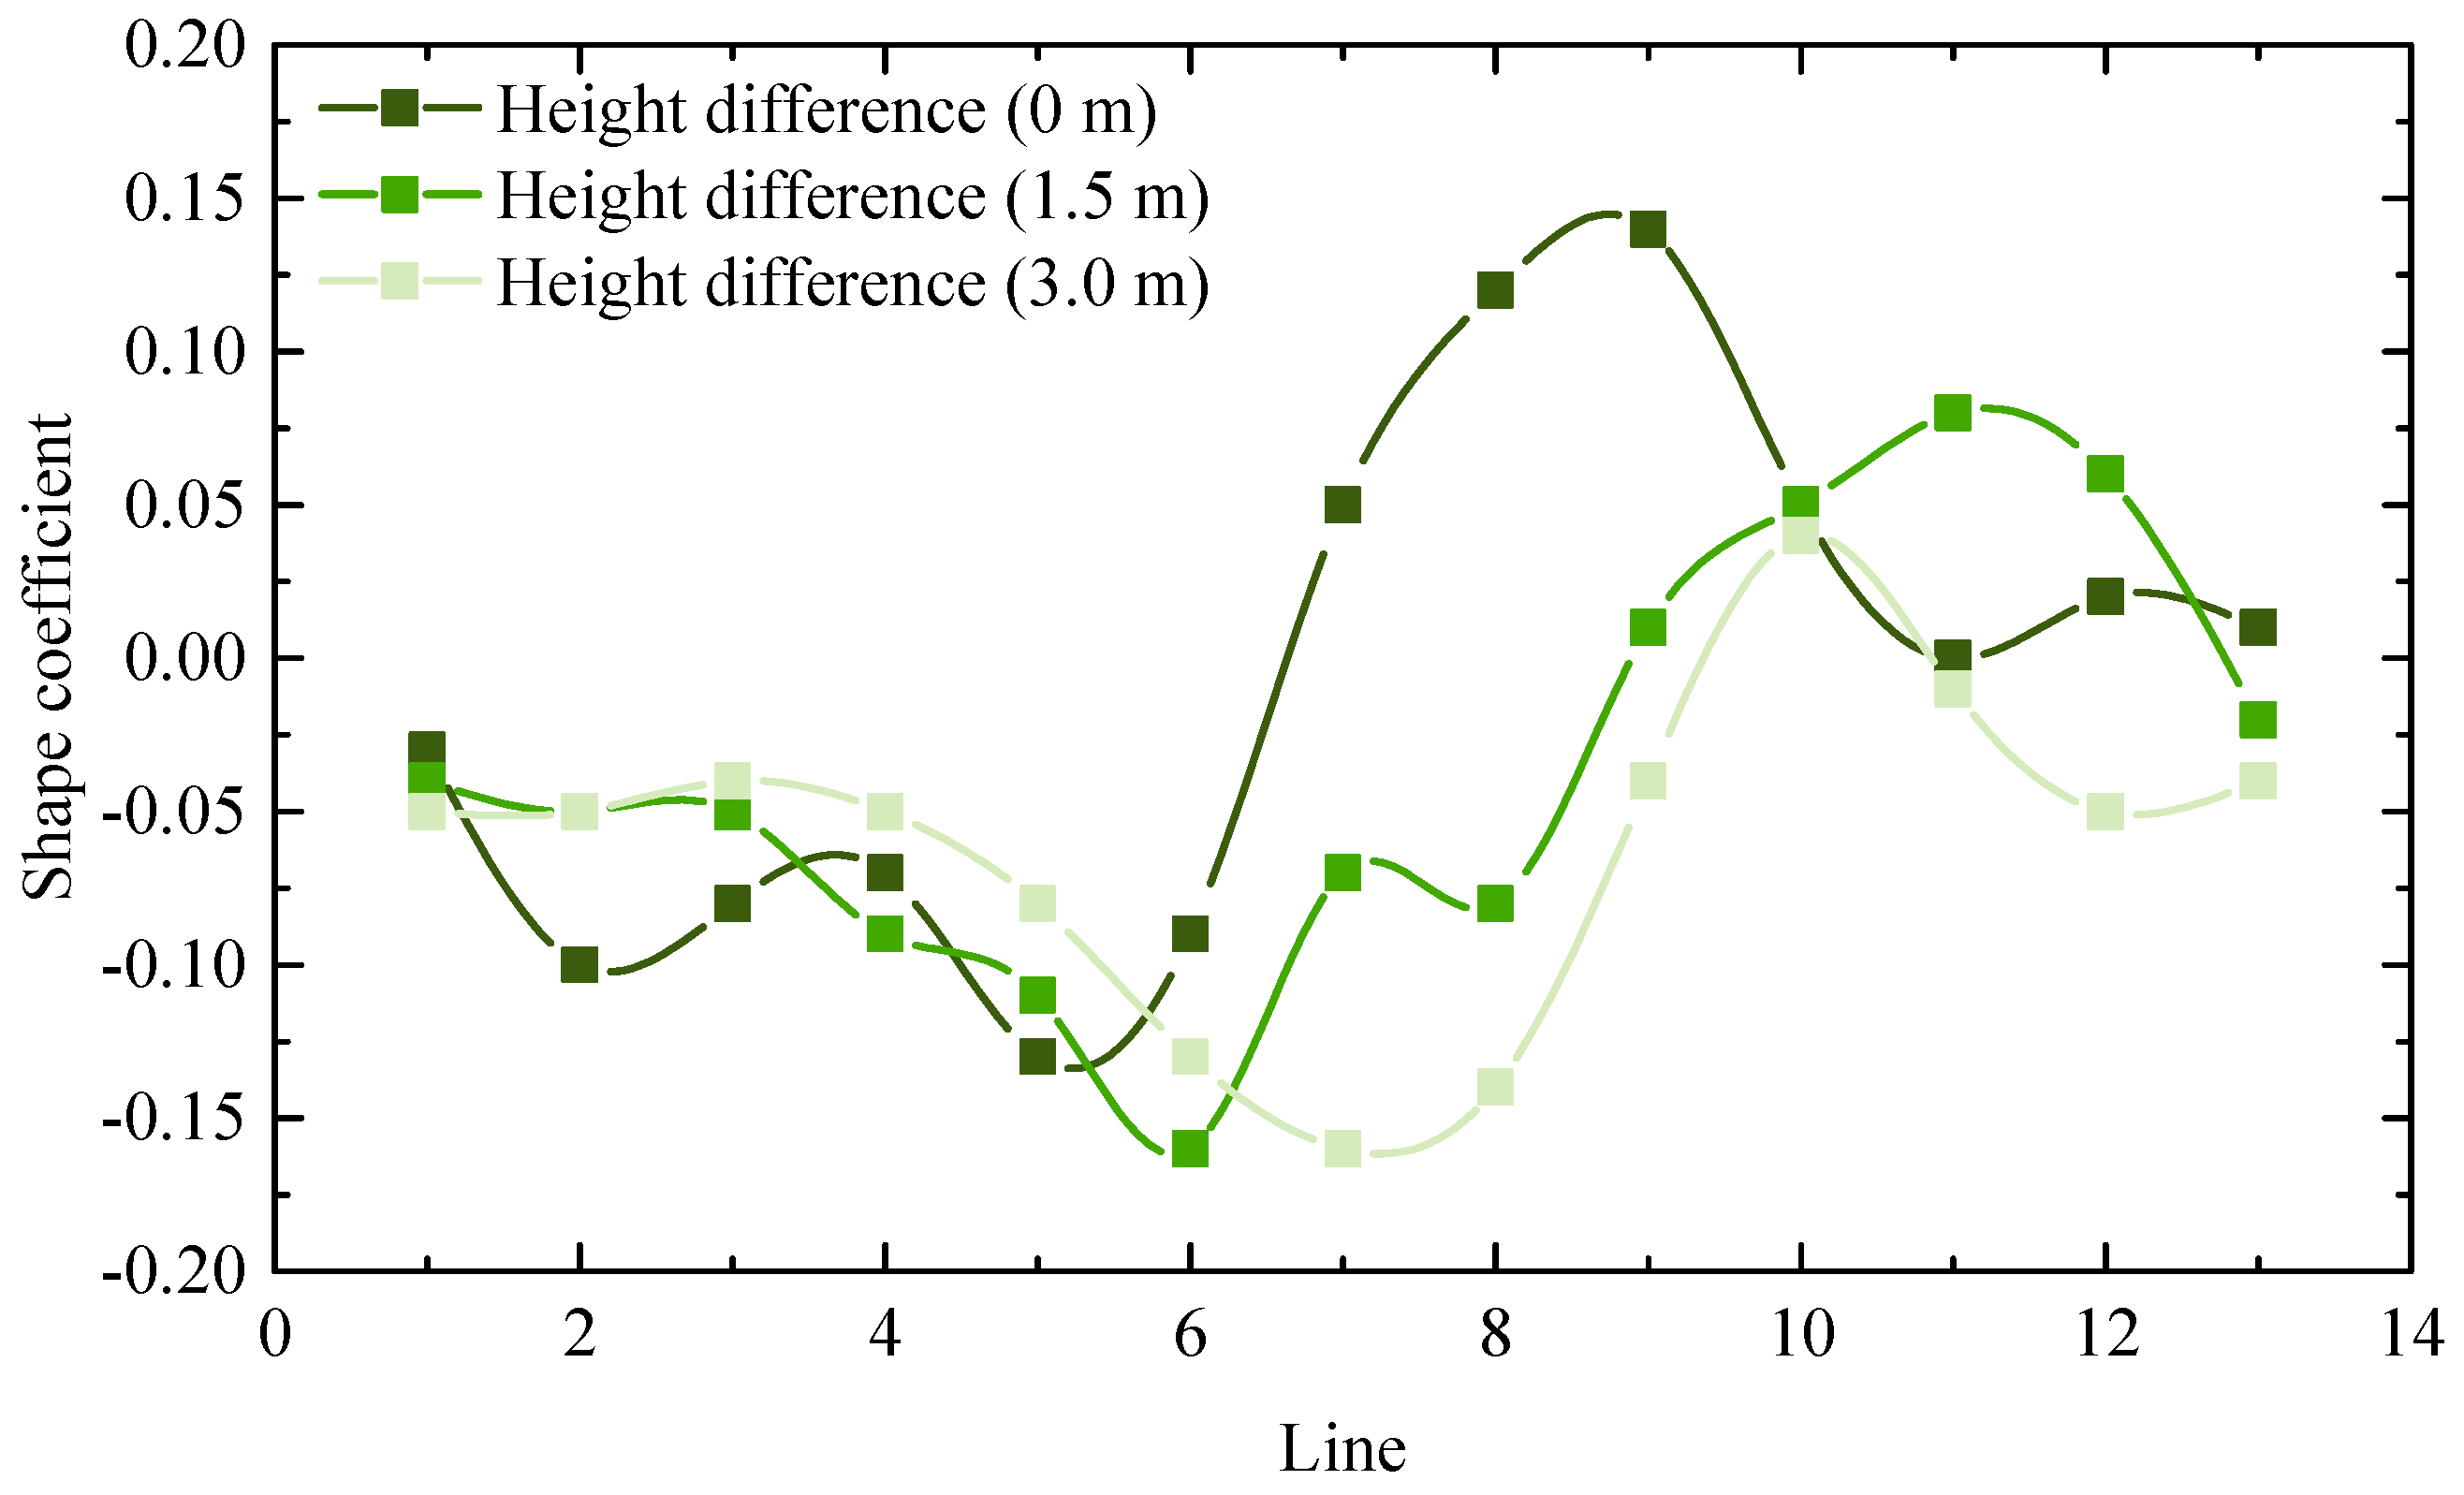
The wind load shape coefficient variation of each module of the one-column and 13-line PV arrays under different shielding height differences is shown in Figure 12. Although the wind load shape coefficients of PV panel modules still varied under different shielding height differences, the overall changing trend was consistent and fluctuated within the range of −0.16 to 0.14. The maximum absolute value of the wind load shape coefficient of the PV panel module was 0.16, which aligns with the earlier recommendation to consider a design value of 0.3. Thus, if the top of the PV panel modules was lower than the elevation of the top of the occlusion, it could be regarded as a complete occlusion. Under complete occlusion, the impact of variations in shielding height on the wind load shape coefficient of PV panel modules could be considered negligible. Consequently, a uniform wind load shape coefficient value of 0.3 might be adopted across all instances.
Figure 12.
Wind load shape coefficient variation of each module of the one-column and 13-line PV arrays under different shielding height differences (wind velocity = 30 m/s).
4.3. Influence of Wind Direction Angle on the Wind Load Shape Coefficient of PV Arrays
To clarify the influence of wind direction under conditions without terrain shielding, additional wind direction angles were considered beyond the two principal directions used in the terrain-shielding analysis. Specifically, wind direction angles of 15° and 30° were investigated, and the variation of the wind load shape coefficient was further examined over the range from 0° to 180°.
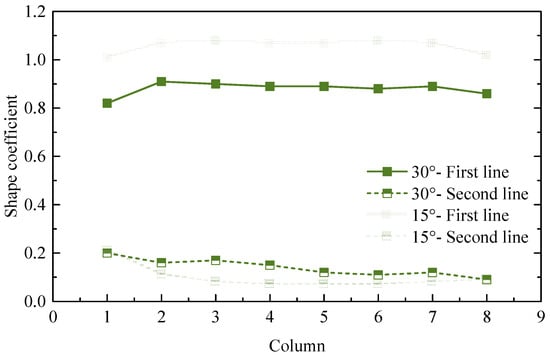
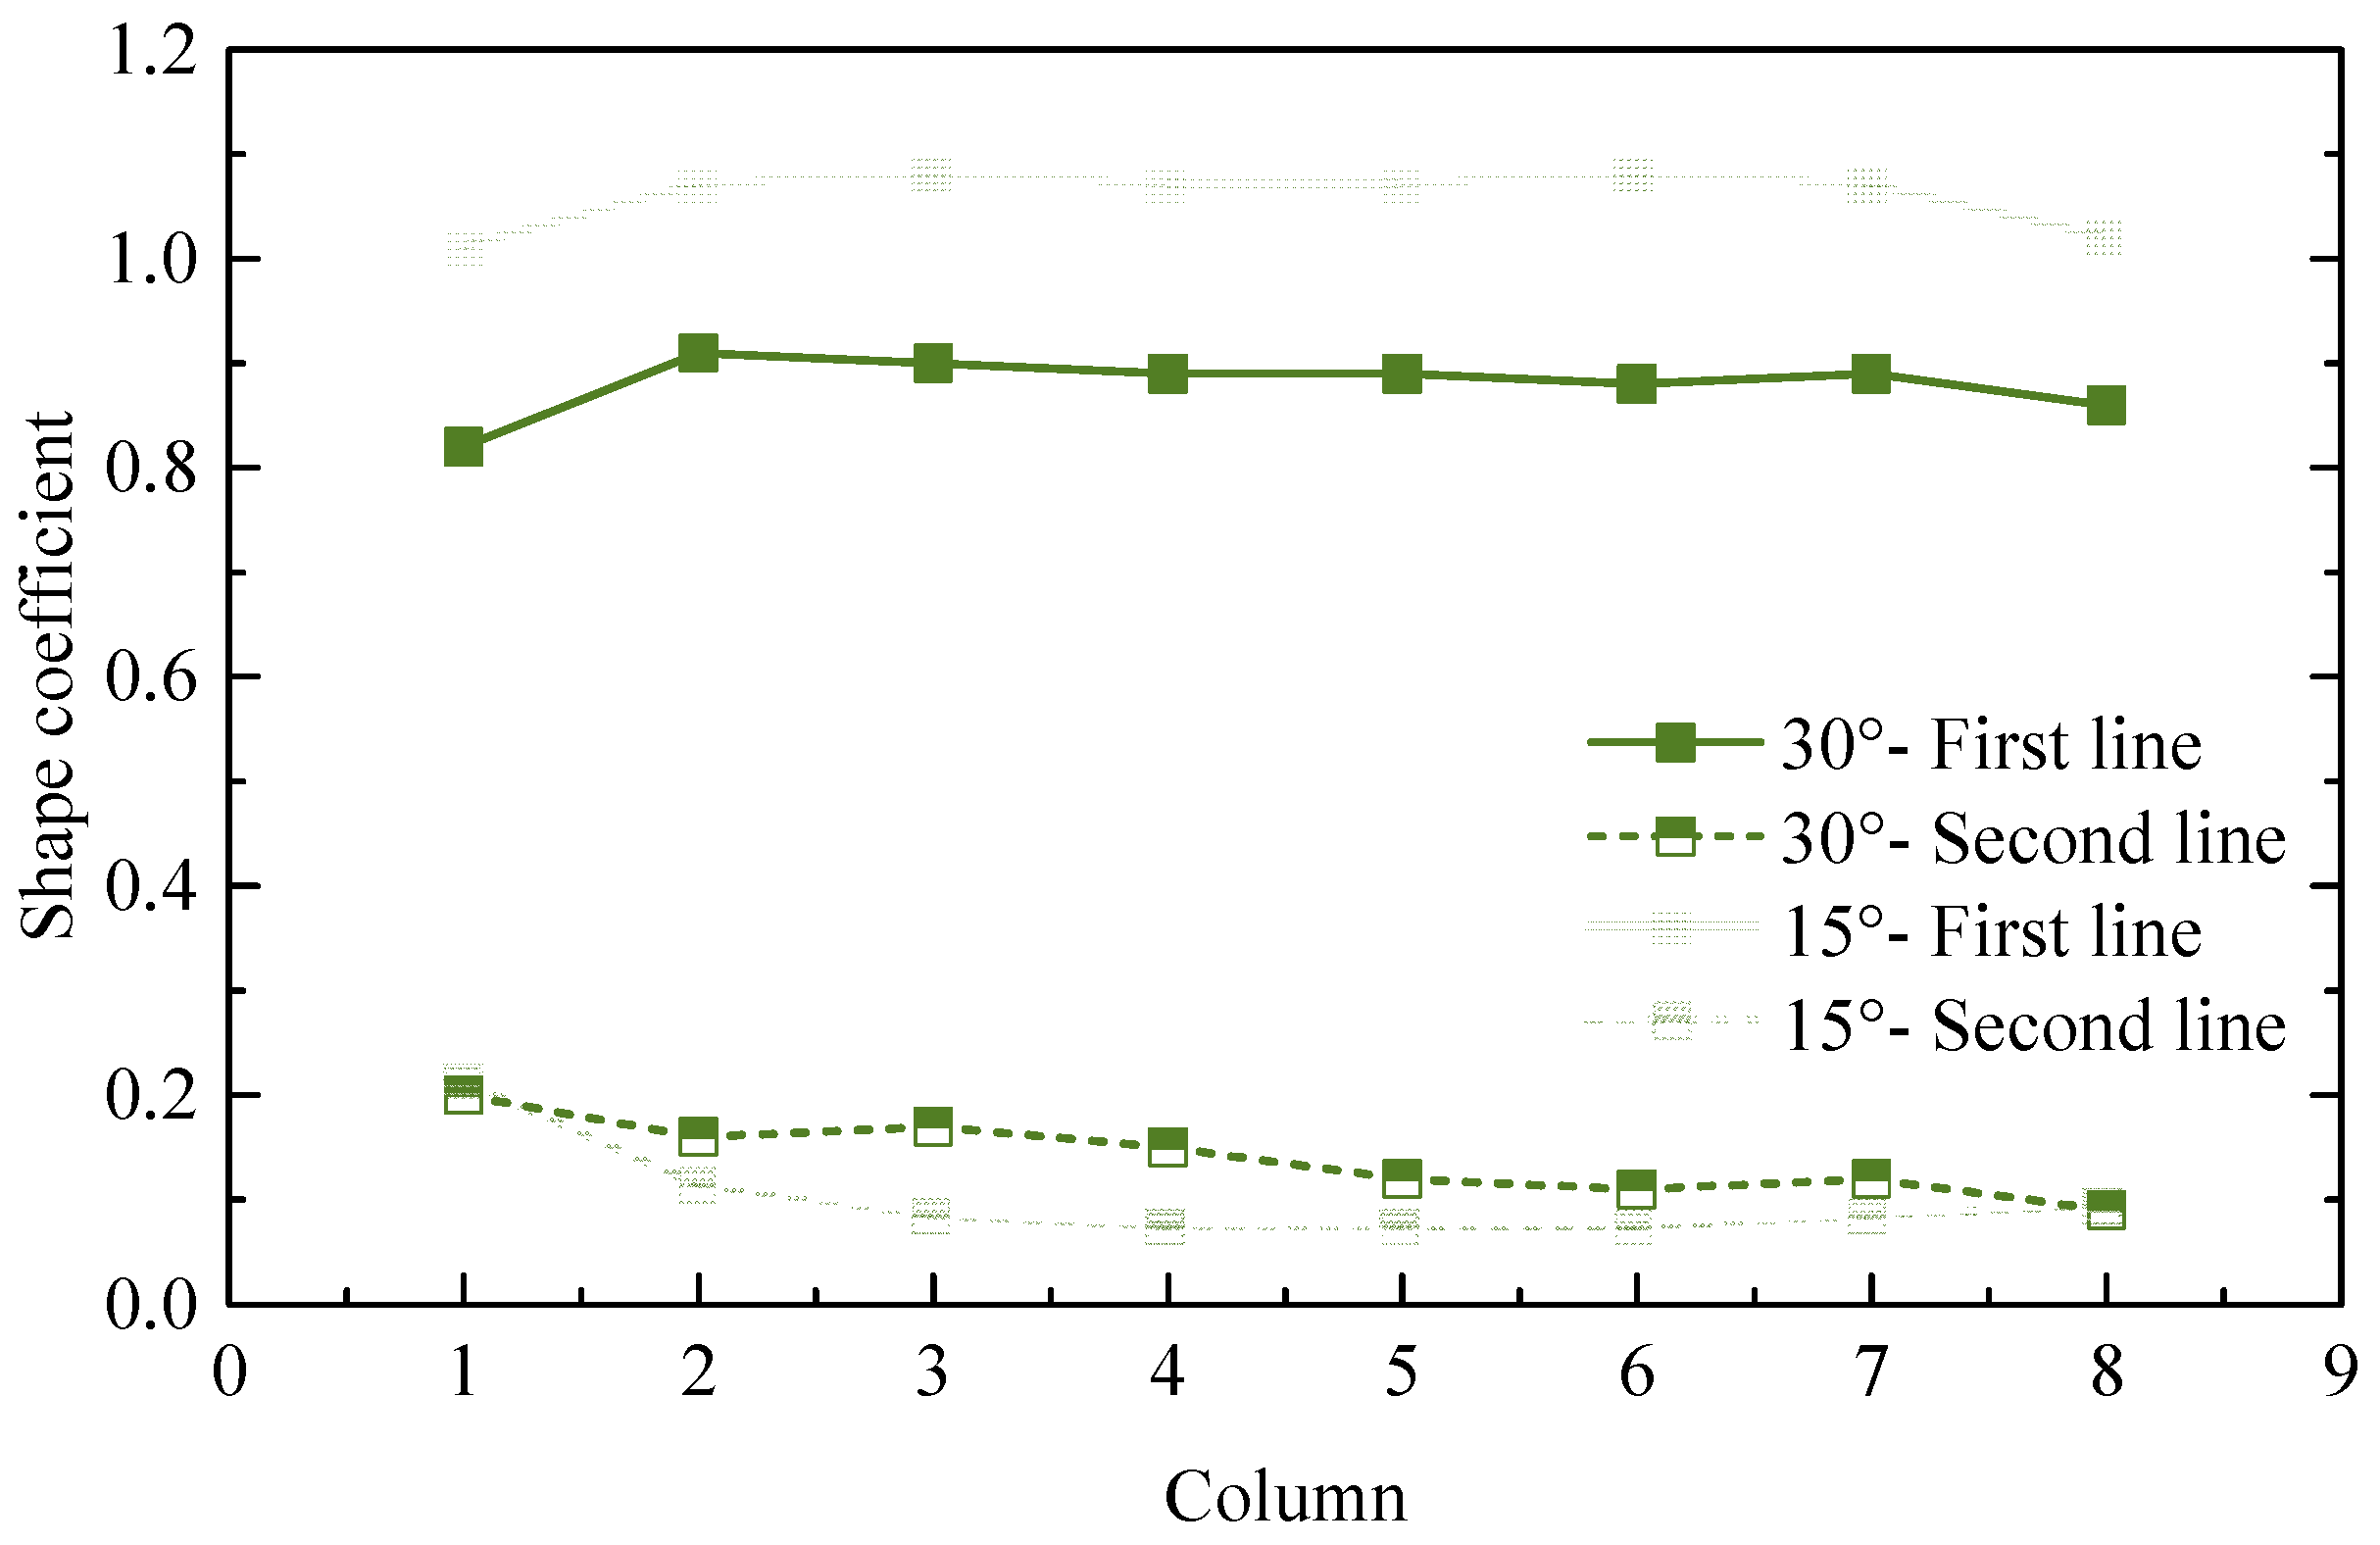
The wind direction angle affects the occlusion area of the PV panel modules and is another major reason influencing the wind load shape coefficient of the mega-scale PV arrays. To investigate the wind load shape coefficient variation of PV panel modules in the same line but different columns under different wind direction angles, a two-line and eight-column PV array model was first established under the wind direction angles of 15° and 30°. The wind load shape coefficient variation of each module of the two-line and eight-column PV arrays is shown in Figure 13. The research indicated that the PV panel modules in the first line facing the wind were subject to the greatest wind pressure at a wind direction angle of 15°, and the wind load shape coefficient ranged from 1.0 to 1.1. The wind load shape coefficient of the PV panel modules in the first column of the second line was more than that of the other columns. The wind load shape coefficient of the first column was 1.1 times that of the other columns at a wind direction angle of 15°, and it was 1.7 times at a wind direction angle of 30°. Except for the PV panel modules in the first column, the wind load shape coefficients of different columns of PV panel modules in the same line at the same wind direction angle were almost the same. It was advisable to adopt a standard value for the wind load shape coefficient of PV panel modules indicated in the remaining columns of the first line, with a recommended design value of 1.1. Furthermore, a ten-line and one-column PV array model was established to investigate the wind load shape coefficient variation of the PV panel modules positioned in the column aligned with different wind direction angles. Additional discrete wind directions, such as 45° and 90°, were not separately simulated in the present study. A more comprehensive angular parametric analysis is considered an important topic for future research.
Figure 13.
Wind load shape coefficient variation of each module of the two-line and eight-column PV arrays (wind velocity = 30 m/s).
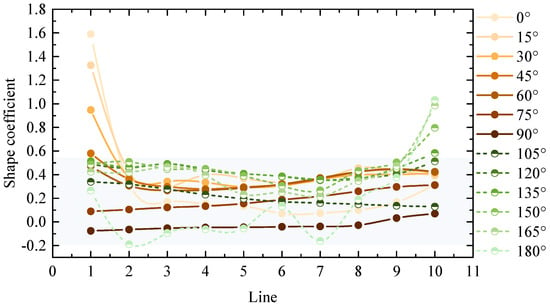
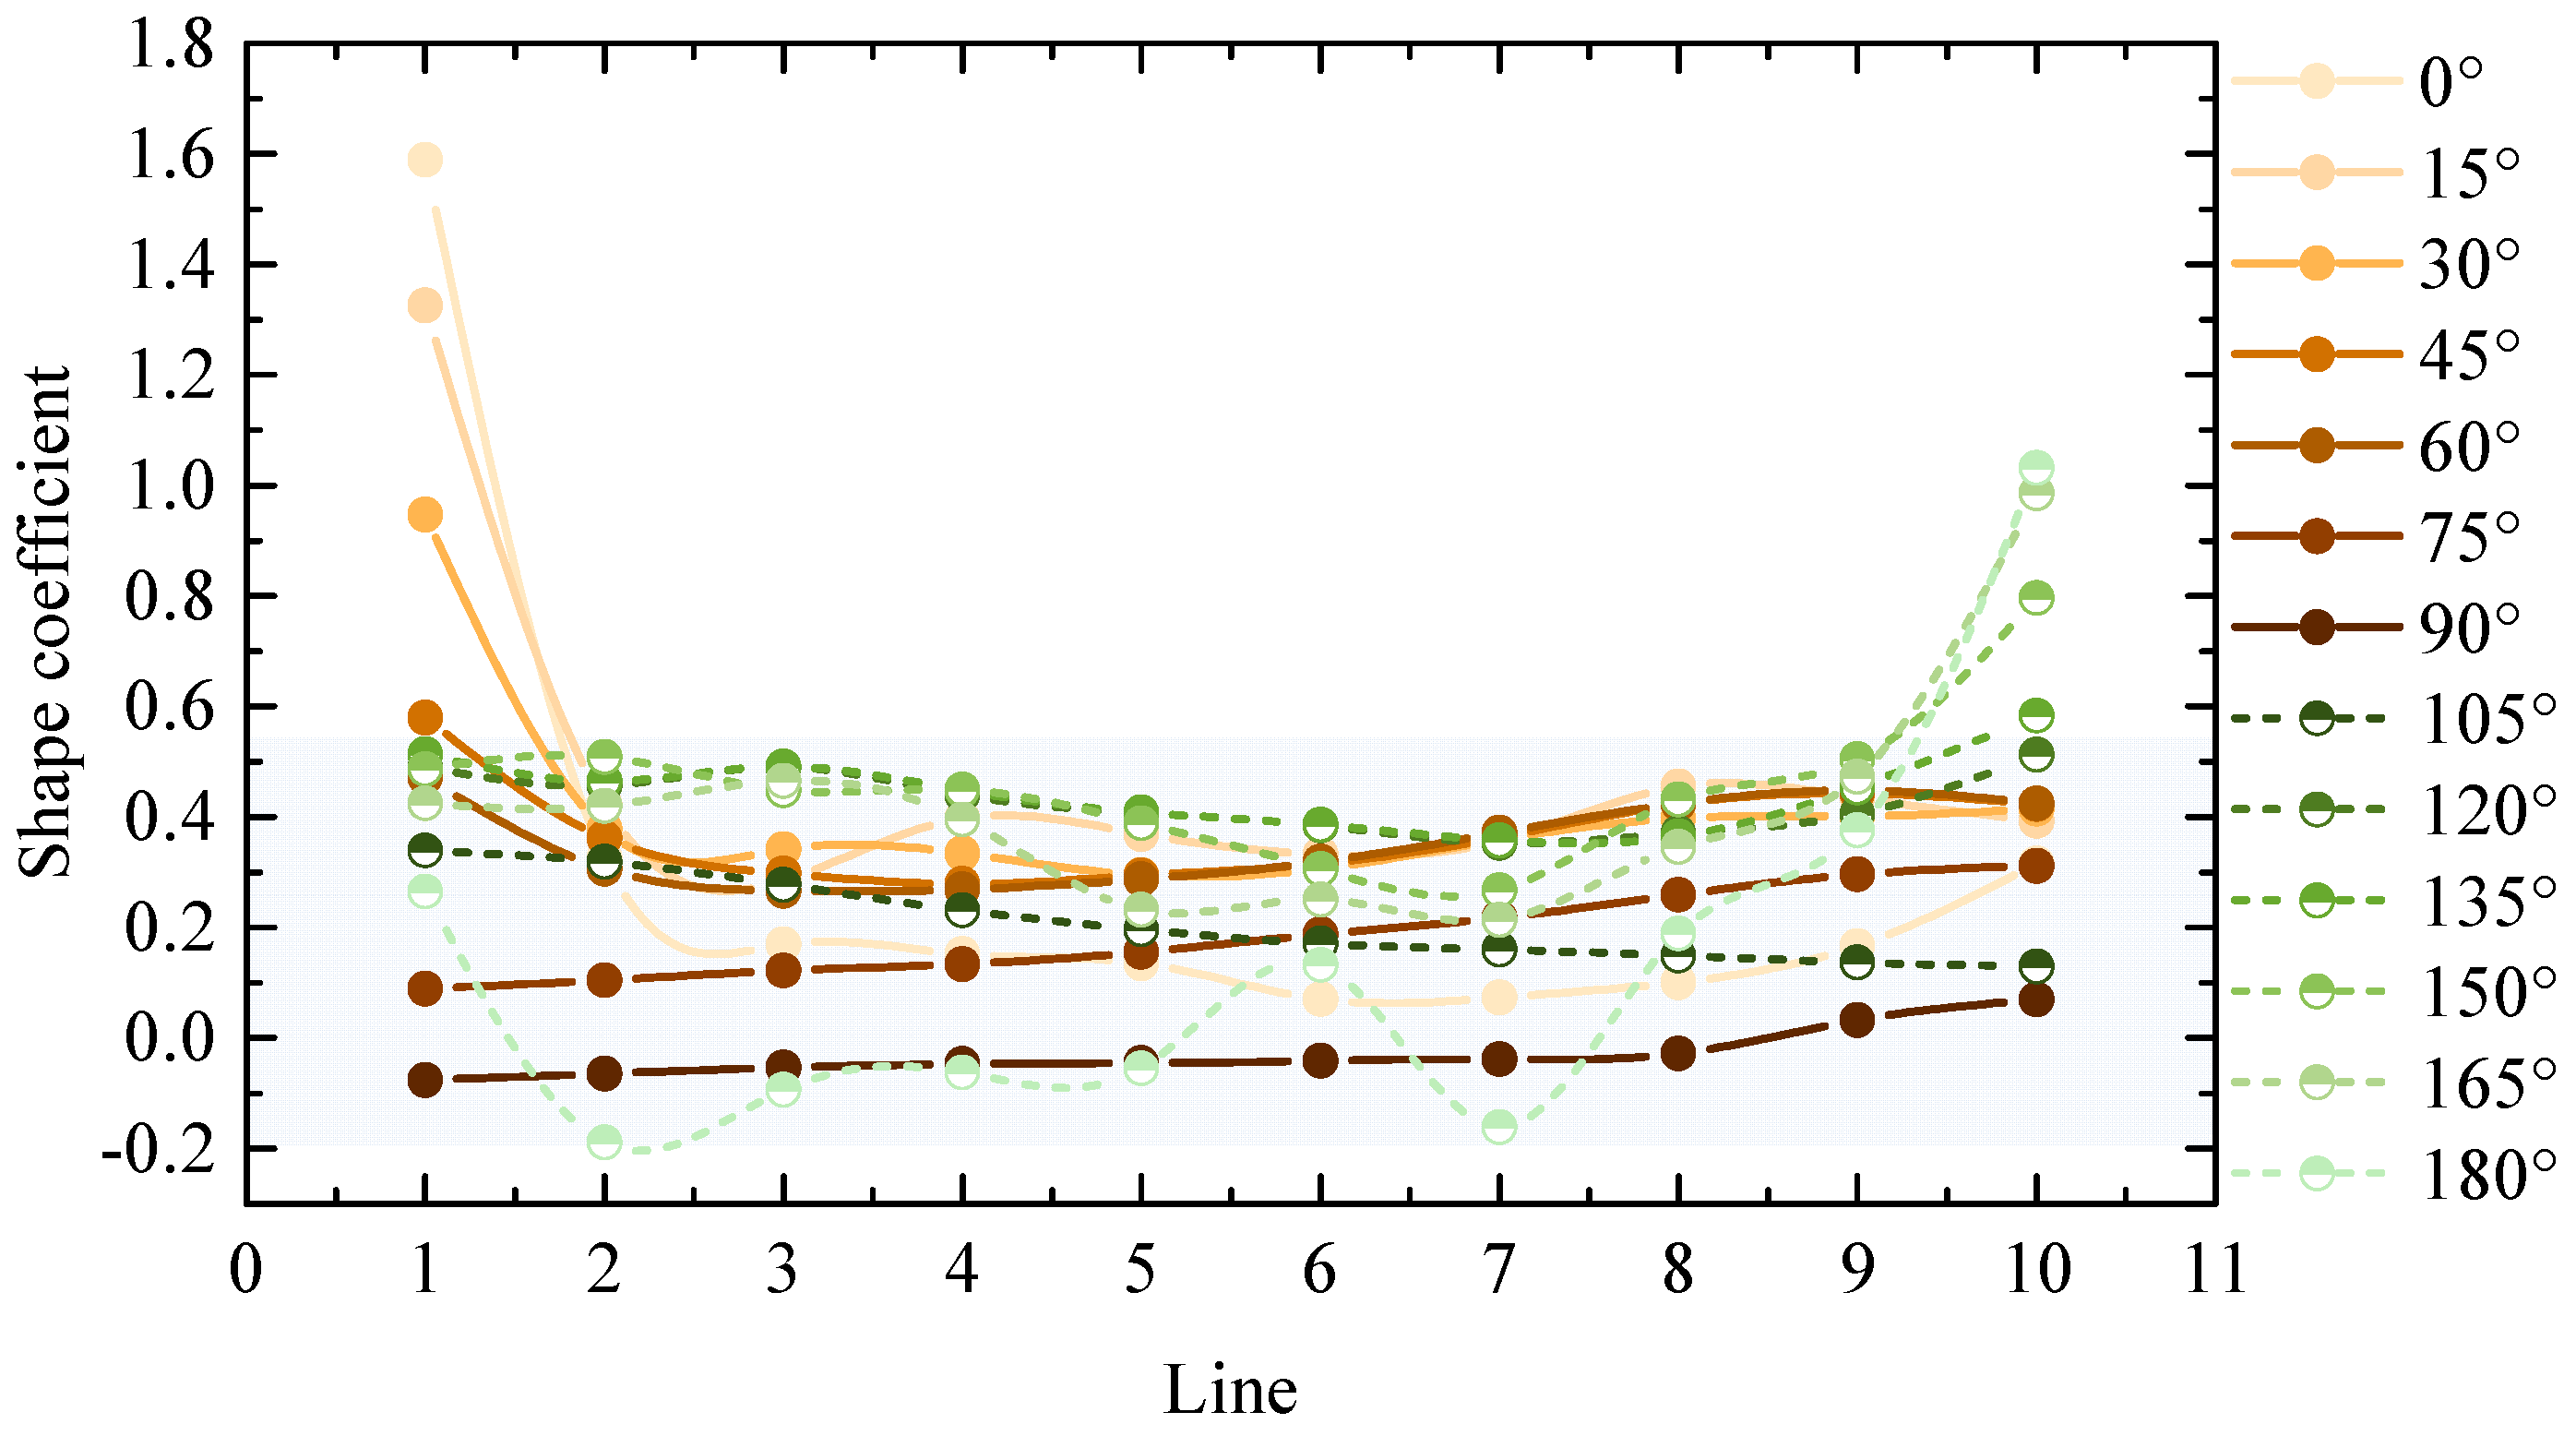
The wind load shape coefficient variation of PV panel modules in the same column but different lines under different wind direction angles is shown in Figure 14. The results showed that the wind load shape coefficients of each PV panel module exhibited a gradual convergence as the wind direction angle increased from 0° to 90°, stabilizing at approximately 0.1. When the wind direction angle increased from 90° to 180°, the differences in the wind load shape coefficients of each module began to increase. The PV panel modules at the near-wind end gradually caused occlusion to PV panel modules at the far-wind end. The wind load shape coefficient of PV panel modules at the near-wind ends gradually increased until it reached the maximum at 180°. The maximum wind load shape coefficients of each module mainly occurred within the intervals of 0° to 30° and 150° to 180°. Excluding one line of PV panel modules on each side (i.e., the first line and the tenth line), the wind load shape coefficients of the remaining lines of PV panel modules ranged from −0.2 to 0.55. Thus, the design value of the wind load shape coefficient of a line of PV panel modules close to the wind direction could be considered as 0.55.
Figure 14.
Wind load shape coefficient variation of each PV panel module under different wind direction angles (wind velocity = 30 m/s).
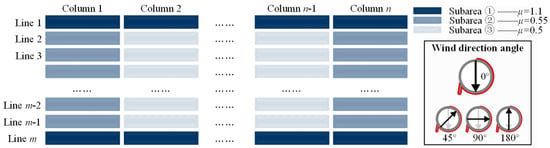
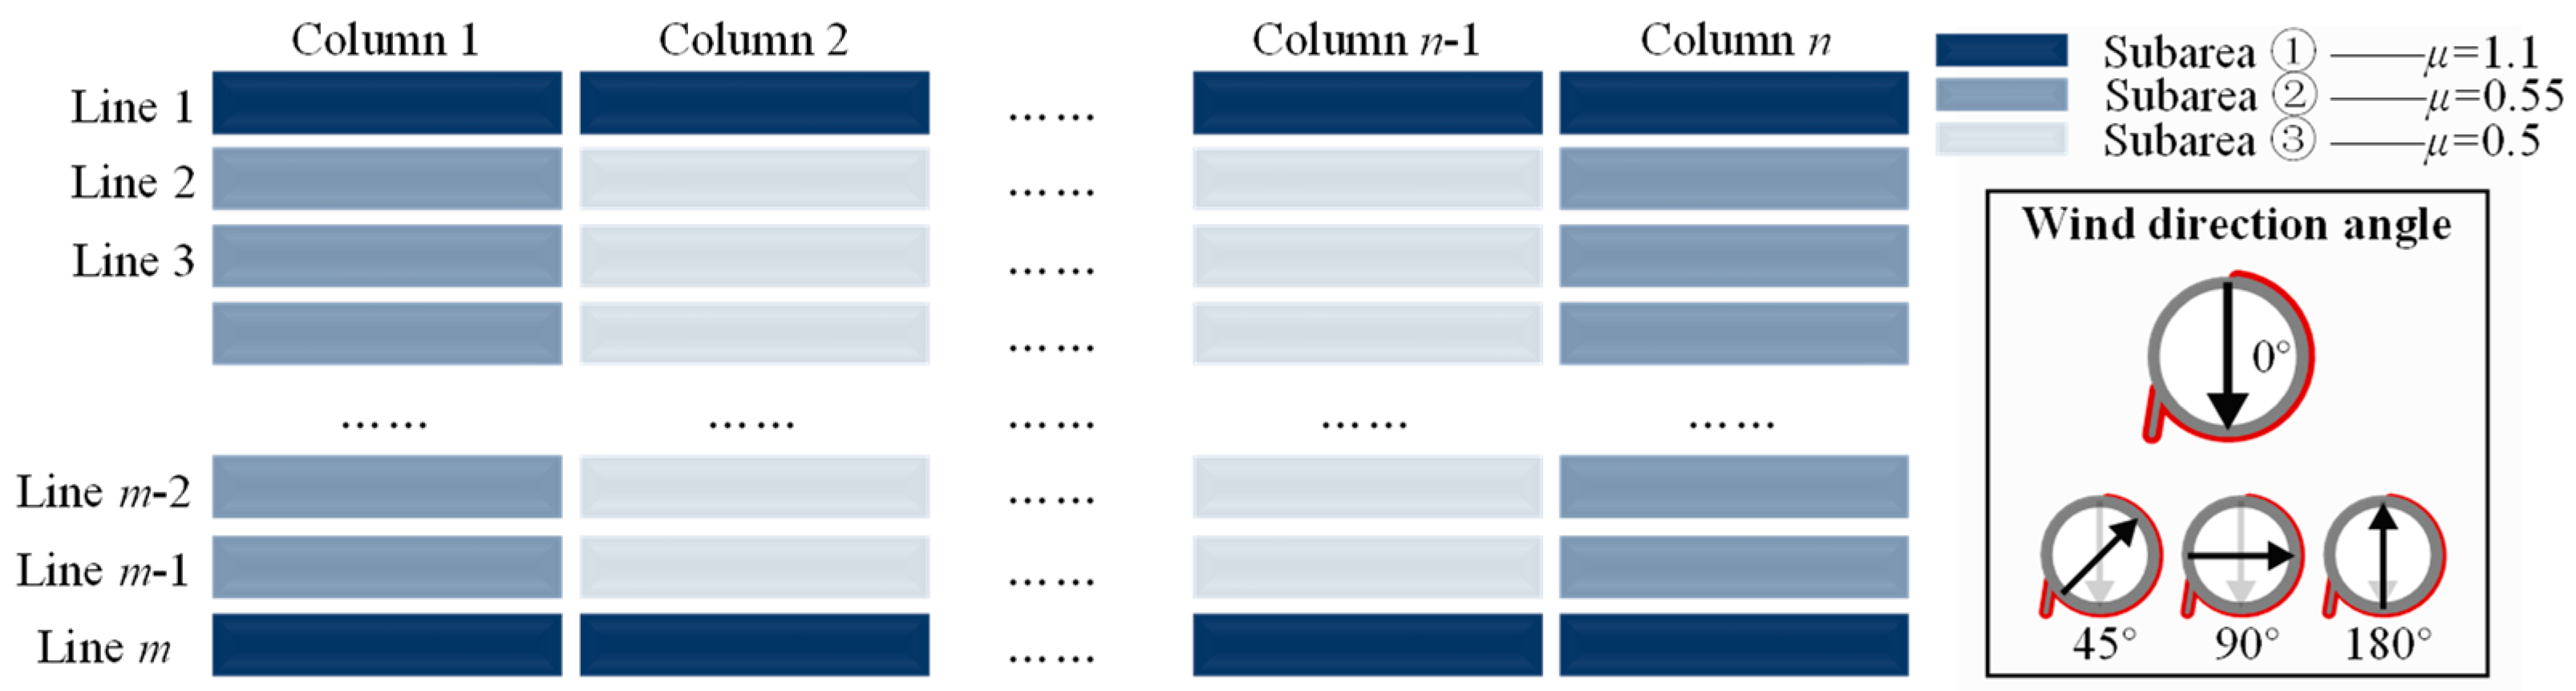
Based on the above, for the mega-scale PV arrays without occlusion, the wind load shape coefficients μ of each PV panel module were divided, summarized, and simplified, as shown in Figure 15.
Figure 15.
Wind load shape coefficient partition of mega-scale PV arrays.
(1) Subarea ① was the windward zone, which was the first line of the windward surface under the wind direction angle of 0° and 180°, and the maximum wind load shape coefficient of the PV panel modules under the wind direction angle of 15°. It could be uniformly designed according to the wind load shape coefficient of the first line of the middle column of the modules, with a design recommendation of 1.1.
(2) Subarea ② was the edge zone, which was the outermost line of PV panel modules (excluding the PV panel modules at the four corners of the PV arrays). Due to the influence of different wind direction angles, its wind load shape coefficient was slightly larger than that of the internal PV panel modules (Subarea ③) and should be considered separately, which could be taken as 0.55.
(3) Subarea ③ was the inner zone, which was the remaining panel modules in the middle. The wind load shape coefficients could be determined based on the variation law observed at a wind direction angle of 0°, and all coefficients were assigned a value of 0.5.
4.4. Limitations and Future Research
Several limitations should be noted. First, the PV modules were represented as plane surfaces, while structural components such as columns and module thickness were not explicitly modeled. Therefore, the present results mainly describe the overall aerodynamic load characteristics and shielding effects rather than local structural aerodynamic responses. Second, the present study adopted a fixed module inclination angle of 29° and a reference inlet wind speed of 30 m/s based on the investigated project configuration. Third, we did not perform a systematic mesh-independence analysis. Finally, although several wind direction angles were considered, additional angles such as 45° and 90° were not separately simulated. These limitations define the scope of applicability of the present results. Future research will focus on systematic mesh-sensitivity analysis, different PV-module inclination angles, a wider range of wind speeds and wind directions, and more detailed modeling of PV support structures. We will also investigate coupled aerodynamic–structural analyses considering vortex-induced vibration and fatigue effects.
5. Conclusions
To explore the shielding effect associated with the wind load shape coefficient of mega-scale PV arrays, a numerical model of the PV array was established and verified using Ansys Fluent software. The impact of PV panel module arrangements on the shielding effect was investigated, along with the influence of this shielding effect on the wind load shape coefficient of mega-scale PV arrays. This examination considered variations in terrain shielding height differences and wind direction angles. Recommended values for different zoning of wind load shape coefficients for the PV panel modules were established. The main conclusions are as follows:
(1) In the absence of terrain shielding, the wind load shape coefficients of each PV panel module in the same line but across different columns exhibited no significant differences and could be uniformly assigned a value. For each PV panel module in the same column but across different lines, the wind load shape coefficient for those in the second and subsequent lines could be 0.5.
(2) For PV arrays in complete terrain shielding, the influence of shielding height differences and wind direction angles could be disregarded. Only the wind suction and wind pressure were considered. The wind load shape coefficients of each PV panel module could be 0.3.
(3) For PV arrays without occlusion, the effects of shielding height difference and wind direction angle should be considered. When considering the first line (with a wind direction angle of 0°) and the last line (with a wind direction angle of 180°) as the windward zones, the wind load shape coefficient of each module could be 1.1. The two edge columns (excluding the PV panel modules at the four corners) were the edge zones, and the wind load shape coefficient for each module could be 0.55. The remaining PV panel modules in the middle were the inner zone, and the wind load shape coefficient of each module could be 0.5.
(4) The applicability of the proposed wind load shape coefficients is subject to the geometric and aerodynamic conditions investigated in this study. In particular, the present analysis adopts a fixed module inclination angle, a reference wind speed, simplified PV-module geometry, and a specific set of wind directions. Systematic investigations of mesh sensitivity, module inclination angle, wind speed, additional wind directions, and detailed structural components are required to further generalize the proposed values and will be considered in future research.
Author Contributions
Conceptualization, D.H. and M.H.; methodology, D.H. and L.Z.; software, D.H.; validation, D.H., L.Z. and H.F.; formal analysis, D.H., H.F. and R.Z.; investigation, D.H., L.Z. and R.Z.; resources, L.Z. and R.Z.; data curation, D.H. and H.F.; writing—original draft preparation, H.F. and D.H.; writing—review and editing, H.F. and M.H.; visualization, L.Z. and H.F.; supervision, R.Z. and M.H.; project administration, M.H. and L.Z.; funding acquisition, M.H. All authors have read and agreed to the published version of the manuscript.
Funding
This research was funded by Tongji University (Grant No. Kh0021020250025).
Data Availability Statement
Data available on request from the authors.
Conflicts of Interest
Author Zhao Lijun and Zhou Rui were employed by the company China Railway 24th Bureau Group Corporation Limited. Author Dongping Huang was employed by the Tongji Architectural Design (Group) Co., Ltd. The remaining authors declare that the research was conducted in the absence of any commercial or financial relationships that could be construed as a potential conflict of interest.
Abbreviations
The following abbreviations are used in this manuscript:
| PV | Photovoltaic |
| CFD | Computational fluid dynamics |
| FEA | Finite element analysis |
| FPC | Fishery-photovoltaic complementarity |
| DC | Direct current |
References
- Wei, L.J.; Islam, M.; Hasanuzzaman, M.; Cuce, E. Energy consumption, power generation and performance analysis of solar photovoltaic module based building roof. J. Build. Eng. 2024, 90, 109361. [Google Scholar] [CrossRef] [Scilit]
- Alomar, O.R.; Ali, O.M.; Ali, B.M.; Qader, V.S. Energy, exergy, economical and environmental analysis of photovoltaic solar panel for fixed, single and dual axis tracking systems: An experimental and theoretical study. Case Stud. Therm. Eng. 2023, 51, 103635. [Google Scholar] [CrossRef] [Scilit]
- Wu, Y.; Wu, Y.; Sun, X.; Sun, Y. Improvement of the flexible support photovoltaic module system: A new type of cable-truss support structure system. Structures 2025, 71, 108203. [Google Scholar] [CrossRef] [Scilit]
- Kshatri, S.S.; Dhillon, J.; Mishra, S.; Tariq, R.; Sharma, N.K.; Bajaj, M.; Rehman, A.U.; Shafiq, M.; Choi, J.-G. Reliability analysis of bifacial PV panel-based inverters considering the effect of geographical location. Energies 2022, 15, 170. [Google Scholar] [CrossRef] [Scilit]
- Nan, B.; Chi, Y.; Jiang, Y.; Bai, Y. Wind load and wind-induced vibration of photovoltaic supports: A review. Sustainability 2024, 16, 2551. [Google Scholar] [CrossRef] [Scilit]
- Zhong, M.; Long, H.N.; Zhou, Z.X.; Zhou, Q.G. Wind load study of solar photovoltaic panels in grassland terrain based on wind tunnel test. J. Nat. Disasters 2023, 32, 64–73. [Google Scholar] [CrossRef]
- Zhang, Z.; Xiao, Z.; Ma, W.; Liu, X. Wind-induced vibration characteristics and shading effects of a double-layer cable-supported photovoltaic module system based on wind tunnel test. Buildings 2025, 15, 550. [Google Scholar] [CrossRef] [Scilit]
- Hu, Y.; Zhang, H.; Luo, Z.; Zhou, Y.; Yuan, G. Critical wind direction angles and edge module vulnerability in fixed double-row photovoltaic (PV) arrays: Analysis of extreme wind conditions based on CFD Simulation. Energies 2025, 18, 2330. [Google Scholar] [CrossRef] [Scilit]
- Zhang, Y.M.; Wang, M.; Shi, G. Mechanical behavior of the extended end-plate connections of a portal frame with various retrofitted constructions under loading. Structures 2024, 63, 106477. [Google Scholar] [CrossRef] [Scilit]
- Teyabeen, A.A.; Mohamed, F. Estimation of the optimum tilt angle of solar PV panels to maximize incident solar radiation in Libya. Energy 2024, 17, 5891. [Google Scholar] [CrossRef] [Scilit]
- Polcovnicu, R.-A.; Hudișteanu, S.-V.; Ţăranu, N.; Ungureanu, D.; Alexa, M.; Hudișteanu, I.; Onuțu, C.; Mustiață, A.-F. Experimental investigation of wind effect on roof configurations with photovoltaic panel systems for sustainable building design. Sustainability 2025, 17, 4739. [Google Scholar] [CrossRef] [Scilit]
- Stathopoulos, T.; Zisis, I.; Xypnitou, E. Local and overall wind pressure and force coefficients for solar panels. J. Wind Eng. Ind. Aerodyn. 2014, 125, 195–206. [Google Scholar] [CrossRef] [Scilit]
- Abiola-Ogedengbe, A.; Hangan, H.; Siddiqui, K. Experimental investigation of wind effects on a standalone photovoltaic (PV) module. Renew. Energy 2015, 78, 657–665. [Google Scholar] [CrossRef] [Scilit]
- Ma, W.Y.; Chai, X.B.; Liu, Q.K.; Xing, K.Y.; Liu, X.B. Study on effect of bottom flow obstruction on wind load of solar photovoltaic panels. Build. Struct. 2019, 49, 129–134. [Google Scholar] [CrossRef]
- Rehman, N.U. Optimal layout for facade-mounted solar photovoltaic arrays in constrained fields. J. Sol. Energy Eng. 2021, 143, 031004. [Google Scholar] [CrossRef] [Scilit]
- Rustemli, S.; Dincer, F.; Almali, M.N. Research on effects of environmental factors on photovoltaic panels and modeling with Matlab/Simulink. Przegląd Elektrotech. 2012, 88, 63–66. [Google Scholar]
- Ding, S.; Zhou, X.Y. A study of combination factor of wind and snow loads on photovoltaic (PV) panels based on characterization of joint wind-snow hazard. Eng. Struct. 2025, 335, 120304. [Google Scholar] [CrossRef] [Scilit]
- Wang, J.; Jiang, F.; Lin, X.; Yousif, C.; Ji, W.; Yuan, Y.; Zhou, J. Field measurement on the wind and thermal microenvironment of distributed PV array. J. Build. Eng. 2025, 105, 112492. [Google Scholar] [CrossRef] [Scilit]
- Li, J.Q.; He, Y.L.; Xu, Z.H. Analysis of wind load shielding effect of array photovoltaic panel. Shanxi Archit. 2019, 45, 54–56. [Google Scholar] [CrossRef]
- Xu, N.; Li, X.; Gao, C.; Zhu, C.; Zhou, Z.; Zhu, X. Analysis of shape coefficients of wind loads of photovoltaic system. Acta Energiae Solaris Sin. 2021, 42, 17–22. [Google Scholar] [CrossRef]
- Lou, W.J.; Dan, H.Y.; Yang, Z.; Xu, H.W. Study of shielding effect on shape coefficient of super—Large photovoltaic arrays. J. Build. Struct. 2021, 42, 47–54. [Google Scholar] [CrossRef]
- Zhang, J.; Lou, Y.B. Study of wind load influencing factors of flexibly supported photovoltaic panels. Buildings 2024, 14, 1677. [Google Scholar] [CrossRef] [Scilit]
- Debnath, K.; Barman, J.; Hsieh, C.-C.; Huang, C.-Y.; Juang, R.-C.; Chiu, C.-W.; Kuo, C.-F.J. Wind pressure characterization on ground-mounted solar PV systems: A combined experimental and numerical study. Case Stud. Therm. Eng. 2025, 73, 106501. [Google Scholar] [CrossRef] [Scilit]
- Abdallah, M.; Zisis, I. Wind-induced loads on photovoltaic (PV) panels on low-sloped gable roofs: Panel size effects. J. Wind Eng. Ind. Aerodyn. 2025, 263, 106129. [Google Scholar] [CrossRef] [Scilit]
- Xie, S.D.; Ma, C.; Zhang, Z. Experimental study on the hydrodynamic behavior of a floating Fishery-Photovoltaic complementary structure. Ocean Eng. 2025, 332, 121401. [Google Scholar] [CrossRef] [Scilit]
- Zhu, Z.; Song, Z.; Xu, S.; Wang, S.; Chen, X.; Wang, Y.; Zhu, Z. The development of fishery-photovoltaic complementary industry and the studies on its environmental, ecological and economic effects in China: A review. Energy Nexus 2024, 15, 100316. [Google Scholar] [CrossRef] [Scilit]
- Chen, Z.Y. Research on Wind Resistance Performance of Fixed Support Photovoltaic Panel Array. Master’s Thesis, Harbin Institute of Technology, Harbin, China, 2021. [Google Scholar] [CrossRef]
- Baetke, F.; Werner, H.; Wengle, H. Numerical simulation of turbulent flow over surface-mounted obstacles with sharp edges and corners. J. Wind Eng. Ind. Aerodyn. 1990, 35, 129–147. [Google Scholar] [CrossRef]
- Bekele, S.A.; Hangan, H. A comparative investigation of the TTU pressure envelope—Numerical versus laboratory and full scale results. Wind Struct. 2002, 5, 337–346. [Google Scholar] [CrossRef] [Scilit]
- GB 50009-2012; Load Code for the Design of Building Structures. China Building Industry Press: Beijing, China, 2012.

Disclaimer/Publisher’s Note: The statements, opinions and data contained in all publications are solely those of the individual author(s) and contributor(s) and not of MDPI and/or the editor(s). MDPI and/or the editor(s) disclaim responsibility for any injury to people or property resulting from any ideas, methods, instructions or products referred to in the content. |
© 2026 by the authors. Licensee MDPI, Basel, Switzerland. This article is an open access article distributed under the terms and conditions of the Creative Commons Attribution (CC BY) license.