Article

Second-Life Battery Energy Storage System Deployment for Fast Charging of Electric Buses: A Scenario-Based Cost–Benefit Assessment


Faculty of Civil Engineering, Transportation Engineering and Architecture, University of Maribor, Smetanova ulica 17, 2000 Maribor, Slovenia
*
Author to whom correspondence should be addressed.
Energies 2026, 19(17), 4092; https://doi.org/10.3390/en19174092
Submission received: 22 July 2026 / Revised: 24 August 2026 / Accepted: 28 August 2026 / Published: 31 August 2026

Abstract

Fast-charging sites for electric buses create short-duration high-power demand that can increase grid-capacity requirements and operating costs. This paper assesses the economic performance of second-life battery energy storage systems (BESS) at an operational electric-bus fast-charging site in Maribor, Slovenia. Using measured charging-demand data, this study compares baseline operation with three implementation scenarios: a small-scale BESS, a full-scale BESS, and a full-scale BESS integrated with photovoltaic (PV) generation. A 12-year scenario-based cost–benefit assessment (CBA) considers investment, grid-electricity, and operation and maintenance costs under the applicable network tariff. The results show that BESS-only configurations are not economically justified under the analysed conditions. Importantly, even a substantial temporary reduction in grid demand from approximately 150 kW to 60 kW produces only limited cost savings, demonstrating that technically effective peak shaving does not necessarily translate into economic viability. The strongest economic performance is achieved by combining BESS with the annual-demand-matched 92.4 kWp PV system, which substantially reduces annual grid-electricity demand and operating costs. Nevertheless, this configuration does not reach break-even within the 12-year assessment period; under the reference assumption of a 5% annual increase in grid-electricity costs, extrapolation indicates break-even in approximately year 18. The findings demonstrate that the economic value of second-life BESS at fast-charging sites depends not only on peak-shaving capability but on its interaction with tariff structure, grid conditions, and local renewable generation.

1. Introduction

1.1. Electric Bus Fast Charging and Local Grid Impacts

The electrification of urban bus fleets is an important pathway for reducing local emissions and improving the environmental performance of public transport systems. However, the transition from diesel buses to battery-electric buses involves not only vehicle replacement but also new requirements for charging infrastructure, grid-connection capacity, and operational energy management. These requirements are particularly relevant for fast-charging and opportunity-charging systems, where high-power charging events are concentrated at specific charging locations and within short time intervals.
Electric bus fast-charging infrastructure can create short-duration but high-power-demand peaks, which may increase distribution-capacity requirements and motivate the use of local grid-support measures [1,2,3,4,5]. Previous work on electric-bus fast-charging stations shows that stationary storage can reduce grid-power peaks, support the charging process, and act as an energy buffer between the charger and the grid [1,2,3]. At a broader network level, storage-supported charging has also been analysed to support bus fleet electrification under different grid-capacity and infrastructure constraints [4,5]. These findings indicate that electric bus charging infrastructure should be evaluated not only through annual electricity demand, but also through peak-power exposure and grid-capacity-related costs.
In the broader fast-charging context, BESS-supported DC fast chargers are commonly used to reduce instantaneous grid demand by supplying charging power jointly from the grid and the battery [6]. This operating principle is directly relevant for electric bus fast-charging sites, where high charging power is required only during short charging events, while the intervals between charging events may be used for BESS recharging. In addition, charging-load regulation and time-shifting strategies can become relevant where electricity tariffs vary by time period or where grid-capacity exposure affects operating costs [7].

1.2. BESS and Second-Life Batteries for Charging Infrastructure

Second-life batteries are particularly relevant for stationary storage applications because they connect energy storage deployment with circular-economy objectives. Batteries retired from electric vehicles or electric buses may retain sufficient capacity for less demanding stationary applications, even when they are no longer suitable for traction use [8,9,10,11,12,13]. Their reuse can extend battery lifetime, reduce the need for new battery production, and support circular use of battery materials before recycling.
This circular-economy perspective is increasingly reflected in European battery policy. Regulation (EU) 2023/1542 strengthens the regulatory framework for battery sustainability, waste-battery management, recycling efficiency, material recovery, and recycled-content requirements [10]. In this context, second-life use is relevant because it can extend the useful lifetime of battery systems before recycling becomes necessary. However, reuse does not remove the need for economic assessment. Once a second-life battery is considered for a specific stationary application, the key question becomes whether the complete implemented system creates enough operational value to justify the required investment.
Recent reviews show that second-life batteries are increasingly being considered for stationary storage applications, including renewable-energy integration, peak shaving, grid support, and charging infrastructure [8,9,11,12]. Gharebaghi et al. [8] provide a broad overview of second-life battery applications, covering technical challenges, economic feasibility, environmental impacts, existing projects, and recycling pathways. However, the same body of literature also shows that practical feasibility depends on battery condition, remaining useful life, repurposing requirements, safety, system integration, market conditions, and the intended use case [8,9,11,12].
Environmental assessments further show that the benefits of repurposed batteries depend on how system boundaries, energy flows, and avoided production or recycling processes are modelled [13]. This is important because second-life use is not automatically beneficial under all conditions; its value depends on both the specific reuse application and the assumptions used to compare reuse with alternative pathways. For charging infrastructure, this means that second-life BESS should not be assessed only as a low-cost battery asset, but as a complete stationary storage system with specific technical, economic, and operational conditions.
For the present study, the broader literature on second-life battery use provides the circular-economy and stationary-storage context. However, the analysed application is more specific: a second-life BESS deployed at an electric-bus fast-charging site with short high-power charging events, site-specific grid-capacity assumptions, and a time-differentiated network-tariff structure. Therefore, the relevant research question is not whether second-life batteries are generally useful for stationary storage, but whether a specific implementation configuration is economically justified under the operating and tariff conditions of the charging site.

1.3. Research Gap

Existing research provides important insights into electric-bus charging infrastructure, BESS-supported fast charging, and second-life battery reuse. Studies have addressed BESS configuration and sizing for electric-bus fast-charging stations [1,2,3], city-scale and grid-constrained storage support for bus electrification [4,5], BESS-supported DC fast-charging architectures [6], charging-load regulation using BESS [7], and renewable-energy integration at electric-bus charging stations [14,15]. The literature on second-life batteries has also developed substantially, including systematic reviews, cost assessments, circular-economy perspectives, environmental assessment methods, and distributed grid applications [8,9,11,12,13,16,17]. A more specific research stream has started to connect second-life batteries with public transport electrification and charging-station operation. Energy-management studies indicate that second-life batteries can reduce operating costs and peak charging demand in electric-bus charging-station models, depending on the assumed charging profile, operational strategy, and electricity-price structure [18]. Public transport electrification planning models have also begun to include second-life batteries and renewable-energy systems as part of broader fleet-transition strategies [19]. Studies on retired electric-bus batteries further highlight the potential of echelon utilisation, although its economic value remains dependent on the reuse application, system boundaries, and assumptions applied in the assessment [20].
Nevertheless, these research streams remain only partially integrated. Technical studies commonly focus on BESS sizing, charging control, or grid interaction, whereas second-life battery studies often examine economic or environmental performance at the battery or system level. Fewer studies combine measured site-level charging demand, time-resolved operational modelling, practical second-life BESS implementation costs, local electricity-supply and network tariffs, battery-ageing assumptions, uncertainty analysis, and long-term economic indicators within a single charging-site assessment. Table 1 positions the present study against representative recent studies according to these methodological dimensions.
This combination is particularly relevant to public transport operators making investment decisions for individual charging sites under existing grid-connection and tariff conditions. The economic value of a BESS-only configuration used primarily for peak shaving may differ substantially from that of a configuration combining BESS with PV generation. A BESS-only configuration can reduce peak grid-power requirements and shift electricity use between tariff periods, but it does not necessarily reduce annual charging-energy demand. By contrast, PV integration may reduce both peak-power exposure and annual grid-electricity import, although its actual contribution depends on the temporal correspondence between PV generation, charging demand, and available storage capacity. Second-life BESS should therefore be assessed not only as a storage component, but as part of a complete charging-site configuration in which technical operation, grid conditions, tariffs, and investment costs are evaluated consistently.

1.4. Objective and Contribution

This paper addresses the identified gap through a case study of an operational electric-bus fast-charging site in Maribor, Slovenia. The study combines measured charging-demand data, time-resolved operational modelling, and practical implementation-cost assumptions derived from pilot activities to compare the baseline charging-site operation with three alternative second-life BESS implementation scenarios. These comprise a small-scale BESS configuration, a full-scale BESS configuration, and a full-scale BESS configuration combined with PV generation dimensioned to approximately match the annual charging-energy demand. The main research question is as follows:
Which of the evaluated second-life BESS implementation configurations, if any, is economically justified under the charging-demand, grid-capacity, tariff, and implementation-cost conditions represented by the Maribor case study?
Although the numerical results are site-specific, the assessment procedure is applicable to other electric-bus charging sites. Its application requires site-level charging profiles and information on grid-capacity constraints, local electricity and network tariffs, BESS technical and cost parameters, and, where relevant, local PV generation. The study therefore does not seek to identify a universally optimal BESS configuration, but to establish a structured approach through which alternative charging-site configurations can be evaluated under locally applicable conditions.
The contribution of the paper is fourfold. First, it provides a scenario-based techno-economic assessment of second-life BESS deployment at an operational electric-bus fast-charging site using measured charging demand and time-resolved operational analysis. Second, it links scenario-specific investment and O&M costs with electricity-supply costs, grid-capacity requirements, and time-block network tariffs within a 12-year cumulative-cost assessment. Third, it distinguishes between the economic mechanisms of BESS-only configurations, which are used primarily for peak shaving and tariff-based load shifting, and those of a combined PV–BESS configuration, which can additionally reduce annual grid-electricity import. Fourth, it identifies the site-level inputs and operational conditions required to apply the assessment framework to other electric-bus charging sites.

2. Materials and Methods

2.1. Case Study: Maribor Electric Bus Fast-Charging Site

The case study is based on a fully electrified urban bus line operated exclusively with battery electric buses (BEVs) using opportunity charging. The line represents one of the key electric-bus applications in the Maribor, Slovenia, public transport network, with up to four electric buses operating during peak periods. Charging is performed using 150 kW DC pantograph-based fast-charging systems, which enable short charging sessions during scheduled terminal layovers. The line is served by two terminal charging locations. The analysed charging site is located at the final stop, while the opposite terminal at the main bus station is equipped with the same type of charging system. All charging events included in the present analysis refer exclusively to the 150 kW DC pantograph charger at the final stop terminal; no free-standing or plug-in DC fast chargers are included.
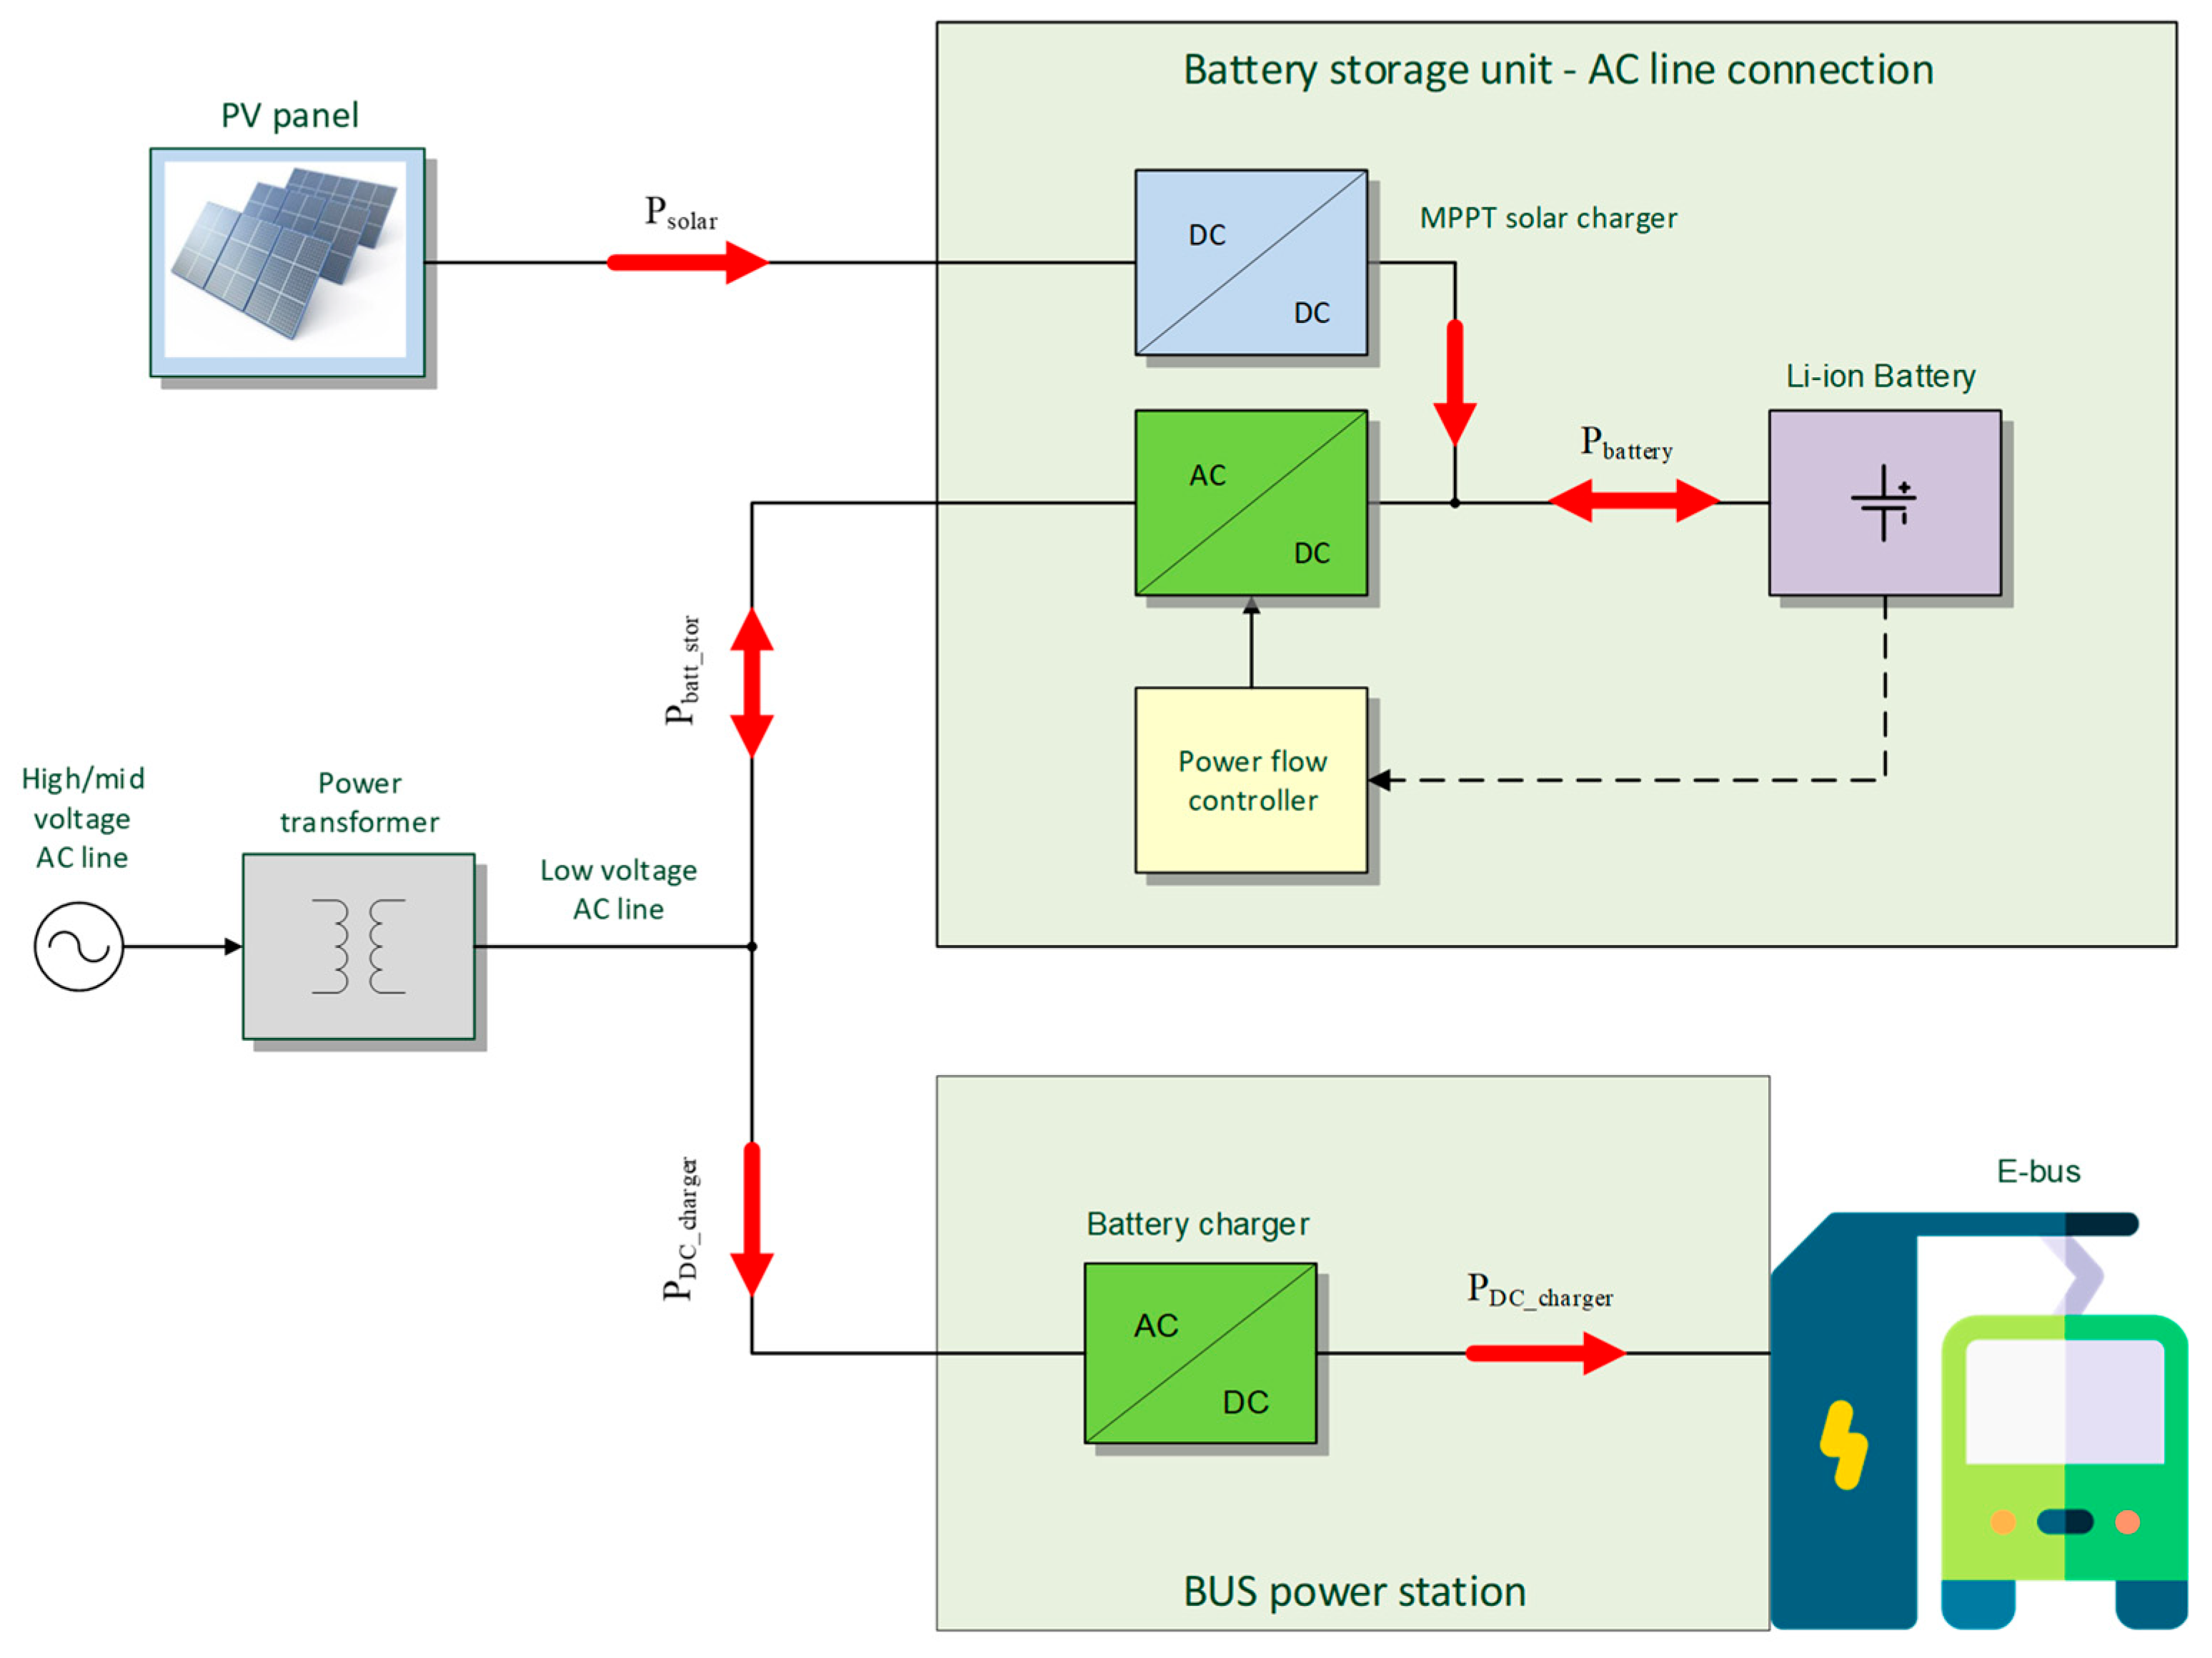
Figure 1 illustrates the system topology, based on a parallel hybrid configuration in which the grid and BESS are connected in parallel on the low-voltage AC side, while the PV system is coupled to the battery storage through an MPPT-controlled DC/DC converter. This arrangement makes the site suitable for analysing charging-site energy demand, peak-power exposure, and the potential role of BESS support under real public transport operating conditions. The key line, vehicle, and charging-system parameters used as case-study inputs are summarised in Table 2.
The measured charging-session indicators and the high-resolution charging profile are based on a two-week dataset collected at the analysed terminal charging site in February 2026. The dataset contained session-level information on delivered energy, charging duration, vehicle identifier, charger location, and state of battery charge, included 537 charging sessions. For BESS sizing, the 85th percentile (P85) of the observed daily charging-energy demand was used as the design reference, representing a relatively demanding operating day without sizing the system according to an isolated maximum. In addition, monthly charging-energy data covering a full calendar year were available and were used to represent seasonal variation and establish the monthly distribution applied in the annual assessment. The annual assessment therefore did not rely solely on the two-week measurement period. The resulting annual charger-side demand was approximately 100 MWh/year. Based on six months of concurrent grid-meter and charger measurements, the grid-to-charger efficiency was approximately 90.9%, corresponding to an annual grid-side electricity demand of approximately 110 MWh/year. A detailed heatmap of the charging activity and the monthly charger-side energy distribution used in the annual assessment are provided in Supplementary File S1.

2.2. Second-Life BESS Characteristics and Sizing

The second-life BESS considered in this study is based on repurposed NMC traction batteries recovered from electric buses. For demand-based BESS sizing, the P85 daily charger-side energy demand was used as the design reference. Nominal battery capacity was determined considering an operational SOC range of 10–90%, corresponding to 80% usable capacity. This range provides a practical compromise between energy utilization and limiting operation at SOC extremes that may accelerate battery ageing [21,22]. Energy routed through the BESS is subject to additional losses associated with the charging and discharging conversion stages. A BESS round-trip efficiency of 90% was adopted as a conservative modelling assumption, consistent with values reported for second-life battery storage applications [23]. Combined with the measured losses of the existing grid-to-charger path, this corresponds to an overall efficiency of approximately 82%, i.e., total losses of approximately 18%. This combined efficiency was considered when determining the energy requirements for BESS-supported operation.
Battery power capability was assessed separately through the C-rate. The NMC batteries used in the pilot have a nominal maximum C-rate of 1C, while the operating conditions evaluated in this study result in substantially lower C-rates and therefore relatively moderate battery loading. Although higher C-rates may increase electrical and thermal stress and accelerate degradation [24,25], cycle-resolved degradation modelling was beyond the scope of this study. Battery ageing was therefore assessed through the cumulative usable-capacity-fade sensitivity described below.
To examine the long-term effect of battery ageing, annual usable-capacity fade rates of 1% and 3% were applied cumulatively over the 12-year assessment period as favourable and unfavourable boundary cases, respectively. The selected range was informed by degradation results reported for second-life NMC batteries and field-operated stationary storage systems [26,27]. For each scenario, the resulting usable capacity was evaluated against its peak-support and BESS-recharging requirements.

2.3. Site-Specific Photovoltaic Potential

For the analysed charging site, photovoltaic generation was selected as the most suitable local RES option, primarily because it could be directly coupled with the BESS and charging infrastructure. The site-specific solar resource was assessed using PVGIS and cross-checked against the Global Solar Atlas [28,29]. The annual solar irradiation at the site is approximately 1283 kWh/m2/year. PV electricity generation was estimated using the PVGIS grid-connected PV model rather than by directly converting solar irradiation according to installation area. A fixed crystalline-silicon PV system with optimal inclination and orientation was assumed. For the analysed location, the optimal inclination was 37° and the azimuth −5°. The PVGIS default system loss of 14% was adopted. Under these assumptions, the modelled annual specific PV yield was 1196.8 kWh/kWp/year. This specific yield was subsequently used to determine the installed PV capacity required in the PV-integrated scenario. To convert the installed PV capacity into the corresponding module area, a representative module efficiency of 22% for crystalline-silicon PV modules was assumed. The conversion was based on standard test conditions (1 kW/m2). The calculated area represents the active module area rather than the total site footprint required for installation. The resulting PV capacity and module area for Scenario S.3 were subsequently determined based on the scenario-specific annual energy requirement.

2.4. Scenario Development

The analysed scenarios were developed to represent a gradual increase in the level of support provided to the electric bus fast-charging site, ranging from baseline grid-supplied operation to BESS-supported peak shaving and combined BESS–PV operation. The scenarios were evaluated with respect to two related but distinct effects: grid-capacity exposure, defined by the maximum power required from the grid, and grid-energy dependence, defined by the amount of electricity imported from the grid over the analysed period. BESS integration primarily reduces grid-capacity exposure and enables energy shifting between tariff periods, whereas PV integration additionally reduces grid-energy dependence by substituting grid electricity with locally generated energy. In all configurations, the grid connection was retained for residual demand and operational backup.
For the full-scale BESS scenarios, a grid-capacity target of 60 kW was adopted. With a maximum charging power of 150 kW, the BESS must therefore provide up to 90 kW during peak charging events. The P85 daily charger-side energy demand of 544 kWh was used as the design reference for energy capacity. Accounting for the measured grid-to-charger efficiency and conversion losses consistent with the assumed 90% BESS round-trip efficiency, approximately 630 kWh of usable stored energy is required. With the adopted 10–90% SOC operating range, this corresponds to approximately 800 kWh BESS. Replenishing the 630 kWh of usable stored energy requires approximately 665 kWh of grid electricity due to charging losses. Overnight charging supplemented, when necessary, by intermediate recharging between bus-charging sessions, enables the planned BESS support to be maintained throughout the design day, including peak hours, while BESS recharging is avoided during the high-cost tariff Block 1.
For Scenario S.3, the PV system was dimensioned by dividing the projected annual AC-side electricity demand of approximately 110 MWh/year by the site-specific annual PV yield defined in Section 2.3. This resulted in an installed capacity of approximately 92.4 kWp and an active module area of approximately 420 m2. The sizing criterion equalised the expected annual PV generation and annual AC-side charging demand before considering their temporal distribution. It therefore represents an annual demand-matched PV configuration rather than complete self-sufficiency, and it is dependent on the hourly coincidence of PV generation and charging demand, as well as on the storage constraints of the BESS.
Residual grid electricity demand was estimated using an hourly energy-balance model with 8760 time steps. A representative 168 h weekly charging profile was derived from two consecutive weeks of measured charger data, repeated over the year and scaled separately to the projected demand for each month. For the main assessment, hourly PV generation was represented by the PVGIS profile for 2015, whose annual specific yield most closely matched the long-term value adopted for PV sizing. To examine inter-annual weather variability, the same simulation was additionally performed using all 19 annual PVGIS-SARAH3 hourly profiles available for 2005–2023. These profiles were applied without normalization to a common annual yield, while the charging-demand profile, installed PV capacity, BESS parameters, and dispatch rules were kept unchanged. All profiles were mapped to the same 8760 h operating calendar, with 29 February omitted in leap years. In each simulation hour, PV generation was routed to the BESS through the MPPT-controlled DC/DC converter. The available PV energy was either supplied through the BESS inverter to cover simultaneous charging demand or stored in the battery, subject to the applicable power and SOC limits. When PV generation and stored energy were insufficient, the remaining charging demand was supplied by the grid. Conversion losses and the sequential evolution of SOC were included, and annual grid import was calculated as the sum of the hourly residual demand. The representative 2015 profile was retained for the main economic assessment, while the multi-year simulations were used to quantify the sensitivity of useful PV contribution and residual grid electricity demand to inter-annual weather variability.
Scenario S.0: Baseline operation
Scenario S.0 represents the reference configuration without BESS or PV. The fast charger is supplied entirely from the grid, and the grid connection is dimensioned to cover the full charging power requirement of 150 kW.
Scenario S.1: Small-scale BESS implementation
Scenario S.1 represents the 136 kWh second-life BESS configuration implemented in the Maribor pilot. The storage system provides 25 kW of support during high-power charging events, reducing the maximum grid-import power from 150 kW to approximately 125 kW. The relatively low power-to-energy ratio limits battery loading, while the system remains predominantly grid-dependent. Energy discharged from the BESS is replenished from the grid, preferentially during lower-cost tariff periods and periods of lower charging demand.
As an additional operating variant, the same 136 kWh BESS was evaluated at a discharge power of 90 kW to illustrate its peak-shaving capability. Under a 150 kW charging load, this can reduce grid-import power to approximately 60 kW. However, this represents more intensive utilisation of the same storage configuration and is therefore not treated as an independent scenario in the economic assessment.
Scenario S.2: Full-scale BESS implementation
Scenario S.2 represents the demand-based full-scale second-life BESS configuration, providing approximately 631 kWh of usable energy and 90 kW of peak-power support. This corresponds to a nominal BESS capacity of approximately 800 kWh and allows the grid-capacity target to be reduced to 60 kW. BESS recharging is prioritised during lower-cost tariff Blocks 3–5 and periods of low charging demand, rather than being restricted to night-time operation.
Scenario S.3: Full-scale BESS with PV implementation
Scenario S.3 combines the full-scale BESS configuration from S.2 with the demand-matched PV system described above. Although annual PV generation is approximately equal to the annual AC-side charging demand, temporal mismatch between generation and consumption results in a residual grid import of approximately 32.0 MWh/year. The grid connection is therefore retained for residual demand and operational backup, while the BESS provides short-term energy shifting and peak-power support.
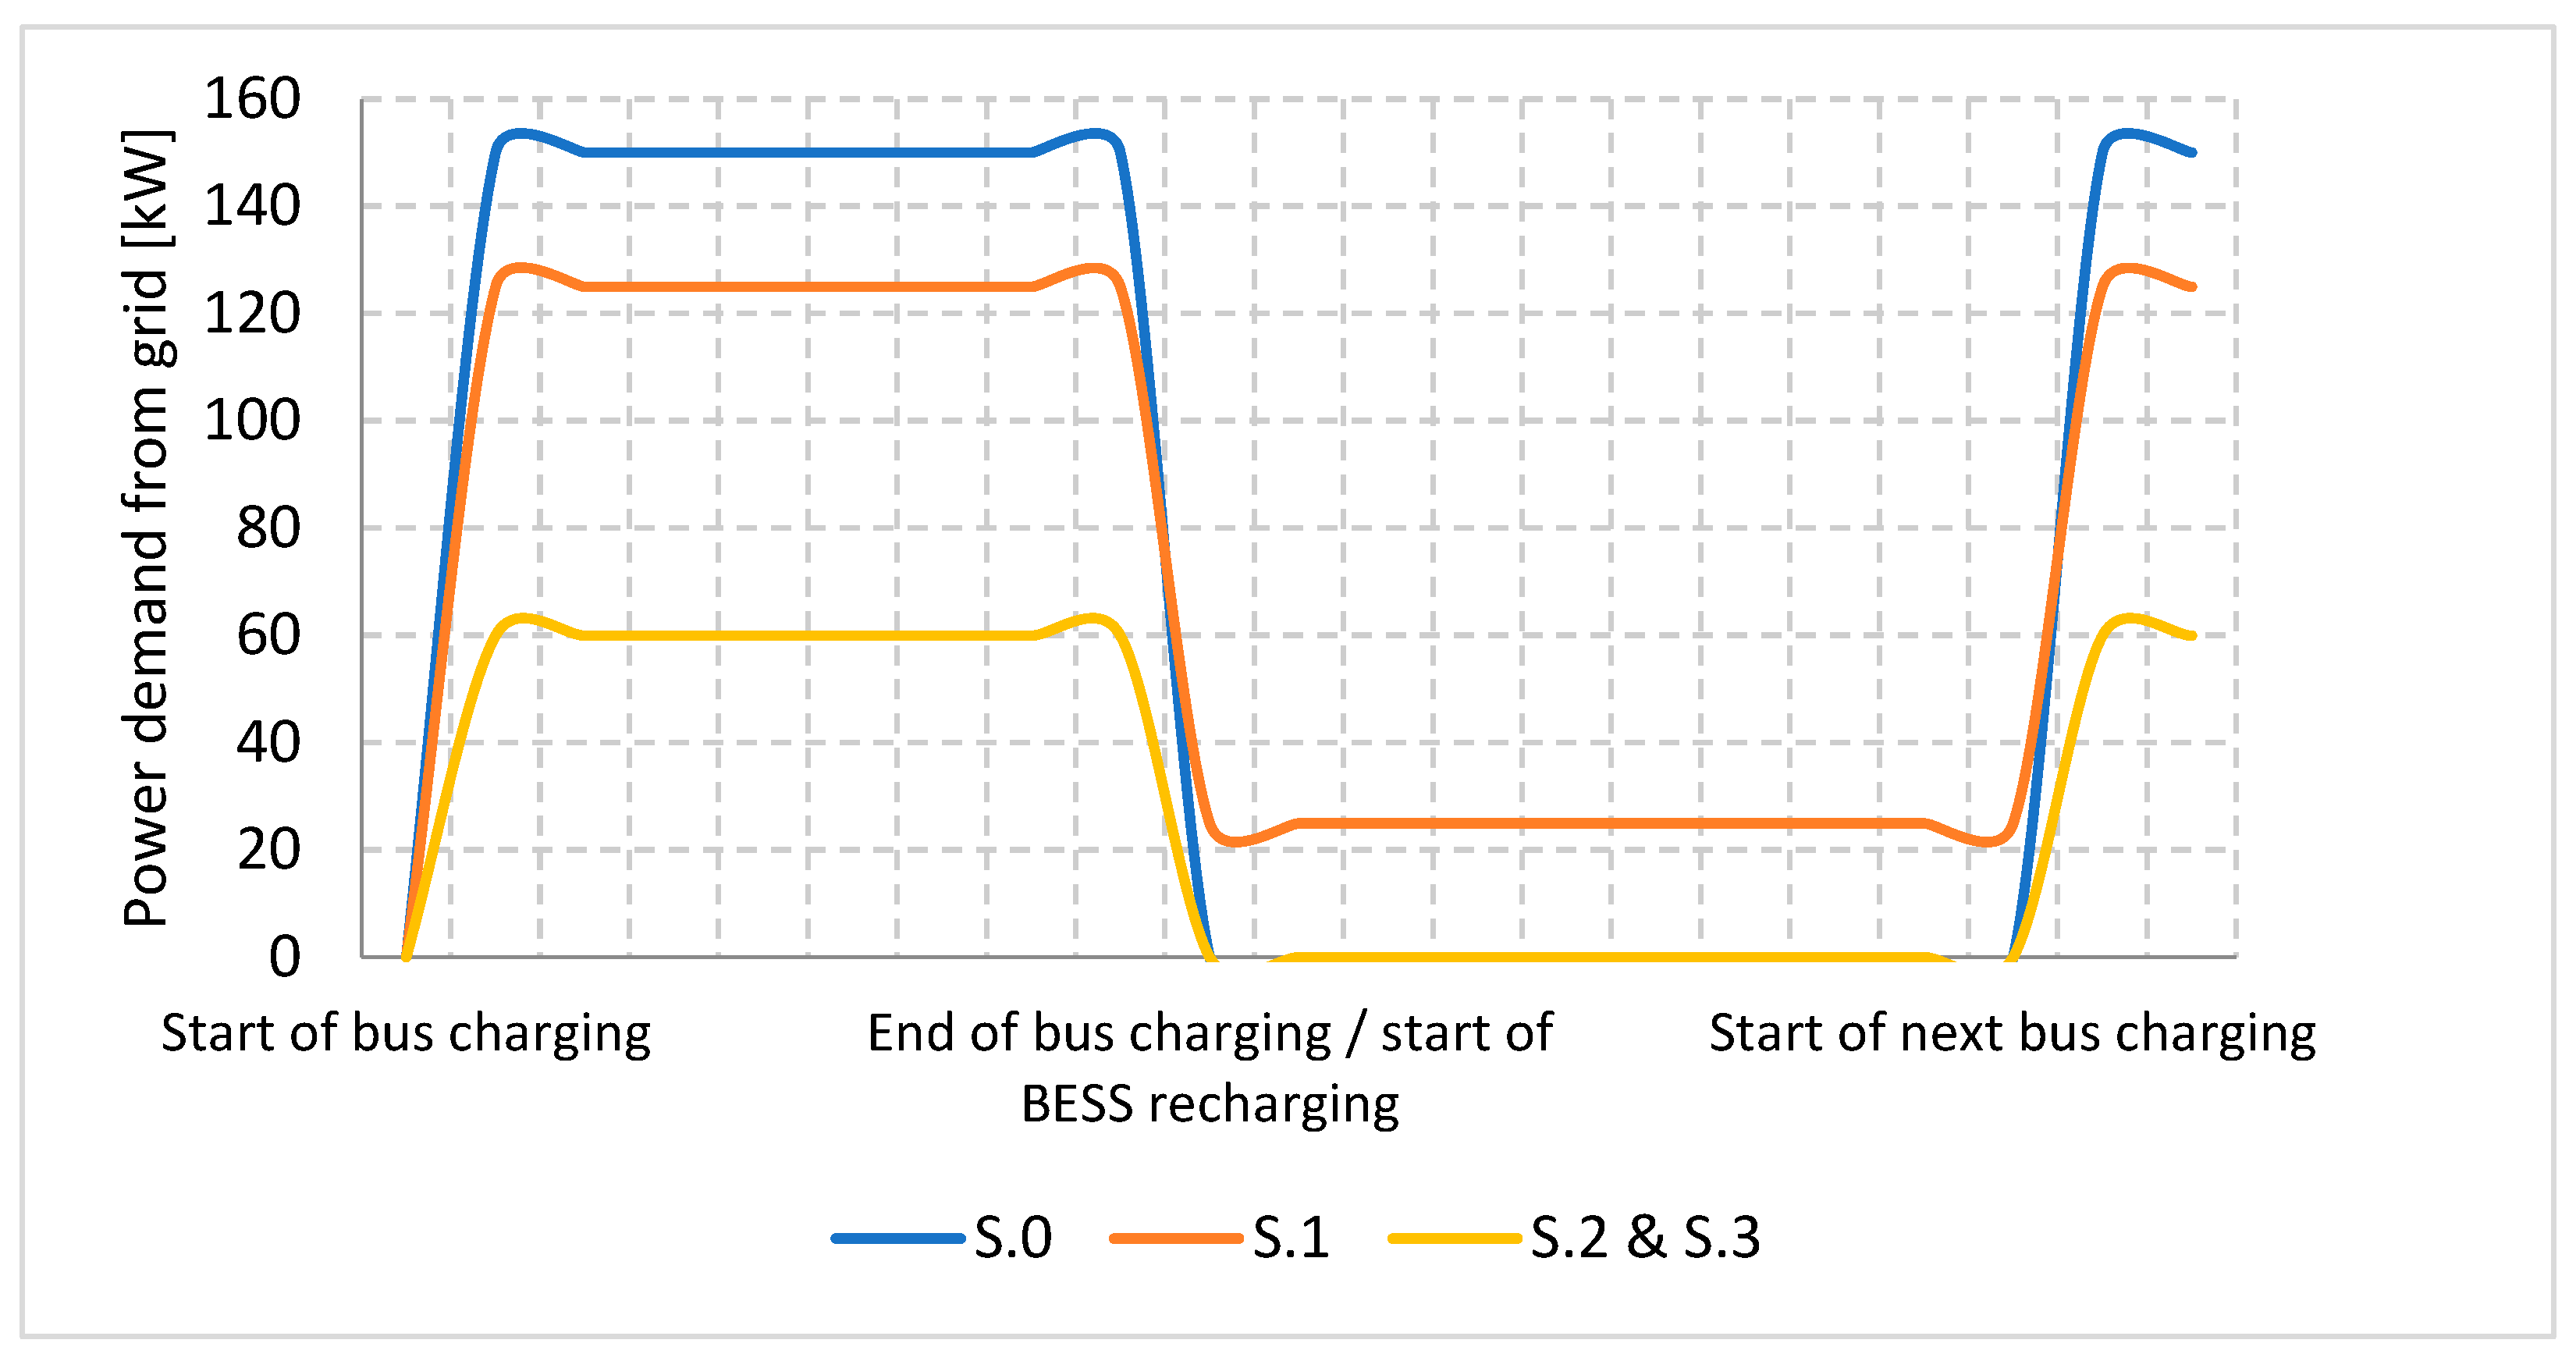
Figure 2 illustrates the resulting grid-power demand during a representative sequence of bus-charging events. In the baseline scenario (S.0), the full charging demand is supplied by the grid, reaching approximately 150 kW. In S.1, the small-scale BESS reduces the peak grid demand to approximately 125 kW; following the charging event, grid demand remains at approximately 20 kW while the BESS is recharged. In S.2 and S.3, the full-scale BESS reduces grid demand during bus charging to approximately 60 kW. Their power profiles overlap in the illustrated sequence because the BESS has sufficient stored energy and immediate grid-based recharging is avoided. In S.2, BESS recharging is shifted to the night-time tariff period, whereas in S.3, it can additionally be supported by available PV generation. For S.3, actual grid demand varies with weather-dependent PV generation; the profile shown therefore represents only the illustrated operating condition.

2.5. Cost Estimation

The cost assessment is based on two main cost components: the initial investment required to implement each BESS scenario, and the annual electricity-related operating costs of the charging site. The initial investment is linked to the technical integration requirements and implementation scope defined for each scenario, whereas the annual electricity-related operating cost is derived from the baseline charging demand, the assumed BESS/PV operating strategy, and the applicable electricity and network-tariff conditions.
All monetary inputs are treated as net values excluding VAT. This applies to investment-cost estimates, electricity supply costs, and network-tariff charges.

2.5.1. Investment-Cost Estimation

Investment costs are estimated according to the implementation scope required for each scenario. The small-scale BESS scenario is based on the project bill of quantities prepared for the pilot implementation. The full-scale BESS and BESS with PV scenarios are derived by adjusting this scope to reflect the higher support function required at the charging site. The investment estimate represents the cost of establishing an operational second-life BESS configuration. The investment level is therefore determined by the way the BESS is configured and integrated: small-scale BESS, full-scale BESS, or full-scale BESS combined with PV generation. The investment estimate is structured into functional cost categories. These categories are used to aggregate detailed bill-of-quantity items into comparable cost groups across the analysed scenarios. The purpose of this classification is to reflect the main technical requirements of second-life BESS implementation without presenting the full project-level bill of quantities in the Section 2.
The investment estimate covers the equipment and works required to establish an operational second-life BESS at the charging site, including battery inspection, diagnostic testing, module screening and reassembly, the inverter, electrical integration, adapted housing, thermal management, fire-protection provisions, monitoring and control configuration, system testing, and installation. It also includes the communication interface between the battery-management system and the hybrid inverter, which represents an important integration requirement because the two systems were not originally designed to operate together. Only the acquisition cost of the second-life battery modules is excluded, while civil works are excluded from the scenario comparison. The investment categories are summarized in Table 3, with the detailed bill of quantities provided in Supplementary File S2. Scenario-specific investment values are reported in the Section 3.
The cost–benefit assessment was performed at two levels. The basic CBA included the initial investment and annual grid-electricity costs, whereas the extended CBA additionally accounted for recurring BESS and PV O&M costs. Annual BESS O&M costs were assumed to equal 2.5% of the BESS-related investment, following Cao et al. [30]. This percentage was applied to grid and charger integration, BESS equipment, housing and installation, and battery monitoring and control integration. For S.3, PV O&M was calculated separately using the fixed annual rate of EUR 9.5/kWp-year reported by Mathews et al. [26]. Accordingly, the annual O&M costs for the scenarios were calculated using Equation (1):
C s , t O M = 0.025 I s B E S S + 9.5 P s , t P V
where C s , t O M represents the annual O&M cost of the BESS and, where applicable, the PV system. I s B E S S is the BESS-related investment and P s , t P V is the installed PV capacity in scenario S.3.

2.5.2. Grid-Electricity Cost Calculation

Annual grid-electricity costs are calculated from the charging-station demand profile, the electricity supply-price input and the Slovenian time-block network-tariff system [31,32,33]. The calculation applies the tariff parameters for user group 1, corresponding to a low-voltage user with measured demand connected to the low-voltage busbar of an MV/LV transformer station. This classification is consistent with the characteristics of the charging-site metering point. The tariff distinguishes between energy-based and capacity-based network charges differentiated by time block, with the updated tariff structure placing greater emphasis on capacity-based charges [34]. The total annual grid-electricity cost in the respective scenarios in the first assessment year is calculated using Equation (2):
C s G =   C s S + C s E + C s P + C s X
where C s G is the annual grid-electricity cost in scenario s , comprising electricity supply cost C s S , energy-based network cost C s E , capacity-based network cost C s P , and excess-capacity cost C s X . The electricity-supply cost is calculated using Equation (3), the energy-based network cost using Equation (4), and the capacity-based network cost using Equation (5):
C s S = m = 1 12 b = 1 5 E s m b G p m b
C s E = m = 1 12 b = 1 5 E s m b G τ b E
C s P = m = 1 12 b = 1 5 P s m b G τ b P
In Equations (3)–(5), m and b denote the month and time block, respectively. E s m b G is the electricity supplied from the grid, p m b is the electricity supply price, and P s m b G is the assigned grid-capacity level. The corresponding energy- and capacity-based network-tariff rates are denoted by τ b E and τ b P , respectively. In the base calculation, C s X = 0 , because the assigned grid-capacity levels are treated as operating limits.
The grid-capacity assumptions are defined in the scenario framework in Table 4: 150 kW in S.0, 125 kW in S.1, and 60 kW in S.2 and S.3. In S.2, BESS recharging is shifted primarily to lower-cost time blocks, whereas grid imports in S.3 are derived from the hourly PV–BESS energy-balance model. The year-1 electricity supply price is set at 0.152 EUR/kWh, based on the Q4 2025 average non-household electricity price in Slovenia excluding VAT [35]. The complete time-block schedule and tariff parameters are provided in Supplementary File S3. Scenario-specific annual grid-electricity costs are presented in the Section 3.

2.6. Cost–Benefit Assessment

The scenario-based CBA combines the initial investment with the annual grid-electricity and, where applicable, O&M costs under each scenario over a 12-year assessment period. The initial investment is assigned to year 0, while recurring costs are accumulated from year 1 to year 12. The cumulative cost under each scenario over the assessment period T is calculated using Equation (6):
C s , T c u m = I s + t = 1 T ( C s , t G + C s , t O M )
where C s , T c u m is the cumulative cost of scenario over the assessment period T , I s is the initial investment cost in the scenario, C s , t G is the annual grid-electricity cost, and C s , t O M is the corresponding annual O&M cost. In the baseline scenario, the I s and C s , t O M are set to zero. The economic performance of each implementation scenario is evaluated by comparing its cumulative cost with that of the baseline scenario. A scenario is considered economically favourable if its cumulative cost falls below the corresponding baseline cumulative cost within the 12-year assessment period. The reference CBA applies a 5% annual increase in grid-electricity costs, while investment costs are assigned to year 0 and O&M costs are held constant. As a robustness check, the calculation was repeated using a 10% annual grid-electricity cost escalation rate to test whether the relative economic performance of the scenarios changes under higher electricity-cost growth. These escalation rates are used to project future nominal electricity expenditures; no separate discount rate is applied, and the reported cumulative costs therefore represent undiscounted nominal cost projections.
The complete methodological workflow, linking the input data, scenario development, technical modelling, cost calculation and economic assessment, is summarized in Figure 3. All hourly energy-balance simulations, tariff calculations and scenario-based cost–benefit calculations were performed using Microsoft Excel.

3. Results

3.1. Representative Hourly Operation of S.2 and S.3

To complement the annual assessment, an additional hourly operational simulation was performed for a representative 24 h design cycle in S.2 and S.3. The charging-demand profile was derived from ten measured working days in February 2026 by calculating the median of the non-zero measured values for each hour and scaling the resulting charger-side profile to the P85 demand of 544 kWh/day. The corresponding AC-side demand was obtained using the measured grid-to-charger efficiency. For S.3, the actual hourly PVGIS-SARAH3 profile whose daily generation was closest to the median of the 365 daily values in 2015 was used. The demand and PV curves therefore represent objectively selected representative profiles rather than concurrent measurements. All technical parameters and control constraints remained as defined for S.2 and S.3. This representative-cycle simulation was used to illustrate hourly operation and did not replace the 8760 h simulations used for the annual energy assessment and CBA.
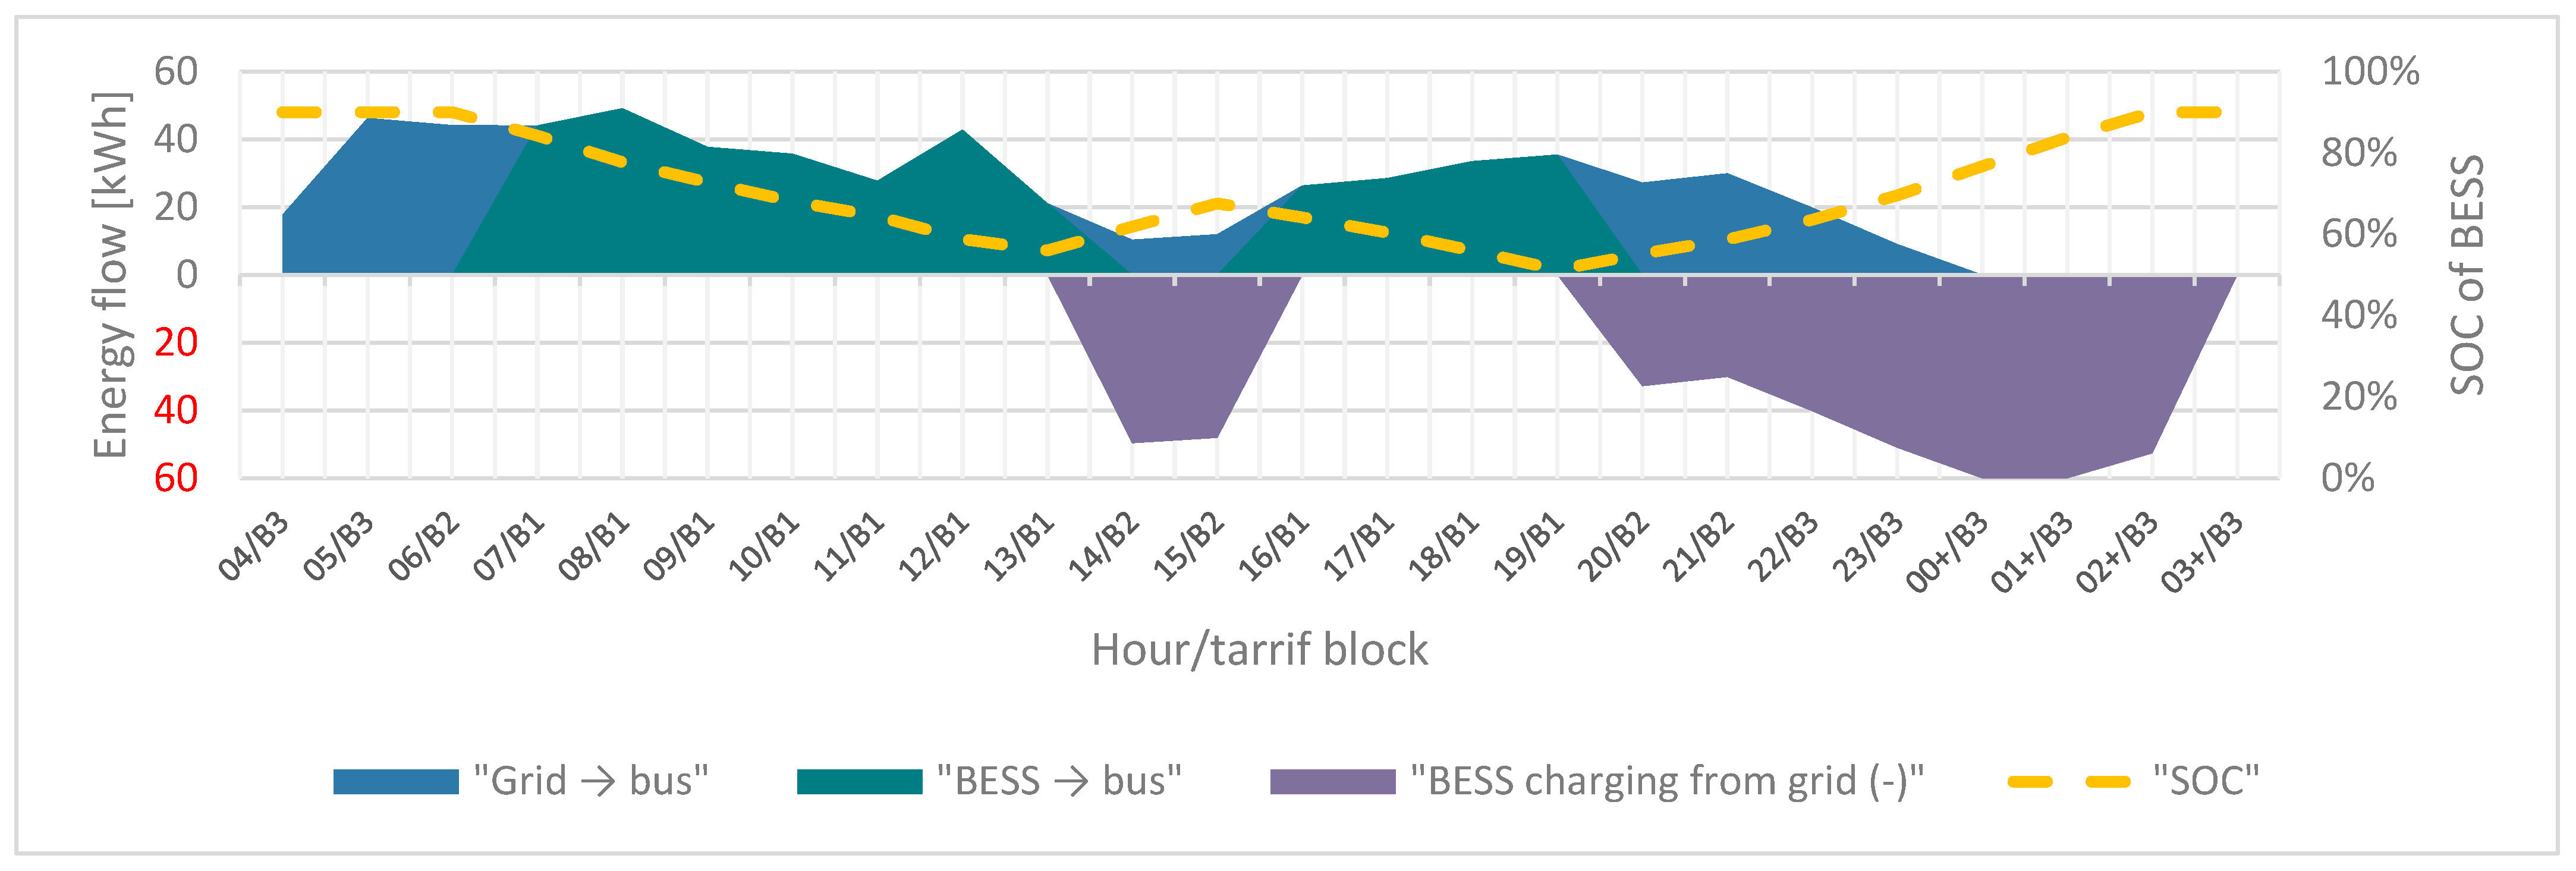
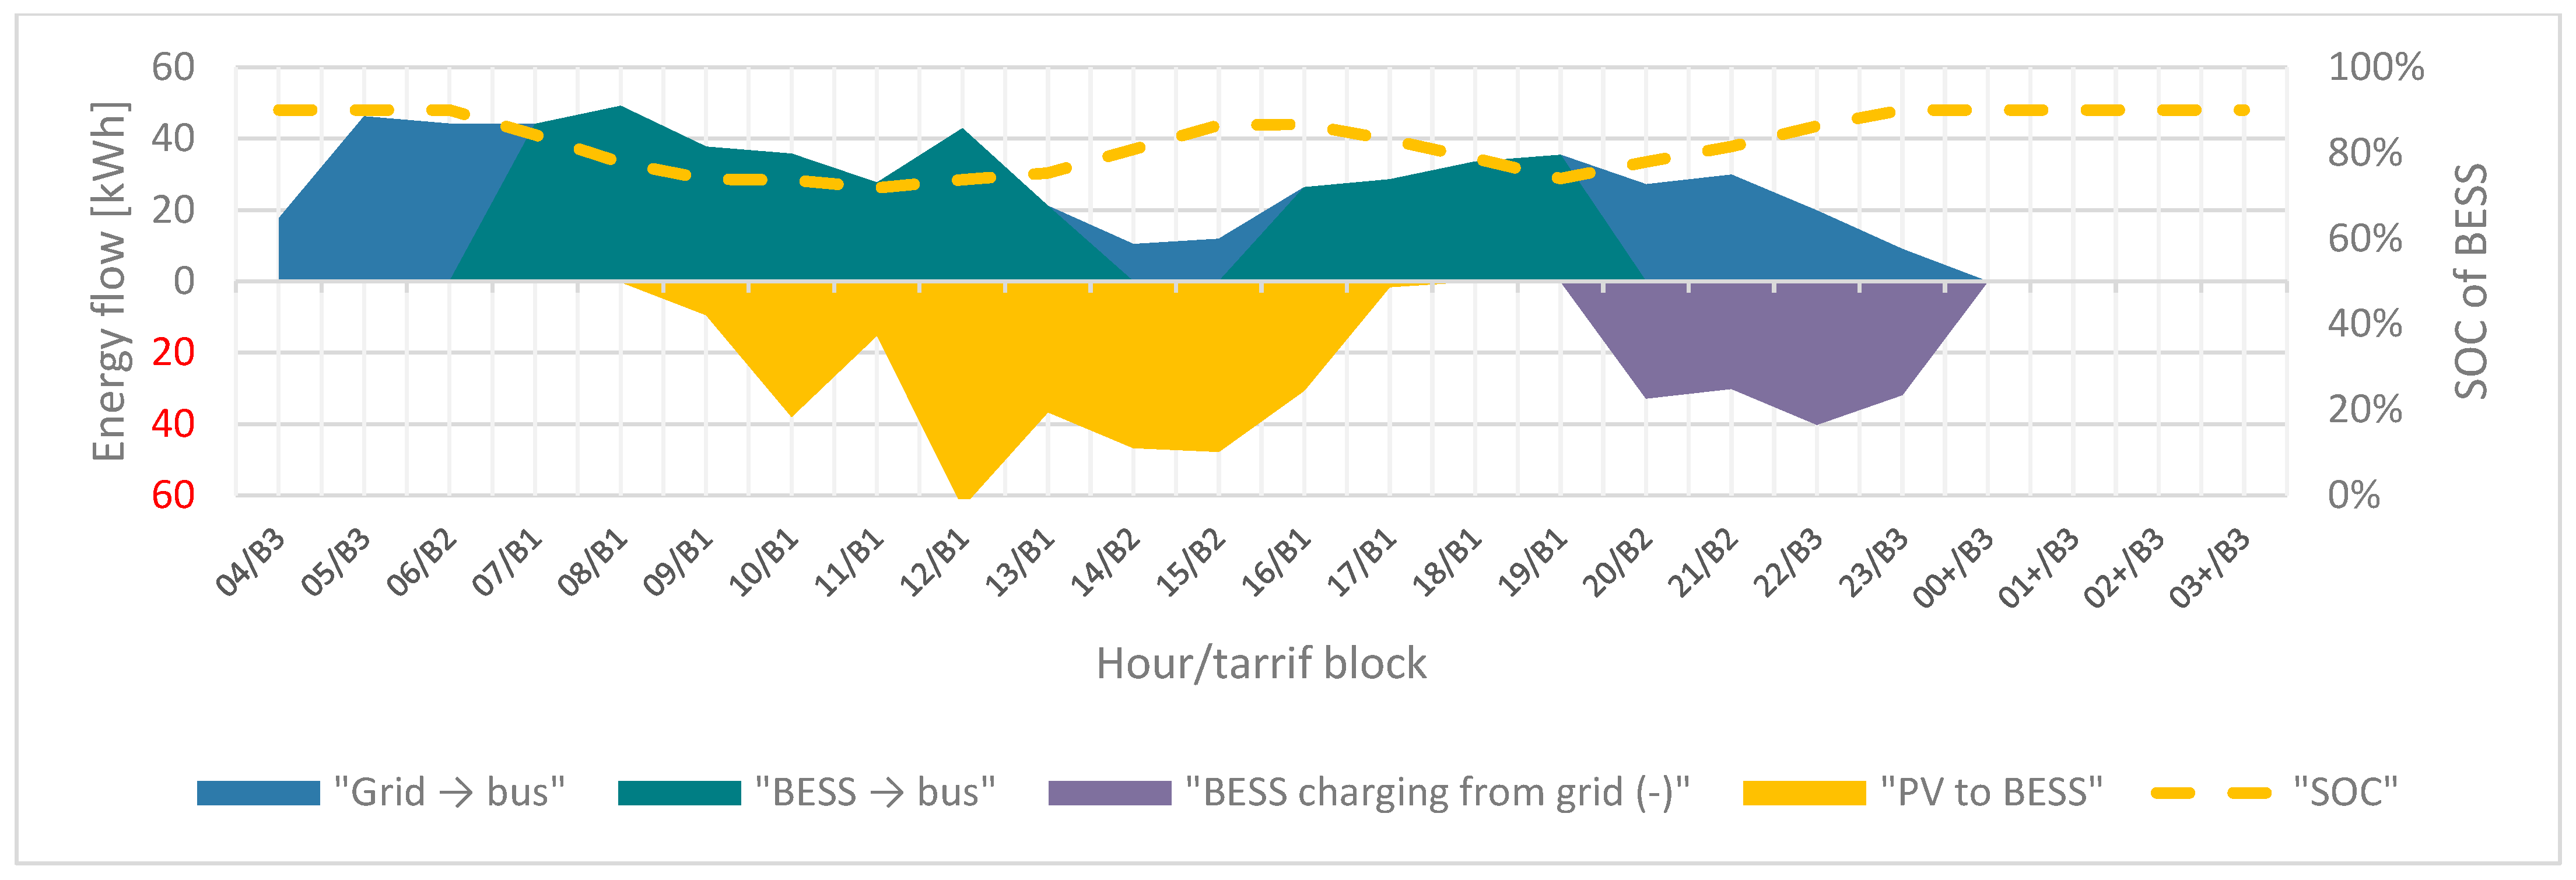
Figure 4 and Figure 5 show the distinct operating patterns of the two full-scale configurations. In both scenarios, the BESS supplies the charging demand during tariff Block 1, avoids direct grid use during the most expensive period, and maintains the hourly grid-import limit of 60 kWh per one-hour interval. In S.2, the absence of PV generation causes SOC to decrease from 90% to 51.3%, after which the BESS is recharged from the grid during lower-cost tariff blocks. In S.3, the available PV generation is routed through the BESS, reducing the required grid recharging and maintaining a higher minimum SOC of 71.8%. Both scenarios return to an SOC of 90% by the end of the cycle, confirming that the initially stored energy is restored rather than treated as a free energy input. PV integration reduces total grid import for the representative cycle from 640.7 kWh in S.2 to 351.2 kWh in S.3, corresponding to a reduction of 45.2%.

3.2. CBA Analysis

The scenario-based CBA results are presented in Table 5. The investment-cost inputs are based on the scenario-specific implementation-cost estimates presented in Supplementary File S2, while the first-year grid-electricity costs are derived from the network-tariff and grid-electricity allocation calculation presented in Supplementary File S3. The cumulative 12-year costs include the initial investment, grid-electricity costs, and annual O&M costs. Grid-electricity costs are assumed to increase by 5% annually in the reference case, while annual O&M costs remain constant. The year-by-year calculation is provided in Supplementary File S4.
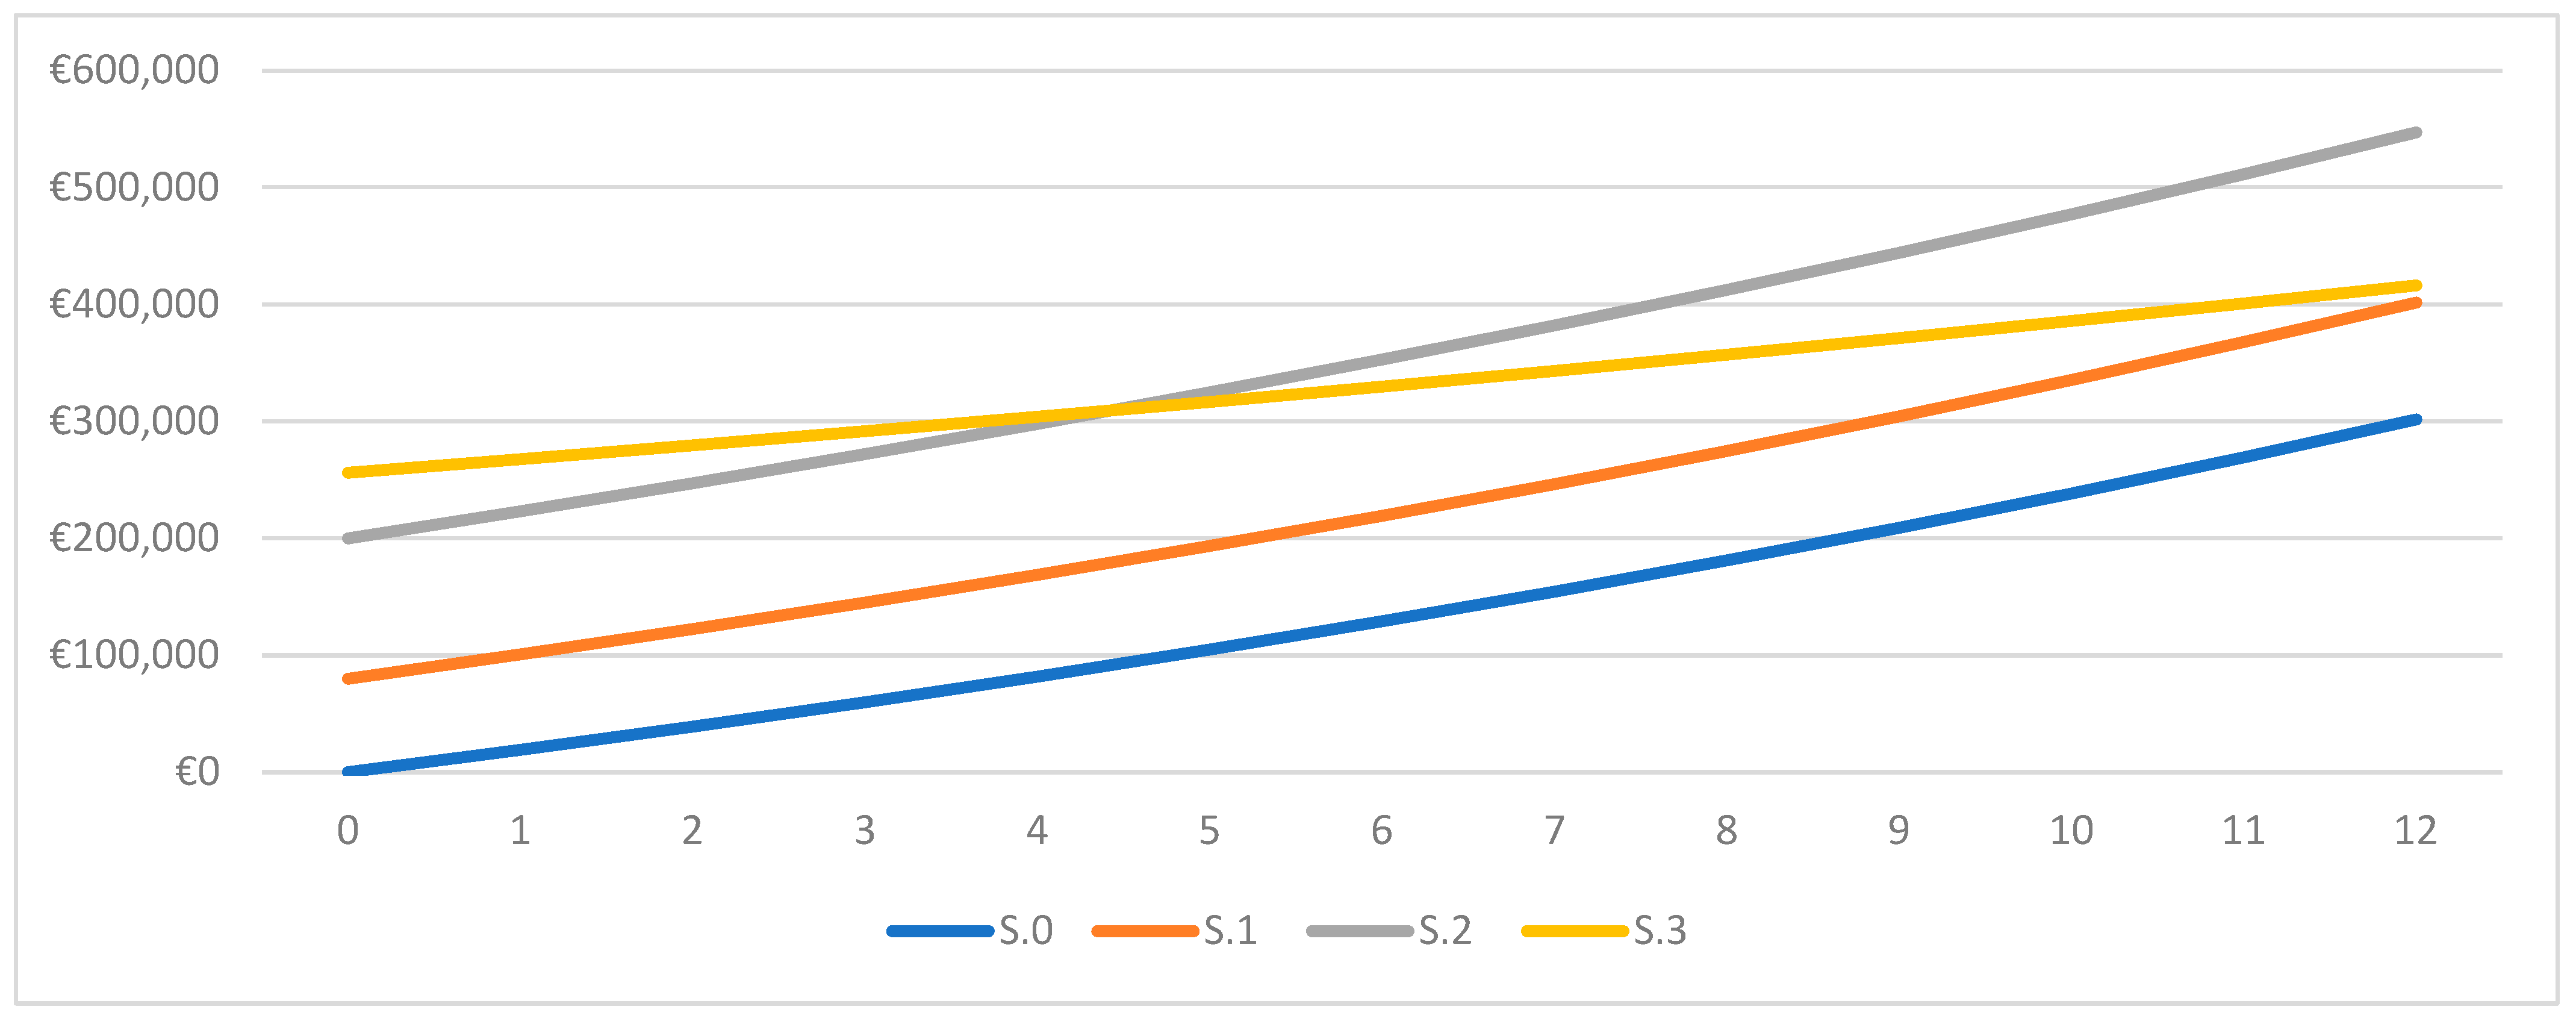
Table 5 shows that the BESS-only scenarios achieve relatively small reductions in grid-electricity costs. Compared with the baseline first-year cost of approximately EUR 18,900/year, S.1 reduces the grid-electricity cost by about EUR 200/year, equivalent to 1.3% based on the unrounded values. S.2 reduces it by approximately EUR 900/year, equivalent to 4.8%. These reductions are small relative to the respective investment costs of EUR 80,000 and EUR 200,000 and are further offset by annual O&M costs. Consequently, neither BESS-only scenario reaches break-even within the 12-year assessment period. After 12 years, the cumulative cost of S.1 amounts to approximately EUR 401,700, about EUR 100,200 above the baseline. S.2 performs least favourably, reaching approximately EUR 547,100, or about EUR 245,500 above S.0. The additional investment required for stronger BESS-supported peak shaving is therefore not compensated by the resulting reduction in grid-electricity costs within the considered assessment period. S.3 achieves a substantially larger reduction in grid-electricity costs due to the combined contribution of PV generation and the BESS. Its first-year grid-electricity cost decreases to approximately EUR 5600/year, corresponding to a reduction of about 70% relative to S.0. However, the scenario requires an initial investment of EUR 256,000 and incurs annual O&M costs of approximately EUR 5900. When O&M is included, the first-year operating-cost saving relative to S.0 is approximately EUR 7400. Although these savings increase as grid-electricity costs escalate, they are insufficient to recover the initial investment within the 12-year assessment period. At the end of year 12, the cumulative cost of S.3 is approximately EUR 416,300, about EUR 114,800 higher than the baseline.
Figure 6 illustrates the cumulative cost development over the 12-year assessment period, including O&M costs. S.1 and S.2 remain above the baseline throughout the entire period. The cumulative cost of S.3 also remains above S.0, although the difference progressively decreases as the lower annual operating costs begin to compensate for the higher initial investment. By year 12, the annual operating-cost advantage of S.3 relative to S.0 reaches approximately EUR 16,900/year. If the same assumptions are extrapolated beyond the defined assessment horizon, S.3 reaches cumulative break-even relative to S.0 in approximately year 18 under the representative 2015 PV profile. Across the 19 annual PVGIS profiles, residual grid import ranges from 27.9 MWh/year in the favourable 2022 case (−13.0% relative to 2015) to 41.0 MWh/year in the unfavourable 2013 case (+28.0% relative to 2015). The residual grid import obtained with the representative 2015 profile, 32.0 MWh/year, is close to the multi-year median of 32.8 MWh/year. Repeating the favourable or unfavourable boundary profile throughout the cost-assessment period shifts the projected break-even to approximately year 17 or year 20, respectively. None of the considered PV-weather cases reaches break-even within the defined 12-year assessment period. These extended results indicate the potential influence of inter-annual PV variability on the longer-term cost trajectory but do not alter the assessment horizon used for the CBA.
As an additional sensitivity check, the CBA was recalculated assuming a 10% annual increase in grid-electricity costs, while keeping the investment and O&M assumptions unchanged. Under this assumption, neither S.1 nor S.2 reaches break-even within the 12-year assessment period. S.3 also remains above the baseline at the end of year 12, although the difference decreases to approximately EUR 42,000. Extending the calculation beyond the assessment horizon indicates break-even for S.3 in approximately year 14. The sensitivity analysis therefore confirms the main economic conclusion of the reference case: among the investment scenarios, S.3 provides the strongest potential for longer-term cost recovery, whereas BESS-only peak shaving does not compensate for the required investment within the considered assessment period.
Assessment of battery-ageing sensitivity shows that, at the end of the 12-year assessment period, the favourable (1% annual capacity fade) and unfavourable (3% annual capacity fade) cases result in usable capacities of 97.5 and 76.3 kWh in S.1 and 558 and 437 kWh in S.2 and S.3, respectively. These capacities remain sufficient for the principal peak-support function of each scenario. In the full-scale configurations, the eight-hour night-time period allows up to approximately 455 kWh to be stored after charging losses. This night-time charging potential remains unchanged in the favourable case. To meet the design-day BESS throughput, the unfavourable case requires approximately 193 kWh of intermediate daytime recharging, compared with 175 kWh in the no-ageing reference case. This additional requirement can be accommodated during low-demand periods falling within the lower-cost tariff Blocks 3–5.

4. Discussion

4.1. Interpretation of the Scenario-Based CBA

The results show that second-life BESS deployment at the analysed fast-charging site is not economically justified by peak shaving alone. Scenarios S.1 and S.2 reduce the power drawn from the grid during bus charging and enable part of the grid consumption to be shifted to more favourable tariff periods, but they do not materially reduce annual grid-electricity demand. Consequently, the resulting operating-cost savings are insufficient to compensate for the required investment and O&M costs within the 12-year assessment period. An important finding is that the economic effect of peak shaving is not proportional to the technical reduction in grid power. The pilot-scale BESS considered in S.1 can be operated more aggressively to temporarily reduce grid demand during a charging event from approximately 150 kW to around 60 kW. However, this substantial technical reduction produces only a limited additional economic benefit, since the discharged energy must subsequently be replenished from the grid and the monetary value of peak reduction depends strongly on the applicable network tariff and the timing of grid use. Thus, technically effective peak shaving does not necessarily imply economic viability. This is particularly relevant for BESS sizing, as increasing storage and power-conversion capacity to achieve lower grid-power limits may substantially increase investment costs without generating proportional tariff savings. Nevertheless, BESS-based peak shaving may have greater economic value where the grid connection is physically constrained, where grid reinforcement can be avoided or deferred, or where capacity-related network charges are higher. Previous studies have similarly demonstrated the technical potential of BESS for supporting high-power electric-bus charging [1,2,3,4,5,6], while the present results highlight the importance of evaluating the economic value of this technical capability under site-specific conditions.
Scenario S.3 introduces a different economic mechanism by combining BESS operation with local PV generation. The PV system was sized to approximately match the annual grid-side electricity demand, resulting in an installed capacity of approximately 92.4 kWp and a required module area of approximately 420 m2. In this scenario, although estimated annual PV generation is approximately 110 MWh, temporal mismatch between generation and charging demand, together with BESS operating constraints and losses, limits the useful PV contribution to approximately 78.5 MWh/year, leaving approximately 32 MWh/year to be supplied from the grid. This substantially reduces grid-energy dependence and provides a much stronger operating-cost reduction than peak shaving alone. Nevertheless, when investment and O&M costs are included, S.3 does not reach break-even within the 12-year assessment period. Under the reference 5% grid-electricity cost escalation assumption, extrapolation beyond the assessment horizon indicates break-even in approximately year 18. The results therefore show that PV integration considerably strengthens the economic case for second life BESS but is not sufficient to recover the investment within the adopted assessment horizon under the reference assumptions.
The favourable and unfavourable PV-weather cases produce different energy and cost trajectories; however, projecting either boundary profile as recurring throughout the entire assessment period would not represent realistic inter-annual weather variability. The analysis of all 19 PVGIS profiles confirms substantial year-to-year variation. The residual grid import obtained with the 2015 profile, 32.0 MWh/year, is close to the multi-year median of 32.8 MWh/year, while its annual specific PV yield also most closely matches the long-term value adopted for PV sizing. The 2015 profile was therefore retained as an intermediate representative case for the main 8760 h annual simulation and CBA.

4.2. Relevance for Second-Life BESS Deployment

These results add an economic perspective to a field in which the functional and circular-economy relevance of second-life batteries is already well established. Previous studies and reviews show that second-life batteries can support stationary storage, renewable-energy integration, peak shaving, and charging infrastructure while extending battery lifetime before recycling [8,9,10,11,12]. The present case study complements these findings by demonstrating that technical effectiveness and economic viability should be considered separately. In the Maribor case, the second-life battery modules are treated as available assets, reducing the battery-acquisition burden. However, a functional stationary BESS still requires power electronics, housing, protection, thermal management, monitoring, communication, control, and integration with the grid and charging infrastructure. These balance-of-system costs can therefore prevent even a technically effective peak-shaving solution from becoming economically attractive.
The ageing analysis indicates that capacity fade reduces the available energy buffer but does not alter the technical feasibility or principal function of the evaluated BESS scenarios within the 12-year assessment period. This result is consistent with the good initial condition of the repurposed modules (SOH above 95%), their comparatively moderate expected stationary operating profile, and the system configuration and operating strategy intended to limit battery stress. Nevertheless, the ageing assessment was limited to cumulative usable-capacity fade and did not explicitly represent cycle-dependent degradation, changes in efficiency or power capability, or possible battery replacement. These effects could particularly influence the amount of PV energy that can be shifted in S.3 and should therefore be examined in a more detailed lifetime assessment.
In addition, participation in grid-balancing services could provide an additional revenue stream and improve the economic performance of the BESS scenarios. However, establishing such a system would require coordination among the charging-site operator, the BESS technology provider, the relevant network operators, and market participants or aggregators. It would also require technical qualification, suitable metering and communication infrastructure, contractual arrangements and, depending on the service provided, possible modifications to the grid connection. Since this technical and organisational framework was not defined within the present study, the associated revenues could not be quantified and were excluded from the CBA. Their potential contribution is acknowledged as an area for future assessment.
Overall, the present findings suggest that the economic case for second-life BESS depends strongly on the context in which storage is deployed. Where peak reduction avoids grid reinforcement or attracts substantial capacity-related savings, peak shaving itself may provide greater economic value; otherwise, integration with local renewable generation can provide a stronger savings mechanism. Although the present case concerns battery-electric buses, the same principles apply to other externally charged electric vehicles with comparable charging requirements. Transferability therefore depends primarily on charging profiles, grid constraints, tariff structure, and local generation opportunities rather than on a particular vehicle technology.

5. Conclusions

This paper assessed the economic justification of second-life BESS deployment at an electric-bus fast-charging site by comparing BESS-only peak-shaving configurations with a BESS–PV configuration over a 12-year assessment period. Under the analysed site and tariff conditions, BESS-only deployment is not economically justified. A central finding is that the economic benefit of peak shaving is not proportional to its technical effectiveness; even a temporary reduction in grid demand from approximately 150 kW to around 60 kW produces relatively limited cost savings. Consequently, technically successful peak shaving should not by itself be interpreted as evidence of economic viability.
In this study, the strongest economic performance was achieved when BESS was combined with the annual-demand-matched 92.4 kWp PV system. By reducing annual grid-energy dependence in addition to grid-power exposure, S.3 provides substantially greater operating-cost savings than the BESS-only scenarios. Nevertheless, after including investment and O&M costs, it does not reach break-even within the 12-year assessment horizon. Under the reference 5% electricity-cost escalation assumption, the same cost trajectory indicates break-even in approximately year 18. The 19-year PV-weather sensitivity shifts the extrapolated break-even of S.3 between approximately years 17 and 20, while none of the considered weather cases reaches break-even within the 12-year assessment period. Under the alternative assumption of a 10% annual increase in grid-electricity costs, the projected break-even occurs in approximately year 14. The results therefore indicate that the economic value of second-life BESS is determined by the interaction between storage operation, tariff structure, grid constraints, and local renewable generation rather than by peak-shaving capability alone.
Battery ageing was represented through favourable and unfavourable usable-capacity-fade boundary cases. The resulting capacities remained sufficient for the principal peak-support function of all evaluated BESS scenarios over the 12-year assessment period. However, cycle-resolved degradation, changes in battery efficiency and power capability, and possible battery replacement were not explicitly modelled. The analysis also excludes financing, discounting, residual value, and potential revenues from grid-balancing services. Future work should therefore examine these effects together with more detailed operational behaviour and alternative tariff, grid-constraint, and market-access conditions.

Supplementary Materials

The following supporting information can be downloaded at: https://www.mdpi.com/article/10.3390/en19174092/s1. Table S1: Hourly distribution of charging-energy demand at the analysed terminal during the February 2026 measurement period. Table S2: Projected monthly charger-side energy demand used for the annual energy and cost assessment. Table S3: Investment-cost breakdown by scenario. Table S4: PV sizing and investment input breakdown for Scenario S.3. Table S5: Applied network-tariff values for user group 1 (validity from 1 July 2024). Table S6: Time-block shares used for annual grid-electricity allocation by scenario. Table S7: Annual grid-electricity allocation by time block and scenario. Table S8: First-year grid-electricity cost components by scenario. Table S9: Annual grid-electricity cost by year under the 5% reference escalation case. Table S10: Cumulative CBA by year under the 5% reference escalation case. Figure S1: Time-block schedule by season and day type. Figure S2: Time-block distribution by season, day type and hours (24-h format).

Author Contributions

Conceptualization, D.H., and S.T.; Methodology, D.H., and S.T.; Software D.H.; Validation, D.H. and S.T.; Formal analysis, D.H. and S.T.; Investigation, D.H., and S.T.; Resources, D.H.; Data curation, D.H. and S.T.; Writing—original draft preparation, D.H.; Writing—Review and Editing, S.T.; Visualization, D.H.; Supervision, S.T.; Project administration, D.H.; Funding acquisition, S.T. All authors have read and agreed to the published version of the manuscript.

Funding

This research received no external funding.

Data Availability Statement

The original contributions presented in this study are included in the article/Supplementary Material. Further inquiries can be directed to the corresponding author.

Acknowledgments

The authors acknowledge the support of the Interreg Central Europe project CE4CE. The Maribor pilot activities provided the technical and operational basis for the case-study analysis presented in this paper.

Conflicts of Interest

The authors declare no conflicts of interest.

Abbreviations

The following abbreviations are used in this manuscript:
ACAlternating current
BESSBattery energy storage system
BMSBattery management system
CBACost–benefit assessment
DCDirect current
LTOLithium titanate oxide
MV/LVMedium-voltage/low-voltage
MPPTMaximum power point tracking
NMCNickel manganese cobalt
O&MOperation and maintenance
PVPhotovoltaic
SOCState of charge
SOHState of health
VATValue-added tax

References

  1. Yan, Y.; Wang, H.; Jiang, J.; Zhang, W.; Bao, Y.; Huang, M. Research on Configuration Methods of Battery Energy Storage System for Pure Electric Bus Fast Charging Station. Energies 2019, 12, 558. [Google Scholar] [CrossRef] [Scilit]
  2. Ding, H.; Hu, Z.; Song, Y. Value of the Energy Storage System in an Electric Bus Fast Charging Station. Appl. Energy 2015, 157, 630–639. [Google Scholar] [CrossRef] [Scilit]
  3. Ding, X.; Zhang, W.; Wei, S.; Wang, Z. Optimization of an Energy Storage System for Electric Bus Fast-Charging Station. Energies 2021, 14, 4143. [Google Scholar] [CrossRef] [Scilit]
  4. Trocker, F.; Teichert, O.; Gallet, M.; Ongel, A.; Lienkamp, M. City-Scale Assessment of Stationary Energy Storage Supporting End-Station Fast Charging for Different Bus-Fleet Electrification Levels. J. Energy Storage 2020, 32, 101794. [Google Scholar] [CrossRef] [Scilit]
  5. Paternost, R.F.P.; Diab, I.; Mouli, G.R.C.; Ricco, M.; Bauer, P.; Grandi, G. Stationary Energy Storage Solutions and Power Management for Bus Fleet Electrification in Congested Grid Areas. IEEE Access 2024, 12, 140211–140222. [Google Scholar] [CrossRef] [Scilit]
  6. Polat, H.; Hosseinabadi, F.; Hasan, M.M.; Chakraborty, S.; Geury, T.; El Baghdadi, M.; Wilkins, S.; Hegazy, O. A Review of DC Fast Chargers with BESS for Electric Vehicles: Topology, Battery, Reliability Oriented Control and Cooling Perspectives. Batteries 2023, 9, 121. [Google Scholar] [CrossRef] [Scilit]
  7. Bao, Y.; Luo, Y.; Zhang, W.; Huang, M.; Wang, L.Y.; Jiang, J. A Bi-Level Optimization Approach to Charging Load Regulation of Electric Vehicle Fast Charging Stations Based on a Battery Energy Storage System. Energies 2018, 11, 229. [Google Scholar] [CrossRef] [Scilit]
  8. Gharebaghi, M.; Rezaei, O.; Li, C.; Wang, Z.; Tang, Y. A Survey on Using Second-Life Batteries in Stationary Energy Storage Applications. Energies 2025, 18, 42. [Google Scholar] [CrossRef] [Scilit]
  9. Gu, X.; Bai, H.; Cui, X.; Zhu, J.; Zhuang, W.; Li, Z.; Hu, X.; Song, Z. Challenges and Opportunities for Second-Life Batteries: Key Technologies and Economy. Renew. Sustain. Energy Rev. 2024, 192, 114191. [Google Scholar] [CrossRef] [Scilit]
  10. European Parliament; Council of the European Union. Regulation (EU) 2023/1542 of the European Parliament and of the Council of 12 July 2023 concerning batteries and waste batteries, amending Directive 2008/98/EC and Regulation (EU) 2019/1020 and repealing Directive 2006/66/EC. Off. J. Eur. Union 2023, L191, 1–117. [Google Scholar]
  11. Al-Alawi, M.K.; Cugley, J.; Hassanin, H. Techno-Economic Feasibility of Retired Electric-Vehicle Batteries Repurpose/Reuse in Second-Life Applications: A Systematic Review. Energy Clim. Change 2022, 3, 100086. [Google Scholar] [CrossRef] [Scilit]
  12. Akram, M.N.; Abdul-Kader, W. Repurposing Second-Life EV Batteries to Advance Sustainable Development: A Comprehensive Review. Batteries 2024, 10, 452. [Google Scholar] [CrossRef] [Scilit]
  13. Bobba, S.; Mathieux, F.; Ardente, F.; Blengini, G.A.; Cusenza, M.A.; Podias, A.; Pfrang, A. Life Cycle Assessment of Repurposed Electric Vehicle Batteries: An Adapted Method Based on Modelling Energy Flows. J. Energy Storage 2018, 19, 213–225. [Google Scholar] [CrossRef] [Scilit]
  14. Bazzi, A.; El Hafdaoui, H.; Khallaayoun, A.; Mehta, K.; Ouazzani, K.; Zörner, W. Optimization Model of Hybrid Renewable Energy Generation for Electric Bus Charging Stations. Energies 2024, 17, 53. [Google Scholar] [CrossRef] [Scilit]
  15. He, J.; Yan, N.; Zhang, J.; Chen, L.; Tang, T. Capacity Configuration Optimization for Battery Electric Bus Charging Station’s Photovoltaic Energy Storage System. J. Cent. South Univ. 2023, 30, 4268–4284. [Google Scholar] [CrossRef] [Scilit]
  16. Kamath, D.; Shukla, S.; Arsenault, R.; Kim, H.C.; Anctil, A. Economic and Environmental Feasibility of Second-Life Lithium-Ion Batteries as Fast-Charging Energy Storage. Environ. Sci. Technol. 2020, 54, 6878–6887. [Google Scholar] [CrossRef] [Scilit] [PubMed]
  17. Song, Z.; Nazir, M.S.; Cui, X.; Hiskens, I.A.; Hofmann, H. Benefit Assessment of Second-Life Electric Vehicle Lithium-Ion Batteries in Distributed Power Grid Applications. J. Energy Storage 2022, 56, 105939. [Google Scholar] [CrossRef] [Scilit]
  18. Wei, R.; Wang, Y.; Zhou, F.; Chen, X.; Chai, B.; Liu, J.; Wang, Y.; Jin, H. Energy Management for Electric Bus Charging Station with Facilitated Second-Life Batteries. Renew. Energy 2025, 241, 122363. [Google Scholar] [CrossRef] [Scilit]
  19. Franco, S.E.; Wang, J.; Shirkoohi, M.G.; Chen, Q.; Mérida, W. Public Transit Electrification Planning with Energy Storage via Second-Life Batteries—A Stochastic Programming Approach. Appl. Energy 2025, 401, 126868. [Google Scholar] [CrossRef] [Scilit]
  20. Xu, W.; Guo, W.; Gao, K.; Yang, C.; Shangguan, Y.; Yin, Y.; Yao, W.; Jin, S. Echelon Utilization of Retired Electric Bus Batteries: Economic and Environmental Potential. Transp. Res. Part E Logist. Transp. Rev. 2026, 209, 104778. [Google Scholar] [CrossRef] [Scilit]
  21. Gao, W.; Cao, Z.; Kurdkandi, N.V.; Fu, Y.; Mi, C. Evaluation of the second-life potential of the first-generation Nissan Leaf battery packs in energy storage systems. eTransportation 2024, 20, 100313. [Google Scholar] [CrossRef] [Scilit]
  22. Wikner, E.; Björklund, E.; Fridner, J.; Brandell, D.; Thiringer, T. How the utilised SOC window in commercial Li-ion pouch cells influence battery ageing. J. Power Sources Adv. 2021, 8, 100054. [Google Scholar] [CrossRef] [Scilit]
  23. Janota, L.; Králík, T.; Knápek, J. Second Life Batteries Used in Energy Storage for Frequency Containment Reserve Service. Energies 2020, 13, 6396. [Google Scholar] [CrossRef] [Scilit]
  24. Xu, B.; Diao, W.; Wen, G.; Choe, S.Y.; Kim, J.; Pecht, M. Decoupling the thermal and non-thermal effects of discharge C-rate on the capacity fade of lithium-ion batteries. J. Power Sources 2021, 510, 230390. [Google Scholar] [CrossRef] [Scilit]
  25. Geslin, A.; Xu, L.; Ganapathi, D.; Moy, K.; Chueh, W.C.; Onori, S. Dynamic cycling enhances battery lifetime. Nat. Energy 2025, 10, 172–180. [Google Scholar] [CrossRef] [Scilit]
  26. Mathews, I.; Xu, B.; He, W.; Barreto, V.; Buonassisi, T.; Peters, I.M. Technoeconomic model of second-life batteries for utility-scale solar considering calendar and cycle aging. Appl. Energy 2020, 269, 115127. [Google Scholar] [CrossRef] [Scilit]
  27. Figgener, J.; van Ouwerkerk, J.; Haberschusz, D.; Bors, J.; Woerner, P.; Mennekes, M.; Hildenbrand, F.; Hecht, C.; Kairies, K.-P.; Wessels, O.; et al. Multi-Year Field Measurements of Home Storage Systems and Their Use in Capacity Estimation. Nat. Energy 2024, 9, 1438–1447. [Google Scholar] [CrossRef] [Scilit]
  28. European Commission, Joint Research Centre. Photovoltaic Geographical Information System—PVGIS 5 User Manual. Available online: https://joint-research-centre.ec.europa.eu/photovoltaic-geographical-information-system-pvgis_en (accessed on 26 May 2025).
  29. World Bank Group. Global Solar Atlas. Available online: https://globalsolaratlas.info/ (accessed on 26 May 2025).
  30. Cao, Z.; Vosoughi Kurdkandi, N.; Mi, C. Techno-Economic and Environmental Viability of Second-Life EV Batteries in Commercial Buildings: An Analysis Using Real-World Data. Batteries 2025, 11, 412. [Google Scholar] [CrossRef] [Scilit]
  31. Energy Agency. Network Charge Tariff Items. Slovenian Agency for Energy. Available online: https://www.agen-rs.si/ (accessed on 10 March 2026).
  32. Legal Information System of the Republic of Slovenia. Act on the Methodology for Charging Network Charges for Electricity Operators. 2024. Available online: https://pisrs.si/pregledPredpisa?id=AKT_1266 (accessed on 10 March 2026).
  33. SODO. New Network Charge Billing System. Electricity Distribution System Operator. Available online: https://sodo.si/nov-obracun-omreznine (accessed on 10 March 2026).
  34. URO. Network Charge Calculation. User Information Portal for the Network Charge Reform. Available online: https://www.uro.si (accessed on 10 March 2026).
  35. Statistical Office of the Republic of Slovenia. Prices of Energy Sources, 4th Quarter 2025. Available online: https://www.stat.si/StatWeb/en/News/Index/14213 (accessed on 28 May 2026).
Figure 1. Block diagram of the parallel hybrid grid-BESS(-PV) configuration.
Energies 19 04092 g001
Figure 2. Schematic representation of grid-power demand and peak-shaving operation under the considered scenarios.
Energies 19 04092 g002
Figure 3. Methodological framework of the scenario-based technical and economic assessment.
Energies 19 04092 g003
Figure 4. Hourly energy-flow balance and BESS state of charge during the representative design cycle: S.2, full-scale BESS without PV. Positive values indicate energy supplied to bus charging, while negative values indicate BESS charging from the grid or PV. The dashed line represents BESS SOC on the secondary axis.
Energies 19 04092 g004
Figure 5. Hourly energy-flow balance and BESS state of charge during the representative design cycle: S.3, full-scale BESS with PV. Positive values indicate energy supplied to bus charging, while negative values indicate BESS charging from the grid or PV. The dashed line represents BESS SOC on the secondary axis.
Energies 19 04092 g005
Figure 6. Cumulative CBA cost development over the 12-year assessment period.
Energies 19 04092 g006
Table 1. Comparison of the scope and economic treatment in representative related studies.
StudySystem and Purpose AssessedCosts and Revenues EvaluatedLong-Term Effects and Uncertainty
Ding et al.
(2021) [3]
New BESS sizing and peak shaving at an electric-bus fast-charging stationBESS/converter investment, electricity and grid-capacity costsFixed lifetime; multiple charging-demand scenarios
Trocker et al. (2020) [4]City-scale BESS support for bus-terminal fast chargingBESS investment, energy, and peak-demand charges; annualized costCalendar and cycle ageing; fleet-electrification scenarios
He et al.
(2023) [15]
Comparison of PV, BESS and PV-BESS charging-station configurationsInvestment, O&M, and electricity costs; annual total costFixed component lifetimes; probabilistic demand and PV output
Wei et al.
(2025) [18]
Second-life BESS operation and flexibility provision at a bus charging stationPurchased energy, degradation cost, and flexibility-service revenueExplicit degradation; stochastic travel and energy demand
Franco et al.
(2025) [19]
Transit fleet, charging infrastructure, renewables, and second-life batteriesFleet/infrastructure investment and operating costs; total system costMulti-period planning; stochastic costs and sensitivity analysis
Present studySite-level comparison of second-life BESS and PV implementation configurationsInvestment, O&M, electricity supply and time-block network costs; 12-year cumulative cost and break-evenInitial SOH, electricity-cost sensitivity, and capacity-fade sensitivity; battery replacement excluded
Table 2. Key case-study input parameters for the electrified bus line and analysed charging site.
ParameterValue/Description
Public transport applicationFully electrified urban bus line
Peak-period operationUp to four electric buses
Bus battery technology and capacityLTO, 74 kWh
Route length7.7 km one way
Charging technology and conceptPantograph-based opportunity fast charging
Charger power150 kW DC fast charger
Typical charging-session durationApprox. 5 min
Energy transferred per one way trip/charging sessionAverage 9.6 kWh
Energy consumption (grid-side)Average 1.24 kWh/km
Average daily energy demand426 kWh/day
Maximum daily energy demandApprox. 700 kWh/day
P85 daily charging-energy demand544 kWh/day
Estimated annual grid electricity demand110 MWh
Measured grid-to-charger energy lossesApprox. 9%
Table 3. Investment categories and main cost elements used for scenario-based cost estimation.
Investment CategoryMain Cost Elements
BESS-to-grid and charger
integration
Equipment and works enabling the BESS to operate in parallel with the grid connection and fast charger, including cabling, protection equipment, and grid- and charger-side connection.
BESS equipment, housing and
installation
Main stationary BESS installation, including the hybrid inverter, low-voltage cabinet and adapted container with racks or trays, fire-resistant lining, and water-cooling and safety equipment.
Battery system, monitoring and
control integration
Functional integration of the available second-life battery system, including the BMS–inverter communication interface, monitoring, control configuration, parameter setting, and testing.
PV system and BESS connectionRequired PV generation package, including PV modules, mounting system, and connection of the PV system to the BESS.
Table 4. Implementation scenarios for the Maribor fast-charging site.
ScenarioScenario TitleUsable BESS Capacity [kWh]BESS Support [kW]Grid Capacity [kW]
S.0Baseline operation150
S.1Small-scale BESS11025125
S.2Full-scale BESS6309060
S.3Full-scale BESS with PV6309060
Table 5. Scenario-based CBA results under the 5% reference electricity-cost escalation case.
ParameterS.0S.1S.2S.3
Investment cost [EUR]080,000200,000256,000
First-year grid-electricity cost [EUR/year]18,94618,70418,0365640
Annual O&M cost [EUR/year]0200050005878
12-year cumulative cost incl. O&M [EUR]301,558401,712547,085416,309
Savings compared with S.0 after 12 years [EUR]Reference−100,154−245,527−114,751
Break-even within 12-year assessment periodReferenceNot reachedNot reachedNot reached
Disclaimer/Publisher’s Note: The statements, opinions and data contained in all publications are solely those of the individual author(s) and contributor(s) and not of MDPI and/or the editor(s). MDPI and/or the editor(s) disclaim responsibility for any injury to people or property resulting from any ideas, methods, instructions or products referred to in the content.