


Abstract
Non-uniform heat flux in high-power electronic devices can induce local hotspots. To address hotspot thermal management, a hybrid microchannel heat sink featuring micro pin-fins with secondary channels (MPSCs) is proposed. Straight microchannels are used in the low-heat-flux region, while staggered pin-fins are arranged in the central hotspot region. Five models are considered: solid pin-fins without secondary channels (M1) and pin-fins with one-, three-, four-, and six-directional secondary channels (M2–M5). Over Re = 200–800, the thermal resistance of M3 is reduced by up to 43.3% compared with the SPMS, and the maximum PEC reaches 1.178. MPSC structures achieve better cooling at lower pumping power. At similar pumping power, the thermal resistance of M3 is 36.8% lower than the minimum value attainable by the SPMS. However, the marginal reduction in thermal resistance gradually weakens as the pumping power increases. The effects of hotspot heat flux and relative pin-fin height are investigated. MPSCs can withstand higher heat loads. Under a hotspot heat flux of 800 W/cm2, the maximum temperature of M3 remains below the safety threshold. Relative pin-fin height has a coupled effect on the thermal–hydraulic performance. At Re = 800, the PEC of M3 at RPH = 0.9 is about 2.8% higher than that at RPH = 1.0, and a PEC fitting equation is developed. The results show that the hybrid micro pin-fin heat sink with secondary channels disrupts the thermal boundary layer through internal flow diversion and local disturbance, thereby balancing hotspot suppression and pressure drop control. This design provides a reference for hotspot thermal management and thermal–hydraulic optimization of microchannel heat sinks.
1. Introduction
Increasing integration density in microprocessors, power electronics, and three-dimensional integrated chips raises local power density and imposes stricter thermal constraints on device reliability [1,2]. Current advanced high-performance processors can have thermal design power (TDP) of up to 400 W [3]. During actual chip operation, heat is not generated uniformly. Core regions and switching units often form local hotspots with heat flux much higher than that in the background region [4,5]. These hotspots can raise the peak temperature and thermal gradients, degrading performance and device lifetime [5]. Conventional air cooling is generally limited to heat fluxes on the order of 100 W/cm2 and is inadequate for high-heat-flux devices [6]. Liquid cooling with localized hotspot control therefore offers a more suitable approach [7,8].
To meet the increasing thermal management demand of electronic devices, various cooling technologies have been studied, including thermoelectric cooling, immersion cooling, and heat pipe cooling [9,10,11,12]. Among them, microchannel heat sinks (MHS) have become an important route for electronic cooling because of high specific surface area, short heat transfer path, and strong convective heat transfer capability [13]. Tuckerman and Pease [14] first demonstrated high-heat-flux cooling with a straight parallel microchannel heat sink (SPMS) in 1981. Subsequent studies have examined cross-section, inlet or outlet arrangement, coolant type, and other key factors [15,16,17]. Kose et al. [18] showed that heat transfer enhancement generally increases pumping power demand. In straight microchannels, limited disturbance allows the thermal boundary layer to grow downstream, reducing local heat-transfer capability. Passive enhancements such as ribs [19,20], grooves [21,22], manifolds [23,24], multilayer channels [25,26], and micro pin-fins [27,28] are therefore used to interrupt this development and promote mixing.
Micro pin-fins have strong fluid disturbance capability and have become an important structure for heat transfer enhancement in MHS. Yang et al. [29] summarized the heat transfer enhancement mechanisms of pin-fins and reported that pin-fins can induce accelerated flow, thereby disrupting the thermal boundary layer. They also noted that the shape and size of pin-fins have significant effects on heat transfer performance. Ismail et al. [30] optimized the geometry of pin-fins and showed that pin-fin design should balance heat transfer enhancement and pressure drop control. In addition to shape, the arrangement of micro pin-fins also affects the cooling performance. Chiu et al. [31] studied a variable-density arrangement of micro pin-fins and found that it provided better temperature uniformity than the staggered arrangement, with a minimum effective thermal resistance of 0.258 K/W. In recent years, micro pin-fin structures have increasingly been developed as composite designs. Li et al. [28] designed an open microchannel with diamond pin-fins. At a pumping power of 0.1 W, its total thermal resistance was 23.77% lower than that of a conventional microchannel. Shen et al. [32] experimentally studied a silicon-based thermal test chip cooled by a backside embedded-manifold staggered pin-fin microchannel heat sink. At a mass flow rate of 5 mL/s and a heat flux of 700 W/cm2, this design reduced the maximum chip temperature by 8 K compared with a rectangular microchannel. Haque et al. [33] investigated perforated, twisted, and grooved pin-fins. At Re = 21,367, the hydrothermal performance factor (HTPF) of the grooved–perforated heat sink was about 27% higher than that of the baseline case, but the pressure increased by about 80%. Complex pin-fin structures can enhance fluid mixing and improve heat transfer efficiency, but they also increase hydraulic loss and manufacturing complexity.
However, most MHS studies assume uniform heat flux, although practical chips exhibit spatially non-uniform power dissipation. Taking microprocessors as an example, the cores, caches, interconnects, and peripheral logic units have different power levels. Therefore, hotspot thermal management has gradually become an important direction in MHS research. Local heat-transfer enhancement has been achieved by embedding pin-fin arrays in the hotspot region of microchannels. Feng et al. [34] proposed gradient annular-cavity micro pin-fins for non-uniform hotspots in 3D chips. Under a hotspot heat flux of 700 W/cm2, the thermal resistance was reduced by 34.5%. Fallahtafti et al. [35] optimized the shape of hotspot-targeted micro pin-fins. Using a multi-objective optimization algorithm, they achieved a hotspot thermal resistance of 0.208 K·cm2/W under a pressure drop constraint of 10 kPa, and improved the temperature uniformity by about 50%. These studies show that local cooling enhancement for non-uniform heat sources is more consistent with the practical thermal management demand of modern multi-core chips. However, although micro pin-fins can effectively enhance local heat transfer, they often cause large hydraulic losses. Composite designs that balance thermal and hydraulic performance are still limited.
Secondary channels offer another passive approach for balancing heat transfer and flow resistance. By redirecting coolant between adjacent regions, they promote mixing and disturb boundary-layer growth with a relatively small power penalty [36]. Sadique et al. [36] systematically reviewed the enhancement mechanisms of secondary channels in microchannels and reported that secondary flow can enhance heat transfer level with a limited power penalty. Wen et al. [37] reported up to a 34% improvement in overall performance for a composite secondary-channel MHS at a relative channel width of 0.6. However, most existing secondary channels are arranged between adjacent straight microchannels or near the channel walls. Studies on secondary-channel structures for micro pin-fin heat sinks are still limited. Representative MHS architectures and their reported thermal–hydraulic performance are compared in Table 1.
Table 1.
Comparison of representative microchannel heat sink structures, reported performance, and thermal–hydraulic characteristics.
Table 1 shows that conventional straight channels offer structural simplicity but limited hotspot control. Ribs, grooves, manifolds, multilayer channels, and pin-fins strengthen heat transfer at the expense of additional hydraulic or fabrication penalties. Secondary channels can relieve local blockage, but their direct integration within hotspot-targeted micro pin-fins has received limited attention.
Based on these characteristics, this study proposes a hybrid microchannel heat sink featuring micro pin-fins with secondary channels. Straight microchannels are retained in the low-heat-flux background region, while staggered micro pin-fins are arranged only in the central hotspot region. One-, three-, four-, and six-directional secondary channels are embedded inside the pin-fins to promote local flow diversion and reduce the blockage associated with solid pin-fins. The proposed structure therefore combines hotspot-targeted enhancement with internal secondary flow paths, aiming to improve hotspot suppression while controlling the hydraulic penalty. Numerical simulations are conducted to compare several pin-fin structures with embedded secondary channels against the baseline SPMS. The influence of Re on the thermal–hydraulic performance is examined, and the energy benefit is evaluated using the relationship between thermal resistance and pumping power. The hotspot load capacity of the hybrid heat sink is analyzed under different hotspot heat fluxes, and the effect of pin-fin height is also investigated. This study provides a hotspot thermal management solution that balances thermal and hydraulic performance for high-power electronic devices.
2. Numerical Method
2.1. Geometric Model
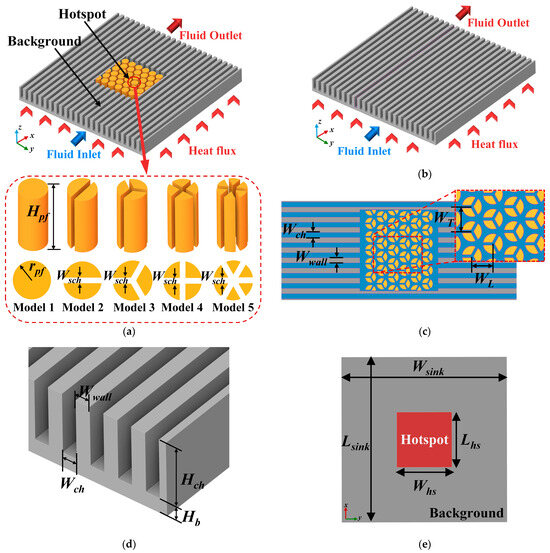
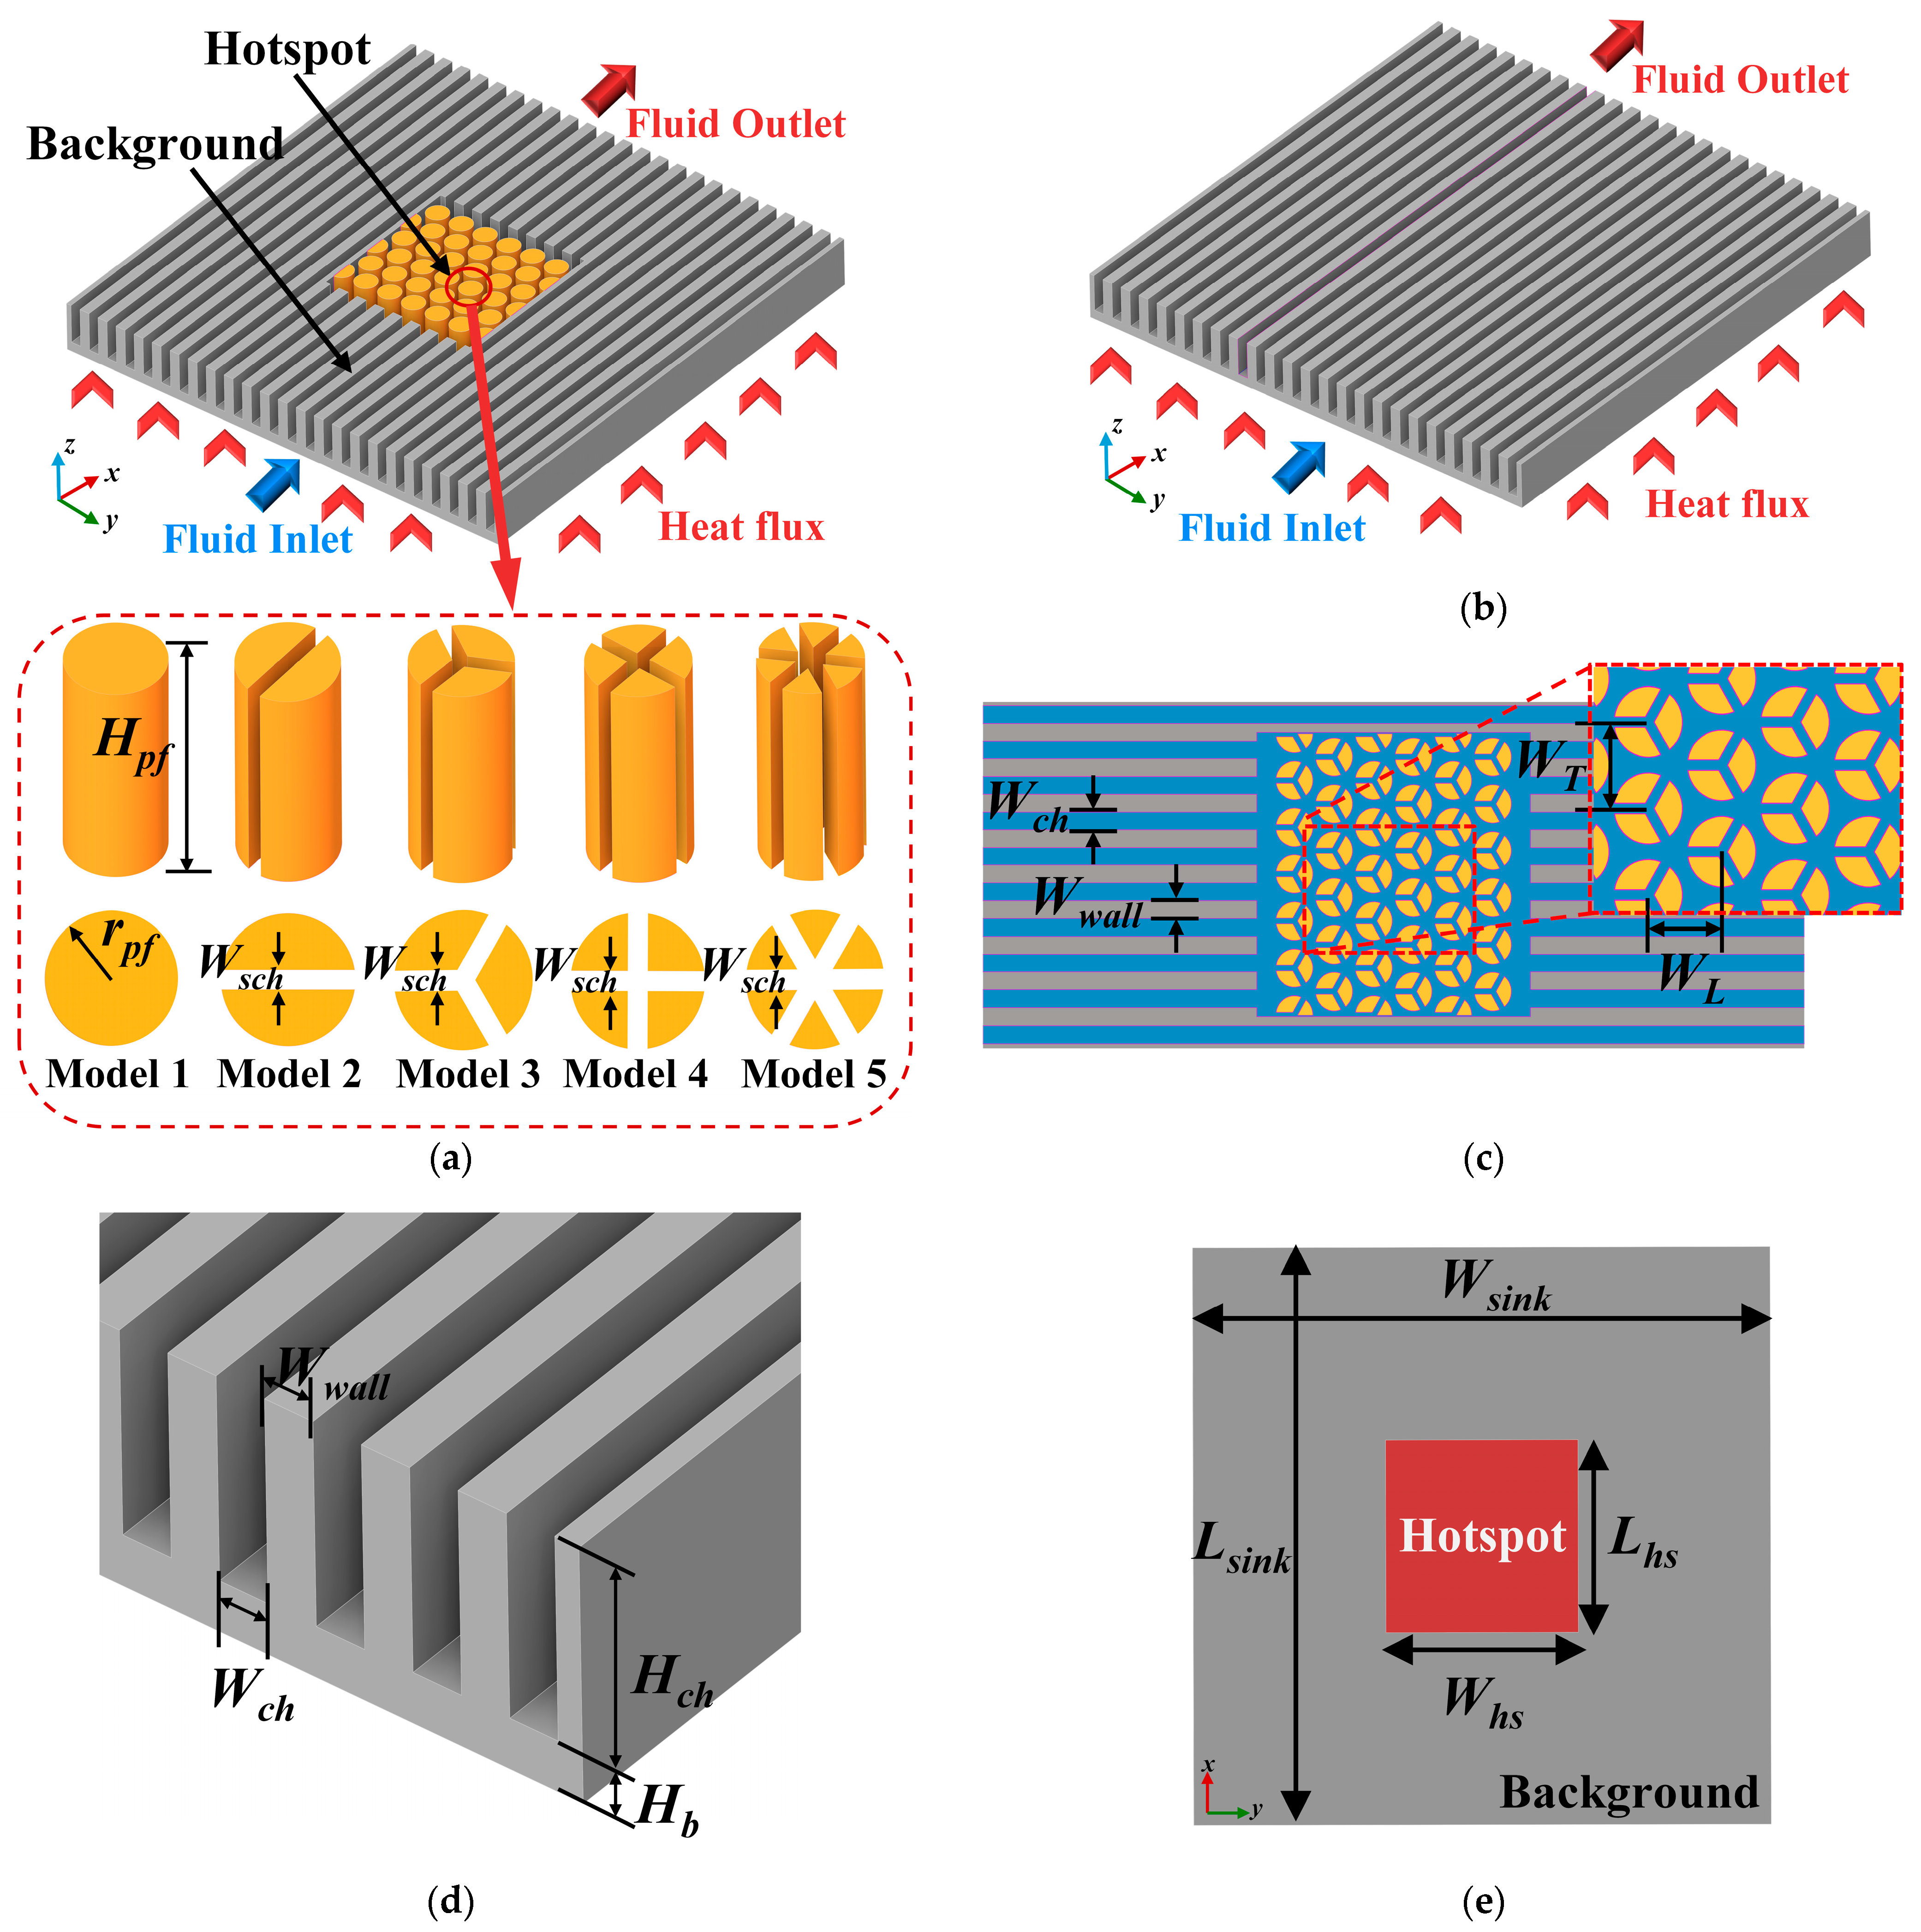
A hybrid microchannel heat sink featuring micro pin-fins with secondary channels (MPSCs) is proposed to enhance local cooling of the central hotspot under non-uniform heat flux. Its geometric structure is shown in Figure 1. The heat sink consists of straight microchannels in the background region and micro pin-fins in the central hotspot region. In this hybrid design, the heat transfer enhancement structures are concentrated in the high-heat-flux region, which improves local cooling capacity while controlling the overall flow resistance.
Figure 1.
Geometric model of MHS. (a) Overall structure of the MPSC and five pin-fin models; (b) the SPMS model; (c) top view of M3 and enlarged staggered pin-fin array; (d) geometrical parameters of microchannels; (e) hotspot and background regions of MHS.
Figure 1a shows the geometric structure of the MPSC heat sink. The cover plate is hidden in this view. A circular pin-fin array is arranged in the central hotspot region, and different types of secondary channels are embedded inside the pin-fins. According to the number and direction of the internal channels, five geometric models are constructed and denoted as Model 1–Model 5 (M1–M5). M1 is a solid circular pin-fin without internal secondary channels and is used as the pin-fin baseline model. M2–M5 introduce one-, three-, four-, and six-directional secondary channels inside the circular pin-fins, respectively. All models have the same external pin-fin envelope size. The secondary channels are formed only by removing solid regions inside the circular pin-fins, and their characteristic width is Wsch. The SPMS is also established as the control model, as shown in Figure 1b. Except for the central enhancement structure, the SPMS and M1–M5 have the same geometric dimensions and boundary conditions. Figure 1c presents the top view of the hotspot region in M3. The pin-fin array is located in the central hotspot region and arranged in a staggered pattern. The staggered arrangement promotes flow diversion in the gaps between the pin-fins. The secondary channels inside the pin-fins further connect the surrounding flow regions, which provides additional internal flow paths and promotes local coolant exchange. Figure 1d describes the local geometric parameters of the straight microchannel region. Figure 1e illustrates the bottom heat source regions and the corresponding geometric dimensions. The central pin-fin enhancement region is aligned with the hotspot region in the planar direction. The dimensional parameters of all models are listed in Table 2.
Table 2.
Size parameters of all models.
2.2. Governing Equations and Boundary Conditions
Numerical simulations are conducted using computational fluid dynamics (CFD) with a steady fluid–solid conjugate heat transfer model. The computational domain includes the complete heat sink model, as shown in Figure 1. To reduce unnecessary computational complexity, the following assumptions are adopted:
- The Reynolds number of deionized water ranges from 200 to 800. Therefore, the flow is assumed to remain laminar in all models. The applicability of this treatment at Re = 800 is further assessed using local Reynolds numbers and a transient stability test.
- The thermal–hydraulic analysis is performed under steady-state conditions. The stability of the steady-state solution at Re = 800 is further examined in Section 2.7.
- Deionized water is treated as a single-phase incompressible fluid. The calculated coolant temperature remained below 340 K in all cases, so phase change was not considered.
- Gravity, thermal radiation, and natural convection between the outer walls and the surrounding environment are neglected. Conjugate heat transfer conditions are applied at the solid–fluid interfaces, and the no-slip boundary condition is used.
Silicon is selected as the heat-sink material because of its compatibility with microfabrication and integrated devices. Its properties are listed in Table 3, with a constant thermal conductivity of 148 W/(m·K). Although the thermal conductivity of silicon decreases with increasing temperature, the present study mainly focuses on the thermal–hydraulic differences between geometric configurations. The same material property and boundary conditions are applied to all models, providing a consistent basis for evaluating the effects of pin-fins and secondary channels. Therefore, the constant ksi is retained as a reasonable simplification for the comparative analysis in this study.
Table 3.
The material parameter of silicon (Si).
Deionized water is used as the coolant in the heat sink, and its physical properties are expressed as polynomial functions of temperature [38,39,40]. The density (ρf (T), kg/m3), specific heat capacity (Cp,f (T), J/(kg·K)), thermal conductivity (kf (T), W/(m·K)), and dynamic viscosity (μf (T), Pa·s) are calculated using the correlations listed in Equations (1)–(4), respectively.
Since the model is solved under steady-state conditions, three-dimensional steady governing equations are adopted.
The continuity equation is
The momentum equation is
where τ is defined as
The energy equations are expressed as follows:
The energy equation for the fluid is
The energy equation for the solid is
where is the velocity vector (m/s), p is the static pressure (Pa), τ is the stress tensor (Pa), and I is the identity tensor (dimensionless). kf and ks are the thermal conductivities of the fluid and solid (W/(m·K)). Tf and Ts are the fluid temperature and solid temperature (K), respectively.
Three-dimensional numerical simulations are performed using Ansys Fluent 2026 R1 based on the finite volume method. A pressure-based steady solver is employed, and pressure–velocity coupling is handled using the Coupled algorithm. The gradients are evaluated using the least-squares cell-based method. A second-order scheme is used for pressure interpolation, while the momentum and energy equations are discretized using the second-order upwind scheme. These settings are applied consistently to all steady-state models and operating conditions.
The convergence of the numerical solution is evaluated using both residuals and the monitored thermal–hydraulic parameters. The convergence criterion for the scaled residuals of the continuity, momentum, and energy equations is set to 10−8. The iterations are continued until the residual criteria are satisfied and Tmax and ΔP no longer show appreciable changes. The converged solution is used for subsequent performance evaluation and flow-field analysis. All computations are performed on a hardware platform equipped with an Intel® Core™ Ultra 7 251 HX processor (5.1 GHz) and 32 GB DDR5 memory.
The boundary conditions are simplified based on the physical assumptions of this study. The inlet is set as a uniform velocity inlet. The average inlet velocity (uavg) is determined by the Reynolds number, Re. The Reynolds number ranges from 200 to 800, corresponding to an inlet velocity range of 0.45–1.81 m/s. The inlet temperature (Tin) is fixed at 293.15 K. The outlet is defined as a pressure boundary with zero gauge pressure. A partitioned heat flux boundary is applied at the bottom heating surface. The heat sink footprint is 12 mm × 12 mm. The central 4 mm × 4 mm region is defined as the hotspot region, while the remaining bottom surface is defined as the background region. The initial heat flux is set to 3 × 10⁶ W/m2 in the hotspot region (qhs) and 5 × 10⁵ W/m2 in the background region (qbg). Except for the inlet, outlet, and bottom heating surface, all other external solid surfaces are treated as adiabatic. After comparing the thermal–hydraulic performance of different structures at the same Reynolds number, the hotspot heat flux is gradually increased at Re = 400 to evaluate the maximum hotspot heat flux that the heat sink structure can withstand.
Accordingly, the applicability of the present numerical model is limited to the operating conditions and geometric configurations investigated in this study. The model considers steady, single-phase laminar cooling of a silicon heat sink using deionized water at Tin = 293.15 K. Therefore, the quantitative results should not be directly extrapolated to boiling or turbulent flow, other coolants or substrate materials, or substantially different hotspot layouts and geometries without additional validation.
2.3. Practical Manufacturability
The proposed MPSC structures are compatible with established silicon microfabrication processes based on photolithography and deep reactive-ion etching (DRIE). For the present design, the nominal etching aspect ratios are approximately 3.2 for the main microchannels (Hch/Wch = 0.80/0.25) and 10 for the secondary channels (Hpf/Wsch = 0.80/0.08), which are within the demonstrated capability of optimized DRIE processes [41,42]. In the present models, M5 has the largest number of intersecting secondary channels, and its manufacturing requirements are mainly associated with dimensional accuracy at the channel intersections. In practical fabrication, mask compensation and optimized DRIE parameters can be used to control etch bias and junction dimensions, thereby preserving the designed flow passages.
Surface roughness produced during DRIE can increase wall friction and consequently raise the pressure drop. Its influence is more pronounced in the secondary channels because of their larger relative roughness. Sidewall roughness can be substantially reduced through optimized etching and post-etch smoothing treatments [43]. Therefore, practical fabrication should focus on controlling the intersection geometry and sidewall quality. These manufacturing considerations provide a feasible route for fabricating the proposed MPSC structures while limiting deviations in their thermal–hydraulic performance. Accordingly, the smooth-wall numerical results can be regarded as an idealized benchmark for the proposed structures. In fabricated devices, residual surface roughness and small dimensional deviations may lead to slightly higher hydraulic resistance and some variation in thermal–hydraulic performance, while these discrepancies can be limited through appropriate fabrication control.
2.4. Performance Parameters
The following performance parameters are selected as the main evaluation indices. The Reynolds number was used to define the inlet flow condition:
where ρf, uavg, Dh, and μf are the coolant density (kg/m3), mean inlet velocity (m/s), hydraulic diameter (m), and dynamic viscosity (Pa·s), respectively [44].
For the rectangular inlet channel, the hydraulic diameter of the rectangular inlet microchannel is defined as
where Ach and Pch are the inlet cross-sectional area (m2) and wetted perimeter of a single microchannel (m), respectively. Wch and Hch are the width and height of the inlet microchannel [44].
The maximum substrate temperature is defined as the larger value between the peak temperature in the hotspot region and that in the background region:
where Tmax,hs is the maximum temperature in the hotspot region (K), and Tmax,bg is the maximum temperature in the background region (K).
The temperature uniformity of the hotspot is characterized by the mean absolute temperature difference (MATD) [5]:
where δThs is the mean absolute temperature difference in the hotspot region (K), and Tmax,hs, Tmin,hs, and Tavg,hs are the maximum, minimum, and average temperatures in the hotspot region (K), respectively. A smaller value of this index indicates a more uniform surface temperature distribution and weaker hotspot concentration [5].
The convective heat transfer intensity is expressed by the Nusselt number:
where Qtot is the total heat input (W), Ah is the solid–fluid contact area involved in heat transfer (m2), Tc is the average temperature of the heated wall (K), and Tf is the average fluid temperature (K).
The total thermal resistance is used to describe the ability of the heat sink to limit the maximum temperature under a given heat input:
where Rth is the total thermal resistance (K/W); Tmax and Tin are the maximum substrate temperature and inlet fluid temperature (K), respectively; qbg and qhs are the background and hotspot heat fluxes (W/m2), respectively; and Abg and Ahs are the corresponding heating areas (m2).
The average pressure drop is defined as
where ΔP is the average pressure drop (Pa). nch is the number of channels, and Δpi is obtained from the inlet–outlet pressure difference of channel i (Pa) [44].
The surface friction factor reflects the flow resistance:
where f is the friction factor (dimensionless), and L is the effective channel length (m).
The pumping power is used to evaluate the hydraulic power required to drive the coolant:
where Ppump is the pumping power (W). Ain is the inlet cross-sectional area of a single channel (m2). This parameter can be used to evaluate the flow penalty caused by heat transfer enhancement.
The performance evaluation criterion is used to compare the overall benefit of the enhanced structures relative to the baseline MHS:
where Nu0 and f0 are the average Nu and f of the baseline MHS at the same Re, respectively. When PEC > 1, the heat transfer gain of the new structure can offset its flow resistance penalty. When PEC is clearly lower than 1, the structure can reduce the maximum temperature, but its overall thermal–hydraulic performance is insufficient. For M1, M2, M3, M4, and M5 in this study, the SPMS is used as the common baseline.
2.5. Grid Independence Test
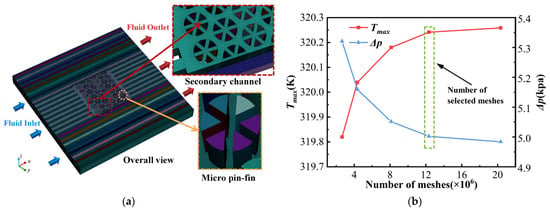
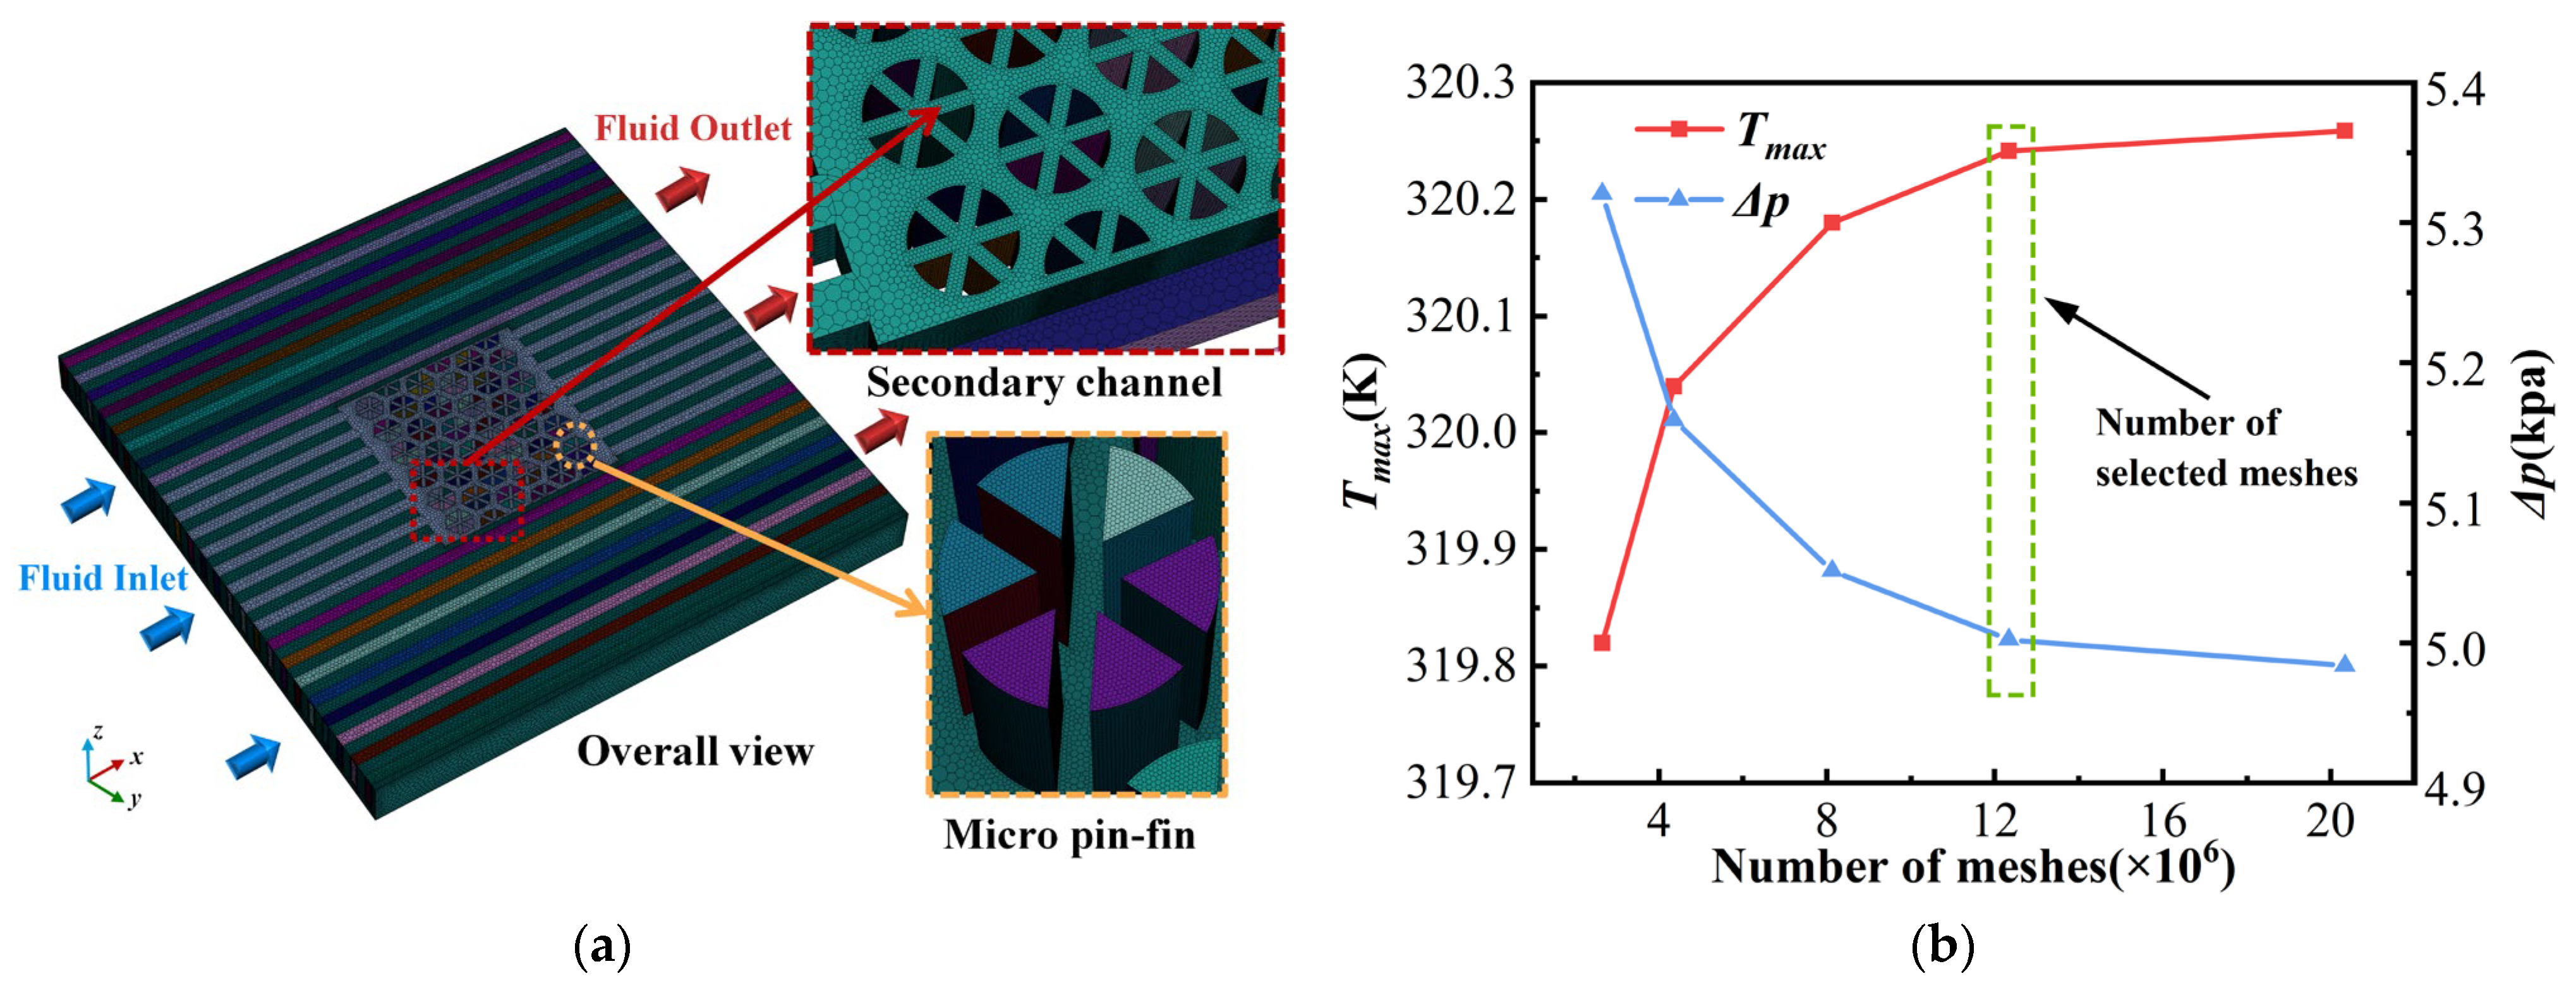
To ensure that the numerical results are not affected by the mesh number, a grid independence test is performed for M5 at Re = 400 under qbg = 50 W/cm2 and qhs = 300 W/cm2, as M5 has relatively complex geometric features. The results are shown in Figure 2. An unstructured polyhedral mesh is used in the calculation, with local refinement near the pin-fins, secondary channels, and solid–fluid heat transfer interfaces. Tmax and ΔP are used as the evaluation indices for grid independence. Meshes with different densities are established and compared. As the mesh number increases from 2.65 × 10⁶ to 12.33 × 10⁶, both Tmax and ΔP gradually become stable. When the mesh number is further increased to 20.33 × 10⁶, Tmax changes only from 320.241 K to 320.418 K, with a relative variation of 0.055%. ΔP changes from 5.00225 kPa to 4.98389 kPa, with a relative variation of 0.363%. The variations in both indices are lower than the convergence criterion of 1%, indicating that further mesh refinement has little effect on the calculation results. Considering both computational accuracy and cost, a mesh with approximately 12.33 × 10⁶ cells is finally selected for the following numerical simulations.
Figure 2.
(a) Mesh diagram of M5. The colors are used only for visualization of different mesh regions; (b) grid independence validation.
2.6. Numerical Validation
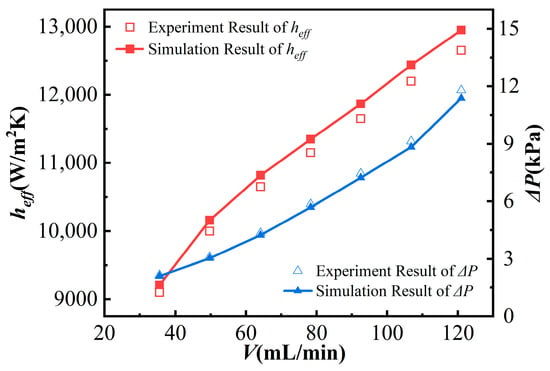
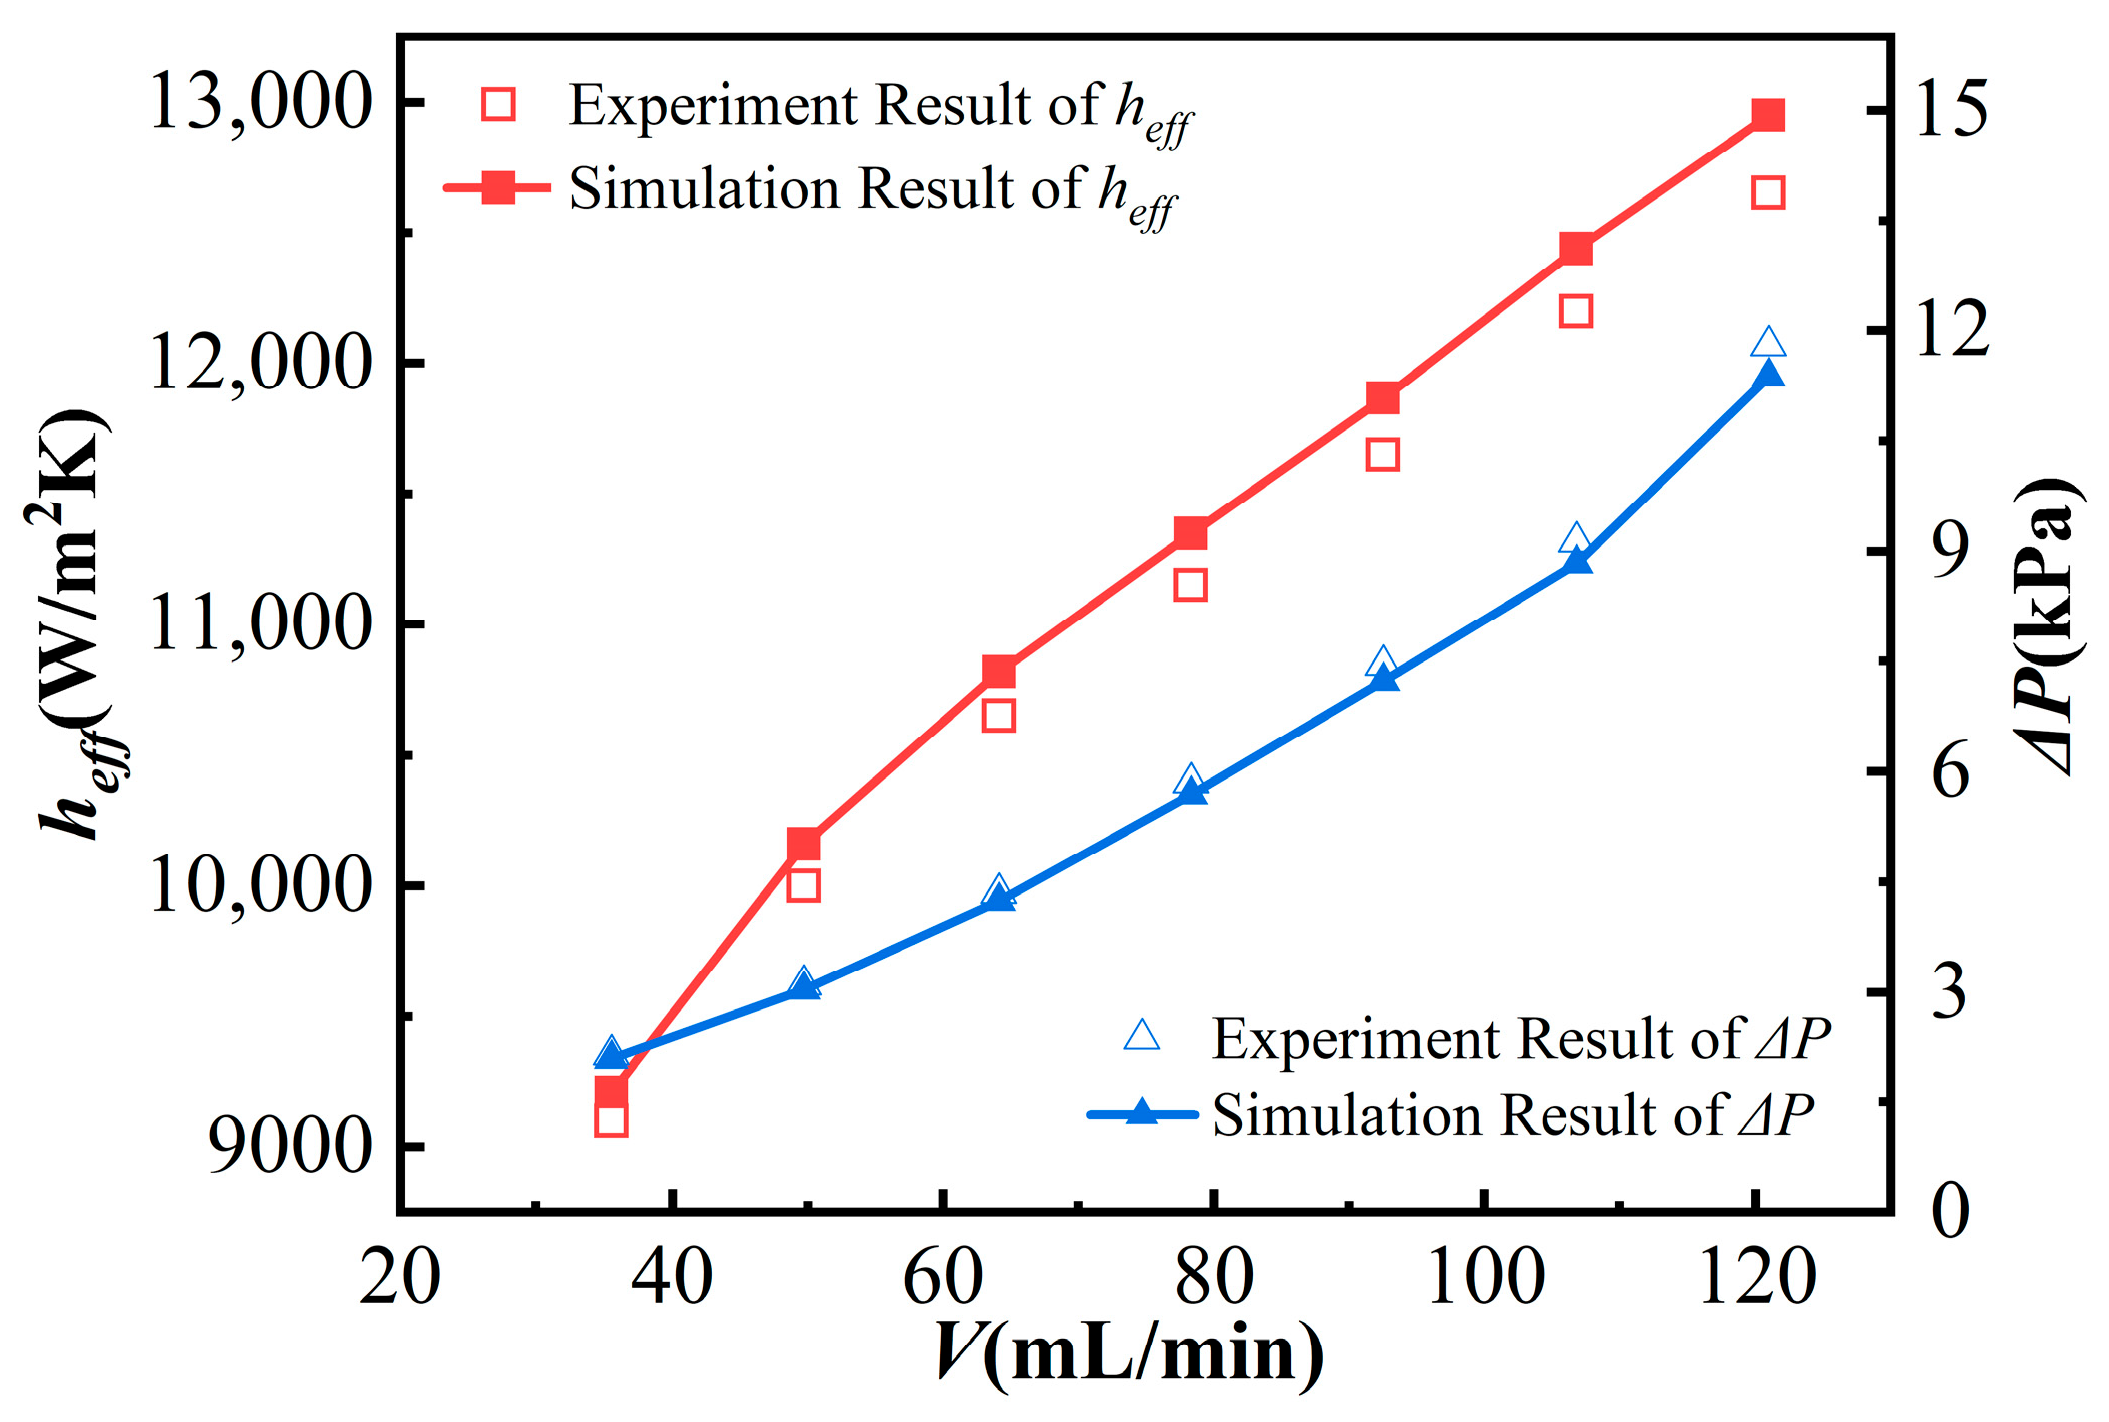
To validate the accuracy of the numerical method used in this study, the simulation results are compared with experimental data reported in the literature. The experimental study on tree-like fractal microchannel heat sinks by Ji et al. [45] is selected as the validation reference, and the FM-30 structure with better overall performance is used for numerical validation. As shown in Figure 3, the global heat transfer coefficient (heff) and pressure drop (ΔP) are selected as the validation indices. As the flow rate increases from 35.5 mL/min to 121.0 mL/min, the maximum relative error of heff is 2.36%, and the average relative error is 1.73%. For ΔP, the maximum relative error is 3.53%, and the average relative error is 2.79%. Overall, the numerical results are consistent with the experimental data in both heff and ΔP. The relative errors remain low, confirming that the present model can provide dependable predictions for the subsequent simulations.
Figure 3.
Validation of the present numerical model against the experimental data reported by Ji et al. [45].
2.7. Validation of Laminar and Steady-State Assumptions
2.7.1. Validation of the Laminar-Flow Assumption
To assess the laminar-flow assumption at the highest inlet Reynolds number, the local flow characteristics of M3 are examined at Re = 800, qhs = 300 W/cm2, and qbg = 50 W/cm2. The maximum local velocity in the hotspot fluid region is 4.2621 m/s, indicating local acceleration around the pin-fins and secondary-channel junctions. Since this maximum velocity is a local point value, mass-averaged velocities at representative cross-sections are used to calculate the local Reynolds numbers. At the pin-fin region, the characteristic Reynolds number is defined as
where dpf = 0.54 mm is the pin-fin diameter and ugap is the mass-averaged velocity at the minimum gap between adjacent pin-fins. Representative sections are selected at the upstream, middle, and downstream locations of the hotspot region. As shown in Table 4, the corresponding Repf values are 1547.7, 1050.1, and 1899.7, respectively.
Table 4.
Local flow parameters and characteristic Reynolds numbers of M3 at Re = 800.
The flow inside the secondary channels is evaluated using
where Dh,sch = 0.145 mm is the hydraulic diameter of the secondary channel and usch is the corresponding mass-averaged velocity. The calculated Resch values are 501.7, 563.3, and 362.1 at the upstream, middle, and downstream sections, respectively. A recent study on water flow in rectangular microchannels reported transition-related changes at Reynolds numbers above approximately 2200 [46]. The present Resch values are much lower than this level, indicating that the flow inside the secondary channels remains in the laminar regime.
2.7.2. Transient Stability Test
To further assess the applicability of the steady-state assumption and the stability of the numerical results at the upper limit of the investigated Reynolds number, a transient laminar calculation is performed for M3 at Re = 800, qhs = 300 W/cm2, and qbg = 50 W/cm2. The fully converged steady-state solution is used as the initial field. The physical models, material properties, and boundary conditions are kept unchanged. This treatment avoids the startup process caused by reinitialization and allows the stability of the converged solution to be examined directly under transient calculation. A time step of 1 × 10⁻⁶ s is used, and the total flow time is 0.02 s.
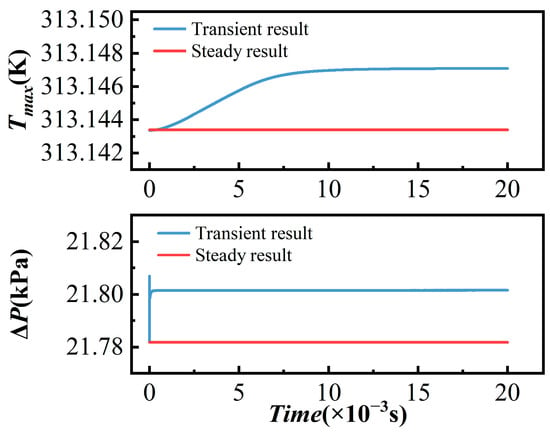
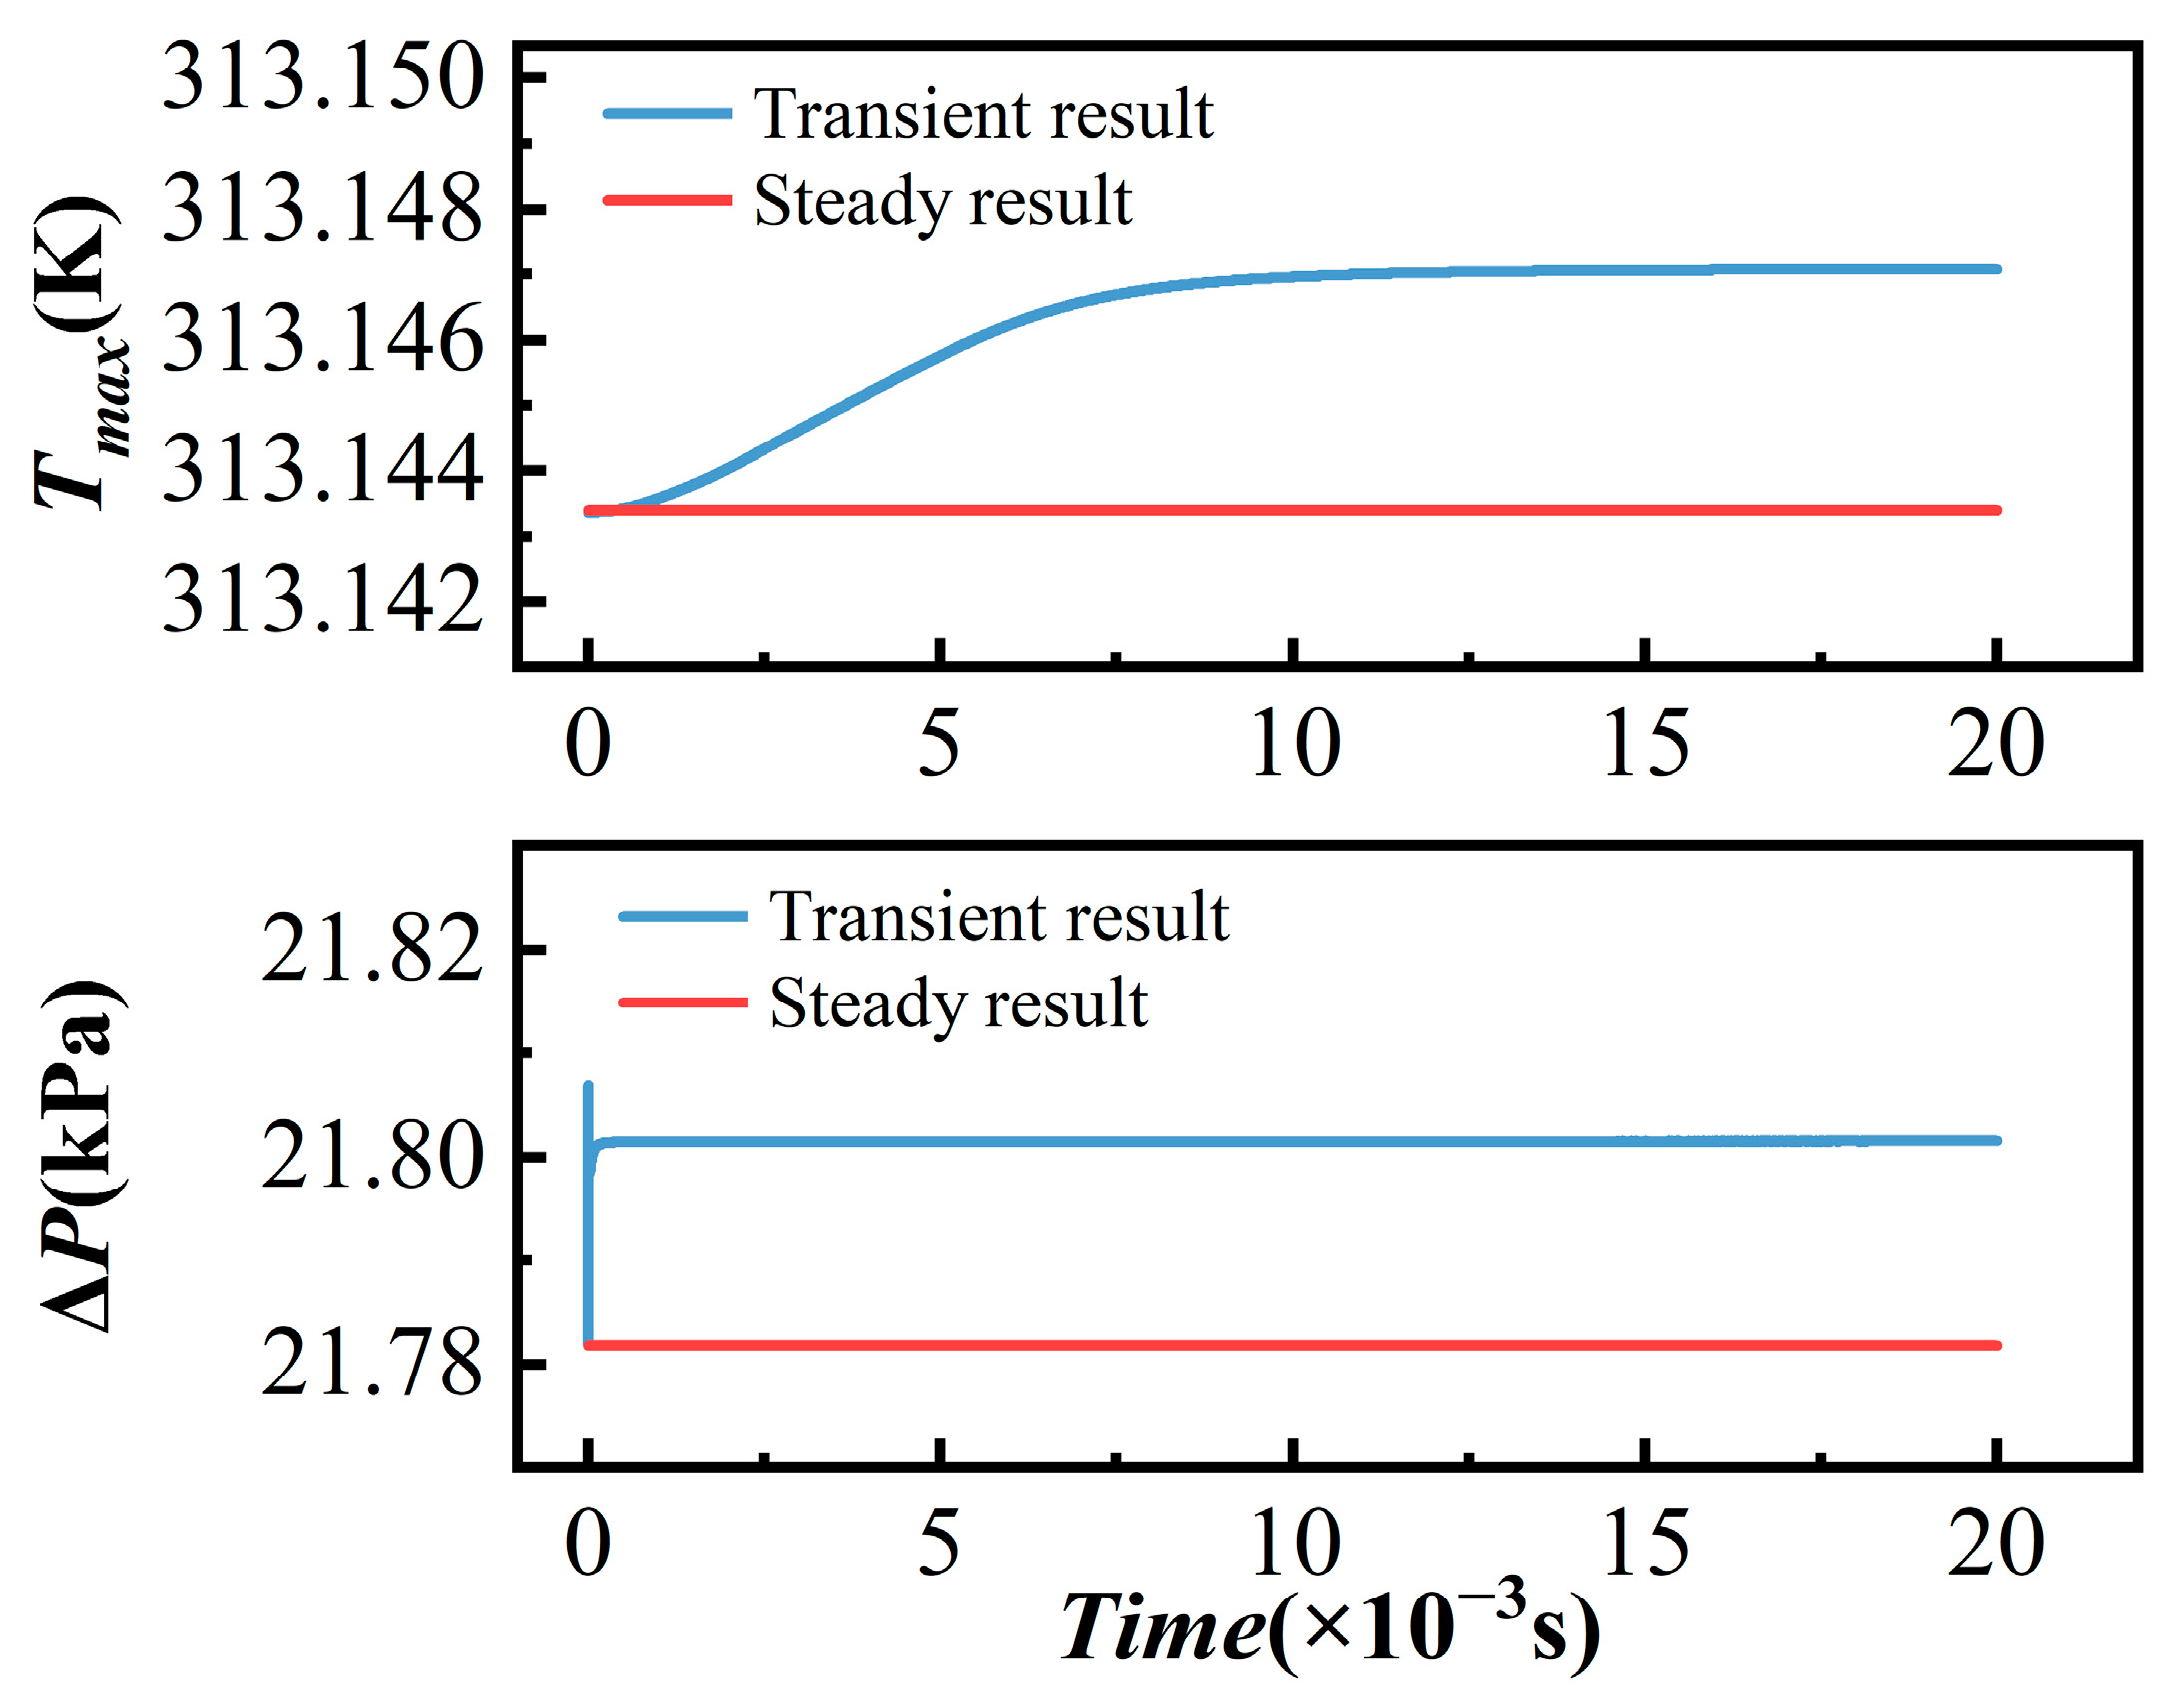
Figure 4 shows the transient histories of Tmax and ΔP. Both parameters remain within narrow ranges and gradually approach stable levels during the calculation. Table 5 compares the steady-state results with the time-averaged transient results. The time-averaged Tmax and ΔP are 313.1463 K and 21.8014 kPa, while the steady-state values are 313.1434 K and 21.7818 kPa, respectively. The relative deviations are only 0.00092% and 0.09023%. The transient results are very close to the steady-state predictions. This confirms that no significant time-dependent variation develops in the monitored thermal–hydraulic parameters at Re = 800, supporting the use of the steady-state model for the present thermal–hydraulic analysis.
Figure 4.
Transient histories of the thermal–hydraulic responses of M3 at Re = 800.
Table 5.
Comparison of steady-state and time-averaged transient results for M3 at Re = 800.
3. Results and Discussion
This study evaluates the thermal–hydraulic performance of MPSC microchannel heat sinks (M1–M5) under several thermal and flow conditions. First, the performance of M1–M5 and the SPMS is compared under the same heat flux, and the effect of Reynolds number is examined. Then the hotspot heat flux is gradually increased at Re = 400 to evaluate the hotspot load capacity of all designs. The effect of the pin-fin/channel height ratio on the thermal–hydraulic performance of the heat sink is analyzed under the same Reynolds number and hotspot heat flux. The detailed conditions are listed in Table 6.
Table 6.
Thermal and flow conditions used in this study.
3.1. Effect of Different Micro Pin-Fin Structures
The heat transfer and flow performance of the SPMS and M1–M5 are compared at the qbg = 50 W/cm2 and qhs = 300 W/cm2.
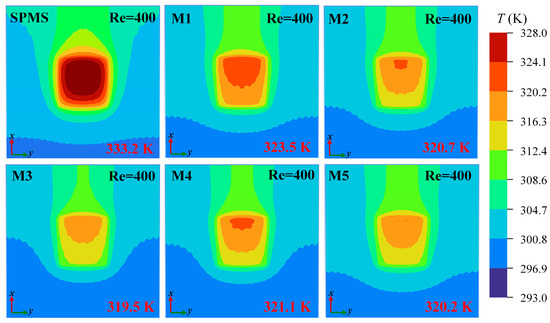
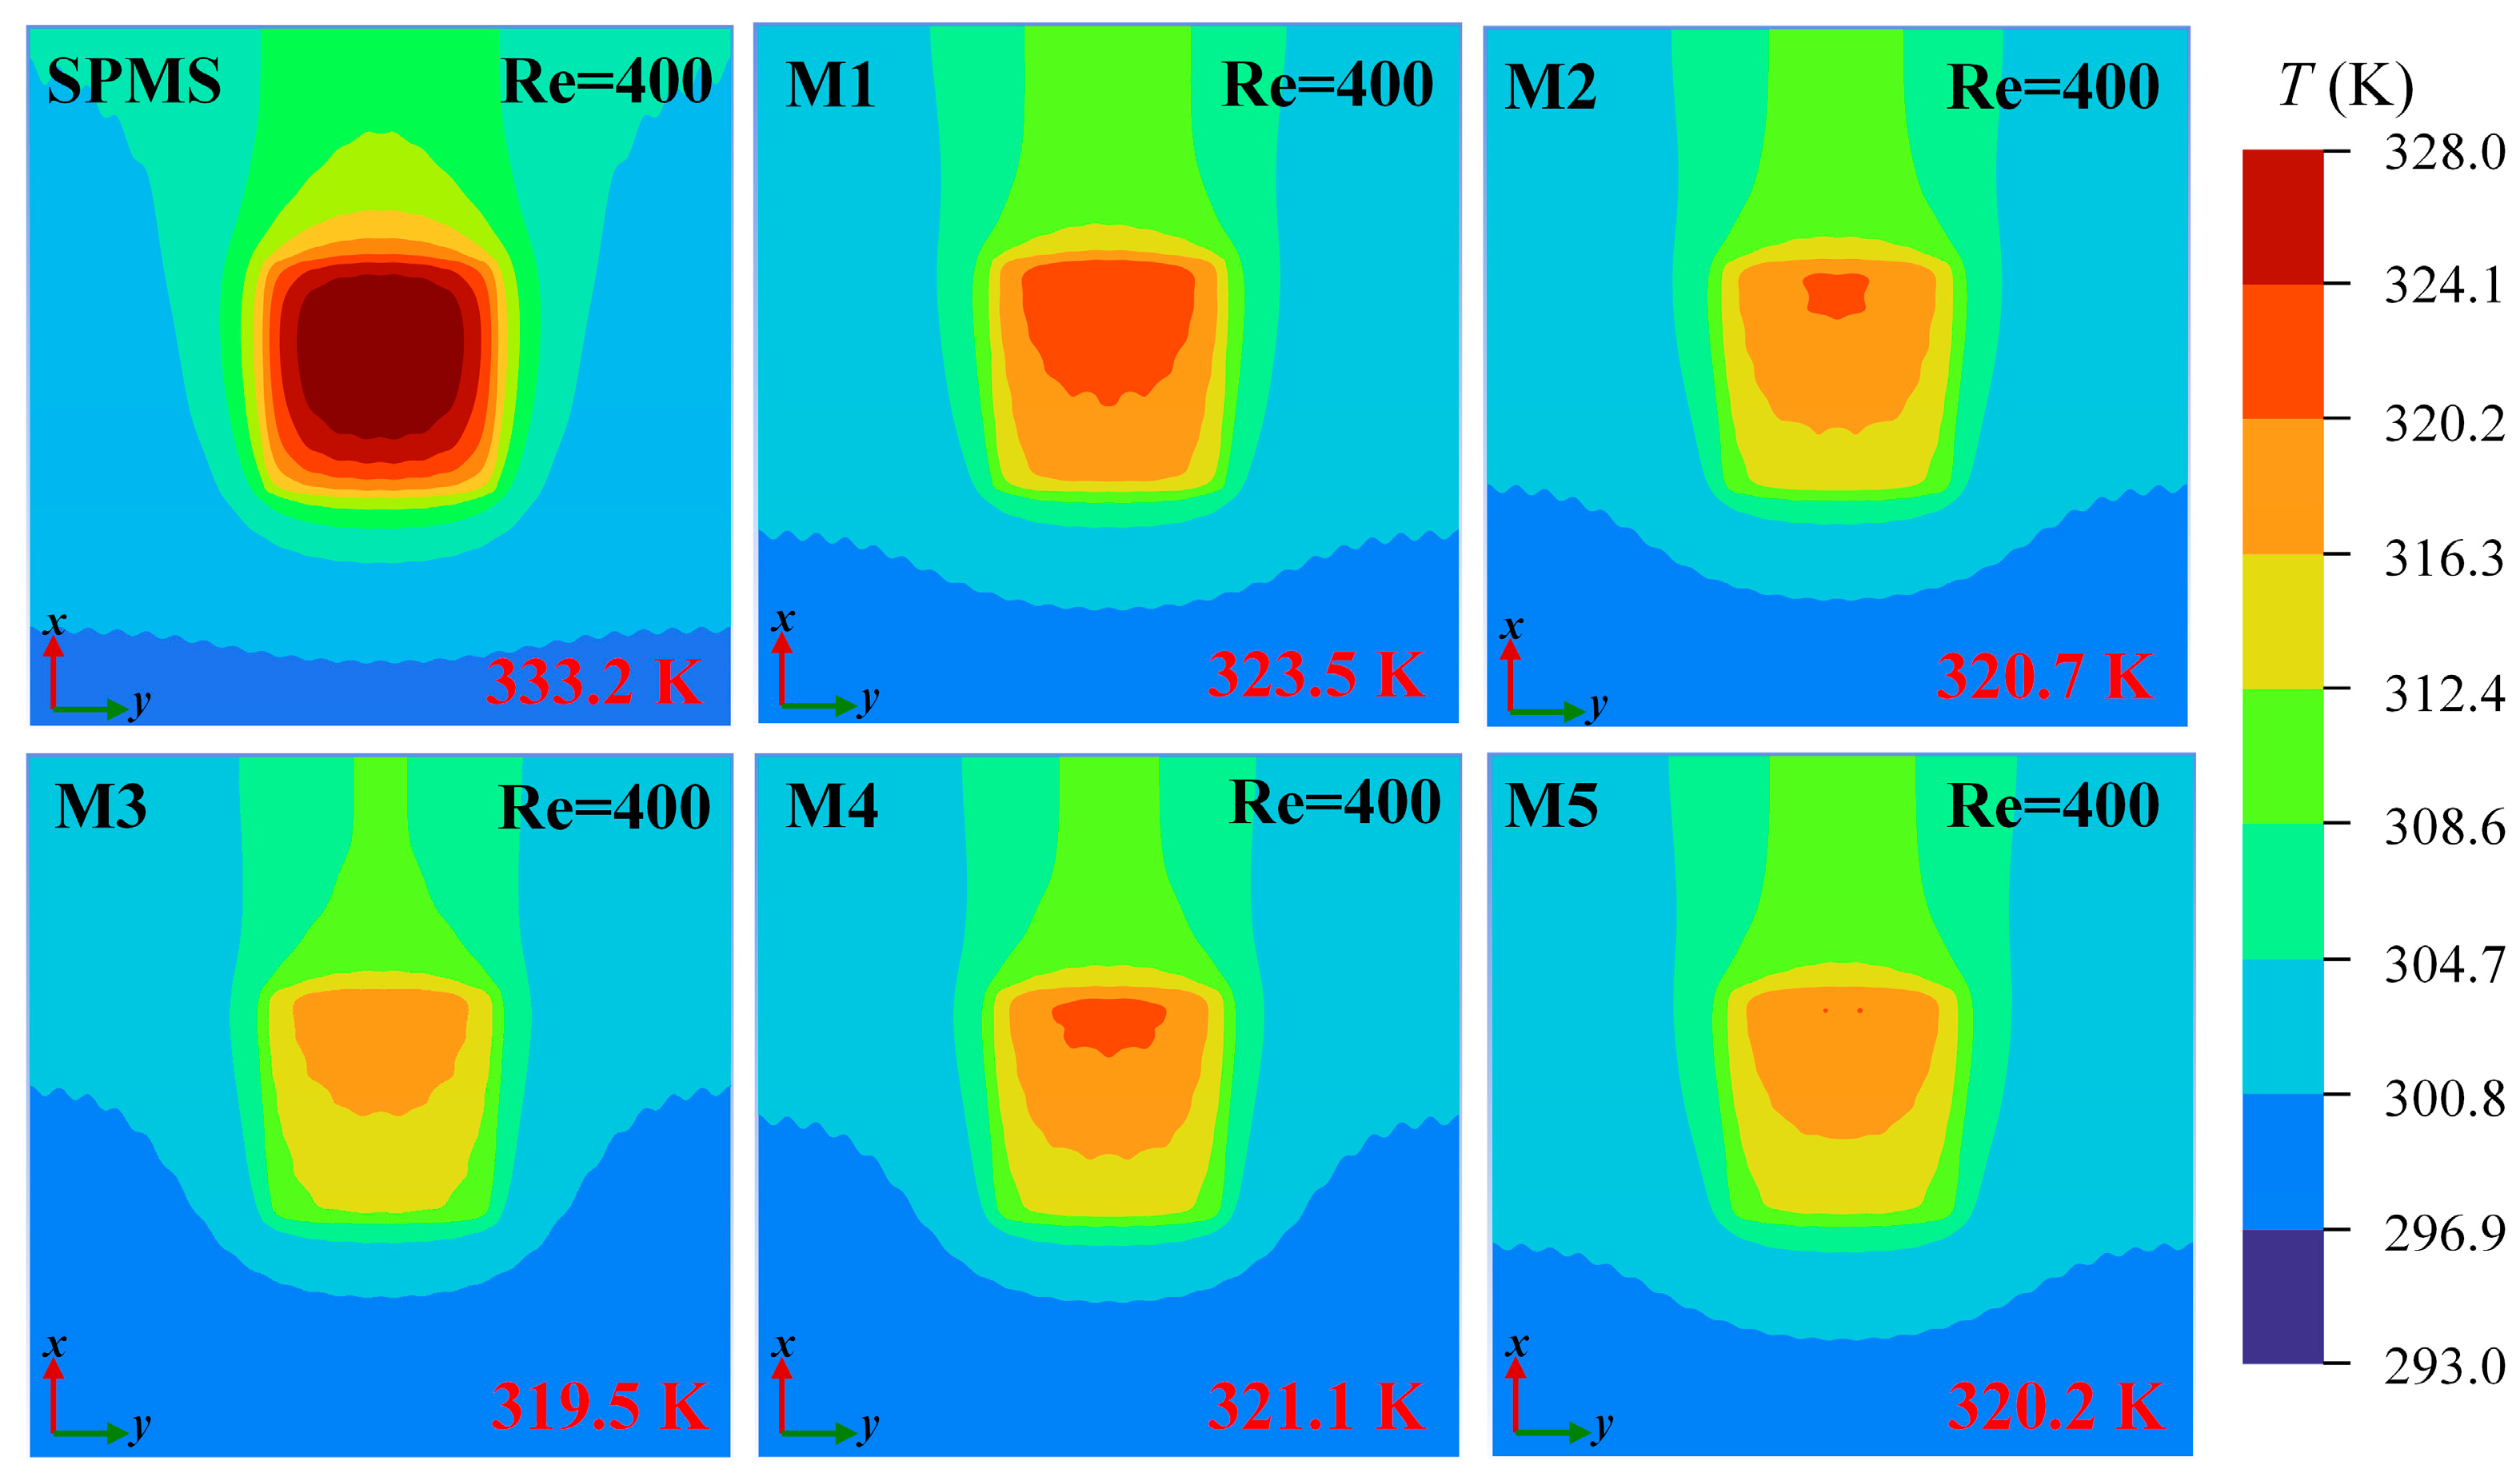
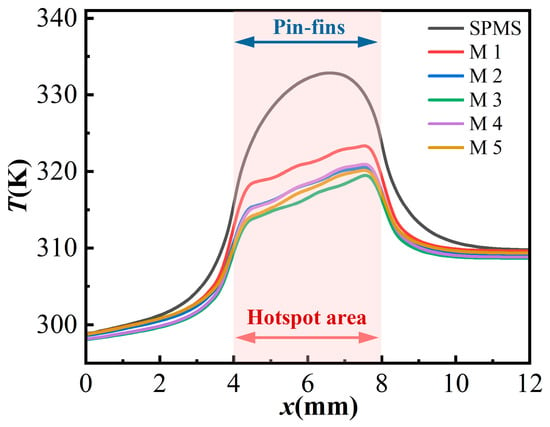
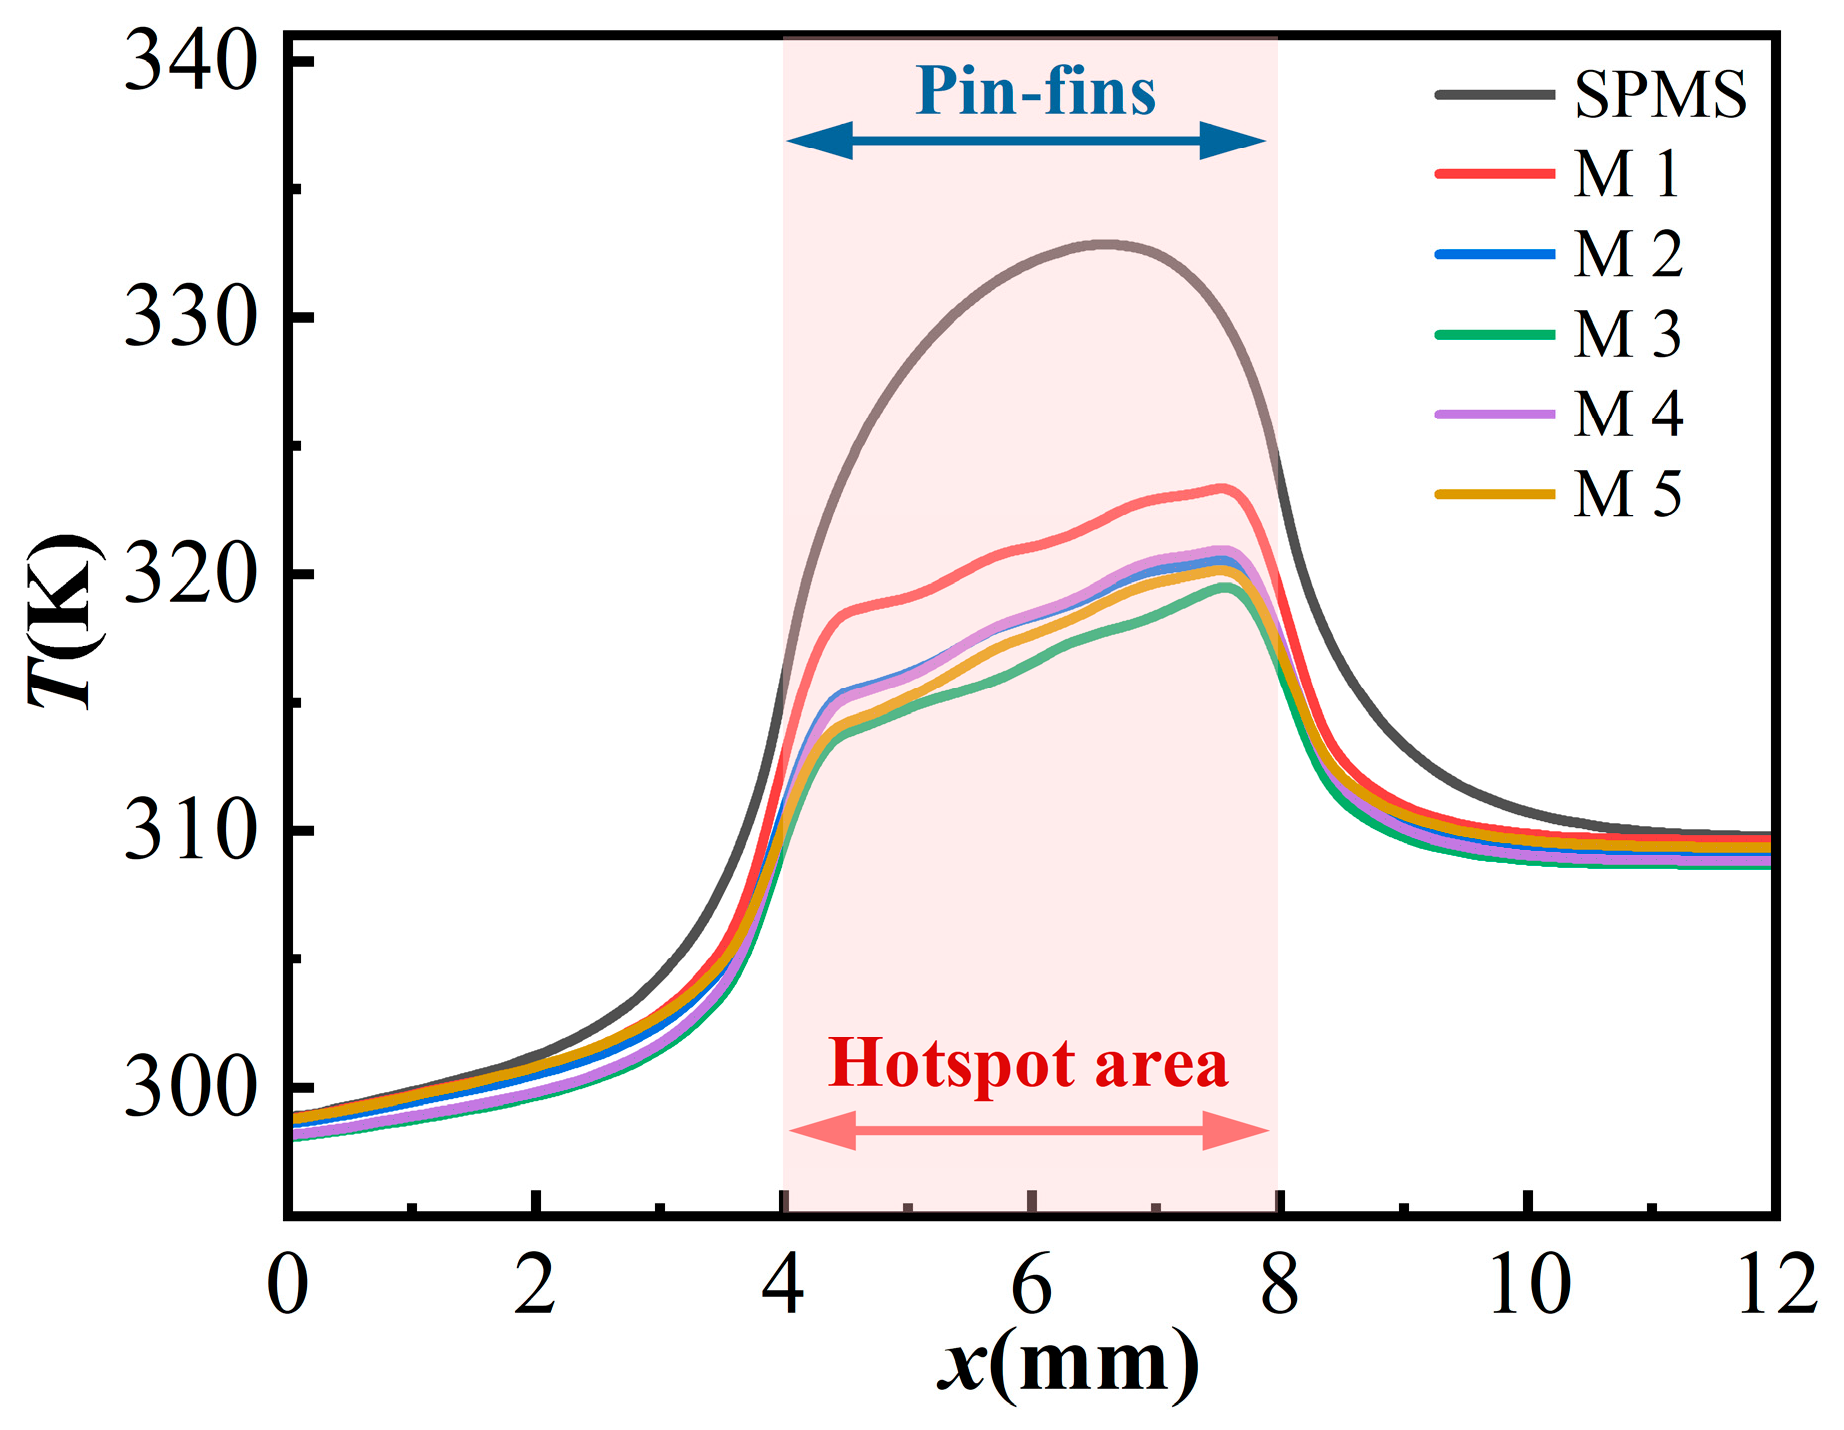
Figure 5 shows the bottom surface temperature distributions of the SPMS and M1–M5 at Re = 400. All results use the same temperature scale. For the SPMS, heat is concentrated in the central hotspot, and the peak temperature reaches 333.2 K. This indicates that straight channels alone cannot suppress the central local hotspot. After the pin-fin structures are introduced, the bottom surface temperature is clearly reduced. The surface temperatures in the hotspot region of M2–M5 are all lower than that of M1. Among them, M3 shows the lowest temperature, with a peak value of 319.5 K, which is 13.7 K lower than that of the SPMS. In addition, along the transverse direction of the flow, M1–M5 show lower surface temperatures. This indicates that the secondary channels enhance transverse fluid disturbance and can effectively suppress the central hotspot. Figure 6 depicts temperature variation of each structure along the flow direction at the bottom centerline, y = 6 mm. When the fluid enters the hotspot region, the temperature increases rapidly, and the differences between different structures become more pronounced. The temperatures of M1–M5 are lower than that of the SPMS along the entire centerline. M2–M5 also show a smoother temperature rise, indicating weaker local heat accumulation and improved surface temperature uniformity. The associated near-wall heat transfer behavior is further examined below using the flow and thermal fields.
Figure 5.
Bottom surface temperature distributions of the SPMS and MPSC structures (M1–M5). The maximum temperature is marked in the lower right corner. All cases are presented using the same temperature range and color scale to ensure direct comparison among different configurations.
Figure 6.
Bottom surface temperature profiles of different structures along the flow direction at y = 6 mm at Re = 400.
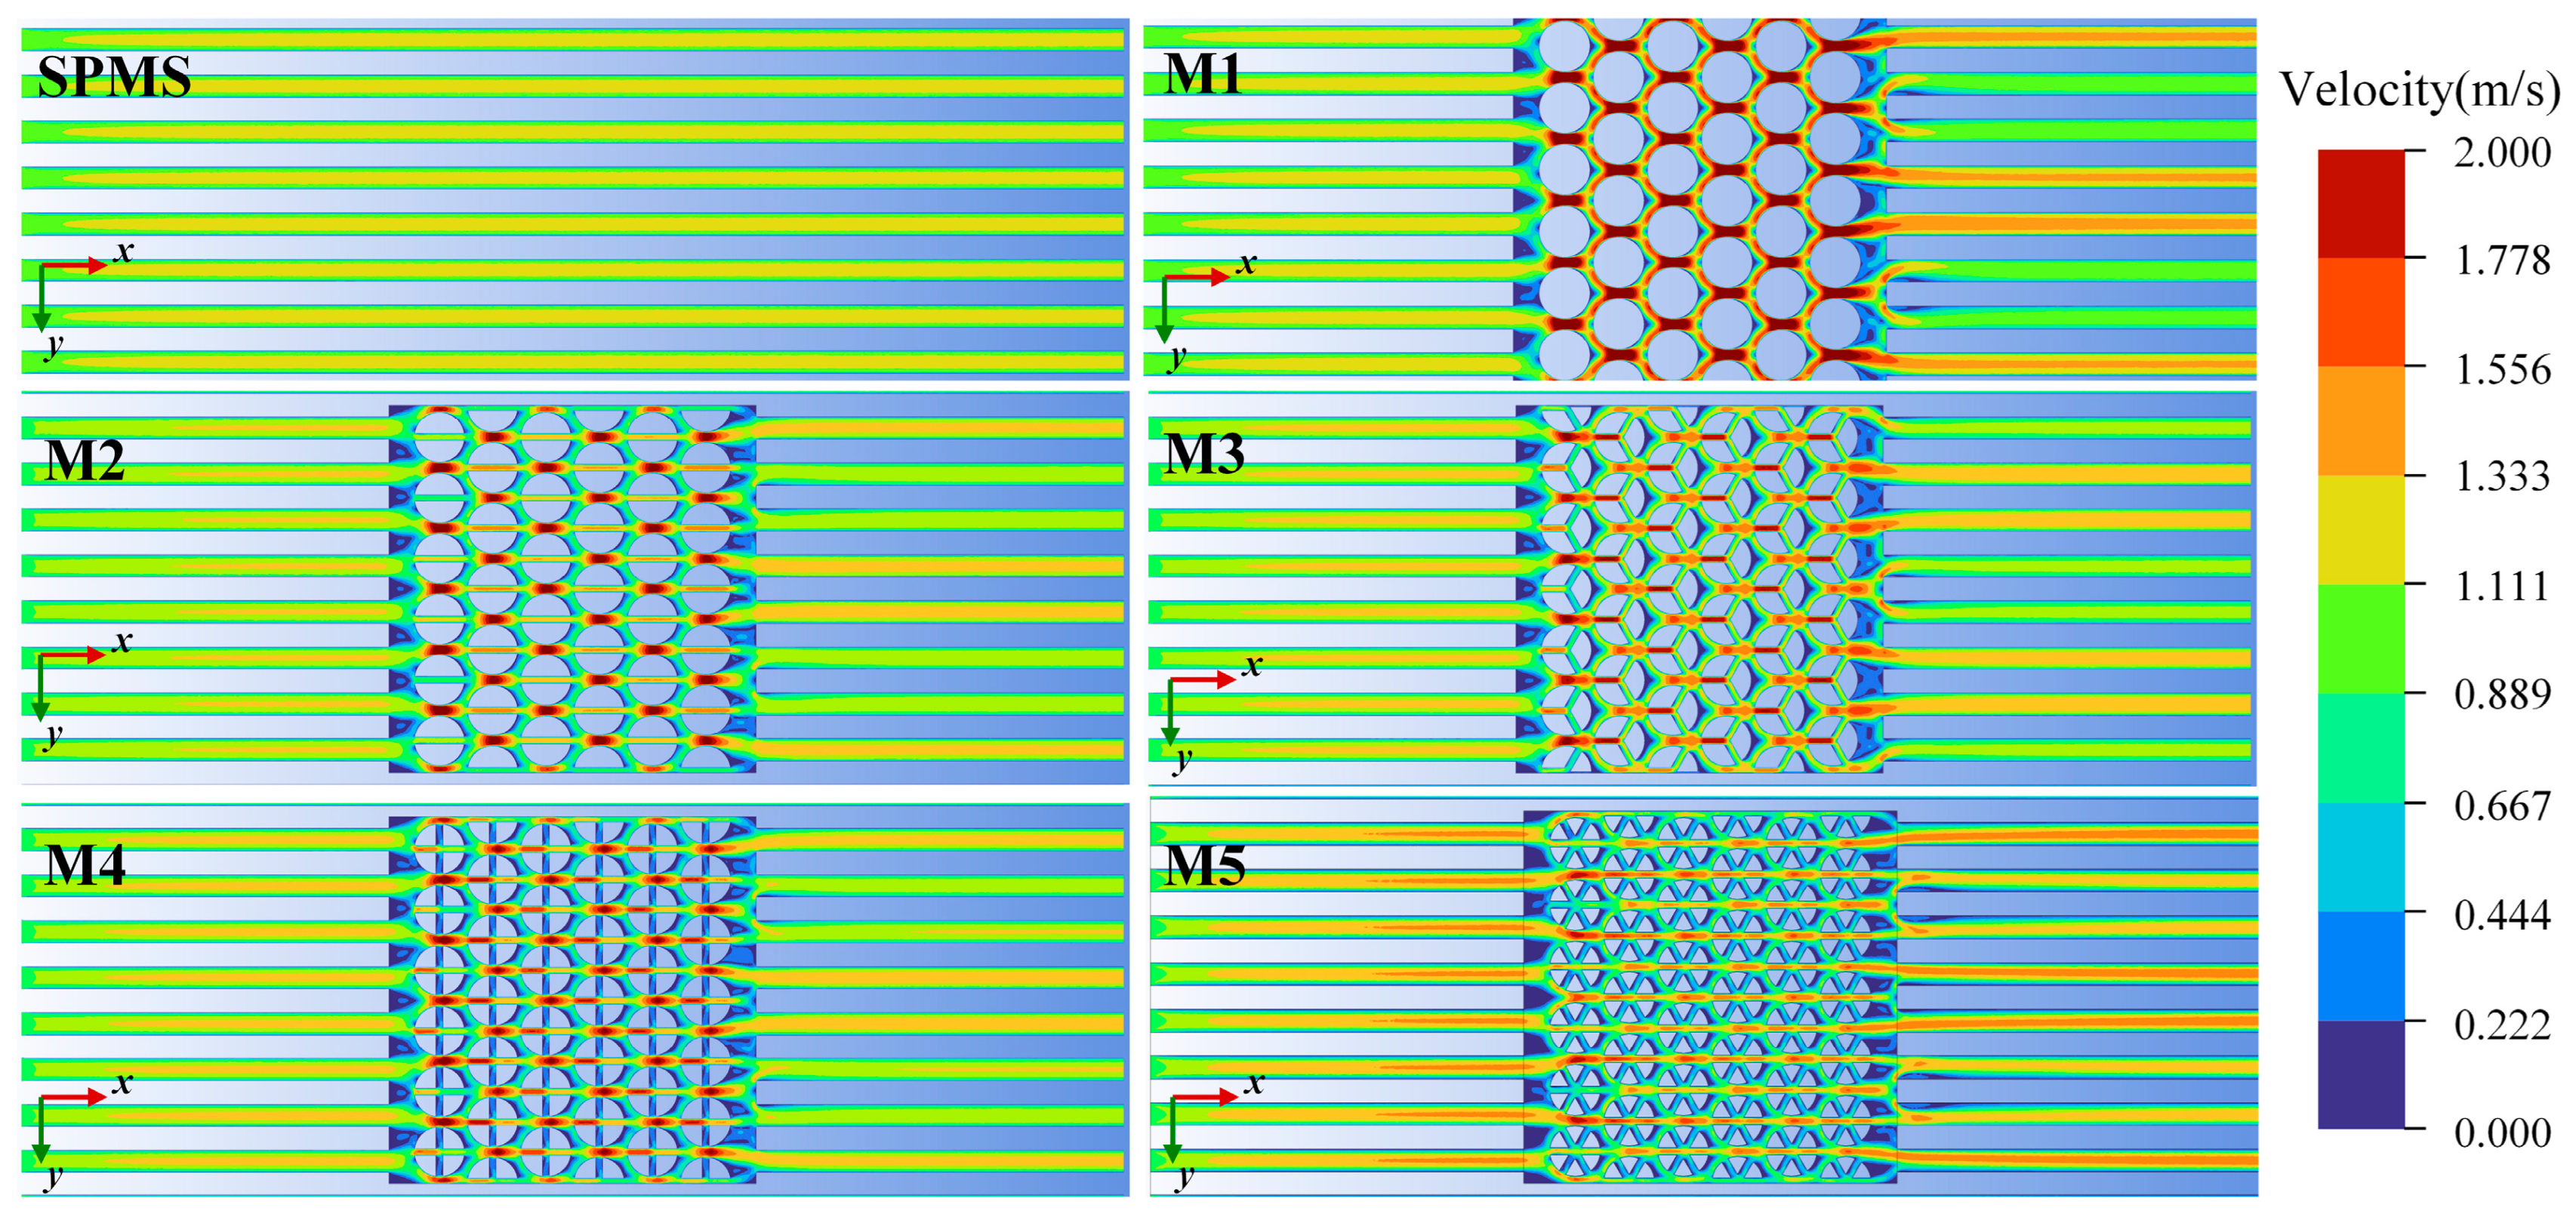
To explain the differences in heat transfer performance, flow behavior in the SPMS and M1–M5 is analyzed. Figure 7 shows the velocity distributions in the central hotspot region at Re = 400. The central eight channels passing through the hotspot are selected, and the section is located at z = 0.6 mm, parallel to the x–y plane. In the SPMS, the fluid flows uniformly along the straight channels, and the thermal boundary layer continues to develop along the flow direction. After the central pin-fins are introduced, the fluid in the hotspot region of M1–M5 is clearly accelerated. The high-velocity regions are mainly located in the main channels and the constricted regions around the pin-fins. The local velocity approaches 2.0 m/s, which is much higher than the overall velocity in the SPMS. The secondary channels change the flow distribution. The average flow velocity in M2–M5 is lower than that in M1 because through or crossed secondary flow paths are developed inside the pin-fins. Part of the coolant is diverted through the interior of the pin-fin array, which reduces the flow velocity and pressure drop.
Figure 7.
Velocity field distributions in the x–y section of the central hotspot region for the SPMS and M1–M5 at Re = 400.
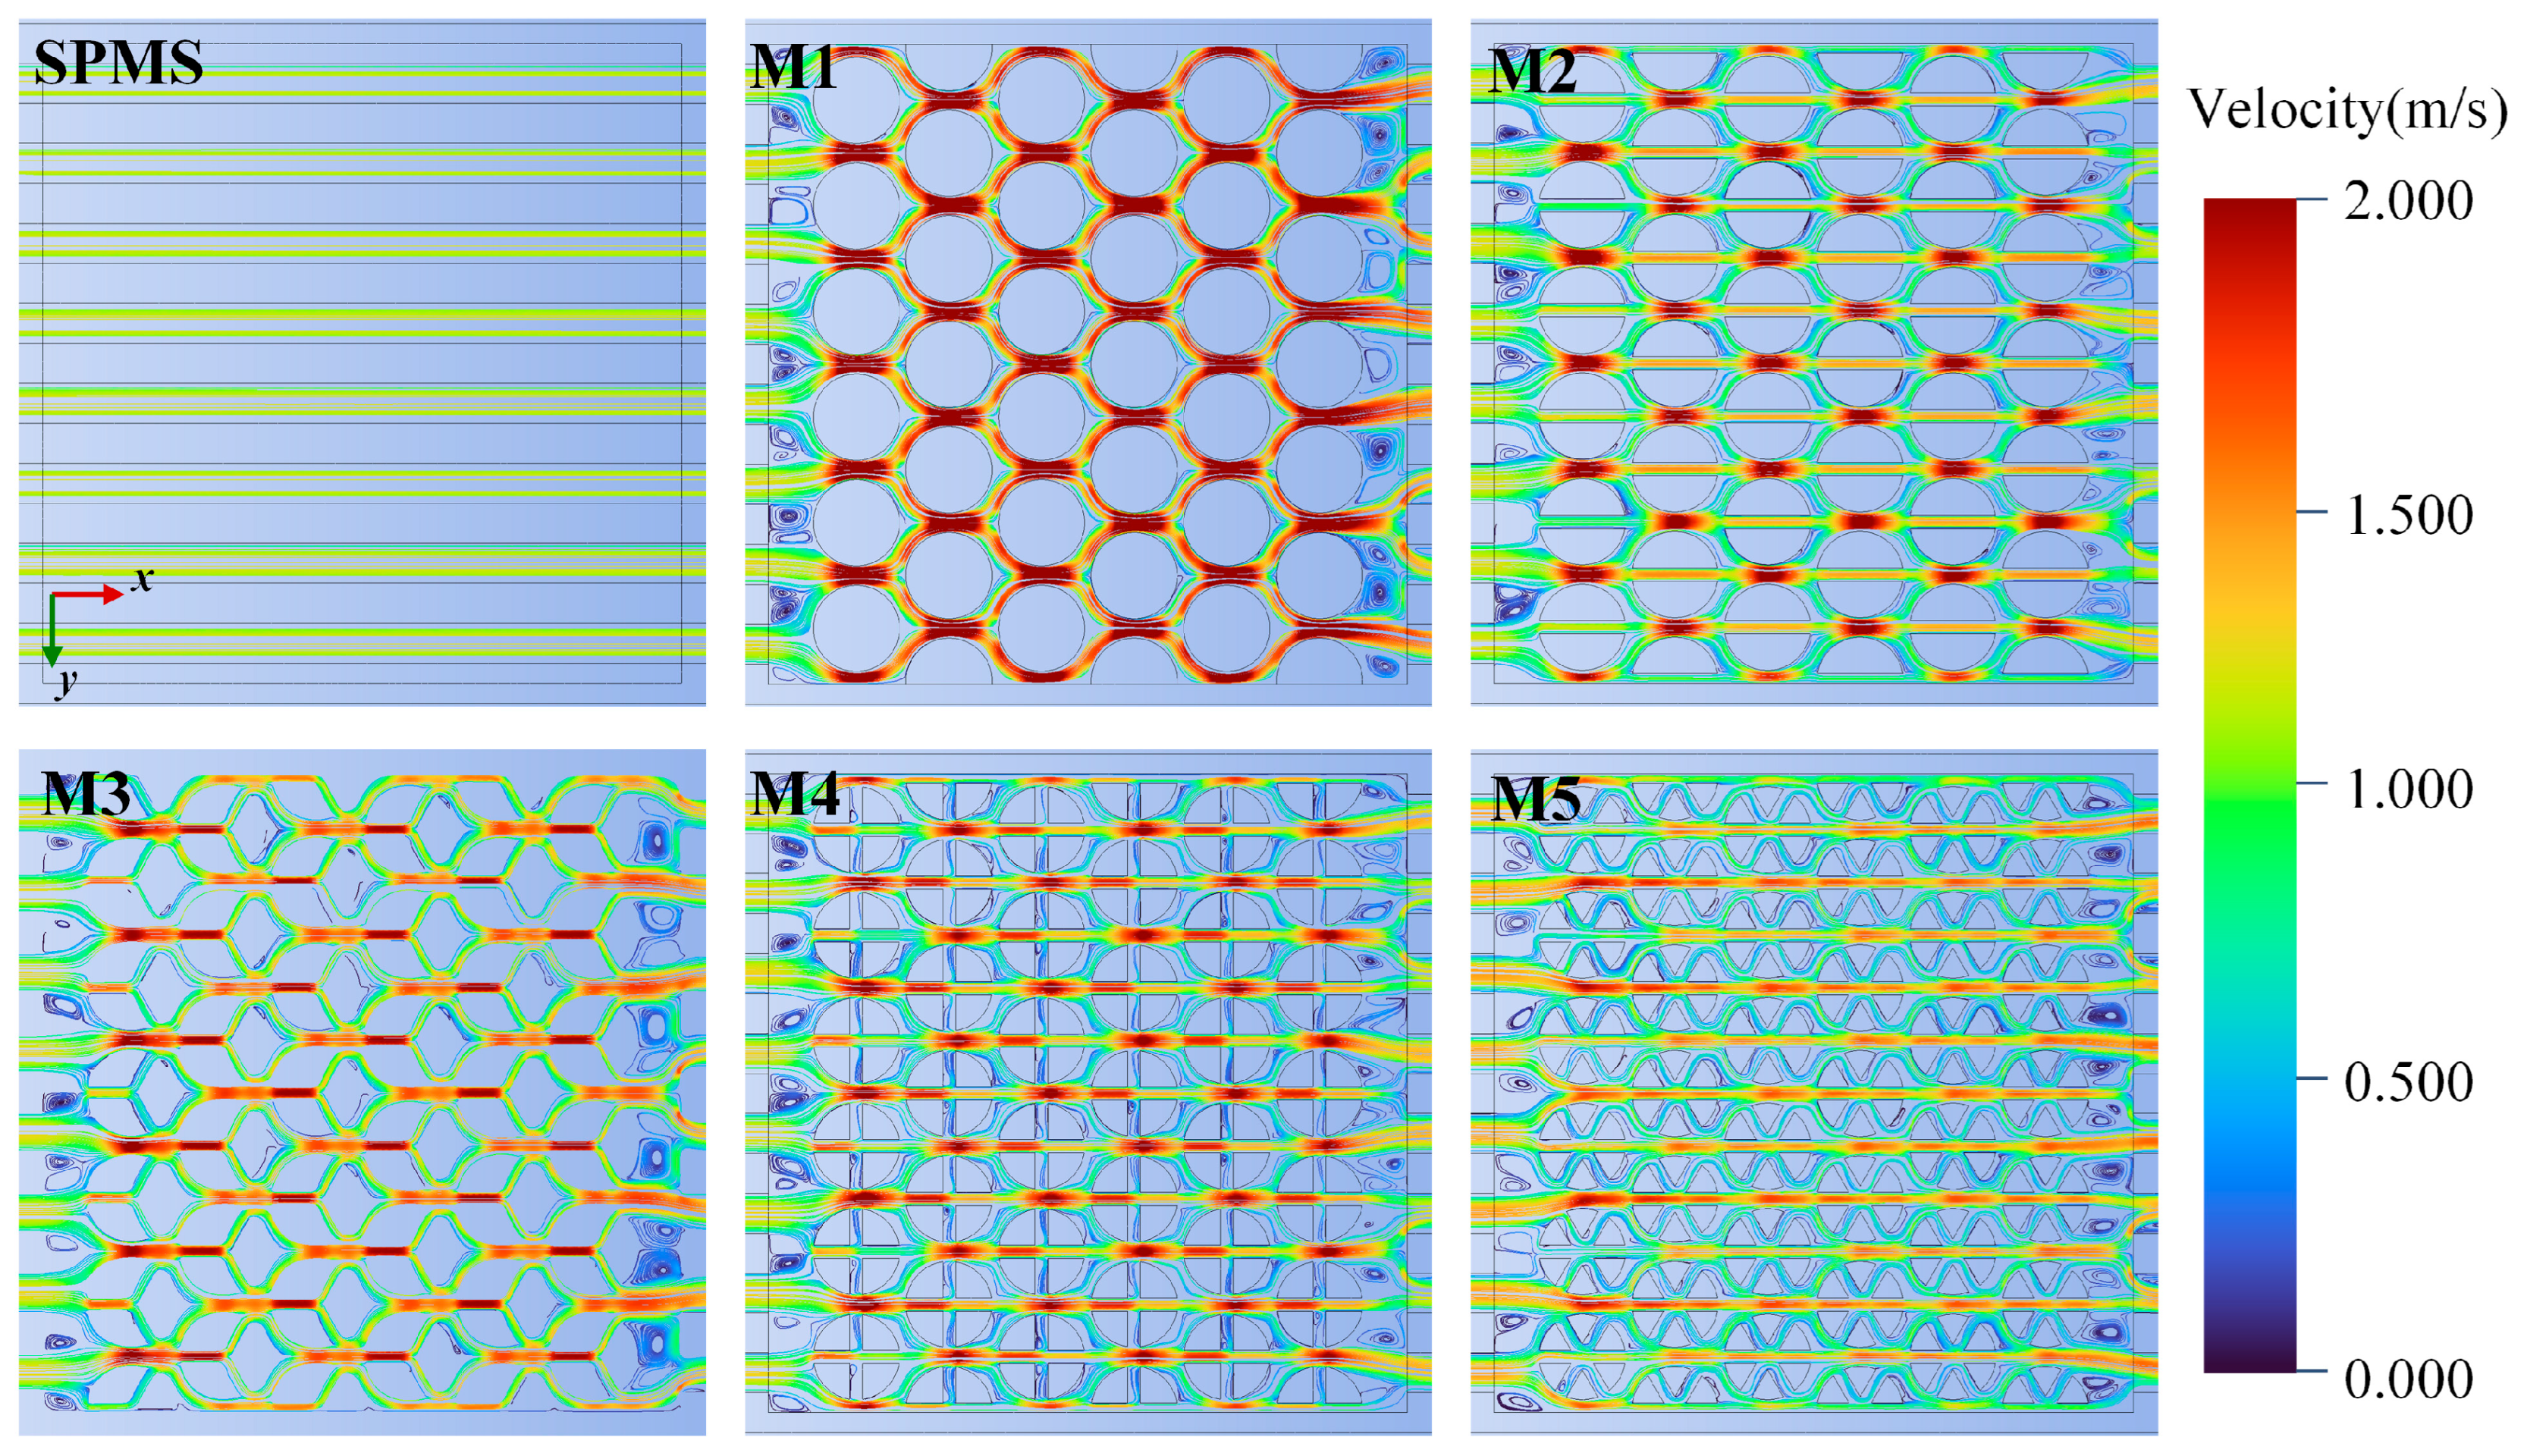
Figure 8 further shows the velocity streamlines around the pin-fin array. In M1, the fluid separates at the front edge of the pin-fins, accelerates in the gaps, and forms low-velocity wake regions behind the pin-fins. Continuous high-velocity regions are observed in M2 and M4, indicating that the secondary channels provide through-flow paths for the fluid and reduce the local blockage caused by the pin-fins. In M4, the fluid also shows clear transverse low-velocity flow with small vortices. M3 has three-directional secondary channels, and its streamline distribution is more balanced. It maintains strong local impingement while avoiding excessive transverse flow dispersion. M5 has the largest number of internal connected paths. The fluid is distributed into more small channels, and the local high-velocity core becomes less concentrated. The results show that M1–M5 have higher flow velocities and larger pressure drops than the SPMS. For M2–M5, the embedded secondary channels allow the fluid to enter the pin-fins. This reduces the dependence on external bypass flow around the pin-fins and promotes transverse exchange between adjacent main channels. The secondary channels introduce pressure-relief paths in the pin-fin array. Part of the flow is shared by the internal channels, local acceleration occurs in the internal channels and junction regions, and small-scale vortices are generated downstream of the pin-fins. These effects enhance the mixing of hot and cold fluids.
Figure 8.
Local velocity streamlines in the pin-fin region of SPMS and M1–M5 at Re = 400.
Compared with M1, M2–M5 not only increase the solid–fluid contact area but also reduce the pressure penalty caused by solid pin-fins. These channels create additional coolant paths in the hotspot region. They refresh the near-wall fluid and weaken thermal boundary-layer growth, thereby improving heat transfer around the pin-fins. The corresponding changes in the near-wall thermal field are examined directly in Figure 9.
Figure 9.
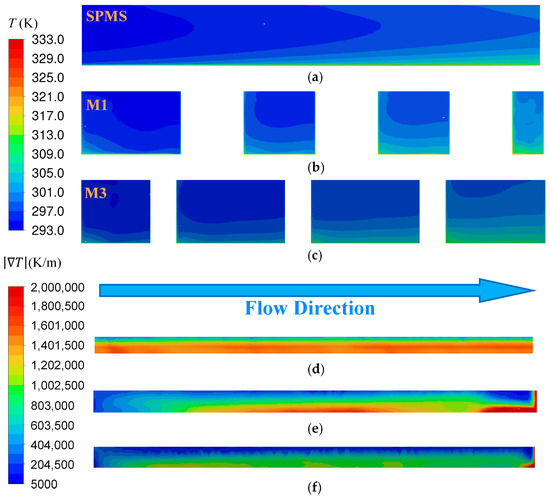
Cross-sectional temperature and near-wall temperature-gradient distributions of the SPMS, M1, and M3 at Re = 400. (a–c) Fluid temperature contours of the SPMS, M1, and M3; (d–f) temperature-gradient magnitude of the SPMS, M1, and M3.
Figure 9 compares the thermal fields of the SPMS, M1, and M3 at Re = 400. The temperature contours are plotted on longitudinal x–z sections at y = 6.5 mm for the SPMS and y = 6.0 mm for M1 and M3. The near-wall temperature-gradient distributions are shown over z = 0.20–0.25 mm on the corresponding sections.
Figure 9a–c show that the SPMS maintains a continuous heated-fluid layer adjacent to the bottom wall, which expands downstream. This reflects the continuous development of the thermal boundary layer in the straight microchannel. In M1, the solid pin-fins interrupt this pattern. The near-wall isotherms are redistributed between successive pin-fins and redevelop downstream of the local disturbances. This behavior agrees with the flow separation and local acceleration observed in Figure 8. For M3, the longitudinal section passes through a streamwise secondary channel inside the pin-fins. The internal passage allows coolant to pass through the pin-fin region and changes the local isotherm pattern. Relative to M1, the near-wall temperature field shows repeated local redistribution along the secondary-channel path. Together with the streamlines, this indicates that the secondary channels promote local coolant exchange and modify the local redevelopment of the thermal boundary layer.
To characterize the local spatial variation of the thermal field near the heated wall, the temperature-gradient magnitude is defined as
where T is temperature (K), and x, y, and z are the Cartesian coordinates (m). has a unit of K/m and reflects the local spatial variation in temperature.
Figure 9d–f further compare the temperature-gradient magnitude within z = 0.20–0.25 mm. In the SPMS, the near-wall gradient band remains relatively continuous along the flow direction. In M1, the pin-fin disturbance causes clear local changes in the gradient distribution. M3 shows further local redistribution of the gradient field along the secondary-channel path. The comparison indicates that the secondary channels redistribute the near-wall temperature gradient. Combined with the temperature contours and velocity streamlines, these results support that the internal channels promote coolant exchange and redevelopment of the thermal boundary layer.
3.2. Effect of Reynolds Number on the Thermal–Hydraulic Performance of Different Structures
The thermal–hydraulic performance of each structure is investigated under different Re values at the same hotspot heat flux of 300 W/cm2 and background heat flux of 50 W/cm2.
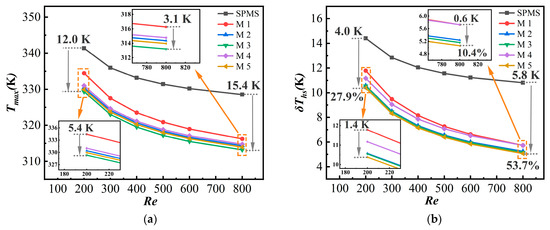
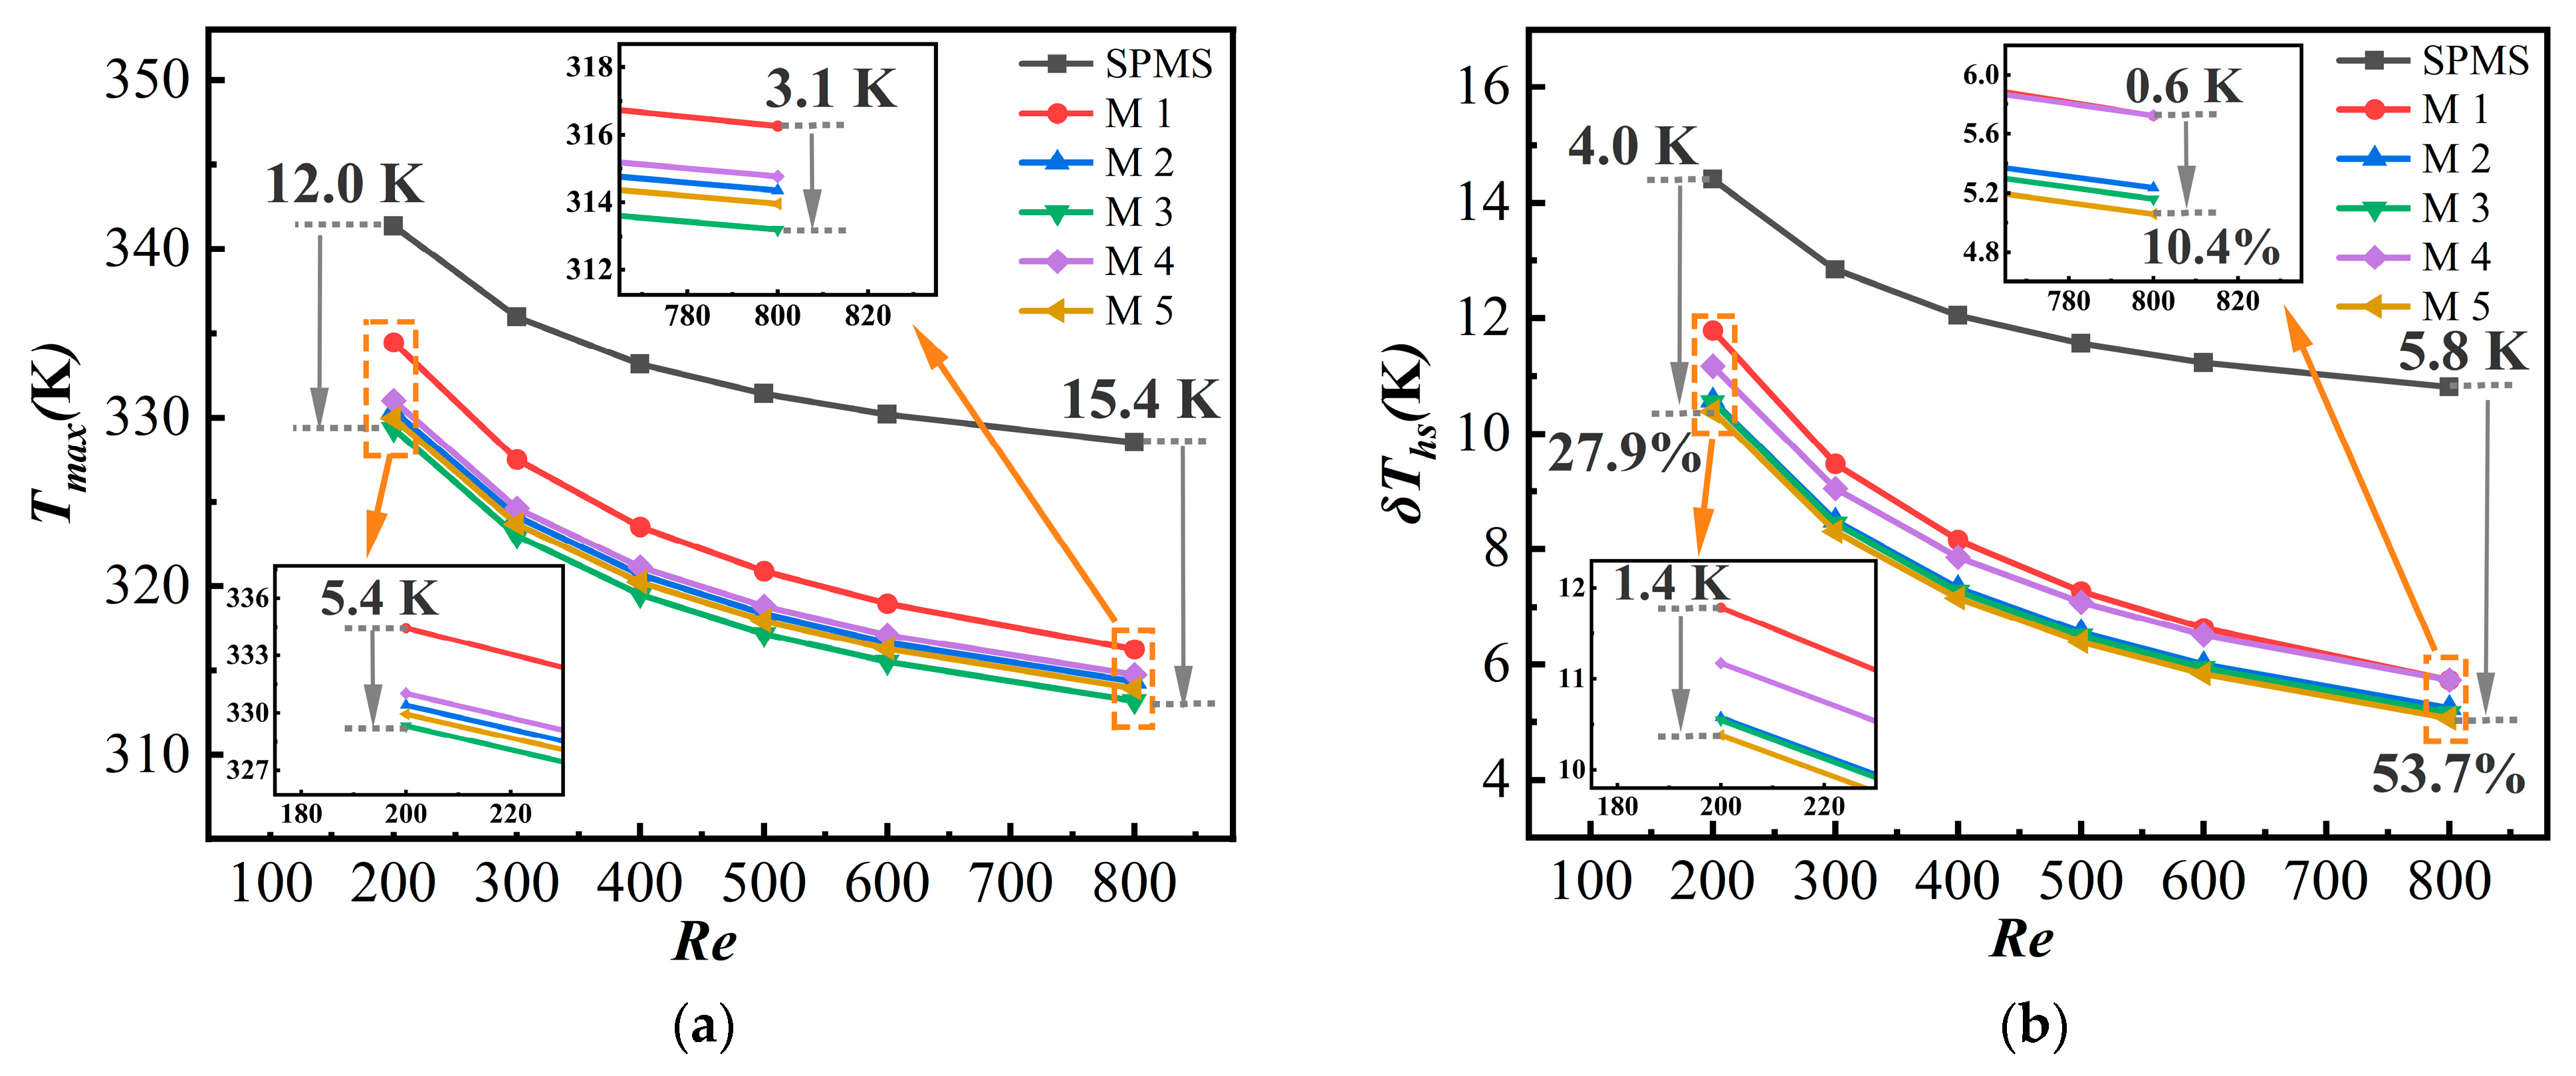
Figure 10 shows the variations in the performance parameters of different structures over Re = 200–800. Figure 10a shows the maximum temperature (Tmax) of the SPMS and M1–M5. As Re increases, Tmax decreases continuously for all six structures, but the marginal benefit of increasing the flow rate gradually weakens. M1–M5 show much lower Tmax values than the SPMS over the entire Re range, and M3 has the lowest Tmax. At Re = 200 and 800, the Tmax of M3 is about 12.0 K and 15.4 K lower than that of the SPMS, respectively. Compared with M1, the reductions are 5.4 K and 3.1 K, respectively. This is because the secondary channels promote flow diversion and recombination, which disrupts the thermal boundary layer. Figure 10b shows the variation in MATD (δThs) over Re = 200–800. As Re increases, δThs decreases continuously for all six structures. The SPMS always has the largest δThs, indicating that straight microchannels have limited ability to reduce temperature accumulation caused by the central hotspot. The secondary-channel structures in M2–M5 further improve fluid redistribution in the pin-fin region, making the temperature field in the hotspot region more uniform. Among them, M5 has the lowest δThs. At Re = 200 and 800, the δThs of M5 is 4.0 K (27.9%) and 5.8 K (53.7%) lower than that of the SPMS, respectively. This is attributed to the strong flow diversion effect of the six-directional secondary channels in M5. As the flow velocity increases, fluid mixing is enhanced, and the advantage of the secondary channels in improving temperature uniformity becomes more pronounced.
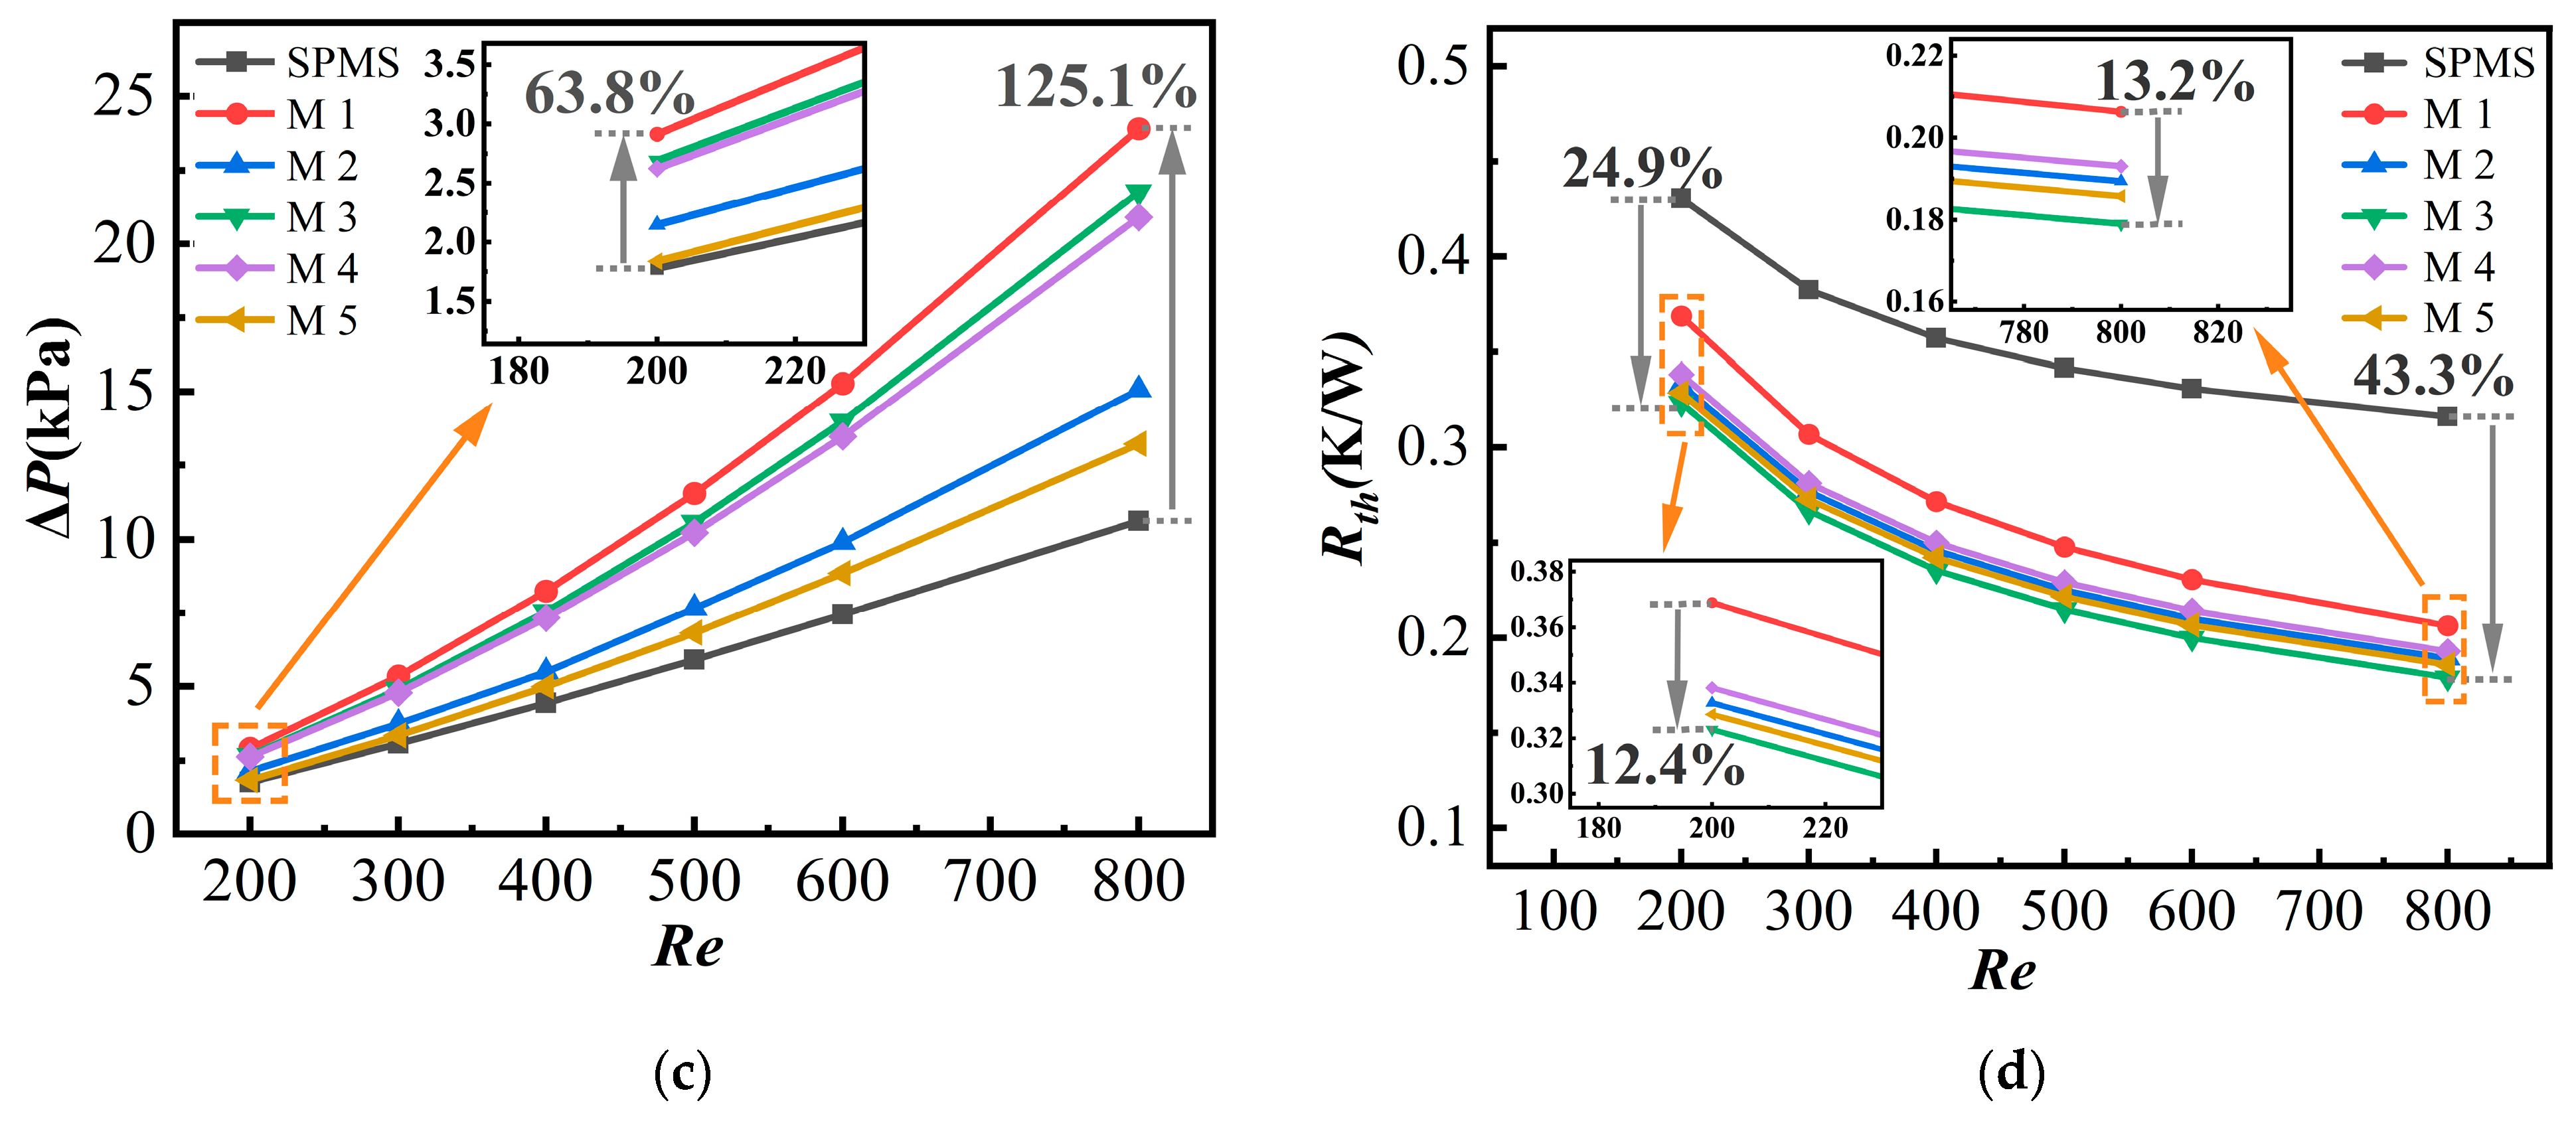
Figure 10.
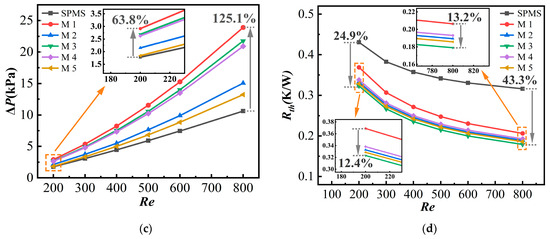
Variations in the performance parameters of SPMS and M1–M5 at Re = 200–800. (a) Tmax; (b) δThs; (c) ΔP; (d) Rth.
Figure 10c shows the variation in channel pressure drop (ΔP). All structures show a clear nonlinear increase in ΔP. Compared with the SPMS, M1–M5 show a faster increase in pressure drop. M1 has the strongest blockage effect, and its pressure drop is 125.1% higher than that of the SPMS at Re = 800. Compared with M1, M2–M5 show lower pressure drops overall. Among them, the pressure drop of M5 is 13.22 kPa at Re = 800, which is close to that of the SPMS. This is because the embedded secondary channels provide additional through-flow paths for the coolant. Part of the flow is transferred into the internal channels of the pin-fins, which reduces the flow velocity and lowers part of the blockage loss while maintaining flow disturbance in the hotspot region. Figure 10d shows the variation in total thermal resistance (Rth). At Re = 200 and 800, the Rth of M3 is 24.9% and 43.3% lower than that of the SPMS, respectively. The internal secondary channels promote fluid exchange and allow heat to be transferred more effectively to the coolant. This advantage becomes more evident as Re increases.
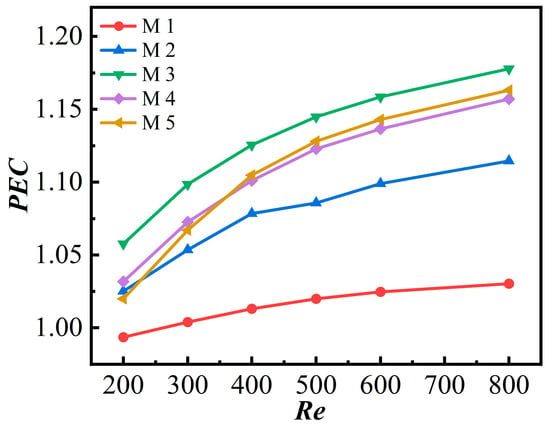
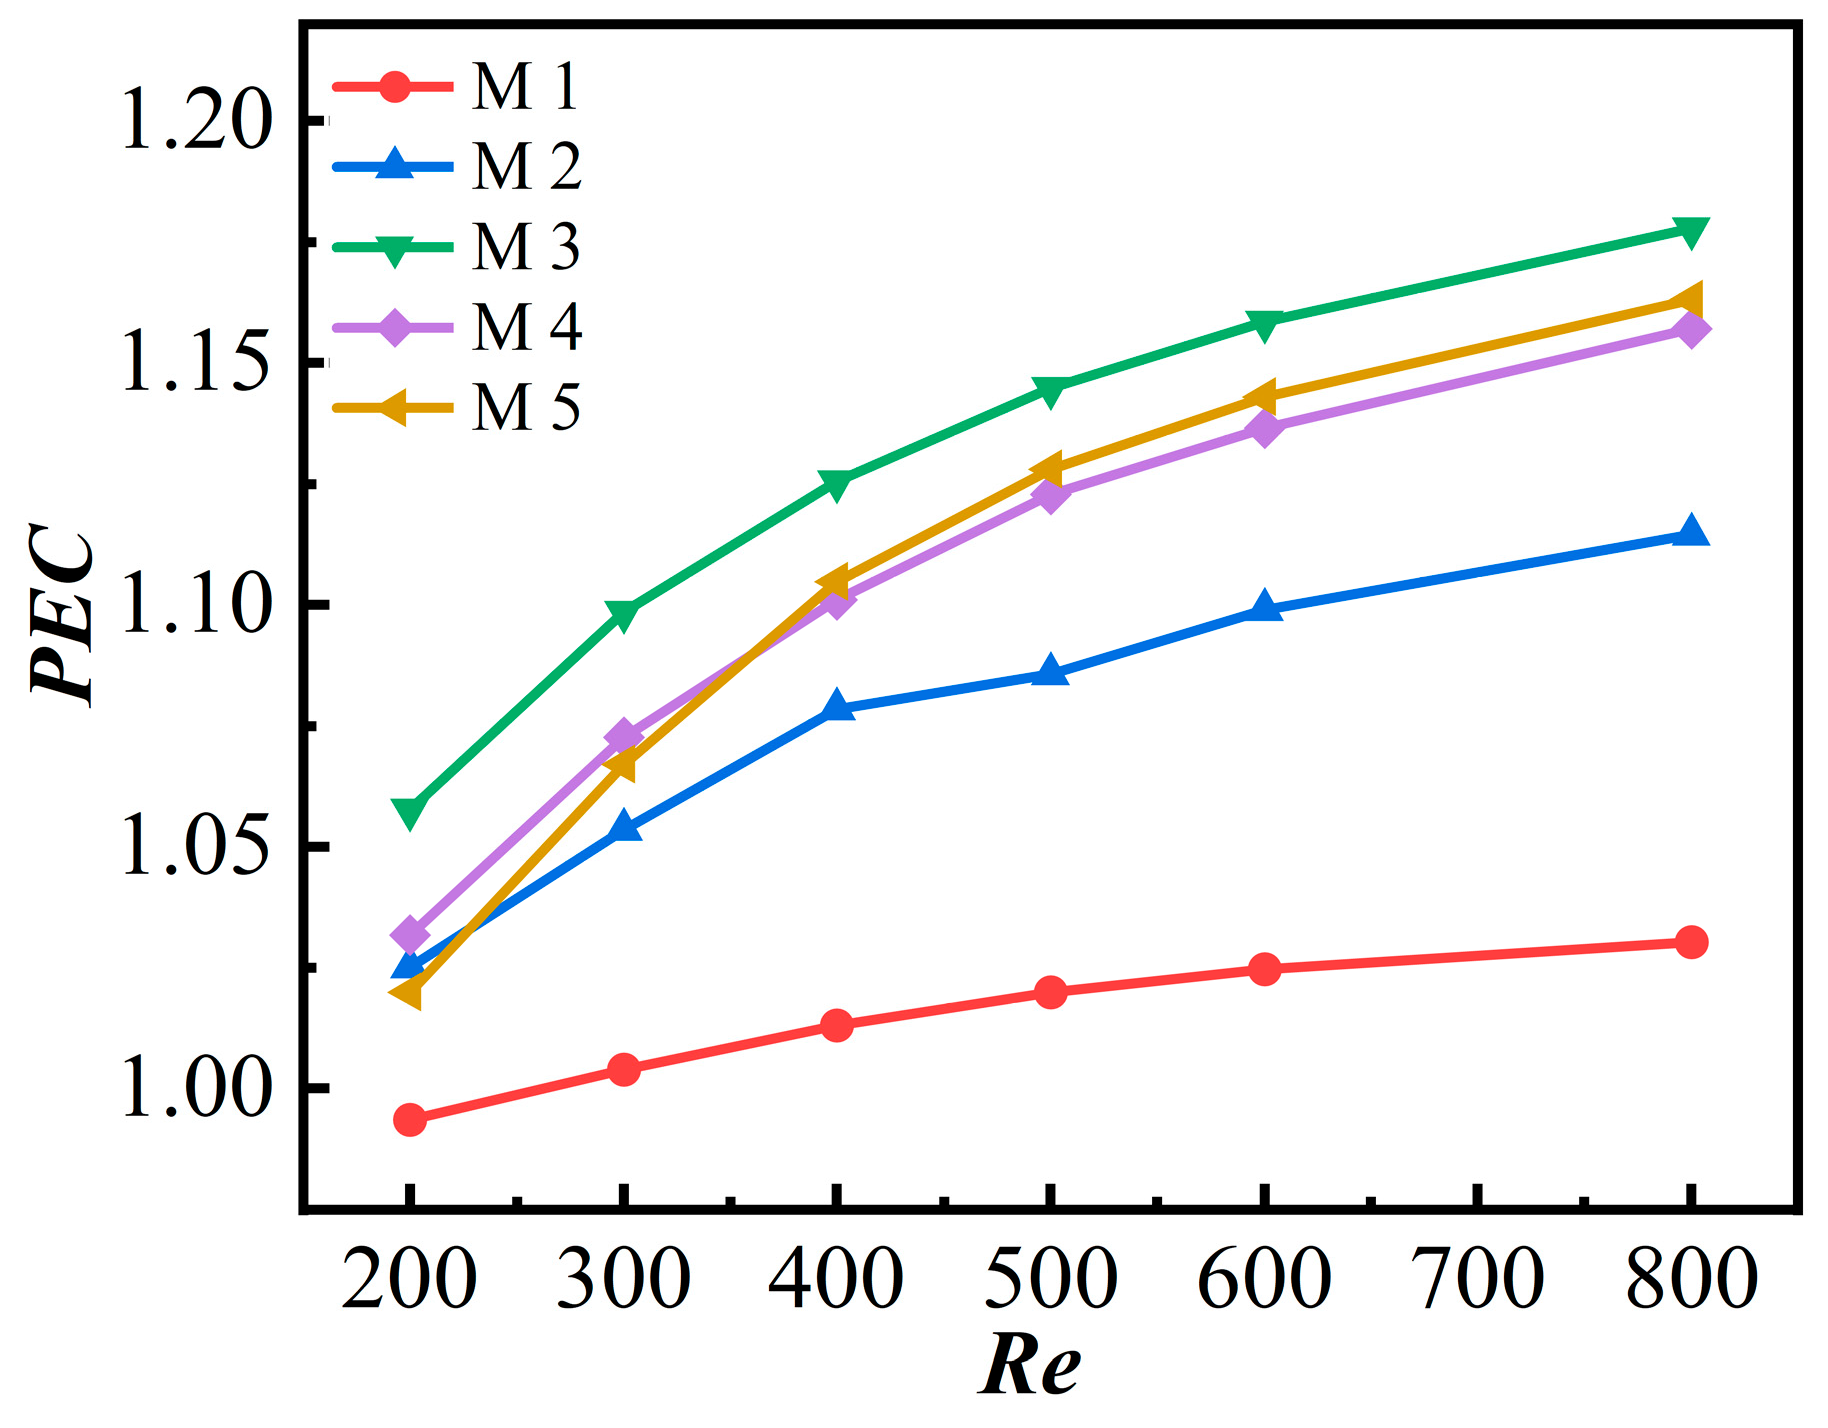
Figure 11 depicts PEC for M1–M5 over Re = 200–800. As Re increases, the PEC values of M1–M5 all show an upward trend. At higher flow velocities, the heat transfer gains of M1–M5 gradually exceed their additional flow resistance. The PEC values of M2–M5 are clearly higher than that of M1 at Re = 200–800. Among them, M3 shows the best performance, with a maximum PEC of 1.178. This indicates that the embedded secondary channels maintain heat transfer enhancement and reduce pressure drop penalty through internal flow diversion, leading to better overall thermal–hydraulic performance.
Figure 11.
Variation in PEC for M1–M5 at Re = 200–800.
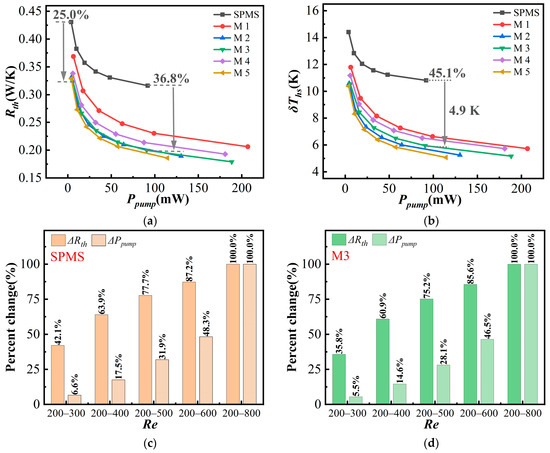
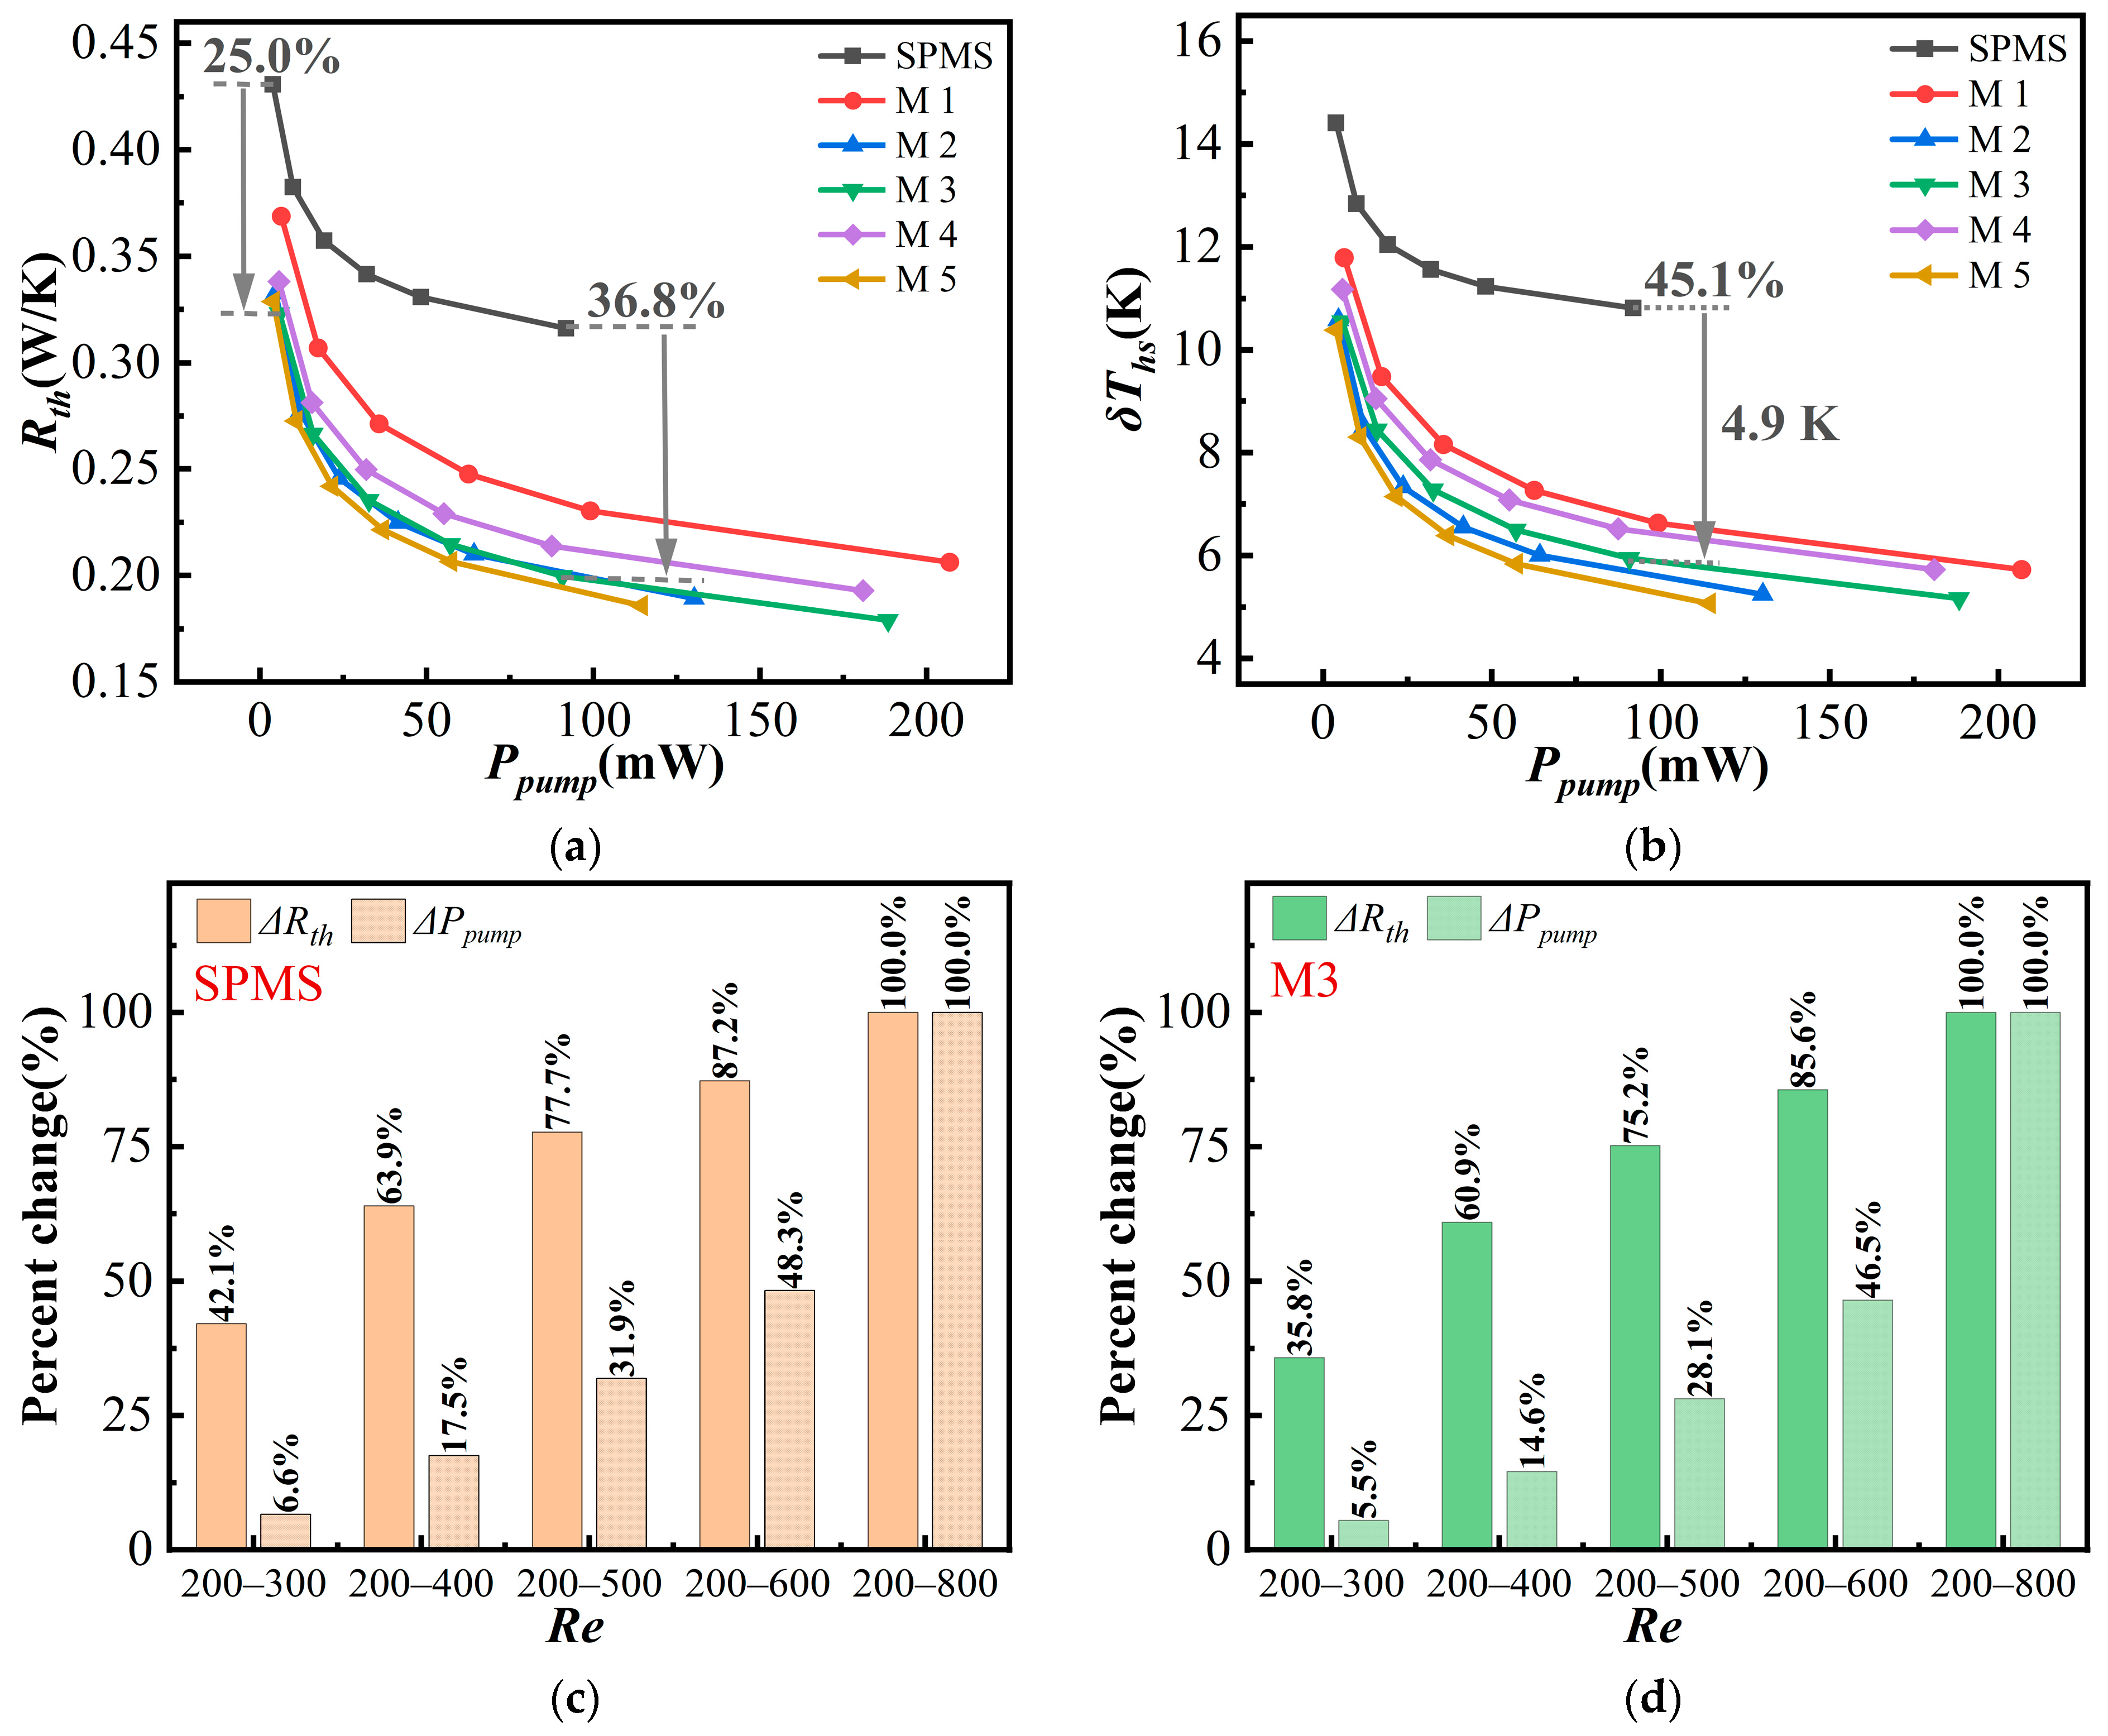
Since different structures have different flow resistances, comparison at the same Re alone cannot directly reflect the energy consumption level. Therefore, Figure 12a further compares Rth among different structures using pumping power (Ppump) as the reference. M1–M5 all show lower Rth values at similar Ppump levels. At 5.8 mW, the Rth of M3 is about 0.32 K/W, which is about 25.0% lower than that of the SPMS. This indicates that the MPSC structures already have a clear thermal resistance advantage under low-energy-consumption conditions. To reach a similar thermal resistance level, the SPMS requires a pumping power of about 92 mW. At a comparable pumping power, the Rth of M3 decreases to 0.20 K/W, corresponding to a reduction of 36.8%. This shows that the MPSC structures can improve heat transfer while maintaining good flow performance, which is of practical engineering value. Figure 12b shows a similar nonlinear trend in δThs. With secondary channels, M2–M5 achieve better temperature uniformity at lower pumping power. For the SPMS, δThs is 10.81 K at 91.9 mW, while M3 reduces δThs by 45.1% at a similar Ppump level.
Figure 12.
Variations in (a) total thermal resistance (Rth) and (b) MATD (δThs) with pumping power (Ppump) over Re = 200–800. (c) Thermal resistance reduction ratio (ΔRth) and pumping power increase ratio (ΔPpump) of the SPMS; (d) ΔRth and ΔPpump of M3.
Figure 12a,b show diminishing thermal returns with increasing Ppump, which is not cost-effective in engineering applications. Figure 12c,d further quantify the relationship between Rth benefit and Ppump consumption. Taking Re = 200 as the baseline condition and Re = 800 as the normalized endpoint, the thermal resistance reduction ratio and pumping power increase ratio are defined as
where ΔRth (%) represents the cumulative thermal resistance reduction ratio obtained when Re increases from 200 to Rei, and ΔPpump (%) represents the cumulative pumping power increase ratio required to reach this condition. For the SPMS, raising Re from 200 to 300 consumes only 6.6% of the total pumping-power increase but delivers 42.1% of the total Rth reduction. In contrast, the final increase from Re = 600 to 800 requires another 51.7% of pumping power for only 12.8% additional Rth reduction. M3 shows a similar trend, but its absolute performance improvement is better than that of the SPMS. Practical operation should therefore avoid unnecessarily high flow rates.
3.3. Heat Transfer Performance Analysis Under Different Hotspot Heat Fluxes
The safe operating temperature of a microprocessor is 358.15 K. To evaluate the load capacity of different structures, the hotspot heat flux is gradually increased at Re = 400, and the heat transfer performance of different structures is systematically compared. It should be noted that, in actual chip packaging, the heat flux that the heat sink can safely withstand may be lower because of the thermal interface layer, the inherent thermal resistance inside the chip, and the decrease in silicon thermal conductivity with increasing temperature.
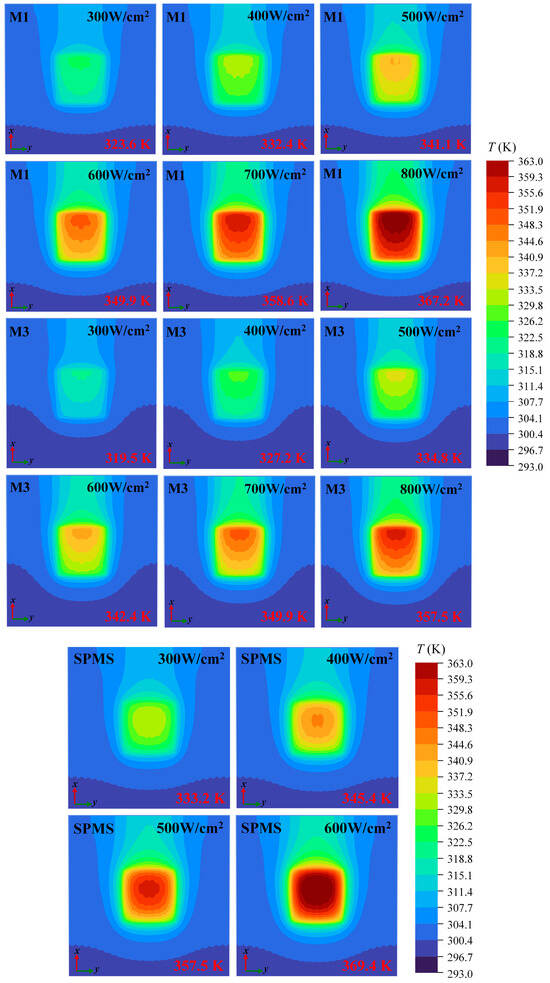
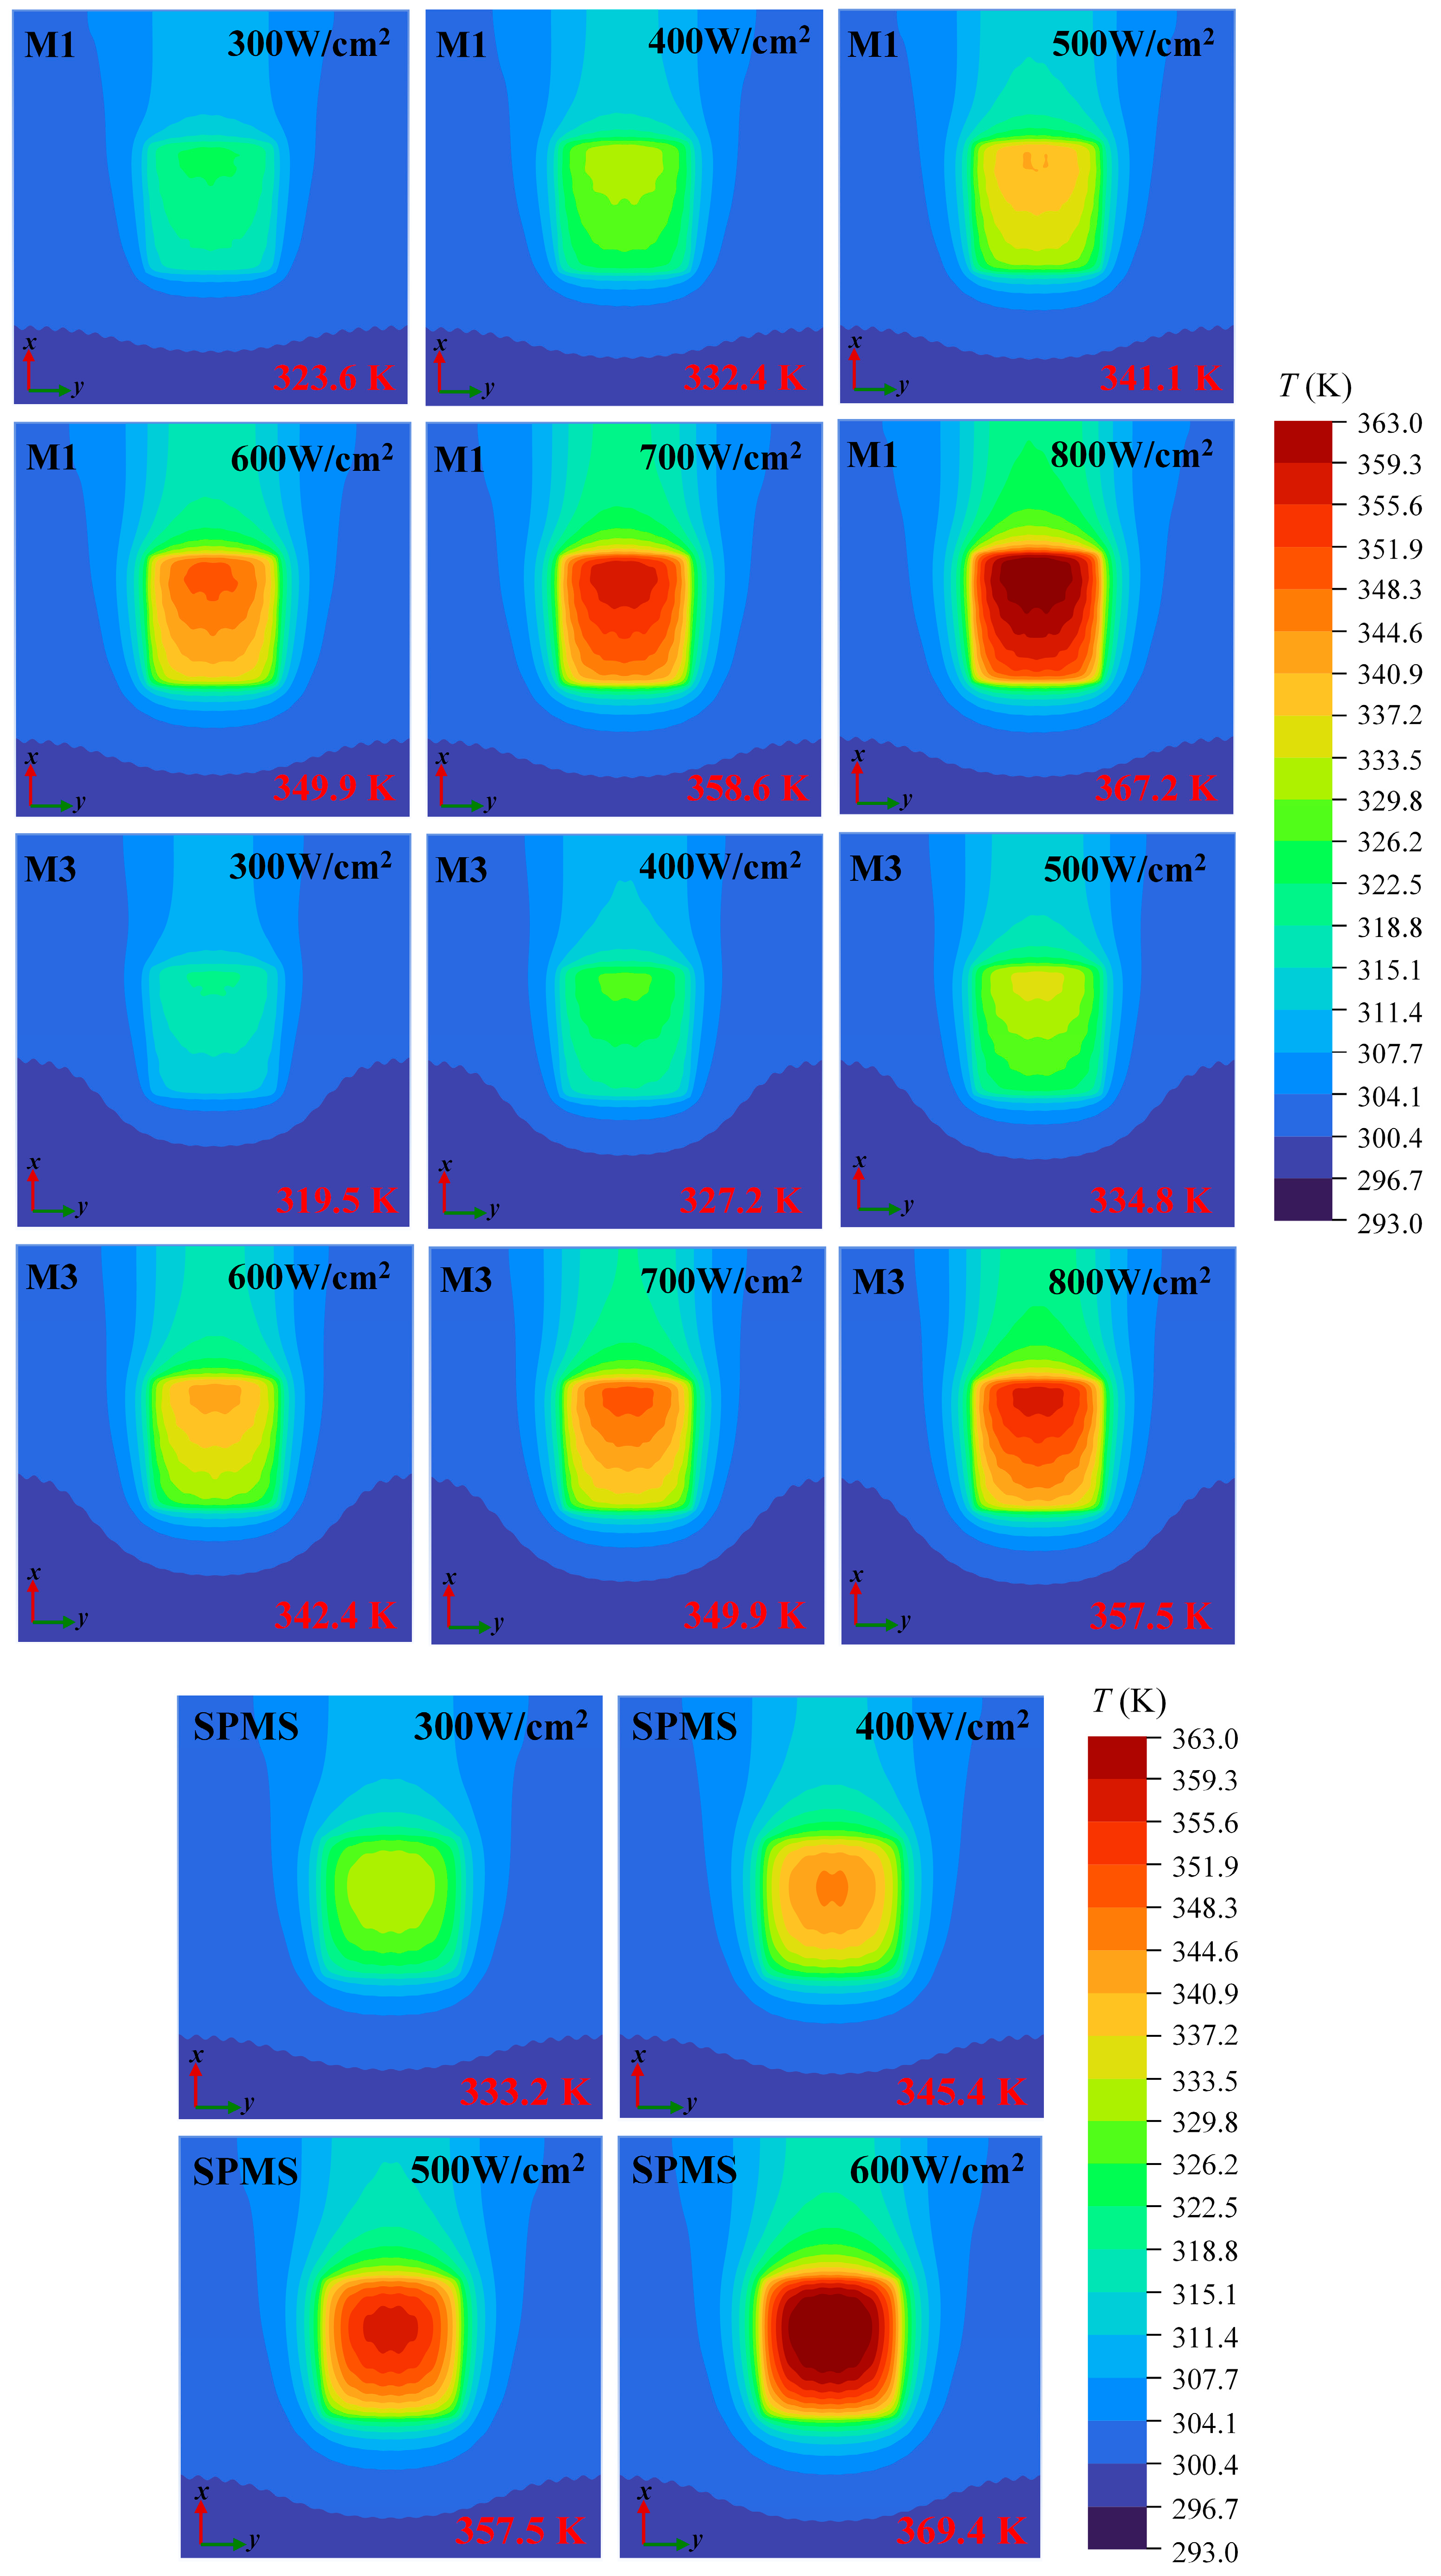
Figure 13 depicts the surface temperature distributions of the SPMS, M1, and M3 under different qhs at Re = 400. The SPMS shows the largest temperature rise and approaches the safe temperature limit at 500 W/cm2. In contrast, the Tmax of M1 is clearly lower than that of the SPMS under the same heat flux. M3 shows stronger hotspot suppression capability. As qhs increases from 300 to 800 W/cm2, the Tmax of M3 rises from 319.5 K to 357.5 K. Its heat load capacity is 60% higher than that of the SPMS, and its temperature distribution is also smoother.
Figure 13.
Bottom surface temperature distributions of the SPMS, M1, and M3 under different hotspot heat fluxes at Re = 400.
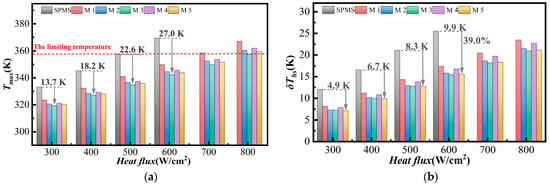
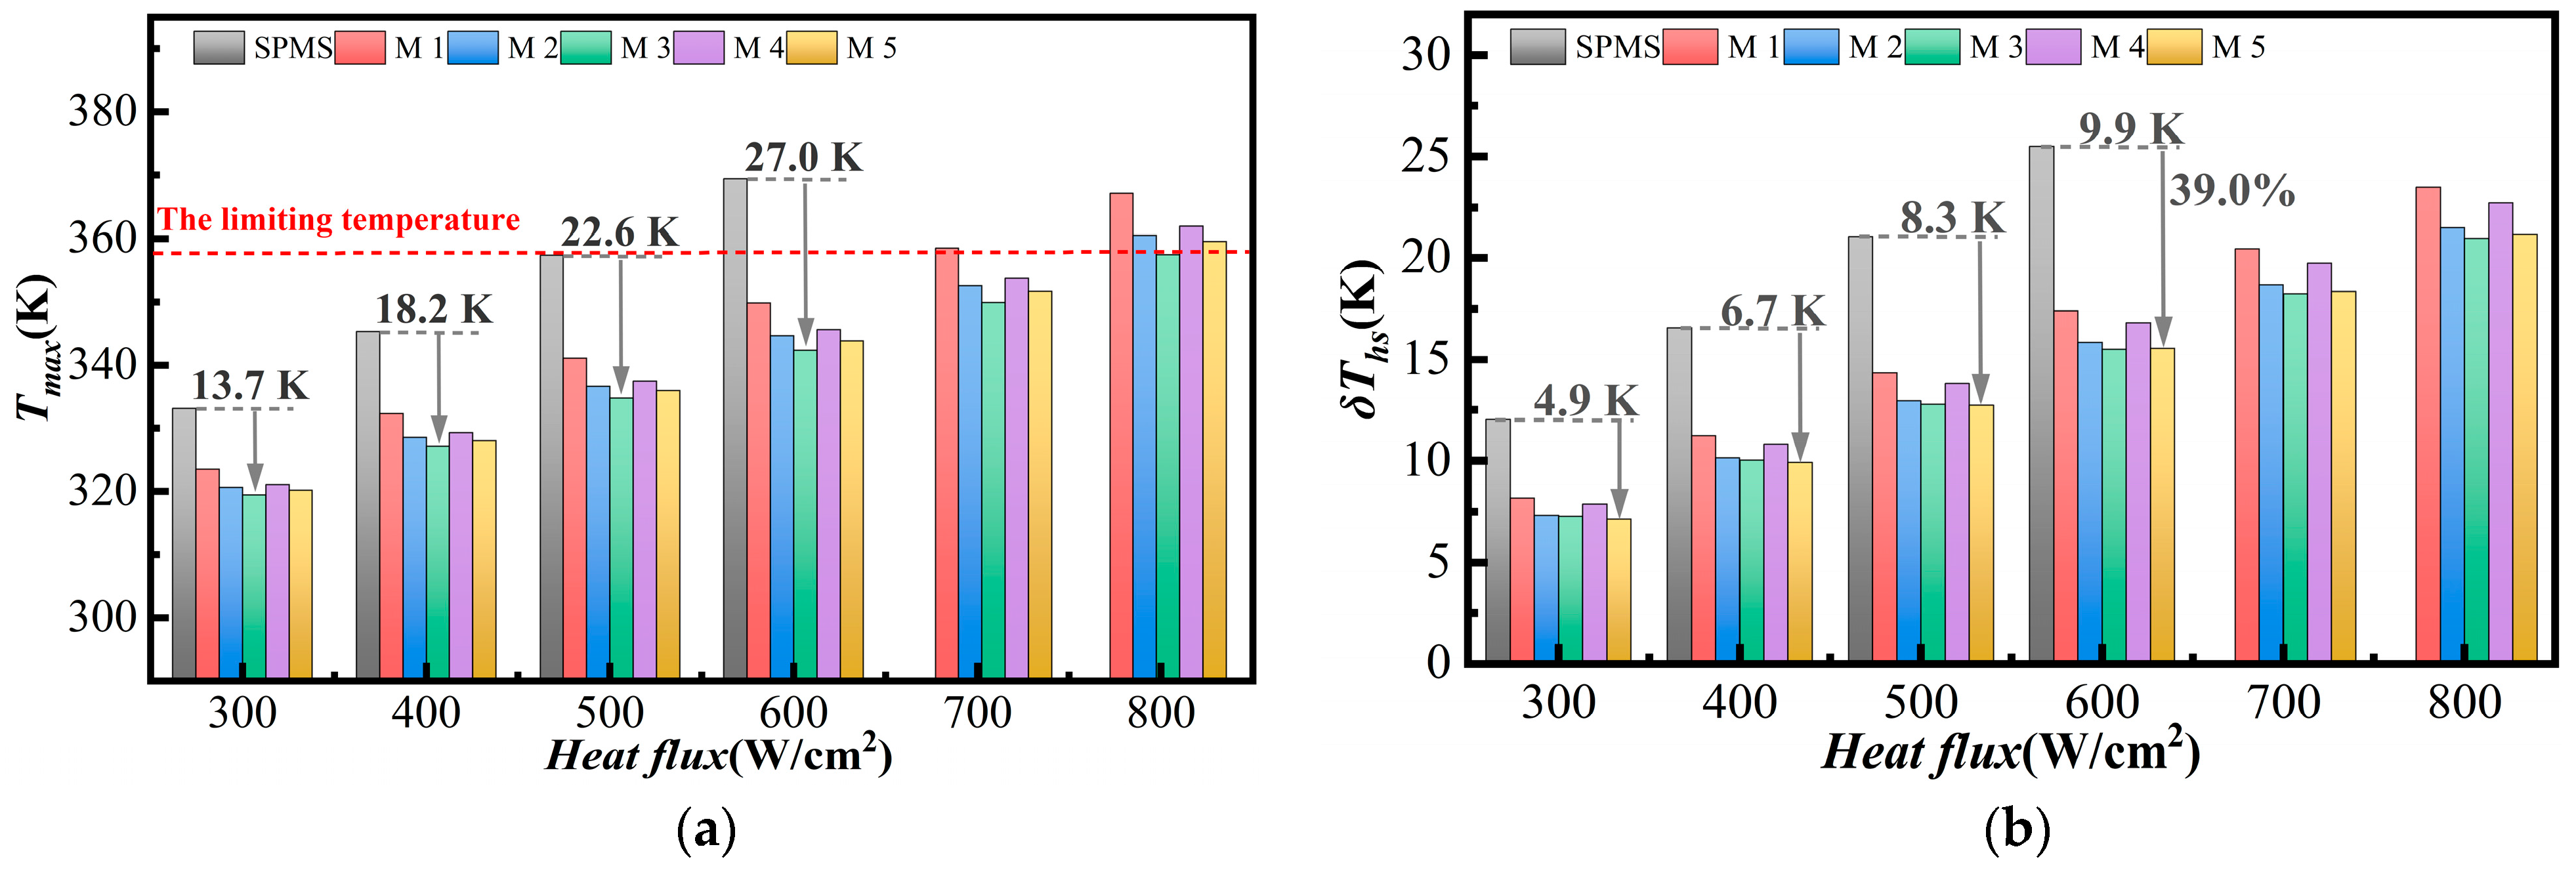
Figure 14a shows the variation in Tmax under different qhs values. As qhs increases from 300 to 800 W/cm2, M1–M5 all reduce Tmax significantly compared with the SPMS, and their advantage becomes more evident in the high-heat-flux range. M3 has the lowest Tmax. Its temperature reduction relative to the SPMS increases from 13.7 K at 300 W/cm2 to 27.0 K at 600 W/cm2. This is because the secondary channels improve the heat transfer capacity in the pin-fin region, and their effect becomes stronger as the hotspot load increases. The results show that a reasonable secondary-channel design can significantly improve the hotspot load capacity of the heat sink. Figure 14b shows the variation in δThs under different qhs values. When qhs increases from 300 to 600 W/cm2, the reduction in δThs of M5 relative to the SPMS increases from 4.9 K to 9.9 K, with a relative reduction of 39.0% at 600 W/cm2. This indicates that the improvement in temperature uniformity by the secondary channels becomes more evident as the hotspot load increases. Although M5 gives the lowest δThs, M3 maintains the lowest Tmax over the investigated heat-flux range. This difference indicates that broader flow redistribution does not necessarily provide stronger local heat removal. The flow mechanism responsible for this difference is further examined in Figure 15.
Figure 14.
(a) Tmax and (b) δThs under different hotspot heat fluxes.
Figure 15.
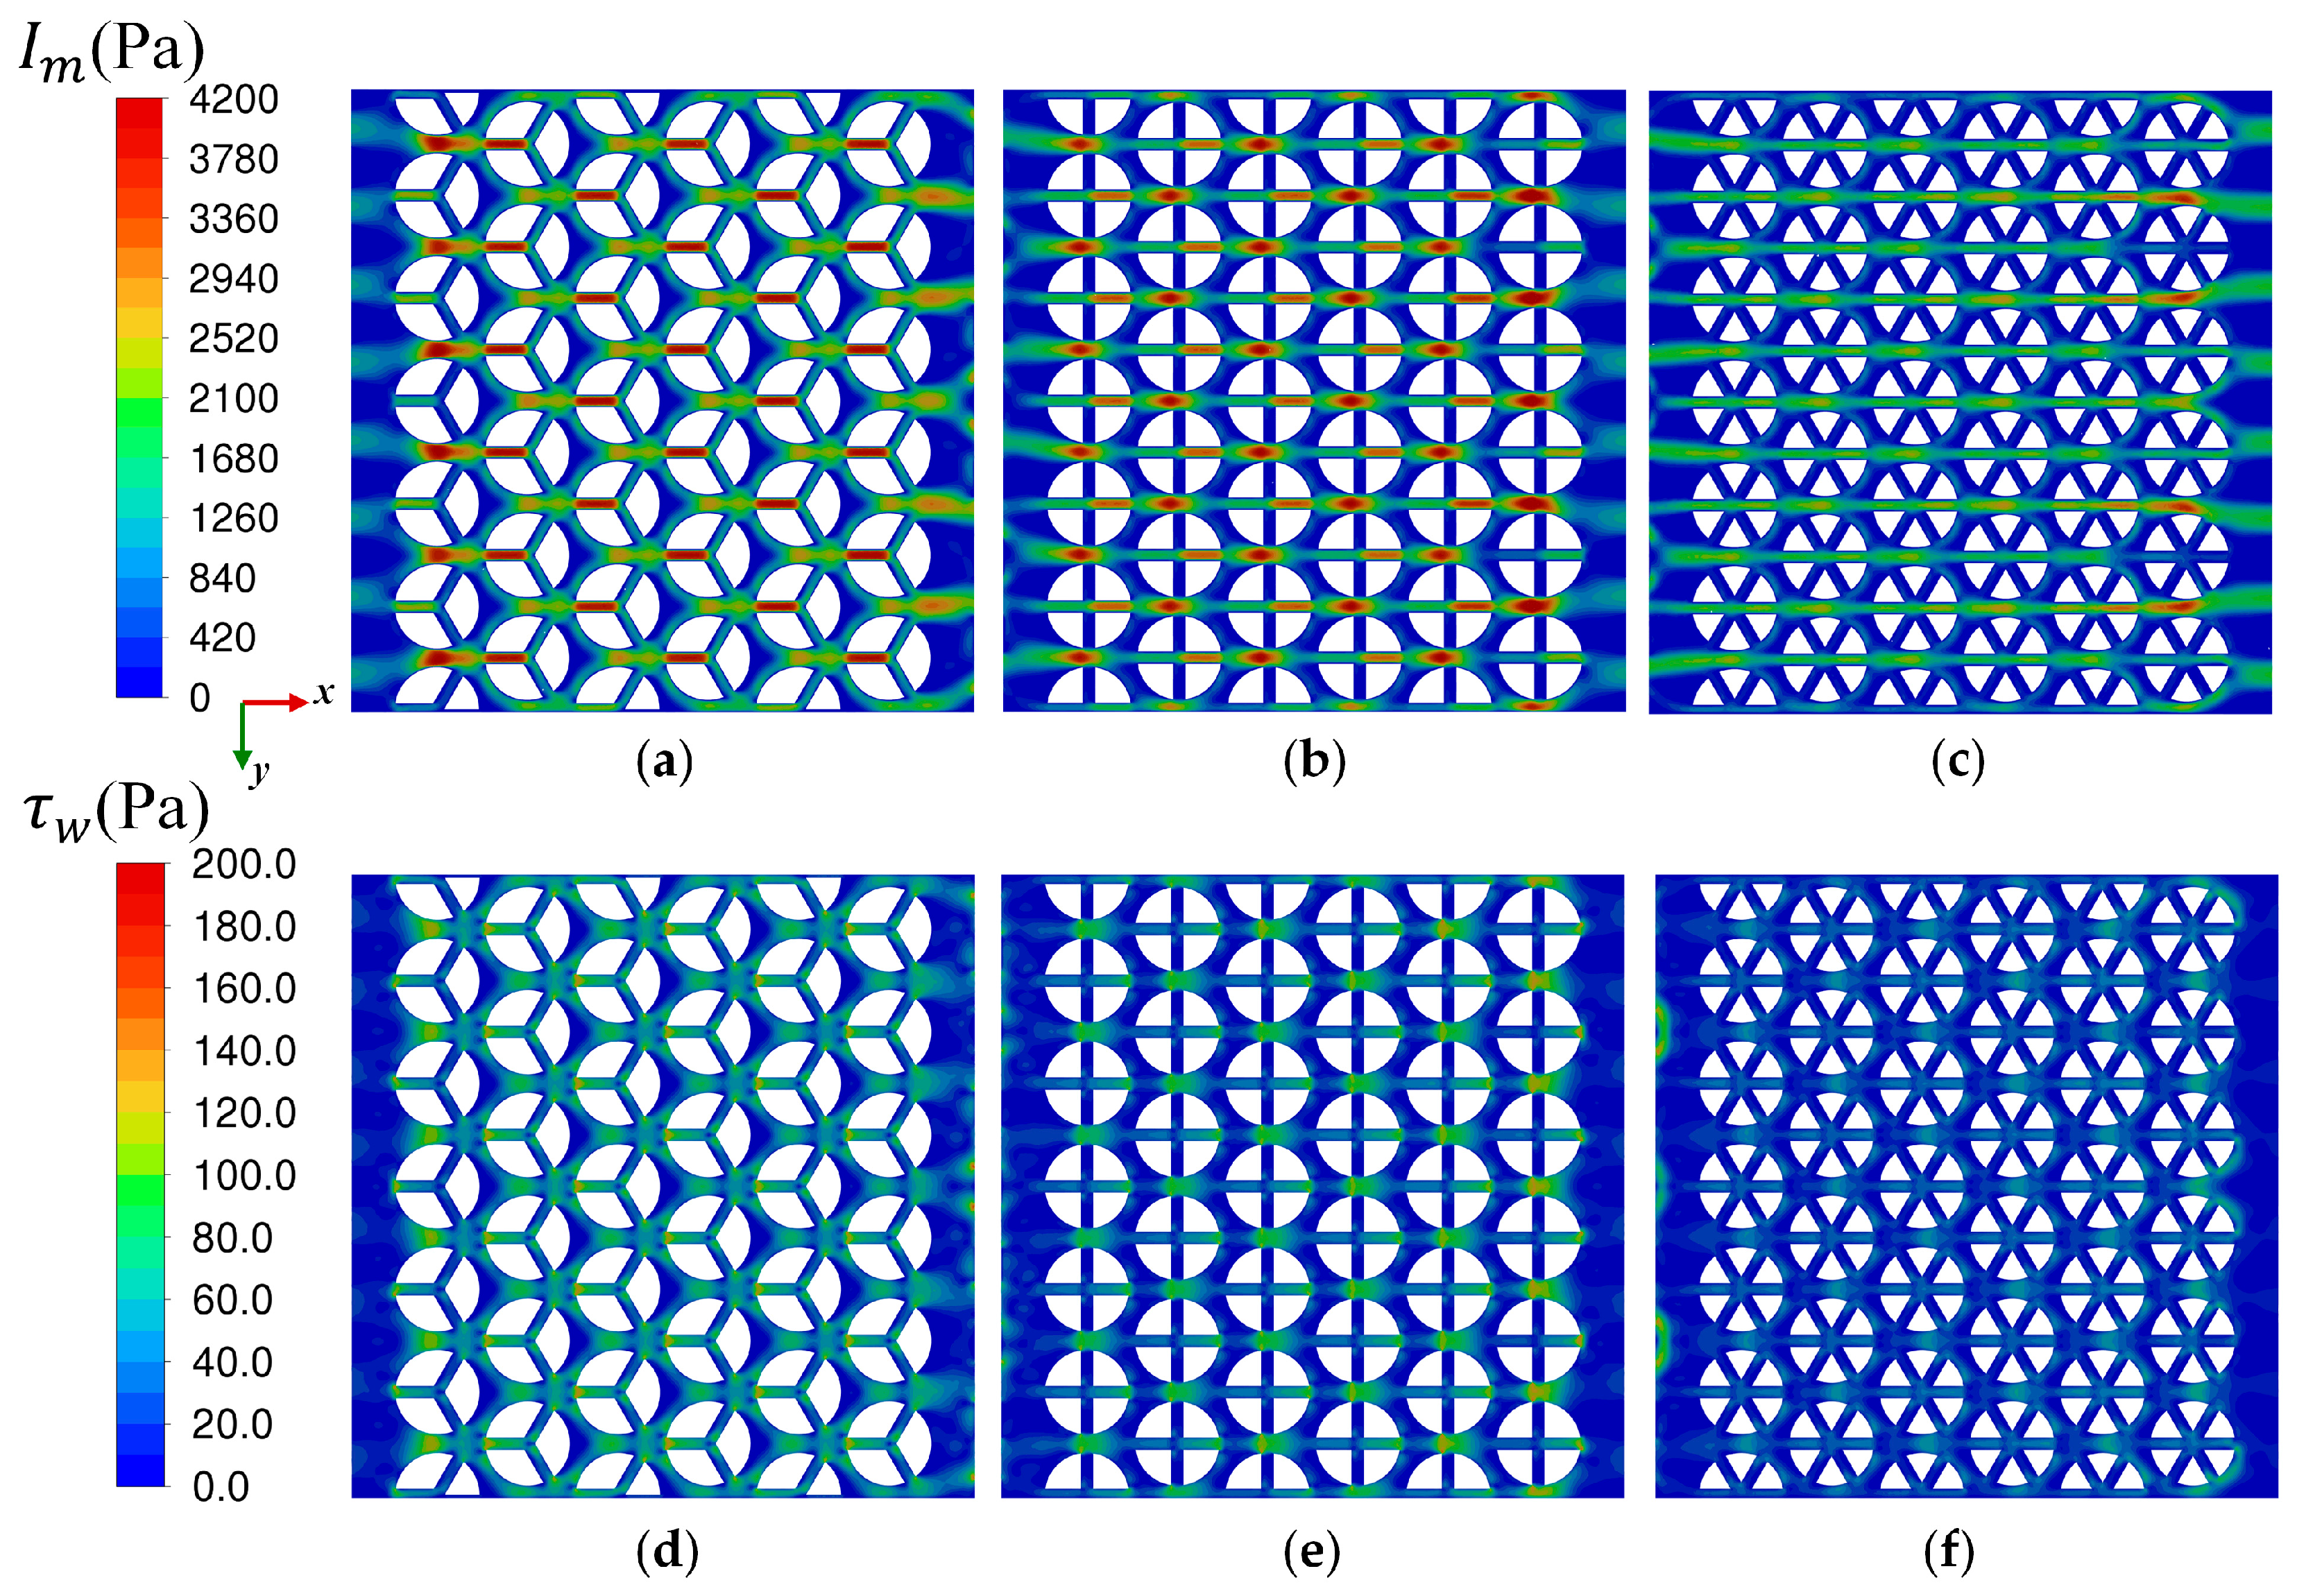
Local momentum-flux indicator and bottom-wall shear-stress distributions of M3–M5 at Re = 400 and qhs = 800 W/cm2. (a–c) Momentum-flux indicator; (d–f) wall shear stress.
Figure 15 compares the local flow momentum and bottom-wall shear stress of M3–M5 under the high-heat-flux condition. To characterize the local inertial momentum carried by the coolant, a local momentum-flux indicator is defined as
where ρf is the coolant density and u is the local velocity magnitude. Im has a unit of Pa and represents the strength of local inertial momentum.
For the laminar Newtonian flow considered here, the wall shear stress is expressed as
where τw is the wall shear stress, μf is the dynamic viscosity of the coolant, ut is the wall-tangential velocity, and n is the wall-normal direction. The momentum distributions are plotted on the x–y plane at z = 0.6 mm, while the wall shear stress is evaluated on the heated bottom wall at z = 0.2 mm.
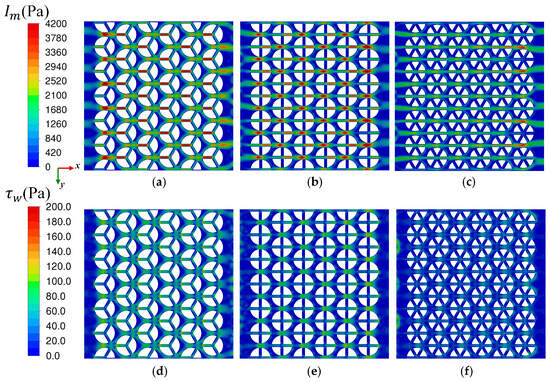
Figure 15a–c show that the number of secondary-channel branches has a clear effect on the spatial distribution of momentum. In M3, high-Im regions of approximately 2.9 × 10³–4.2 × 10³ Pa are continuously maintained in the main flow passages and streamwise secondary channels, while the inclined branches provide additional fluid exchange. With additional internal branches in M4, the high-momentum regions are distributed among more flow paths and their continuity begins to decrease. This trend becomes more evident in M5. Most of its inclined internal branches have Im values below approximately 1.3 × 10³ Pa, while the main flow passages are mostly within approximately 1.7 × 10³–2.5 × 10³ Pa. The six-directional secondary channels distribute the coolant among more internal flow paths, but the high-momentum cores become less concentrated. Therefore, increasing the number of secondary-channel branches broadens the flow redistribution but also reduces the local momentum retained in individual effective flow paths.
The wall shear stress in Figure 15d–f shows a corresponding change. M3 maintains relatively continuous moderate-to-high-shear-stress regions along the main flow paths and near the channel junctions, with some local values approaching approximately 140–160 Pa. In M4, these regions become weaker and more dispersed. M5 shows the most dispersed shear-stress distribution, and the wall shear stress over most of the internal-branch region remains below approximately 60 Pa. The spatial correspondence between the momentum and wall-shear distributions indicates that the additional internal branches in M4 and M5 do not produce the same level of wall-adjacent flow action. As the coolant is distributed among more flow paths, the local near-wall shear is reduced in part of the hotspot region.
Under high thermal loads, the more dispersed flow momentum and weaker near-wall shear in M4, especially M5, reduce local coolant renewal near the heated surface and limit further disturbance of the thermal boundary layer. On the other hand, M5 still provides broader flow redistribution, which is consistent with its lower δThs and better temperature uniformity. These results indicate that M3 achieves a better balance between flow redistribution and local momentum retention.
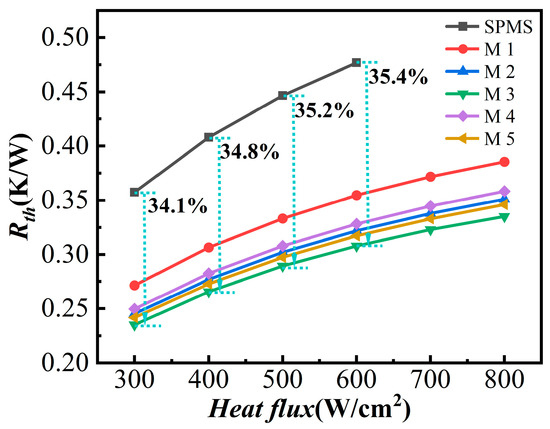
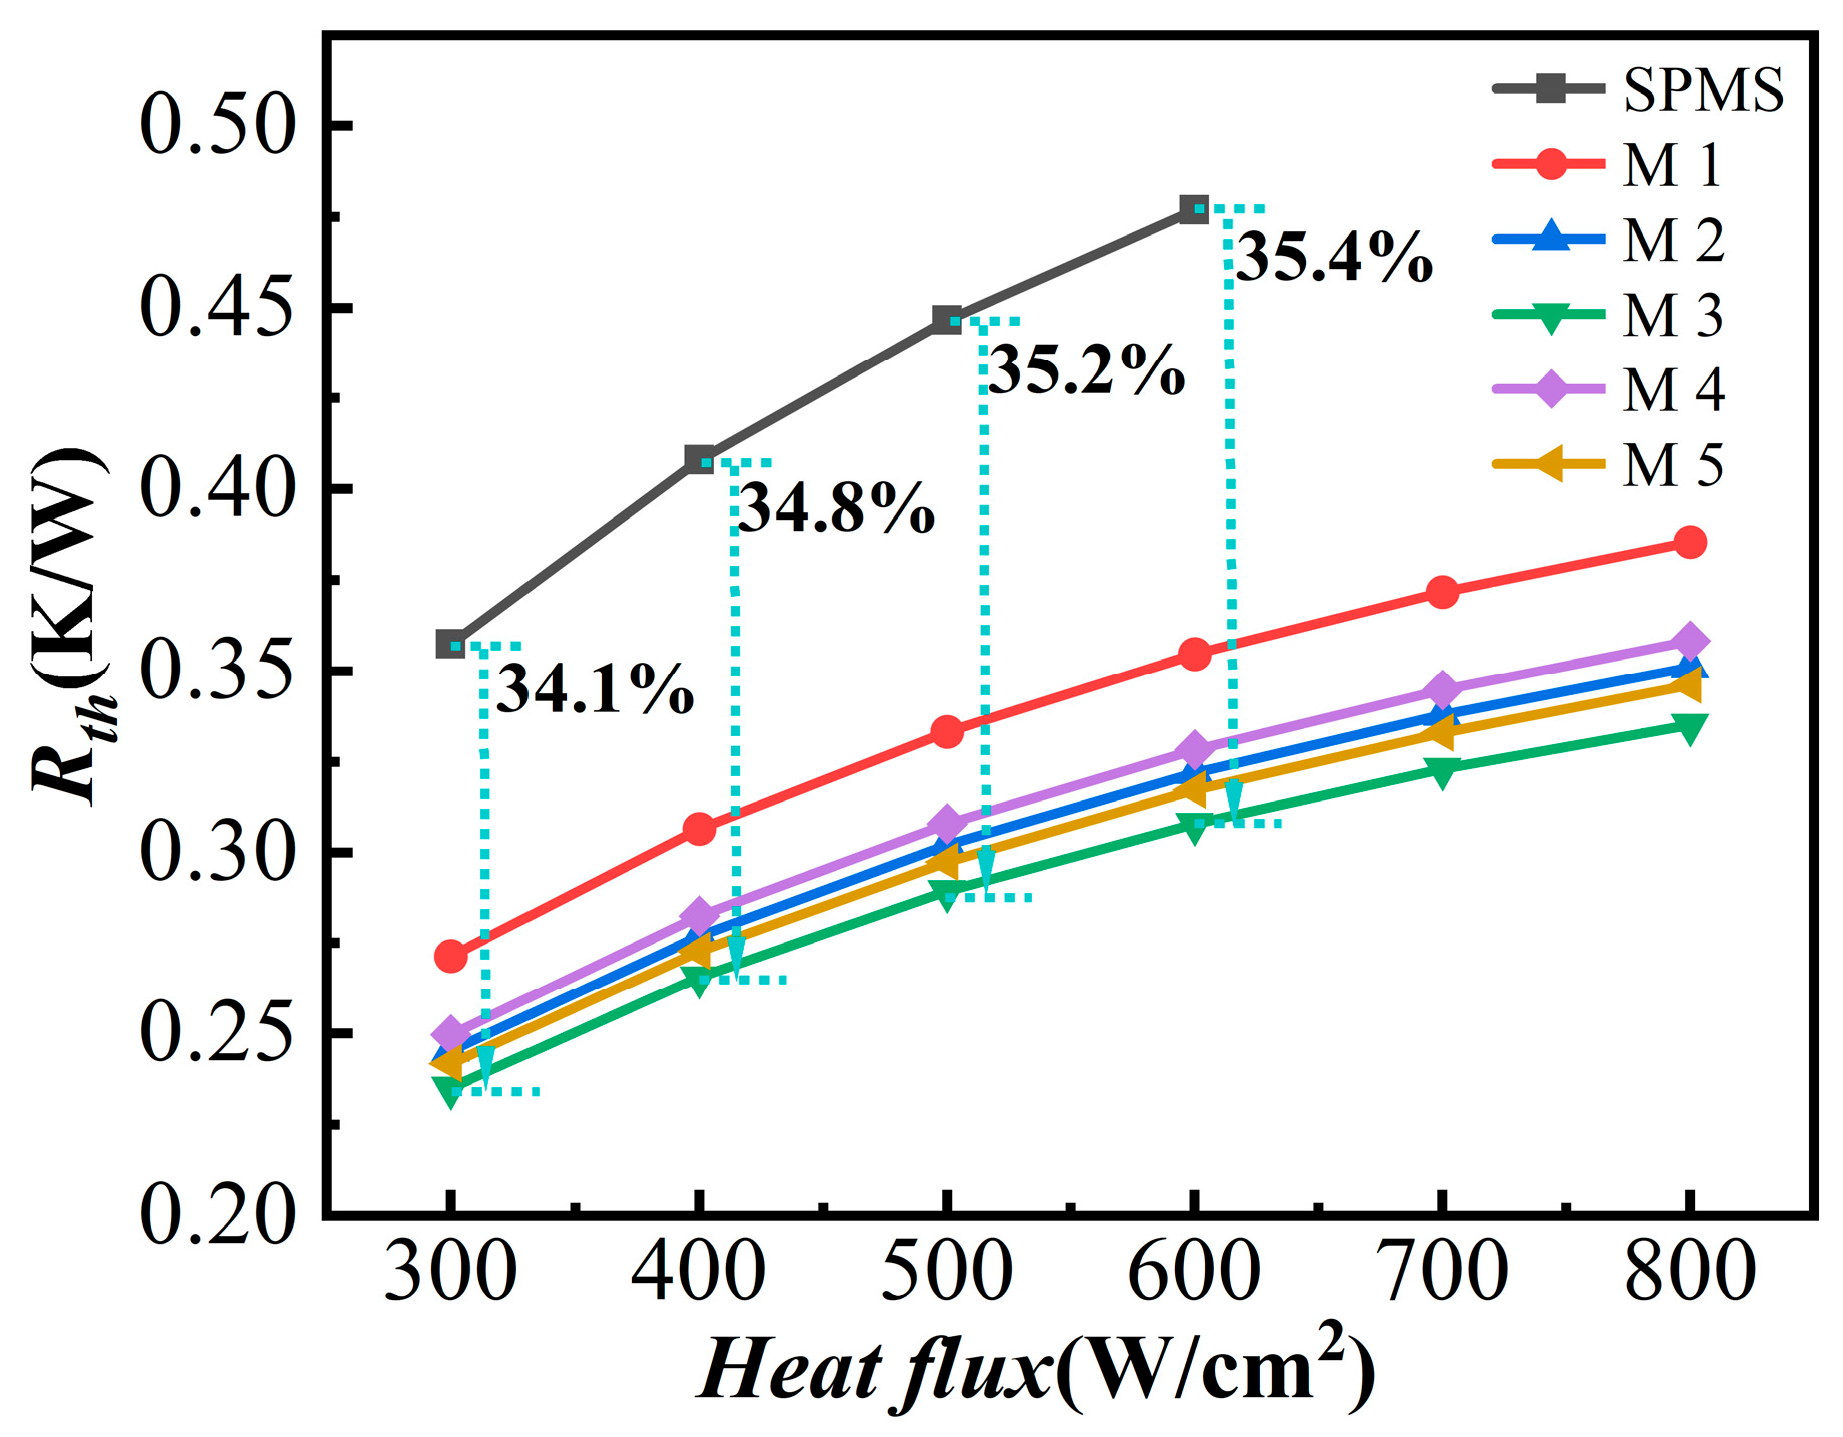
Figure 16 shows the variation in Rth for different structures under different hotspot heat fluxes. M1 shows a clear improvement compared with the SPMS, but its Rth is always higher than those of M2–M5. M3 has the lowest Rth among all designs. Under qhs = 300–600 W/cm2, its Rth is about 35.0% lower than that of the SPMS, indicating that the MPSC structures can maintain a stable thermal resistance reduction under different heat load levels.
Figure 16.
Variation in Rth under different hotspot heat fluxes.
3.4. Effect of Relative Pin-Fin Height on Thermal–Hydraulic Performance
Pin-fin height influences both heat-transfer area and the fraction of coolant entering the secondary channels, thereby affecting thermal performance and pressure drop. Its effect is evaluated using the relative pin-fin height (RPH):
where Hpf and Hch are the pin-fin height and channel height (m), respectively.
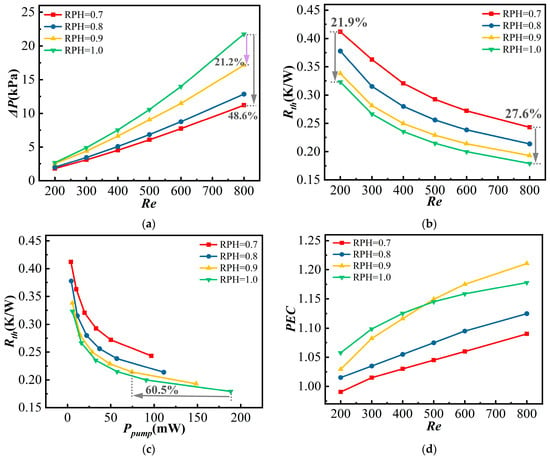
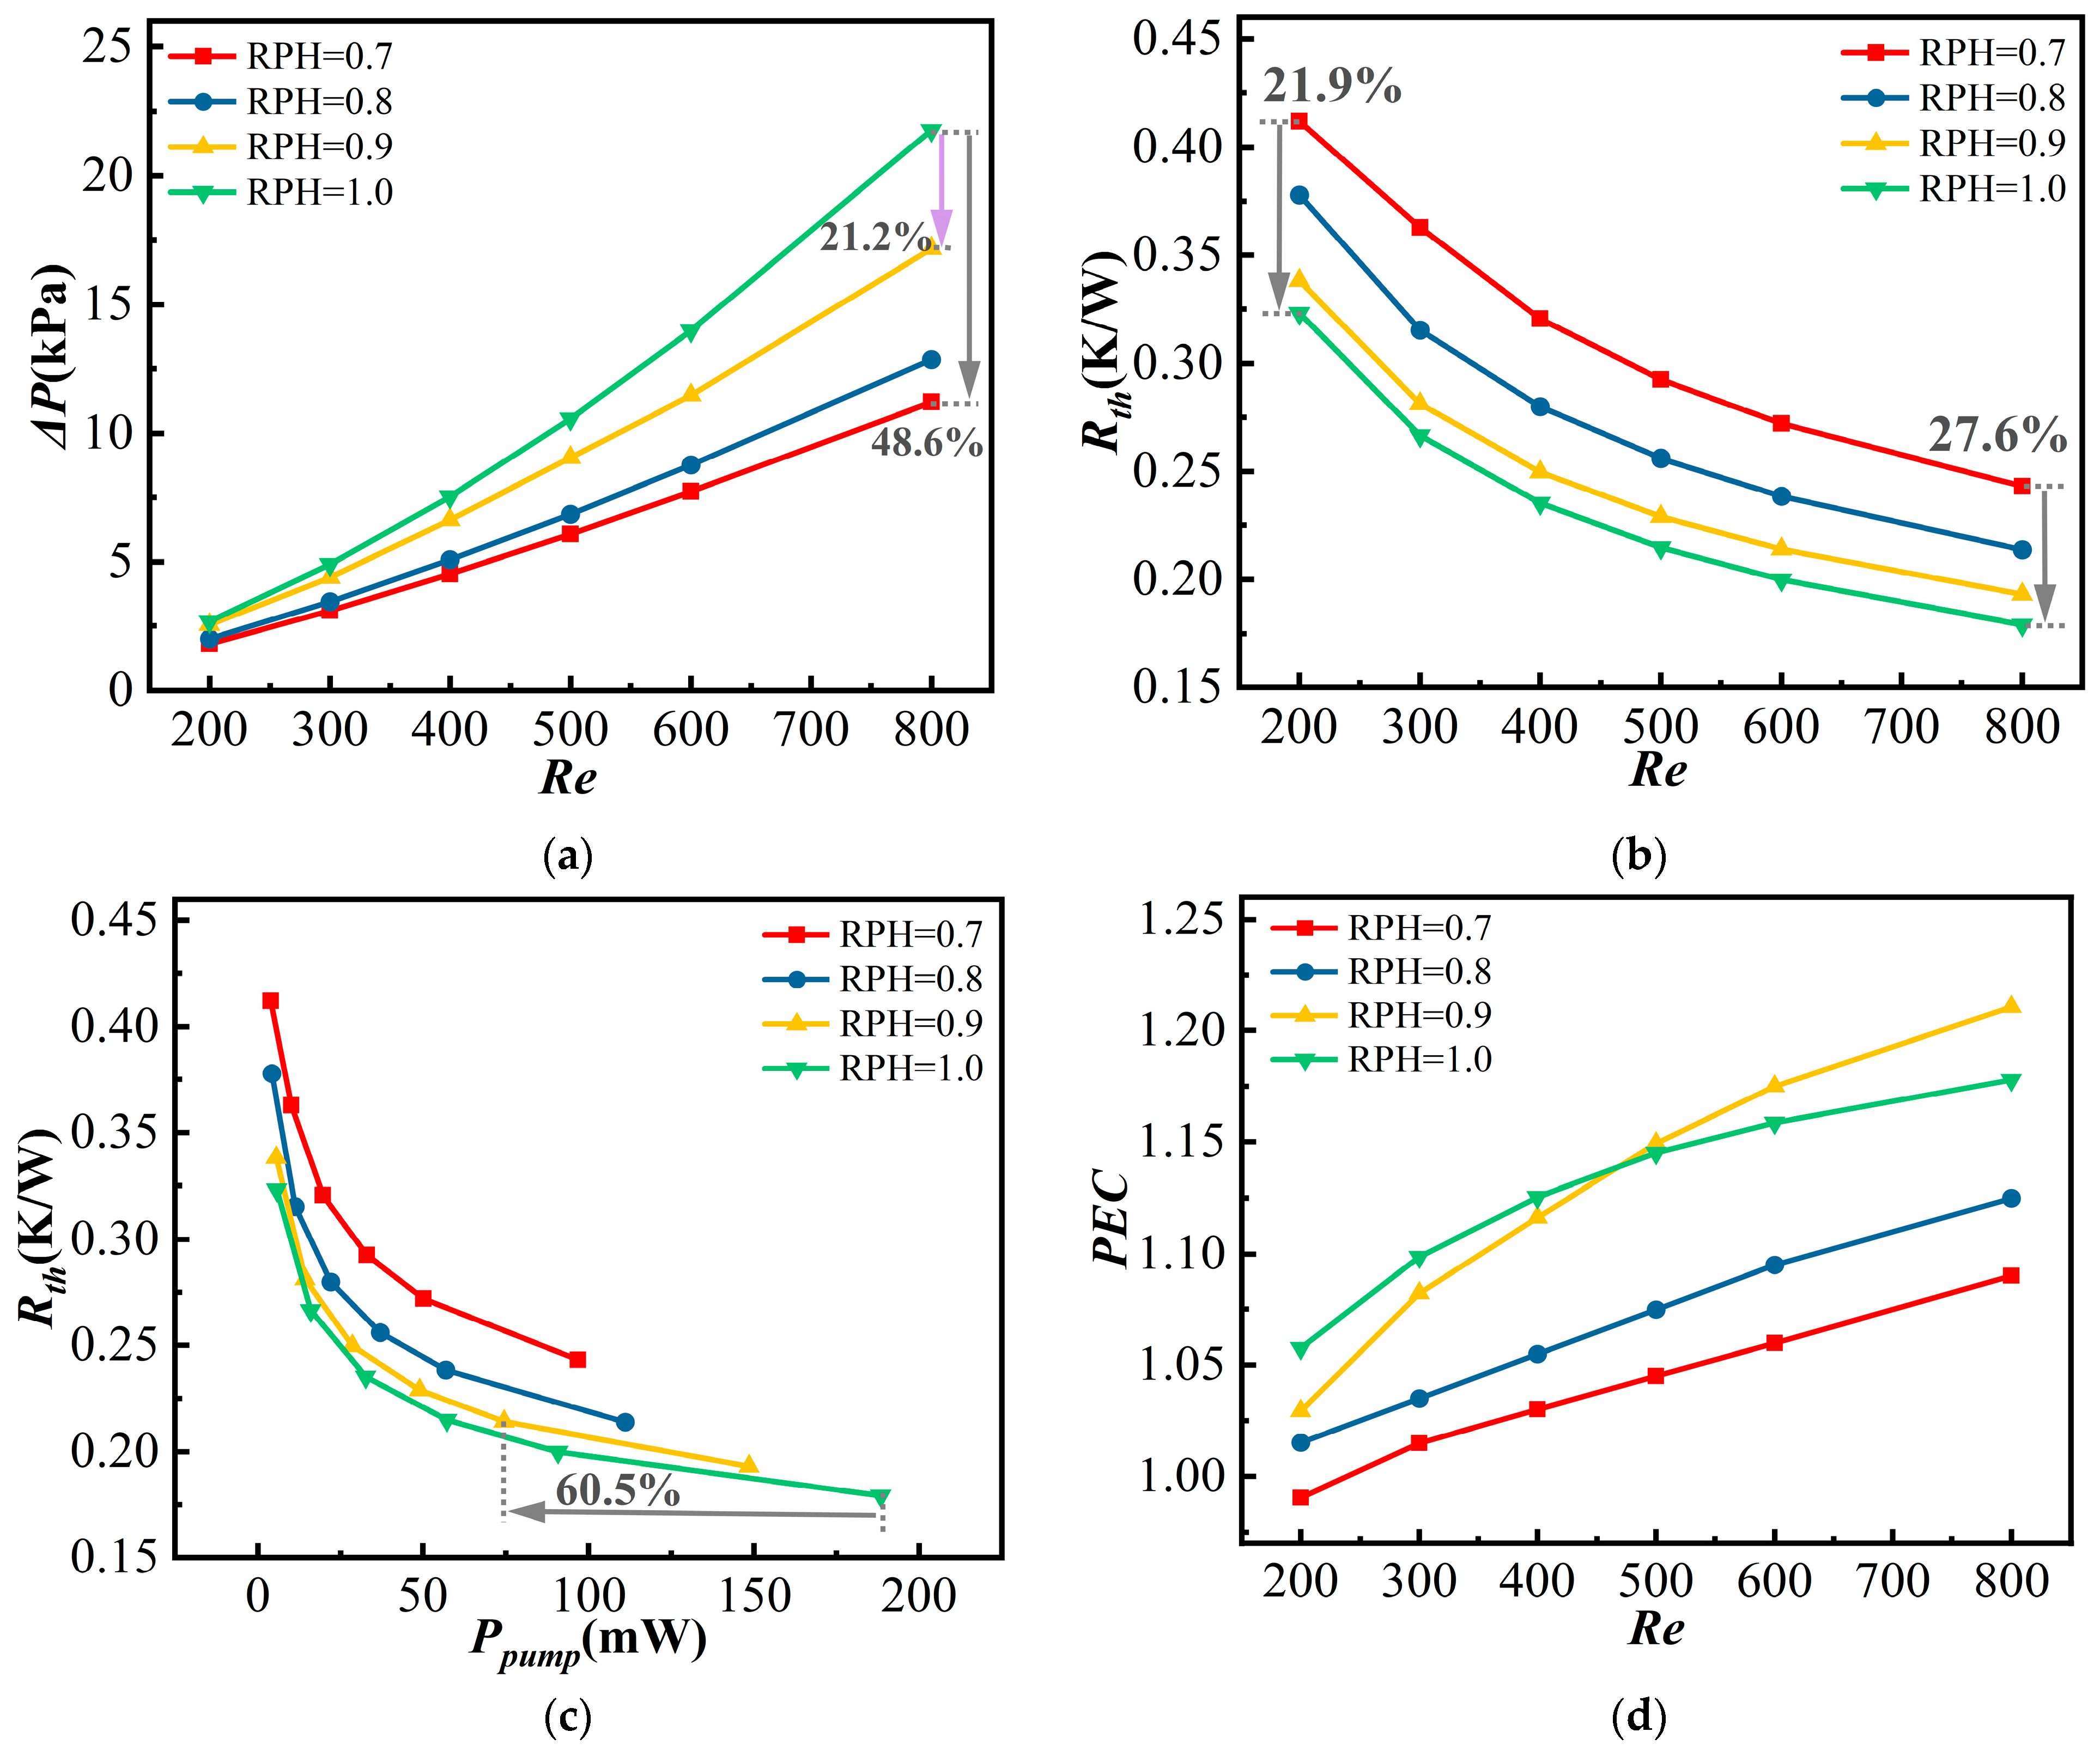
In this section, M3, which has the highest PEC, is selected as the representative structure. Figure 17 shows the performance variation of M3 under RPH = 0.7–1.0 over Re = 200–800. Figure 17a shows that ΔP increases with RPH. The ΔP reaches 21.78 kPa at RPH = 1.0, while it is only 11.20 kPa at RPH = 0.7, corresponding to a reduction of 48.6%. This is because increasing the pin-fin height compresses the upper flow space and increases the form resistance. When RPH increases from 0.9 to 1.0, ΔP rises more sharply. This indicates that when the pin-fins approach the channel top wall, the flow resistance does not increase linearly. Instead, it worsens rapidly because the top clearance is greatly reduced. Therefore, an appropriate reduction in pin-fin height can significantly reduce flow blockage and save pumping power, especially at high flow velocities.
Figure 17.
Variations in the performance parameters of M3 under different RPH values over Re = 200–800. (a) ΔP; (b) Rth; (c) Rth with Ppump; (d) PEC.
Figure 17b shows that at Re = 800, when RPH = 1.0, Rth is 0.1790 K/W, while it is 0.2433 K/W at RPH = 0.7, corresponding to a reduction of about 26.4%. Increasing the pin-fin height enlarges the heat transfer area and allows more coolant to participate in the heat transfer process through the pin-fins and secondary channels. Figure 17c further shows the need for RPH optimization from the perspective of pumping power. At Re = 600, the pumping power of RPH = 0.9 is 74.39 mW, which is 60.5% lower than that of RPH = 1.0 at Re = 800, 188.41 mW. However, its Rth increases by only about 19.5%. Therefore, M3 at RPH = 0.9 can achieve a large saving in pumping power with only a small loss in thermal performance. Figure 17d shows M3 has the lowest PEC at RPH = 0.7, indicating that the flow disturbance is insufficient when the pin-fin height is too low. At Re = 200–400, RPH = 1.0 gives the highest PEC because the pressure drop penalty is not significant at low flow velocities. When Re approaches 500, RPH = 0.9 shows higher PEC. At Re = 800, the PEC reaches 1.2106, which is about 2.8% higher than that at RPH = 1.0. This indicates that at higher flow velocities, the PEC at RPH = 1.0 is weakened by the sharp increase in flow resistance. In contrast, RPH = 0.9 can avoid excessive channel blockage and lead to better overall performance.
The above analysis shows that the effect of RPH on PEC is regulated by Re, indicating a coupled relationship between them. To further analyze the effects of Re and RPH on PEC, a quadratic response surface model is used to fit PEC in this section.
Re is normalized as follows:
Based on the normalized Re, a quadratic response surface model including linear terms, quadratic terms, and an interaction term is adopted:
where a0, a1, a2, a3, a4, and a5 are constant coefficients.
The fitting process is performed using the least-squares method, with the PEC data of M3 under different combinations of Re and RPH used as sample points. The fitted quadratic response surface equation is obtained as
where 200 ≤ Re ≤ 800 and 0.7 ≤ RPH ≤ 1.0.
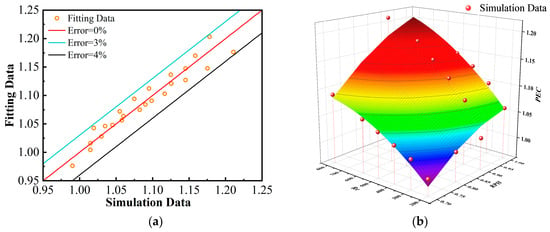
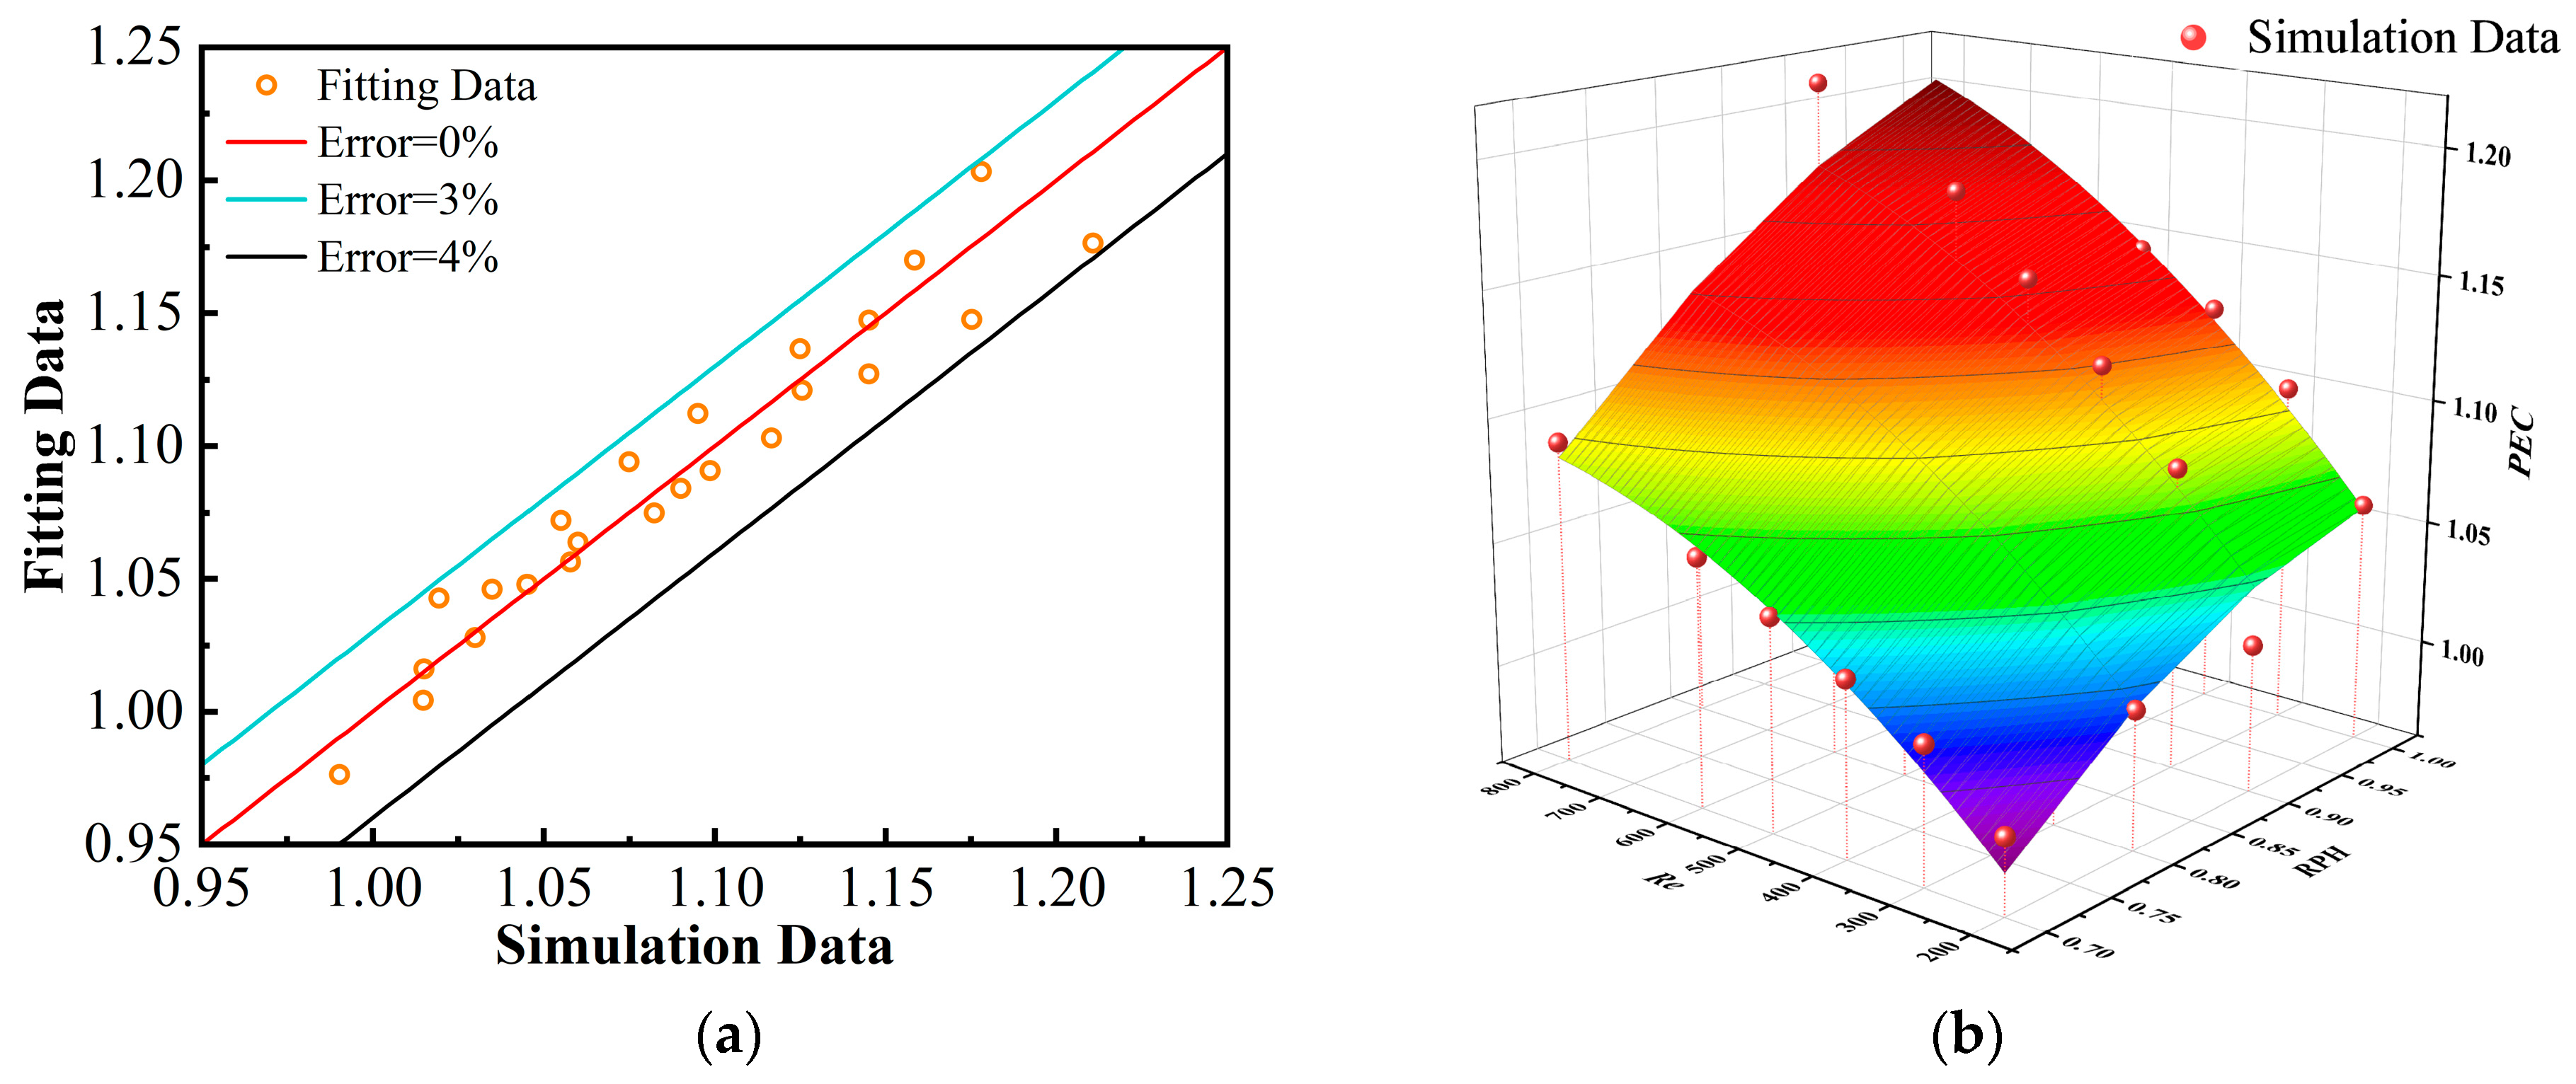
Figure 18 shows the fitting results of PEC. Figure 18a presents the fitting error curve. All sample points fall within an error range of ±4%, which is acceptable. Figure 18b further shows the variation trend of PEC in the continuous Re-RPH parameter space. The surface shows clear curvature along the RPH direction, indicating that the effect of relative pin-fin height on PEC is constrained by the pressure drop. Combined with the results in Figure 17d, the maximum RPH does not necessarily correspond to the optimal PEC. At low flow velocities, increasing RPH is more favorable for using the heat transfer benefits from the larger heat transfer area and secondary channels. At higher flow velocities, the pumping power penalty caused by an excessively high RPH begins to weaken the overall benefit. Therefore, RPH optimization should be based on the balance between heat transfer gain and flow penalty, rather than simply pursuing the maximum pin-fin height. This provides a reference for selecting a suitable pin-fin height and flow condition according to practical cooling requirements.
Figure 18.
Quadratic response surface fitting of PEC for the M3 structure with respect to Re and RPH: (a) Fitting error; (b) response surface.
4. Conclusions
This study proposes a hybrid microchannel heat sink featuring micro pin-fins with secondary channels for hotspot thermal management in high-heat-flux electronic devices. Straight microchannels are used in the background region, while staggered pin-fins are arranged in the hotspot region. Five models are considered: solid pin-fins without secondary channels (M1) and pin-fins with one-, three-, four-, and six-directional secondary channels (M2–M5). The effects of pin-fin structure, Reynolds number, hotspot heat flux, and relative pin-fin height on the thermal–hydraulic performance of the heat sink are investigated. The main conclusions are as follows:
- Compared with the SPMS, M1–M5 significantly improve hotspot suppression. The secondary channels provide internal flow diversion and transverse exchange paths inside the pin-fins. They reduce the local blockage caused by solid pin-fins and promote redevelopment of the thermal boundary layer.
- Over Re = 200–800, M3 shows the best overall performance. Compared with the SPMS, the Rth of M3 is reduced by 24.9% and 43.3% at Re = 200 and 800, respectively, and the maximum PEC reaches 1.178.
- The MPSC structures can achieve stronger hotspot cooling at lower pumping power. At similar Ppump, the Rth of M3 is 36.8% lower than the minimum Rth attainable by the SPMS. Meanwhile, the marginal reduction in Rth gradually weakens as Ppump increases. This indicates that the coolant flow velocity should be reasonably selected in practical engineering.
- The MPSC structures have a higher hotspot load capacity. M3 can control the maximum temperature at 357.5 K under qhs = 800 W/cm2. Compared with the SPMS, M3 increases the allowable hotspot heat flux from 500 W/cm2 to 800 W/cm2, corresponding to a 60% improvement in hotspot load capacity.
- The relative pin-fin height, RPH, has a coupled effect on the thermal–hydraulic performance. At Re = 800, the PEC of RPH = 0.9 reaches 1.2106, which is about 2.8% higher than that of RPH = 1.0. The response surface fitting further shows that the pin-fin height should be designed according to the flow condition and pumping power constraint.
Overall, the hybrid micro pin-fin structure with embedded secondary channels can balance hotspot suppression and pressure drop control. Among the tested structures, M3 shows the best overall thermal–hydraulic performance. This study provides a reference for hotspot suppression in high-power electronic devices and for the thermal–hydraulic optimization of microchannel heat sinks.
Future work will focus on experimental evaluation of the MPSC heat sink using both controlled constant-power heat sources and representative high-power electronic devices. These studies will be used to verify its thermal–hydraulic performance under practical operating conditions and further evaluate the engineering applicability of the proposed design.
The main limitations of the present study and the corresponding future work are summarized as follows:
- The present study is mainly based on CFD analysis. The immediate next step is experimental validation. Future work will fabricate silicon-based MPSC prototypes and compare the measured thermal resistance and pressure drop with the corresponding CFD predictions.
- The present model uses a constant thermal conductivity for silicon and does not account for its temperature dependence. Future simulations will incorporate the temperature-dependent thermal conductivity ksi(T), particularly for high-heat-flux conditions.
- The present design has not yet been integrated with other advanced microchannel architectures. Future work will explore combinations of MPSCs with manifold-fed or double-layer microchannels to further improve coolant distribution and shorten the effective flow path while retaining the local heat-transfer enhancement of MPSCs.
Author Contributions
Conceptualization, R.H. and J.S.; methodology, R.H.; software, R.H. and J.S.; validation, R.H., J.S. and C.W.; formal analysis, R.H.; investigation, R.H., Y.X. and S.X.; resources, R.H.; data curation, R.H.; writing—original draft preparation, R.H.; writing—review and editing, R.H., J.S., C.W., Y.X. and S.X.; visualization, R.H. and J.S.; supervision, J.Y. and S.C.; project administration, J.Y. and S.C.; funding acquisition, J.Y. and S.C. All authors have read and agreed to the published version of the manuscript.
Funding
This research was funded by the Frontier Technologies R&D Program of Jiangsu Province, grant number BF2024077, and Postgraduate Research & Practice Innovation Program of Jiangsu Province, grant number KYCX25_2011.
Data Availability Statement
The original contributions presented in this study are included in the article. Further inquiries can be directed to the corresponding authors.
Conflicts of Interest
The authors declare no conflicts of interest.
Nomenclature
| Symbols | |
| Abg, Ach, Ah, Ahs, Ain (m2) | Background heating area, microchannel cross-sectional area, solid–fluid heat-transfer area, hotspot heating area, and channel inlet area, respectively |
| Cp,f, Cp,si (J/(kg·K)) | Specific heat capacities of the coolant and silicon, respectively |
| Dh, Dh,sch (m) | Hydraulic diameters of the main channel and secondary channel, respectively |
| f, f0 (–) | Friction factors of the investigated structure and baseline MHS, respectively |
| Hb, Hch, Hpf (m) | Substrate thickness, channel height, and pin-fin height, respectively |
| Im (Pa) | Local momentum-flux indicator |
| kf, ks, ksi (W/(m·K)) | Thermal conductivities of the coolant, solid domain, and silicon, respectively |
| L, Lhs, Lsink (m) | Effective channel length, hotspot length, and heat sink length, respectively |
| Nu, Nu0 (–) | Nusselt numbers of the investigated structure and baseline MHS, respectively |
| Pch (m) | Wetted perimeter of a single microchannel |
| Ppump (W) | Pumping power |
| ΔP, Δpi (Pa) | Overall pressure drop and inlet–outlet pressure difference of channel i, respectively |
| qbg, qhs (W/m2) | Background and hotspot heat fluxes, respectively |
| Qtot (W) | Total heat input |
| rpf (m) | Pin-fin radius |
| Re (–) | Reynolds number |
| Repf, Resch (–) | Characteristic Reynolds numbers of the pin-fin gap and secondary channel |
| Rn (–) | Normalized Reynolds number |
| Rth (K/W) | Total thermal resistance |
| ΔRth, ΔPpump (%) | Cumulative thermal resistance reduction ratio and pumping power increase ratio, respectively |
| Tc, Tf, Tin (K) | Average heated-wall temperature, fluid temperature and inlet coolant temperature, respectively |
| Tmax (K) | Maximum substrate temperature |
| Tmax,bg, Tmax,hs, Tmin,hs, Tavg,hs (K) | Maximum background-region temperature, maximum hotspot-region temperature, minimum and average temperatures in the hotspot region, respectively |
| δThs (K) | Mean absolute temperature difference in the hotspot region |
| (K/m) | Magnitude of temperature gradient |
| uavg (m/s) | Mean inlet velocity |
| ugap, usch (m/s) | Mass-averaged velocities in the pin-fin gap and secondary channel |
| (m/s) | Fluid velocity vector |
| Wch, Whs, Wsch, Wsink, Wwall (m) | Channel width, hotspot width, secondary-channel width, heat sink width, and channel wall thickness, respectively |
| WL, WT (m) | Longitudinal and transverse spacings of pin-fins, respectively |
| x, y, z (m) | Cartesian coordinates |
| Greek Symbols | |
| μf (Pa·s) | Dynamic viscosity of the coolant |
| ρf, ρsi (kg/m3) | Densities of the coolant and silicon, respectively |
| τ (Pa) | Stress tensor |
| τw (Pa) | Wall shear stress |
| Abbreviations | |
| DRIE | Deep reactive-ion etching |
| MHS | Microchannel heat sink |
| MPSCs | Micro pin-fins with secondary channels |
| M1–M5 | Pin-fin models with solid, one-, three-, four-, and six-directional secondary-channel configurations, respectively |
| PEC | Performance evaluation criterion |
| RPH | Relative pin-fin height |
| SPMS | Straight parallel microchannel heat sink |
References
- Sohel Murshed, S.M.; Nieto De Castro, C.A. A Critical Review of Traditional and Emerging Techniques and Fluids for Electronics Cooling. Renew. Sustain. Energy Rev. 2017, 78, 821–833. [Google Scholar] [CrossRef] [Scilit]
- Datta, A.; Sanyal, D.; Agrawal, A.; Das, A.K. A Review of Liquid Flow and Heat Transfer in Microchannels with Emphasis to Electronic Cooling. Sādhanā 2019, 44, 234. [Google Scholar] [CrossRef] [Scilit]
- AMD. Amd EPYCTM 9654P 2022. Available online: https://www.amd.com/en/product/12251 (accessed on 12 May 2023).
- Rao, X.; Jin, C.; Zhang, H.; Song, J.; Xiao, C. A Hybrid Microchannel Heat Sink with Ultra-Low Pressure Drop for Hotspot Thermal Management. Int. J. Heat Mass Transf. 2023, 211, 124201. [Google Scholar] [CrossRef] [Scilit]
- Ansari, D.; Raza, W.; Jeong, J.H.; Kim, K.-Y. A Novel Hybrid-Composite Microchannel Heat Sink for Extreme Hotspot Mitigation. Int. J. Therm. Sci. 2025, 208, 109473. [Google Scholar] [CrossRef] [Scilit]
- Ramakrishnan, B.; Alissa, H.; Manousakis, I.; Lankston, R.; Bianchini, R.; Kim, W.; Baca, R.; Misra, P.A.; Goiri, I.; Jalili, M.; et al. CPU Overclocking: A Performance Assessment of Air, Cold Plates, and Two-Phase Immersion Cooling. IEEE Trans. Compon. Packag. Manufact. Technol. 2021, 11, 1703–1715. [Google Scholar] [CrossRef] [Scilit]
- Chen, M.; Wang, H.; Pan, D.; Wang, X.; Blaabjerg, F. Thermal Characterization of Silicon Carbide MOSFET Module Suitable for High-Temperature Computationally Efficient Thermal-Profile Prediction. IEEE J. Emerg. Sel. Top. Power Electron. 2021, 9, 3947–3958. [Google Scholar] [CrossRef] [Scilit]
- Cheng, S.; Guo, X.; Cai, W.; Zhang, Y.; Zhang, X. Enhanced Thermal Management in Electronic Devices through Control-Oriented Structures. J. Mater. Chem. A 2024, 12, 8640–8662. [Google Scholar] [CrossRef] [Scilit]
- Li, Z.; Luo, H.; Jiang, Y.; Liu, H.; Xu, L.; Cao, K.; Wu, H.; Gao, P.; Liu, H. Comprehensive Review and Future Prospects on Chip-Scale Thermal Management: Core of Data Center’s Thermal Management. Appl. Therm. Eng. 2024, 251, 123612. [Google Scholar] [CrossRef] [Scilit]
- Wei, Y.; Lei, Y.; Yao, Y.; Yang, R.; Qian, X. Design Principles of Thermoelectric-Microchannel Hybrid Cooling Modules for Hotspot Thermal Management. Int. J. Heat Mass Transf. 2025, 247, 127113. [Google Scholar] [CrossRef] [Scilit]
- Wang, H.; Yuan, X.; Zhang, K.; Lang, X.; Chen, H.; Yu, H.; Li, S. Performance Evaluation and Optimization of Data Center Servers Using Single-Phase Immersion Cooling. Int. J. Heat Mass Transf. 2024, 221, 125057. [Google Scholar] [CrossRef] [Scilit]
- Fazeli, K.; Vafai, K. Analysis of Optimized Combined Microchannel and Heat Pipes for Electronics Cooling. Int. J. Heat Mass Transf. 2024, 219, 124842. [Google Scholar] [CrossRef] [Scilit]
- Zhang, J.; An, J.; Xin, G.; Wang, X.; Zhou, Q.; Huang, J.; Wu, Z. Numerical Investigation of Novel Manifold Microchannel Heat Sinks with Countercurrent Regions. Int. J. Heat Mass Transf. 2023, 214, 124389. [Google Scholar] [CrossRef] [Scilit]
- Tuckerman, D.B.; Pease, R.F.W. High-Performance Heat Sinking for VLSI. IEEE Electron Device Lett. 1981, 2, 126–129. [Google Scholar] [CrossRef] [Scilit]
- Zhang, F.; He, Y.; Lao, Y.; Zhai, L.; Liang, B. Optimization Design and Numerical Study on Thermal Performance of a Novel Diamond-Type Channel Cold Plate. Int. J. Therm. Sci. 2023, 188, 108254. [Google Scholar] [CrossRef] [Scilit]
- Shahsavar, A.; Shahmohammadi, M.; Arıcı, M.; Ali, H.M. Extensive Investigation of the Fluid Inlet/Outlet Position Effects on the Performance of Micro Pin-Fin Heatsink through Simulation. Energy Sources Part A Recovery Util. Environ. Eff. 2022, 44, 9489–9505. [Google Scholar] [CrossRef] [Scilit]
- Kalkan, O. Multi-Objective Optimization of a Liquid Metal Cooled Heat Sink for Electronic Cooling Applications. Int. J. Therm. Sci. 2023, 190, 108325. [Google Scholar] [CrossRef] [Scilit]
- Kose, H.A.; Yildizeli, A.; Cadirci, S. Parametric Study and Optimization of Microchannel Heat Sinks with Various Shapes. Appl. Therm. Eng. 2022, 211, 118368. [Google Scholar] [CrossRef] [Scilit]
- Lu, X.; Wang, L.; Wang, L.; Hu, Y. Heat Transfer Enhancement of Diamond Rib Mounted in Periodic Merging Chambers of Micro Channel Heat Sink. Micromachines 2025, 16, 533. [Google Scholar] [CrossRef] [Scilit]
- Chen, S.J.; Li, S.; Hu, Z.-Z. Fluid Flow and Heat Transfer Characteristics of Manifold Microchannel Heat Sinks with Ribs of Different Shapes. Int. J. Heat Mass Transf. 2025, 251, 127300. [Google Scholar] [CrossRef] [Scilit]
- Li, B.; Cui, Y.; Li, G.; Jiang, H. Numerical Analysis on Thermal-Hydraulic Performance of Optimized Microchannel Heat Sink with Slant Ribs and Quatrefoil Rib-Elliptical Groove Complex Structures. Appl. Therm. Eng. 2024, 240, 122165. [Google Scholar] [CrossRef] [Scilit]
- Li, Y.; Zhu, C.; Xia, G.; Yang, B. Experimental Investigation on the Phase Change Liquid Cooling Characteristics in the Offset Grooved Microchannel Heat Sink. Appl. Therm. Eng. 2025, 269, 126032. [Google Scholar] [CrossRef] [Scilit]
- Kang, H.; Mei, X.; Xu, K.; Cui, J. Investigation of Heat Transfer Performance of the Manifold Microchannel Heat Sink with Different Interface Configurations. Int. Commun. Heat Mass Transf. 2024, 159, 107807. [Google Scholar] [CrossRef] [Scilit]
- Qiu, Y.; Wang, H.; Carter, J.; McGuffin-Cawley, J.; Kharangate, C.R. Experimental Investigation of Heat Transfer and Pressure Drop in Copper Manifold Microchannel Heat Sinks. Appl. Therm. Eng. 2024, 255, 124024. [Google Scholar] [CrossRef] [Scilit]
- Maheswari, A.; Prajapati, Y.K.; Bhandari, P.; Upadhyaya, R. Experimental Analysis of Double Layer Microchannel Heat Sink with Distinct Fin Configurations in Upper and Lower Layers. Int. J. Therm. Sci. 2024, 203, 109177. [Google Scholar] [CrossRef] [Scilit]
- Cao, X.; Lan, X.; Gao, S.; Wang, C.-C.; Shen, H. Thermal-Dynamic Analysis Research on the Designed Impingement-Jet Double-Layer Nested Microchannel Heat Sinks with Vertical Truncated Bifurcation. Appl. Therm. Eng. 2024, 243, 122585. [Google Scholar] [CrossRef] [Scilit]
- Sallar, H.; Irfan, M.; Khan, M.M.; Shahzad, M.W. Hydro-Thermal Performance of an I-Shaped Pin Fin Microchannel Heat Sink with Variable Pin Fin Height, Thickness and Orientation. Int. Commun. Heat Mass Transf. 2025, 160, 108256. [Google Scholar] [CrossRef] [Scilit]
- Li, Y.; Wang, T.; Wang, Z.; Zhu, C.; Yang, J.; Yang, B. Thermal–Hydraulic Performance Analysis of Combined Heat Sink with Open Microchannels and Embedded Pin Fins. Energies 2024, 17, 5301. [Google Scholar] [CrossRef] [Scilit]
- Yang, T.; Zhang, X.; Chang, Z.; Xu, R.; Ma, J.; Xu, L.; Xi, L. A Review on Application of Pin-Fins in Enhancing Heat Transfer. Energies 2024, 17, 4305. [Google Scholar] [CrossRef] [Scilit]
- Ismail, O.A.; Ali, A.M.; Hassan, M.A.; Gamea, O. Geometric Optimization of Pin Fins for Enhanced Cooling in a Microchannel Heat Sink. Int. J. Therm. Sci. 2023, 190, 108321. [Google Scholar] [CrossRef] [Scilit]
- Chiu, H.-C.; Youh, M.-J.; Hsieh, R.-H.; Jang, J.-H.; Kumar, B. Numerical Investigation on the Temperature Uniformity of Micro-Pin-Fin Heat Sinks with Variable Density Arrangement. Case Stud. Therm. Eng. 2023, 44, 102853. [Google Scholar] [CrossRef] [Scilit]
- Shen, Y.-T.; Pan, Y.-H.; Chen, H.; Cheng, W.-L. Experimental Study of Embedded Manifold Staggered Pin-Fin Microchannel Heat Sink. Int. J. Heat Mass Transf. 2024, 226, 125488. [Google Scholar] [CrossRef] [Scilit]
- Haque, M.R.; Hridi, T.J.; Haque, M.M. CFD Studies on Thermal Performance Augmentation of Heat Sink Using Perforated Twisted, and Grooved Pin Fins. Int. J. Therm. Sci. 2022, 182, 107832. [Google Scholar] [CrossRef] [Scilit]
- Feng, S.; Yan, Y.; Li, H.; Zhang, L.; Yang, S. Thermal Management of 3D Chip with Non-Uniform Hotspots by Integrated Gradient Distribution Annular-Cavity Micro-Pin Fins. Appl. Therm. Eng. 2021, 182, 116132. [Google Scholar] [CrossRef] [Scilit]
- Fallahtafti, N.; Rangarajan, S.; Hadad, Y.; Arvin, C.; Sikka, K.; Hoang, C.H.; Mohsenian, G.; Radmard, V.; Schiffres, S.; Sammakia, B. Shape Optimization of Hotspot Targeted Micro Pin Fins for Heterogeneous Integration Applications. Int. J. Heat Mass Transf. 2022, 192, 122897. [Google Scholar] [CrossRef] [Scilit]
- Sadique, H.; Murtaza, Q.; Samsher. Heat Transfer Augmentation in Microchannel Heat Sink Using Secondary Flows: A Review. Int. J. Heat Mass Transf. 2022, 194, 123063. [Google Scholar] [CrossRef] [Scilit]
- Wen, H.; Liang, Z.; Luo, Q.; Wu, C.; Wang, C. Heat Transfer Performance Study of Microchannel Heat Sink with Composite Secondary Channels. Int. Commun. Heat Mass Transf. 2023, 143, 106718. [Google Scholar] [CrossRef] [Scilit]
- Polat, M.E.; Ulger, F.; Cadirci, S. Multi-Objective Optimization and Performance Assessment of Microchannel Heat Sinks with Micro Pin-Fins. Int. J. Therm. Sci. 2022, 174, 107432. [Google Scholar] [CrossRef] [Scilit]
- Bhandari, P.; Padalia, D.; Ranakoti, L.; Khargotra, R.; András, K.; Singh, T. Thermo-Hydraulic Investigation of Open Micro Prism Pin Fin Heat Sink Having Varying Prism Sides. Alex. Eng. J. 2023, 69, 457–468. [Google Scholar] [CrossRef] [Scilit]
- Li, Y.; Chang, L.; Kou, G.; Sun, J.; Mu, M. Hotspots Thermal Management for Gallium Nitride Monolithic Microwave Integrated Circuit Power Amplifier Using Integrated Micro-Jet and Multi-Shape Micro Pin-Fin Heat Sinks. Int. J. Heat Mass Transf. 2026, 256, 128152. [Google Scholar] [CrossRef] [Scilit]
- Tang, Y.; Sandoughsaz, A.; Owen, K.J.; Najafi, K. Ultra Deep Reactive Ion Etching of High Aspect-Ratio and Thick Silicon Using a Ramped-Parameter Process. J. Microelectromech. Syst. 2018, 27, 686–697. [Google Scholar] [CrossRef] [Scilit]
- Kim, T.; Lee, J. Optimization of Deep Reactive Ion Etching for Microscale Silicon Hole Arrays with High Aspect Ratio. Micro Nano Syst. Lett. 2022, 10, 12. [Google Scholar] [CrossRef] [Scilit]
- Kadivar, M.; Tormey, D.; McGranaghan, G. CFD of Roughness Effects on Laminar Heat Transfer Applied to Additive Manufactured Minichannels. Heat Mass Transf. 2024, 60, 1915–1929. [Google Scholar] [CrossRef] [Scilit]
- Hou, X.; Yang, Y. A Novel Hybrid Staggered Arrangement Petal-Shaped Pin-Fin Microchannel Heat Sink for Hotspot Mitigation. Appl. Therm. Eng. 2026, 291, 130079. [Google Scholar] [CrossRef] [Scilit]
- Ji, X.; Yang, X.; Zhang, Y.; Zhang, Y.; Wei, J. Experimental Study of Ultralow Flow Resistance Fractal Microchannel Heat Sinks for Electronics Cooling. Int. J. Therm. Sci. 2022, 179, 107723. [Google Scholar] [CrossRef] [Scilit]
- Sun, H.; Fu, H.; Yan, L.; Ma, H.; Luan, Y.; Magagnato, F. Numerical Investigation of Flow and Heat Transfer in Rectangular Microchannels with and without Semi-Elliptical Protrusions. Energies 2022, 15, 4927. [Google Scholar] [CrossRef] [Scilit]

Disclaimer/Publisher’s Note: The statements, opinions and data contained in all publications are solely those of the individual author(s) and contributor(s) and not of MDPI and/or the editor(s). MDPI and/or the editor(s) disclaim responsibility for any injury to people or property resulting from any ideas, methods, instructions or products referred to in the content. |
© 2026 by the authors. Licensee MDPI, Basel, Switzerland. This article is an open access article distributed under the terms and conditions of the Creative Commons Attribution (CC BY) license.