


Abstract
This study presents a five-state functional model for assessing the reliability of electric vehicle charging infrastructure from the perspective of charging-service capability. The model distinguishes full functionality, three levels of degradation, and the loss of the basic charging function. State changes are described using a time-homogeneous continuous-time Markov process that includes progressive degradation, sudden functional loss, and restoration to state S0. On this basis, MTTF, MTTR, and MTBF are reinterpreted in relation to first attainment, restoration trajectories, and complete functional cycles. The reference calculations determine stationary state probabilities, annual residence times, and the effectiveness of restoration before reaching S4. The results show that a low stationary probability of S4 may still correspond to a meaningful annual period of service unavailability, while most functional cycles end with restoration from intermediate states. The proposed framework provides a reproducible basis for analysing EV charging infrastructure and can be applied using transition intensities estimated from operator records.
Keywords:
EV charging infrastructure; five-state model; multistate reliability; Markov process; MTTF; MTBF; MTTR; MTBF 1. Introduction
Ensuring the continuity and quality of operation of complex technical systems remains one of the key challenges of modern reliability engineering, especially in the case of infrastructures whose performance directly affects users, operators, and the wider energy environment. This category increasingly includes electric vehicle charging infrastructure, whose importance is growing together with the rapid expansion of electromobility, the rising density of charging networks, and the integration of charging services with power systems, digital platforms, and energy management solutions [1,2].
Battery electric vehicles are not the only technological pathway supporting the decarbonization of road transport. Fuel cell vehicles (FCVs), particularly in applications such as public and heavy-duty transport, constitute a complementary solution in which energy efficiency and operational performance also depend strongly on appropriate energy management strategies. Recent research on fuel cell buses demonstrates the growing role of advanced energy management methods in improving the efficiency and robustness of such systems [3].
In its contemporary form, an EV charging hub can no longer be interpreted as a simple set of independent chargers. It is a complex functional system composed of multiple charging points, grid connection components, transformer infrastructure, protection and distribution systems, communication layers, user authorization and payment services, operator platform functions, diagnostics, alarm management, maintenance processes, and, in many cases, local energy resources such as photovoltaic generation and battery energy storage systems [4,5,6]. The ability of such a hub to perform its basic function depends not only on the technical condition of individual chargers, but on the coordinated operation of all these subsystems. A representative example of such an integrated EV charging hub, combining multiple charging points, photovoltaic generation, energy storage, and energy management functions, is shown in Figure 1.
Figure 1.
Representative EV charging hub integrating multiple charging points, photovoltaic generation, energy storage, and energy management functions (AI-generated for illustrative purposes).
The configuration illustrated in Figure 1 demonstrates that the actual capability of the hub cannot be assessed solely on the basis of the technical availability of individual charging points. Effective service delivery depends on the coordinated operation of the energy supply, charging infrastructure, communication systems, user services, and maintenance support.
From the user’s perspective, the key issue is not whether a charger is formally available in the binary sense, but whether the charging service can actually be started, maintained, and completed with the expected power, within an acceptable time, and under proper communication, authorization, and settlement conditions [7,8]. In real operating conditions, an EV charging hub may remain partially functional despite degradation of some of its components, but it may also formally appear available while being unable to provide an effective charging service due to power limitation, communication failure, EMS malfunction, payment problems, or delayed maintenance response [9,10]. This creates a clear discrepancy between component availability and actual service capability.
In the classical reliability approach, the assessment of system performance is based on indicators such as MTTF, MTTR, and MTBF. These indicators are widely used in both theoretical analyses and engineering practice because they provide a concise description of the relationship between failure and renewal processes and enable comparisons among different systems, configurations, or maintenance policies [11,12]. Their interpretative simplicity is also one of the main reasons for their continuing popularity in technical diagnostics and reliability-oriented decision support.
At the same time, these indicators were originally formulated on the basis of a binary description of the system state, in which the object is treated as either operational or non-operational. Such an assumption may be sufficient for simple single-function objects, but it becomes inadequate when applied to complex infrastructures with layered dependencies and gradual functional degradation [13,14]. In an EV charging hub, deterioration rarely takes the form of a single abrupt failure. Instead, it often develops through partial loss of charging capacity, reduction in available power, local charger malfunction, communication disturbances, degradation of ESS support, unsuccessful authorization or payment processes, and delayed service intervention. As a result, the boundary between operation and failure becomes functionally blurred.
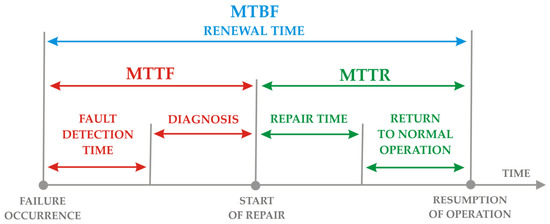
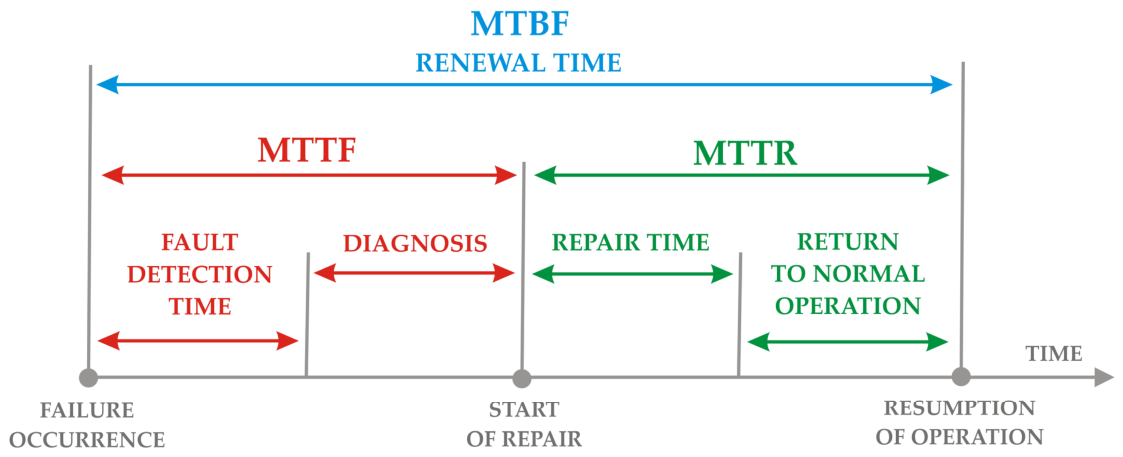
Classical relationships between time to failure, repair time, and mean time between failures are usually represented on a time axis distinguishing the period of correct operation, the moment of failure occurrence, the detection and diagnosis stages, the repair process, and the return to normal operation [11]. A schematic representation of this classical cycle is shown in Figure 2.
Figure 2.
Classical time-based scheme of the relationships between the MTTF, MTTR, and MTBF indicators, taking into account the stages of fault detection, diagnosis, repair, and return to normal operation of the system.
The interpretation of classical dependability measures is also supported by international standards. IEC 61703 provides mathematical expressions for selected reliability, availability, maintainability, and maintenance-support measures, while IEC 61025 provides a standardized framework for fault tree analysis as one of the established techniques of dependability assessment [15,16]. These standards provide an important normative context for reliability-oriented system analysis, although the present study adopts a state-transition approach rather than fault tree analysis.
In the case of EV charging hubs, however, the interpretation of repair and failure-related times becomes considerably more complex. MTTR cannot be treated solely as the time needed to repair a damaged component, because the restoration of service may involve fault detection, diagnosis, communication recovery, operational decision-making, power reallocation, reconfiguration of charging availability, or backend intervention. During these activities, the hub may still preserve full or partial capability to deliver charging service. Consequently, identical MTTR values may correspond to substantially different levels of functional availability. A similar interpretative problem arises for MTTF and MTBF, since the occurrence of a technical fault does not necessarily coincide with the loss of the charging service, and the same aggregate indicator value may correspond to very different functional trajectories of the hub [17,18,19].
Recent studies also demonstrate that multi-state reliability information can provide a basis for maintenance decision-making. Predictive inspection and maintenance policies based on multi-state system models can use information about degradation states to determine appropriate intervention strategies. Similar approaches have also been developed for fleets of self-service systems, including EV charging piles, where maintenance decisions are optimized with respect to service availability and maintenance costs. These studies indicate that distinguishing intermediate degradation states is relevant not only for reliability assessment but also for supporting maintenance decisions [20,21].
These observations lead to the conclusion that classical reliability indicators, although mathematically correct, do not always provide information that is sufficiently relevant from the perspective of the actual service capability of complex EV charging infrastructure. In particular, they do not allow for a clear distinction between minor degradation, service-affecting degradation, a pre-failure condition threatening service continuity, and the complete loss of the charging function [22,23,24].
For this reason, the present study proposes a five-state functional model of an EV charging hub, in which the system states are defined with respect to the actual capability of delivering the charging service rather than the simple number of working chargers. The proposed classification distinguishes full functionality, minor degradation, significant degradation affecting service availability, a pre-failure state in which service continuity is at risk, and a state of inability to perform the basic charging function. On this basis, the classical reliability indicators MTTF, MTTR, and MTBF are reinterpreted in relation to the functional degradation and restoration of the entire charging hub.
The aim of this study is therefore to develop a five-state functional framework for the reliability-oriented assessment of EV charging infrastructure and to show how the indicators MTTF, MTTR, and MTBF can be reinterpreted so that they refer to the real capability of a charging hub to provide the charging service. The proposed approach makes it possible to relate reliability analysis not only to technical faults of individual components, but also to the broader functional behaviour of the hub, including partial degradation, service restoration trajectories, and the influence of energy, communication, and service-related disturbances [25].
2. Characteristics of the Investigated Object
2.1. Functional Perspective of the Investigated EV Charging Hub
The investigated object is an EV charging hub understood as a complex technical and service infrastructure designed to provide coordinated charging services for multiple electric vehicles. Its primary function is not limited to the delivery of electrical energy through individual charging points. The hub must also ensure the availability of power, correct allocation of charging capacity, communication with vehicles and external platforms, user authorization, payment processing, fault detection, operational supervision, and restoration of service after degradation or failure.
The functional capability of the hub therefore results from the coordinated operation of energy, charging, communication, and service-related subsystems. A technically operational charging point does not necessarily mean that the charging service is available. The service may remain unavailable because of insufficient power, communication loss, authorization failure, backend malfunction, payment processing errors, or delayed maintenance response.
For this reason, the investigated object is assessed from the perspective of its actual capability to provide the charging service rather than from the perspective of the binary availability of individual chargers.
2.2. Layered Functional Structure of the Hub
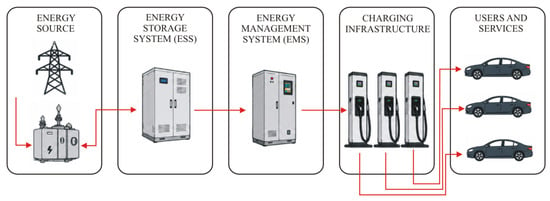
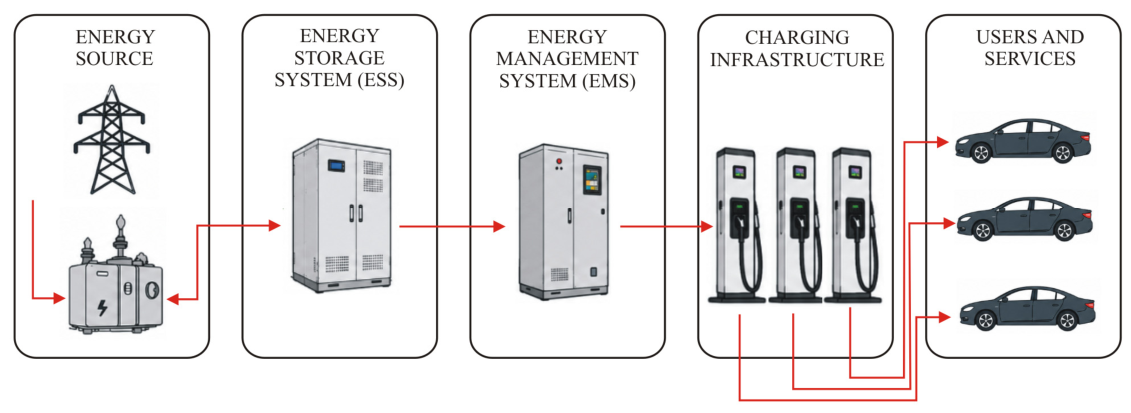
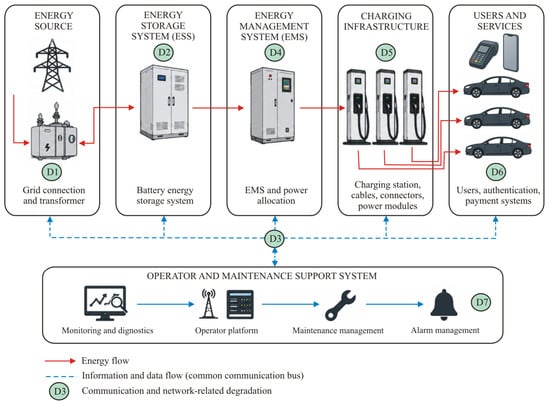
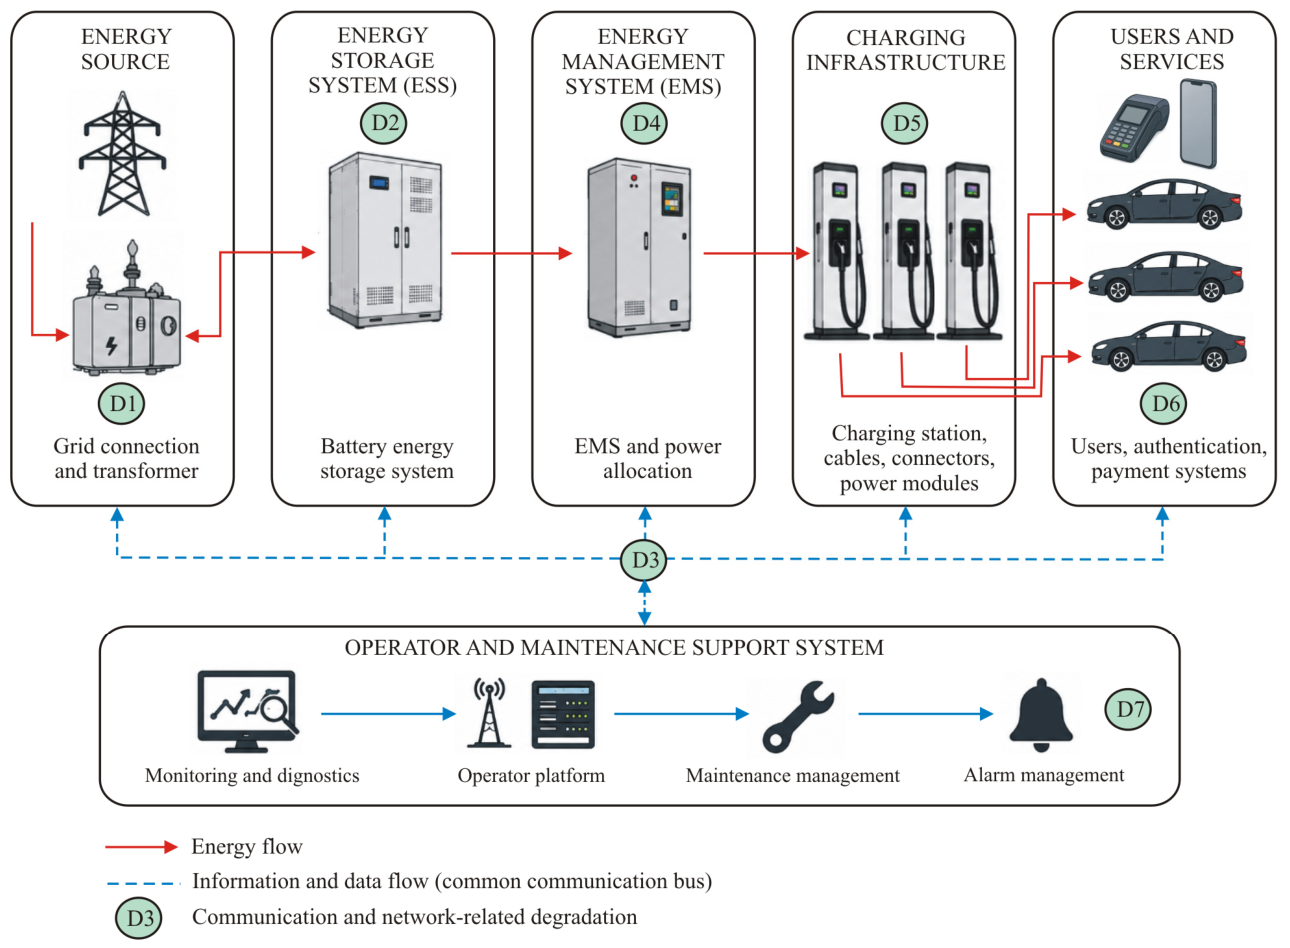
The simplified functional structure of the investigated EV charging hub is shown in Figure 3. The diagram presents the main operational path of the system, beginning with the energy source and ending with the provision of charging service to EV users.
Figure 3.
Simplified functional structure of the investigated EV charging hub, showing the main energy and service path from the energy source to the charging service.
The diagram shown in Figure 3 represents the core functional architecture of the hub. In this perspective, the charging service is the final result of coordinated operation of the energy supply subsystem, optional energy storage support, energy management, and charging infrastructure. Additional functions such as communication, monitoring, authentication, payment, and maintenance are not treated here as separate branches of the main structure, but as supporting mechanisms whose role will be discussed in the following parts of the paper.
For the purposes of further analysis, the EV charging hub is represented as a layered functional system composed of the energy supply layer, energy management layer, charging infrastructure layer, communication and service layer, and maintenance support layer.
The energy supply layer provides the electrical power required for charging and may include the external power grid, transformer, distribution system, photovoltaic installation, and energy storage system. The energy management layer coordinates power allocation, peak limitation, load balancing, and the interaction between the grid, local generation, storage, and charging demand.
The charging infrastructure layer performs the physical transfer of energy to electric vehicles and includes charging units, power modules, cables, connectors, cooling systems, and vehicle interface functions. The communication and service layer supports data exchange, session authorization, payment processing, operator control, and communication between the charging station, backend platform, and vehicle.
The maintenance support layer includes monitoring, diagnostics, alarm management, maintenance planning, and predictive maintenance. Its role is not limited to fault reporting. It also determines how quickly degradation is detected, interpreted, and reversed before the continuity of the charging service is lost.
The cooperation of these layers determines the functional condition of the entire hub. Degradation of one layer may be compensated by another, but it may also propagate through the system and cause a transition to a lower functional state. The principal functional elements of the investigated EV charging hub, together with their roles and the consequences of their degradation for the charging service, are summarized in Table 1.
Table 1.
Functional elements of the EV charging hub and their significance for the provision of the charging service.
As shown in Table 1, the loss or degradation of individual elements may produce different functional consequences depending on their position in the system structure and on the availability of compensating mechanisms. Therefore, the condition of the hub cannot be inferred solely from the technical state of a single component. It must be assessed with respect to the resulting capability of the entire infrastructure to provide the charging service.
2.3. Environmental and Operating Conditions
The functional capability of an EV charging hub also depends on the environmental and operating conditions in which the infrastructure is used. High ambient temperature, rainfall, humidity, snow, icing, dust, wind, and variable solar irradiation may influence electrical, thermal, mechanical, and communication subsystems. These factors may reduce the available charging power, increase thermal stress, disturb communication, accelerate component degradation, or limit the availability of selected charging points.
Figure 4 illustrates the operation of an EV charging hub under substantially different climatic and environmental conditions.
Figure 4.
EV charging hub operating under different climatic and environmental conditions, including high temperature, heavy rainfall, coastal exposure, and snow (AI-generated for illustrative purposes).
The environmental conditions presented in Figure 4 do not define the functional states of the hub directly. They constitute external degradation factors that may affect the energy supply, charging modules, connectors, cooling systems, communication infrastructure, photovoltaic installation, and energy management system. Their influence is therefore reflected through changes in the functional capability of the hub and through transitions between states S0–S4.
2.4. Functional Consequences of System Complexity
The complex structure of the EV charging hub has direct consequences for reliability analysis. The loss of a single component does not necessarily result in the loss of the charging function, while the technical availability of individual charging points does not guarantee effective service delivery.
A hub may remain operational with reduced power, a limited number of available charging points, degraded communication, or restricted service functions. It may also be formally available while users are unable to start or complete a charging session. Consequently, the functional state of the hub cannot be determined solely on the basis of the number of operational chargers or conventional uptime measures.
The reliability assessment of such an object therefore requires the introduction of intermediate functional states that describe different levels of degradation, service limitation, and pre-failure behaviour. This provides the direct justification for the five-state classification presented in the following section.
3. Five-State Functional Classification of the EV Charging Hub Condition
The functional condition of an EV charging hub cannot be described adequately using a binary operational–failed distinction. In practice, the loss of a single component does not necessarily result in the complete loss of the charging service, while the formal availability of individual charging points does not guarantee that users are able to initiate, continue, and complete charging sessions. The hub may continue to operate under reduced power, with a limited number of available charging points, degraded communication, restricted payment functionality, or impaired maintenance support.
For this reason, the condition of the investigated object is defined with respect to its actual capability to provide the charging service. The classification does not result directly from the number of operational chargers. Instead, it reflects the combined effect of the energy supply, charging infrastructure, communication, authentication, payment, diagnostic, and maintenance subsystems on the performance of the hub as a whole.
A three-state classification would allow the distinction between full functionality, degraded operation, and functional loss, but it would not separate minor degradation from degradation that already affects users. A four-state classification would provide an additional intermediate level, but it would still not distinguish clearly between significant functional limitation and a pre-failure condition in which service continuity is directly threatened. Therefore, a five-state classification was adopted.
The proposed model distinguishes full functionality, minor degradation, significant degradation, a pre-failure state, and the loss of the capability to perform the basic charging function. The five-state structure enables the gradual deterioration of the hub to be represented without equating every local fault with system failure.
Definition of Functional States
State S0 represents the full functional capability of the EV charging hub. The required charging points are available, charging sessions are initiated and completed correctly, the expected charging power can be delivered, and the communication, authorization, payment, diagnostic, and maintenance functions operate without significant disturbances.
State S1 represents minor functional degradation that does not significantly affect users. A local disturbance or the loss of a non-critical element may occur, but the hub retains the required charging capability. The degradation may be visible to the operator through diagnostic or monitoring data, although users generally continue to receive the expected service.
State S2 represents significant functional degradation that affects service availability or quality. The number of available charging points may be reduced, charging power may be limited, charging sessions may take longer, or communication, authorization, and payment problems may occur repeatedly. The hub remains capable of providing the charging service, but its functional performance is clearly lower than in the nominal state.
State S3 represents the pre-failure condition. In this state, the charging service may still be available, but its continuity is directly threatened. The hub may operate close to the limit of available power, with reduced redundancy, unstable communication, repeated interruption of sessions, severe degradation of charging modules, or delayed maintenance response. Continued operation without intervention creates a substantial risk of transition to state S4.
State S4 represents the loss of the capability to perform the basic charging function. The hub is unable to initiate, maintain, or complete charging sessions at the required service level. This condition may result from the loss of power supply, failure of critical charging infrastructure, inability to allocate energy, complete communication or backend failure, or another disturbance that prevents the charging service from being provided.
The adopted functional interpretation of states S0–S4 is summarized in Table 2.
Table 2.
Functional interpretation of the states of the EV charging hub.
For practical application of the proposed classification, the functional state should be assigned using observable service-related parameters. These may include the proportion of available charging points, available charging power relative to the required level, charging-session success rate, and availability of communication, authorization and payment functions. The numerical thresholds separating S1, S2 and S3 are installation-specific and should be defined before the analysis on the basis of the technical configuration of the hub and the operator’s service requirements. State S1 corresponds to measurable degradation without violation of the required service level. State S2 is assigned when at least one service-related parameter exceeds its degradation threshold, while the basic charging service remains available. State S3 is assigned when a critical threshold is exceeded or the required functional reserve is lost, although charging service can still be provided. State S4 is assigned when the minimum required charging service can no longer be initiated, maintained or completed. If individual criteria indicate different states, the most severe identified state is assigned.
The classification is therefore based on the resulting service capability rather than on rigid component-count thresholds. For example, the failure of one charging point does not automatically imply transition to state S2 if the remaining infrastructure is able to compensate for the loss without noticeable impact on users. Conversely, the hub may reach state S3 or S4 even when several charging points remain technically operational, if the charging service cannot be provided because of insufficient power, communication failure, authorization problems, or loss of backend functionality.
The transition of the hub between the distinguished states depends on the type, location, intensity, and duration of the degradation process, as well as on the effectiveness of compensating and maintenance mechanisms. The formal representation of degradation and restoration transitions between states S0–S4 is presented in the following section.
4. Sources of Functional Degradation in the EV Charging Hub
The functional degradation of an EV charging hub may originate from disturbances occurring in the energy supply, charging infrastructure, communication systems, user-service processes, and maintenance support mechanisms. These disturbances do not define the functional states S0–S4 directly. Instead, they act as degradation sources that may reduce the capability of the hub and initiate transitions between the distinguished states.
For the purposes of the present study, seven principal problem groups were identified. They represent recurrent operational mechanisms that may impair the provision of the charging service even when part of the infrastructure remains technically available.
4.1. Partial Loss of Functionality
Partial loss of functionality occurs when selected charging points, power modules, connectors, or supporting components become unavailable while the hub retains part of its service capability. The functional consequence depends on the level of redundancy, current demand, and the ability of the remaining infrastructure to compensate for the loss. A local failure may therefore result in state S1, but under high-load conditions the same event may cause transition to S2 or S3.
4.2. Discrepancy Between Reported Uptime and Actual Charging Effectiveness
A charging point may be reported as available by the operator platform while users are unable to initiate or complete a charging session. Such discrepancies may result from backend errors, unstable communication, incorrect status reporting, vehicle incompatibility, authorization problems, or internal charger faults. Consequently, conventional uptime values may overestimate the real functional capability of the hub.
4.3. Communication and Network Problems
Communication and network disturbances may affect data exchange between chargers, the EMS, the operator platform, payment systems, and external service providers. Loss of Ethernet, cellular connectivity, or OCPP communication may prevent remote control, session authorization, billing, diagnostics, or alarm transmission. Depending on the system configuration, the physical charging equipment may remain operational while the charging service becomes partially or completely unavailable.
4.4. Charging Power Limitation
Charging power may be limited by the available grid connection capacity, transformer loading, operation of the ESS, EMS decisions, thermal restrictions, or temporary constraints imposed by the distribution system operator. Power limitation does not necessarily result in immediate service loss, but it may increase charging time, reduce hub throughput, and produce queues. Persistent or severe limitation may therefore shift the hub from state S1 to S2 or S3.
4.5. Failures of Connectors, Cables, and Power Modules
Connectors, charging cables, contactors, cooling systems, and power electronic modules are directly involved in the transfer of energy to electric vehicles. Mechanical wear, thermal stress, insulation deterioration, locking faults, or module failure may prevent session initiation or cause charging interruption. The functional impact depends on the number of affected charging points and the ability of the hub to redirect users to alternative infrastructure.
4.6. Authorization and Payment Problems
The charging service may remain unavailable even when the energy and charging subsystems are technically operational. Failures of RFID identification, mobile applications, user accounts, payment terminals, tariffing systems, or external payment services may prevent users from initiating or completing charging sessions. These problems confirm that the service capability of the hub cannot be assessed solely from the condition of its electrical components.
4.7. Delayed Maintenance, Diagnostics, and Alarm Response
The duration and depth of functional degradation depend strongly on the effectiveness of monitoring, diagnostics, alarm management, and maintenance response. Missing data, incorrect diagnosis, false alarms, delayed intervention, or lack of spare parts may allow a minor disturbance to propagate into a critical condition. This problem group is particularly important for transitions from S1 to S2 and from S2 to S3, because timely intervention may prevent the loss of the basic charging function.
Table 3 shows that the same physical disturbance may have different functional consequences depending on the current load, system redundancy, compensating mechanisms, and maintenance response. Therefore, the assignment of a problem to a particular state cannot be based solely on the failed component. It must reflect the resulting capability of the hub to provide the charging service.
Table 3.
Principal sources of functional degradation in the EV charging hub.
The location of the seven problem groups within the functional structure of the investigated EV charging hub is shown in Figure 5.
Figure 5.
Location of the seven principal sources of functional degradation within the EV charging hub structure.
The same problem group may lead to different functional states depending on the current operating conditions, demand level, redundancy, and effectiveness of compensating mechanisms. Therefore, the assignment of a disturbance to a state S0–S4 cannot be performed solely on the basis of its physical origin. It must be based on the resulting impact on the capability of the hub to provide the charging service.
5. State Transition Graph of the Five-State EV Charging Hub Model
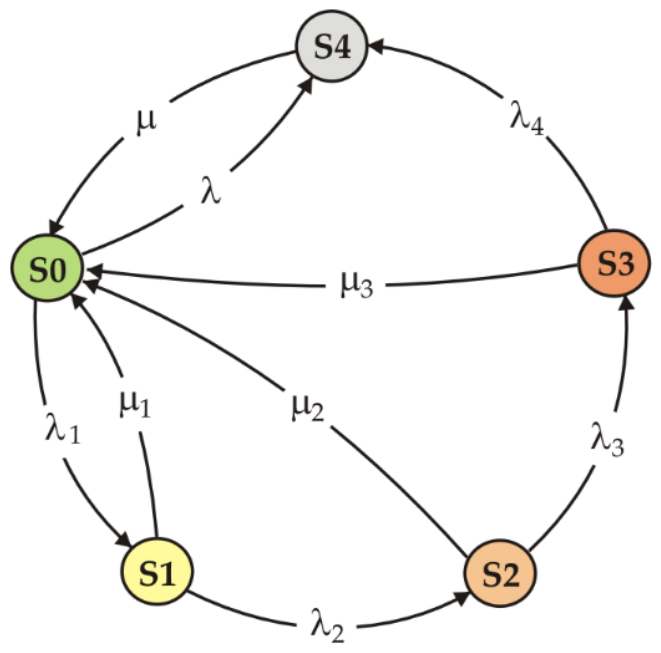
For the formal description of changes in the functional condition of the EV charging hub, a state transition graph was adopted in which the vertices represent the five functional states S0–S4, while the directed edges represent admissible degradation and restoration transitions. The graph enables the gradual deterioration of charging capability, sudden loss of service, and maintenance-related restoration processes to be represented within a single model.
The adopted structure distinguishes degradation transitions from S0 to S1, from S1 to S2, from S2 to S3, and from S3 to S4. These transitions describe the progressive reduction in the hub’s capability to provide the charging service. The model also includes a direct transition from S0 to S4, representing a sudden event that causes immediate loss of the basic charging function, for example a complete loss of power supply, critical transformer failure, central backend failure, or another event affecting the entire hub.
Restoration transitions lead from states S1, S2, S3, and S4 to state S0. They represent maintenance, repair, reconfiguration, communication recovery, restoration of power availability, or other actions that return the hub to full functional capability. The corresponding degradation transition intensities are denoted by λ1, λ2, λ3, λ4, and λ, while restoration intensities are denoted by μ1, μ2, μ3, and μ.
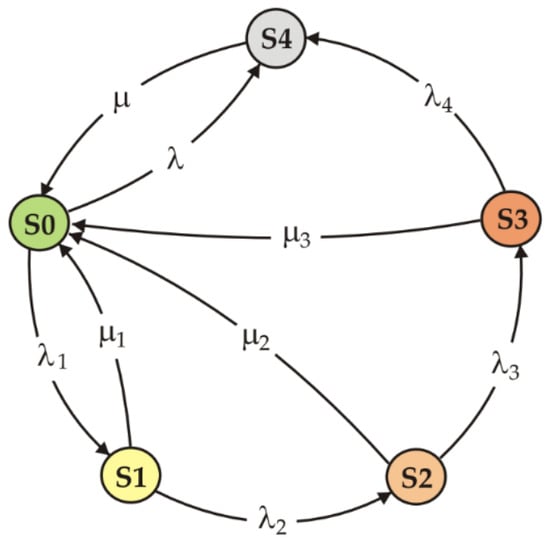
The state transition graph of the five-state functional model is shown in Figure 6.
Figure 6.
State transition graph of the five-state functional model of the EV charging hub, including degradation, sudden-failure, and restoration transitions.
The graph allows different operational trajectories to be represented, including in particular:
- complete functional degradation trajectory
S0 → S1 → S2 → S3 → S4, representing the gradual deterioration of the hub from full functionality to complete loss of the charging service;
- early maintenance trajectory
S0 → S1 → S2 → S0, in which degradation is detected and reversed before the hub reaches the pre-failure state;
- rapid intervention trajectory
S0 → S1 → S0, representing a local disturbance removed before it significantly affects users or the functional capability of the hub;
- sudden failure and full restoration trajectory
S0 → S4 → S0, corresponding to an event that immediately interrupts the charging service and requires full restoration of the hub;
- delayed response trajectory
S0 → S1 → S2 → S3 → S0, in which the hub reaches the pre-failure state, but corrective action prevents the loss of the basic charging function.
In this case, the hub reaches the pre-failure state, but corrective action is completed before the loss of the basic charging function.
The asymmetry between degradation and restoration constitutes an important feature of the model. Functional deterioration may develop gradually through several intermediate states, whereas restoration may return the hub directly to full functionality. This reflects the actual operation of charging infrastructure, where multiple disturbances may accumulate over time, while successful maintenance, reconfiguration, or system recovery may restore the required service capability in a single intervention.
A fully connected five-state transition graph could be formulated in which transitions between all pairs of functional states are permitted. Such a structure would require the estimation of up to 20 directed transition intensities and would provide greater flexibility in representing sudden degradation and partial restoration. However, it would also substantially increase the amount of operational data required for reliable parameter estimation and the complexity of model interpretation. For this reason, the present study deliberately adopts a reduced reference topology containing the principal degradation and restoration pathways. Additional transitions, including direct transitions from degraded states to S4 and partial restoration to intermediate states, can be incorporated when sufficiently detailed operational data are available.
The adopted graph provides the formal basis for defining transition intensities, constructing the continuous-time Markov model, and calculating the reinterpreted MTTF, MTTR, and MTBF indicators. The input data required for estimating the transition parameters are presented in the following section.
6. Mathematical Model of the Five-State EV Charging Hub
The functional behaviour of the investigated EV charging hub is described using a time-homogeneous continuous-time Markov process. The transition intensities are assumed to be constant within the considered observation period, which allows the average degradation and restoration behaviour of the hub to be represented under stationary operating conditions.
The time-homogeneous assumption is adopted here as a reference approximation for an operating regime in which the external conditions and system configuration can be regarded as approximately stable over the considered observation period. The model therefore does not assume that demand, environmental conditions, or redundancy remain unchanged over the entire lifetime of the infrastructure. Instead, their combined influence is represented by constant average transition intensities within the analysed regime. If these factors change substantially over time, the transition intensities should be re-estimated for the corresponding operating periods or replaced by time-dependent transition rates.
The mathematical model is constructed directly from the state transition graph shown in Figure 5. For stationary analysis, the balance equations together with the normalization condition can be written in matrix form as
The first row represents the normalization condition
The remaining rows describe the stationary probability balance for the individual functional states.
From the matrix system, the probabilities of the degraded states can be expressed as functions of
Substituting these relationships into the normalization condition gives the stationary probability of full functional capability
It can also be written more concisely:
The remaining stationary probabilities are obtained by substituting the calculated value of into the corresponding expressions for , , , and .
The resulting probability distribution characterizes the long-term functional condition of the EV charging hub. The model also provides the mathematical basis for the subsequent computational implementation of the reinterpreted MTTF, MTTR, and MTBF indicators.
7. Reinterpretation and Computational Algorithms for MTTF, MTTR, and MTBF
In the five-state functional model, MTTF, MTTR, and MTBF refer to changes in the actual capability of the EV charging hub to provide the charging service. The intermediate states distinguish gradual degradation from complete functional loss and allow restoration before reaching state S4 to be separated from recovery after failure.
This distinction is important because a technical disturbance does not always interrupt the charging service, while a formally operational hub may already provide limited or ineffective service. The reinterpreted indicators therefore offer a more accurate basis for evaluating service continuity, maintenance effectiveness, and the influence of degradation trajectories on hub operation.
7.1. MTTF as the Time to Functional Loss and Its Computational Algorithm
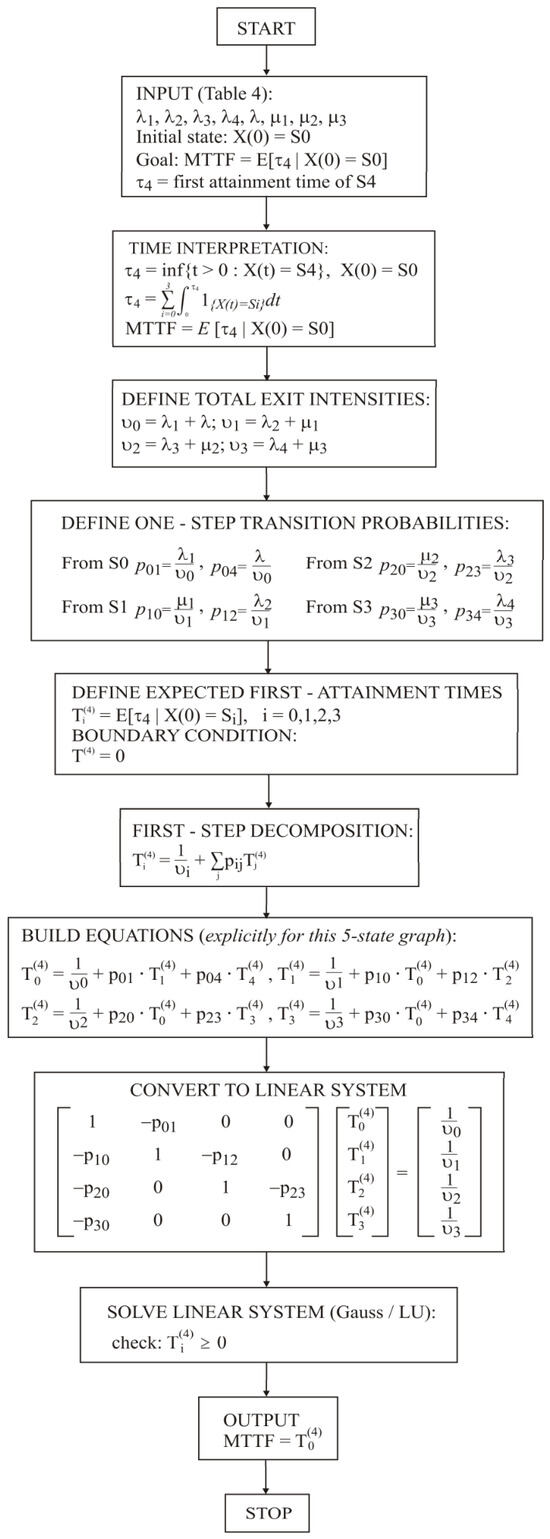
In the five-state model, MTTF represents the expected time from full functional capability to the first loss of the basic charging function. The boundary event is the first attainment of state S4, regardless of whether it results from progressive degradation through the intermediate states or from a sudden system-level disturbance represented by the direct transition :
Accordingly, the reinterpreted MTTF is the expected value of this time when the investigated EV charging infrastructure initially operates in state S0:
The expected time required to reach S4 depends on the initial functional state of the charging infrastructure. It is denoted by , where the lower index identifies the initial state , while the upper index identifies S4 as the target state. Once the basic charging function has been lost, no further time is required to reach the target state:
While operating in S0, the charging infrastructure may enter the first degraded state S1 with intensity or lose its basic function immediately with intensity . The mean residence time in S0 is therefore . Only the transition to S1 requires the addition of the remaining expected time to functional loss:
In state S1, further degradation may lead to S2 with intensity , whereas maintenance or operational intervention may restore full functional capability with intensity . A return to S0 does not terminate the MTTF calculation because another degradation process may subsequently begin:
In state S2, the charging service remains available but its quality or capacity is already reduced. The infrastructure may deteriorate further to S3 with intensity or return to S0 with intensity :
In the pre-failure state S3, continuity of the charging service is directly threatened. The infrastructure may either lose the basic charging function with intensity or return to full functional capability with intensity . Since reaching S4 terminates the calculation, only the restoration transition introduces an additional expected time:
The simultaneous solution of these equations gives the expected time from full functional capability to the first loss of the charging function:
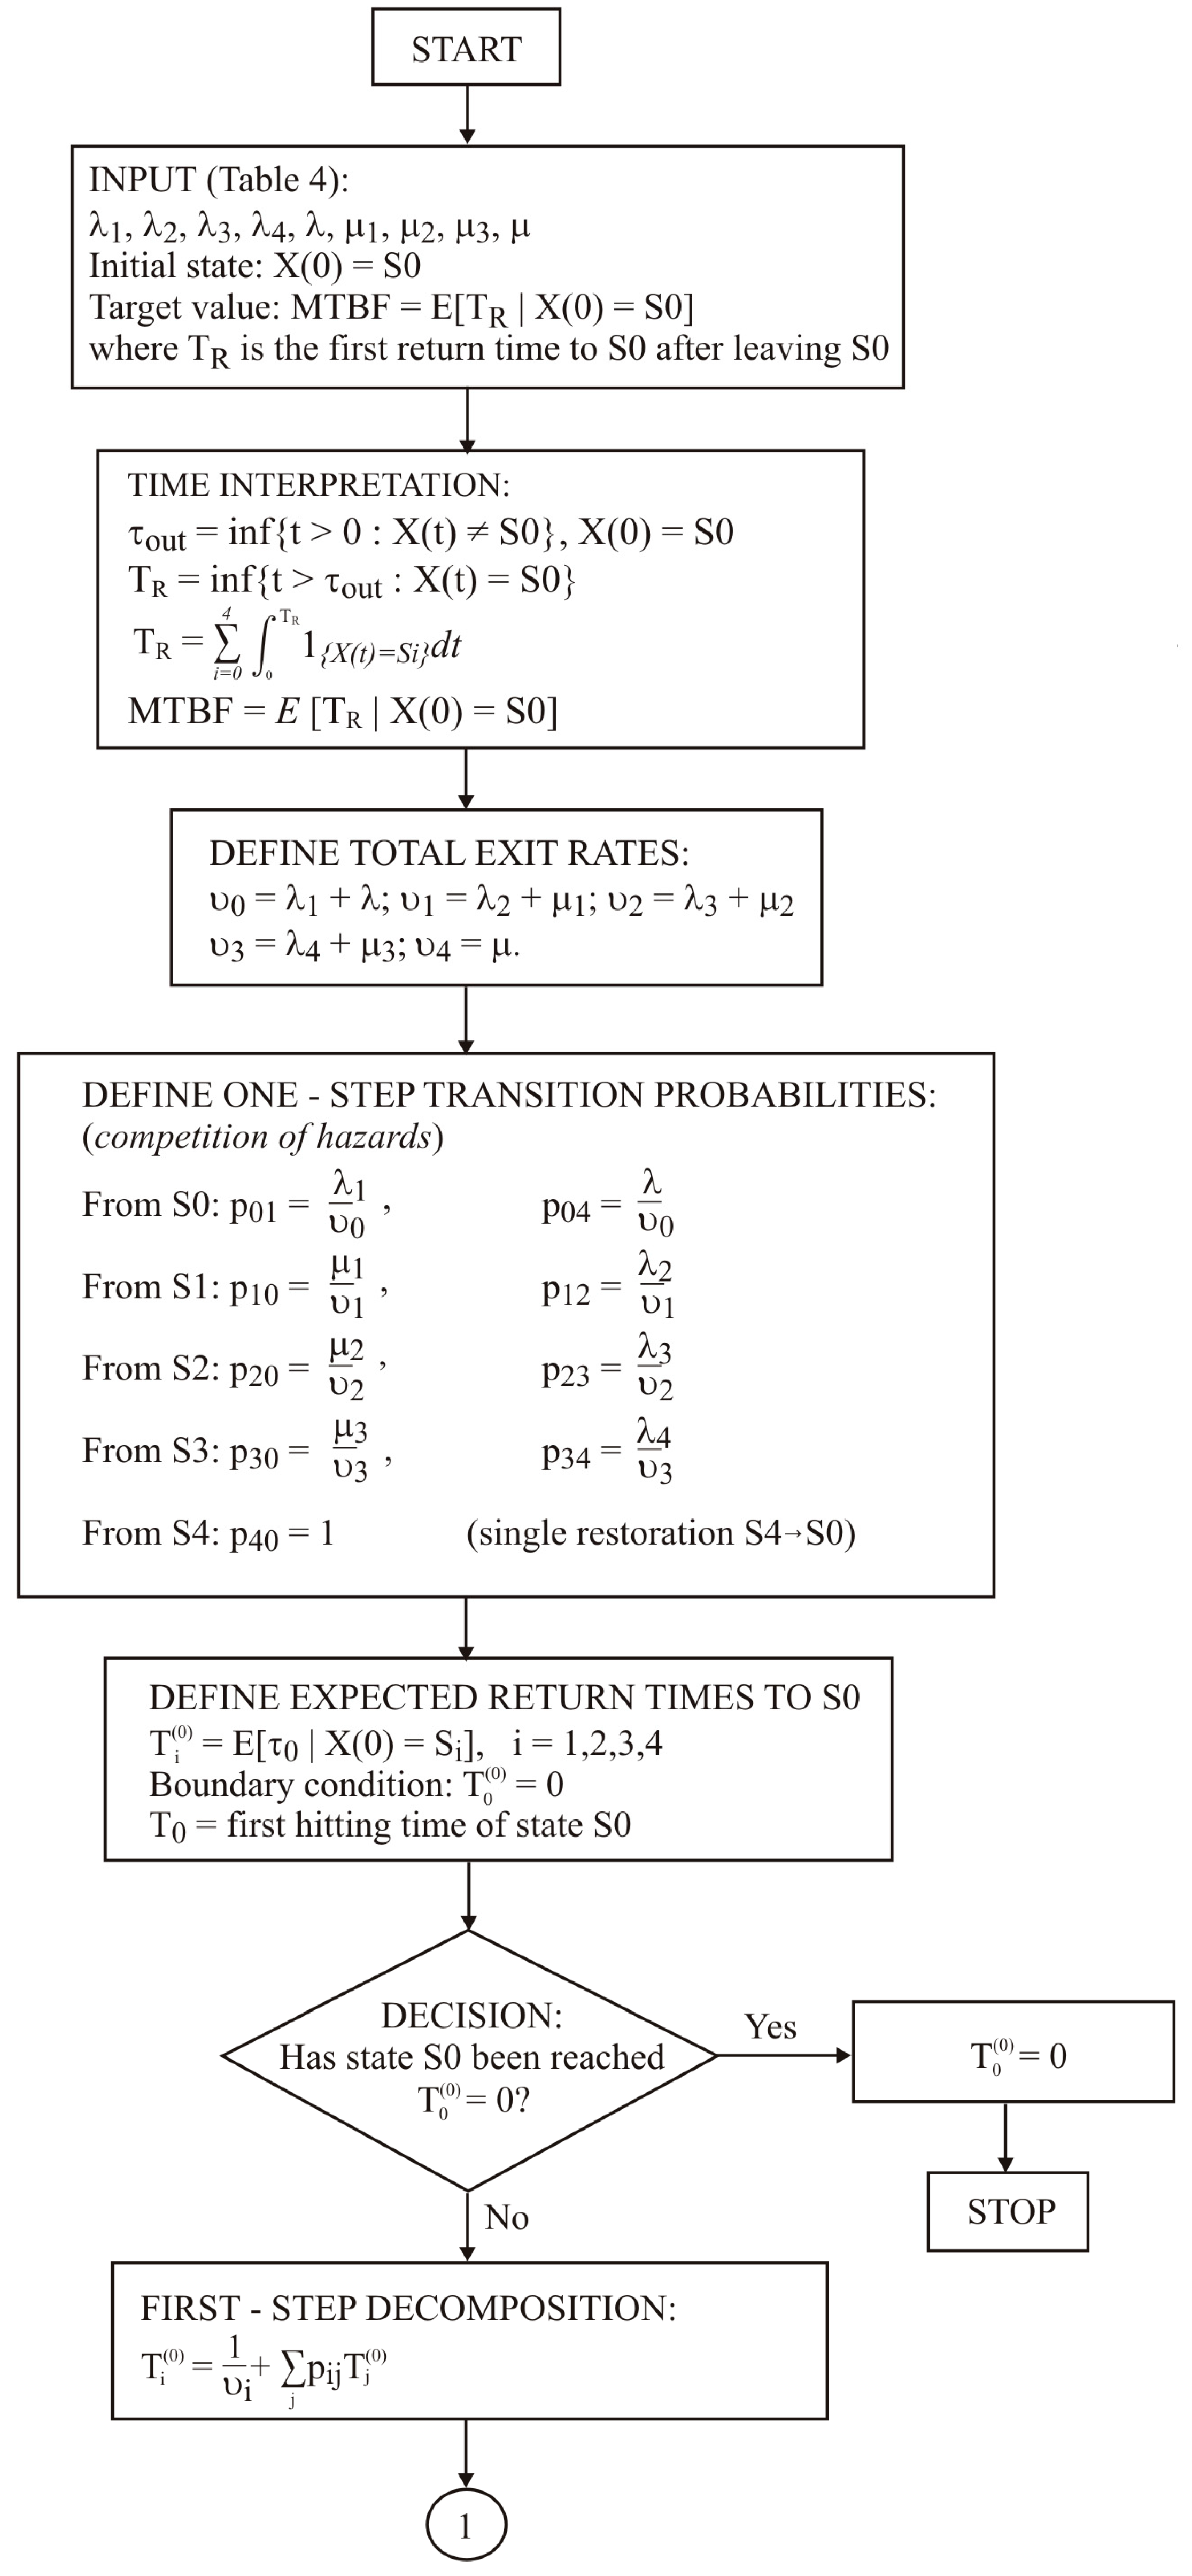
As shown in Figure 7, using the input parameters provided in Table 4, the resulting value reflects not only the occurrence of sudden system-level failures, but also the competition between progressive degradation and restoration in the intermediate states. It therefore shows how effectively maintenance, diagnostics, reconfiguration, and operational intervention delay the complete loss of the charging service.
Figure 7.
Computational algorithm for determining MTTF as the expected time from state S0 to the first attainment of state S4.
Table 4.
Input parameters of the reference five-state EV charging infrastructure scenario.
7.2. MTTR as a Measure of Functional Restoration
Restoration processes have different operational consequences depending on whether the EV charging infrastructure retains the capability to provide the charging service. A return from states S1, S2, or S3 to S0 occurs before complete functional loss, whereas restoration from S4 begins after charging sessions can no longer be provided. These two operating conditions are represented by MTTRtech and MTTRfull.
7.2.1. Conditional MTTRtech Before Reaching State S4
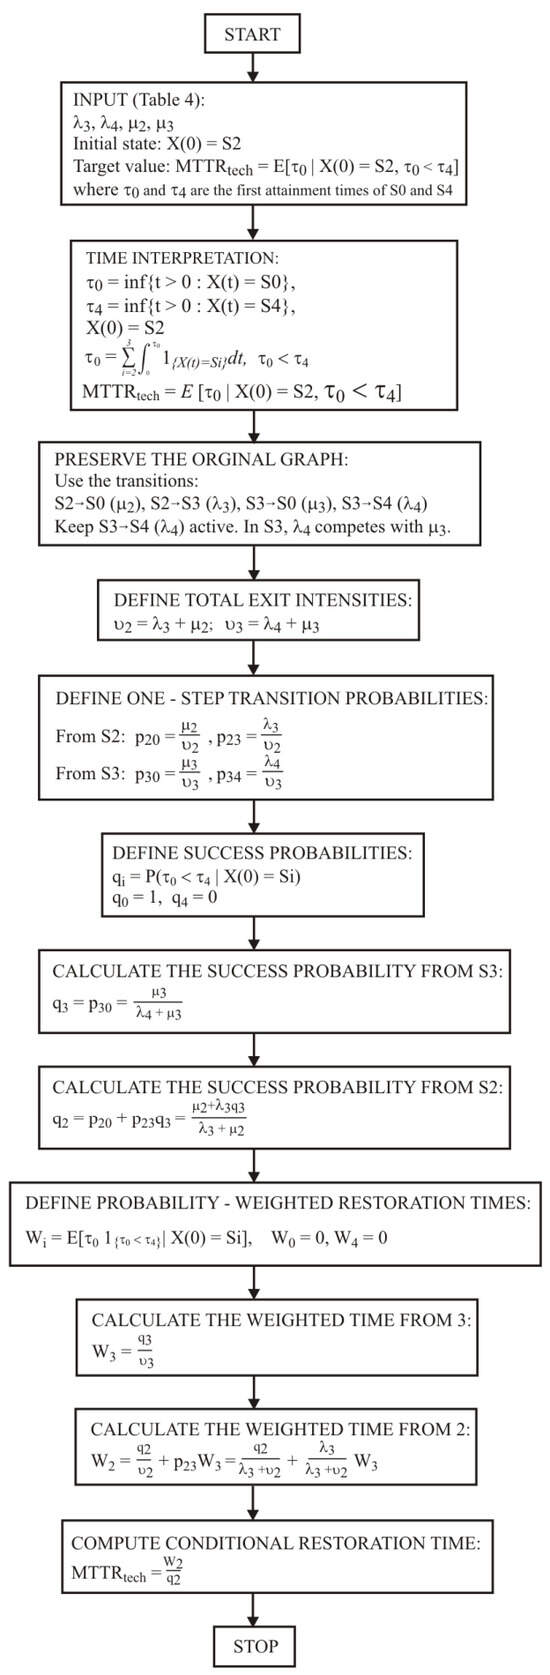
The MTTRtech indicator is defined in this study as the conditional expected time required to restore full functional capability after the infrastructure has reached state S2, provided that S0 is reached before state S4. It therefore represents pre-failure functional restoration rather than conventional repair time following failure. State S2 is adopted as the initial condition because degradation already affects charging availability, charging power, session duration, communication, authorization, or payment functions, but the basic charging service remains available. State S2 is used as the reference starting point because it represents the first state in which degradation has a measurable effect on service availability or quality and maintenance intervention is required. State S1 is not used as the starting point because the required service level is still maintained and the condition primarily requires monitoring rather than corrective intervention. State S3 is not excluded from the restoration process; it is explicitly included as a possible intermediate state when degradation progresses from S2 before restoration is completed. The choice of S2 therefore provides a consistent reference point for evaluating pre-failure restoration while retaining the influence of S3 in the conditional calculation.
The first attainment of full functional capability is described by:
Technical restoration is completed only for trajectories in which S0 is reached before the loss of the basic charging function:
The probability of completing restoration before functional loss, when the infrastructure is initially in state , is denoted by . In state S3, restoration to S0 with intensity competes directly with degradation to S4 with intensity . The probability of successful restoration is therefore:
In state S2, full functionality may be restored directly with intensity , or the infrastructure may deteriorate to S3 with intensity , from which restoration remains possible with probability :
The expected elapsed time associated only with trajectories that successfully reach S0 before S4 is denoted by . For state S3, this quantity is:
For state S2, the elapsed time includes the residence time in S2 and, when further degradation occurs, the corresponding time associated with successful restoration from S3:
The mean technical restoration time is obtained by conditioning the weighted elapsed time on successful restoration:
As shown in Figure 8, the resulting value includes fault detection, diagnosis, operational decision-making, reconfiguration, communication recovery, and technical maintenance performed while at least part of the charging service remains available. State S2 is selected as the reference starting point because it is the first state in which degradation has a measurable effect on service availability or quality and therefore requires maintenance intervention. State S1 is not considered as the starting point because the required service level is still maintained. State S3 is not excluded from the analysis, since it is explicitly included as a possible intermediate state when degradation progresses from S2 before restoration is completed. Together with [symbol/value], it indicates both the expected duration of preventive restoration and the likelihood that intervention will prevent complete functional loss.
Figure 8.
Computational algorithm for determining MTTRtech, conditioned on restoration from S2 to S0 before reaching S4.
7.2.2. MTTRfull After Reaching State S4
The MTTRfull indicator represents the expected time required to restore the EV charging infrastructure after the basic charging function has been lost. The restoration process begins when state S4 is reached and ends when the infrastructure returns to full functional capability S0:
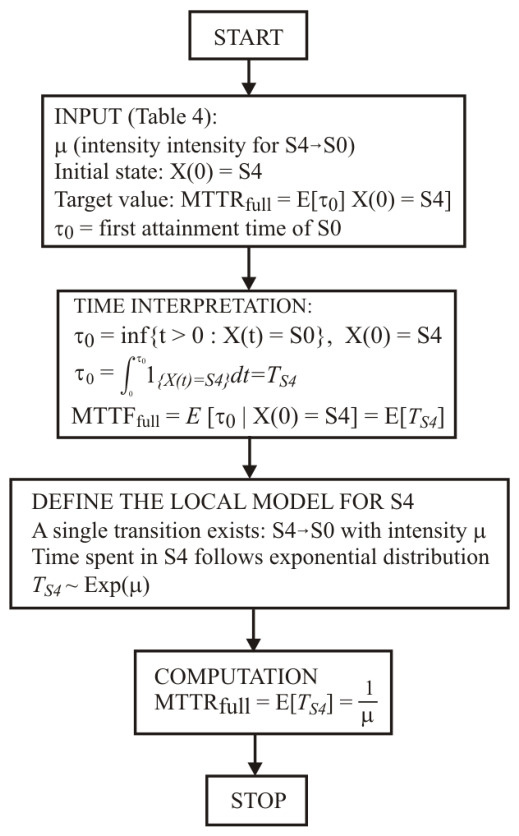
The adopted graph contains a single restoration transition from S4 to S0, described by intensity . The residence time in S4 therefore follows an exponential distribution with expected value:
This value represents the average period during which the required charging service remains unavailable. Depending on the cause of the loss of functionality, this may include the restoration of power, transformer, ESS, EMS, charging modules, communication platform, authorization system, payment infrastructure, or other critical functionality.
As shown in Figure 9, the separation of the two MTTR indicators is important because restoration completed in S2 or S3 may preserve partial charging capability, whereas restoration from S4 takes place after complete interruption of the service. The two measures should not be interpreted as directly equivalent repair times. MTTRtech is a conditional restoration time calculated only for trajectories that return to S0 before reaching S4, while MTTRfull describes restoration after complete functional loss has already occurred. Their comparison therefore reflects the operational difference between successful pre-failure intervention and post-failure recovery rather than two identical repair processes. Similar numerical restoration times may therefore correspond to substantially different consequences for users and the operator.
Figure 9.
Computational algorithm for determining MTTRfull after the EV charging infrastructure reaches state S4.
7.3. MTBF as the Duration of a Complete Functional Cycle and Its Computational Algorithm
MTBF represents the expected duration of a complete functional cycle that begins in state S0, includes departure from full functional capability, and ends with the first subsequent return to S0. This definition differs from the conventional reliability-engineering interpretation of MTBF as the mean time between consecutive failures. In the present study, MTBF is deliberately reinterpreted as a functional-cycle measure and may therefore describe a cycle completed by restoration from an intermediate degraded state without reaching S4. It should consequently not be interpreted as the mean time between consecutive occurrences of functional failure. The rationale for this reinterpretation follows from the multi-state character of the proposed framework. Unlike a binary reliability model, in which the operating cycle is naturally associated with failure and subsequent repair, the five-state model allows the infrastructure to leave S0, pass through one or more degraded states, and return to S0 without reaching S4. These degradation–restoration cycles are operationally relevant but are not captured by the conventional failure-to-failure interpretation of MTBF. Therefore, the return to S0 is treated here as the renewal event defining a complete functional cycle. For the same reason, the conventional relation MTBF = MTTF + MTTR is not applicable to the reinterpreted indicator used in this study, because MTTF, MTTR, and MTBF are defined by different terminating events. The cycle may contain only minor degradation and rapid restoration, progressive deterioration through several intermediate states, or an episode of complete functional loss in S4.
The expected time required to reach S0 from state is denoted by . The quantities , , and describe restoration from successive levels of functional degradation, whereas describes restoration after complete loss of the charging function.
In state S4, the only admissible transition leads directly to S0 with intensity :
In state S3, the infrastructure remains in the pre-failure condition for an expected time . It may then return directly to S0 or deteriorate to S4. Only the second trajectory requires the addition of the restoration time from S4:
In state S2, direct restoration to S0 competes with further degradation to S3. The expected return time is therefore:
In state S1, the infrastructure may return directly to full functional capability or deteriorate to S2:
The departure from state S0 occurs either through progressive degradation to S1 with intensity or through sudden functional loss with intensity . The expected residence time in S0 before either event is:
After leaving S0, the remaining part of the cycle depends on the state reached:
These relationships are included because the duration of a functional cycle depends on the actual trajectory of the EV charging infrastructure rather than solely on the occurrence of complete failure. They account for early restoration from intermediate states, progressive degradation, sudden service loss, and full recovery after S4.
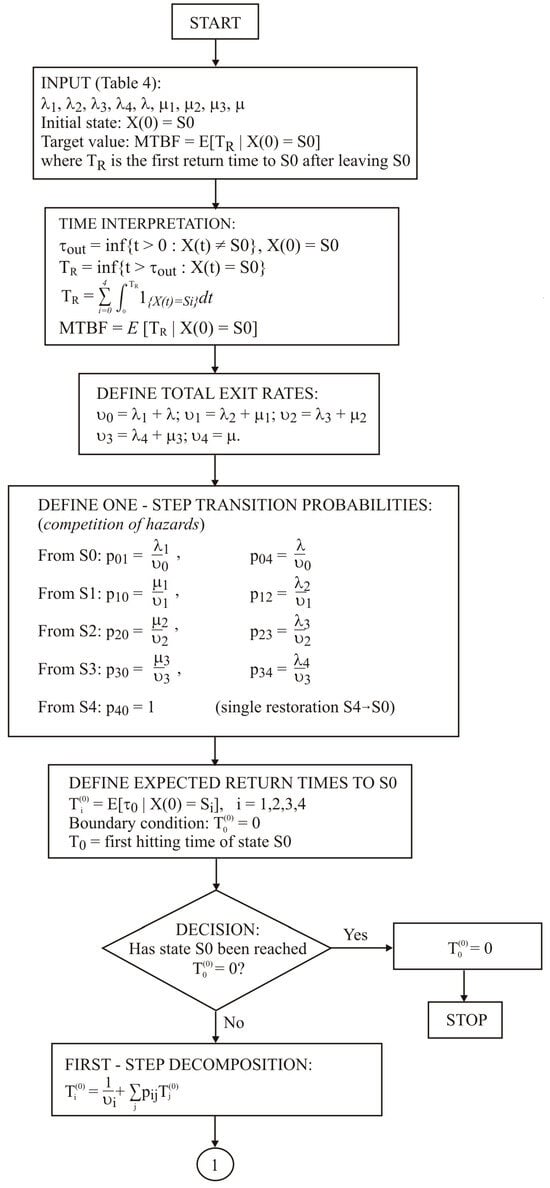
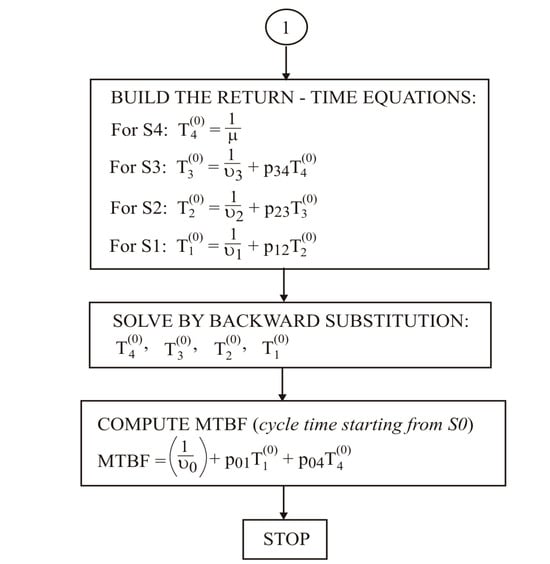
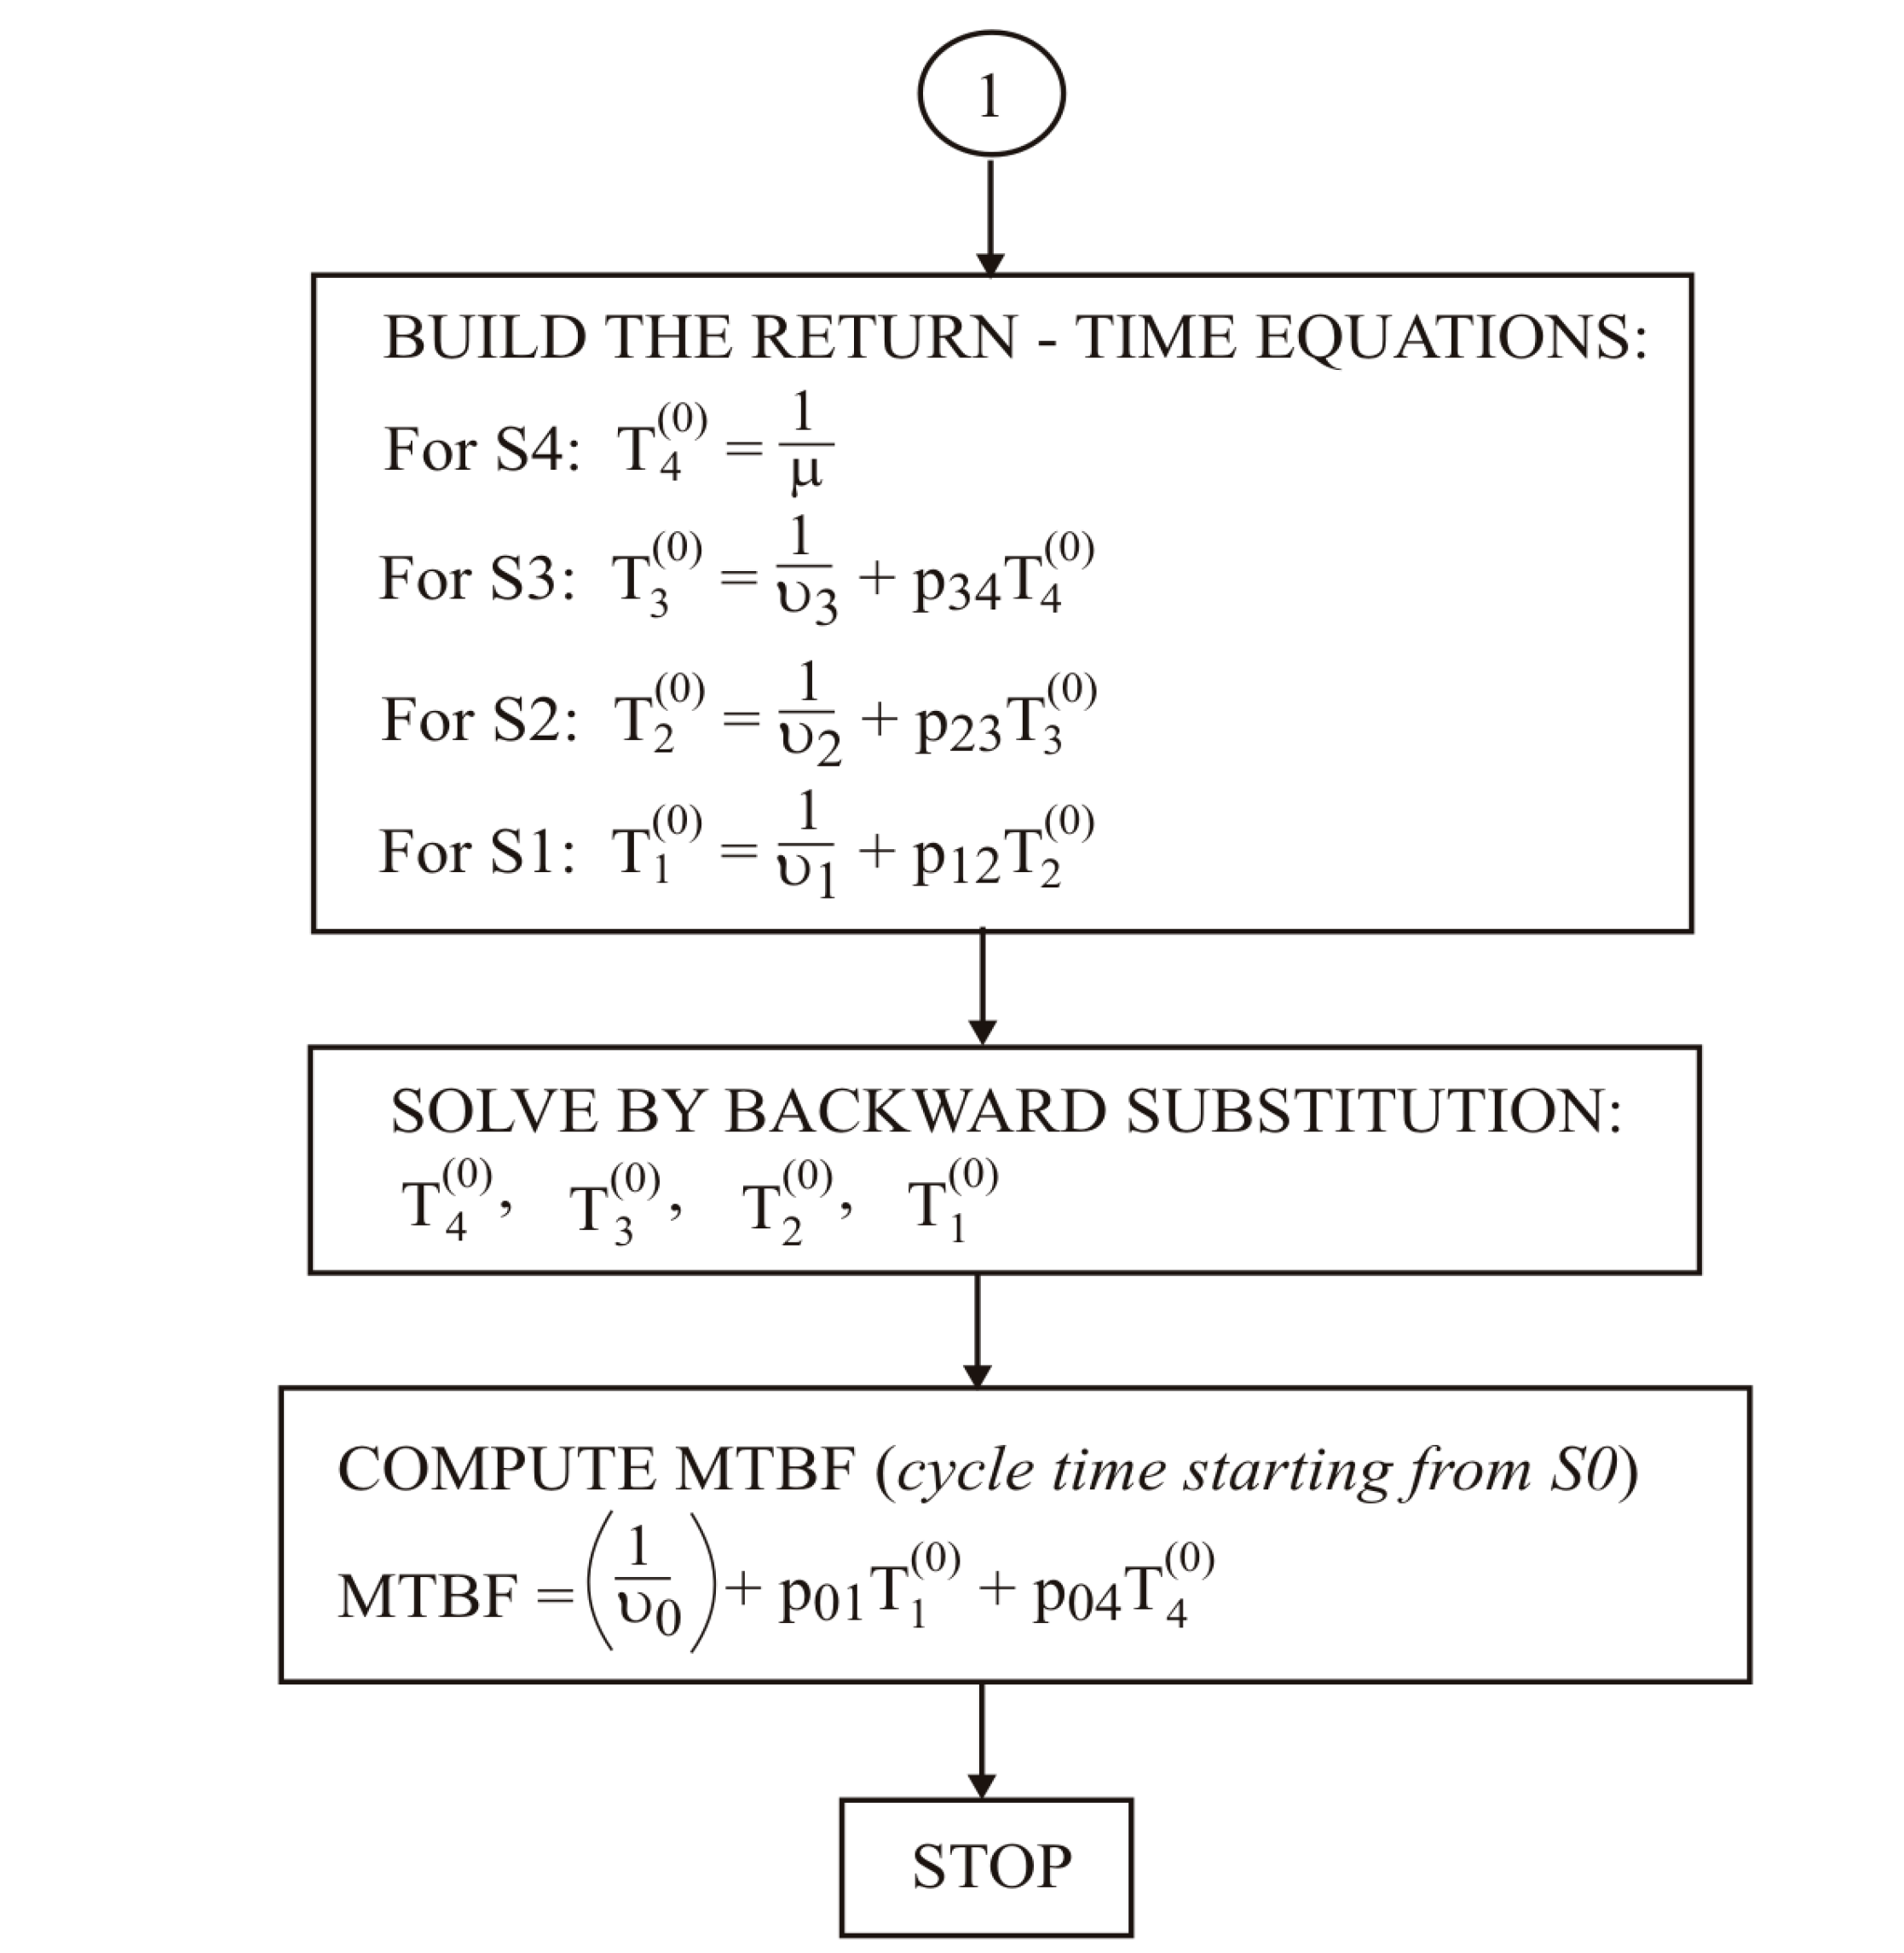
As shown in Figure 10, the resulting MTBF value provides an aggregate measure of cycle duration, while the individual quantities , together with MTTF, MTTRtech and MTTRfull, show how maintenance effectiveness and degradation pathways influence service continuity. This distinction is necessary because two infrastructures may have similar MTBF values while differing substantially in the frequency of partial degradation, the probability of reaching S4, and the duration of complete service unavailability.
Figure 10.
Computational algorithm for determining MTBF as the expected duration of a complete functional cycle beginning and ending in state S0.
8. Input Data and Computational Assumptions
The analysis requires transition intensities for all degradation and restoration paths included in the five-state graph. When chronological operational records are available, the intensity of a transition from state to state can be estimated as:
where —denotes the number of observed transitions from to , and is the total time spent in the initial state . Operational records may include charging-session outcomes, power limitations, communication disturbances, diagnostic alarms, failures, and maintenance interventions.
For application to operational records, chronologically ordered observations should first be assigned to states S0–S4 according to the classification criteria defined in Section 3. The resulting state sequence provides the numbers of observed transitions and cumulative residence times required by Equation (32). The reliability of the estimated transition intensities depends on both the number of observed transitions and the total observation time in the corresponding initial state. Short observation windows may provide insufficient information, particularly for rare transitions, whereas excessively long windows may combine different operating regimes and violate the assumption of approximately constant transition intensities. The observation period should therefore be selected so that it provides sufficient transition information while remaining representative of a reasonably stable operating regime.
In the present study, empirical operational records were not used. Instead, a reference set of transition intensities was adopted to demonstrate the computational behaviour of the proposed five-state framework under a consistent operating scenario. The resulting numerical values should therefore be interpreted as reference results rather than as reliability estimates for a specific EV charging installation. The same computational procedure can subsequently be applied to operational data using transition intensities estimated according to Equation (32).
In the adopted scenario, the risk of further degradation increases as the system moves toward S4. At the same time, restoration becomes slower for more severe functional states. The direct transition from S0 to S4 represents a rare sudden event leading to the loss of the basic charging function. These assumptions apply only to the analysed scenario.
All transition intensities are expressed in and are assumed to remain constant within the analysed operating regime. This corresponds to a time-homogeneous continuous-time Markov process with exponentially distributed residence times. Because empirical residence-time distributions were not available in the present study, the memoryless property could not be directly verified. The assumption of exponentially distributed residence times should therefore be regarded as a modelling approximation resulting from the adopted continuous-time Markov process. If the actual residence times exhibit ageing, duration dependence, or other non-exponential behaviour, the calculated stationary probabilities and first-passage measures may differ from those obtained under the present assumptions. In such cases, a semi-Markov model would provide a more appropriate representation.
The adopted data enable the determination of , , , , and , which describe the expected distribution of the functional states. The same parameters are used to calculate the time to the first loss of the basic charging function, the duration of restoration before and after reaching S4, and the mean duration of a complete functional cycle. The results therefore show how degradation intensity and restoration effectiveness influence the continuity of the charging service.
9. Results and Interpretation
Using the transition intensities listed in Table 4 and the stationary and first-attainment calculations defined for the adopted five-state graph, the probabilities of states S0–S4 and the reinterpreted reliability indicators were determined. The stationary probabilities describe the expected long-term proportion of time spent in each functional state. To provide an operational interpretation of these values, they were also converted into equivalent residence times for an annual operating period of 8760 h. The first-attainment analysis was conducted separately to determine the probability that the EV charging infrastructure reaches state S4 within a specified operating horizon.
9.1. Stationary Probabilities and Annual Residence Times
The calculated stationary distribution is presented in Table 5.
Table 5.
Stationary probabilities and equivalent annual residence times for the reference operating scenario.
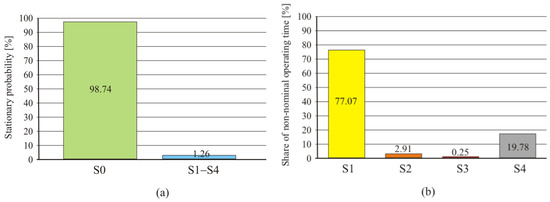
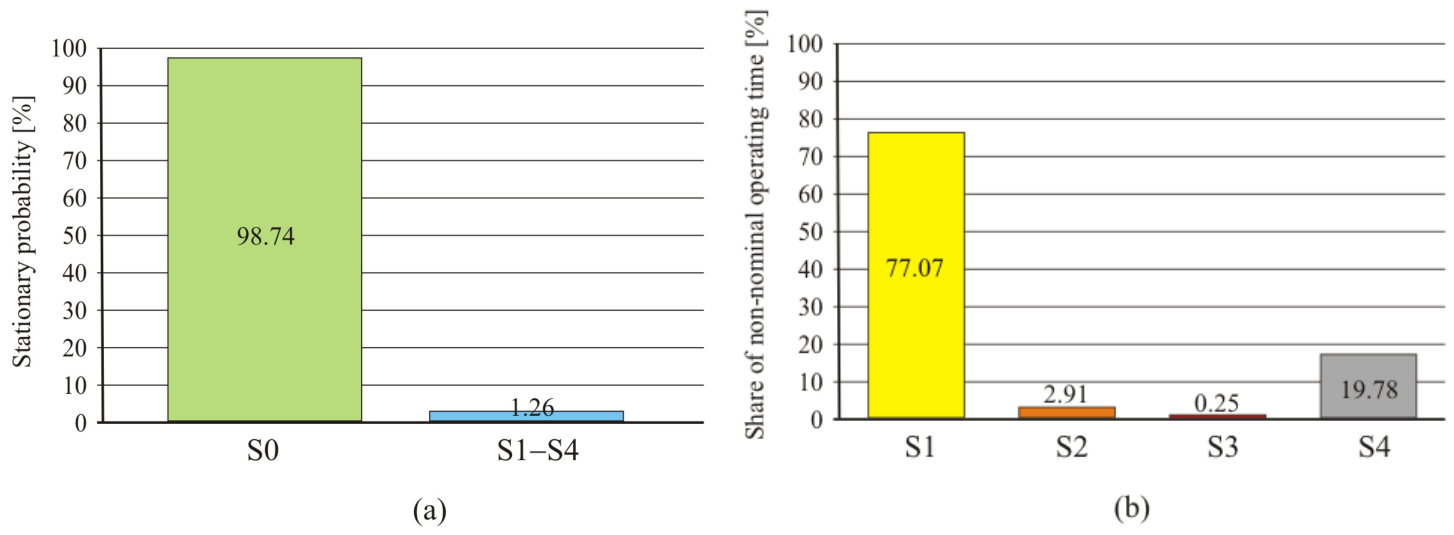
The EV charging infrastructure remains in state S0 for approximately 98.74% of the operating time. The combined probability of states S1–S4 is 1.2562%, which corresponds to approximately 110.04 h of non-nominal operation per year.
A direct comparison of all five probabilities on a single linear scale would conceal the differences between the degraded states because of the dominant value of S0. For this reason, Figure 11 separates nominal operation from the internal structure of non-nominal operation.
Figure 11.
Stationary distribution of the functional states: (a) proportions of nominal and non-nominal operation; (b) distribution of non-nominal operating time among states S1–S4.
State S1 accounts for approximately 77.07% of the total time spent outside S0. This indicates that most departures from full functional capability take the form of minor degradation without a significant impact on users. State S4 accounts for 19.78% of non-nominal operating time, whereas the combined contribution of S2 and S3 is only approximately 3.16%.
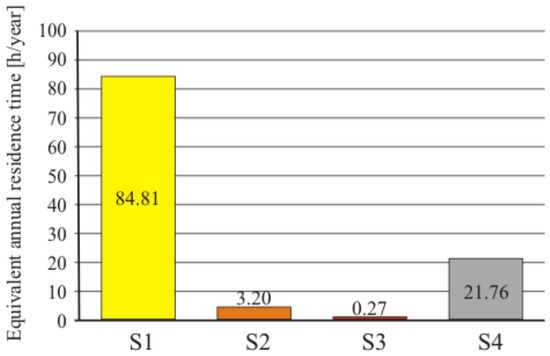
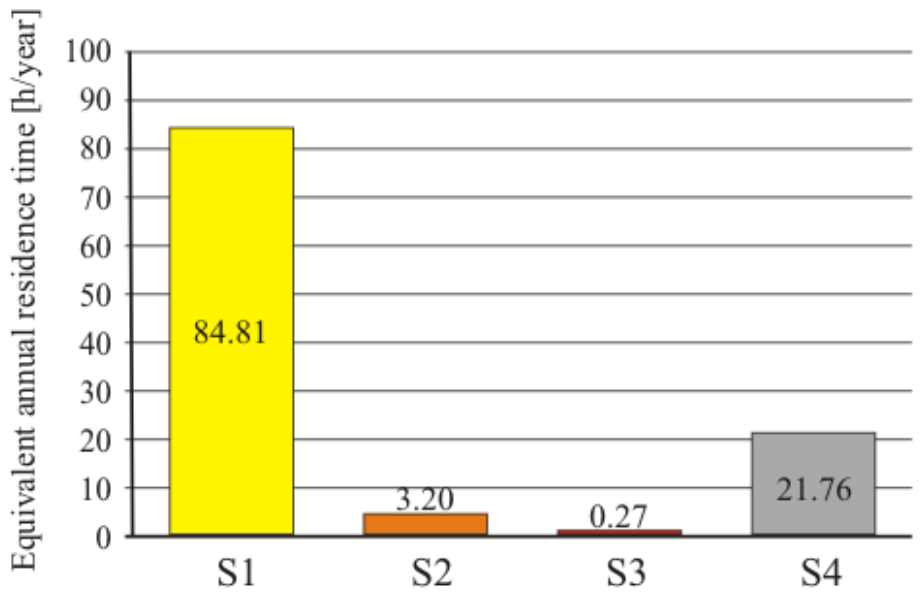
As shown in Figure 12, the annual residence times provide a more direct interpretation of the calculated probabilities. The infrastructure operates for approximately 88.28 h per year in states S1–S3, in which the charging service remains available with different levels of degradation. The equivalent residence time in S4 is 21.76 h per year and represents the period during which the basic charging function cannot be provided.
Figure 12.
Equivalent annual residence times in states S1–S4 for an operating period of 8760 h.
The results show that the small numerical probability of S4 should not be interpreted as an operationally negligible result. A probability of 0.2484% corresponds to almost 22 h of functional unavailability per year. At the same time, the very short residence time in S3 indicates that, under the adopted parameters, the infrastructure either returns to S0 relatively quickly or reaches S4 without remaining in the pre-failure condition for a long period.
9.2. Probability of the First Attainment of State S4
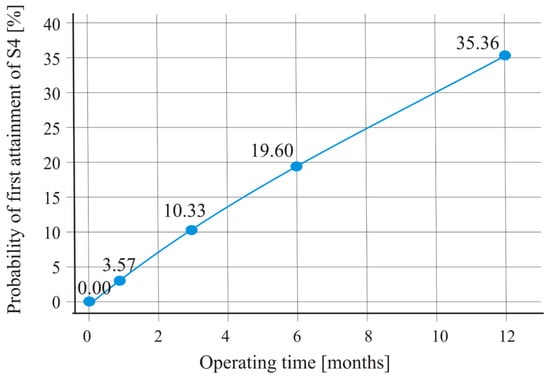
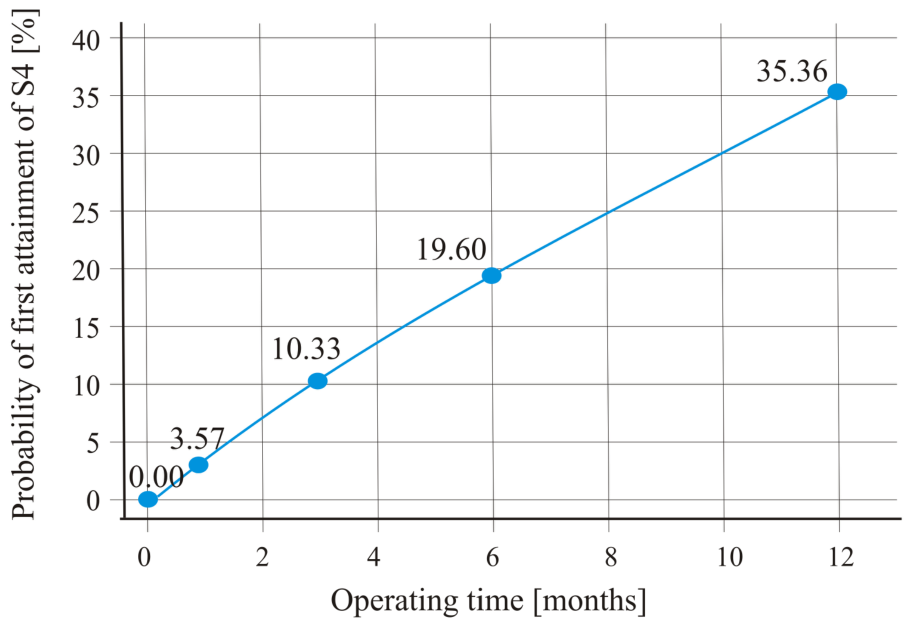
As shown in Figure 13, the stationary probability P4 describes the proportion of time spent in S4, but it does not determine the probability that this state will occur at least once during a specified period. Therefore, the first attainment of S4 was analysed for an infrastructure initially operating in S0.
Figure 13.
Cumulative probability of the first attainment of state S4 for the infrastructure initially operating in state S0.
The calculated probabilities for selected operating horizons are presented in Table 6.
Table 6.
Probability of the first attainment of state S4 within the selected operating horizon.
The probability of reaching S4 increases continuously with operating time and reaches approximately 35.36% after one year. This result provides a substantially different interpretation from the stationary value P4 = 0.2484%. The probability of finding the infrastructure in S4 at an arbitrarily selected moment is low because the mean restoration time from this state is limited. Nevertheless, the probability that the loss of the basic charging function occurs at least once during one year is no longer negligible.
The difference between the stationary probability and the first-attainment probability demonstrates that the duration and occurrence of functional loss describe two distinct aspects of reliability. The stationary probability quantifies the proportion of time affected by functional failure, whereas the first-attainment probability quantifies the risk that such an event will appear within the analysed operating horizon.
9.3. Annual Transition Activity and Pathways to Functional Loss
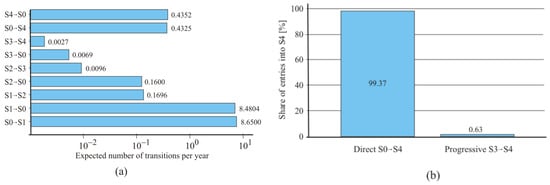
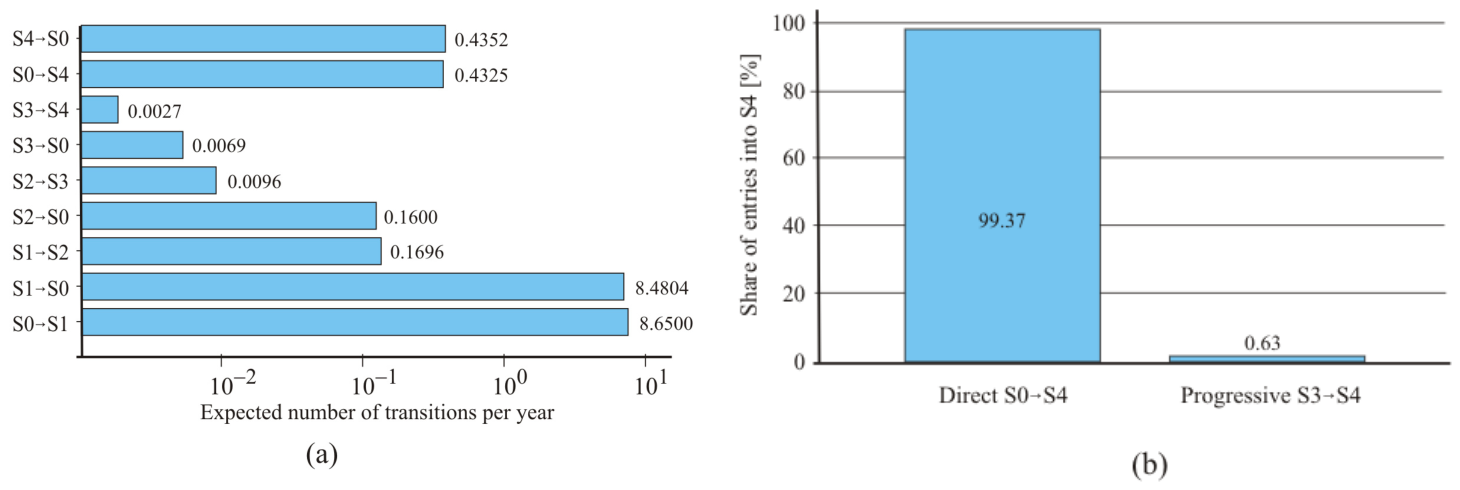
The stationary probabilities and transition intensities were also used to determine the expected annual numbers of individual state transitions, as illustrated in Figure 14. The results describe the activity of the graph during 8760 h of operation and identify the dominant degradation and restoration paths.
Figure 14.
Expected annual transition activity: (a) expected numbers of degradation and restoration transitions; (b) proportions of direct and progressive transitions leading to state S4.
The most frequent transition is S0 → S1, with an expected value of approximately 8.65 transitions per year. It is closely balanced by approximately 8.48 returns from S1 to S0. Only about 0.17 transitions per year continue from S1 to S2, which confirms that most minor degradation processes are reversed before they significantly affect the charging service.
The expected number of transitions from S2 to S3 is approximately 0.0096 per year, while the transition from S3 to S4 occurs approximately 0.0027 times per year. In contrast, the direct transition S0 → S4 occurs approximately 0.4325 times per year.
Consequently, approximately 99.37% of entries into S4 result from the direct transition S0 → S4, whereas only 0.63% result from progressive degradation through S3 → S4. Under the adopted scenario, the loss of the basic charging function is therefore associated primarily with sudden system-level events rather than with the uninterrupted progression through all intermediate degradation states.
This result does not reduce the importance of S1–S3. These states describe the majority of non-nominal operating periods and enable the effectiveness of early restoration to be evaluated. Their low probabilities result from the relationship between degradation and restoration intensities adopted in the reference scenario.
9.4. Reinterpreted Reliability Indicators
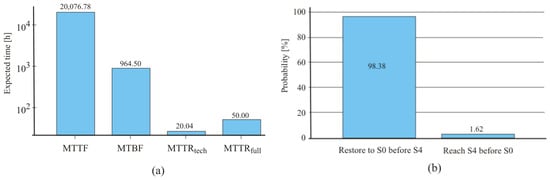
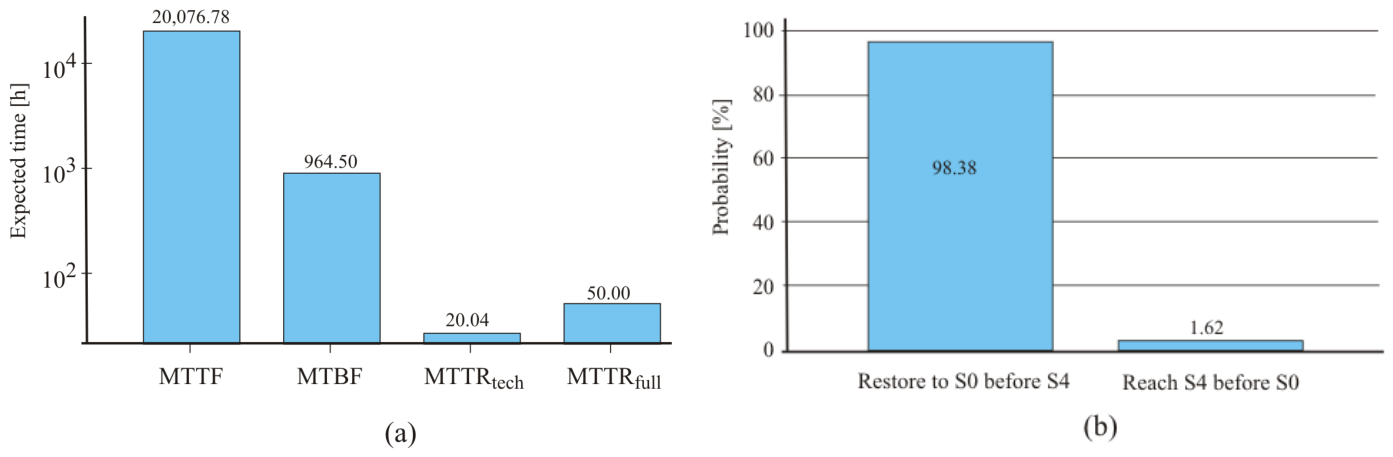
The calculated values of the reinterpreted reliability indicators are summarized in Table 7 and illustrated in Figure 15.
Table 7.
Values of the reinterpreted reliability indicators.
Figure 15.
Reinterpreted reliability results: (a) comparison of MTTF, MTBF, MTTRtech, and MTTRfull; (b) probability of restoring full functional capability from S2 before reaching S4.
The MTTF value indicates that the expected time from S0 to the first attainment of S4 is approximately 20,076.78 h. This period includes degradation trajectories that return to S0 before functional loss. The infrastructure may therefore undergo numerous minor degradation and restoration cycles before reaching S4 for the first time.
The MTBF value is approximately 964.50 h, corresponding to about 40.19 days. In the adopted interpretation, this value describes the duration of a complete functional cycle from S0 to the next return to S0 after leaving it. It does not represent the time between consecutive occurrences of S4. This distinction from the conventional definition of MTBF is intentional and follows directly from the functional-cycle interpretation adopted in this study. The ratio between MTTF and MTBF is approximately 20.82, showing that many functional cycles may be completed before the first loss of the basic charging function. The relation MTBF < MTTF therefore results directly from the different terminating events of the two measures. A functional cycle ends at the first return to S0 after leaving full functionality, whereas MTTF continues across successive degradation–restoration cycles until S4 is reached for the first time. Under the adopted transition intensities, most departures from S0 are followed by restoration from intermediate states rather than by progression to S4, which explains the substantially shorter MTBF.
The expected technical restoration time from S2, conditioned on returning to S0 before reaching S4, is approximately 20.04 h. The probability of completing such restoration successfully is 98.38%. Thus, only approximately 1.62% of trajectories starting in S2 reach S4 before full functional capability is restored.
The full restoration time after reaching S4 is 50 h and is approximately 2.49 times longer than MTTRtech. This difference confirms the operational benefit of intervention before the loss of the basic charging function. Restoration initiated in S2 is not only highly likely to prevent transition to S4, but also requires considerably less time than full restoration after functional failure.
Taken together, the results show that the five-state model distinguishes three aspects that cannot be represented by a single binary reliability measure. These are the duration of degraded but service-capable operation, the probability of preventing functional loss through early restoration, and the occurrence and duration of complete charging-service unavailability.
10. Discussion
The obtained results show that the five-state classification provides information that cannot be obtained from a binary operational–failed representation. Although the EV charging infrastructure remains in S0 for most of the analysed operating time, the model distinguishes periods of minor degradation, service-affecting degradation, a pre-failure condition, and complete functional loss. The conversion of stationary state probabilities into annual residence times additionally illustrates the practical significance of probabilities that appear numerically small. In particular, the probability assigned to S4 corresponds to almost 22 h per year without the basic charging function.
The results also demonstrate that MTTF, MTBF, MTTRtech, and MTTRfull describe different aspects of infrastructure operation. The reinterpreted MTBF used in this study represents the duration of a complete functional cycle that may end with restoration from an intermediate degraded state and therefore differs from the conventional time between consecutive failures, whereas MTTF refers to the first attainment of S4. The distinction between the two MTTR measures separates restoration performed before complete functional loss from restoration initiated after the charging service has already been lost. In the reference scenario, restoration initiated before reaching S4 is shorter and has a high probability of preventing complete functional loss. The proposed indicators therefore provide complementary information on service continuity, degradation trajectories, and restoration effectiveness.
The analysis addresses the principal problem formulated in the study by showing how a five-state transition graph and the associated transition intensities can be used to determine state probabilities and reinterpret classical reliability indicators from the perspective of actual charging-service capability. A low stationary probability of S4 does not imply that functional loss is operationally negligible, and the calculated reliability indicators should not be interpreted independently of the state trajectories from which they arise. The five-state representation is particularly useful in this respect because the infrastructure may undergo several degradation–restoration cycles before S4 is reached for the first time. It therefore captures operational behaviour that would remain hidden in a purely binary representation of the system.
The principal limitation of the present analysis is the use of a reference parameter set rather than transition intensities estimated from chronological records of a specific EV charging operator. Consequently, the numerical results should be interpreted as a demonstration of the proposed computational framework rather than as a reliability assessment of a particular installation. The model also assumes constant transition intensities and exponentially distributed residence times. Because empirical residence-time data were not available, the memoryless assumption could not be directly validated, and deviations from exponential residence-time distributions may affect stationary probabilities and first-passage measures. Furthermore, the climatic and operating factors discussed in Section 2.3 are not introduced as explicit time-varying variables. Their influence can only be represented indirectly through transition intensities corresponding to a given operating regime. The present formulation therefore does not explicitly resolve seasonal variability, daily charging-demand peaks, temperature-dependent effects, ageing, or differences between individual hub configurations.
Future research should extend the framework toward non-stationary operating conditions using non-homogeneous Markov processes in which transition intensities depend on time or measurable operating variables, such as ambient temperature, charging demand, time of day, or season. Semi-Markov formulations should also be considered when transition behaviour depends on the time already spent in a given state and the exponential residence-time assumption is no longer appropriate. These developments should be accompanied by calibration using chronological operational records, installation-specific determination of the S0–S4 state boundaries, and comparative analysis of different EV charging infrastructures.
11. Conclusions
The proposed five-state model provides a coherent framework for assessing EV charging infrastructure from the perspective of actual charging-service capability rather than binary component availability. By combining functional classification, the transition graph, the Markov model, and the reinterpreted reliability indicators, it distinguishes progressive degradation, restoration before functional loss, and full recovery after reaching S4. The method is reproducible and can be applied to operator data by replacing the reference transition intensities with values estimated from operational records. Further work should focus on validation using real chronological data and installation-specific calibration of the state boundaries and transition parameters.
Author Contributions
Conceptualization, M.W., and S.D.; methodology, M.W., S.D., and J.P.; software, D.B.; validation, M.W., S.D., and B.K.; formal analysis, J.P.; investigation, B.K.; resources, S.D., D.B.; data curation, S.D., J.P., and B.K.; writing—original draft preparation, B.K.; writing—review and editing, M.W., J.P., and D.B.; visualization, M.W., and B.K.; supervision, D.B., and J.P.; project administration, M.W., and D.B.; funding acquisition, M.W. All authors have read and agreed to the published version of the manuscript.
Funding
This research received no external funding.
Data Availability Statement
The original contributions presented in this study are included in the article. Further inquiries can be directed to the corresponding author.
Acknowledgments
Conflicts of Interest
The authors declare no conflicts of interest.
Abbreviations
| Acronym | Full term |
| AC | Alternating Current |
| BMS | Battery Management System |
| DC | Direct Current |
| EMS | Energy Management System |
| ESS | Energy Storage System |
| EV | Electric Vehicle |
| LTE | Long-Term Evolution |
| MTBF | Mean Time Between Failures, reinterpreted in this study as the mean duration of a complete functional cycle |
| MTTF | Mean Time to Failure |
| MTTR | Mean Time to Repair, interpreted in this study as mean functional restoration time |
| MTTRtech | Conditional mean technical restoration time before reaching state S4 |
| MTTRfull | Mean time of full restoration after reaching state S4 |
| OCPP | Open Charge Point Protocol |
| PV | Photovoltaic |
| RFID | Radio-Frequency Identification |
| Symbol | Meaning |
| S0 | State of full functional capability |
| S1 | State of minor functional degradation without significant impact on users |
| S2 | State of significant functional degradation affecting service availability or quality |
| S3 | Pre-failure state with threatened service continuity |
| S4 | State of loss of the basic charging function |
| Si | Arbitrary functional state of the five-state model |
| Dk | k-th source of functional degradation |
| X(t) | Functional state of the EV charging hub at time t |
| R0(t) | Probability of being in state S0 at time t |
| P1(t) | Probability of being in state S1 at time t |
| P2(t) | Probability of being in state S2 at time t |
| P3(t) | Probability of being in state S3 at time t |
| P4(t) | Probability of being in state S4 at time t |
| R0 | Stationary probability of state S0 |
| P1–P4 | Stationary probabilities of states S1–S4 |
| λ1 | Transition intensity from S0 to S1 |
| λ2 | Transition intensity from S1 to S2 |
| λ3 | Transition intensity from S2 to S3 |
| λ4 | Transition intensity from S3 to S4 |
| λ | Intensity of the direct transition from S0 to S4 |
| μ1 | Restoration intensity from S1 to S0 |
| μ2 | Restoration intensity from S2 to S0 |
| μ3 | Restoration intensity from S3 to S0 |
| μ | Full restoration intensity from S4 to S0 |
| Q | Infinitesimal generator matrix of the continuous-time Markov process |
| νi | Total exit intensity from state Si |
| pij | Probability that the next transition occurs from Si to Sj |
| τ0 | First attainment time of state S0 |
| τ4 | First attainment time of state S4 |
| Ti(4) | Expected time to first attain S4 when the process starts in Si |
| Ti(0) | Expected time to first attain S0 when the process starts in Si |
| qi | Probability of reaching S0 before S4 when starting in Si |
| Wi | Expected restoration time weighted by the event of reaching S0 before S4 |
| Nij | Number of observed transitions from Si to Sj |
| Hi | Total observed residence time in state Si |
| θij | Estimated transition intensity from Si to Sj |
| t | Operating time |
References
- Pham, H.; Ram, M. Safety and Reliability Modeling and Its Applications; Elsevier: Cambridge, MA, USA, 2021; pp. 43–90. [Google Scholar]
- Sheu, S.H.; Chang, C.C.; Chen, Y.L.; Zhang, Z.G. Optimal preventive maintenance and repair policies for multi-state systems. Reliab. Eng. Syst. Saf. 2015, 140, 78–87. [Google Scholar] [CrossRef] [Scilit]
- Jia, C.; Liu, W.; Chau, K.T.; He, H.; Zhou, J.; Niu, S. Passenger-aware reinforcement learning for efficient and robust energy management of fuel cell buses. eTransportation 2026, 27, 100537. [Google Scholar] [CrossRef] [Scilit]
- Qin, J.; Li, Z. Reliability Modeling for Multistate System with Preventive Maintenance under Customer Demand. Complexity 2020, 2020, 3165230. [Google Scholar] [CrossRef] [Scilit]
- Duer, S.; Woźniak, M.; Budniak, Z.; Zajkowski, K.; Bernatowicz, D.; Ostrowski, A.; Paś, J. Reliability Testing of Wind Farm Devices Based on the Mean-Time Between Failures (MTBF). Energies 2023, 16, 1659. [Google Scholar] [CrossRef] [Scilit]
- Guo, C.; Liang, Z. A Predictive Markov Decision Process for Optimizing Inspection and Maintenance Strategies of Partially Observable Multi-State Systems. Reliab. Eng. Syst. Saf. 2022, 226, 108683. [Google Scholar] [CrossRef] [Scilit]
- Rahimi, T.; Jahan, H.K.; Blaabjerg, B.; Bahman, A.S.; Hosseini, S.H. Fuzzy-Logic-Based Mean Time to Failure (MTTF) Analysis of Interleaved DC–DC Converters Equipped with Redundant-Switch Configuration. Appl. Sci. 2019, 9, 88. [Google Scholar] [CrossRef] [Scilit]
- Pokoradi, L. Logical Tree of Mathematical Modeling. Theory Appl. Math. Comput. Sci. 2015, 5, 20–28. [Google Scholar]
- Zonta, T.; da Costa, C.A.; da Rosa Righi, R.; de Lima, M.J.; da Trindade, E.S.; Li, G.P. Predictive maintenance in the Industry 4.0: A systematic literature review. Comput. Ind. Eng. 2020, 150, 106889. [Google Scholar] [CrossRef] [Scilit]
- Mastoi, M.S.; Zhuang, S.; Munir, H.M.; Haris, M.; Hassan, M.; Usman, M.; Bukhari, S.S.H.; Ro, J.-S. An In-Depth Analysis of Electric Vehicle Charging Station Infrastructure, Policy Implications, and Future Trends. Energy Rep. 2022, 8, 11504–11529. [Google Scholar] [CrossRef] [Scilit]
- Savari, G.F.; Mohamed Ali, M.J.S.; Raman, L.A.; El-Shahat, A.; Hasanien, H.M.; Almakhles, D.; Abdel Aleem, S.H.E.; Omar, A.I. Assessment of Charging Technologies, Infrastructure and Charging Station Recommendation Schemes of Electric Vehicles: A Review. Ain Shams Eng. J. 2023, 14, 101938. [Google Scholar] [CrossRef] [Scilit]
- Sudev, V.; Sindhu, M.R. State-of-the-Art and Future Trends in Electric Vehicle Charging Infrastructure: A Review. Eng. Sci. Technol. Int. J. 2025, 62, 101946. [Google Scholar] [CrossRef] [Scilit]
- Liu, Y.; Francis, A.; Hollauer, C.; Lawson, M.C.; Shaikh, O.; Cotsman, A.; Bhardwaj, K.; Banboukian, A.; Li, M.; Webb, A.; et al. Reliability of Electric Vehicle Charging Infrastructure: A Cross-Lingual Deep Learning Approach. Commun. Transp. Res. 2023, 3, 100095. [Google Scholar] [CrossRef] [Scilit]
- Konara, K.M.S.Y.; Kolhe, M.L.; Ulltveit-Moe, N.; Balapuwaduge, I.A.M. Reliability Enhancement of Fast Charging Station under Electric Vehicle Supply Equipment Failures and Repairs. Energies 2023, 16, 2933. [Google Scholar] [CrossRef] [Scilit]
- IEC 61703:2016; Mathematical Expressions for Reliability, Availability, Maintainability and Maintenance Support Terms. International Electrotechnical Commission: Geneva, Switzerland, 2016.
- IEC 61025:2006; Fault Tree Analysis (FTA). International Electrotechnical Commission: Geneva, Switzerland, 2006.
- Fang, H.; Liao, J.; Huang, S.; Zhang, M. Research on Status Assessment and Operation and Maintenance of Electric Vehicle DC Charging Stations Based on XGBoost. Smart Cities 2024, 7, 3055–3070. [Google Scholar] [CrossRef] [Scilit]
- Martins, J.A.; Rodrigues, J.M.F. Intelligent Monitoring Systems for Electric Vehicle Charging. Appl. Sci. 2025, 15, 2741. [Google Scholar] [CrossRef] [Scilit]
- Gruosso, G.; Mion, A.; Storti Gajani, G. Forecasting of Electrical Vehicle Impact on Infrastructure: Markov Chains Model of Charging Stations Occupation. eTransportation 2020, 6, 100083. [Google Scholar] [CrossRef] [Scilit]
- Wei, Y.; Li, A.; Li, Y.; Cheng, Y. An Optimal Predictive Inspection and Maintenance Policy for a Multi-State System: A Belief-Based SMDP Approach. Reliab. Eng. Syst. Saf. 2026, 265, 111497. [Google Scholar] [CrossRef] [Scilit]
- Wei, Y.; Cheng, Y.; Liao, H. A Quantitative Maintenance Policy Development Framework for a Fleet of Self-Service Systems. Nav. Res. Logist. 2025, 72, 750–767. [Google Scholar] [CrossRef] [Scilit]
- Jiang, L.; Diao, X.; Zhang, Y.; Zhang, J.; Li, T. Review of the Charging Safety and Charging Safety Protection of Electric Vehicles. World Electr. Veh. J. 2021, 12, 184. [Google Scholar] [CrossRef] [Scilit]
- Almutairi, A. Impact Assessment of Diverse EV Charging Infrastructures on Overall Service Reliability. Sustainability 2022, 14, 13295. [Google Scholar] [CrossRef] [Scilit]
- Somefun, T.E.; Longe, O.M. Optimising the Reliability of Electric Vehicle Charging Stations with Vehicle-to-Vehicle Charging Capabilities. Energy Rep. 2025, 13, 4331–4344. [Google Scholar] [CrossRef] [Scilit]
- Liu, Y.; Xiahou, T.; Zhang, Q.; Xing, L.; Huang, H.-Z. Multi-state system reliability: An emerging paradigm for sophisticated engineered systems. Front. Eng. Manag. 2024, 11, 568–575. [Google Scholar] [CrossRef] [Scilit]





Disclaimer/Publisher’s Note: The statements, opinions and data contained in all publications are solely those of the individual author(s) and contributor(s) and not of MDPI and/or the editor(s). MDPI and/or the editor(s) disclaim responsibility for any injury to people or property resulting from any ideas, methods, instructions or products referred to in the content. |
© 2026 by the authors. Licensee MDPI, Basel, Switzerland. This article is an open access article distributed under the terms and conditions of the Creative Commons Attribution (CC BY) license.