


Abstract
This study presents an integrated geochemical approach to distinguish between genetic and reservoir-related factors controlling oil compositional variability, evaluate reservoir compartmentalization, and reconstruct hydrocarbon migration pathways within the Nuraly field and the Akshabulak group of fields in the South Turgay Basin, Kazakhstan. The study aims to develop and validate an integrated approach combining biomarker analysis and oil fingerprinting to improve the reliability of oil genetic interpretation, assess reservoir fluid communication, and reconstruct secondary hydrocarbon migration pathways. This study analyzed 164 unique crude oil samples from the Akshabulak and Nuraly fields. Oil fingerprinting was performed on all 164 samples, including 128 samples from the Akshabulak group and 36 samples from the Nuraly field. A representative subset of 75 samples, comprising 39 Akshabulak oils and 36 Nuraly oils, was additionally analyzed for biomarkers. Oil fingerprinting was conducted using low thermal mass multidimensional gas chromatography (LTM-MD-GC), whereas biomarker analysis was performed using gas chromatography–mass spectrometry (GC–MS). Principal component analysis (PCA) and hierarchical cluster analysis were applied separately to the oil-fingerprinting and biomarker datasets. The resulting classifications were subsequently compared and integrated to distinguish source-related genetic variability from reservoir-related compositional effects, including hydrocarbon migration, oil mixing, and reservoir compartmentalization. The proposed approach is based on the complementary diagnostic capabilities of the applied geochemical methods. Biomarkers provide information on the origin of organic matter, depositional environment, and thermal maturity of the source rocks, whereas oil fingerprinting is sensitive to hydrocarbon migration processes and the degree of hydrodynamic connectivity between reservoirs. The results indicate that the investigated oils are predominantly derived from terrigenous organic matter of lacustrine origin. The Akshabulak group is characterized by genetic homogeneity of oils despite pronounced reservoir compartmentalization, whereas the Nuraly field contains at least two genetically distinct oil populations and hydrocarbon mixing zones. Regional hydrocarbon migration was reconstructed from southeast to northwest. Paleochannel sandstones were identified as high-permeability migration conduits, while tectonic faults and facies heterogeneity were recognized as the principal controls on reservoir hydrodynamic isolation. The results demonstrate that integrating biomarker analysis with oil fingerprinting provides an effective tool for distinguishing between genetic and reservoir-related controls on oil compositional variability, evaluating reservoir compartmentalization, and improving the reliability of geological and reservoir models in structurally complex petroleum systems.
1. Introduction
In the modern petroleum industry, increasing attention is being directed toward improving the development efficiency of mature oil fields characterized by high reserve depletion and declining well productivity. These challenges are particularly pronounced in complex terrigenous and carbonate reservoirs, where reservoir heterogeneity and significant variability in petrophysical properties adversely affect hydrocarbon recovery. The development and management of structurally complex subsurface systems require integrated engineering approaches that combine geological characterization, reservoir analysis, and engineering solutions to improve production efficiency and resource recovery. Under such conditions, geological and reservoir simulation models play a crucial role in defining field development strategies and selecting appropriate enhanced oil recovery methods. Modern reservoir modeling approaches enable the incorporation of uncertainty and risk into development planning, which is particularly important for large and multilayer hydrocarbon reservoirs [1,2,3,4,5,6].
Despite significant advances in numerical simulation, substantial discrepancies between geological and hydrodynamic models persist due to reservoir complexity, limited source data, and the heterogeneous distribution of petrophysical properties. Studies devoted to automatic history matching demonstrate that even the application of advanced algorithms cannot completely eliminate uncertainty in model parameters [1,3]. Additional complexity arises from multilayered reservoir architecture, facies variability, and fractal heterogeneity of formations, resulting in pronounced anisotropy of filtration properties and complicating the prediction of fluid flow and hydrocarbon production [1,3,4]. Therefore, conventional deterministic modeling approaches are often insufficient for reliable reconstruction of internal reservoir architecture and require the application of geostatistical methods capable of accounting for spatial variability and geological uncertainty [3,4].
Under conditions of high uncertainty in geological and hydrodynamic models, there is an increasing need for independent verification methods capable of characterizing hydrocarbon genesis, migration pathways, and the degree of reservoir connectivity [7,8,9]. Among the most informative approaches are organic geochemical methods of petroleum investigation [10,11,12]. Biomarker analysis enables reconstruction of the depositional environment of source organic matter, including kerogen type, sedimentary conditions, and thermal maturity [9,10,11,12,13,14,15,16,17,18].
In turn, oil fingerprinting methods based on the distribution of aromatic hydrocarbons are widely used to evaluate reservoir continuity and compartmentalization studies, identify fluid-isolation zones, and discern genetic relationships between oils derived from different fields [2,5,6,19,20,21,22,23,24,25].
The integrated application of biomarker analysis and oil fingerprinting provides opportunities to reconstruct hydrocarbon generation and migration processes, assess petroleum genetic relationships, and characterize reservoir heterogeneity and compartmentalization [6,8,9,18,20,26]. However, previous regional investigations have often been based on individual fields or geographically restricted datasets, limiting the development of an integrated regional interpretation [21,27,28,29].
Regional studies of petroleum systems in Kazakhstan have demonstrated the importance of geological structure, source-rock depositional conditions, and reservoir architecture in controlling hydrocarbon accumulation [30].
The South Turgay Basin is one of the most promising oil- and gas-bearing basins of Kazakhstan, where the main hydrocarbon accumulations are associated with Jurassic and Cretaceous deposits. The basin is characterized by pronounced block tectonics and includes the Zhilanshik and Aryskum depressions, as well as the Mynbulak uplift [27,31].
Despite the considerable volume of geological and geophysical investigations, the origin of oils, hydrocarbon migration pathways, and reservoir connectivity within the basin remain controversial. At present, two major hypotheses of hydrocarbon origin are considered: the first assumes deep hydrocarbon generation within the Aryskum depression, whereas the second relates oil formation to Jurassic clay sequences regarded as the principal source rocks. In addition, the role of tectonic segmentation and facies variability in the formation of isolated reservoir blocks and hydrocarbon migration pathways remains insufficiently understood [27,28,31].
In this context, the application of integrated geochemical approaches combining molecular and statistical methods of oil analysis becomes particularly important. Such approaches allow for a more reliable interpretation of genetic relationships between oils from different fields and the reconstruction of regional migration systems [6,9,18,20,26,32].
Previous geochemical studies have suggested that oils of the South Turgay Basin may be associated with multiple effective source-rock intervals, including Lower and Middle Jurassic lacustrine source rocks deposited under variable depositional conditions. These alternative source-rock interpretations reflect the complex tectono-sedimentary evolution of the basin and provide an important framework for interpreting the observed geochemical variability [27,31].
The Nuraly field, located within the South Turgay Basin, represents a complex multiblock system divided into Western, Central, and Eastern sectors with different productive stratigraphic intervals. Despite several geochemical investigations, a comprehensive analysis of the entire sample dataset using modern molecular geochemical methods has not previously been conducted [28,33].
Similarly, a substantial amount of geological, geophysical, and production data has been accumulated for the Akshabulak group of fields (Central, Eastern, and Southern Akshabulak); however, their integration with molecular geochemical results remains insufficient [27,29].
Thus, to the best of our knowledge, an integrated regional interpretation combining oil genesis, hydrocarbon migration, and reservoir heterogeneity across both the Nuraly and Akshabulak systems remains lacking.
The aim of this study is an integrated geochemical investigation of oils from the Nuraly field and the Akshabulak group of fields based on biomarker analysis and oil fingerprinting combined with multivariate statistical methods (PCA and cluster analysis) in order to determine the genetic classification of oils, evaluate reservoir connectivity, reconstruct hydrocarbon migration pathways, and identify zones of reservoir heterogeneity within the South Turgay Basin.
Geological Setting and Petroleum Potential of the Study Area
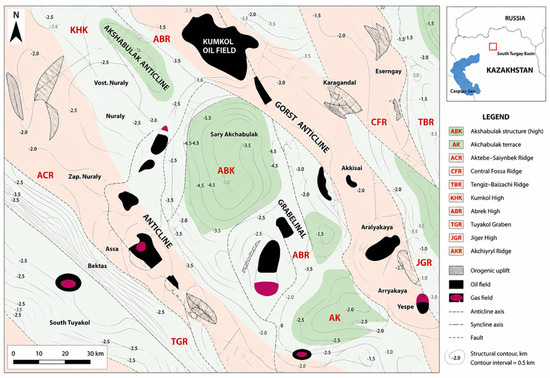
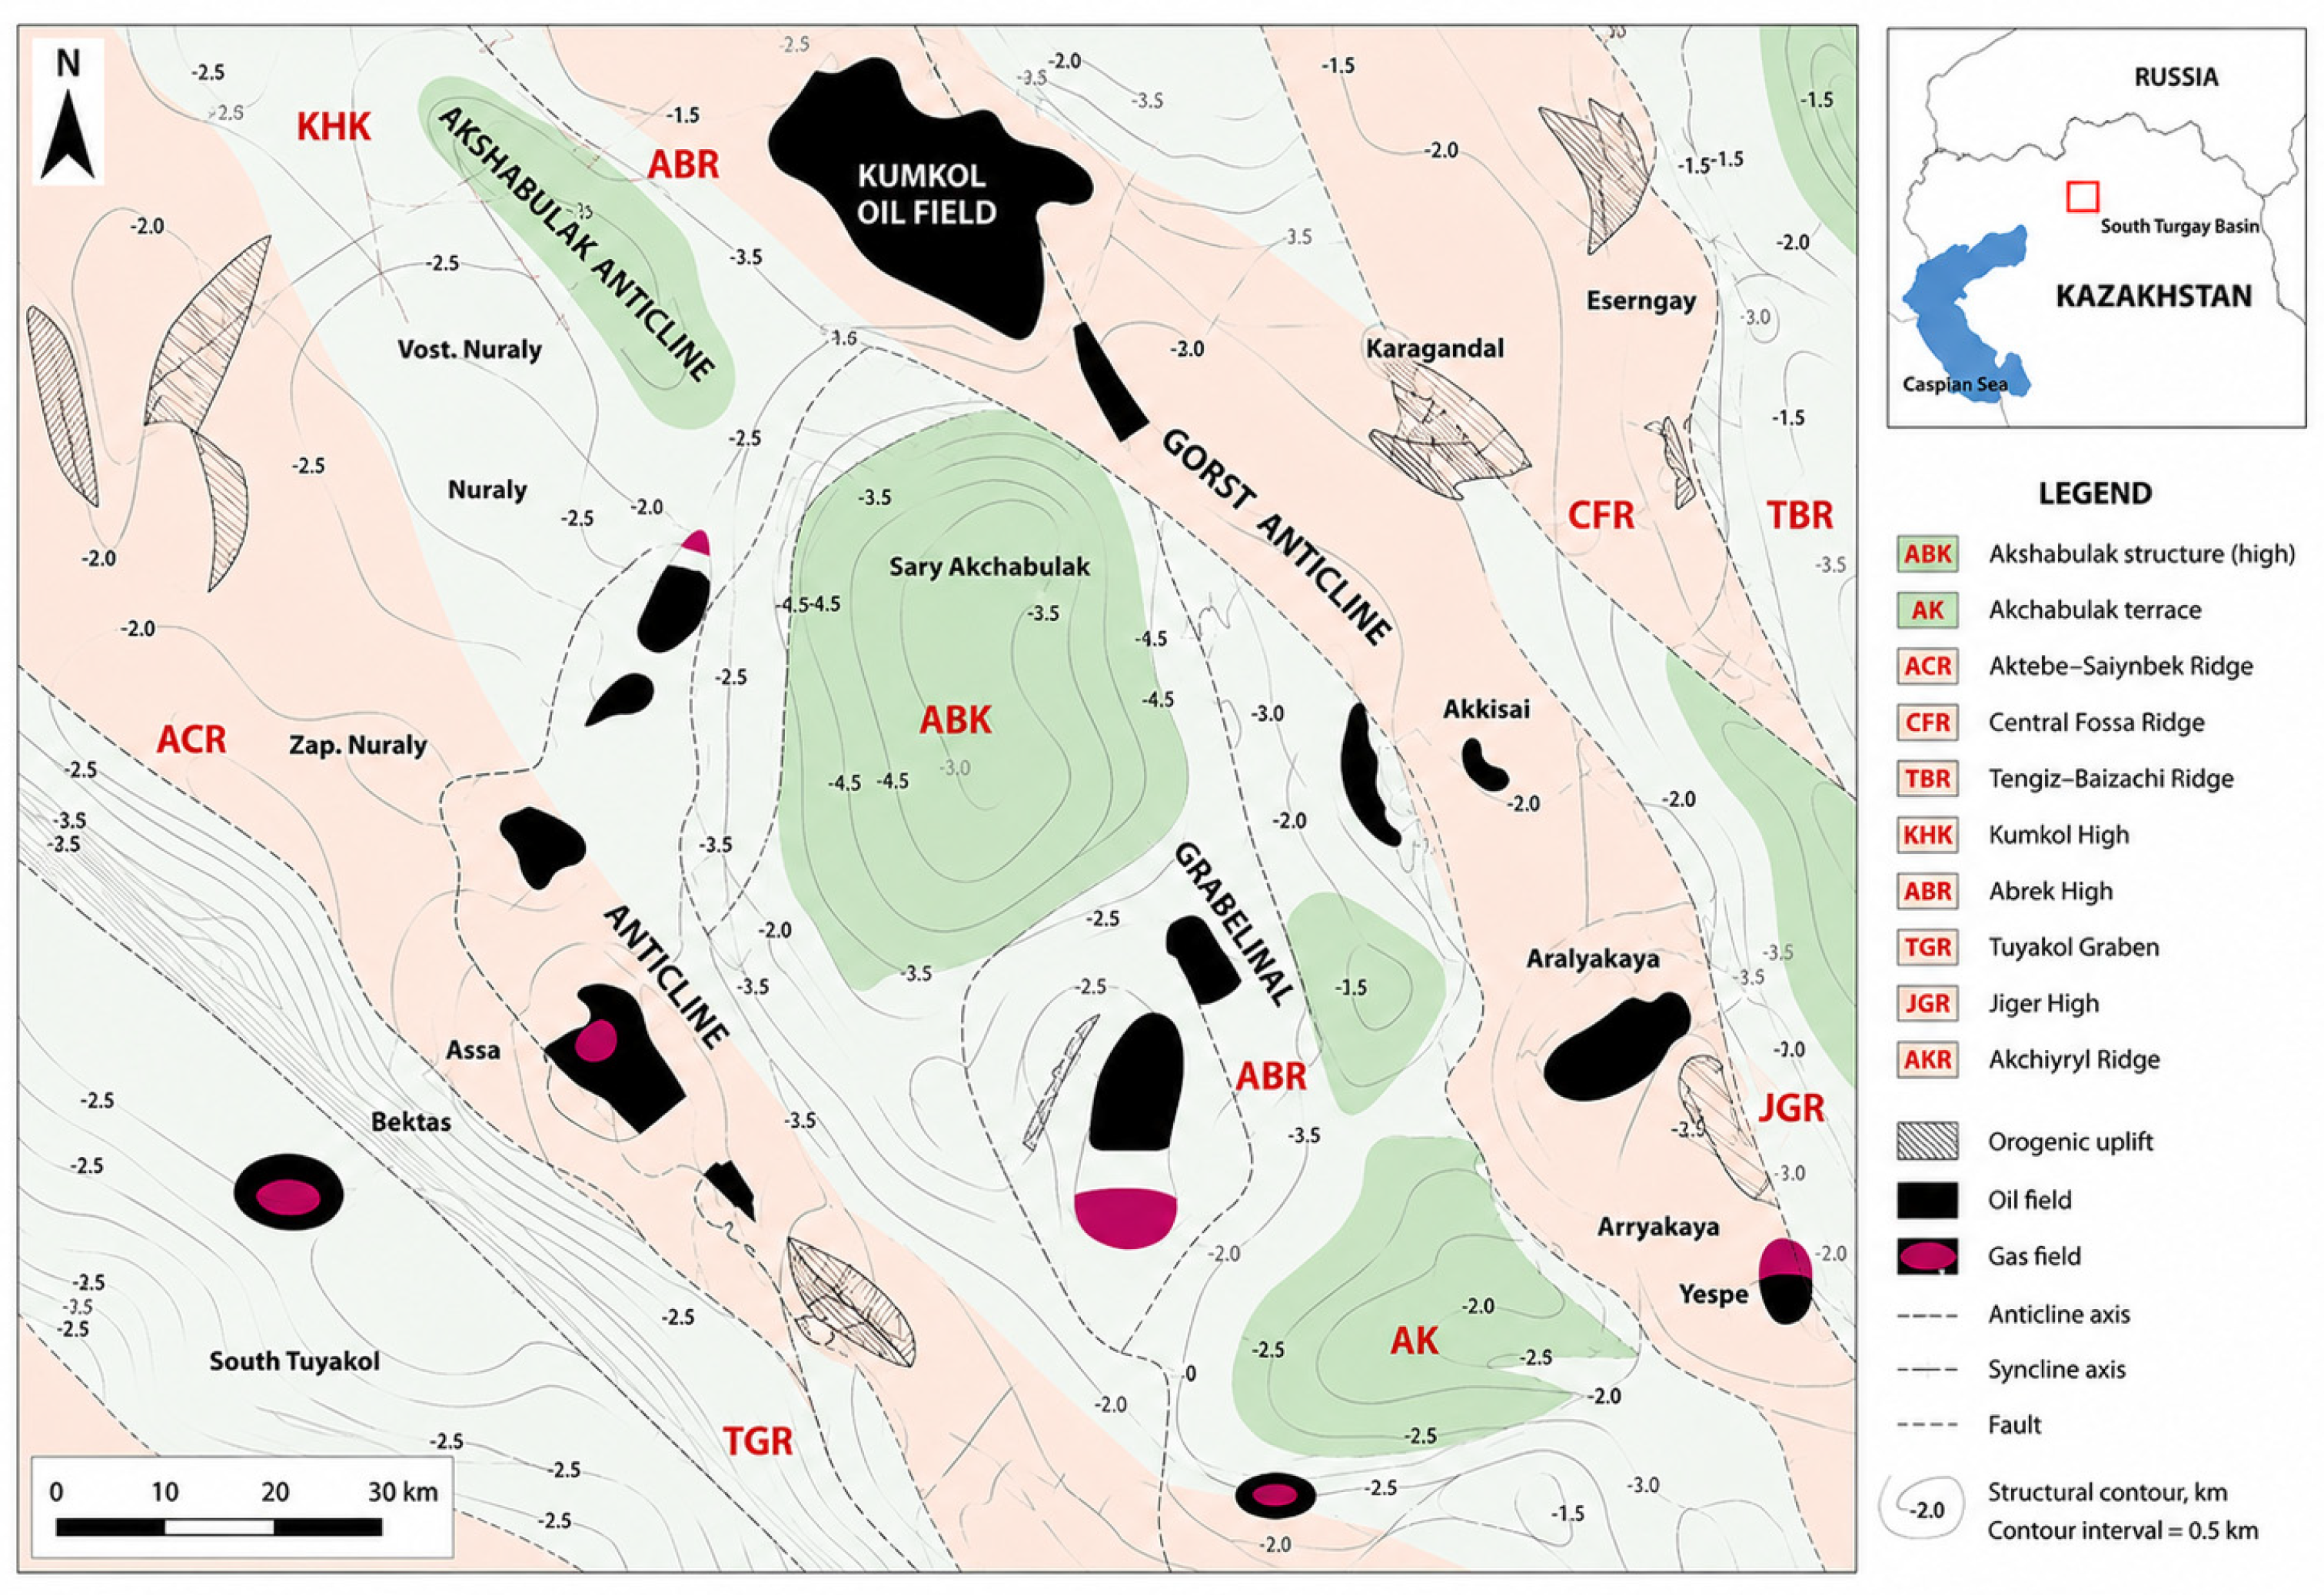
The South Turgay Basin is one of the youngest and most extensively explored petroliferous basins in Kazakhstan (Figure 1). Hydrocarbon accumulations are predominantly associated with Jurassic and Cretaceous sedimentary successions, reflecting the basin’s relatively young geological evolution and intensive sedimentation during the Mesozoic. Structurally, the basin is characterized by a pronounced fault-block architecture comprising three major tectonic elements: the Zhilanshik Depression, the Aryskum Depression, and the intervening Mynbulak Saddle. This structural framework governs the spatial distribution of sedimentary successions, the development of structural traps, and exerts a fundamental control on hydrocarbon generation, migration, and accumulation [27,31].
Figure 1.
Geological setting of the South Turgay Basin.
Systematic petroleum exploration within the South Turgay Basin began in the 1970s and has resulted in the development of an extensive geological and geophysical database. Numerous oil and gas fields and prospective structures have since been identified across the basin. Many of the major producing fields have now reached mature stages of development, highlighting the need to refine petroleum-system models and identify additional exploration targets, including deeper stratigraphic intervals.
Despite decades of geological and geophysical investigations, no unified model has yet been established regarding the origin of hydrocarbons in the South Turgay Basin. Some researchers propose a deep-seated origin of hydrocarbons, particularly within the Aryskum Depression, whereas others consider the Middle Jurassic mudstone sequences to represent the principal source rocks responsible for petroleum generation. In addition, the petroleum potential of the Paleozoic succession has been questioned because of the presumed absence of regionally effective sealing formations. Consequently, the sources of hydrocarbons, migration pathways, and mechanisms controlling hydrocarbon accumulation remain subjects of ongoing scientific debate [27,31].
Under these circumstances, modern organic geochemical techniques have become increasingly important for resolving these uncertainties. Integrated applications of biomarker analysis, stable carbon isotope geochemistry and oil fingerprinting provide robust tools for establishing oil–oil and oil–source rock correlations, reconstructing hydrocarbon migration pathways, and characterizing petroleum systems [5,6,9,13]. Nevertheless, most previous investigations have been based on relatively limited numbers of oil samples, thereby restricting the reliability of regional geochemical interpretations.
One of the principal study objects is the Nuraly Oil Field, discovered in 1983 following regional seismic exploration. The field exhibits a complex fault-block structure and is subdivided into the Western, Central, and Eastern structural blocks. Hydrocarbon accumulations occur within both Jurassic and Cretaceous reservoirs, and their spatial distribution is controlled by the combined effects of tectonic evolution and facies heterogeneity [28,33].
The sedimentary succession overlies the Proterozoic basement and consists of Jurassic, Cretaceous, Paleogene, and Neogene–Quaternary deposits. The principal producing horizons vary between the structural blocks: the Lower Cretaceous horizons M-II-3 and M-II-4 occur in Western Nuraly, the M-II-1 horizon in Central Nuraly, whereas the Upper Jurassic horizons Yu-0-1, Yu-0-2, Yu-I, Yu-II, and Yu-III are developed in the Central and Eastern blocks. The Middle Jurassic Yu-IV horizon is restricted to the marginal parts of the Eastern block. The investigated productive intervals occur at depths of approximately 1725–2245 m, depending on the structural block and stratigraphic horizon [28,33].
The second study object is the Akshabulak Group of oil fields, comprising the Central Akshabulak, East Akshabulak, and South Akshabulak fields, discovered between 1987 and 1990 (Table 1). Hydrocarbon accumulations are primarily hosted within Lower Neocomian, Upper Jurassic, and Middle Jurassic terrigenous reservoirs. Central Akshabulak is the largest producing field in the group, with approximately 80.7% depletion of recoverable reserves, whereas the corresponding depletion levels are about 63% and 70% for East Akshabulak and South Akshabulak, respectively [29]. These differences reflect variations in reservoir architecture, depositional environments, and tectonic evolution across the petroleum system.
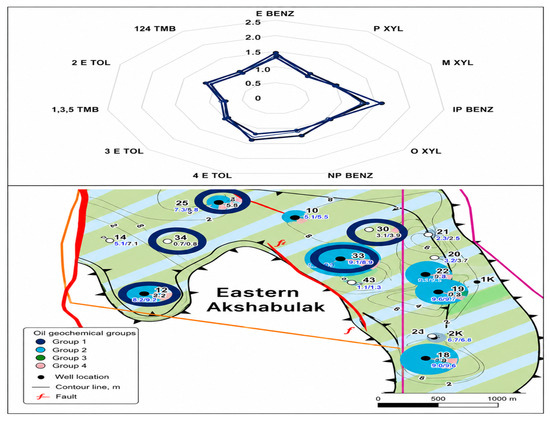
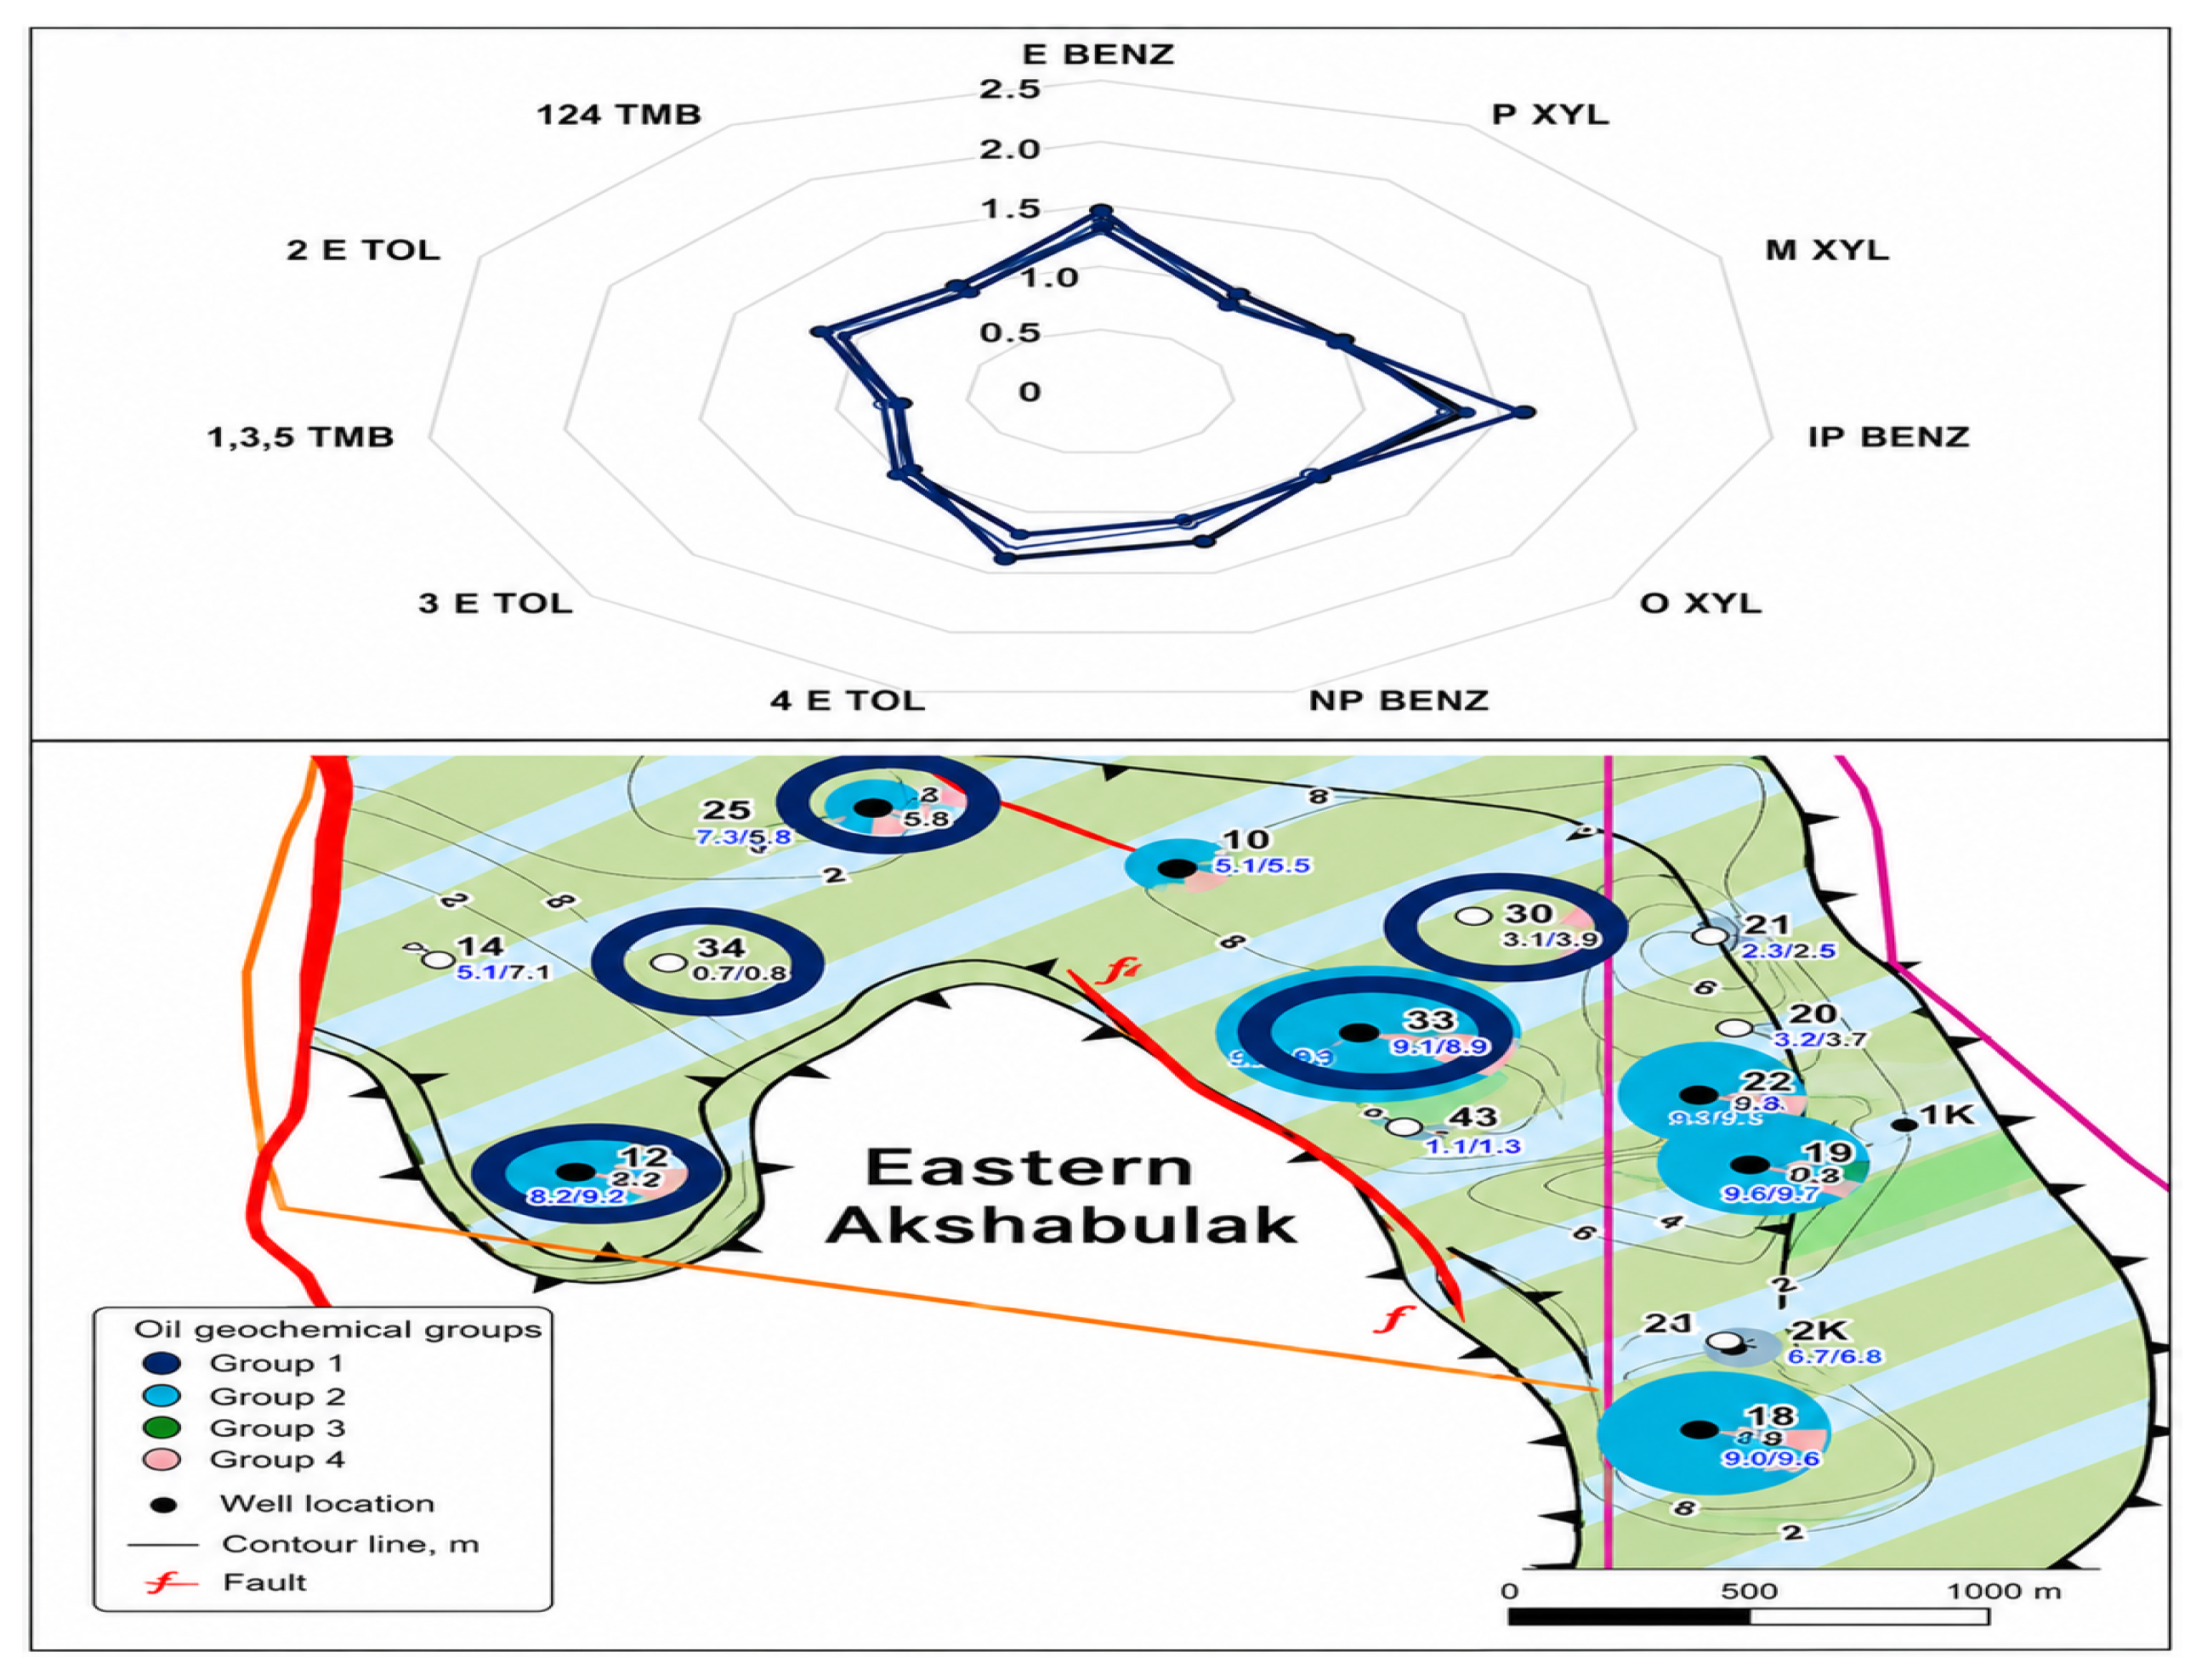
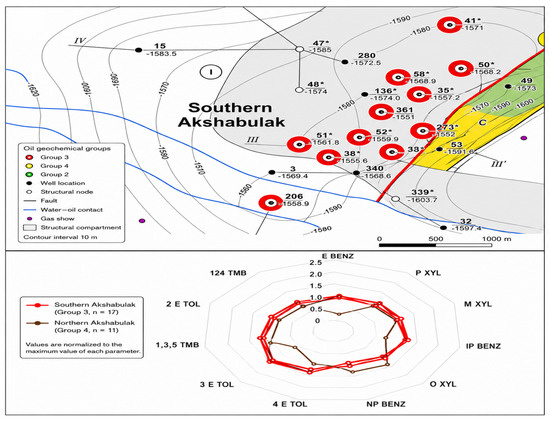
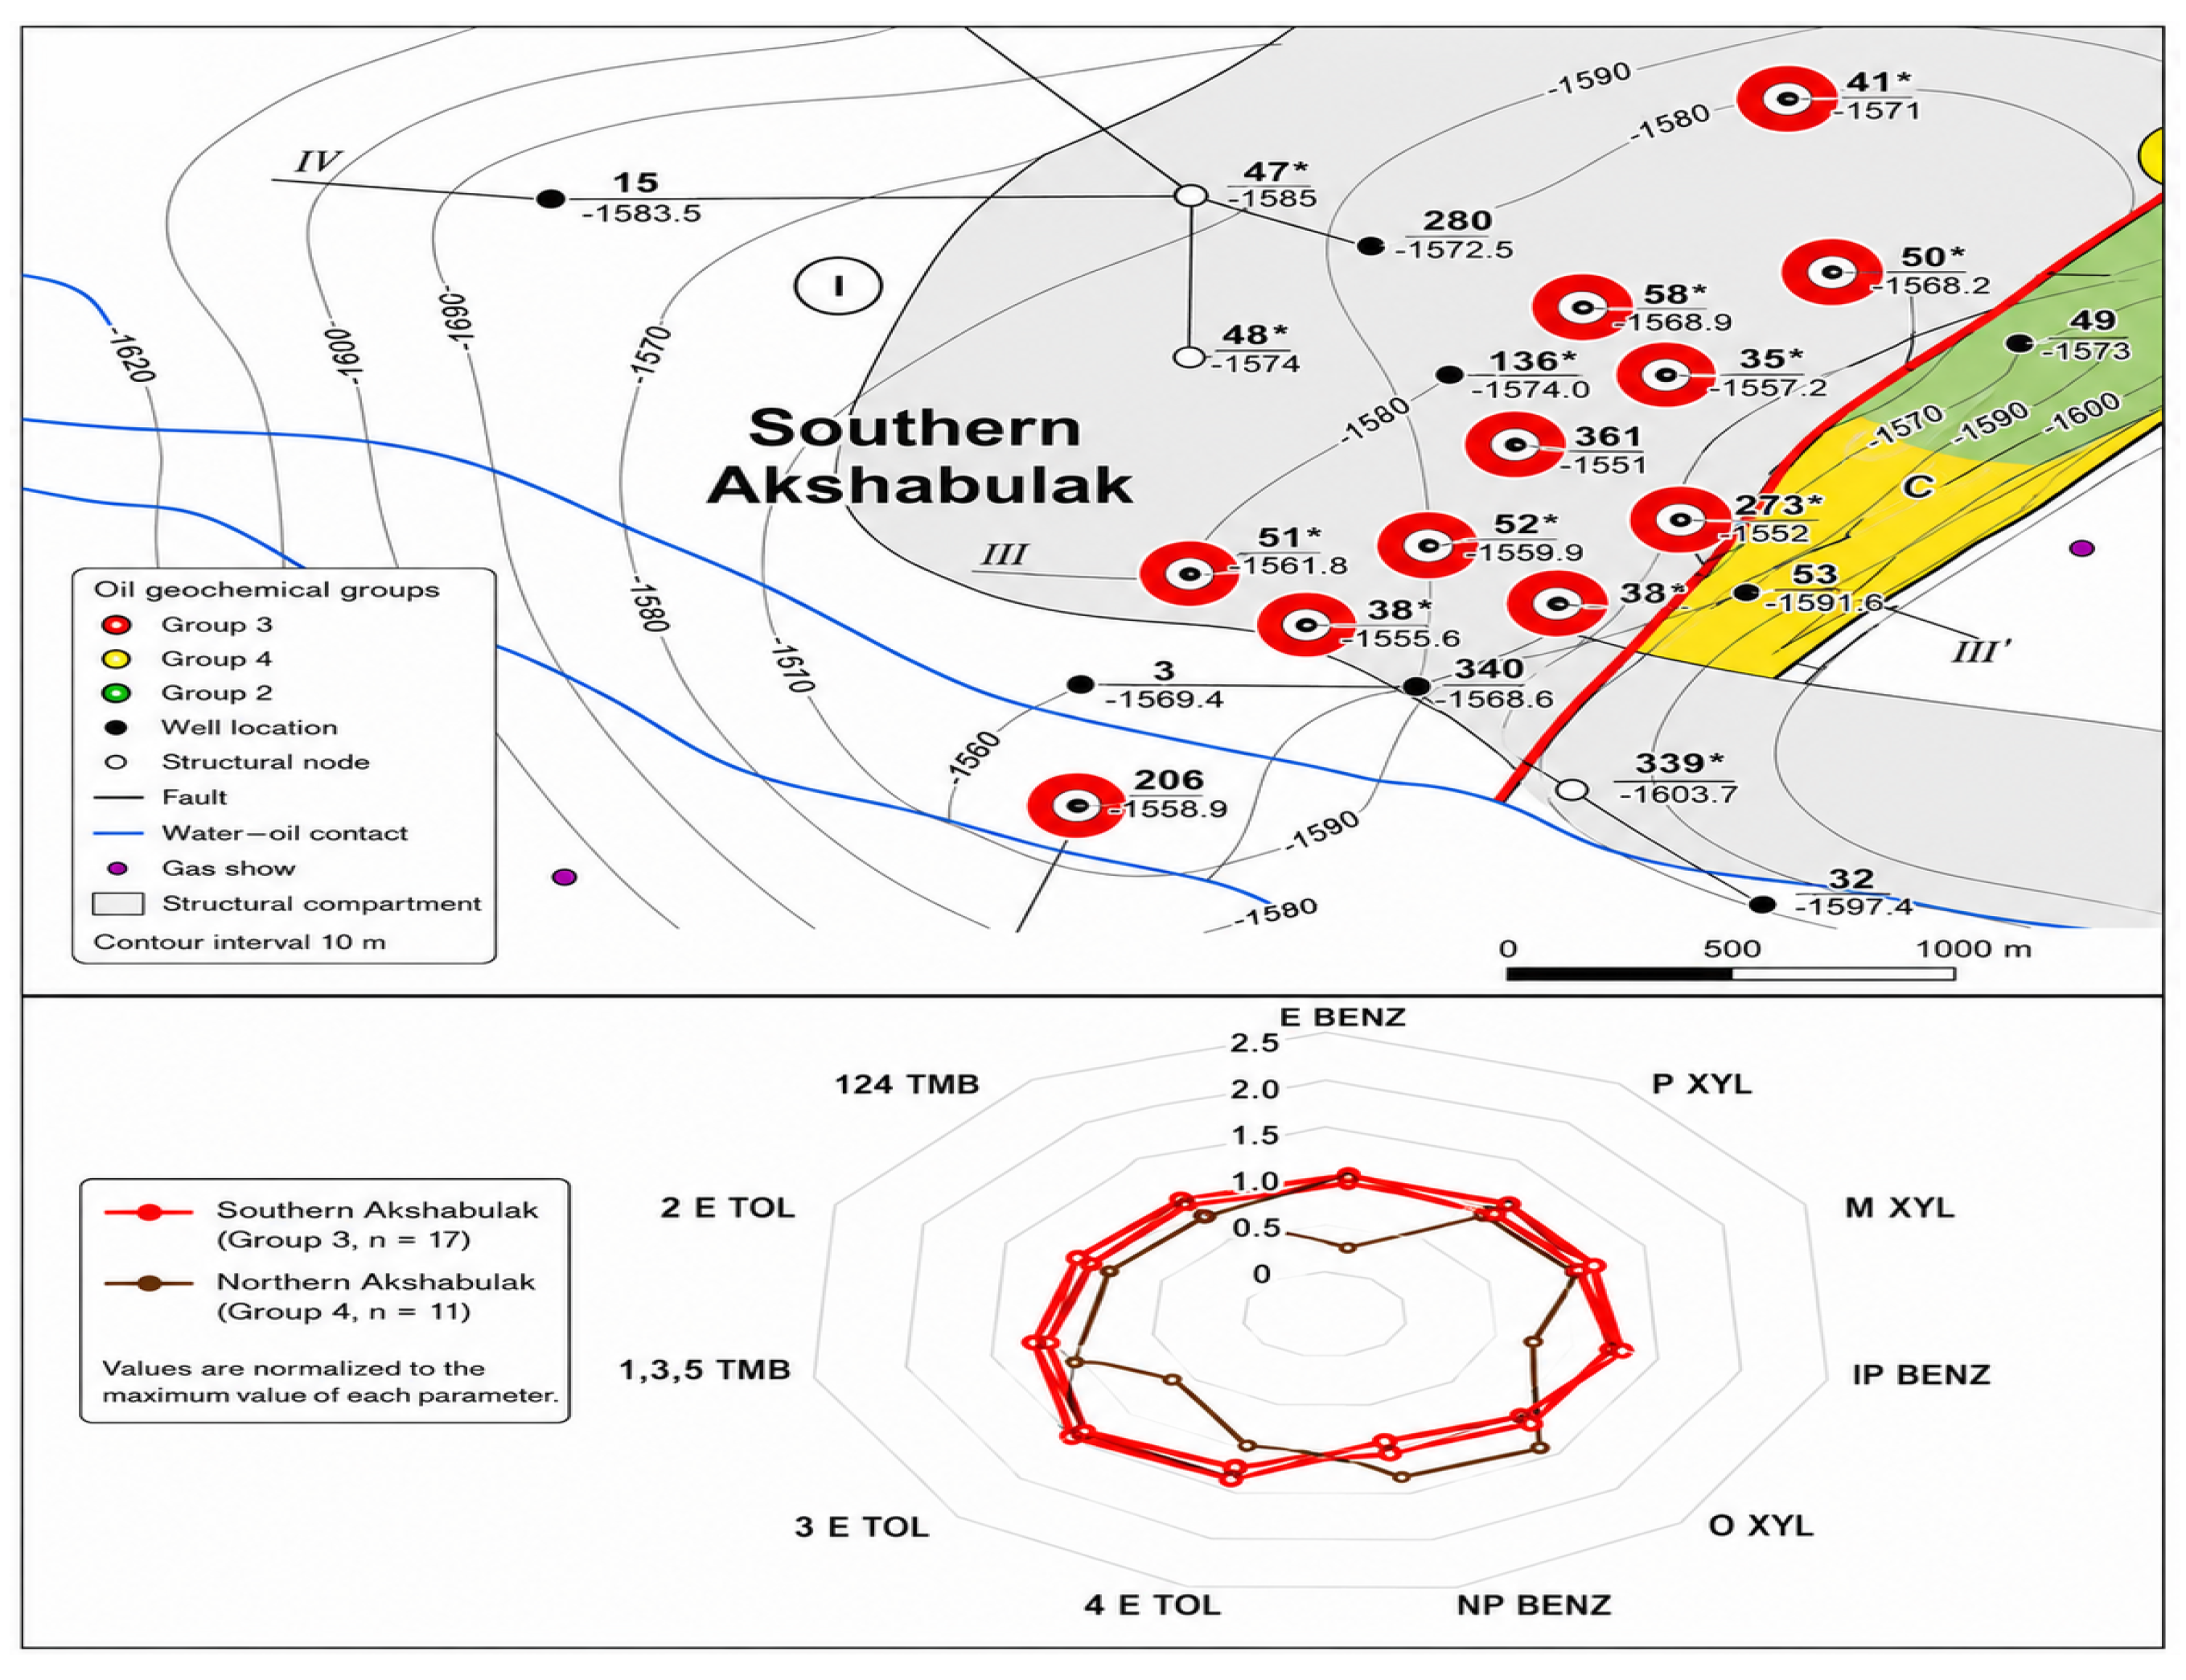
Table 1.
Principal producing reservoirs of the Akshabulak Group of oil fields.
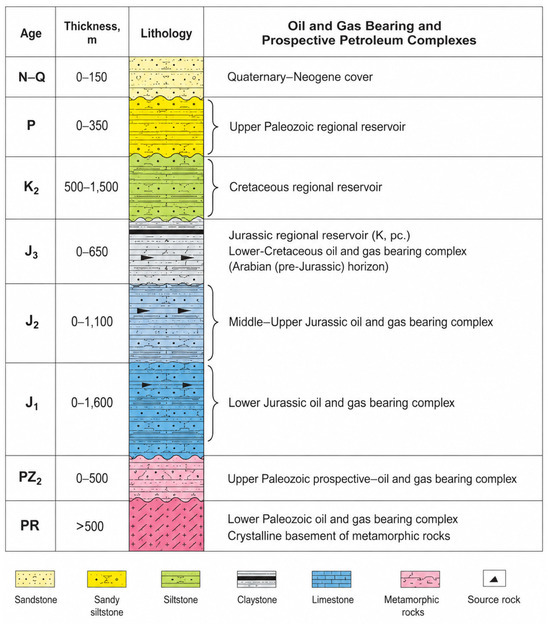
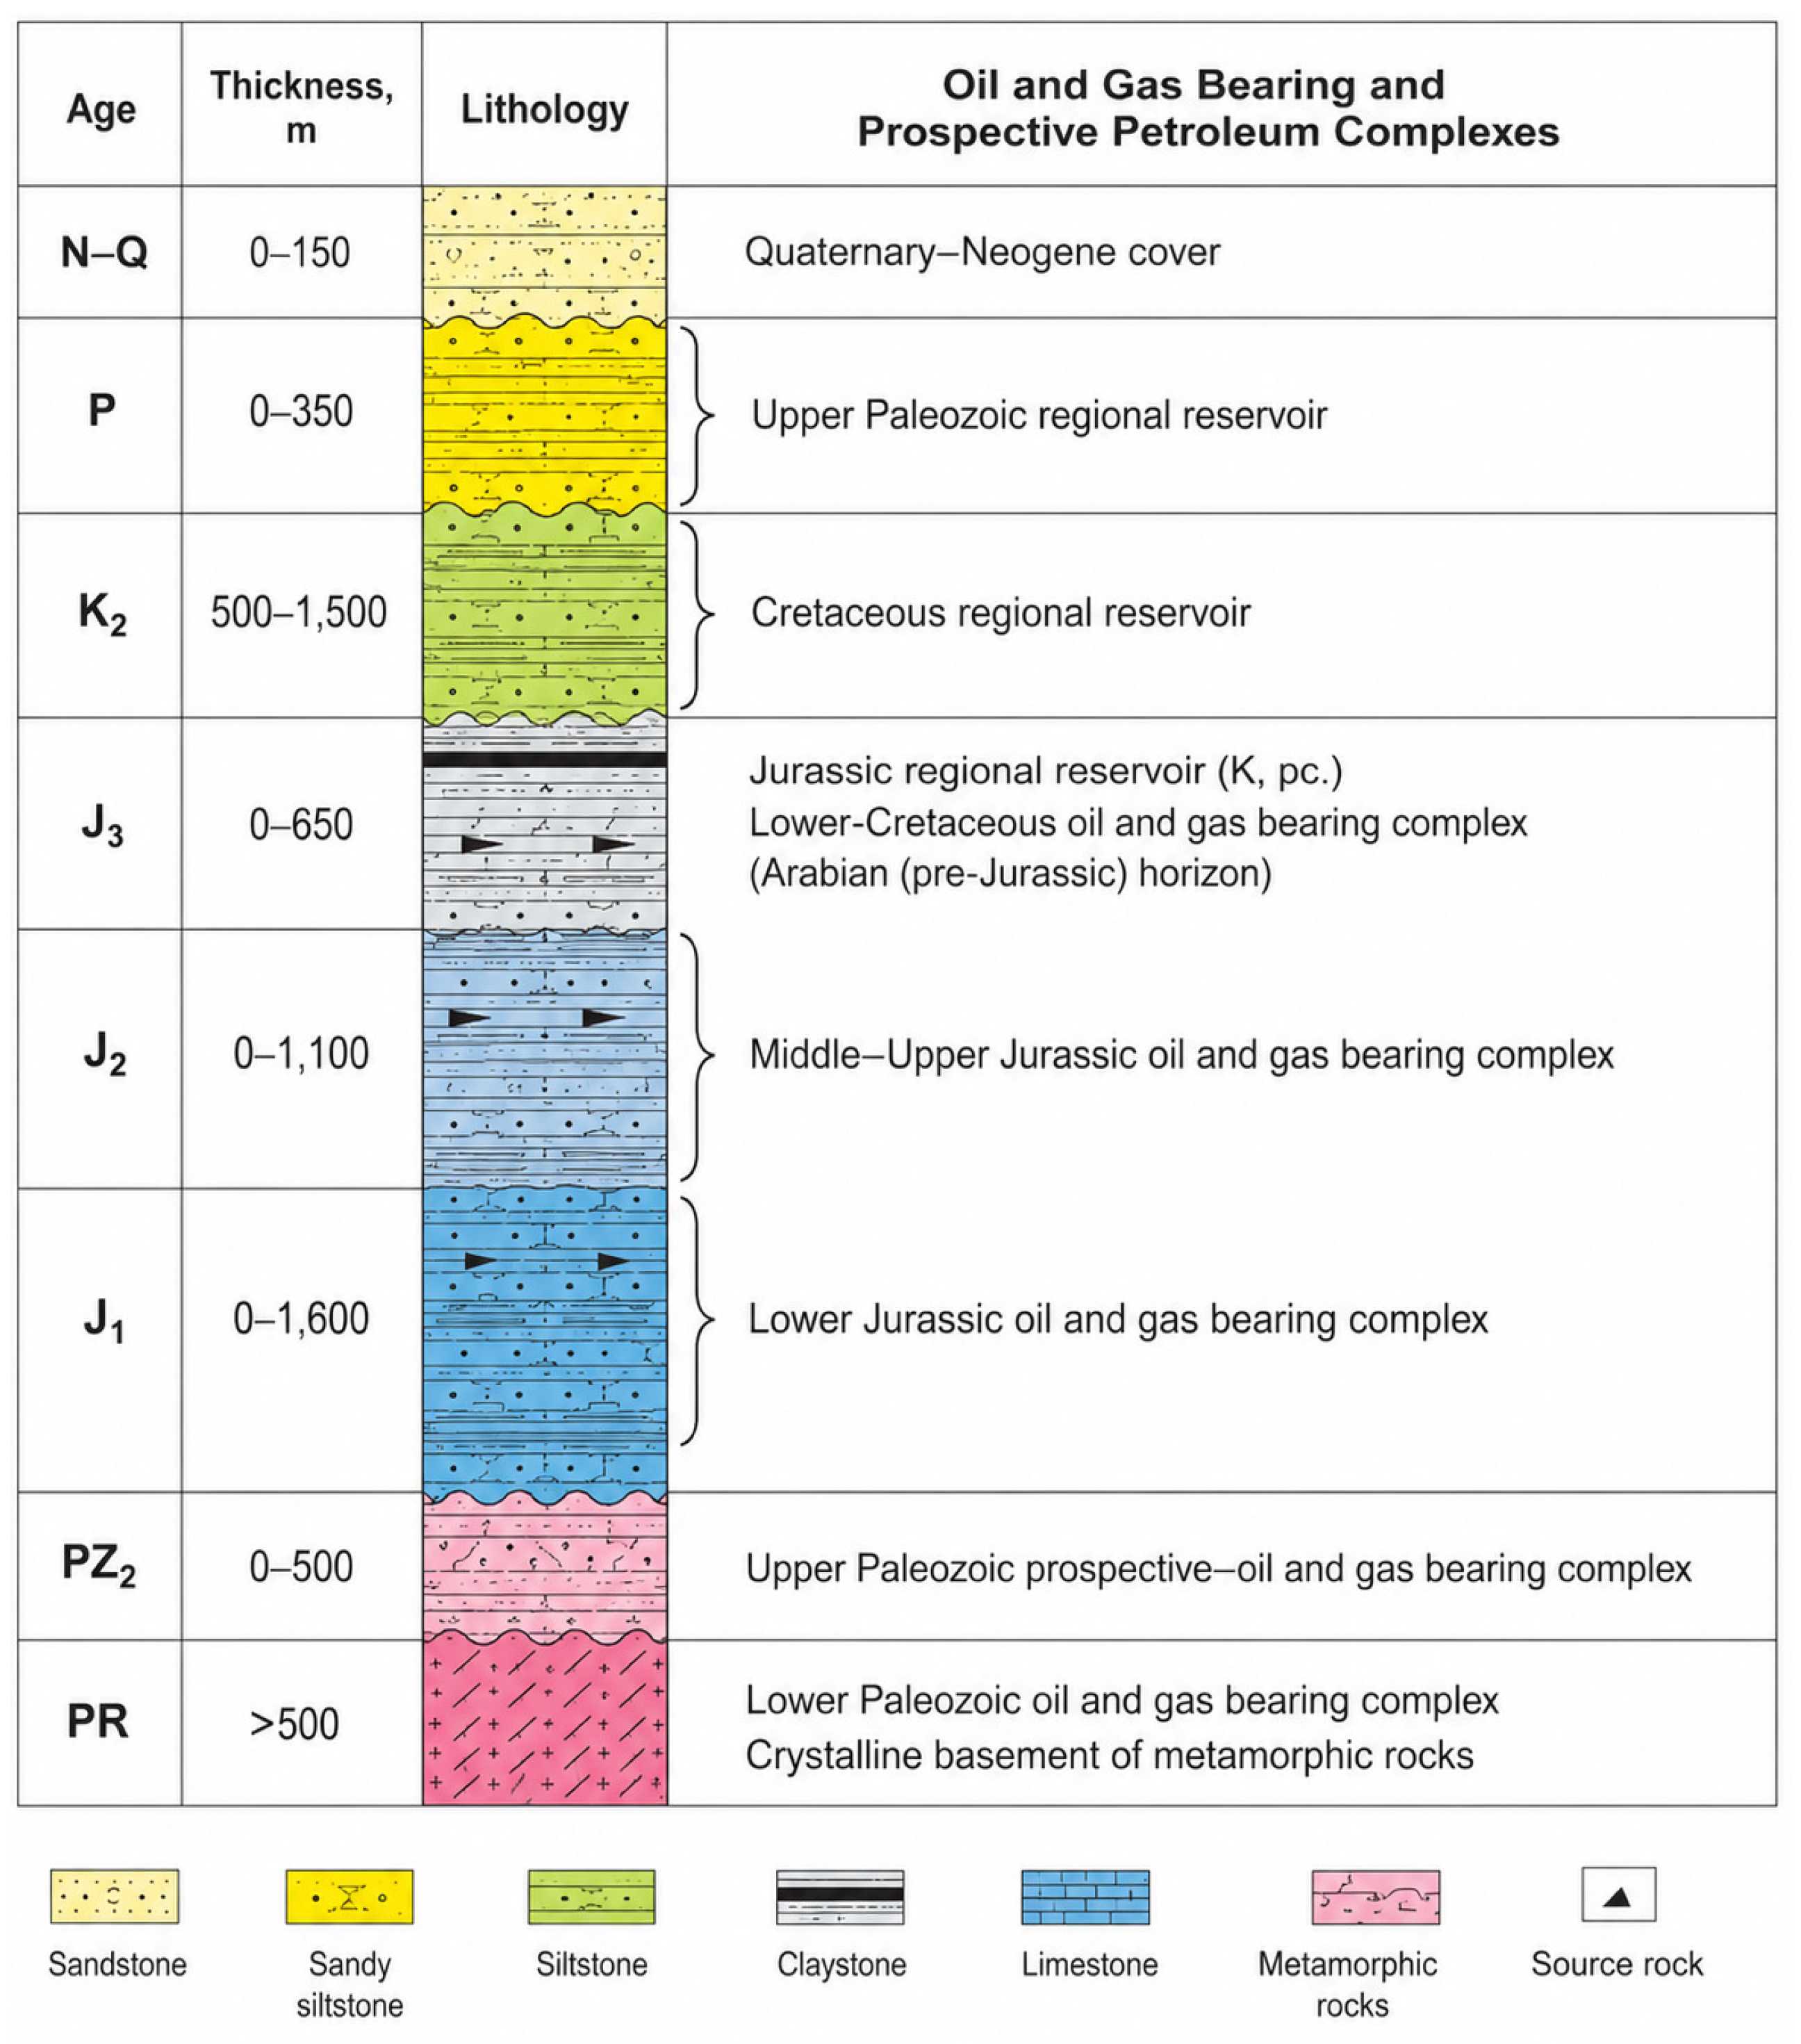
The oldest rocks within the Aryskum Depression are represented by Archean and Proterozoic granites, gneisses, and crystalline schists, which constitute the crystalline basement of the basin (Figure 2). These basement rocks are unconformably overlain by Jurassic, Cretaceous, and Cenozoic sedimentary successions that record the subsequent geological evolution of the basin. As illustrated in the generalized stratigraphic column (Figure 2), the principal hydrocarbon accumulations occur within Jurassic and Lower Cretaceous reservoirs, whereas the penetrated pre-Jurassic succession ranges in thickness from 5 to 108.5 m. The total sedimentary thickness of the Aryskum Depression reaches approximately 12–15 km and reflects a long history of sedimentation, tectonic deformation, and basin evolution. The Jurassic succession consists predominantly of lacustrine and terrigenous deposits that contain the principal petroleum source rocks and reservoir intervals [31], while the overlying Cretaceous succession hosts major producing horizons of the Akshabulak oilfield group [29], as shown in Figure 2.
Figure 2.
Generalized stratigraphic column and vertical distribution of the principal producing horizons of the Akshabulak oilfield group, South Turgay Basin.
A distinctive geological feature of the Central and South Akshabulak fields is the occurrence of paleochannel systems identified through seismic interpretation and subsequently confirmed by drilling. These channel sandstone bodies form highly permeable migration pathways that facilitate hydrocarbon charging and create localized zones of enhanced reservoir productivity [27,29]. Overall, the Nuraly and Akshabulak fields exhibit the principal geological characteristics of the South Turgay Basin, including fault-block tectonics, terrigenous reservoir development, and pronounced facies heterogeneity, all of which strongly influence hydrocarbon migration and accumulation.
Previous studies have suggested that the source organic matter of the South Turgay Basin is predominantly associated with Jurassic source-rock intervals deposited under lacustrine conditions [27,28,29]. However, comprehensive investigations integrating oil fingerprinting and biomarker analysis across the major producing fields of the basin remain limited. Consequently, the relative contributions of genetic factors related to source-rock characteristics and reservoir factors associated with reservoir architecture and accumulation conditions to variations in crude oil composition remain insufficiently understood. Addressing this knowledge gap constitutes the principal scientific objective and novelty of the present study.
2. Materials and Methods
Sampling and Preparation of Oil Samples. In the present study, the results of previously conducted geochemical investigations of oils from the Nuraly field and the Akshabulak group of fields in the South Turgay Basin were used.
For oil fingerprinting, 128 oil samples collected from producing wells of the Akshabulak Central (112 samples), Akshabulak South (11 samples), and Akshabulak East (5 samples) fields, as well as 36 oil samples derived from the Nuraly field in 2021, were analyzed. Sampling was carried out across the entire active producing well stock to ensure maximum spatial coverage of productive reservoirs and to identify possible zones of fluid isolation. All geochemical analyses were performed in the geochemistry laboratory of the Atyrau Branch of KMG Engineering.
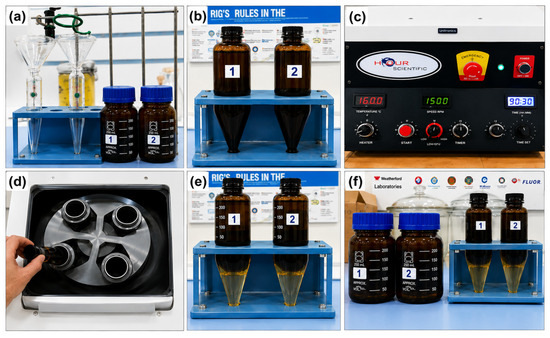
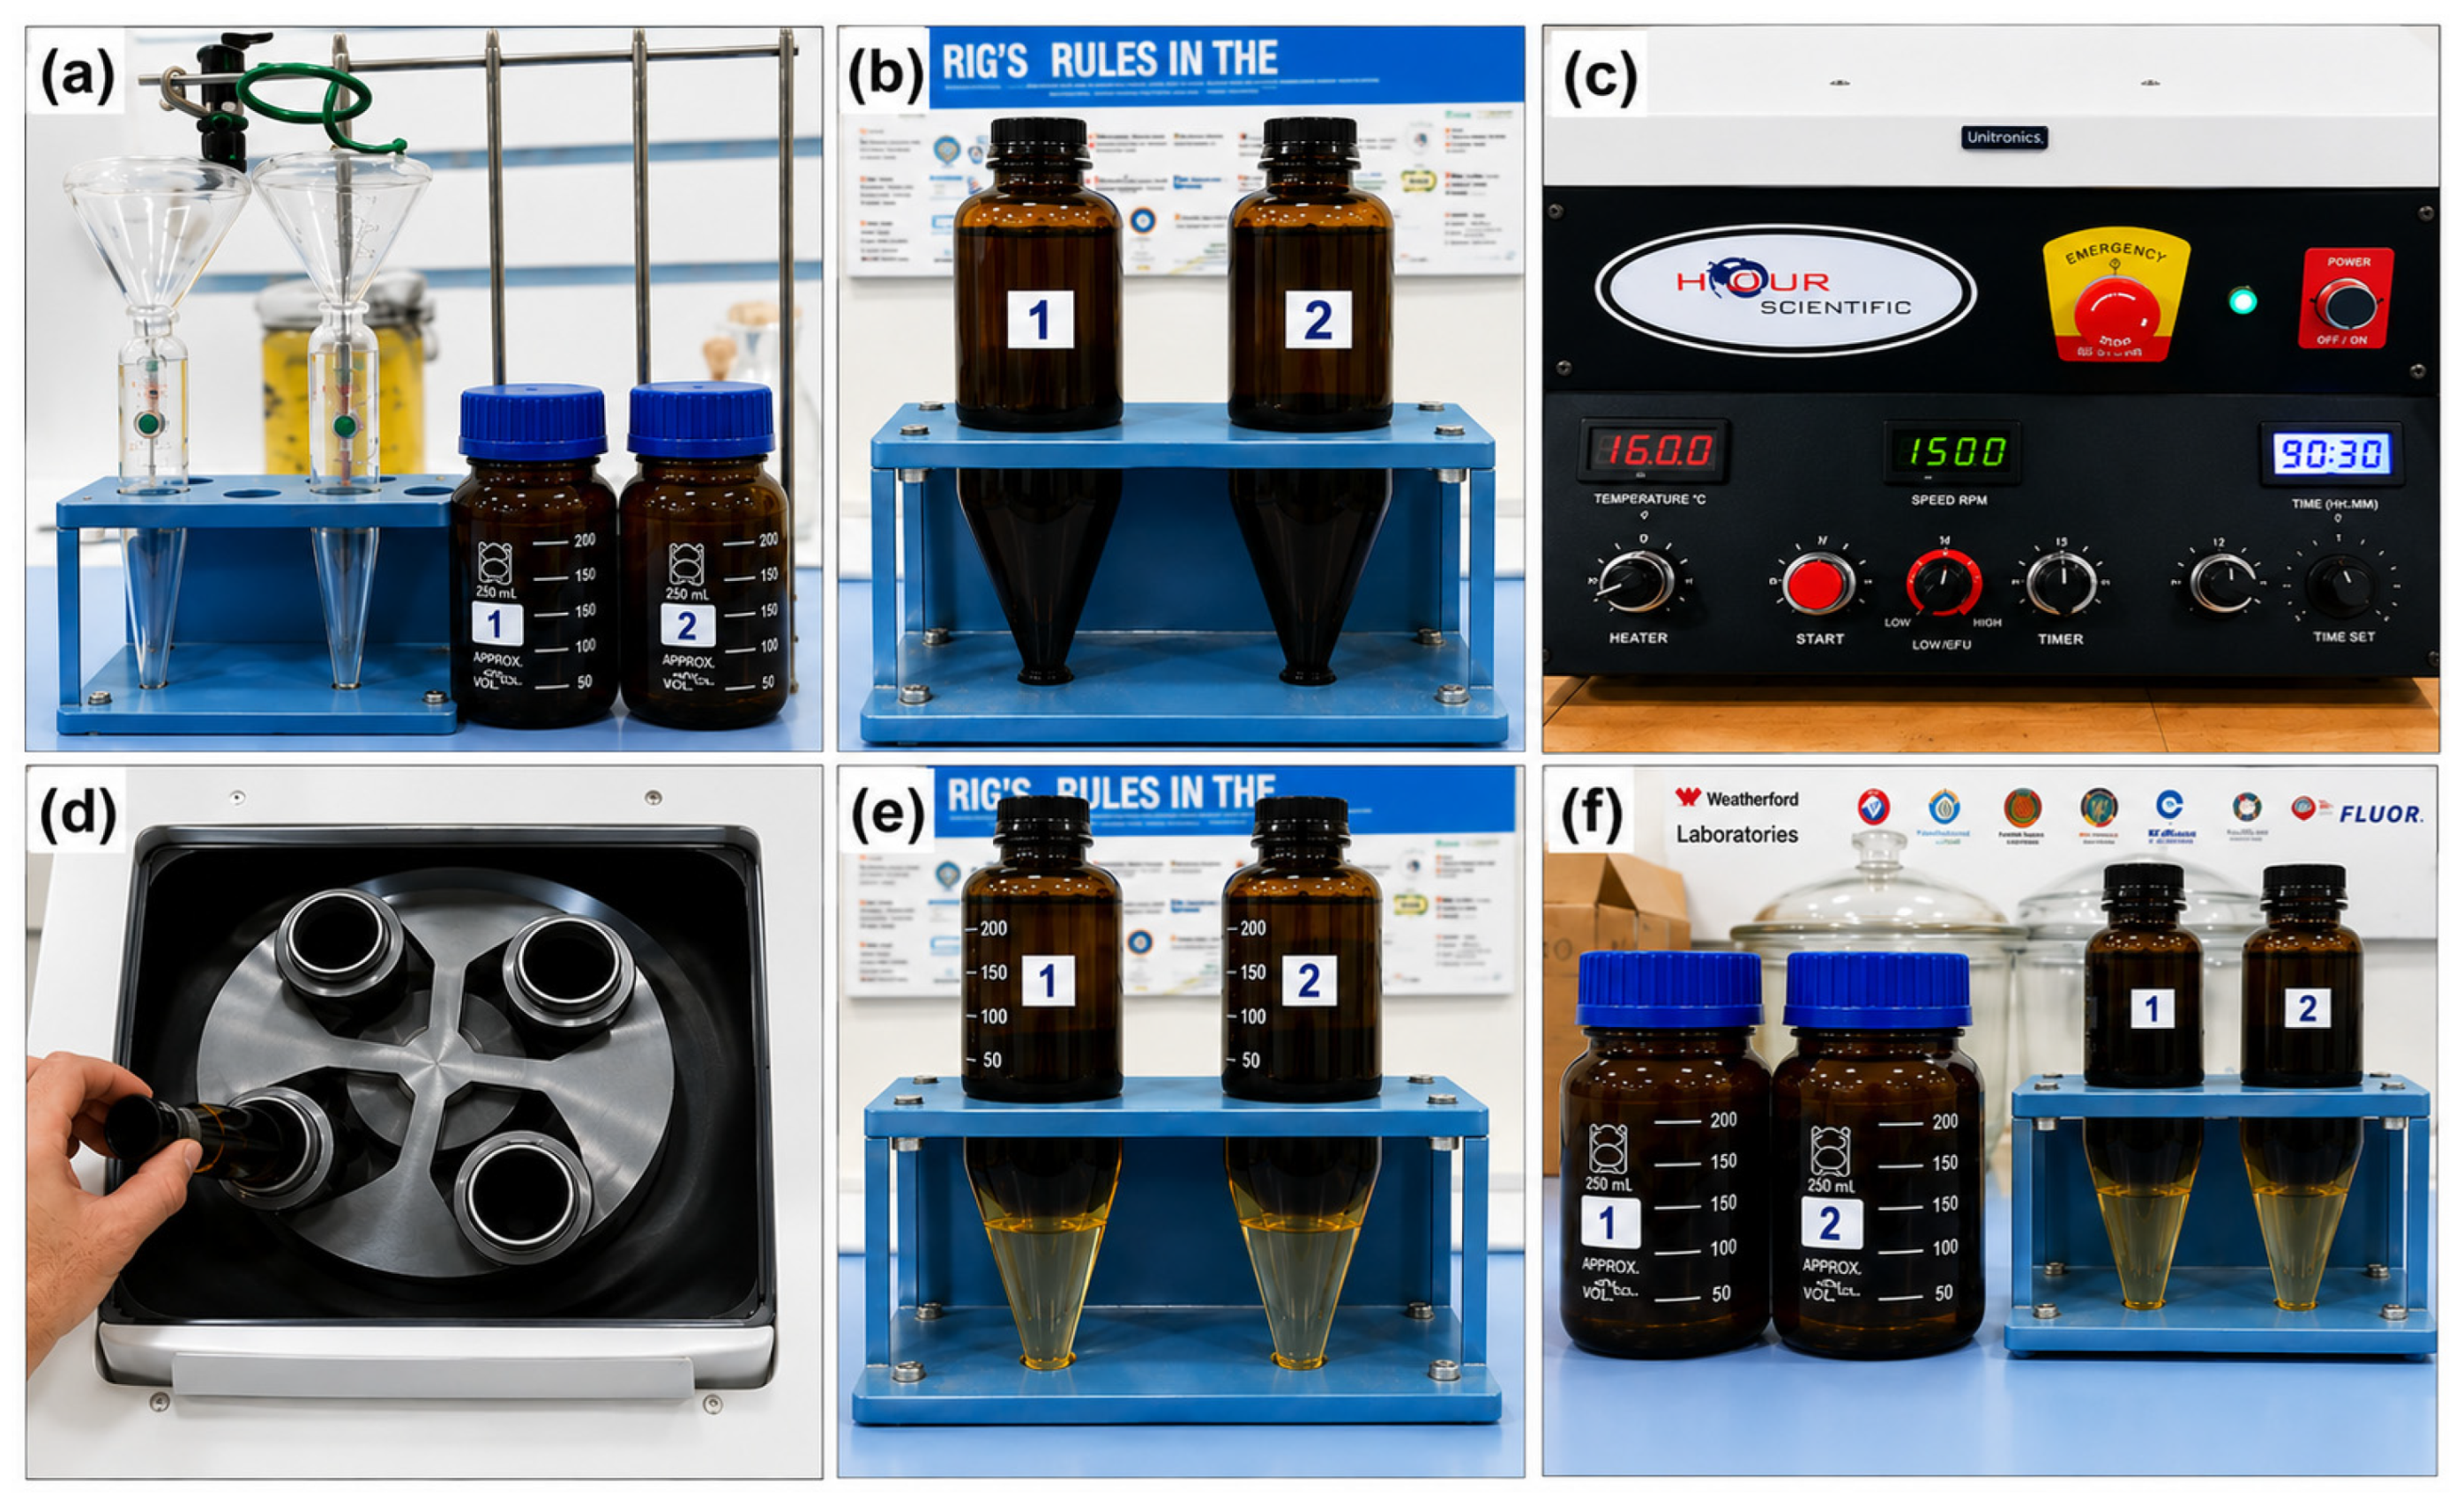
For detailed biomarker analysis, 39 representative oil samples from the Akshabulak group and 36 oil samples from the Nuraly field were selected. Oil samples were collected at the wellheads of producing wells in accordance with laboratory sampling procedures. After collection, the samples were placed in hermetically sealed glass containers to prevent contact with atmospheric air and the loss of light hydrocarbon fractions. Prior to analytical investigations, the samples were stored at a constant temperature under conditions excluding secondary alterations of their composition (Figure 3).
Figure 3.
Workflow for sample preparation prior to geochemical analysis: (a) initial preparation of crude oil samples; (b) crude oil samples before treatment; (c) temperature-controlled sample treatment; (d) centrifugation of oil samples; (e) samples after centrifugation; (f) prepared oil samples ready for subsequent geochemical analysis.
All samples consisted of produced crude oil collected from production wells operating under stable production conditions. Sampling, transportation, and sample preparation were carried out in accordance with the requirements of GOST 2517–2012 [34].
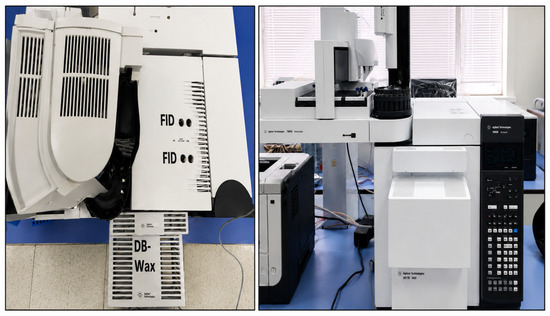
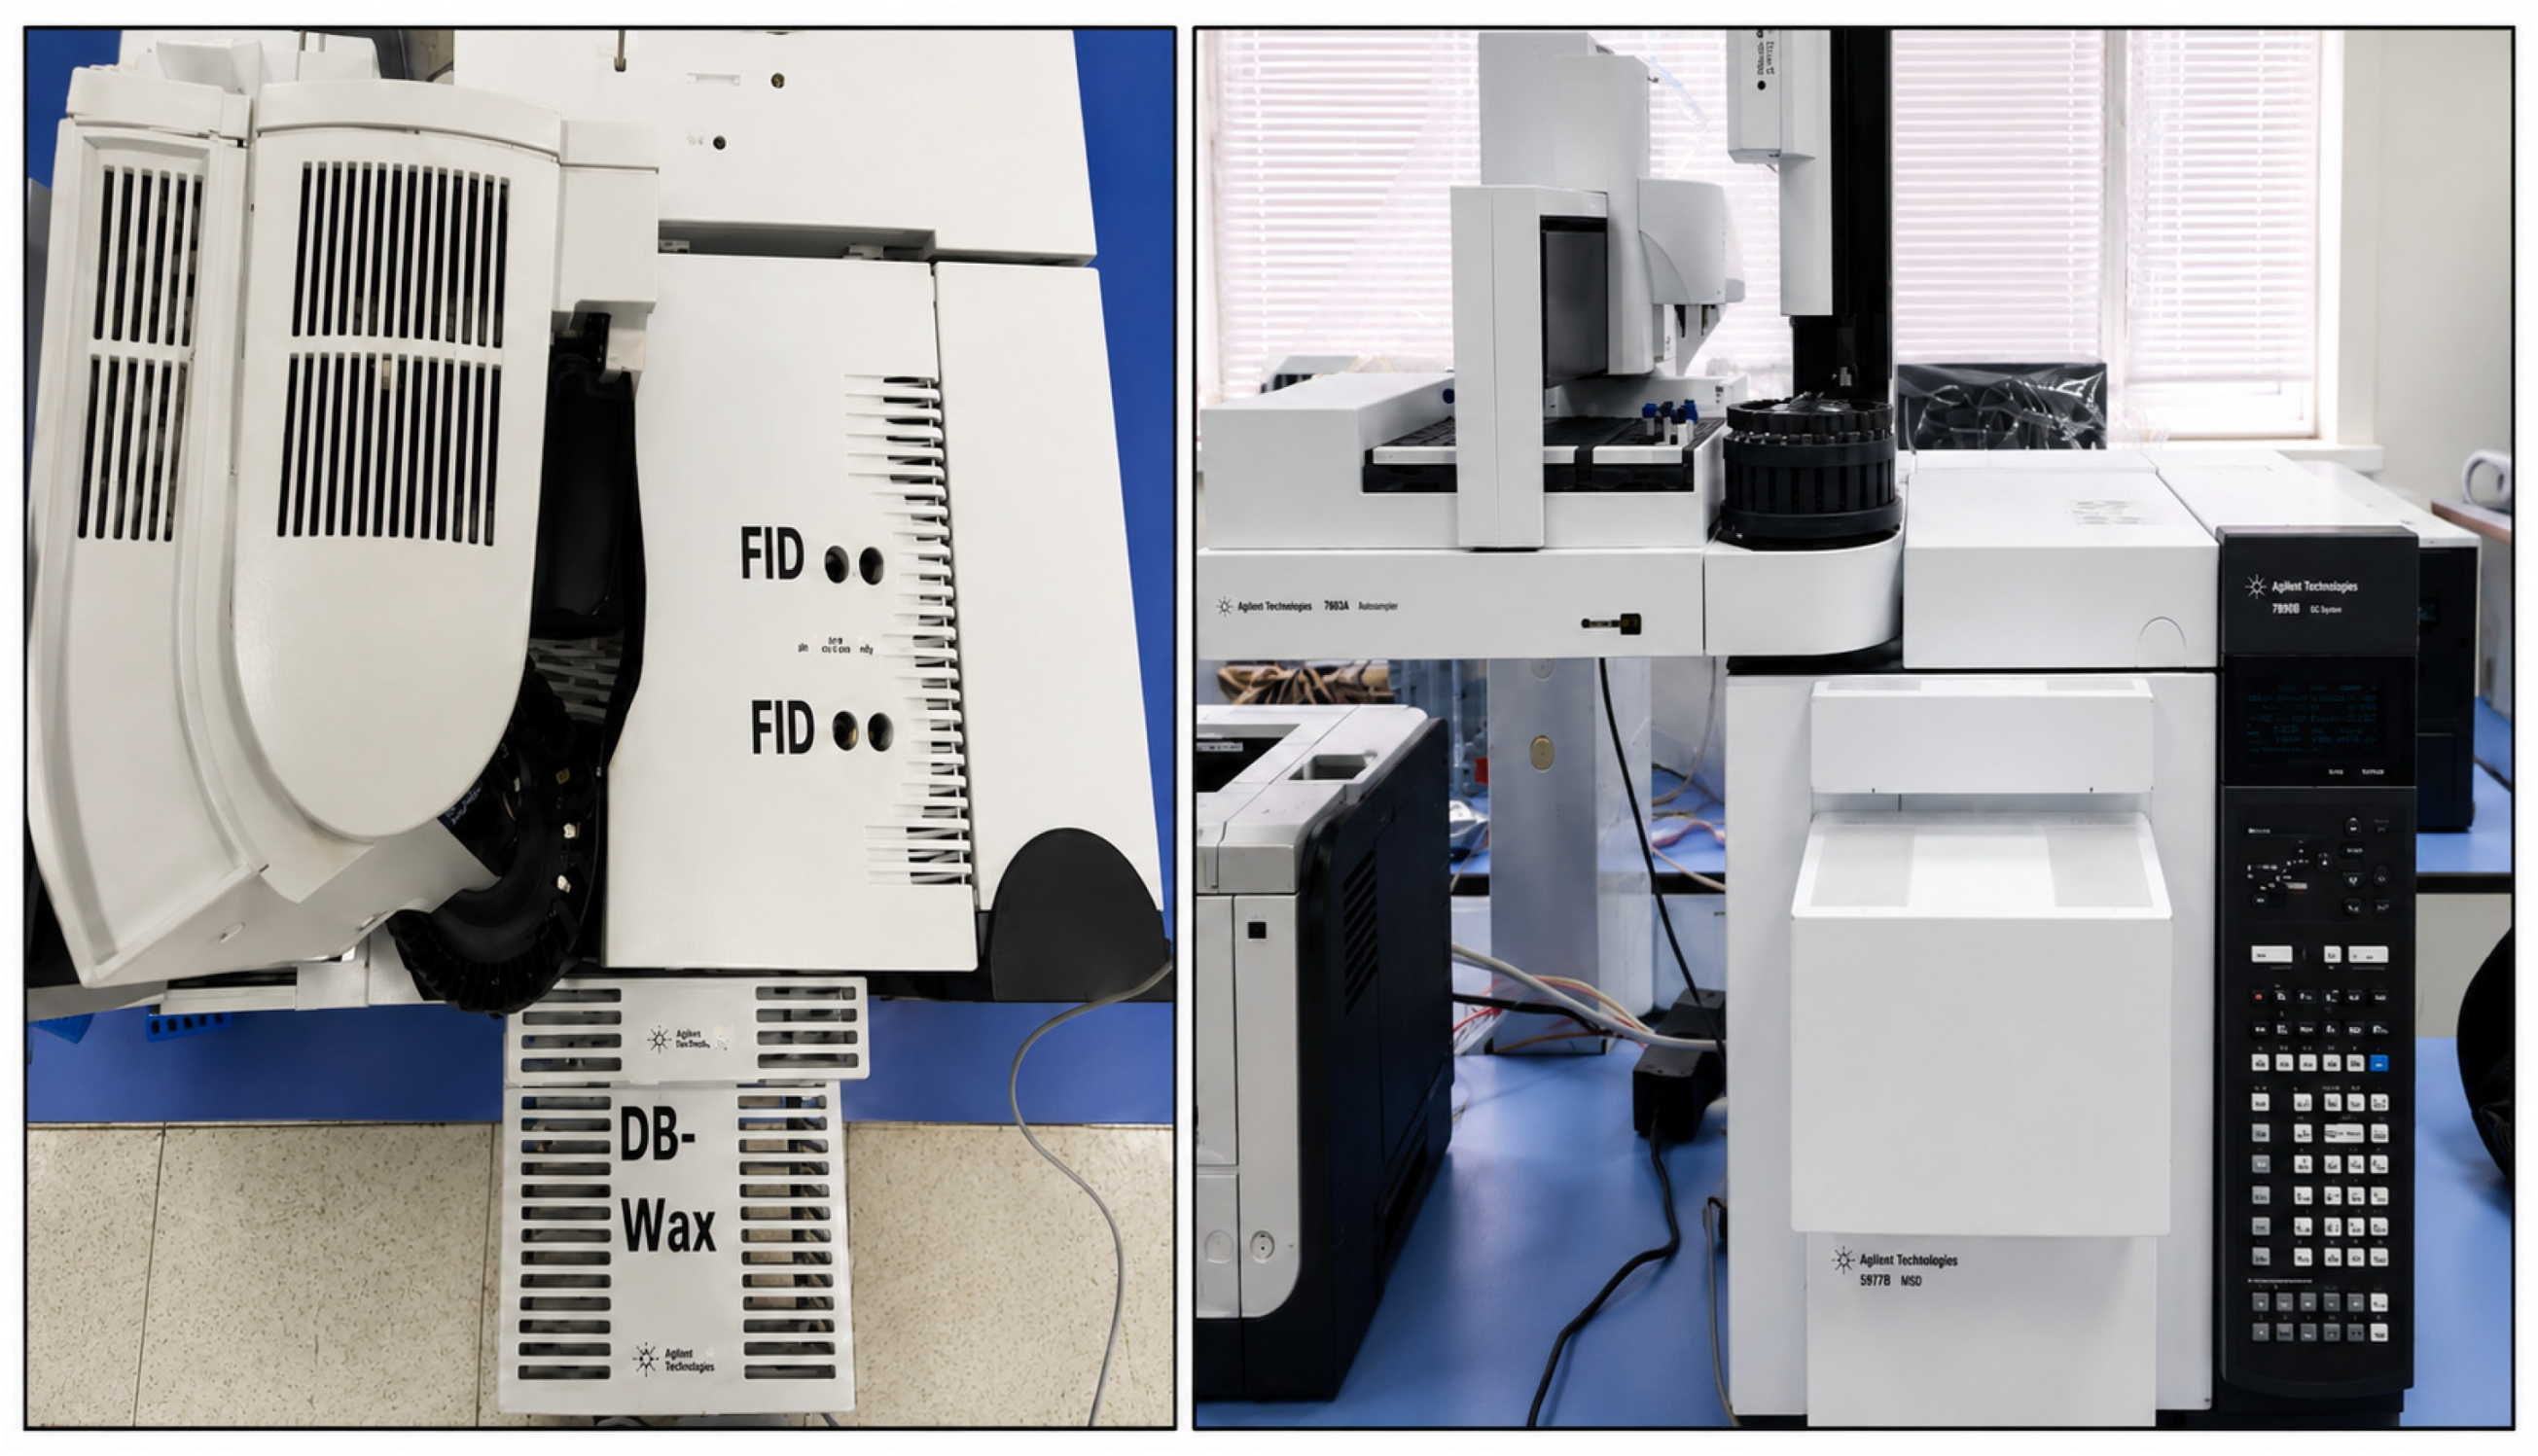
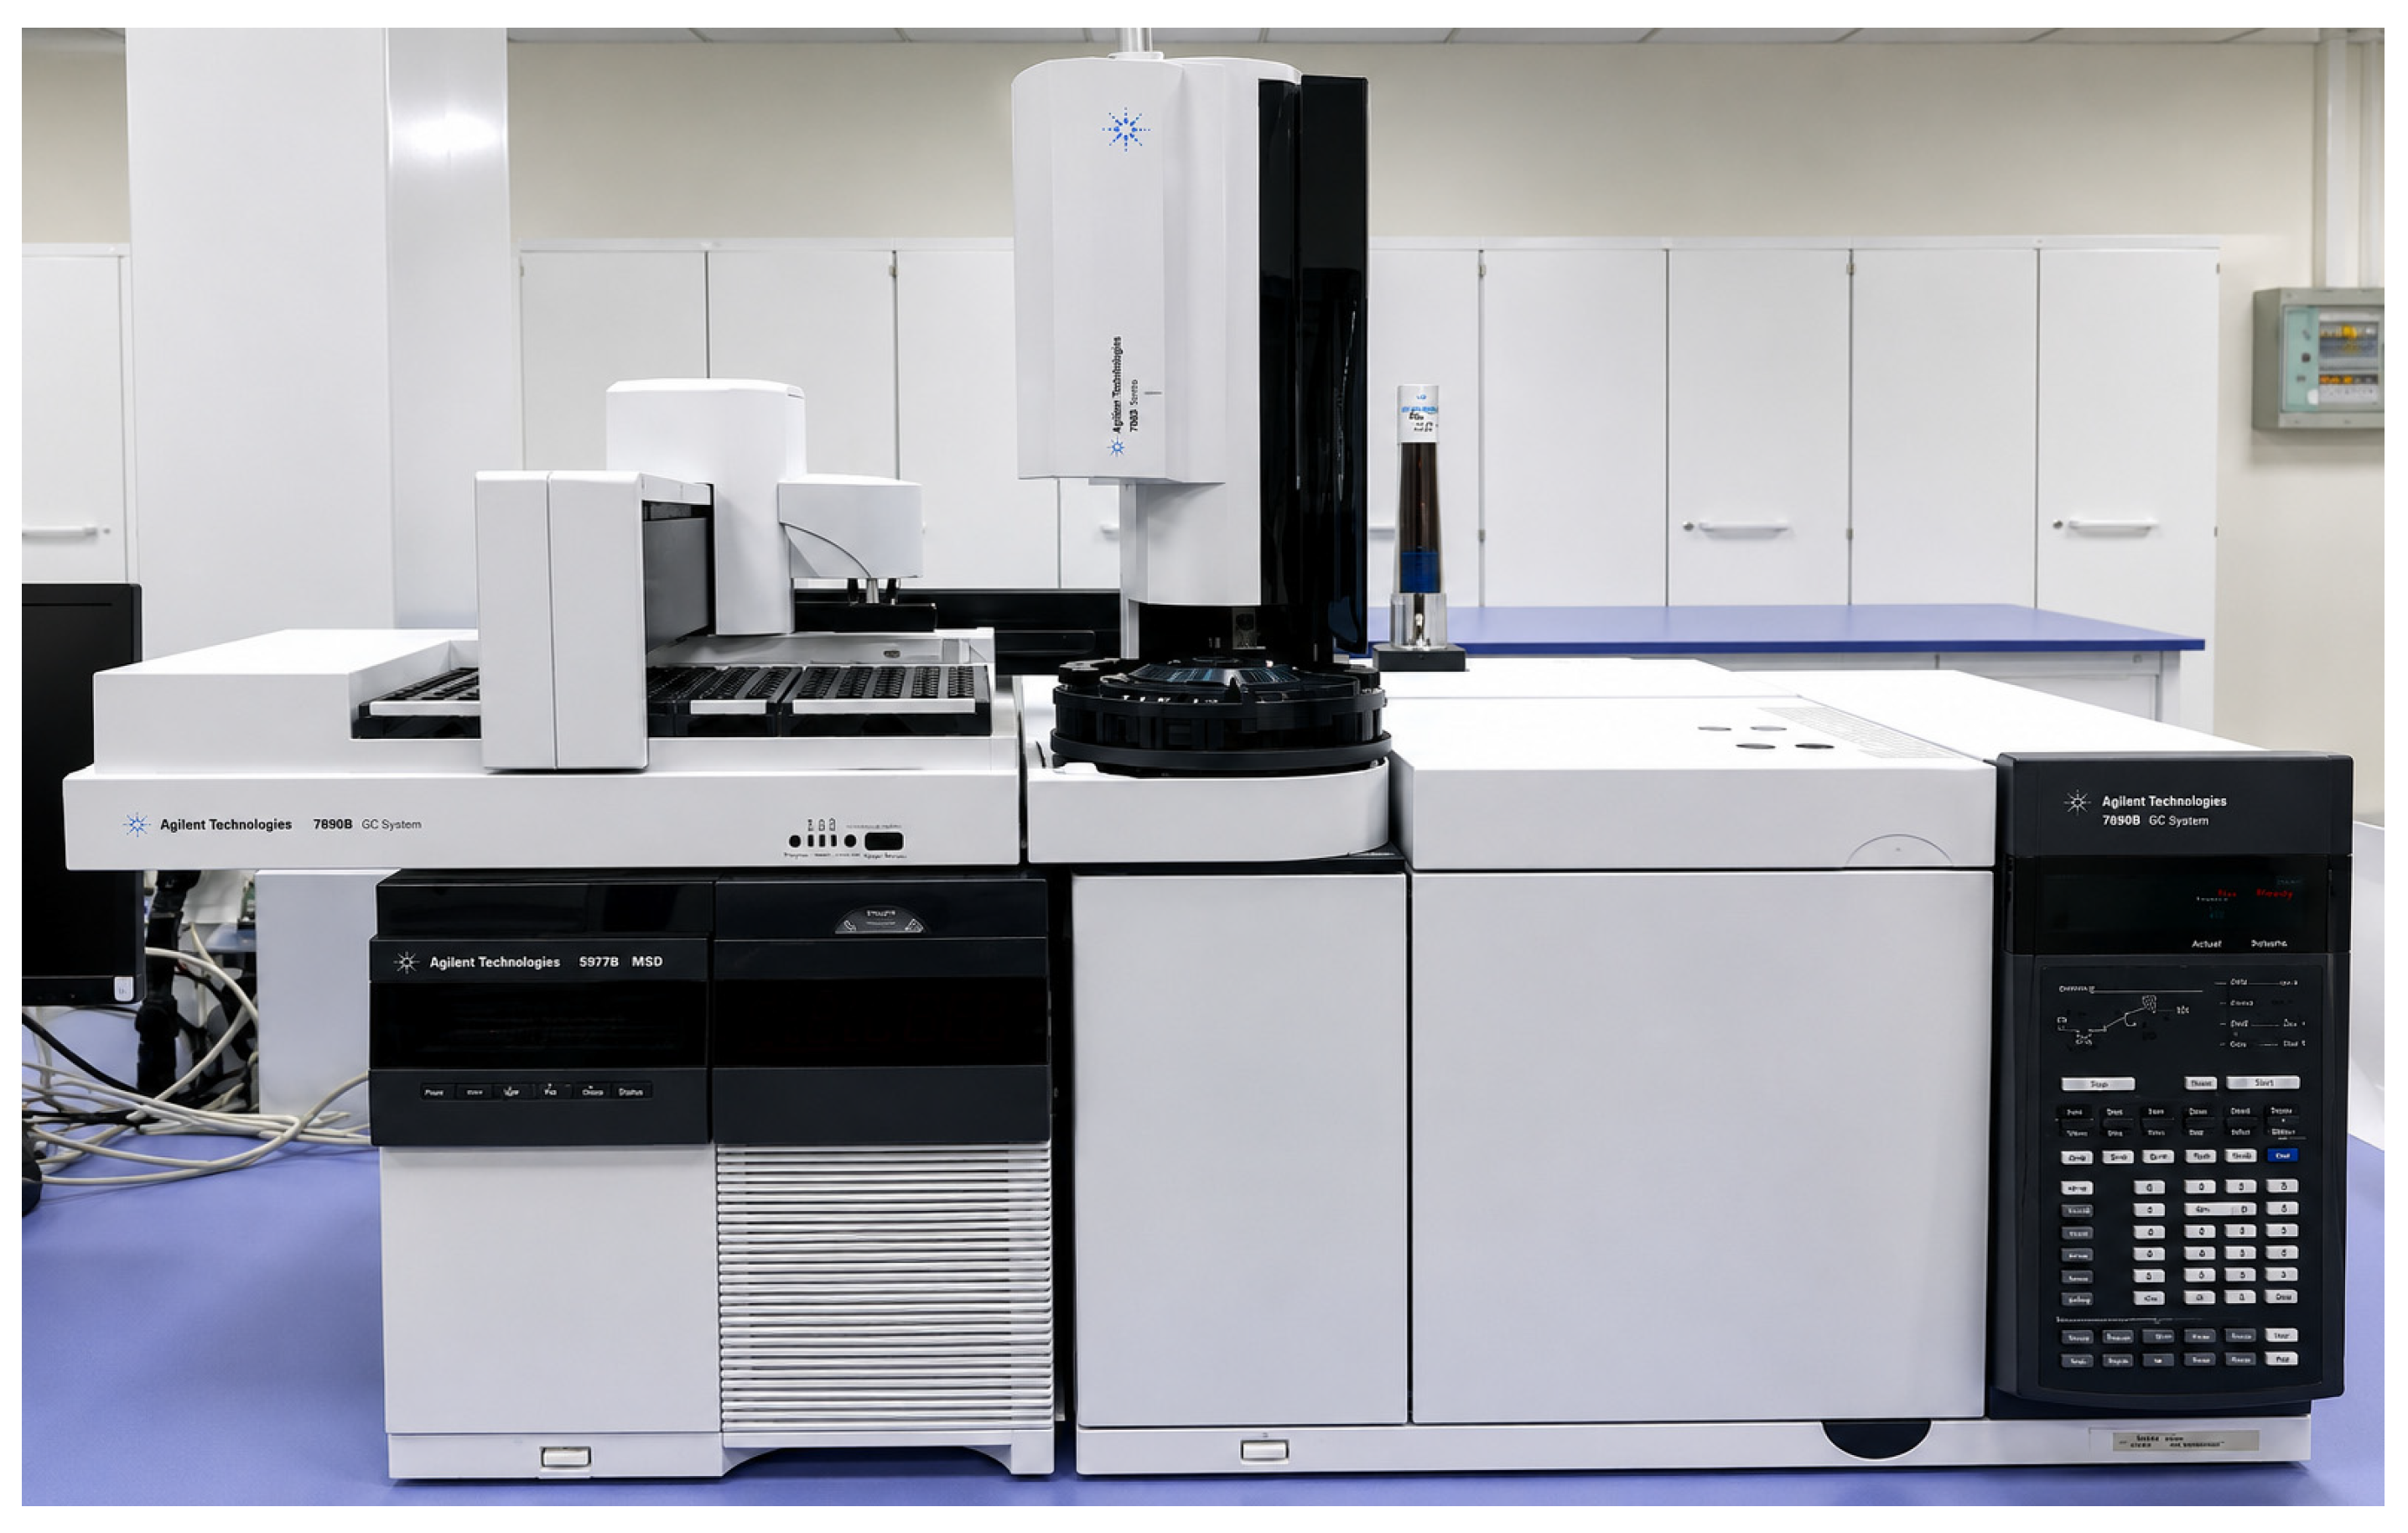
Oil Fingerprinting Analysis. Oil fingerprinting was performed using an Agilent 7890B multidimensional gas chromatograph equipped with a Low Thermal Mass Multidimensional Gas Chromatography (LTM-MD-GC) system and two flame ionization detectors (FID). This analytical configuration enabled the simultaneous detection of aliphatic and aromatic hydrocarbon fractions, providing highly informative chromatographic profiles (“oil fingerprints”) of the investigated samples. A photograph of the LTM-MD-GC analytical system is presented in Figure 4.
Figure 4.
Agilent 7890B gas chromatograph equipped with a Low Thermal Mass Multidimensional Gas Chromatography (LTM-MD-GC) system and two flame ionization detectors (FID).
Prior to quantitative and qualitative analysis, 5-methyl-3-heptanone (ISTD) was added to each oil sample as an internal standard. Chromatographic peaks were integrated based on the retention time of each component, with the internal standard peak identified by its elution between o-xylene and propylbenzene. Chromatographic data processing and peak integration were performed using OpenLab software, and the results were exported to Microsoft Excel for further analysis.
To evaluate analytical reproducibility, each sample was analyzed in duplicate using the LTM-MD-GC method. The relative analytical error did not exceed 1%, indicating high reproducibility and reliability of the obtained results.
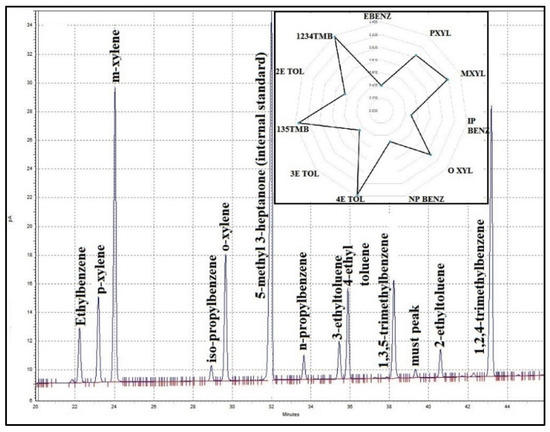
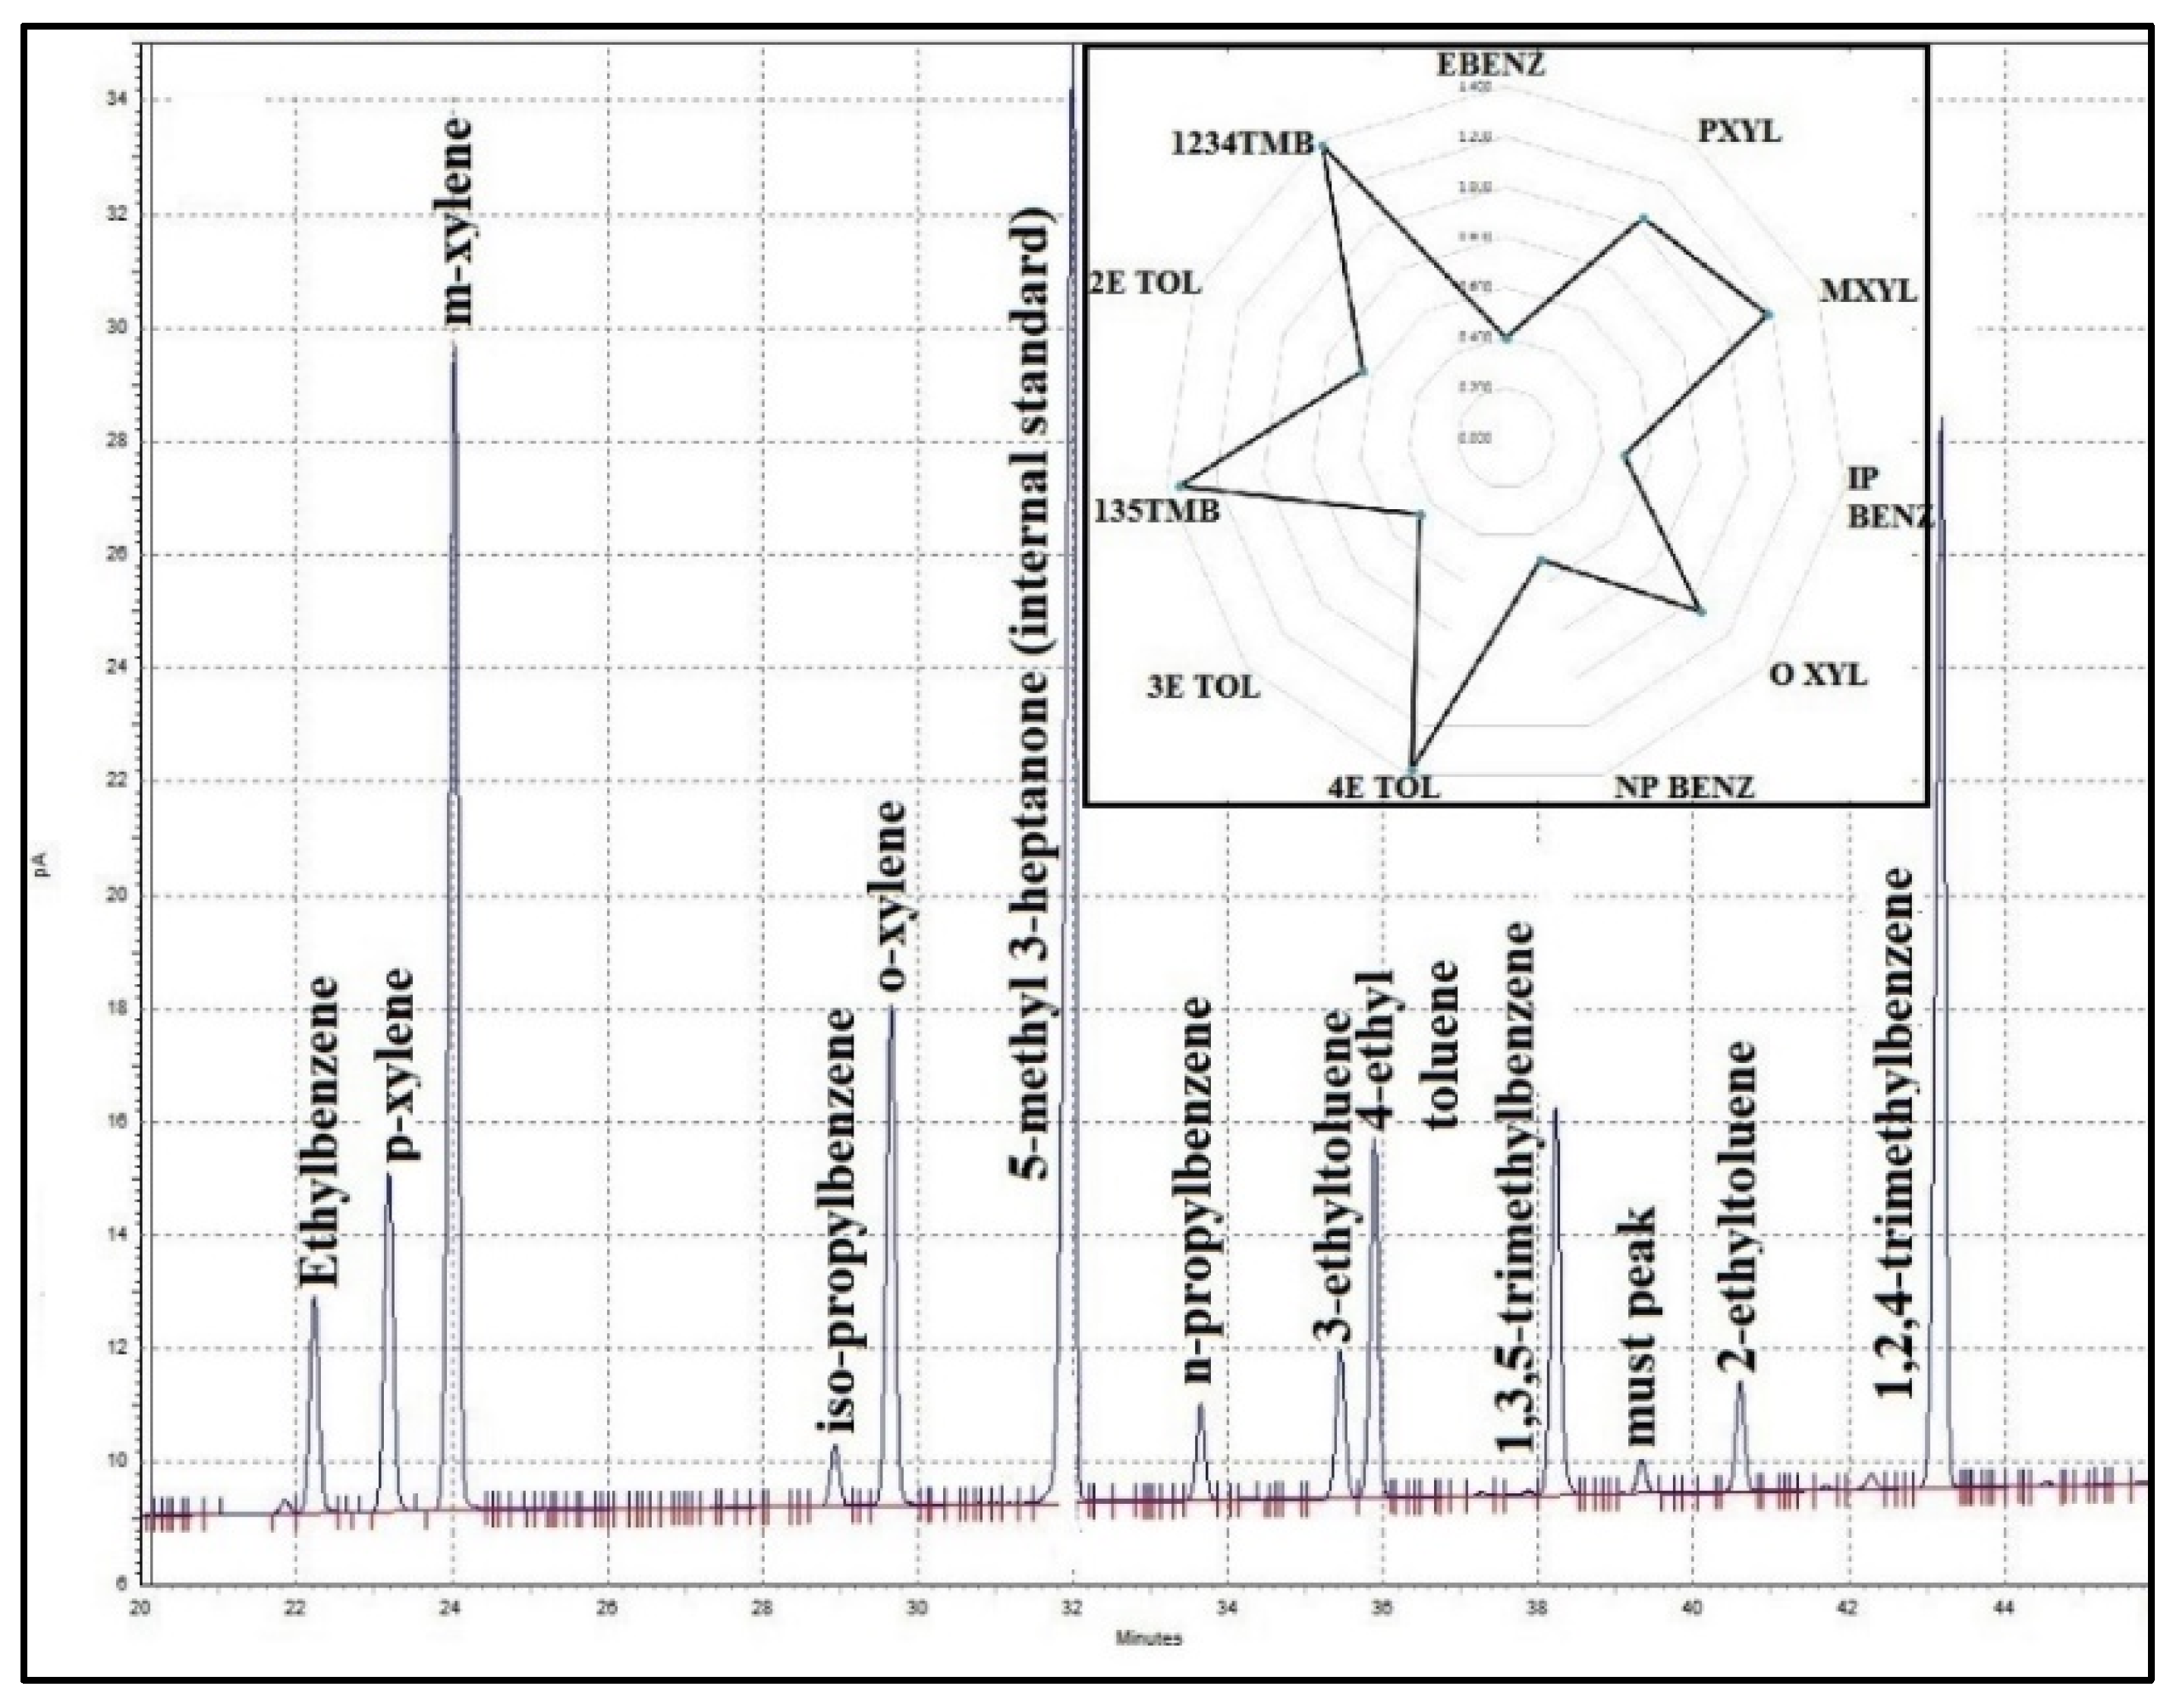
Twelve aromatic compounds eluting within the n-C8–n-C10 retention interval were selected as diagnostic parameters for oil fingerprinting (Figure 5).
Figure 5.
Twelve diagnostic aromatic compounds selected for oil fingerprinting analysis.
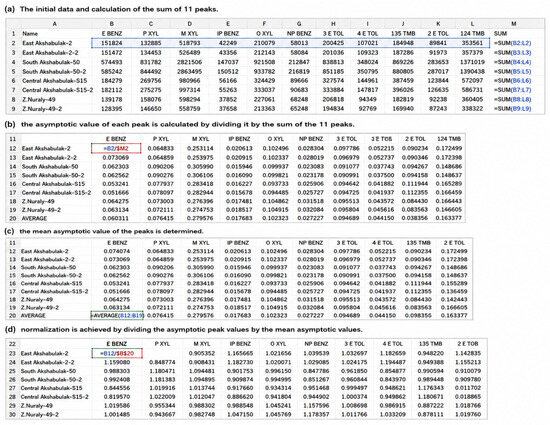
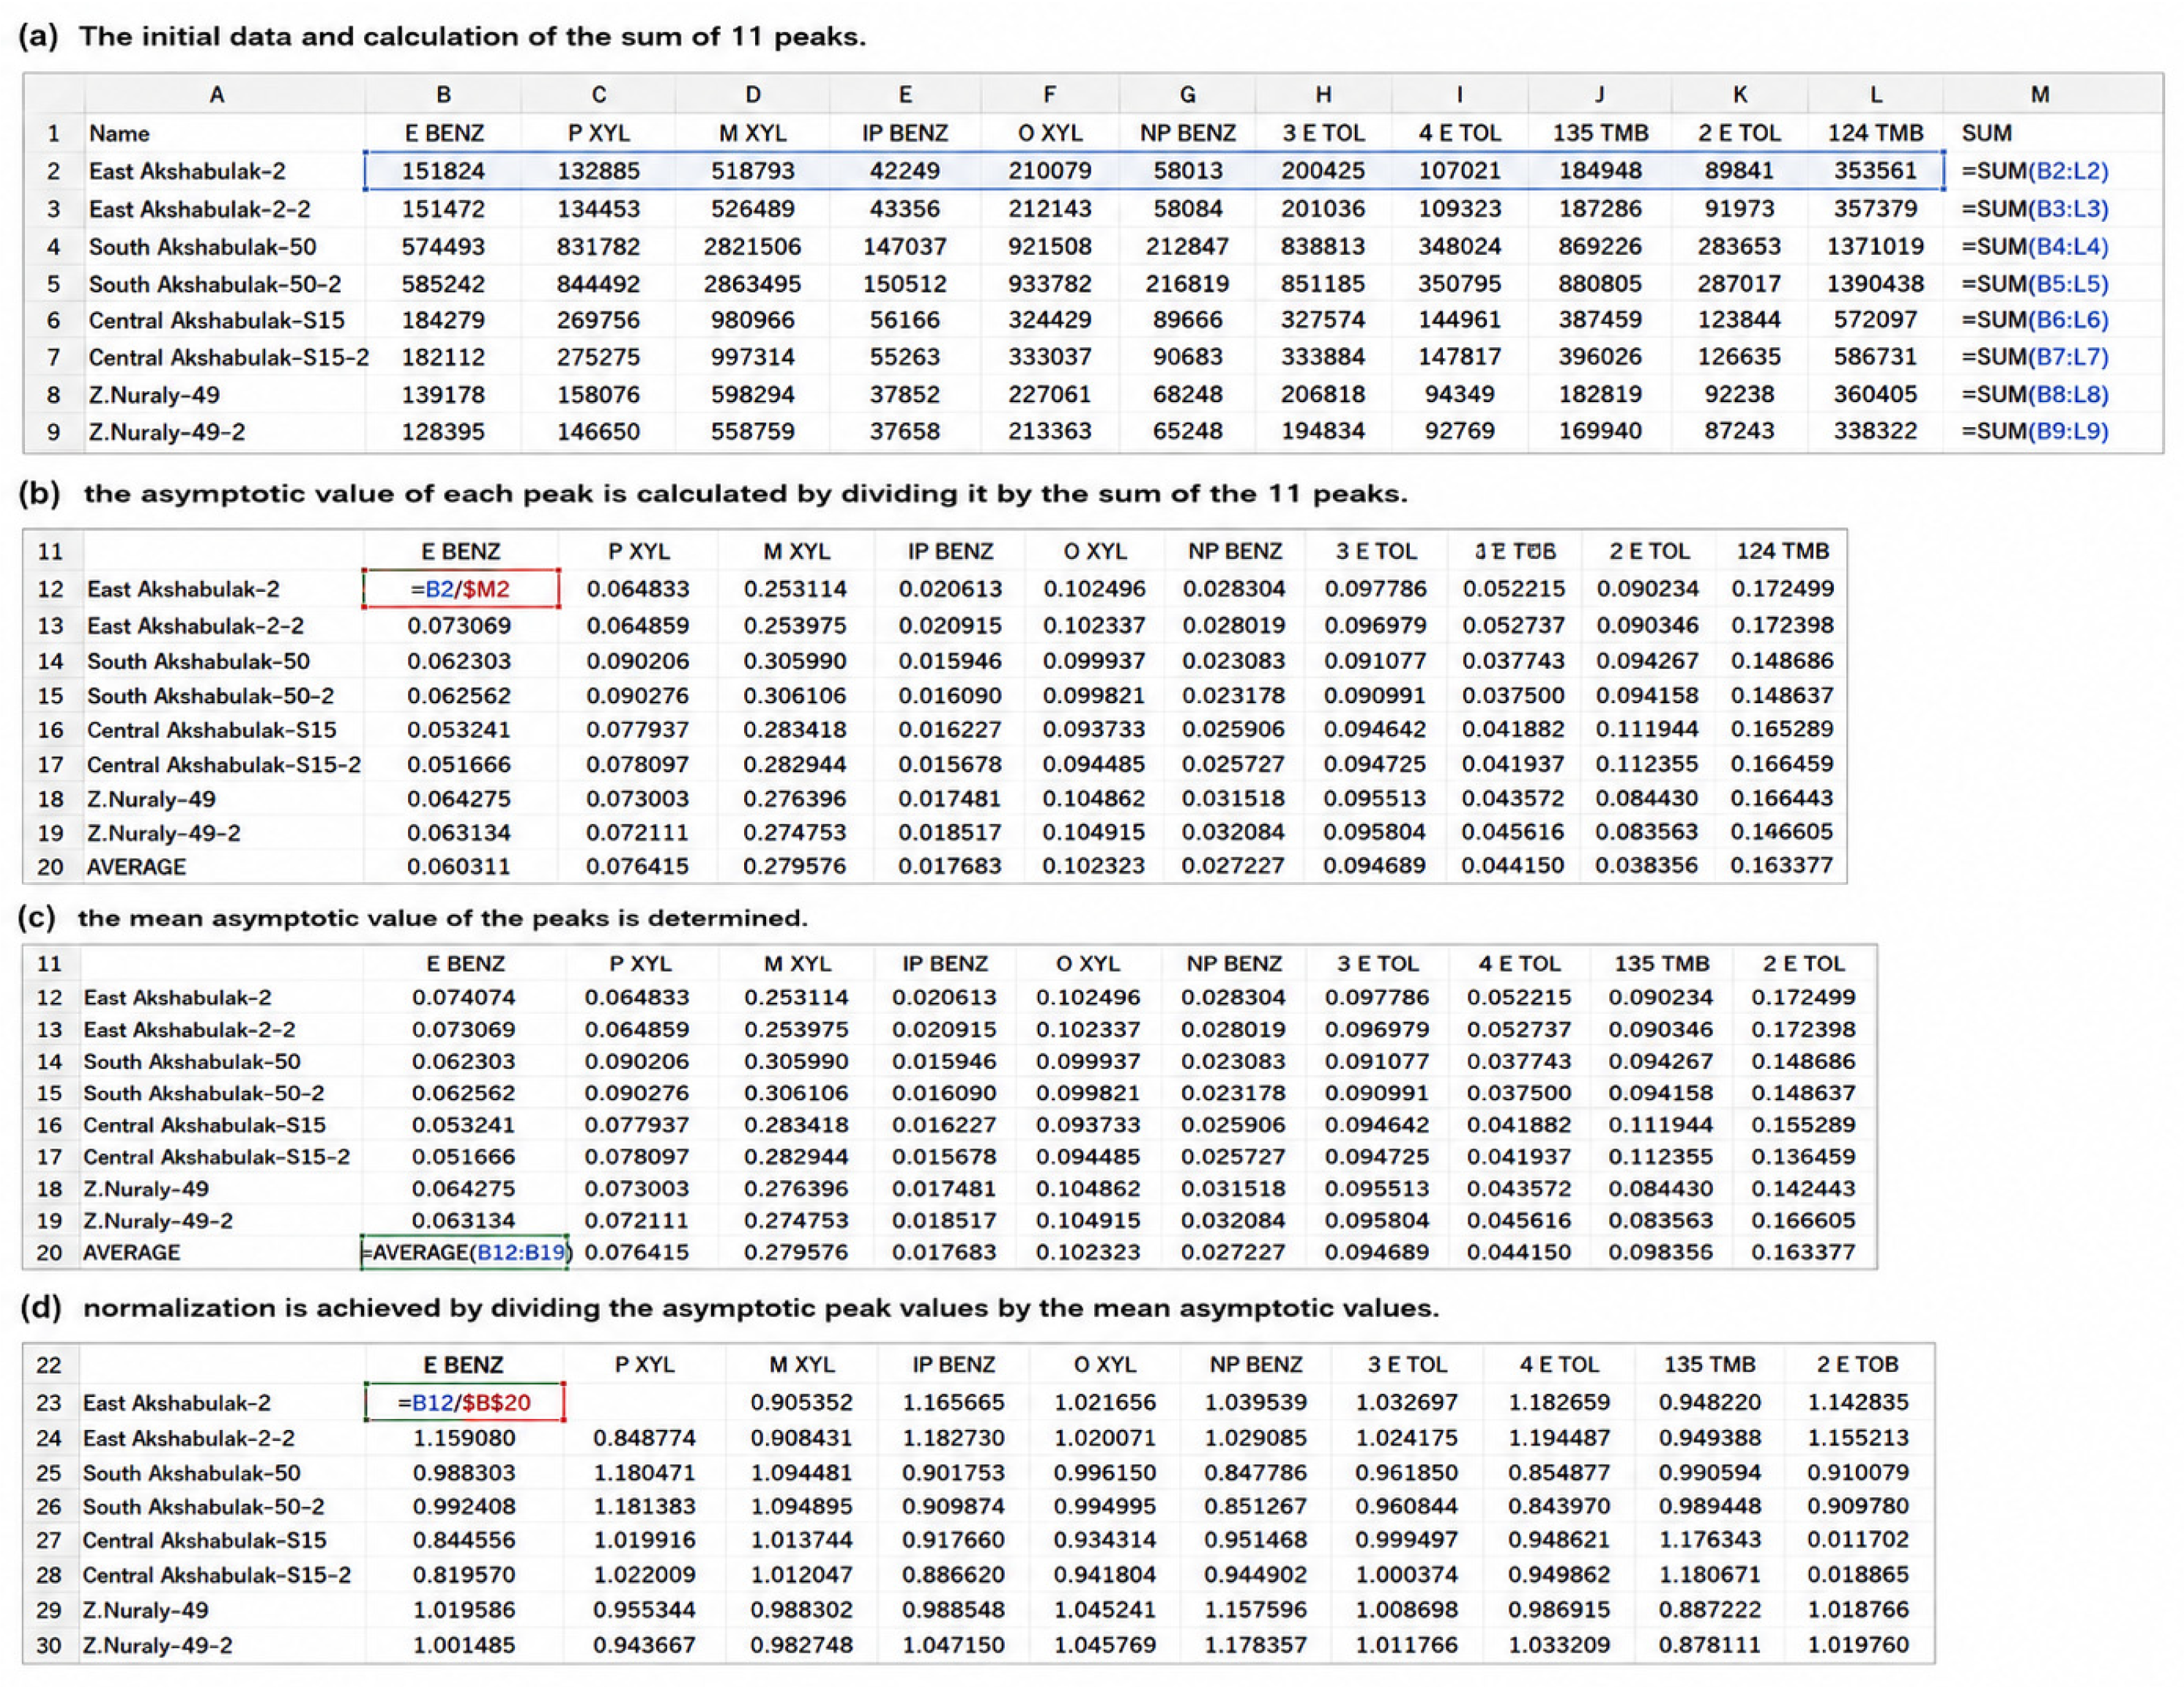
To construct star diagrams for petroleum samples, the chromatographic peak values were normalized. Normalization was performed in the following sequence in Excel (Figure 6): (a) the sum of the values of the 12 selected peaks was calculated; (b) the relative value of each peak was calculated by dividing its value by the sum of the 12 peak values; (c) the mean relative value of the peaks was determined; and (d) the normalized value of each peak was obtained by dividing its relative value by the mean relative value. Radar (star) charts were then constructed in MS Excel using the normalized geochemical parameters. This normalized fingerprinting approach enables the comparison and correlation of petroleum samples at both basin and individual-field scales without converting chromatographic peak areas into absolute concentration units (ppm or mg/L) [21,22].
Figure 6.
Method for normalizing oil and gas condensate values for constructing a star diagram.
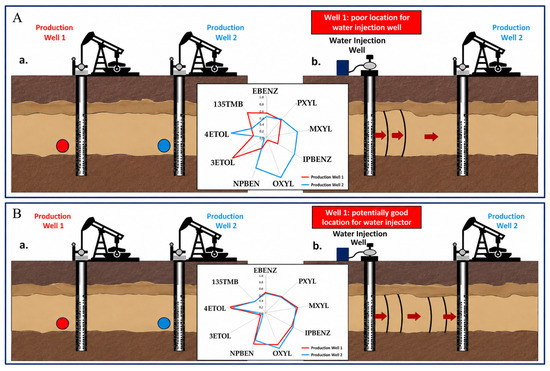
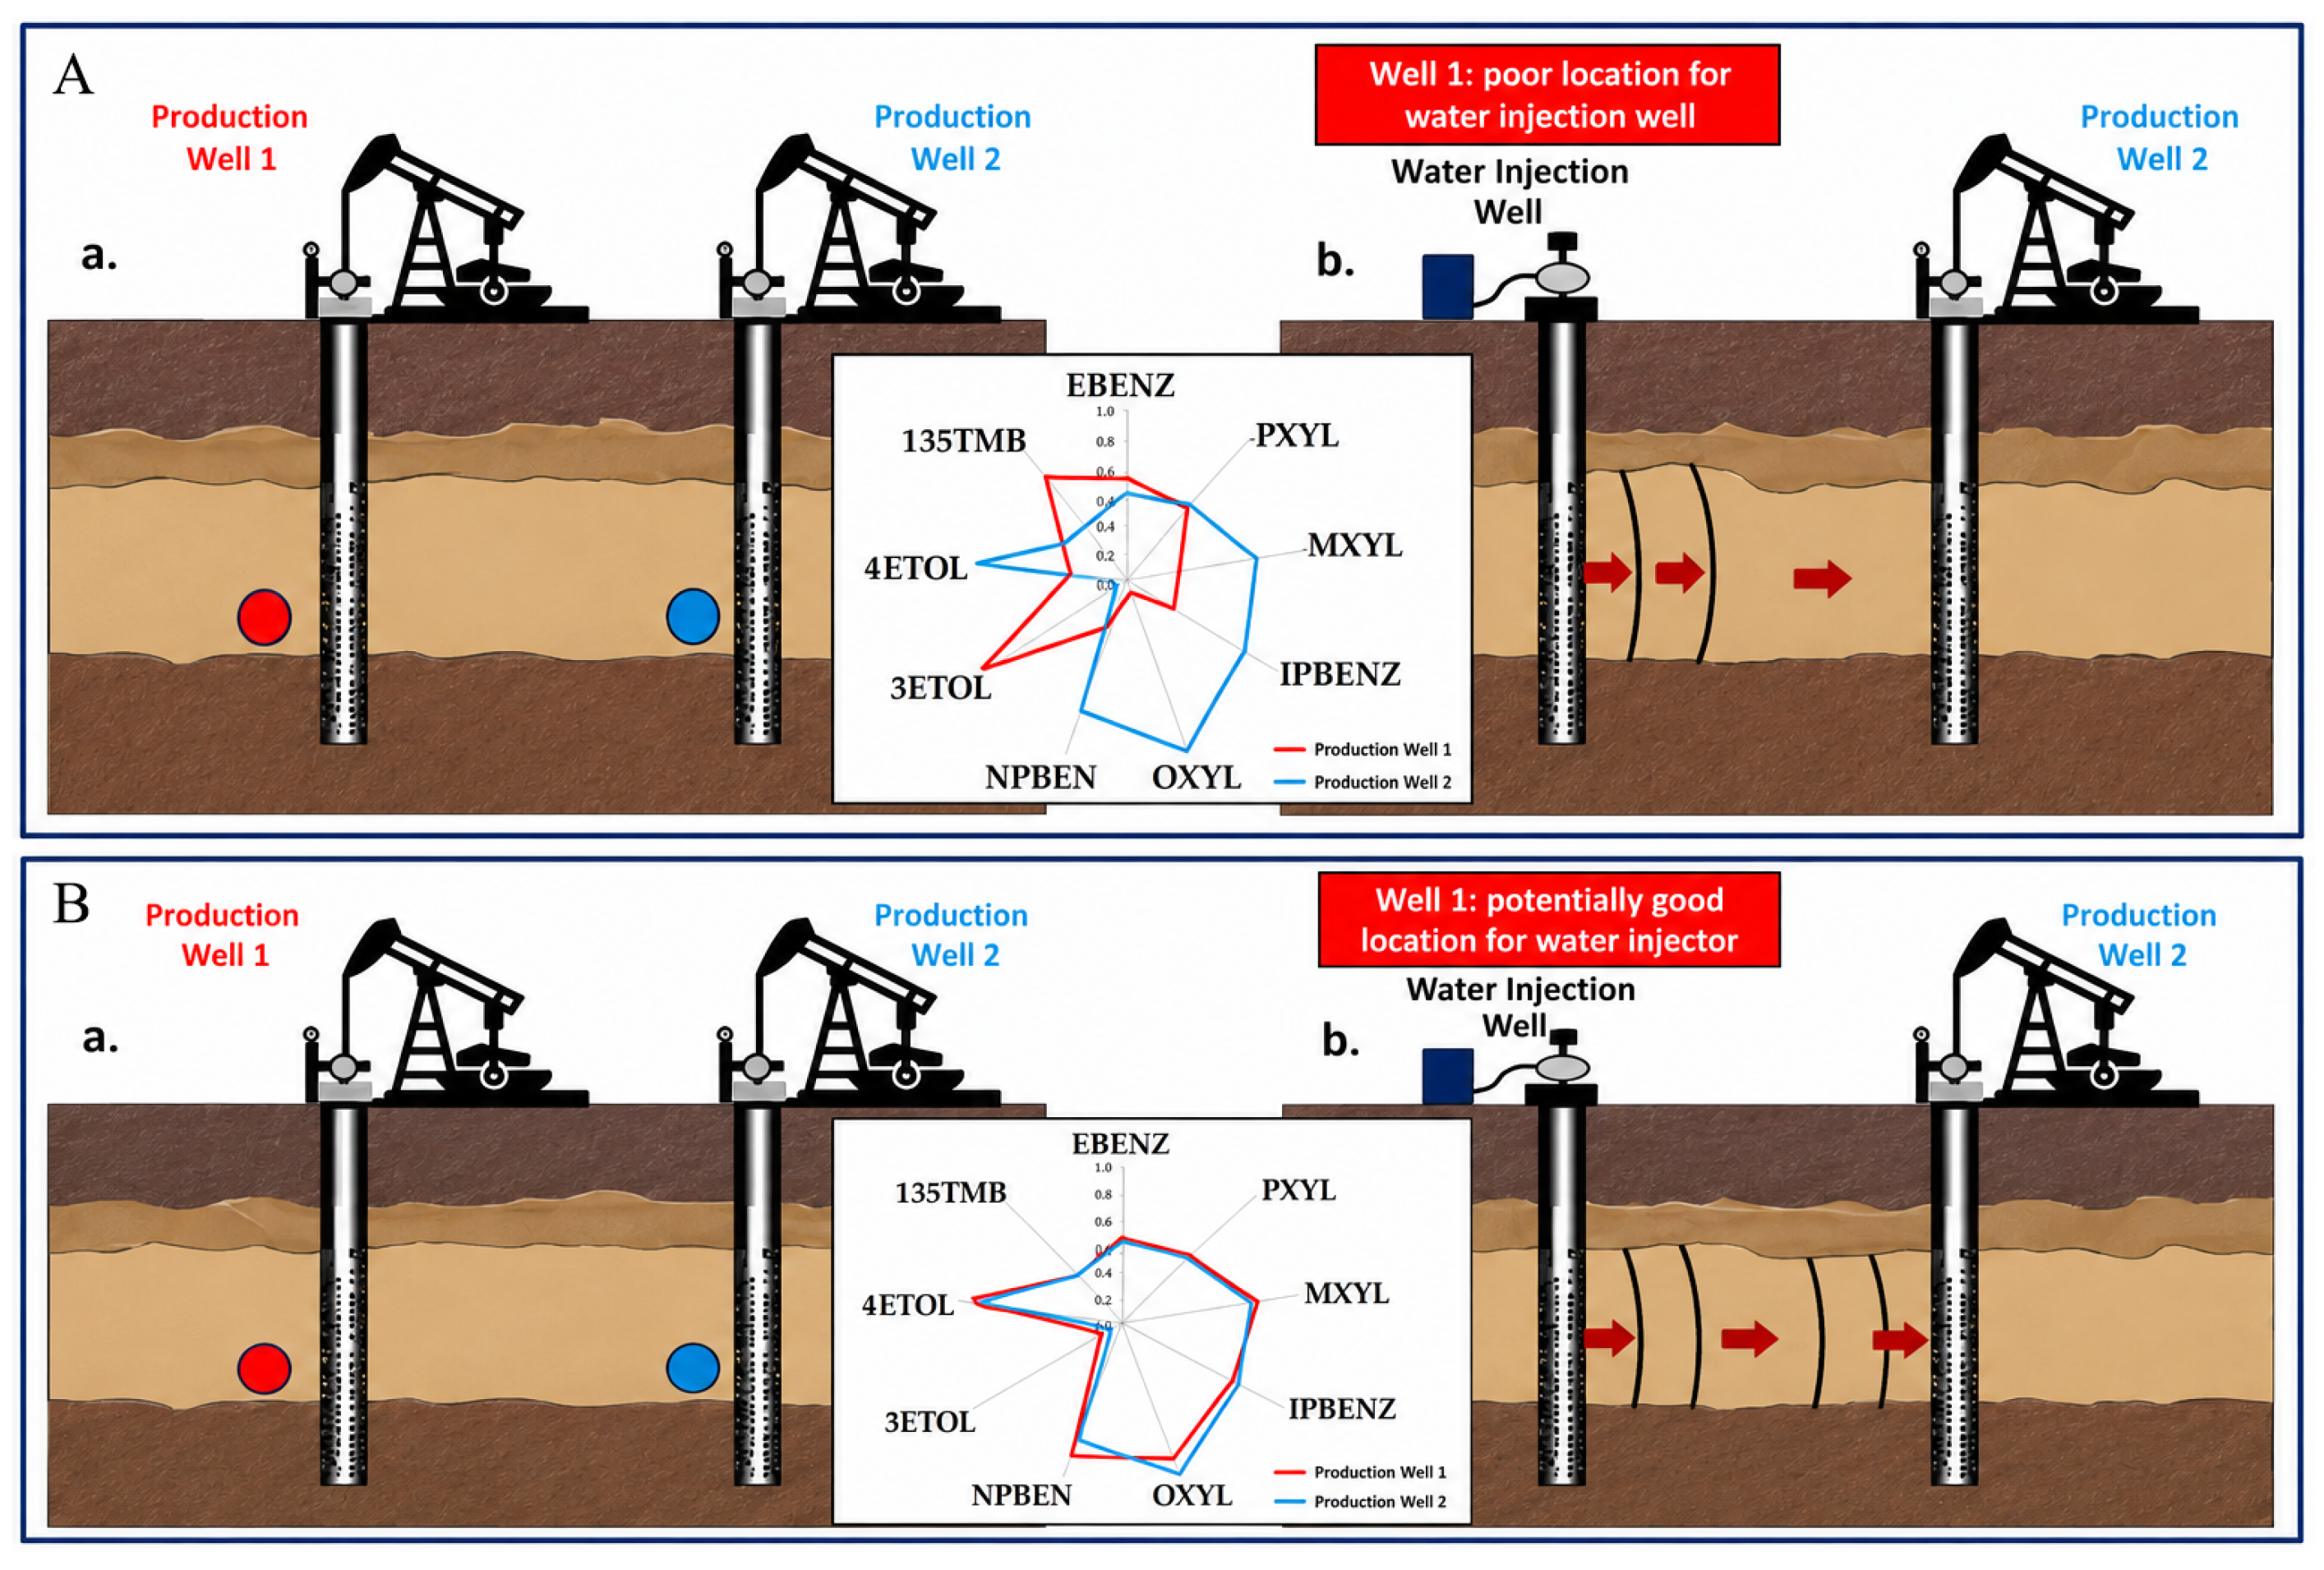
These compositional variations in 12 aromatic peaks effectively indicate reservoir continuity or compartmentalization. Concordant star plot profiles reflect reservoir continuity and high geochemical affinity, whereas profile discrepancies indicate reservoir compartmentalization mainly caused by sealing faults or lithological barriers that prevent fluid communication (Figure 7).
Figure 7.
Application of oil fingerprinting to evaluate hydrodynamic connectivity between oil and gas condensate samples (A,B): (a) comparison of oil fingerprints and spatial relationship between the investigated wells; (b) oil fingerprinting results and schematic representation of hydrodynamic connectivity between the investigated wells. Red arrows indicate the inferred direction of reservoir connectivity.
However, in relatively shallow reservoirs, biodegradation may alter the distribution of hydrocarbon compounds, potentially reducing the diagnostic reliability of oil fingerprinting.
The retention time of each compound in the chromatographic system is governed by its physicochemical properties, including volatility, boiling point, molecular structure, and interactions with the stationary phase. In general, more volatile compounds tend to elute earlier, whereas less volatile compounds exhibit longer retention times.
GC–MS Biomarker Analysis. Biomarker analysis of the oil samples was performed using gas chromatography–mass spectrometry (GC–MS) on an Agilent 7890B gas chromatograph equipped with a mass spectrometric detector operating in selected ion monitoring (SIM) mode (Figure 8).
Figure 8.
Agilent 7890B gas chromatograph equipped with a mass spectrometric detector operating in selected ion monitoring (SIM).
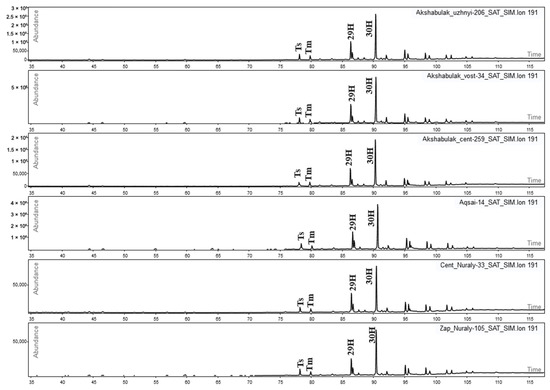
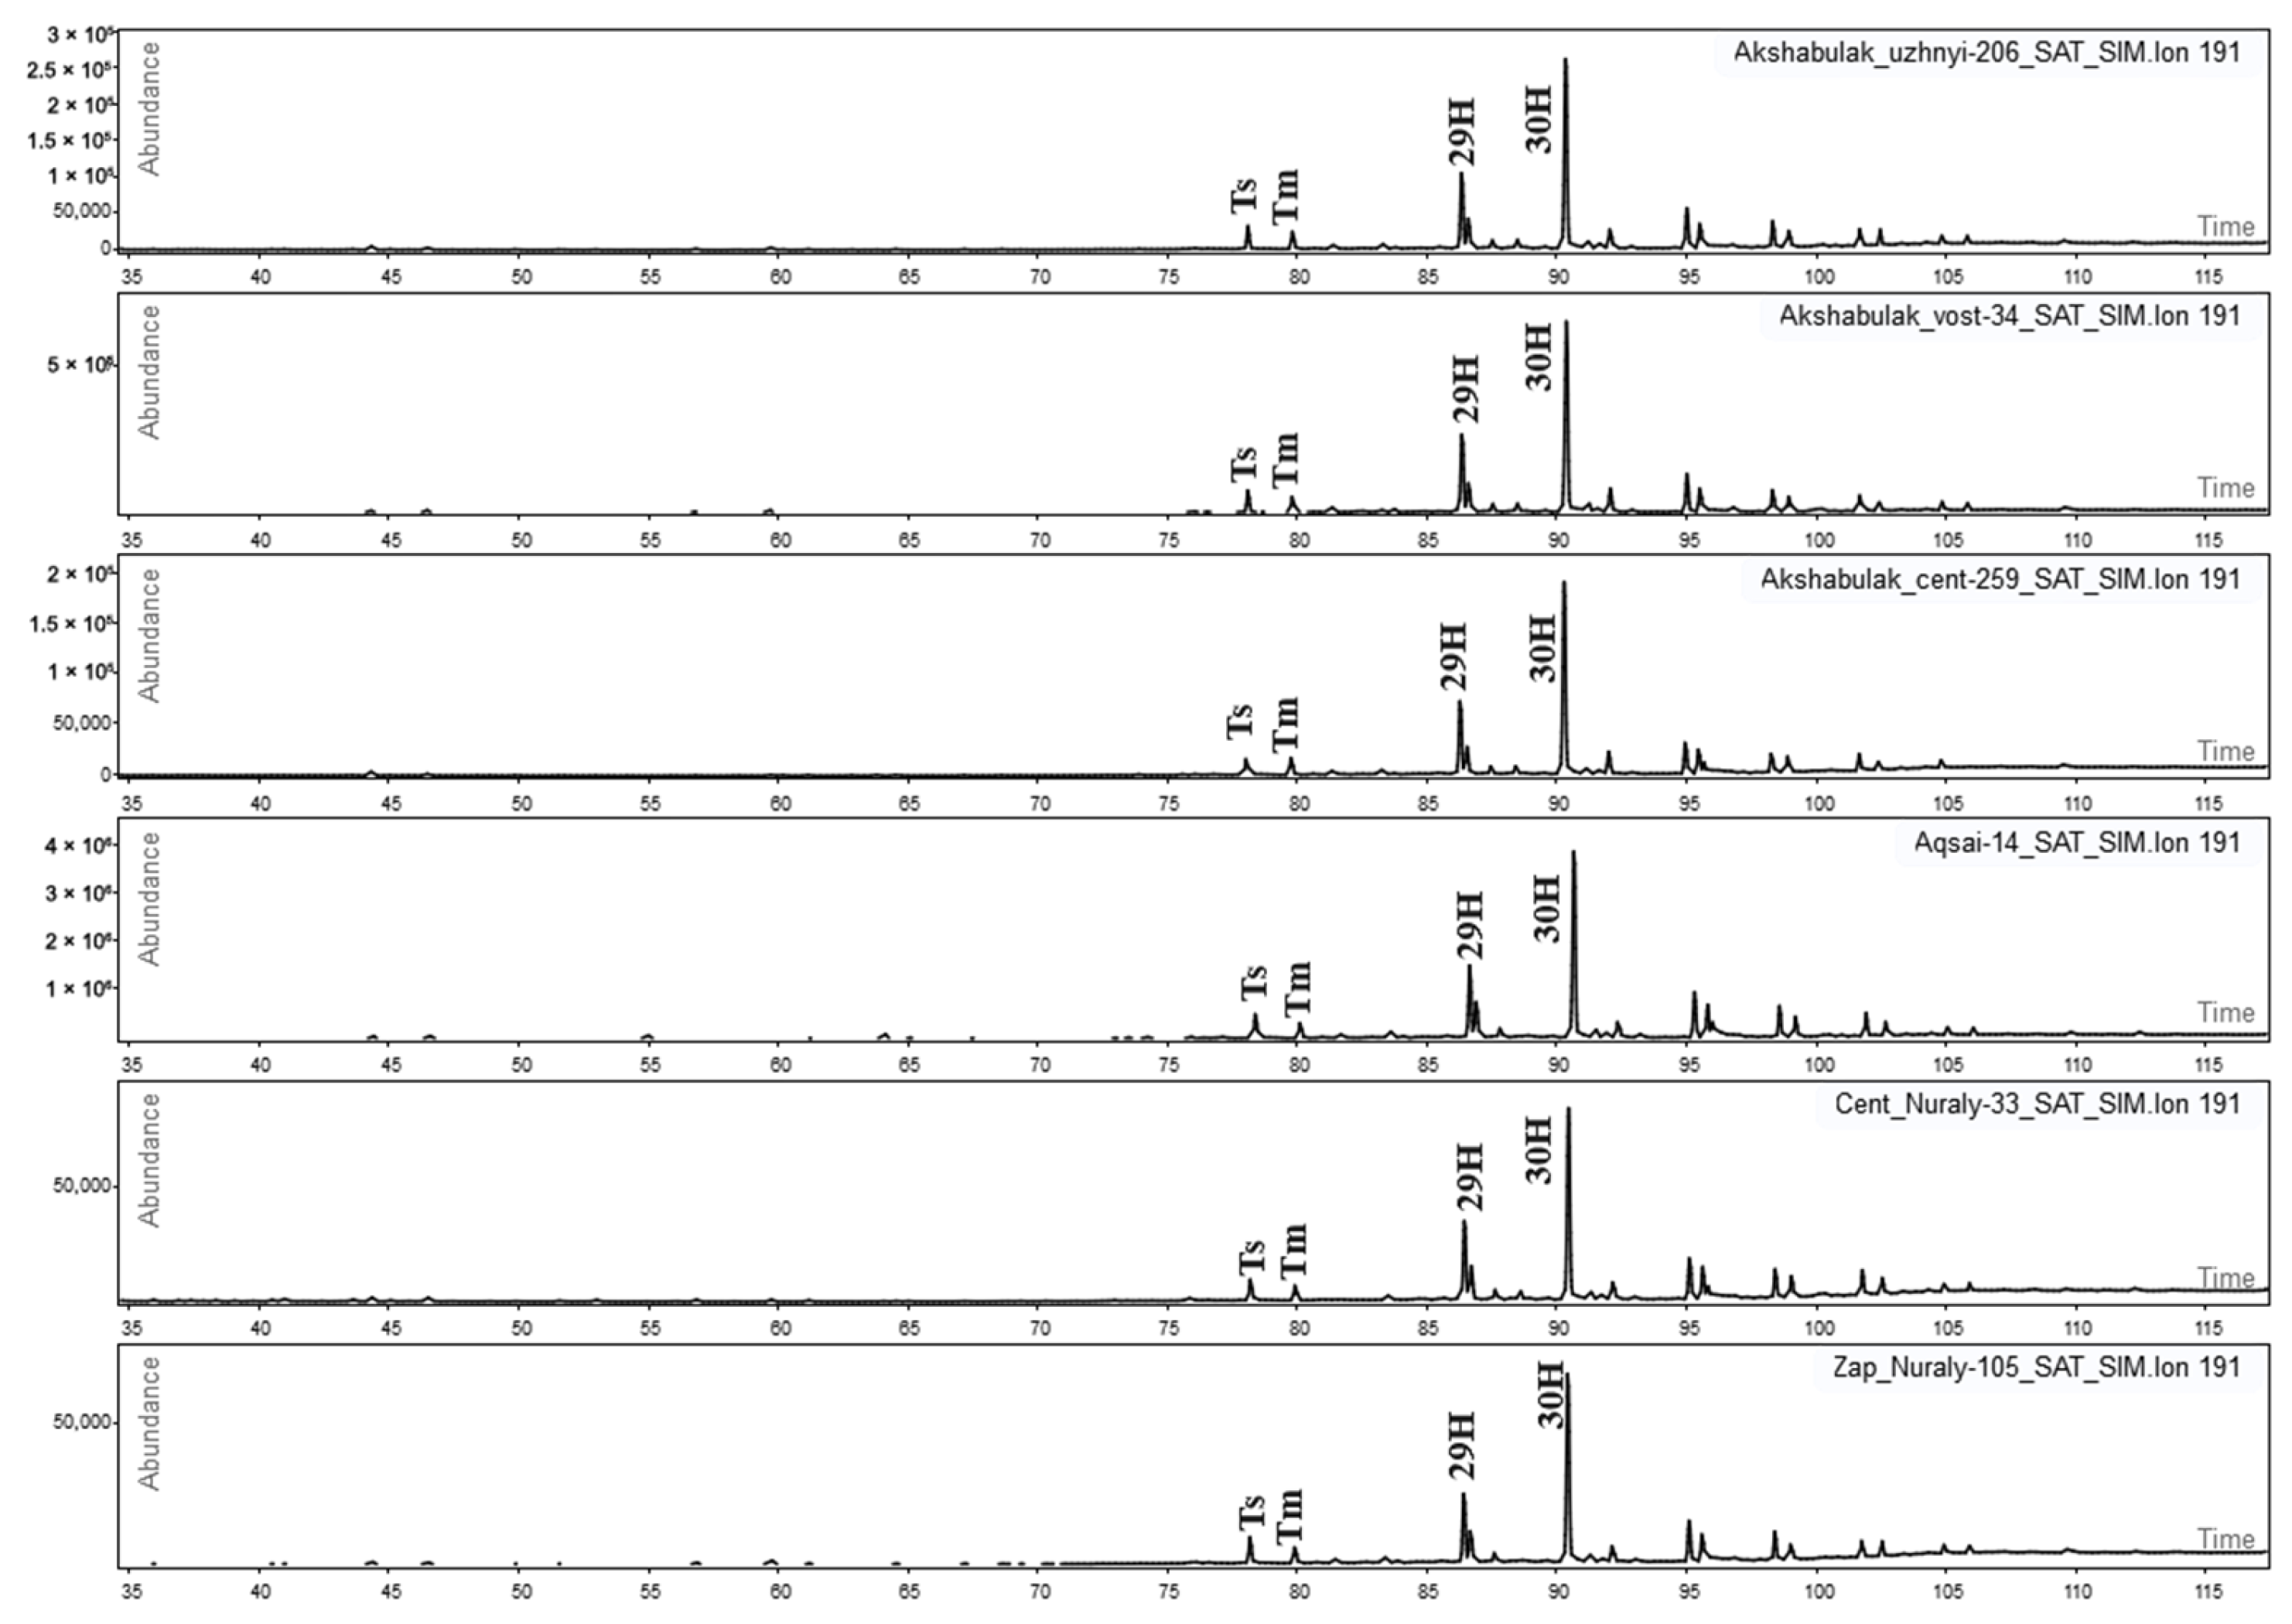
For the analysis of the saturated hydrocarbon fraction, the diagnostic ions m/z 57, 191, 217, and 218 were monitored, corresponding to n-alkanes and isoprenoids, terpanes (Figure 9), steranes, and diasteranes, respectively.
Figure 9.
Mass fragmentograms of terpanes in representative oils from the South Turgay Basin fields based on the m/z 191 ion [27,28].
These biomarker groups were selected because they provide complementary geochemical information. Terpanes (Figure 9) are widely used to evaluate depositional environment, source-rock lithology, and migration history, whereas steranes primarily reflect the origin of organic matter and thermal maturity. Aromatic maturity parameters provide an additional independent assessment of thermal evolution and are less affected by certain secondary alteration processes [13,16].
The aromatic hydrocarbon fraction was analyzed by monitoring the diagnostic ions m/z 178, 184, and 192, corresponding to phenanthrenes, dibenzothiophenes, and methylphenanthrenes, respectively.
Identification of n-alkanes, isoprenoid hydrocarbons, terpanes, steranes, diasteranes, and aromatic biomarkers was performed based on diagnostic mass fragments, retention times, published reference data, and comparison of the acquired mass spectra with library spectra [3,20].
For geochemical interpretation, the distributions of terpanes, steranes, diasteranes, methyldibenzothiophenes, and methylphenanthrenes were evaluated. The thermal maturity of the oils was assessed using sterane and terpane isomerization parameters, including the ratios C29 ααα 20S/(20S + 20R), C29 ββ/(ββ + αα), and Ts/Tm, together with the aromatic maturity indices MPI-1 and 4MDBT/1MDBT [13,16].
Depositional conditions and the lithological characteristics of the source rocks were evaluated using the distributions of sterane and terpane homologues, including the ratios C27–C28–C29 steranes, C29 hopane/C30 hopane, C24 tetracyclic terpane/26TT (C24Tet/26TT), and 23TT/24TT. The resulting geochemical data were used to determine the genetic affinity of the oils, reconstruct the depositional conditions of organic matter, evaluate thermal maturity, identify hydrocarbon migration patterns, and assess the potential mixing of petroleum fluids [9,13].
The principal petroleum source rocks of the South Turgay Basin are considered to be predominantly Jurassic lacustrine mudstones [31]. Their depositional characteristics provide an important geological and geochemical framework for interpreting the biomarker distributions observed in the investigated oils.
Statistical Analysis. For the assessment of geochemical similarity and genetic differentiation of the investigated oils, multivariate statistical techniques, including Principal Component Analysis (PCA) and hierarchical cluster analysis using Ward’s linkage method, were employed.
Statistical analyses were performed using a comprehensive dataset of geochemical parameters representing biomarker composition, thermal maturity, depositional environment, source organic matter characteristics, and the distribution of aromatic compounds. Multivariate statistical methods, including principal component analysis (PCA) and Ward’s hierarchical clustering, were applied to evaluate oil–oil relationships, biomarker variability, and geochemical heterogeneity within the investigated dataset.
Prior to multivariate analysis, all variables were standardized using Z-score transformation (autoscaling), whereby each variable was mean-centered and scaled to its standard deviation. This procedure ensured the comparability of variables with different numerical ranges and measurement units.
Principal Component Analysis (PCA) was applied to reduce the dimensionality of the dataset, identify the principal factors controlling geochemical variability, and visualize the distribution of the investigated oil samples within the principal component space.
Geochemically similar oil groups were identified using hierarchical agglomerative clustering with Ward’s linkage and Euclidean distance as the similarity metric. The clustering results were presented as dendrograms illustrating the degree of geochemical similarity among the investigated oils.
The multivariate statistical analyses were performed separately for the oil fingerprint dataset and the biomarker dataset. The oil fingerprint dataset primarily reflected compositional similarities among crude oils based on aromatic hydrocarbon distributions, whereas the biomarker dataset provided information on source rock characteristics, depositional environment, thermal maturity, and migration history. The results obtained from PCA and hierarchical cluster analysis were subsequently integrated and compared to evaluate the consistency between both datasets. Agreement between the independent datasets was considered to provide stronger evidence for genetic relationships among the investigated oils, whereas discrepancies were interpreted as possible indicators of secondary geological processes, including reservoir compartmentalization, hydrocarbon migration, and oil mixing.
The quality of the dataset was initially assessed by identifying potential outliers using boxplots and the results of the principal component analysis. Samples falling within the confidence limits and showing no significant influence on the overall data structure were retained in the final dataset. Consequently, no samples were excluded from the statistical analysis.
The integrated use of oil fingerprinting, biomarker geochemistry, and multivariate statistical analysis enabled discrimination between genetic and secondary controls on crude oil composition and provided a robust framework for evaluating reservoir connectivity within the South Turgay Basin.
3. Results
3.1. Nuraly Field
Oil fingerprinting. For the correlation of oils from productive reservoirs, the ratios of 12 aromatic peaks derived from LTM chromatograms were used. Based on these parameters, star diagrams were constructed, reflecting similarities and differences between fluid compositions. In the present study, a preliminary comparison of the averaged aromatic component values for oils from the Nuraly field was conducted. Further fingerprinting interpretation was carried out using three complementary approaches: star diagrams, Ward dendrogram analysis, and principal component analysis (PCA).
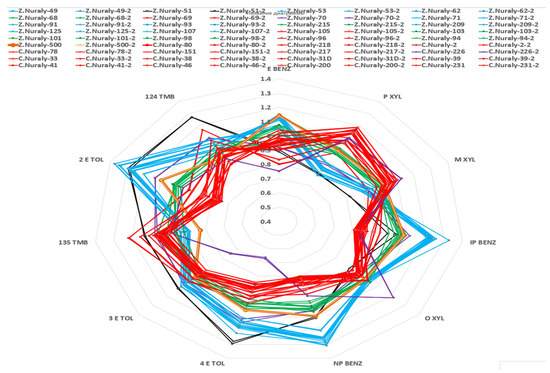
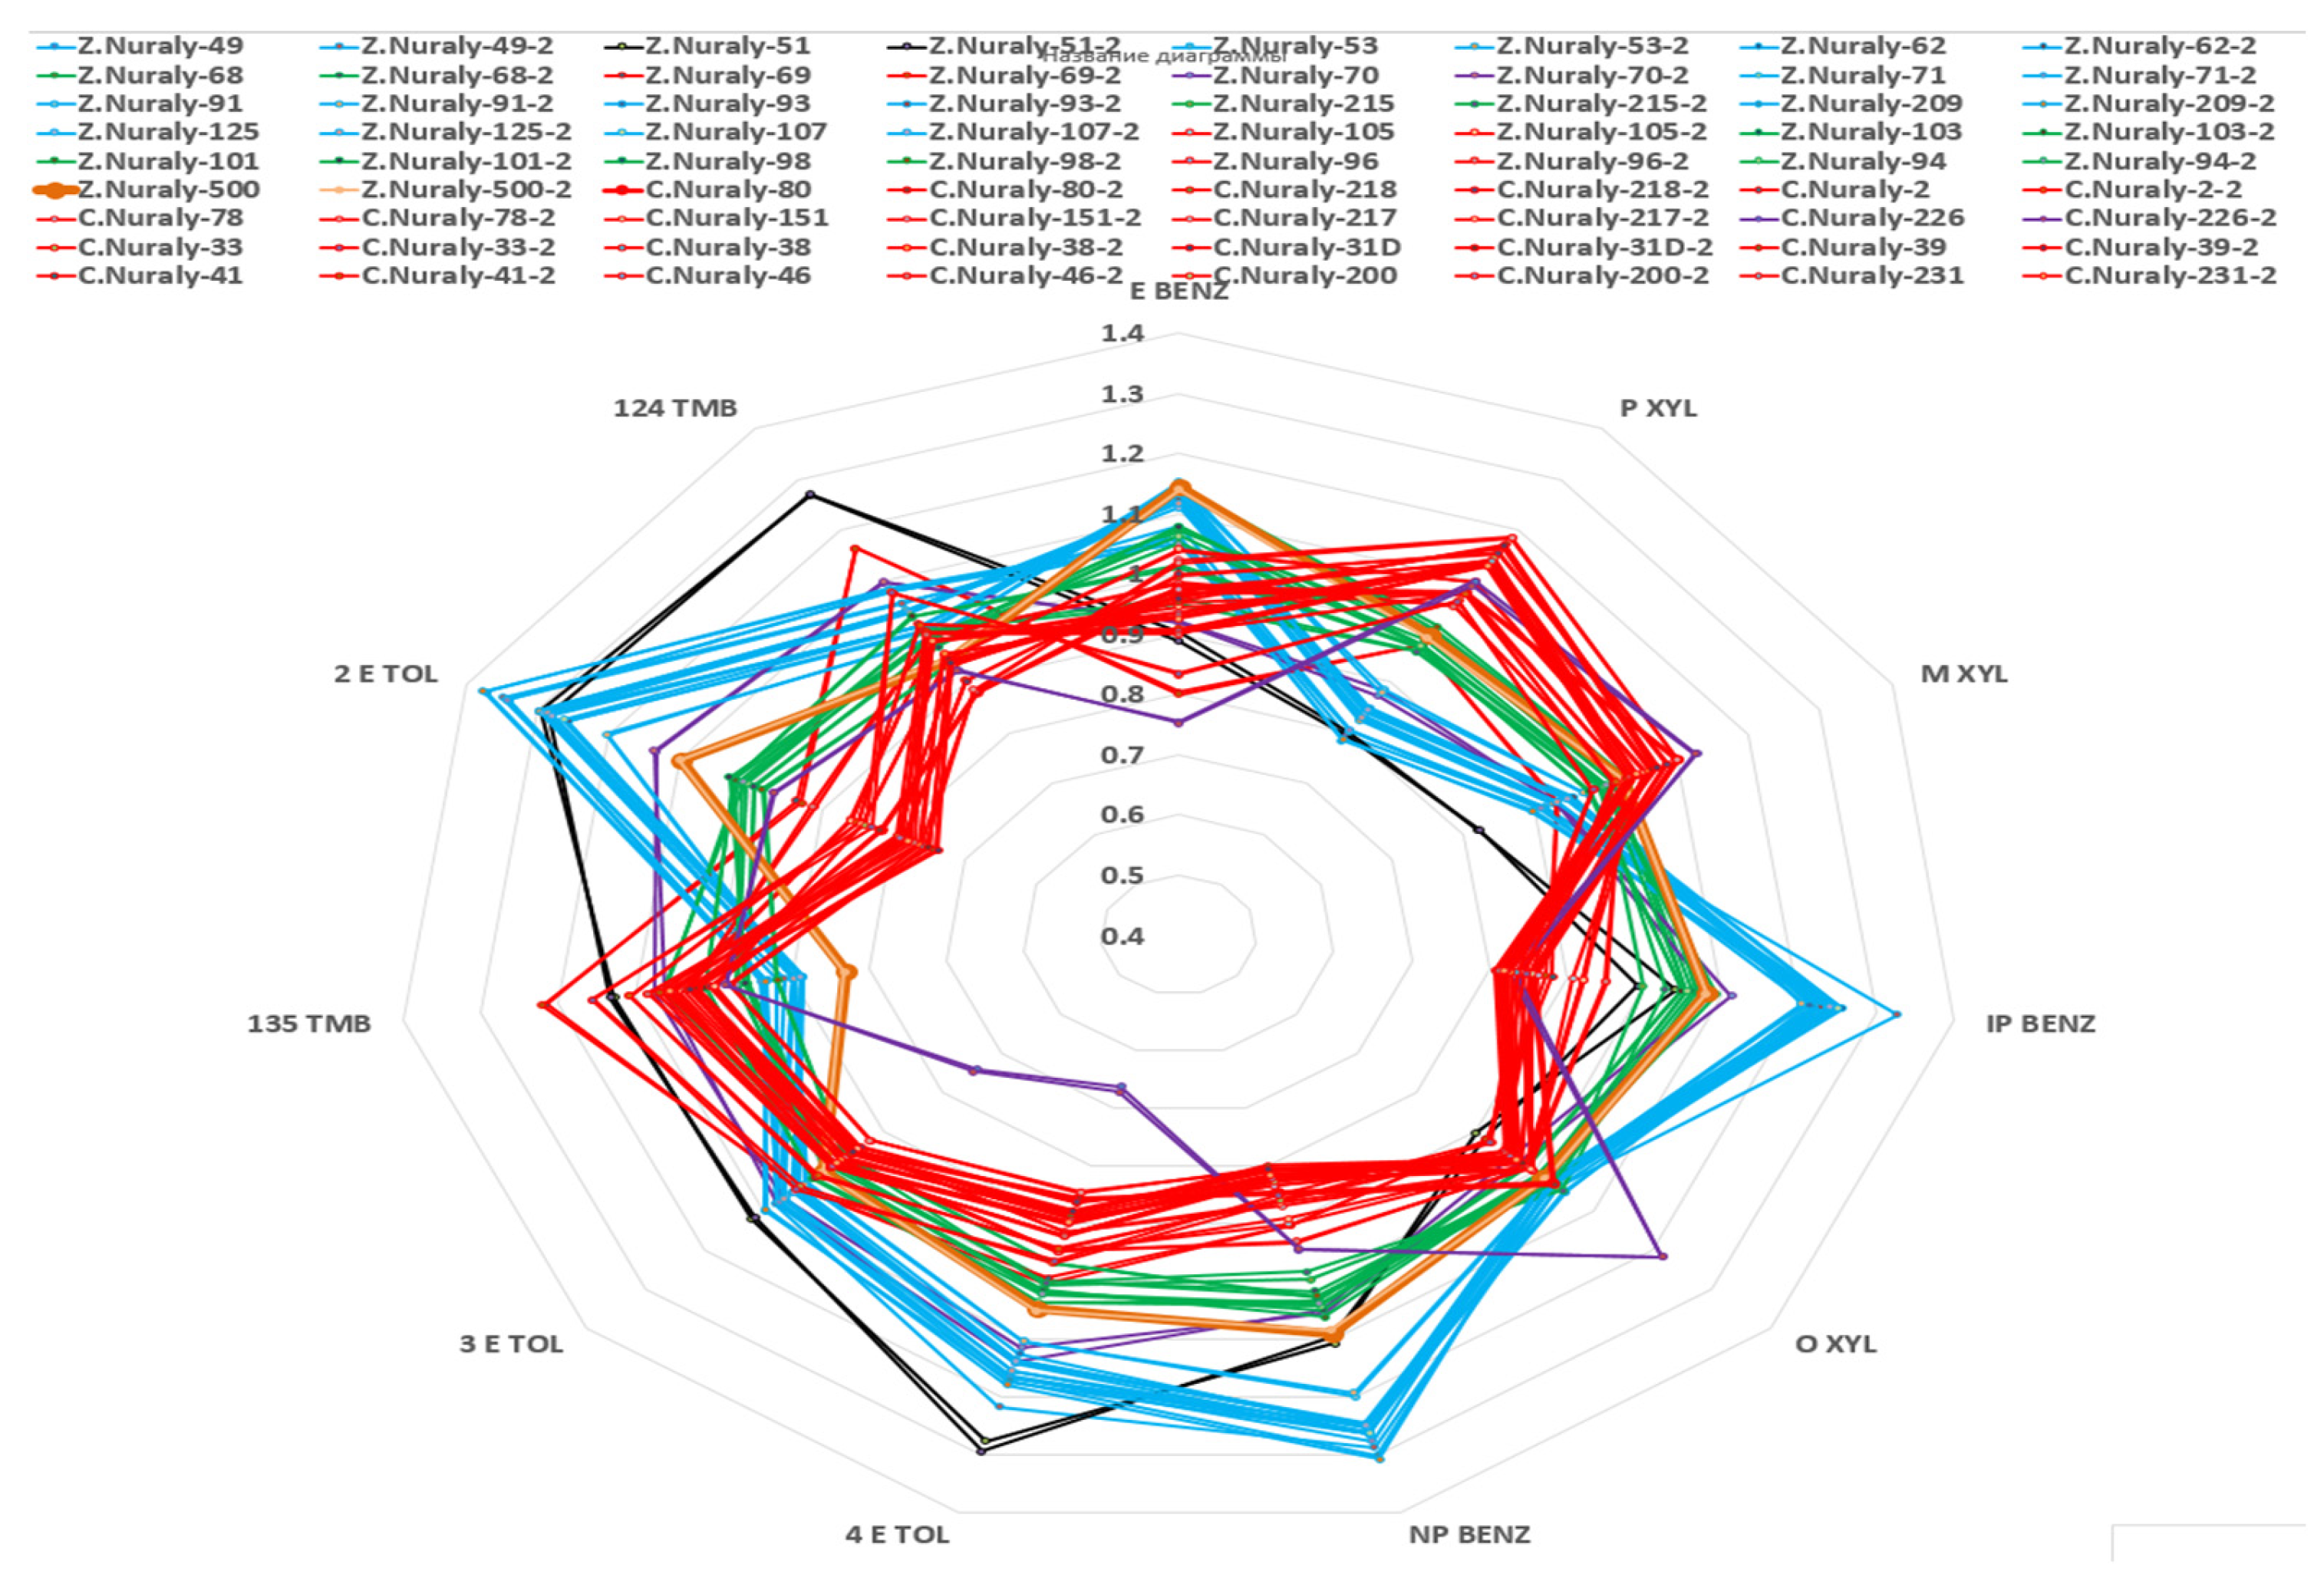
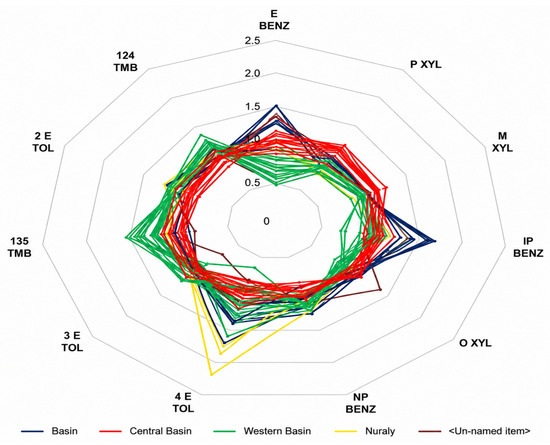
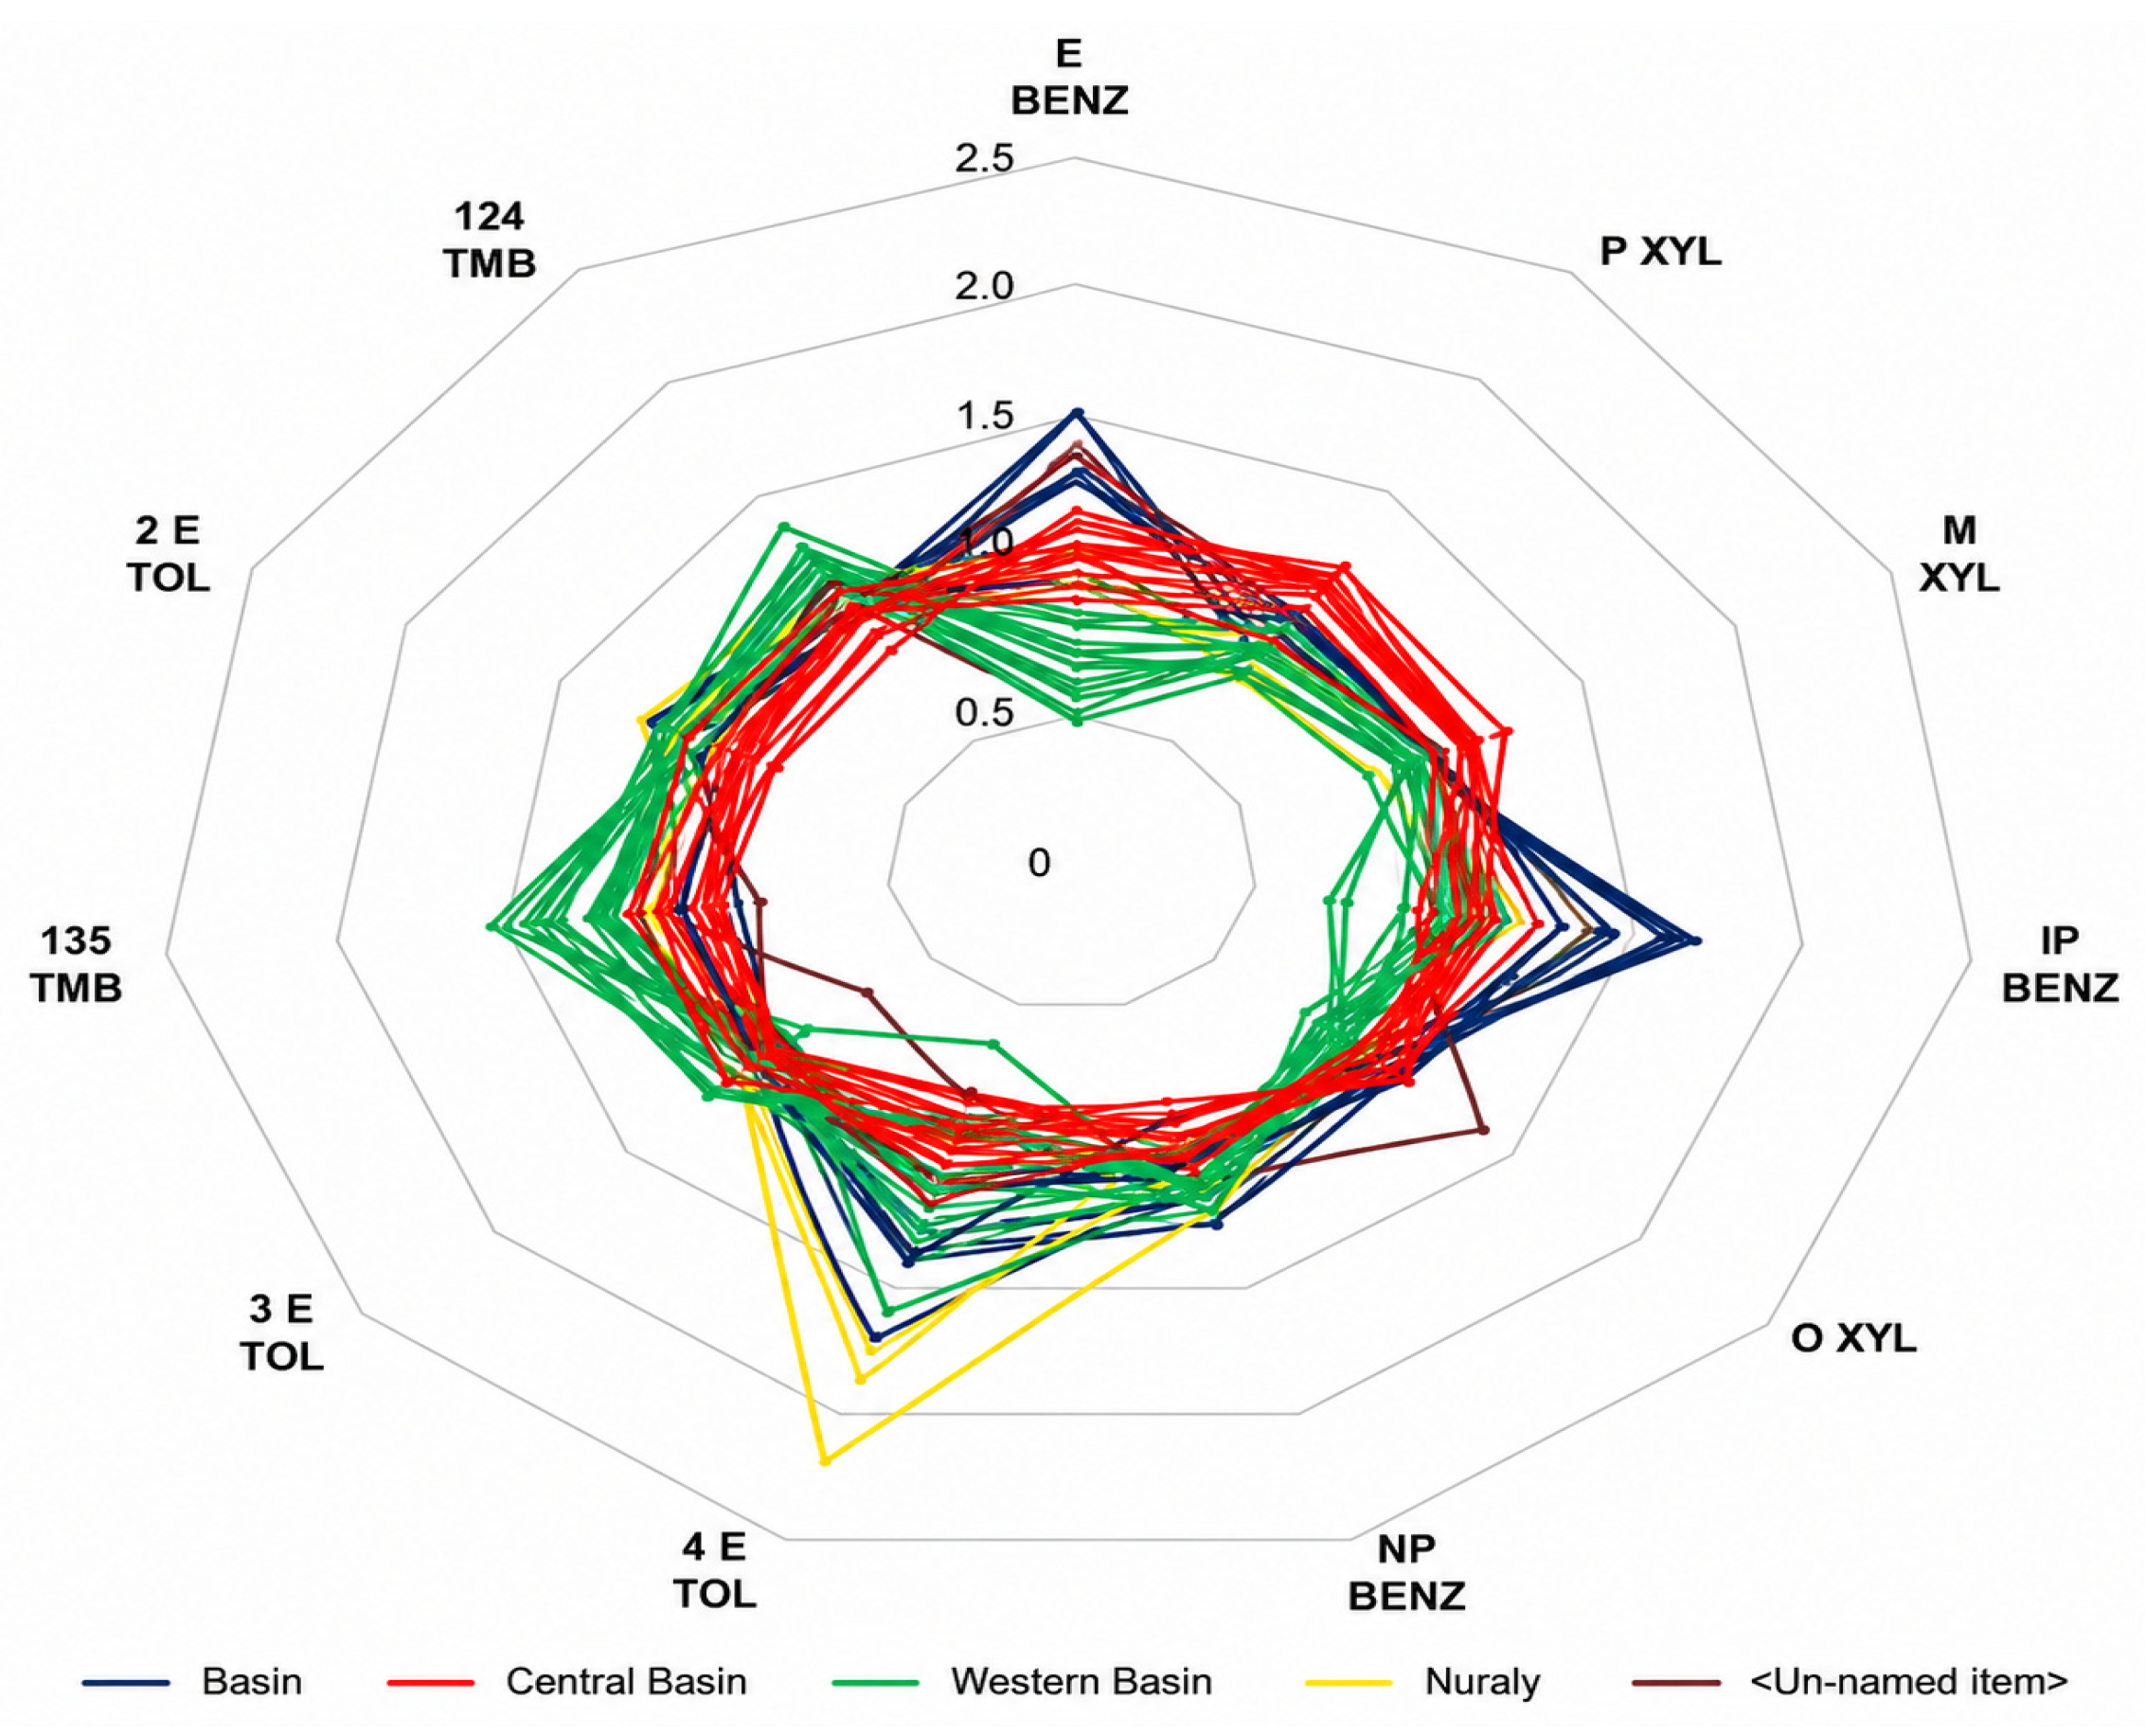
The star diagram constructed for 36 oil samples from the Nuraly field demonstrates pronounced compositional heterogeneity and allows the identification of three principal fluid groups (Figure 10).
Figure 10.
Radar (star) diagram of the studied oils based on 12 diagnostic aromatic compounds used for oil fingerprinting in the Nuraly field [27,28].
Most oils from Central Nuraly are associated with Jurassic reservoirs (J-I and J-II), where the productive horizons occur at greater depths compared to West Nuraly, except for two wells (Nos. 80 and 218) producing from Cretaceous reservoirs (M-II-1). Nearly all oils from Central Nuraly (except well No. 226) exhibit similar star-diagram configurations and form the first (red) group.
Particular attention should be paid to the similarity of the star-diagram patterns of oils from wells Nos. 69, 96, and 105 in West Nuraly to those of Central Nuraly oils, despite their considerable spatial separation. Such similarity may indicate effective fluid communication between the corresponding reservoirs.
Oils from the northwestern part of West Nuraly (except wells Nos. 51, 500, and 70) form the second (blue) group and are characterized by similar aromatic profiles. Well No. 51 shows a distinct deviation in configuration, which may indicate a separate accumulation. The differences in oil from well No. 500 (Jurassic reservoir) relative to Cretaceous oils are also associated with reservoir differences.
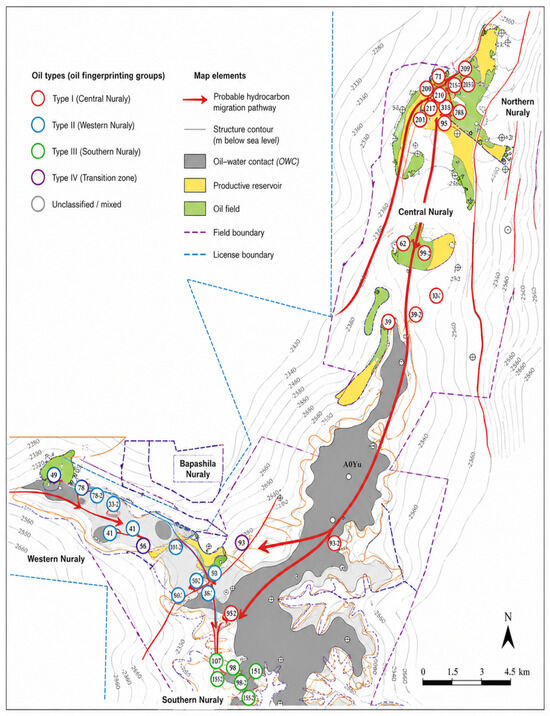
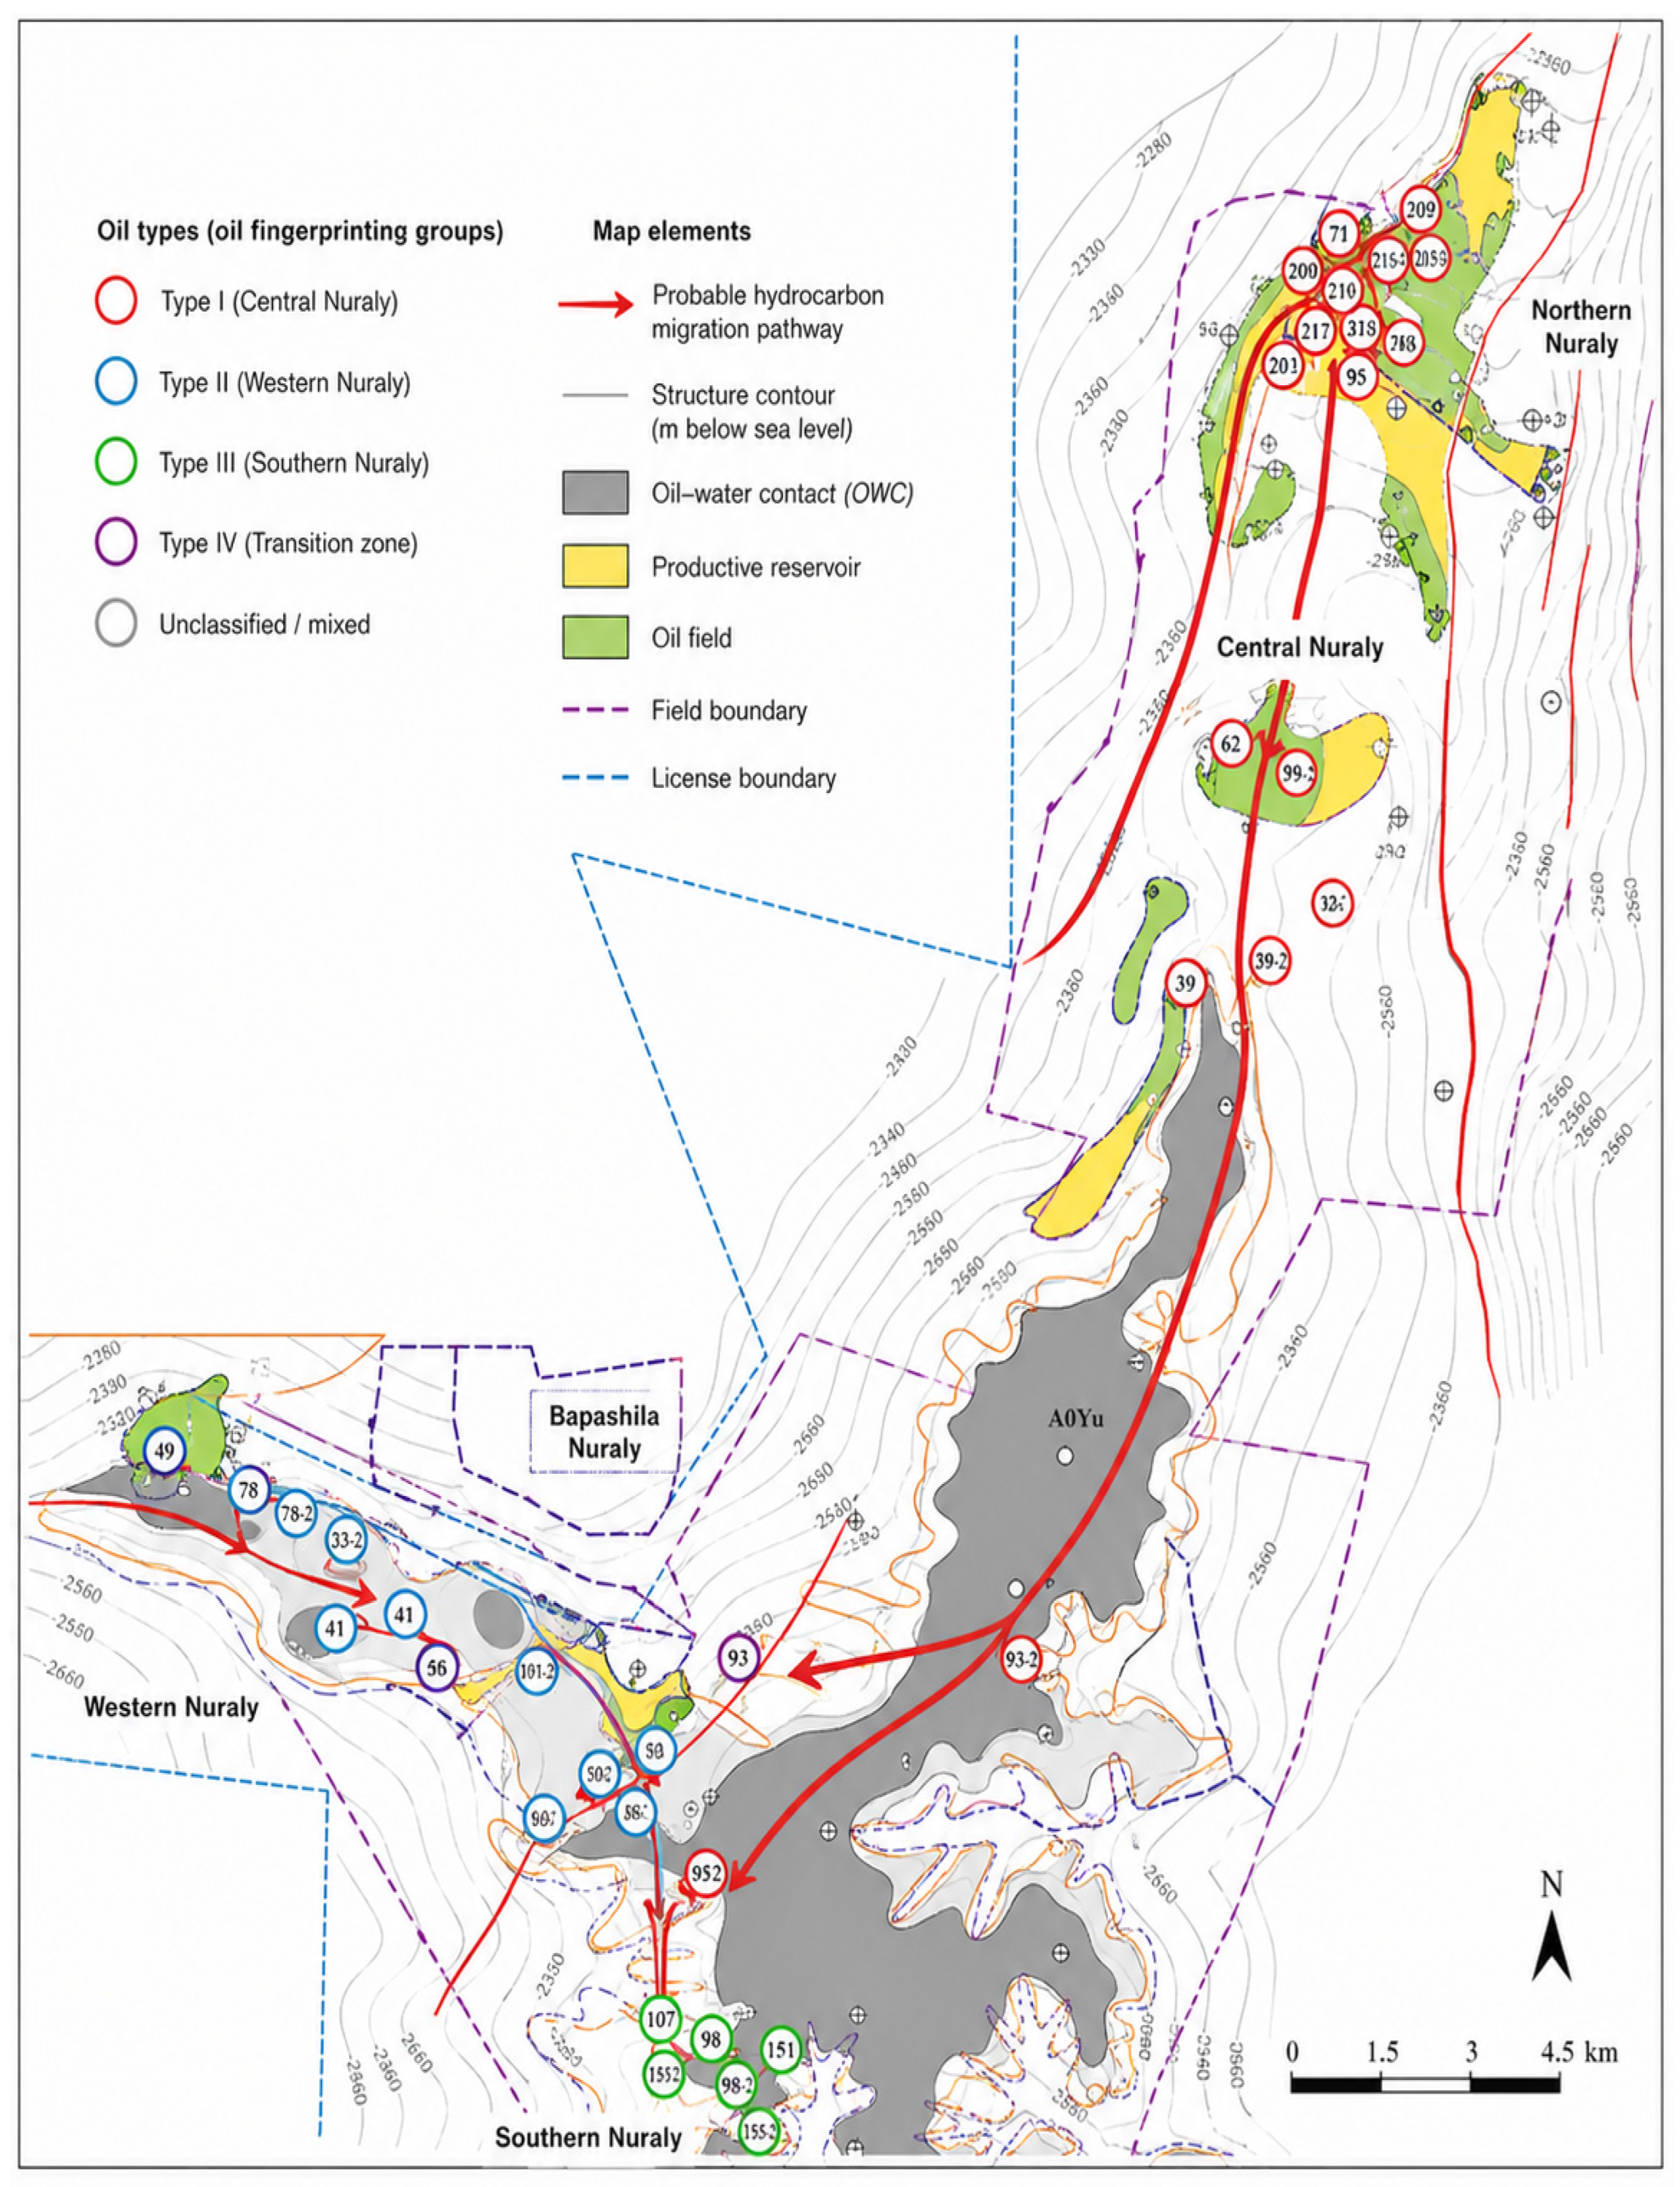
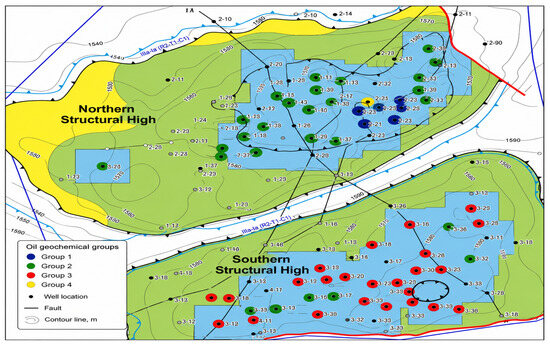
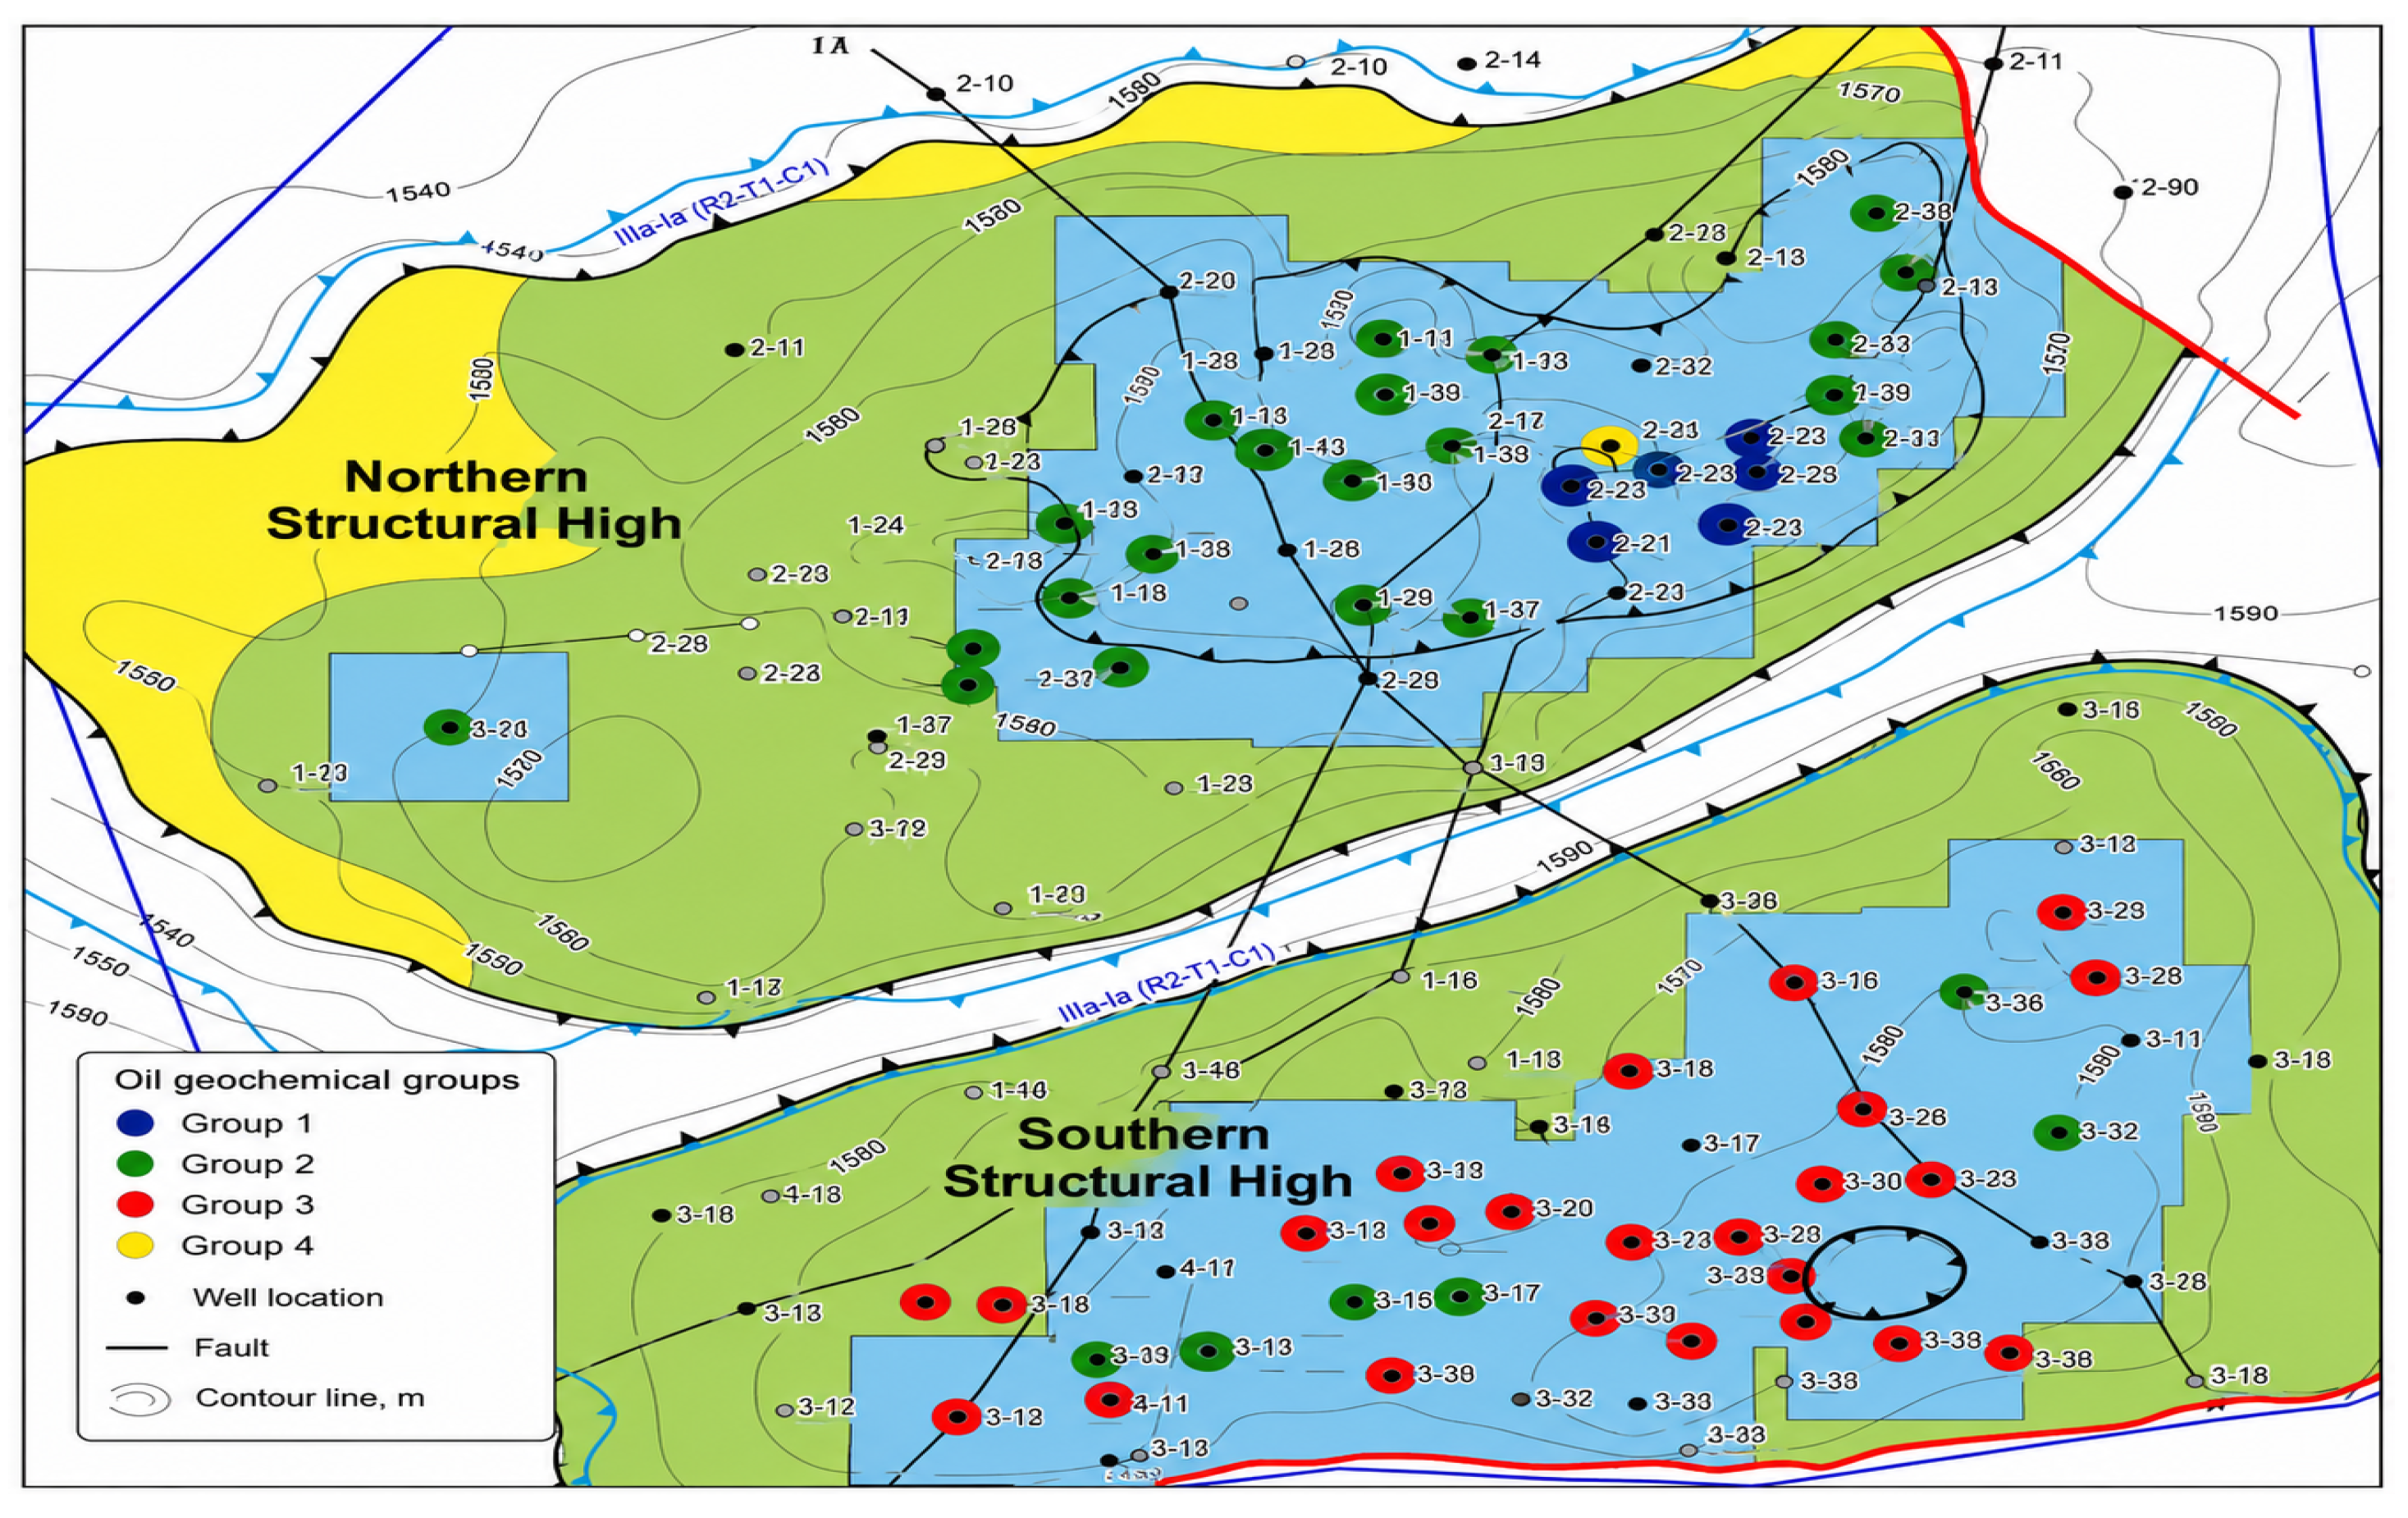
Oils from the southern part of West Nuraly form the third (green) group. Their parameters lie between those of the first and second groups, suggesting a probable mixed-fluid origin. Therefore, the third group may represent mixing between hydrocarbons from the first and second groups. The formation of this accumulation was likely associated with hydrocarbon inflow from the northeastern direction (Group 1) and the northwestern direction (Group 2) (Figure 11) [27,28].
Figure 11.
Map showing the distribution of the identified oil types in the Nuraly field with the probable directions of hydrocarbon migration based on geochemical data [27,28].
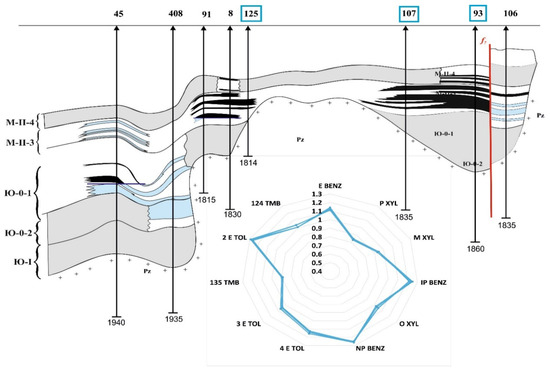
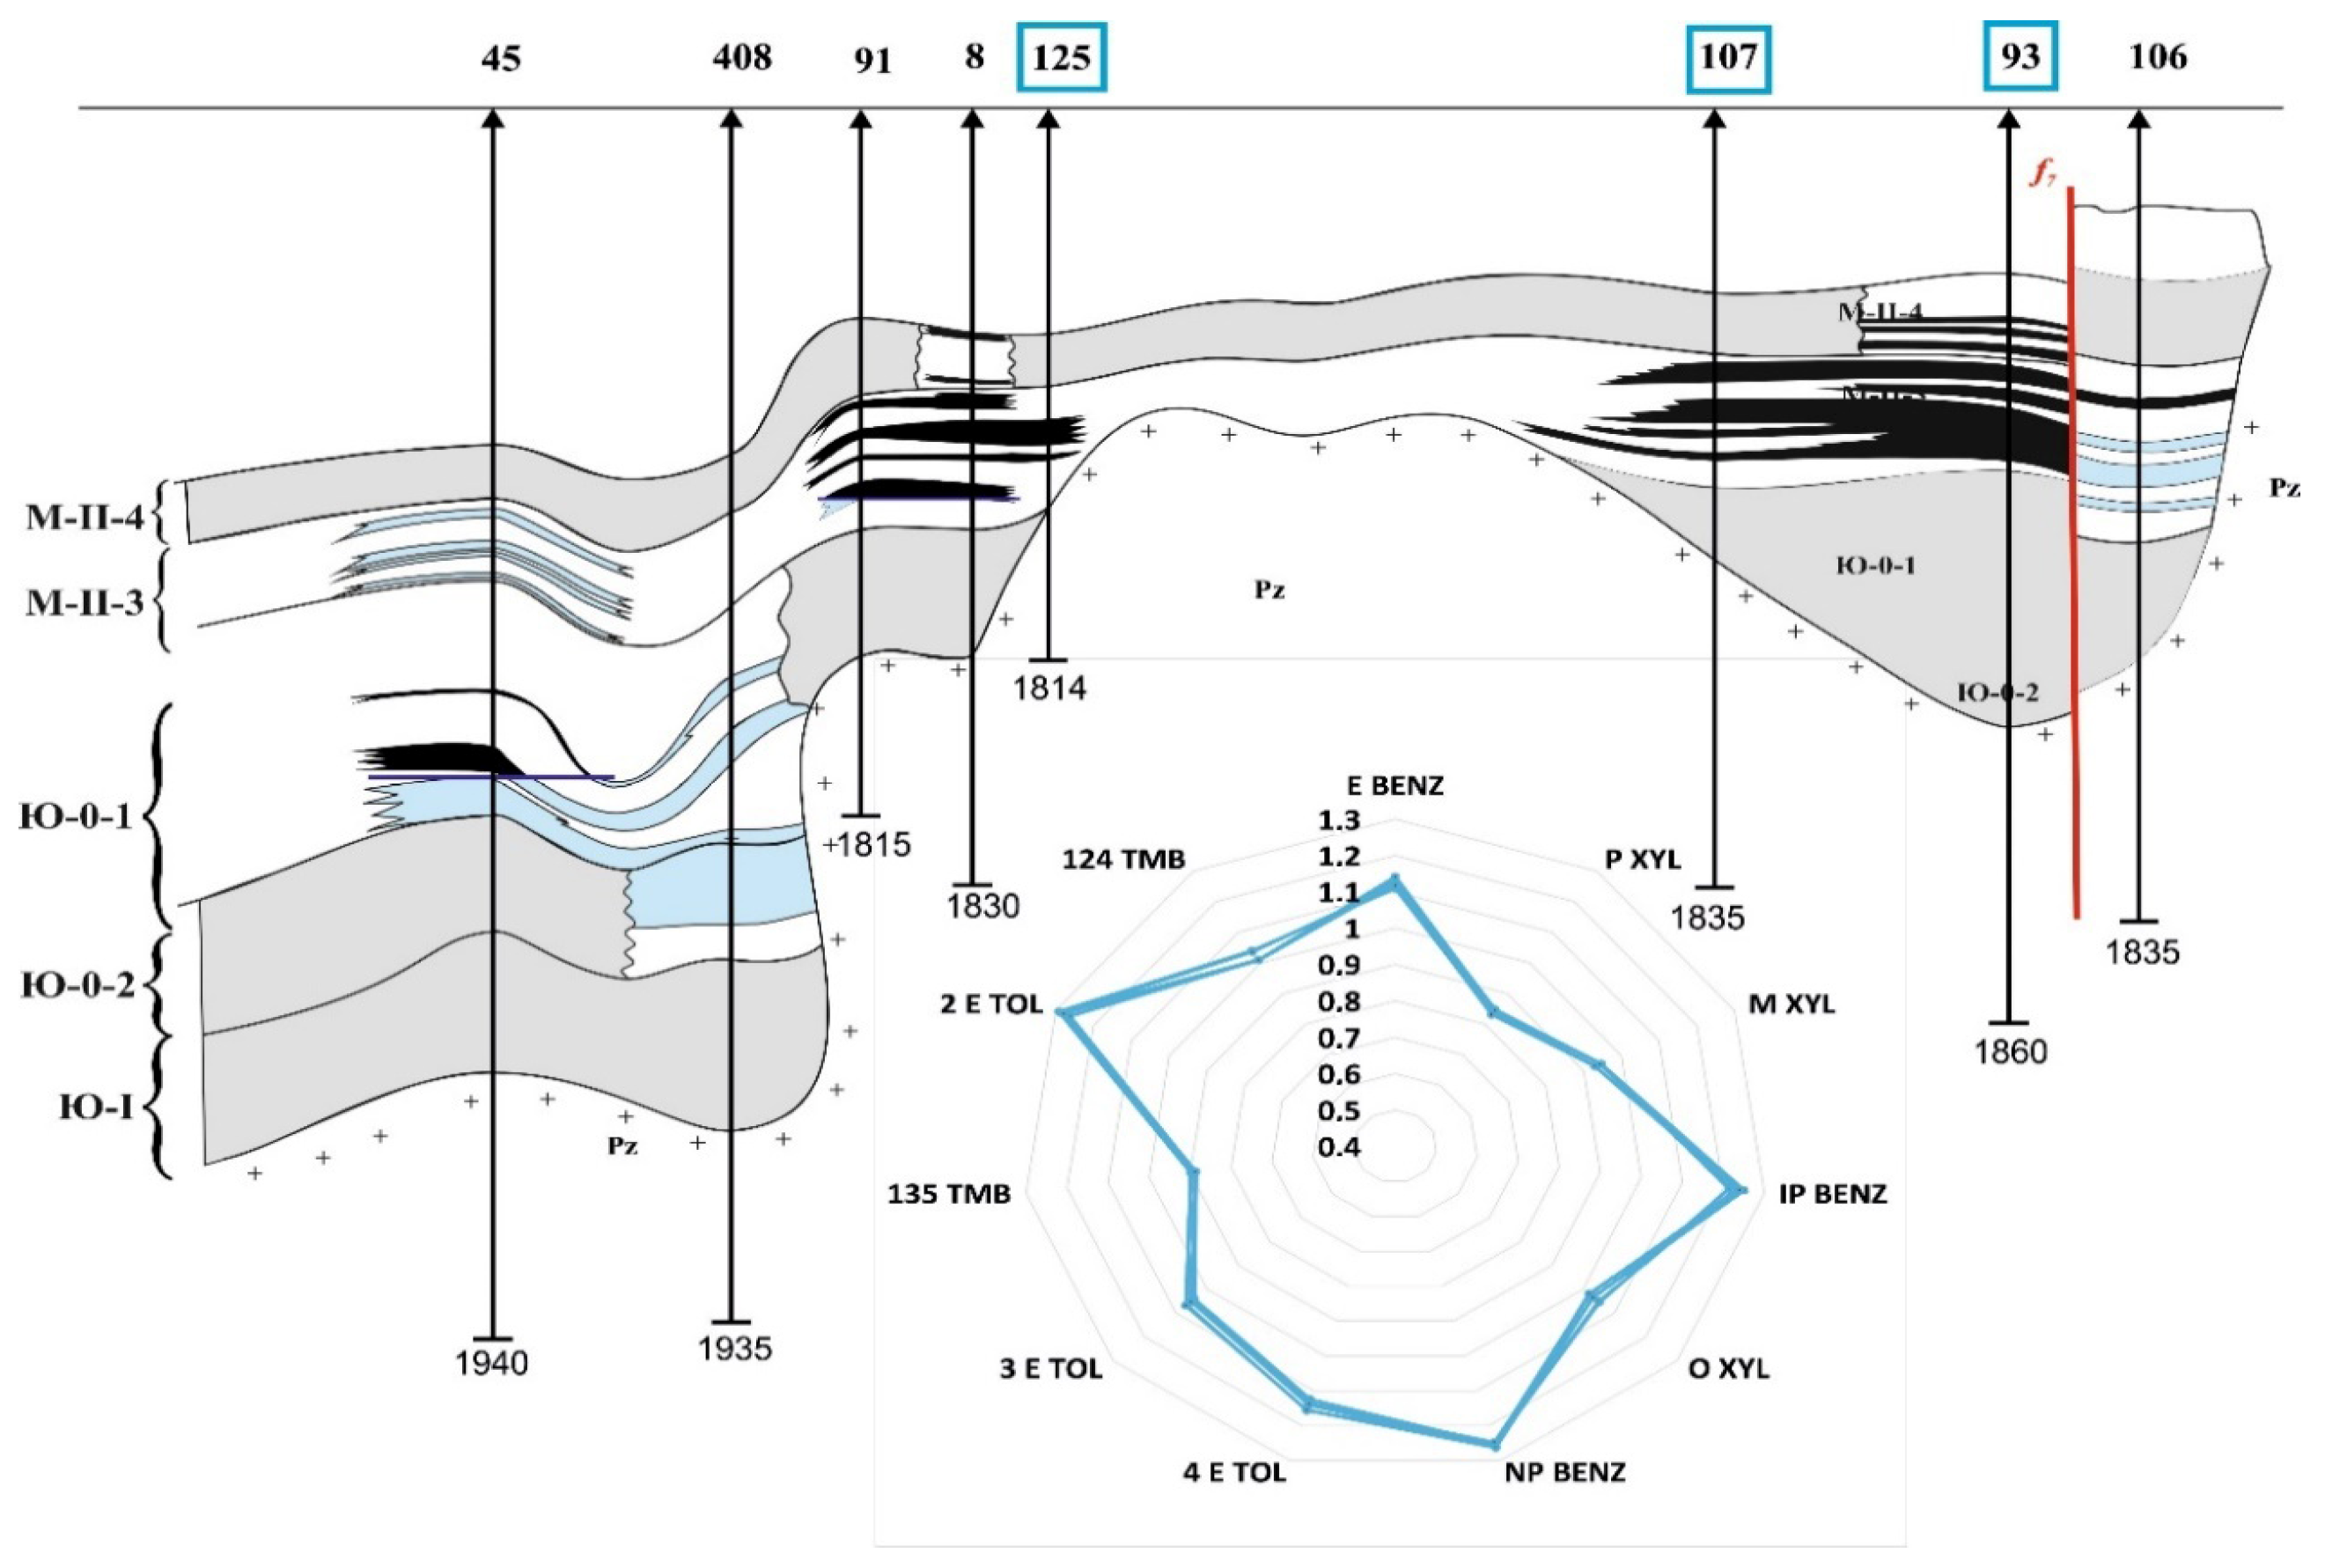
Additional evidence is provided by the high degree of similarity between oils from wells Nos. 125, 107, and 93, indicating local fluid connectivity and the potential unity of the reservoir (Figure 12).
Figure 12.
Oil–water contact (OWC) and star diagram of oils from wells Nos. 125, 107, and 93 in Nuraly field [27,28].
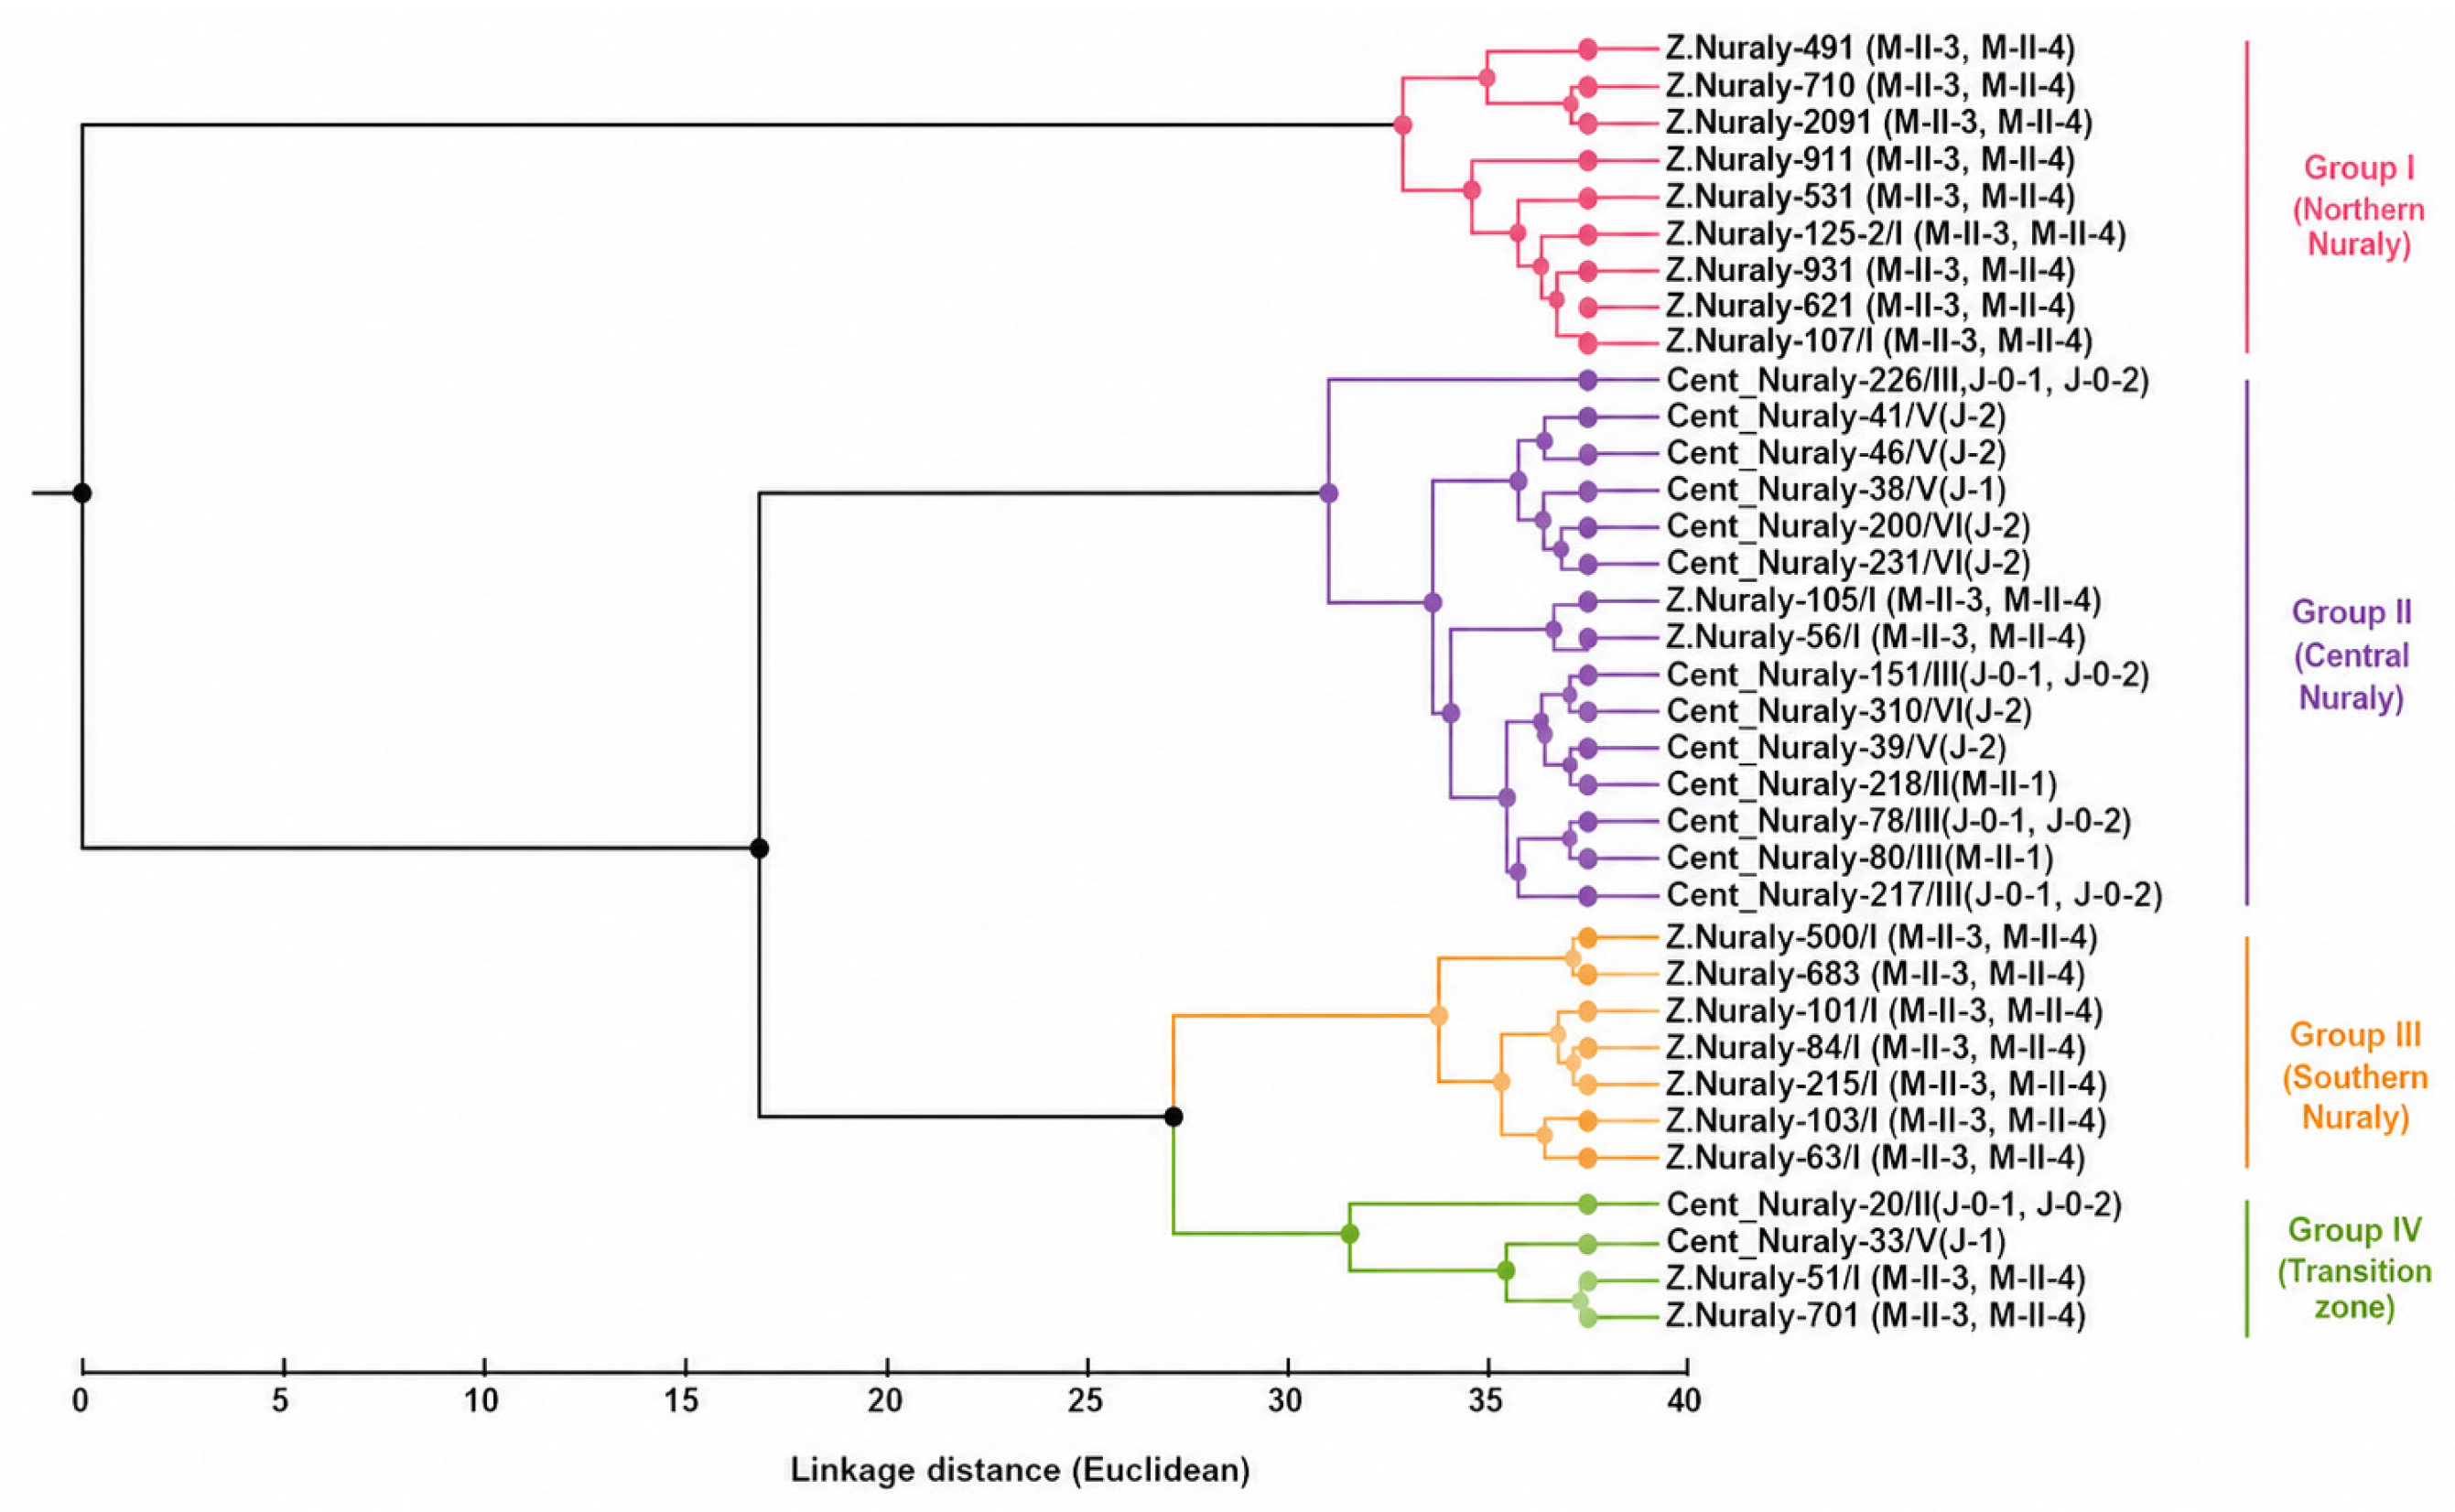
The Ward dendrogram (Figure 13), constructed in the Malcom software package (Schlumberger), represents a hierarchical clustering of oils based on their aromatic composition. This method allows for the assessment of the degree of similarity between samples and the sequence of their clustering. According to the results of the analysis, four oil groups were identified.
Figure 13.
Hierarchical cluster analysis (Ward’s method) of the studied oil samples based on oil fingerprinting parameters [27,28].
The clustering results show a clear association with the stratigraphic distribution of the studied oils. Oils from West Nuraly generally form separate clusters compared to those from Central Nuraly. Based on the clustering results, the fingerprinting results can be used to optimize field development decisions, including the selection of candidate wells for conversion to injection wells.
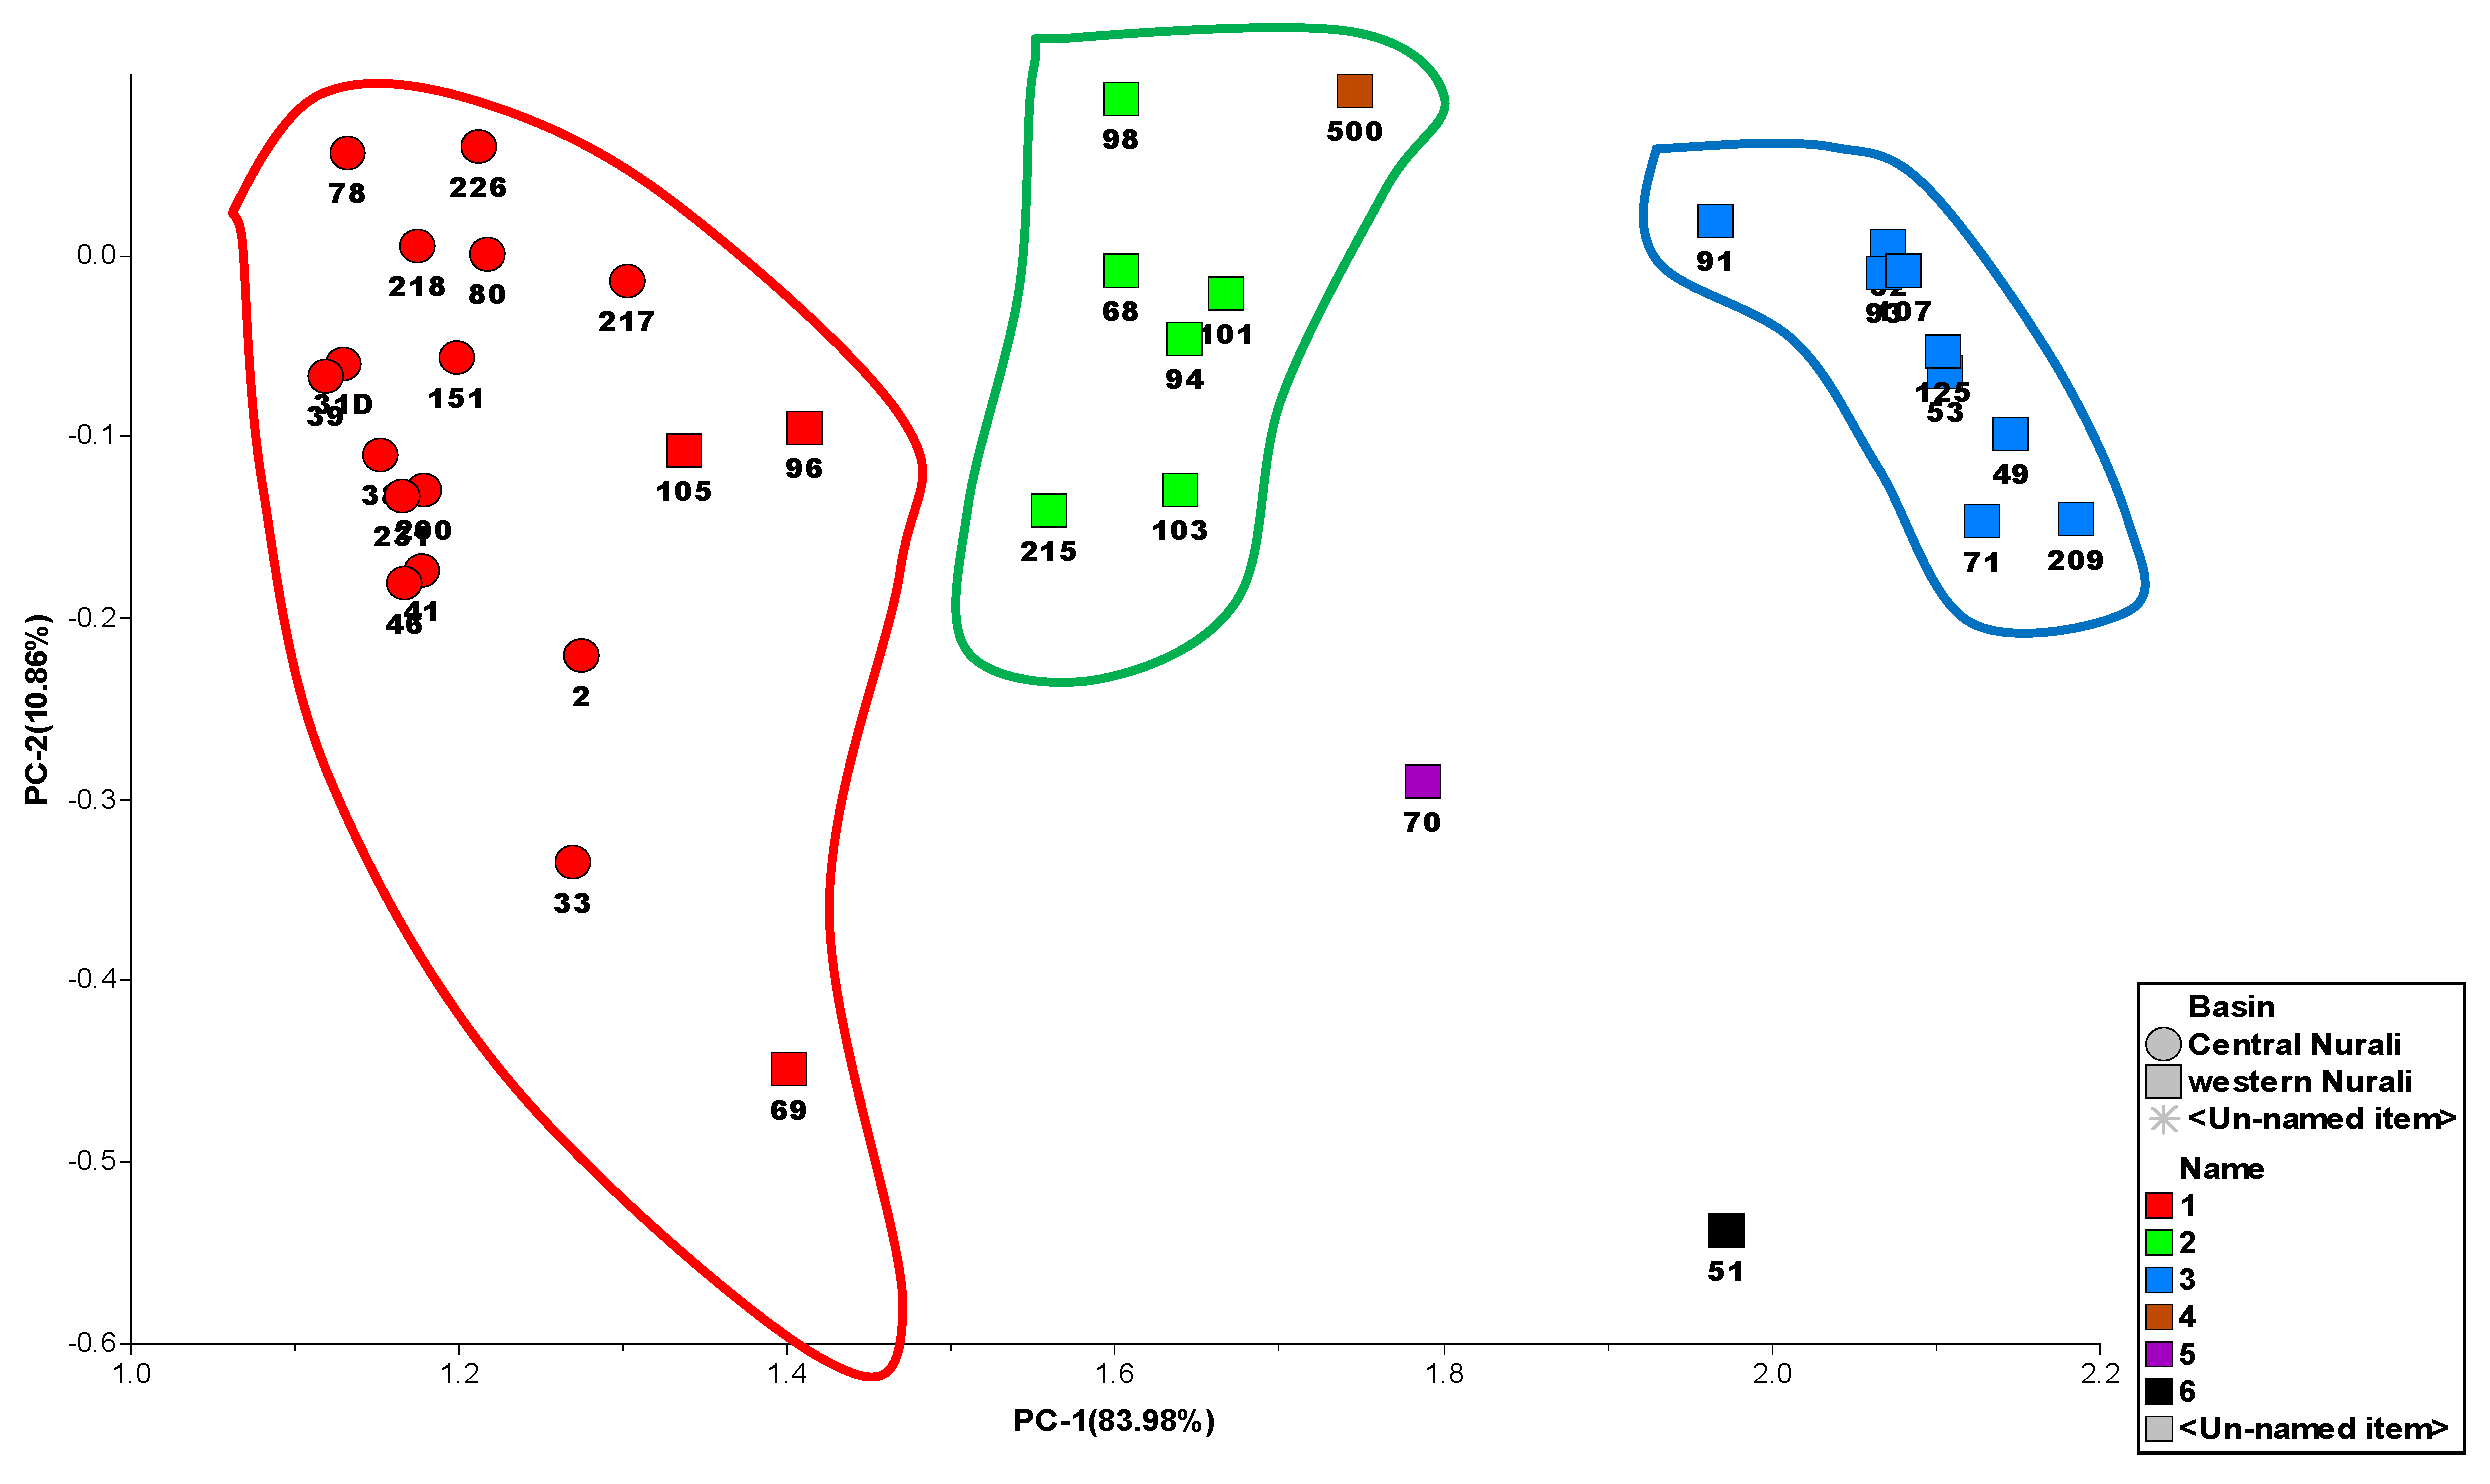
PCA analysis showed that PC1 and PC2 explain 83.98% and 10.86% of the total variability, respectively. The two-dimensional projection (94.84% of the total variance; Figure 14) is generally consistent with the star diagram results and confirms the presence of three main clusters.
Figure 14.
2D PCA analysis of the studied oils based on oil fingerprinting [27,28].
Most oils from Central Nuraly and part of the oils from West Nuraly (wells Nos. 96 and 105) form a compact group (red cluster). Oils from the northwestern part of West Nuraly form a second (blue) group, with the exception of wells Nos. 51, 500, and 70 [27,28].
The integration of clustering results with the geological map indicates that fluid distribution is controlled by structural–stratigraphic factors. It is assumed that at least two hydrodynamically partially isolated blocks exist, with mixing zones in the southern part of West Nuraly.
The anomalous position of well No. 226 may be related to its marginal location and possible penetration of an alternative productive horizon. Further analysis of oils from East Nuraly is required to refine this interpretation.
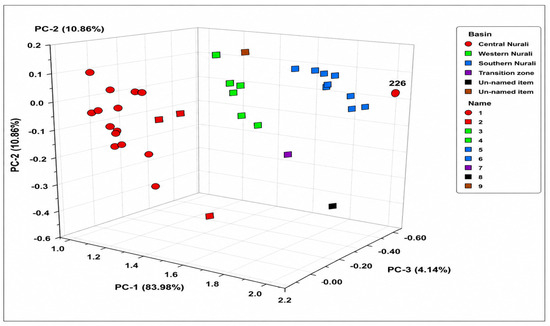
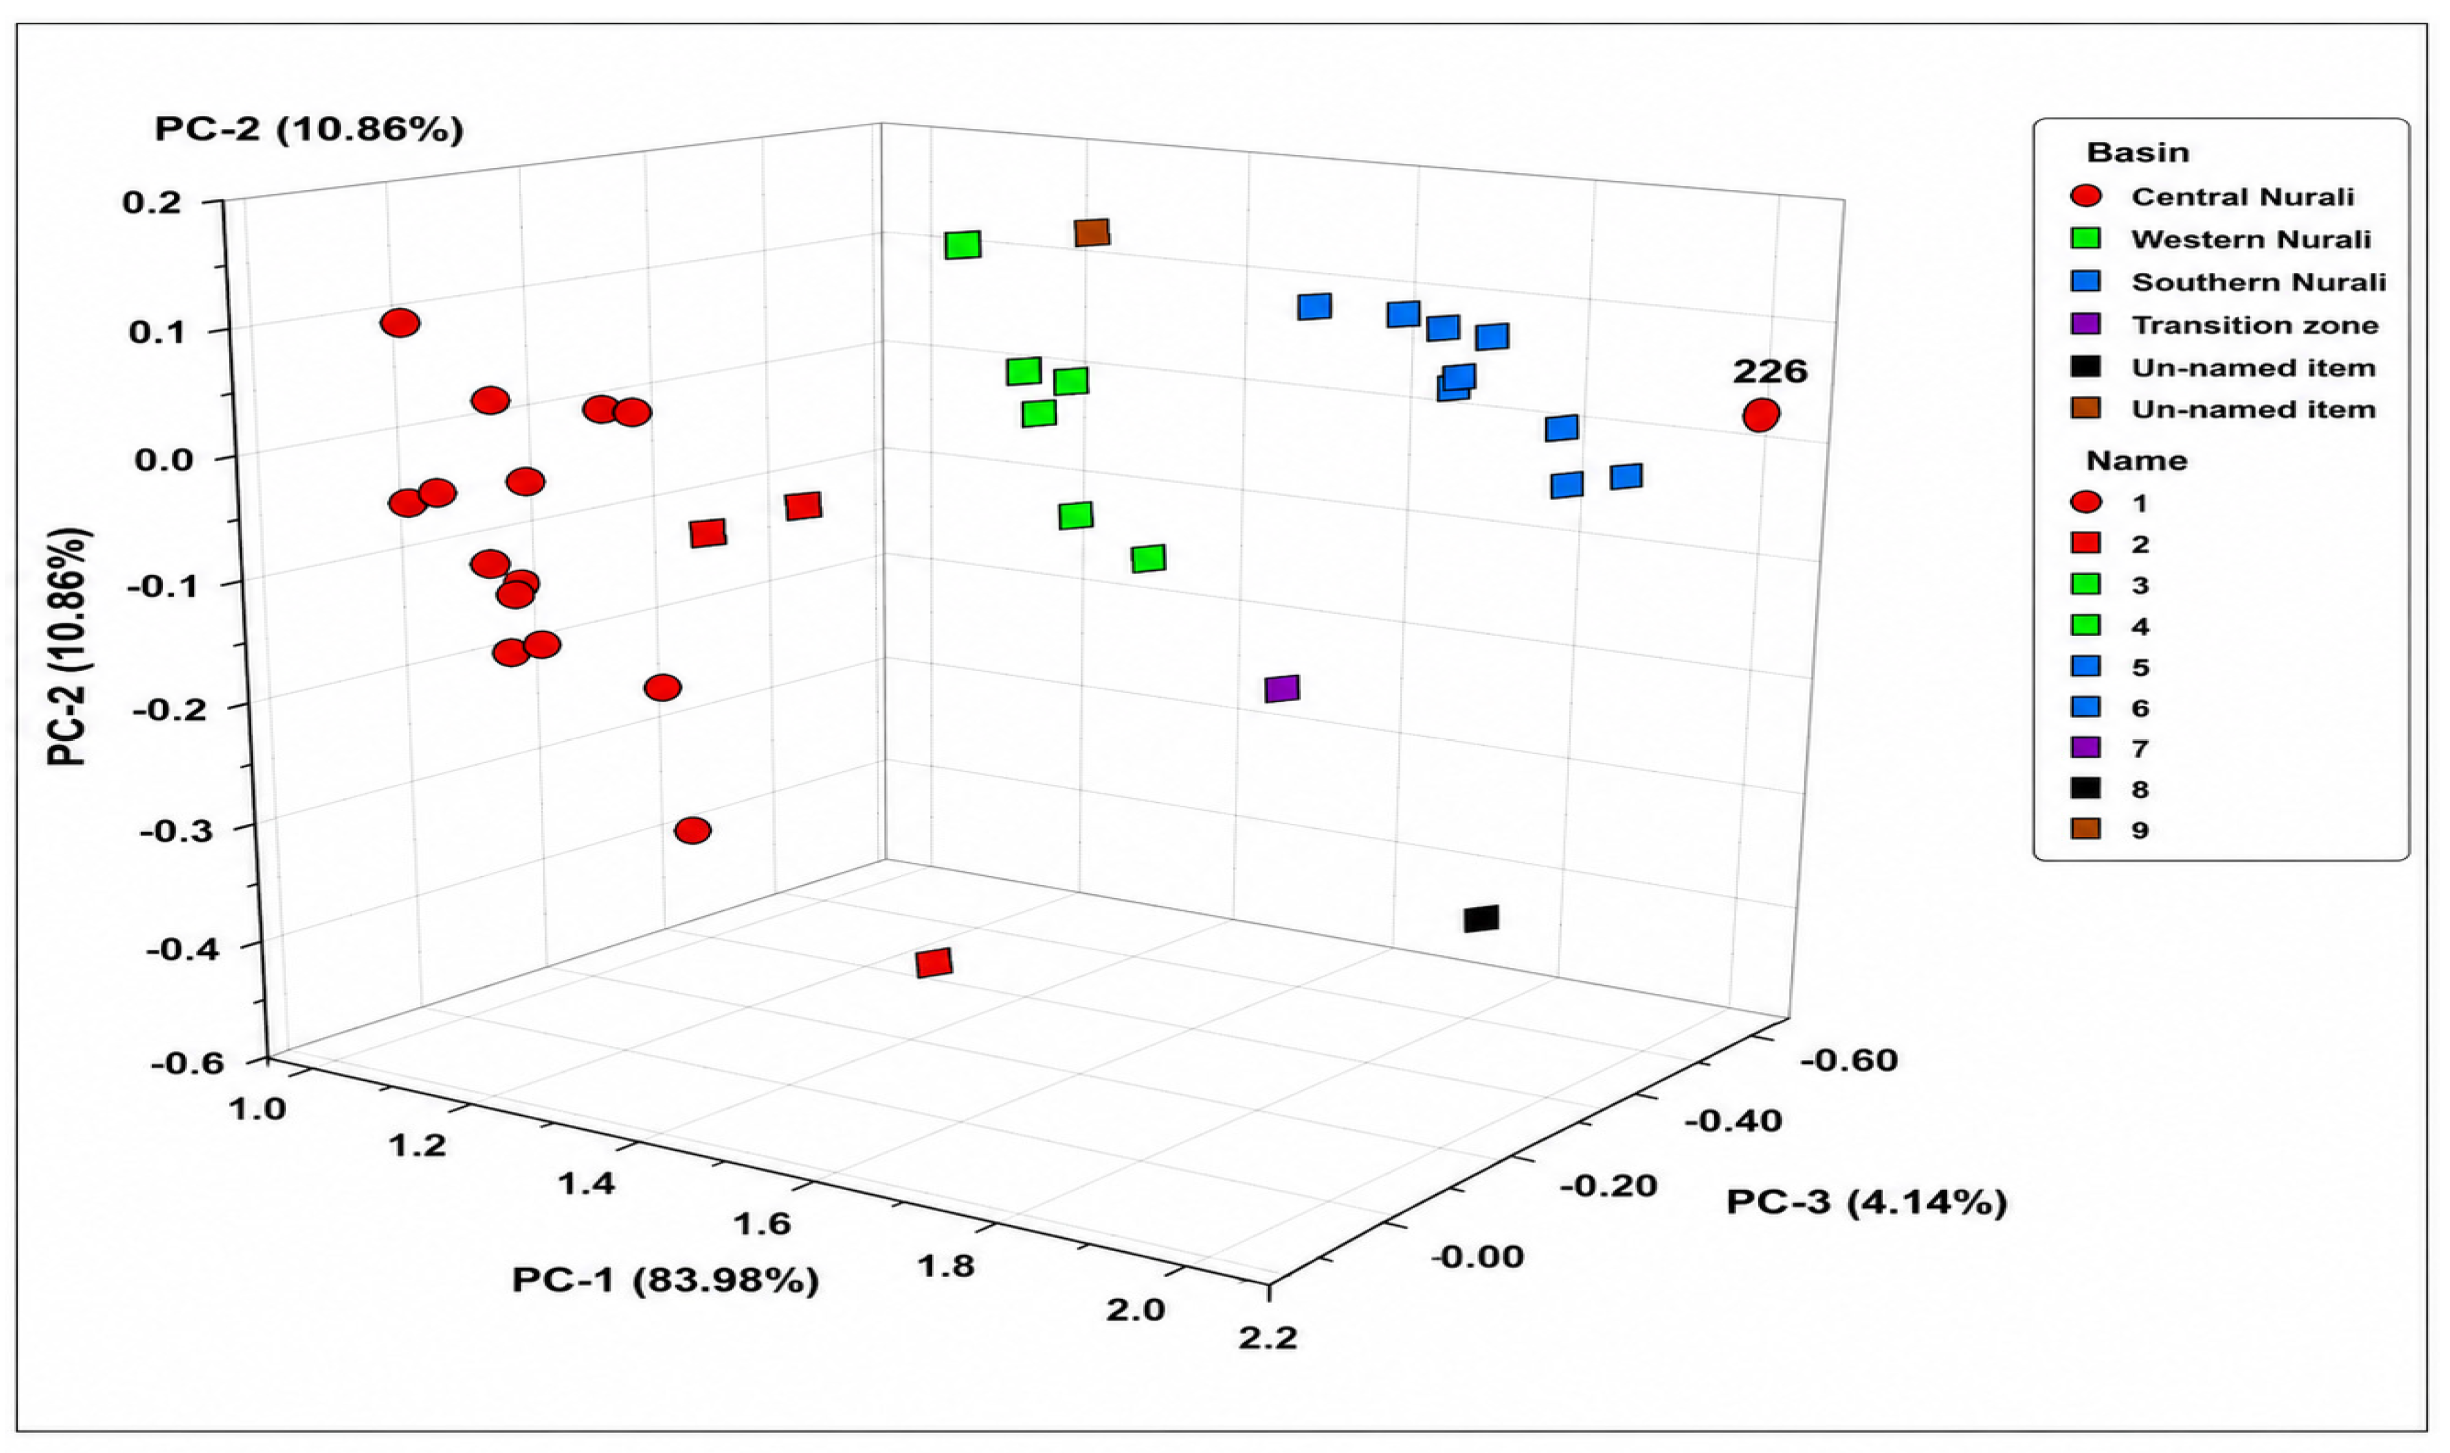
To improve the resolution of PCA, a three-dimensional model (PC1–PC2–PC3) was additionally constructed, explaining 97.14% of the total variability (Figure 15). This projection confirms the isolated position of well No. 226 relative to the main Central Nuraly group, while the remaining samples show consistent agreement between 2D and 3D interpretations.
Figure 15.
3D PCA analysis of the studied oils [27,28].
3.2. Biomarker Investigations
Characteristic ion signals m/z 57, 191, 217, and 218 were used for the analysis of saturated hydrocarbon fractions, corresponding to n-alkanes (including isoprenoids), terpanes, steranes, and diasteranes, respectively. For the aromatic fraction, ions m/z 178, 184, and 192 were selected, reflecting the distribution of phenanthrenes, dibenzothiophenes, and their methylated derivatives.
The obtained biomarker data were used to characterize the source rocks in terms of depositional environment (lacustrine, marine, or deltaic), lithological characteristics (carbonate or siliciclastic), thermal maturity, and geological age based on age-diagnostic biomarkers [3,22]. Integration of these parameters provides a basis for evaluating genetic relationships among oils and reconstructing their source and depositional conditions.
Source rocks may form under different depositional environments, including marine, lacustrine, and deltaic settings, each characterized by specific organic-matter inputs. Biomarkers preserved in crude oils can retain information on the original organic matter and therefore provide valuable evidence for reconstructing source-rock depositional conditions [3].
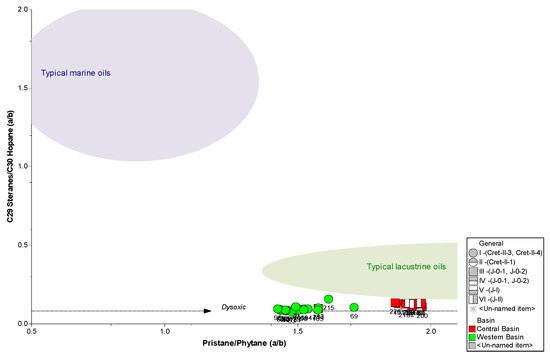
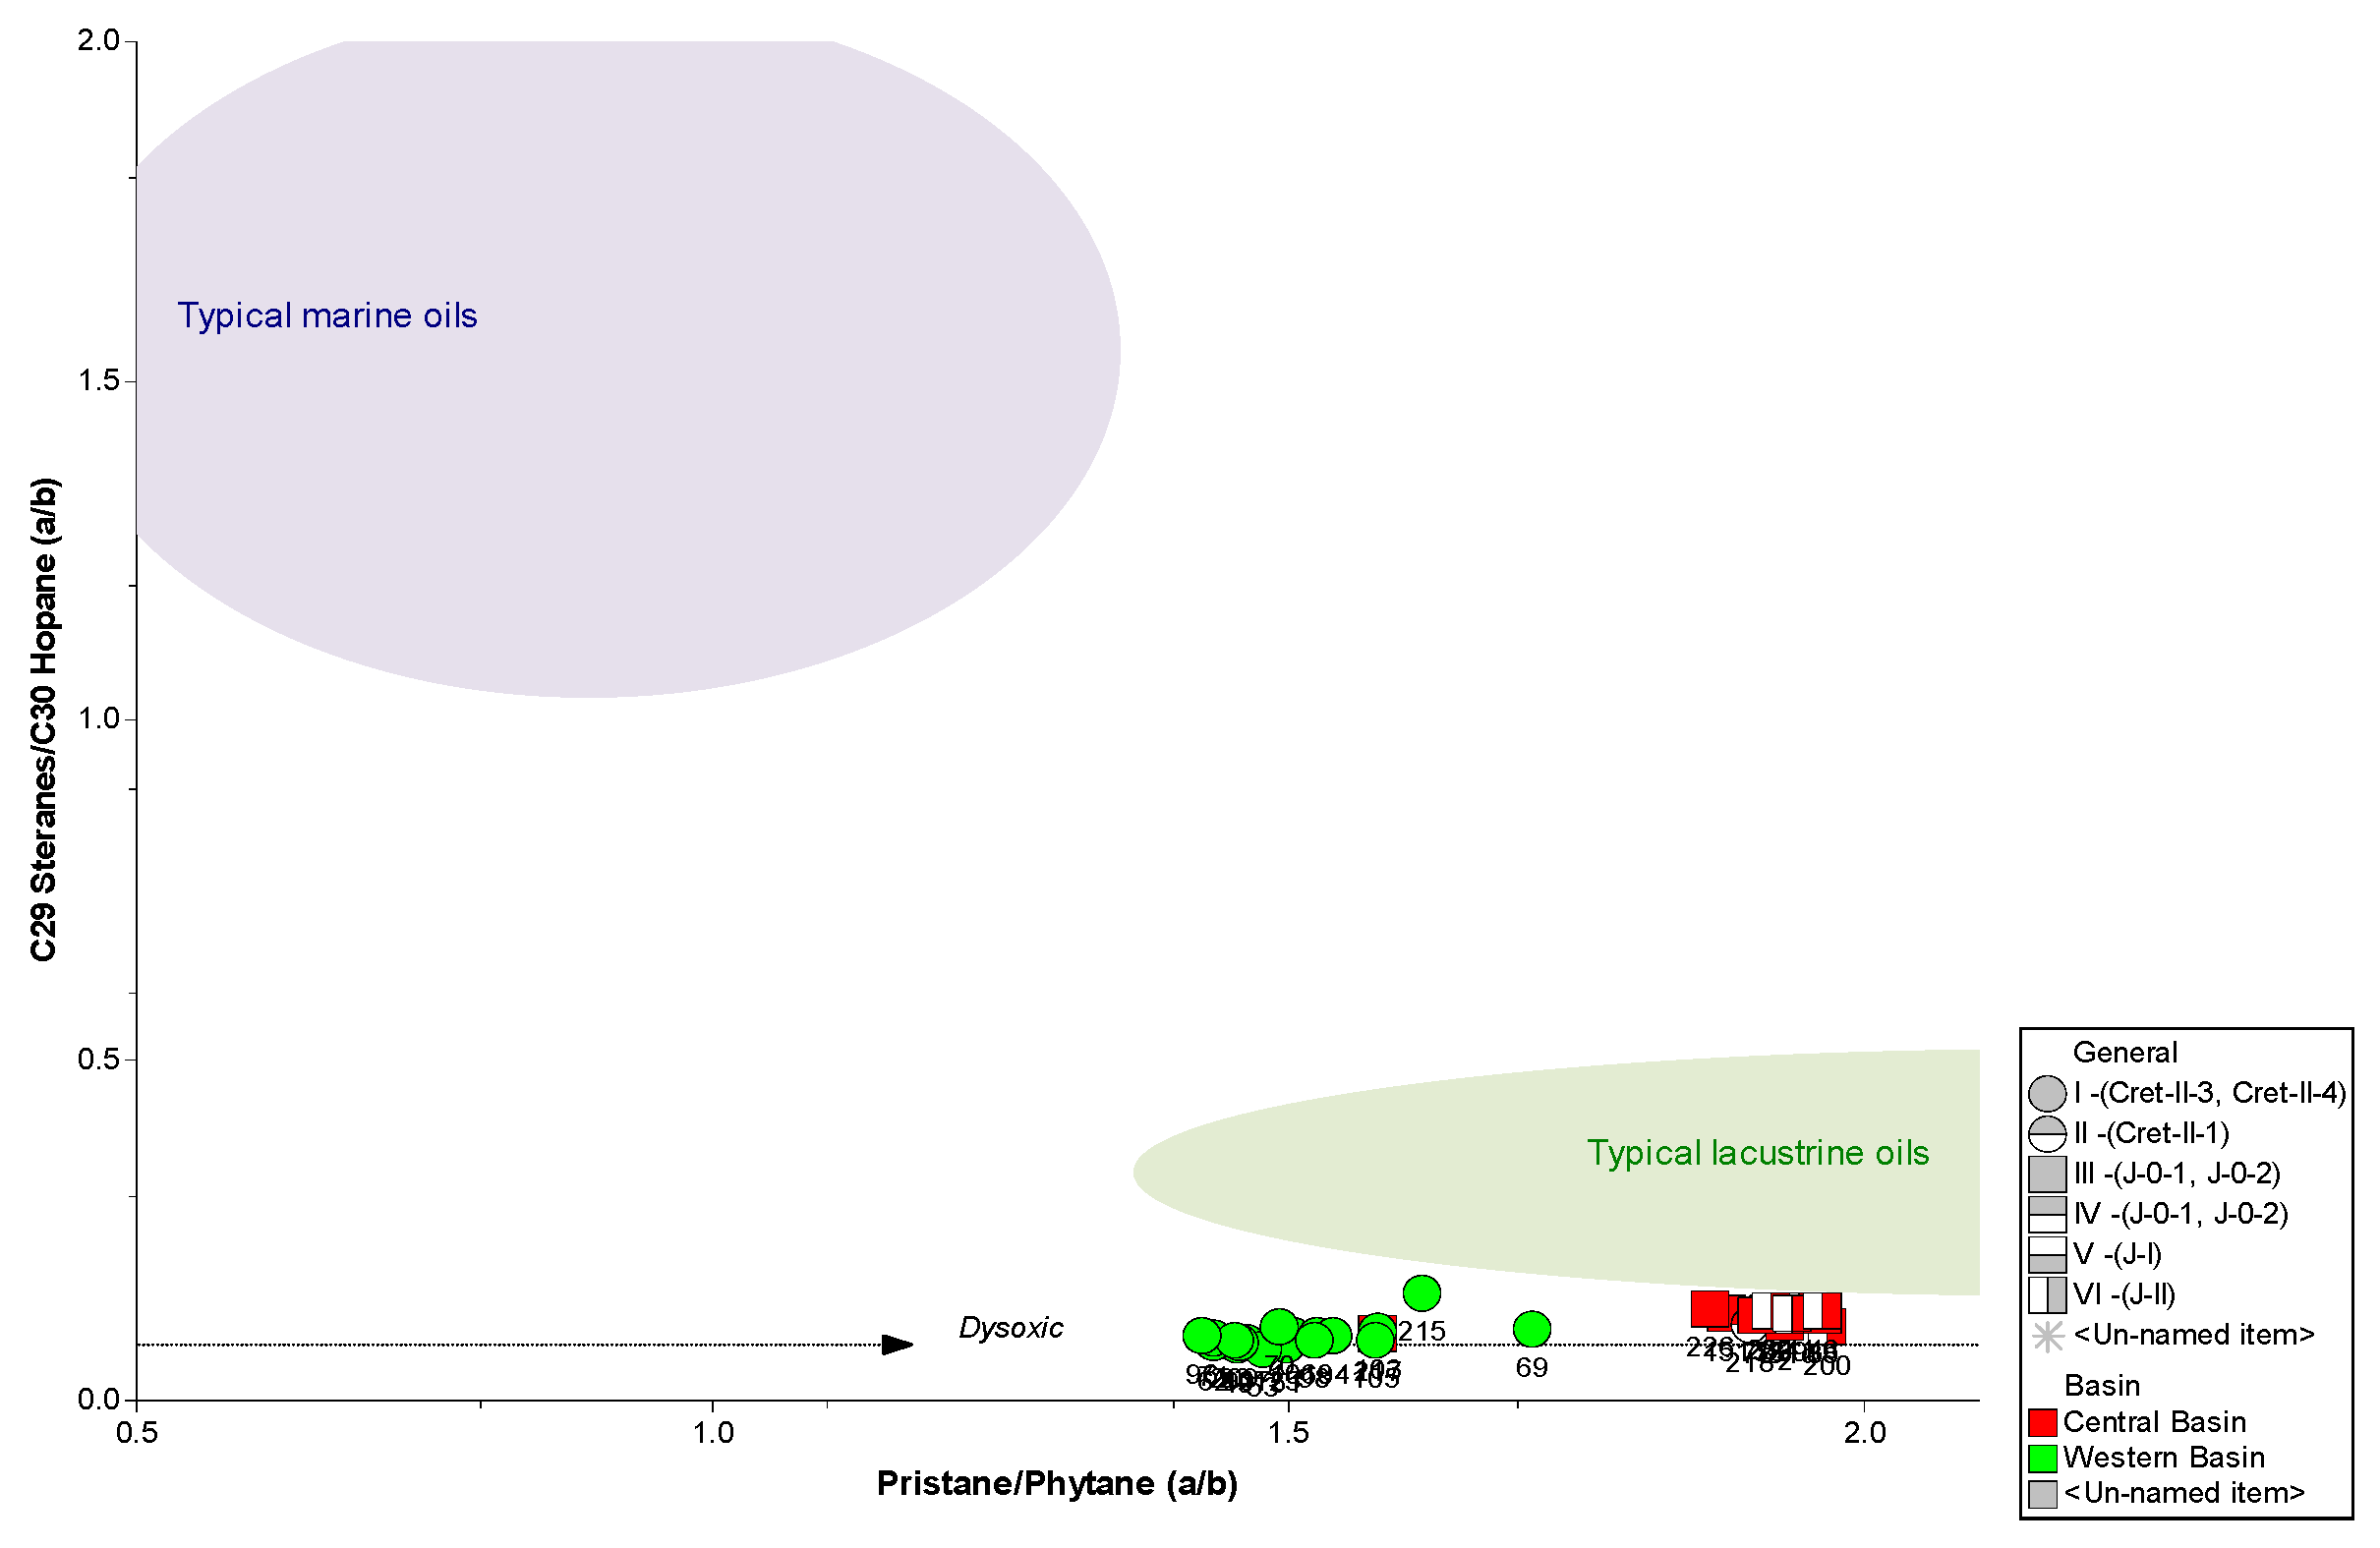
In this study, the Pr/Ph ratio and C29 sterane/C30 hopane ratio were used to evaluate the depositional conditions of the source rocks associated with the analyzed oils [3]. The results indicate that the Nuraly oils are predominantly associated with a lacustrine depositional environment (Figure 16). However, differences between oils from the Central and West Nuraly sectors suggest variability in organic-matter input and/or depositional conditions. Higher Pr/Ph values in Central Nuraly oils may indicate relatively more oxic depositional conditions than those represented by oils from West Nuraly.
Figure 16.
Comparison of the Pr/Ph ratio with the C29 sterane/C30 hopane ratio [27,28].
The lithology of source rocks (oil-source rocks) significantly influences the composition of biomarkers in oils. Although no single parameter alone is sufficient to determine rock type unambiguously, the combination of geochemical characteristics allows differentiation between predominantly clay-rich and carbonate sources.
For the studied Nuraly samples, low C29/C30 hopane ratios (29H/30H) were observed, along with characteristic distributions of homohopanes in mass fragmentograms (m/z 191). These features suggest a predominance of clay-rich source rocks.
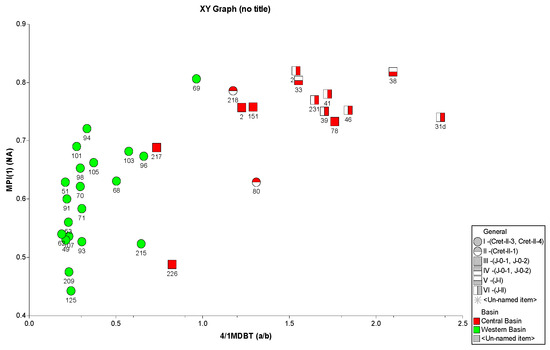
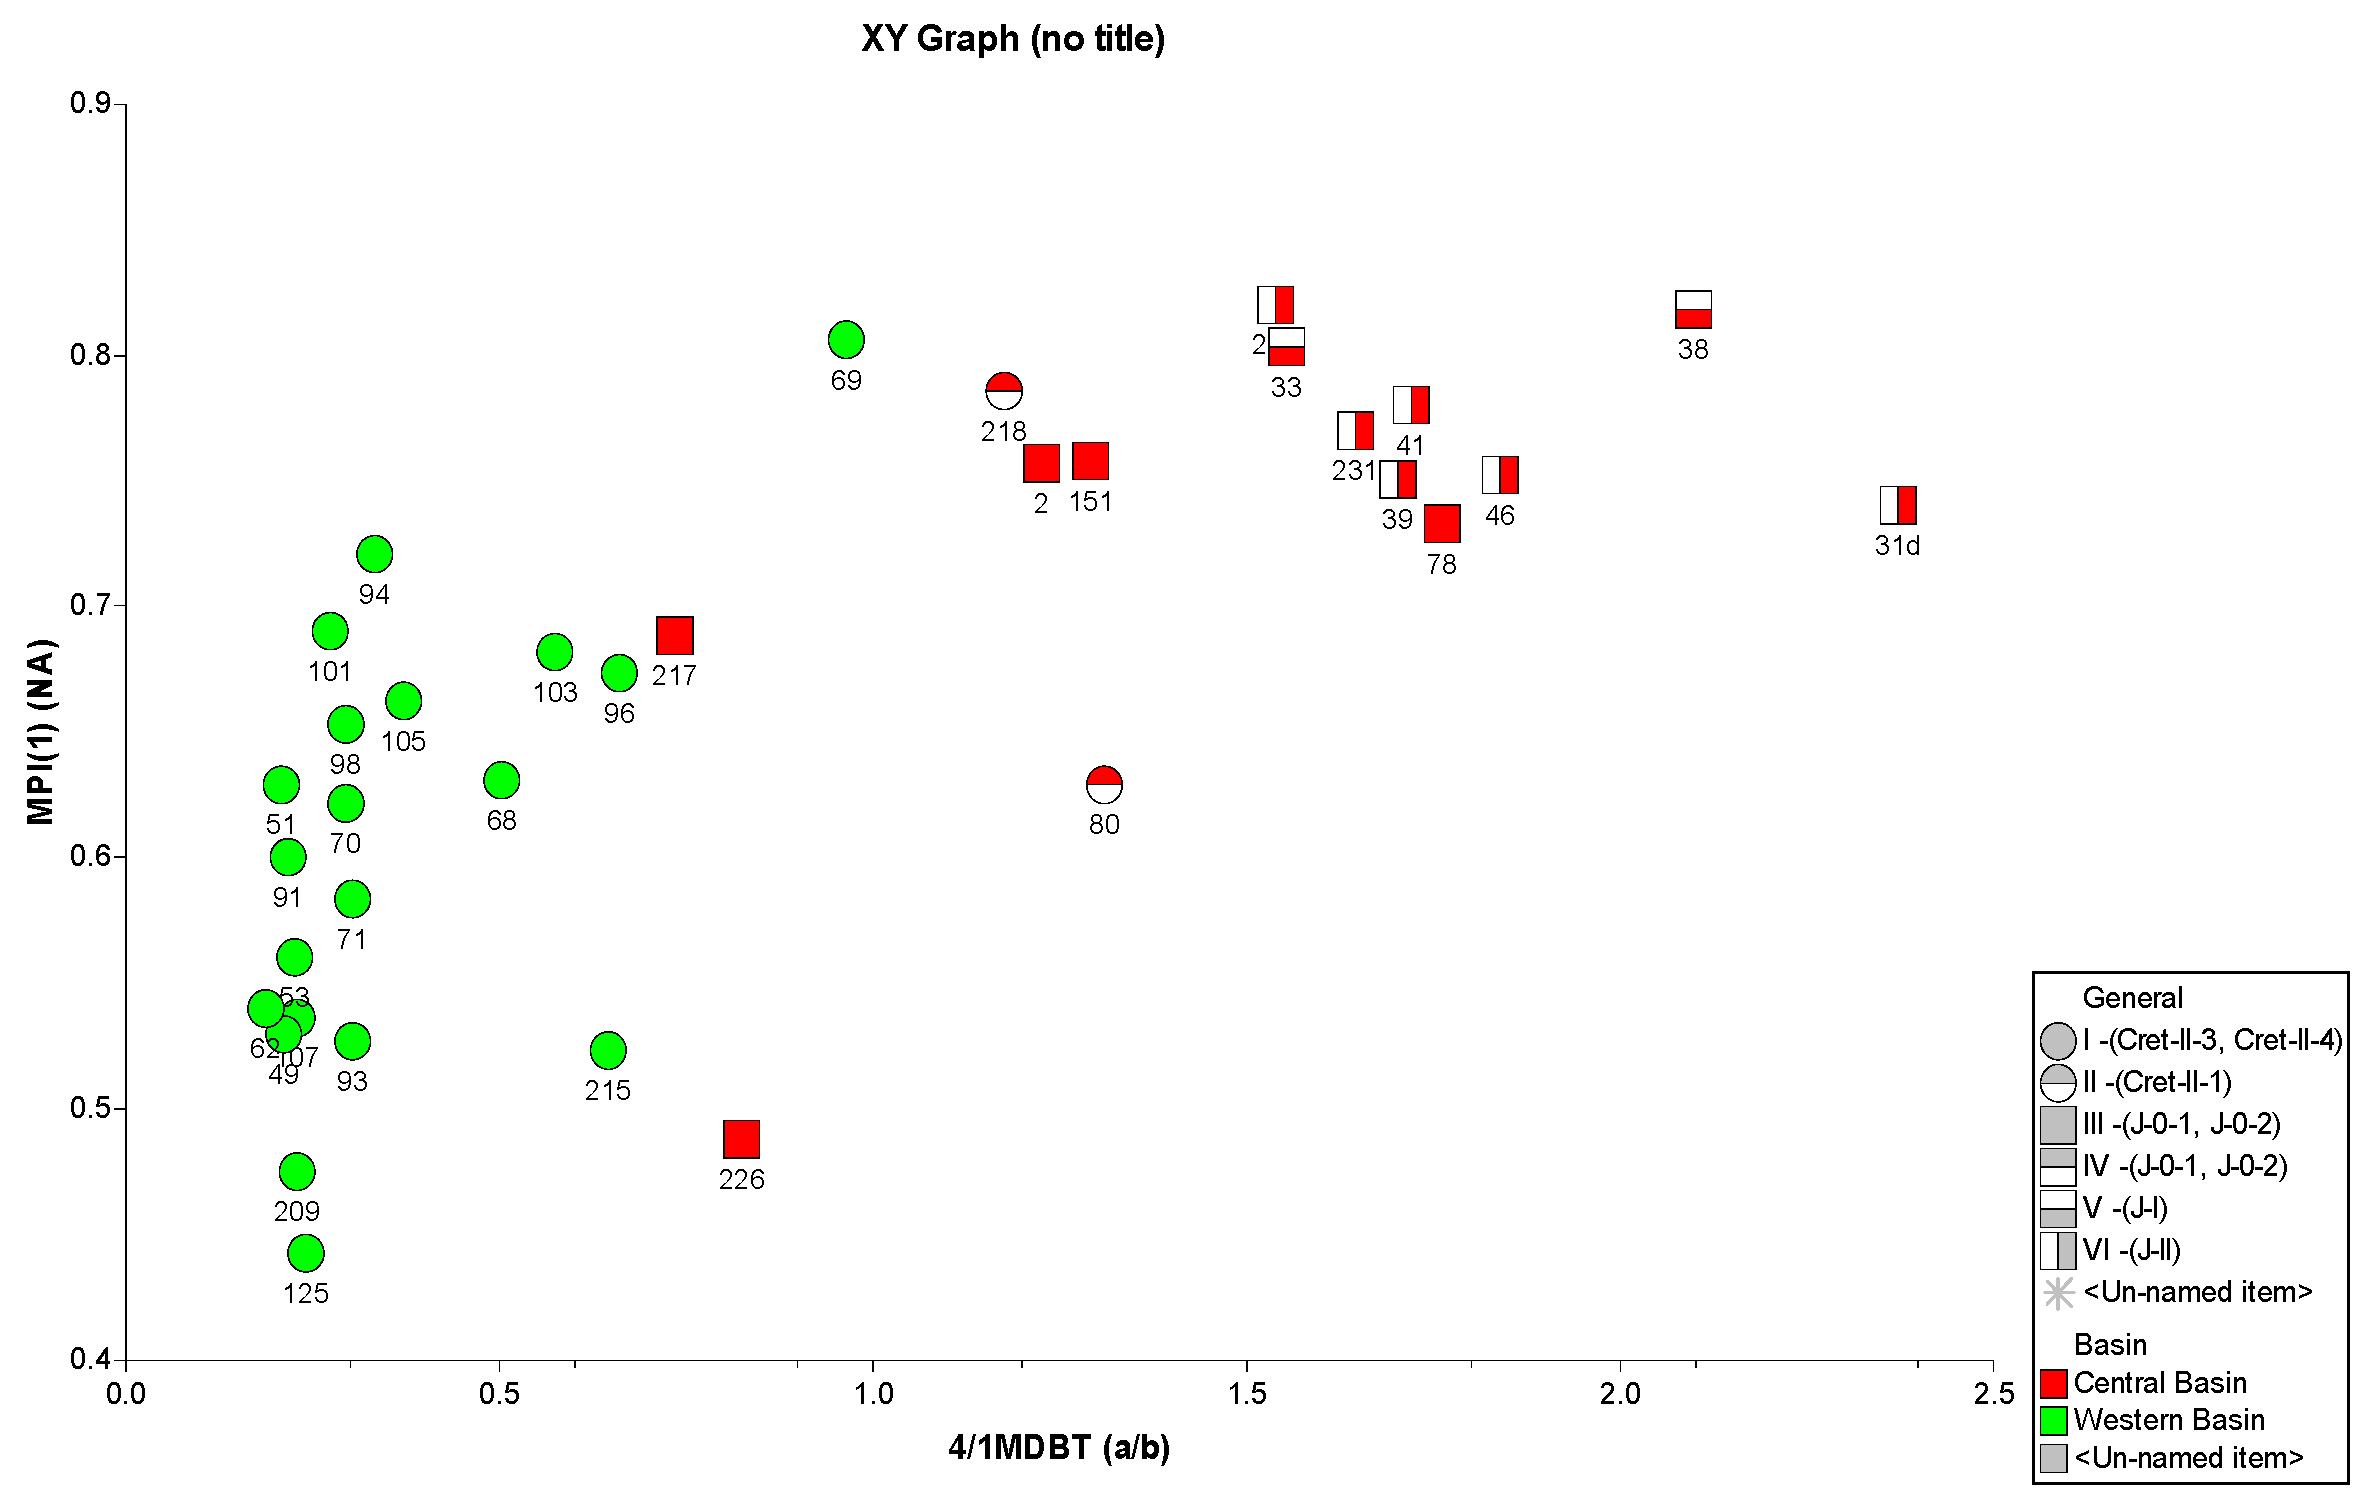
Thermal maturity was evaluated based on the relationship between the methyldibenzothiophene ratio (4MDBT/1MDBT) and the methylphenanthrene index (MPI-1), both of which increase with increasing thermal maturity [16]. The analysis shows that oils from Central Nuraly are characterized by a higher degree of thermal maturity compared with oils from West Nuraly (Figure 17).
Figure 17.
Relationship between the 4MDBT/1MDBT ratio and the methylphenanthrene index (MPI-1) [27,28].
A lateral trend of decreasing thermal maturity is also observed from the northeastern to the southwestern part of the field, which may reflect the direction of secondary hydrocarbon migration. The higher maturity observed in the northeastern zones may be associated with the presence of gas caps in this area. It is additionally noted that individual wells (e.g., well No. 69) show higher thermal maturity than neighboring samples, suggesting local heterogeneity within the system.
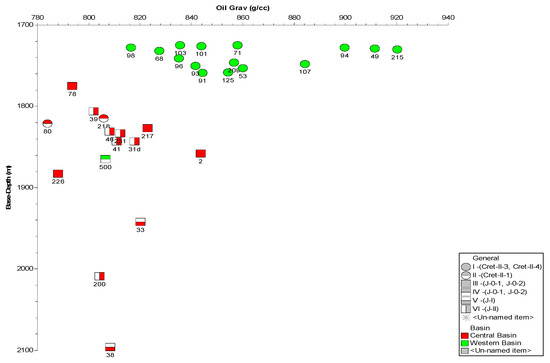
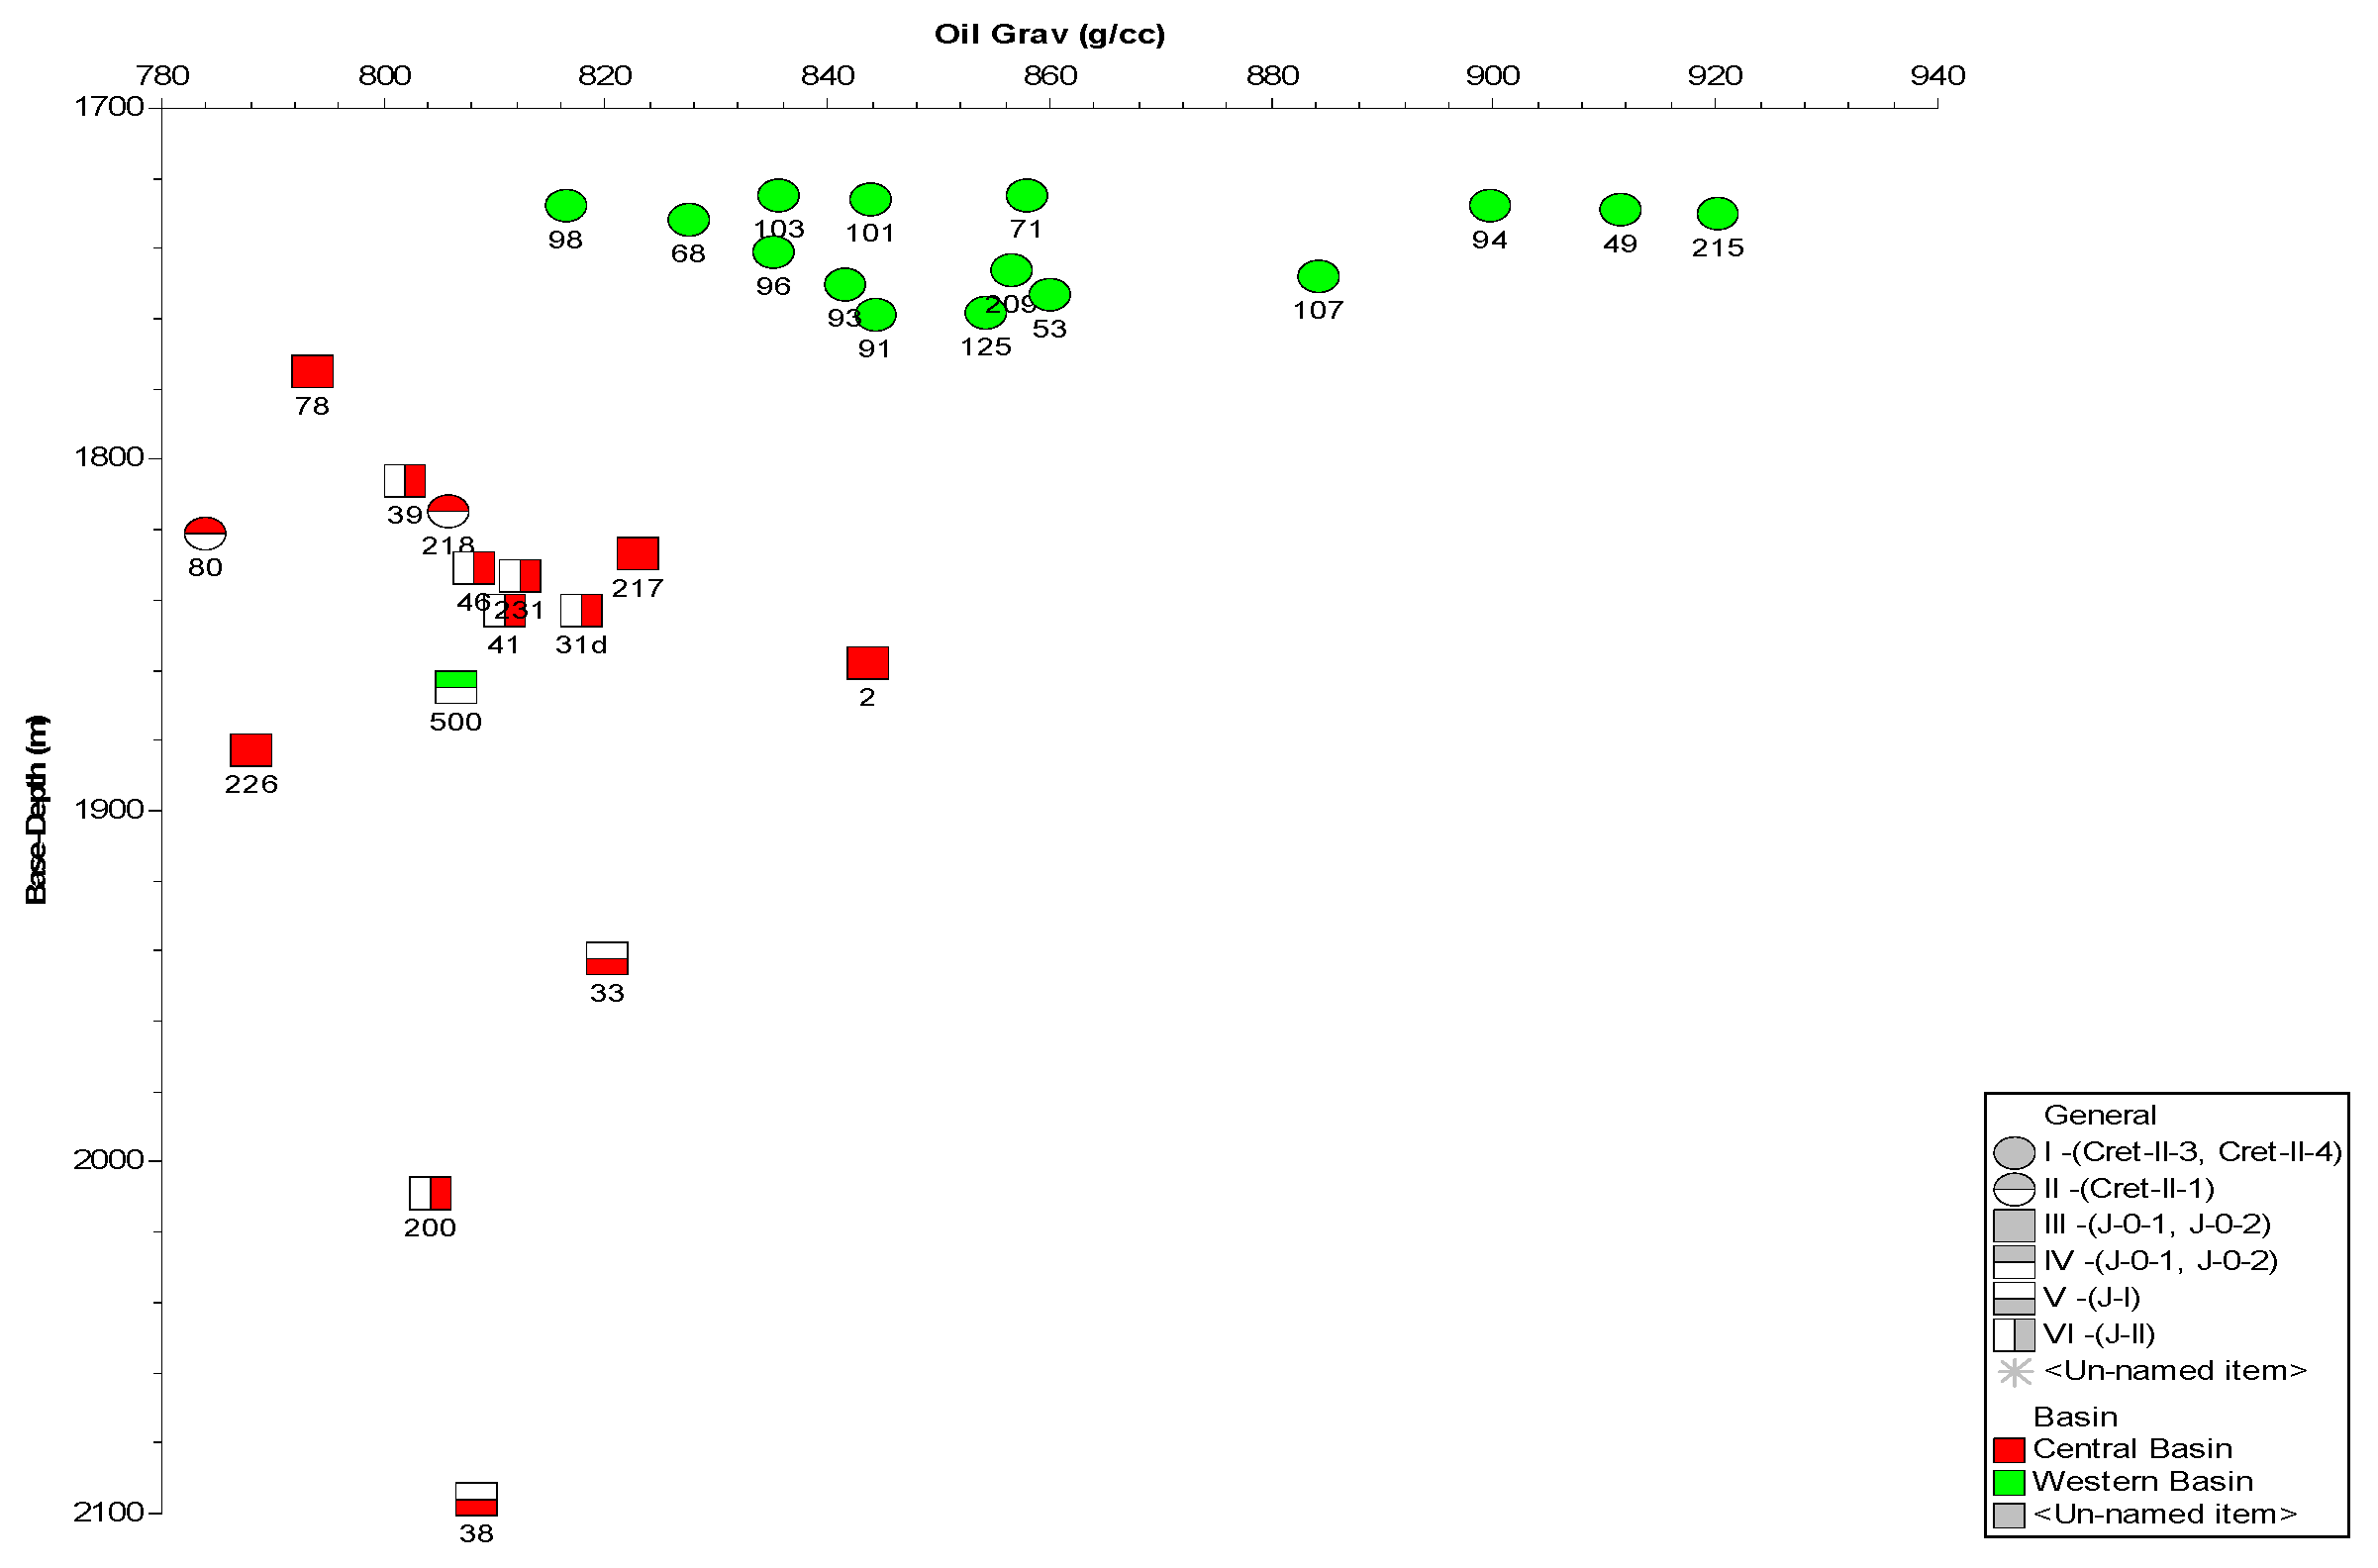
Comparison of oil density with burial depth shows that lighter oils are associated with Central Nuraly (Figure 18). This trend may be related to increasing thermal maturity and cracking of higher-molecular-weight hydrocarbons. More mature oils also tend to exhibit higher saturation pressures and gas–oil ratios.
Figure 18.
Relationship between oil density and burial depth in the Nuraly field [27,28].
The age of the source rocks (oil-source rocks) can be determined based on evolutionary changes in biomass and microorganisms reflected in the biomarker composition of oils. However, the application of age-related biomarker indicators requires caution, as many have limited applicability and must be confirmed by oil–rock correlation.
It should also be considered that SIM mode analysis has limited selectivity, which may lead to signal overlap and reduced accuracy in age interpretation. More reliable results can be obtained using MRM mode.
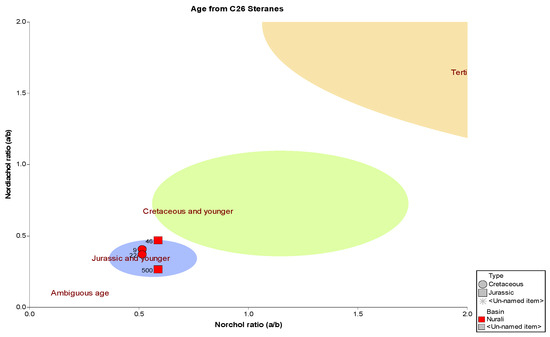
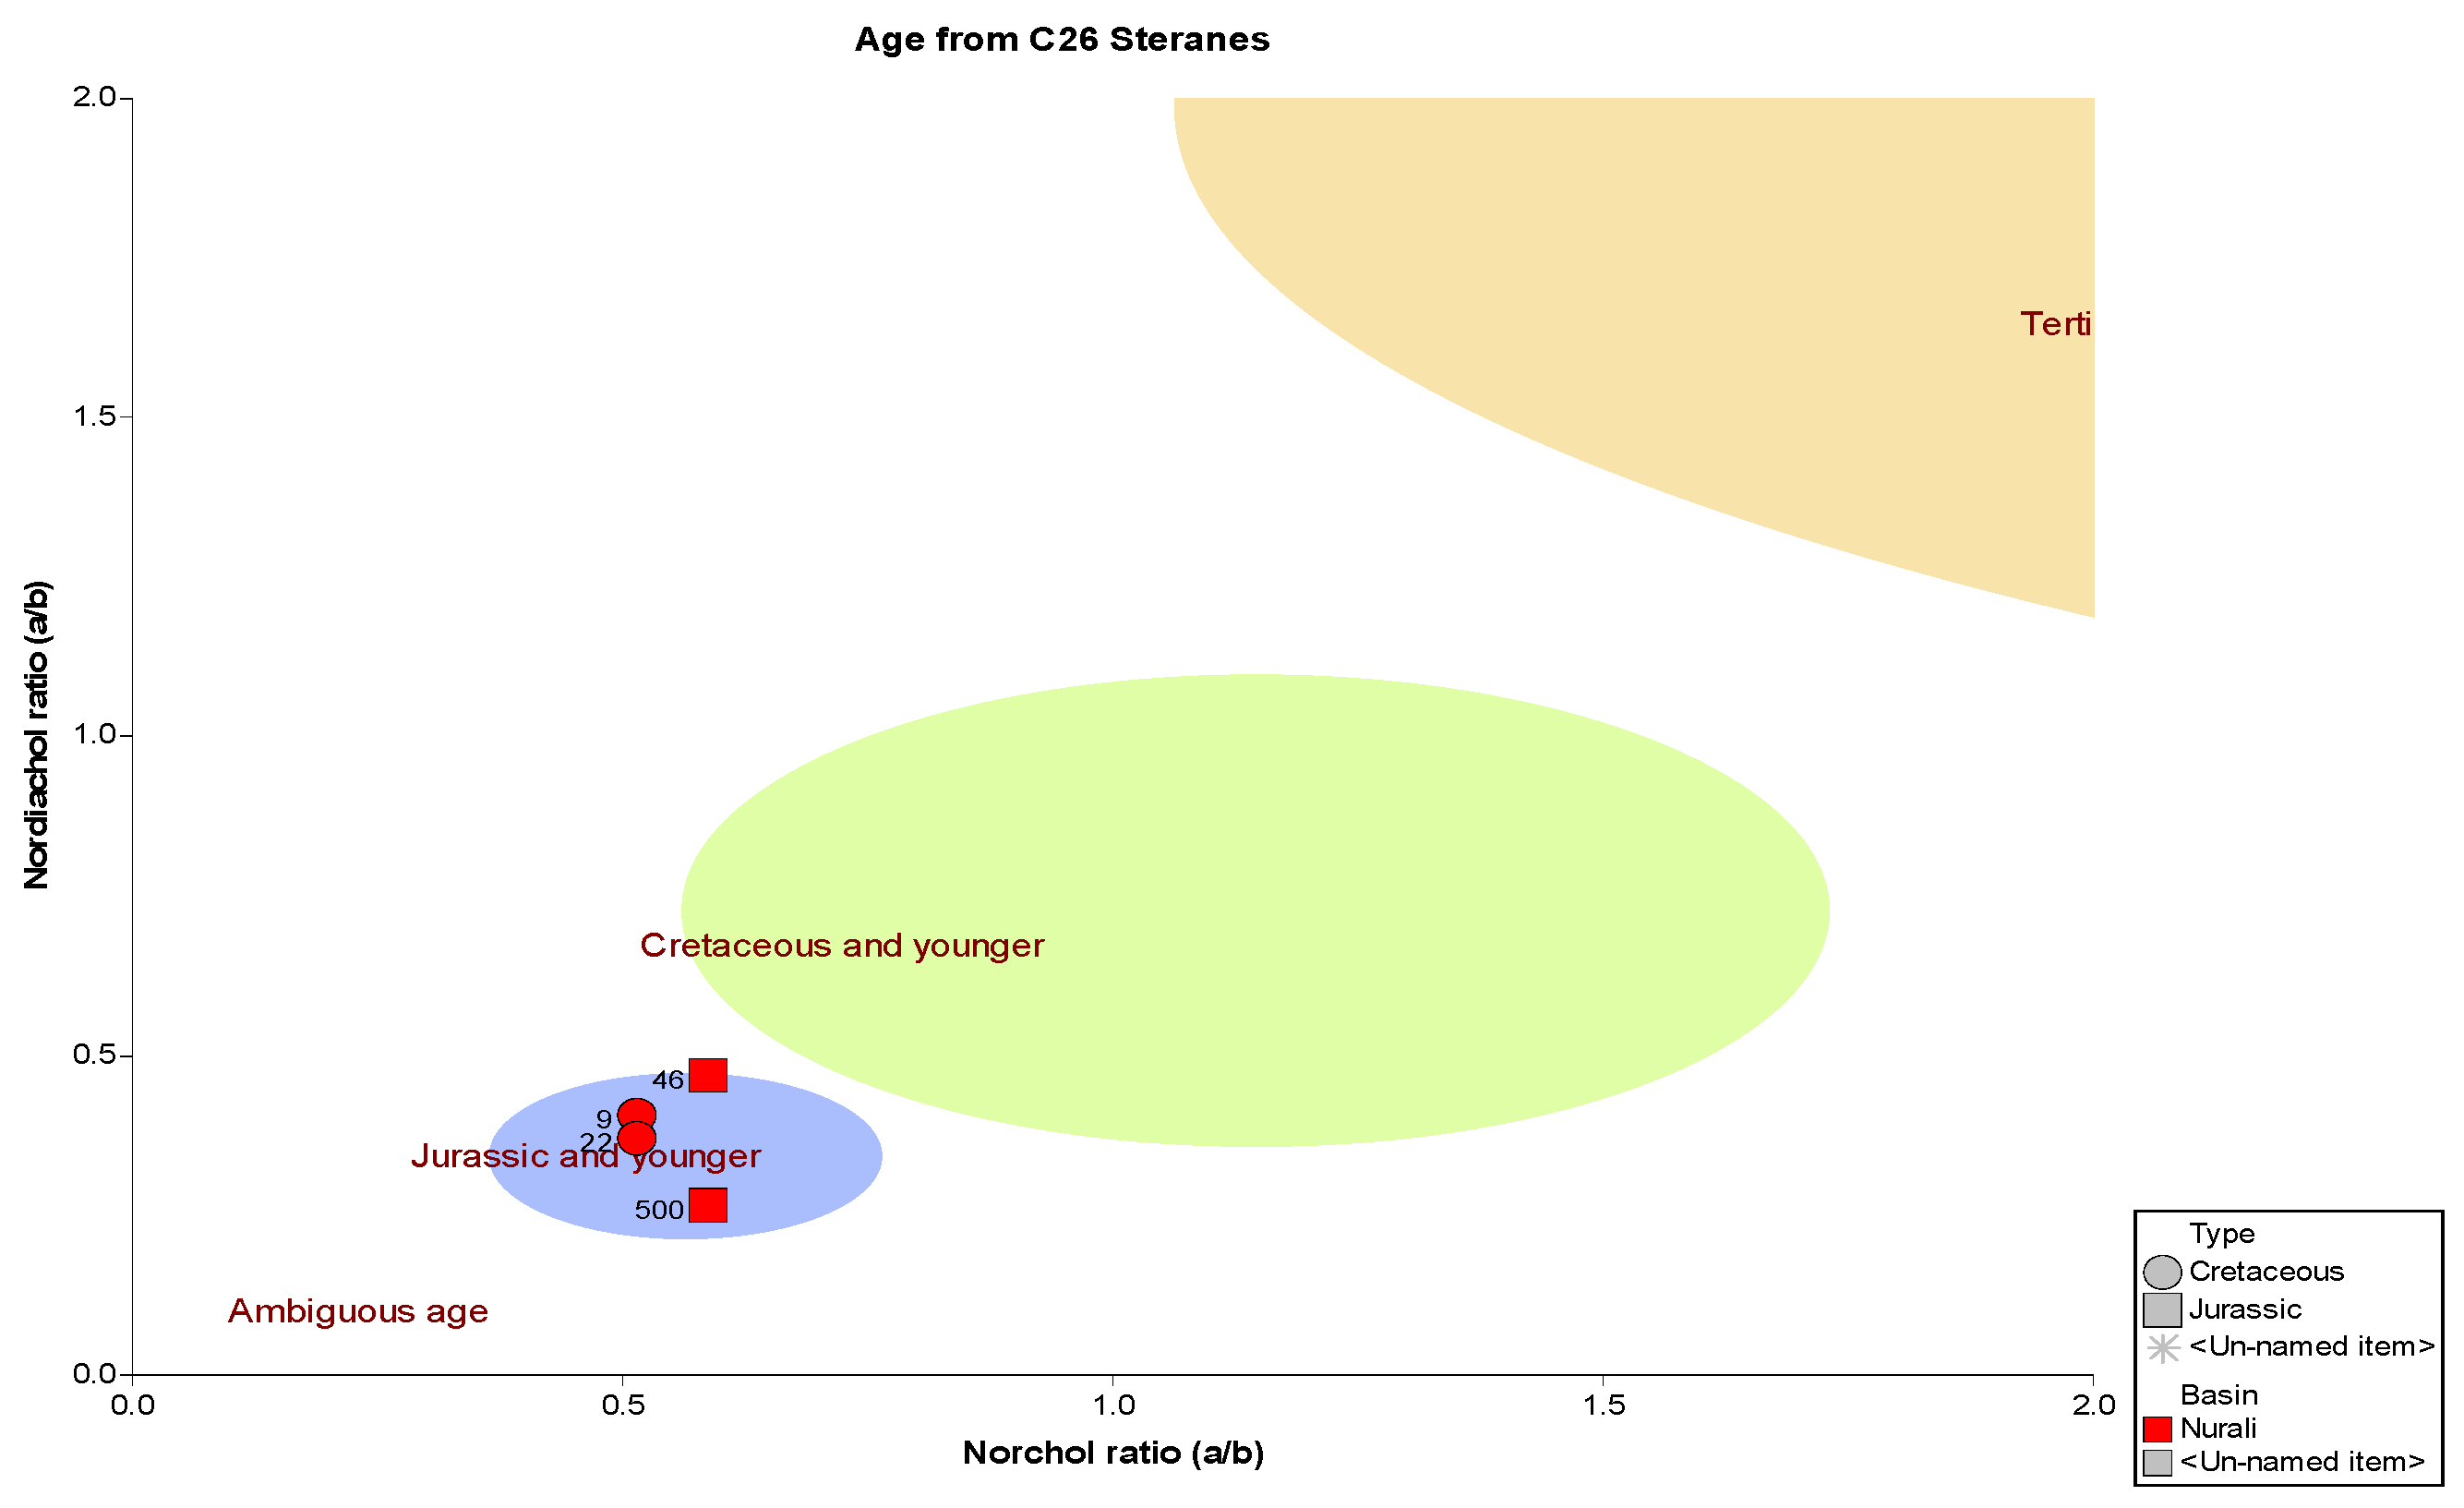
Nevertheless, previous studies using MRM for several Nuraly samples suggested a Jurassic age for the source rocks based on the norcholestane/nordiacholestane ratio (Figure 19) [27,28]. However, additional independent methods are required for final verification.
Figure 19.
Graph of the relationship between norcholestane and nordiacholestane [27,28].
To establish the genetic relationship between the studied samples, two approaches were used: principal component analysis (PCA) and comparative analysis of biomarker mass fragmentograms.
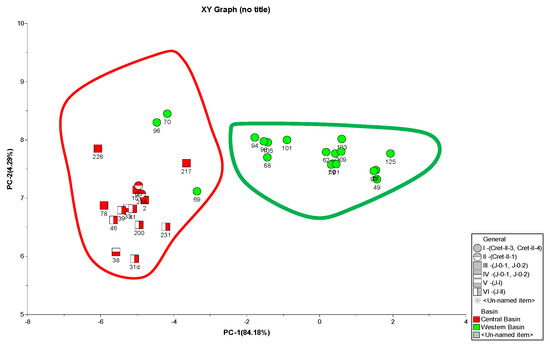
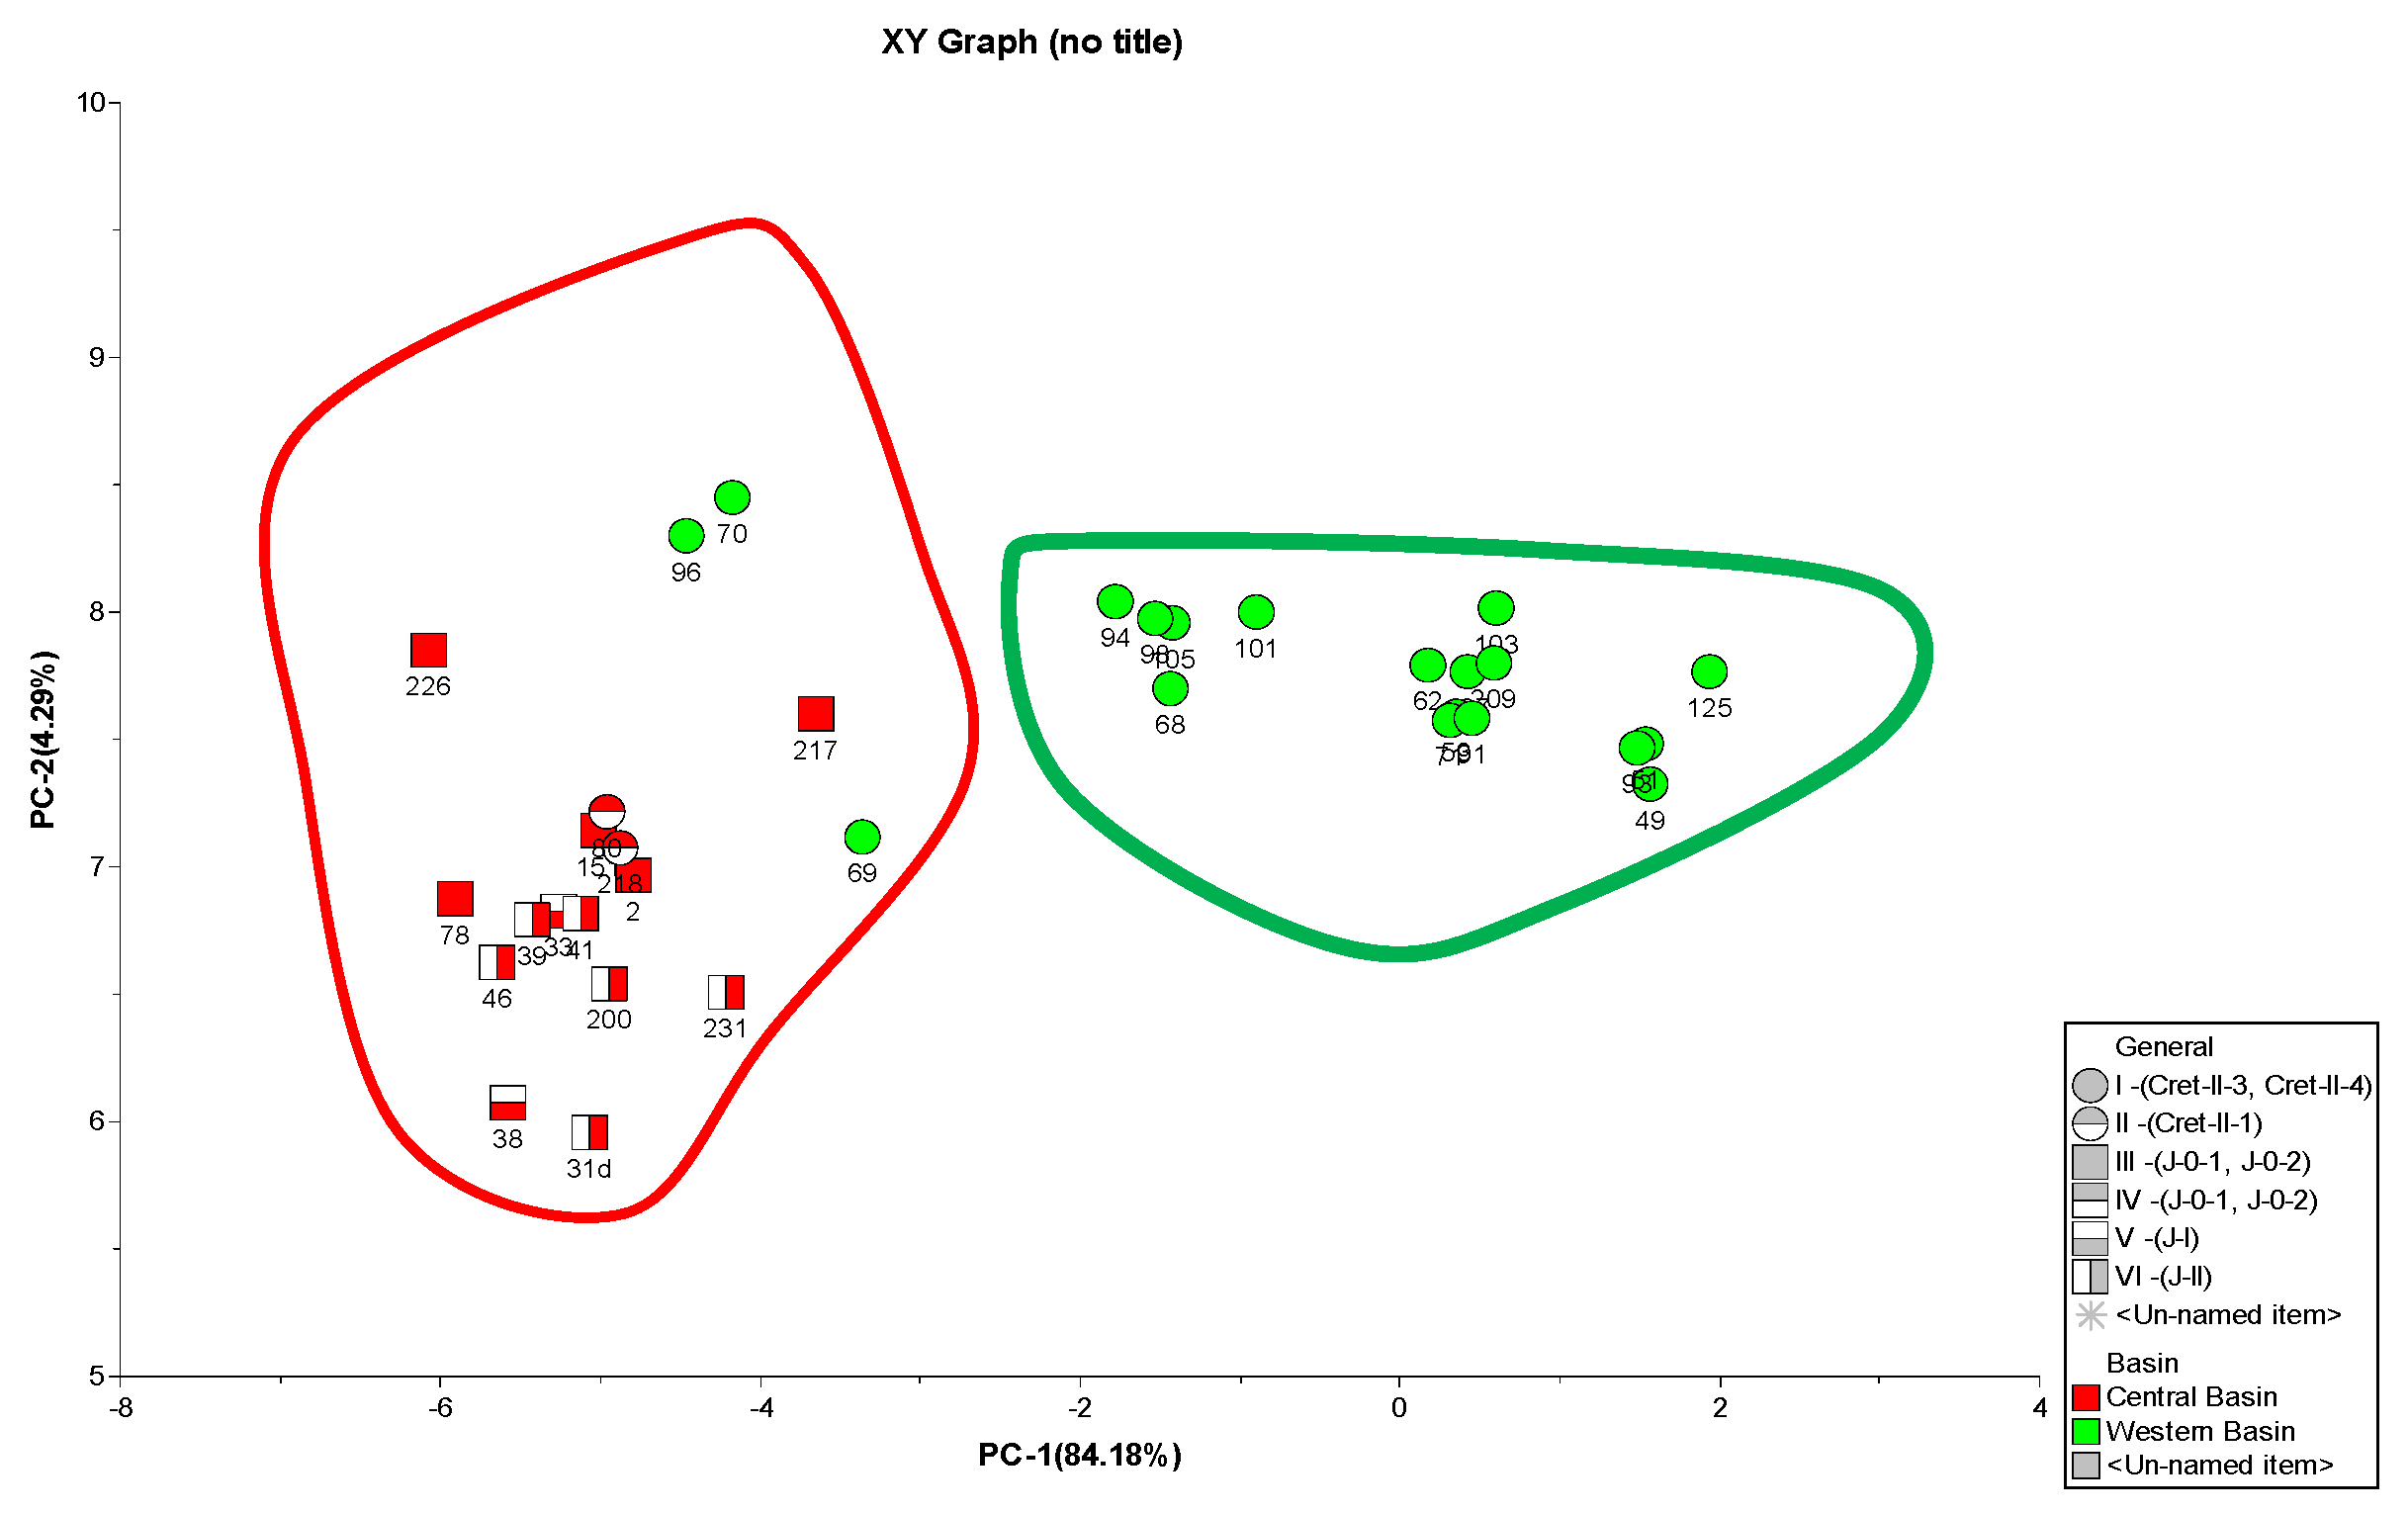
The PCA results, performed in the PIGI software environment, showed that the first two principal components explain 88.47% of the total variance. The graphical interpretation revealed two main oil clusters. Central Nuraly together with part of the West Nuraly samples forms a single group, suggesting geochemical similarity and possible genetic affinity, while some individual samples deviate from the general trend (Figure 20).
Figure 20.
2D PCA analysis of the studied oils based on biomarker composition [27,28].
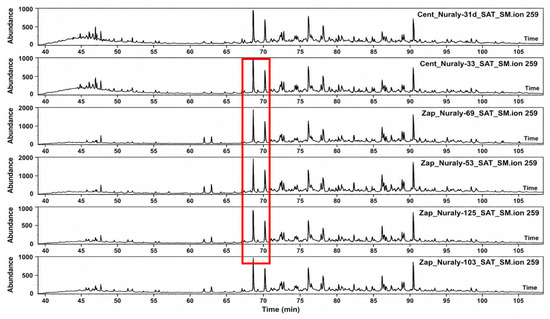
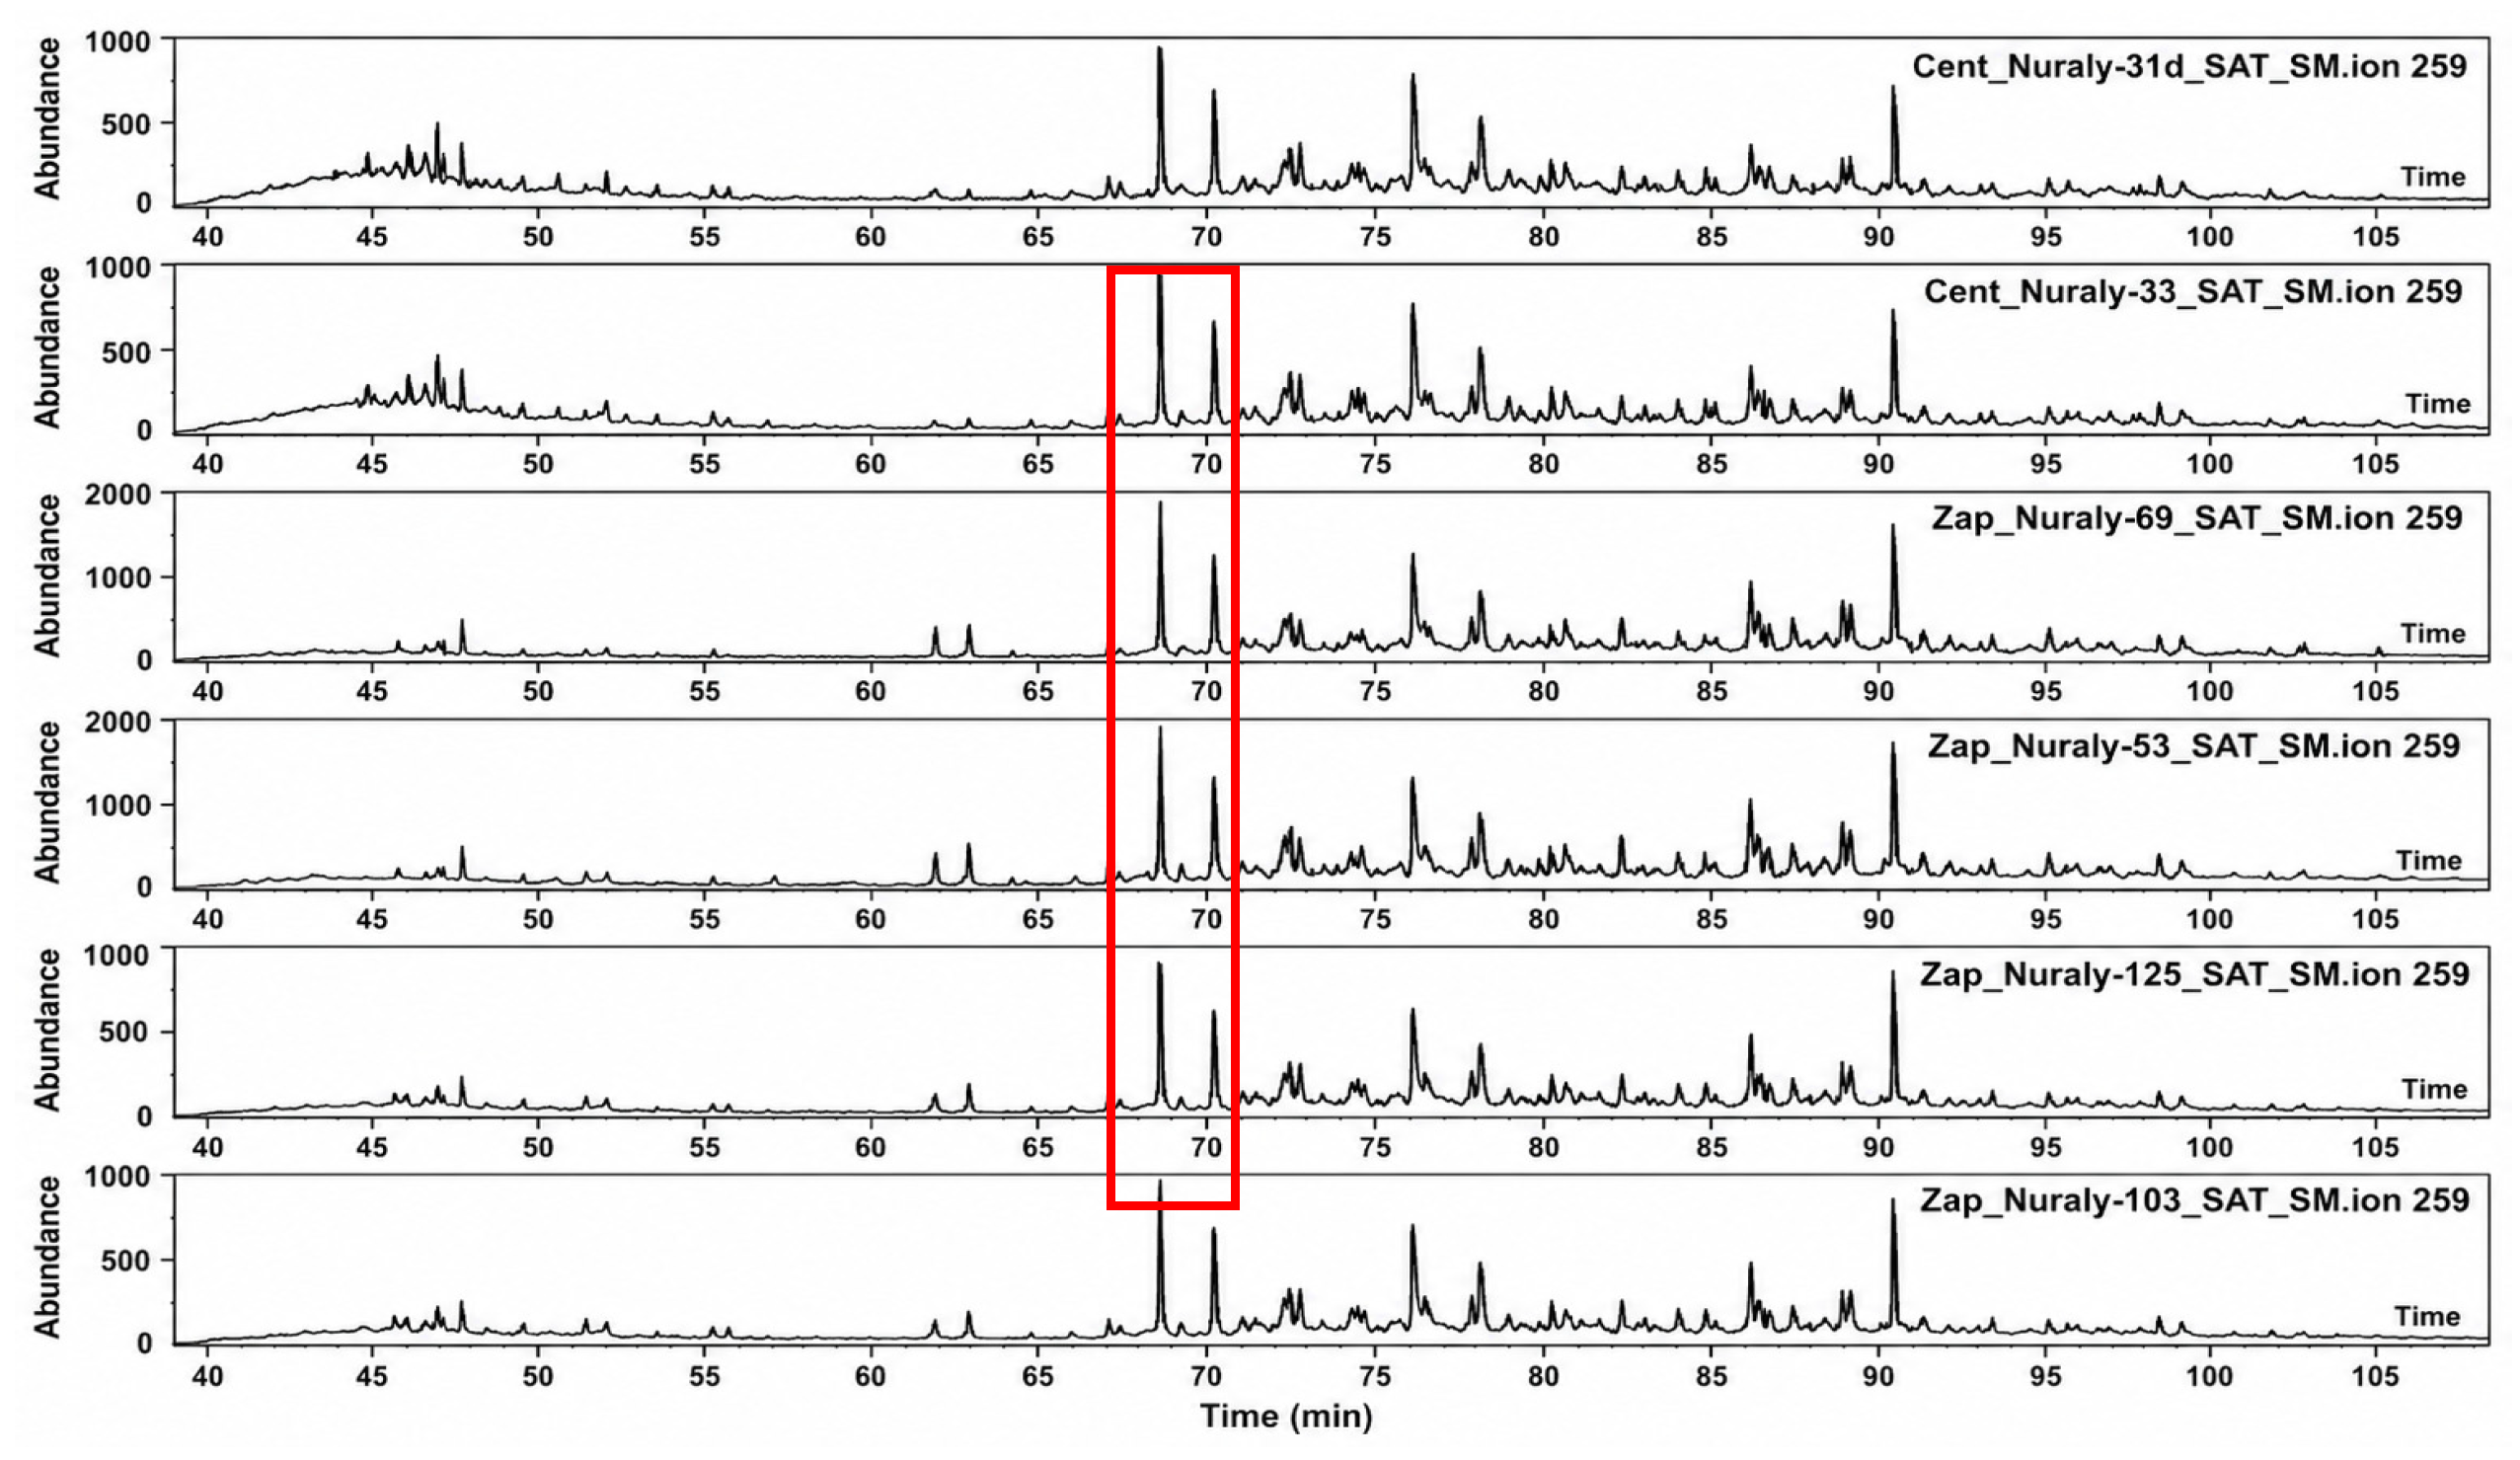
Visual analysis of diasteranes (m/z 259) confirmed differences between the groups: several samples from West Nuraly exhibited additional peaks that were absent in Central Nuraly oils, further supporting geochemical differences between these oil groups (Figure 21).
Figure 21.
Mass fragmentogram of diasteranes in representative oil samples based on the m/z 259 ion. The red box indicates the region containing the characteristic diasterane peaks used for comparison between the oil samples.
3.3. Akshabulak Fields
Oil Fingerprinting. Each oil sample from a single well was analyzed in duplicate to evaluate the reproducibility of the method and the reliability of the software packages (OpenLab, Malcom, PIGI). Duplicate chromatograms were processed with peak integration, after which peak areas were automatically calculated in two independent software environments—OpenLab and Malcom—and subsequently compared. Based on OpenLab data, star diagrams were constructed in Excel, and principal component analysis (PCA) was performed in the PIGI software package. In parallel, using Malcom data, a Ward’s dendrogram was constructed. The comparison of results obtained from duplicates and processed using three independent approaches showed high consistency, confirming the reproducibility of the methodology and indicating the absence of significant analytical or software-related discrepancies at the evaluated stages, from sampling to data processing.
(a) Star diagram. Comparison of the aromatic parameters of 128 oil samples from the Central, South, and East Akshabulak fields using star diagrams in Excel identified four stable oil groups. The identified groups differ in their aromatic distribution profiles and are visually separated in the diagram using color coding (Figure 22).
Figure 22.
Star diagram of all oils based on fingerprinting [27,29].
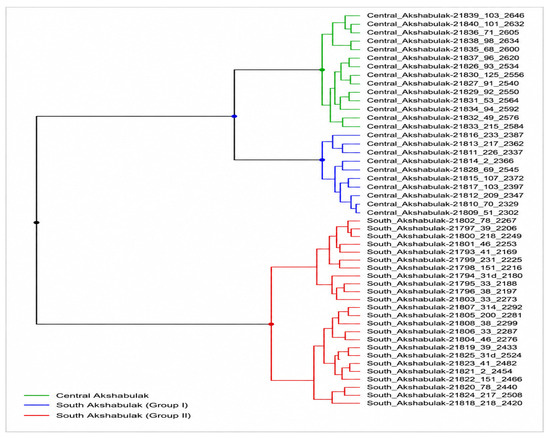
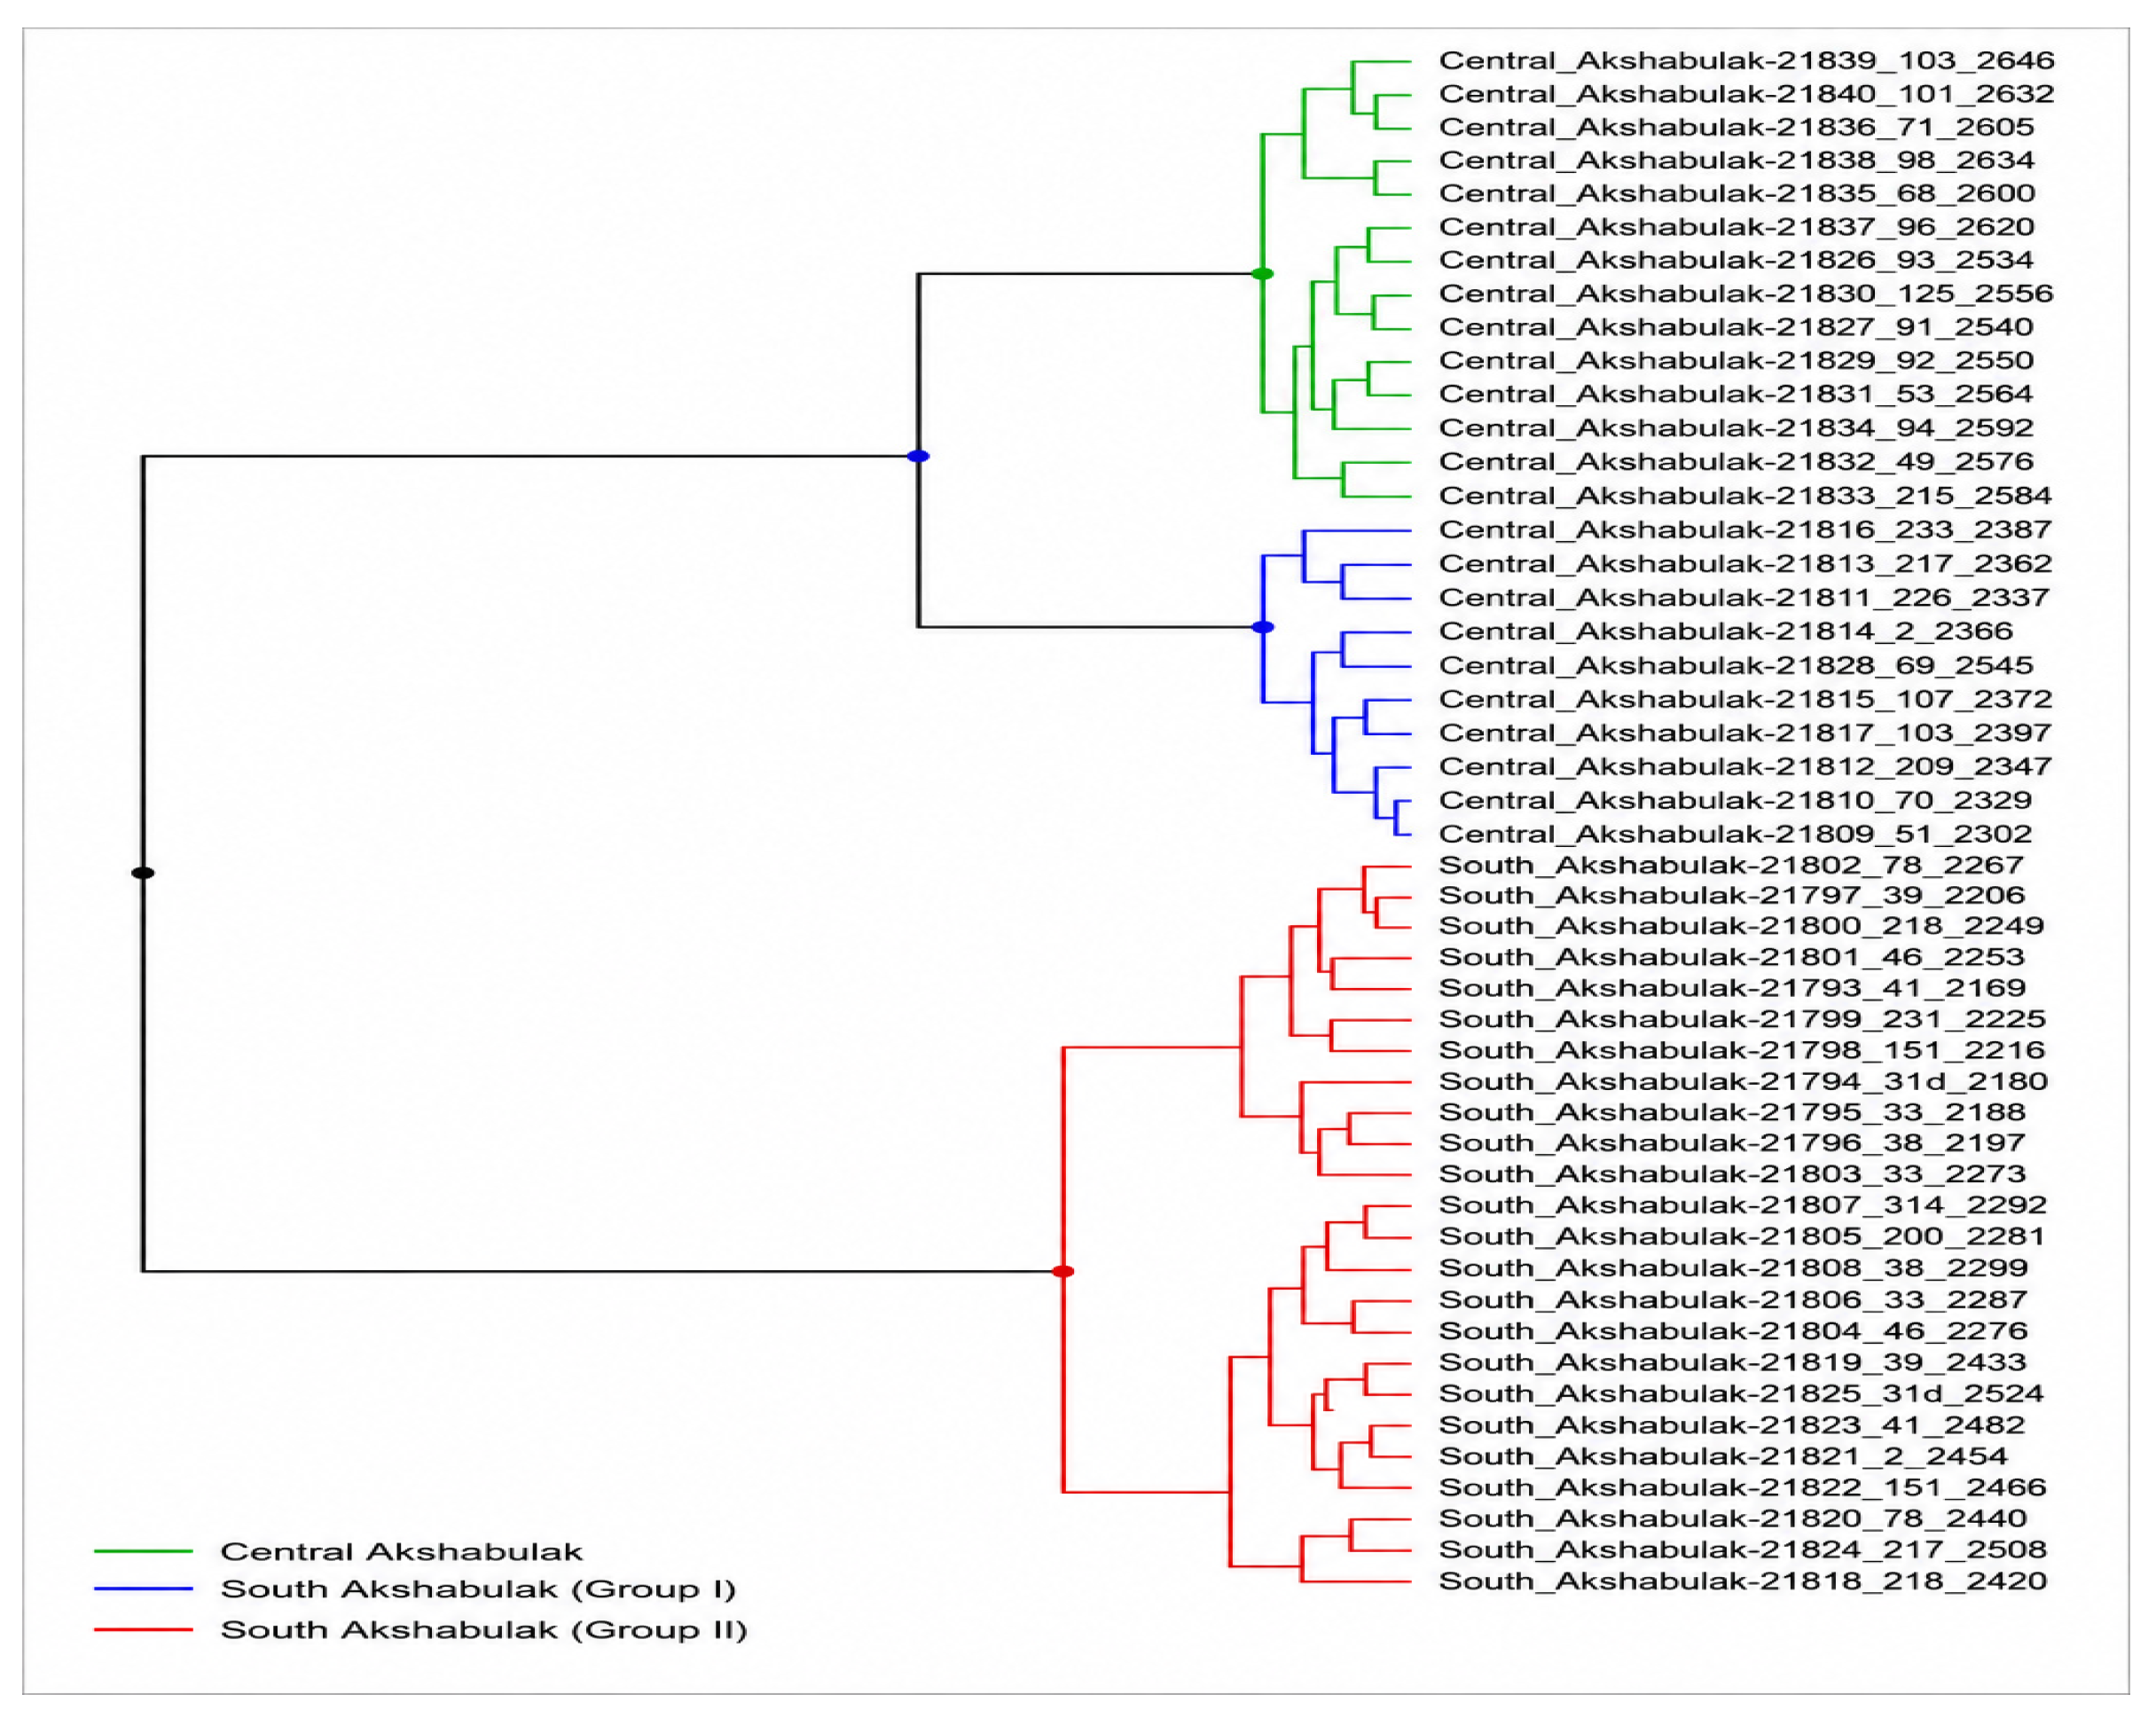
(b) Ward’s dendrogram reflects the degree of similarity between samples and clusters, as well as the sequence of their aggregation. Based on fingerprinting data, three main oil groups are identified (Figure 23), marked in green, blue, and red. In addition, the fingerprinting results distinguish one mixed subgroup and one anomalous subtype [23,24].
Figure 23.
Ward’s dendrogram of all oils based on fingerprinting [27,29].
In contrast to the star diagram, Ward’s clustering analysis indicates partial overlap between the third principal group and the mixed subgroup, resulting in their partial aggregation within the dendrogram.
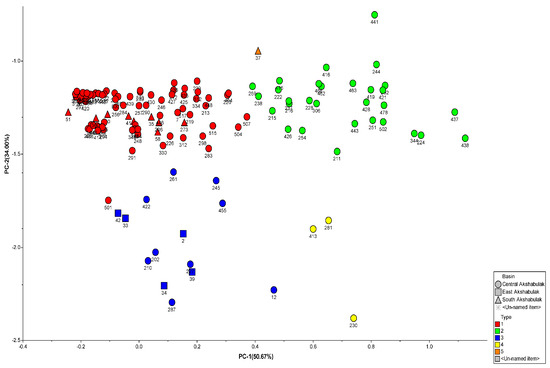
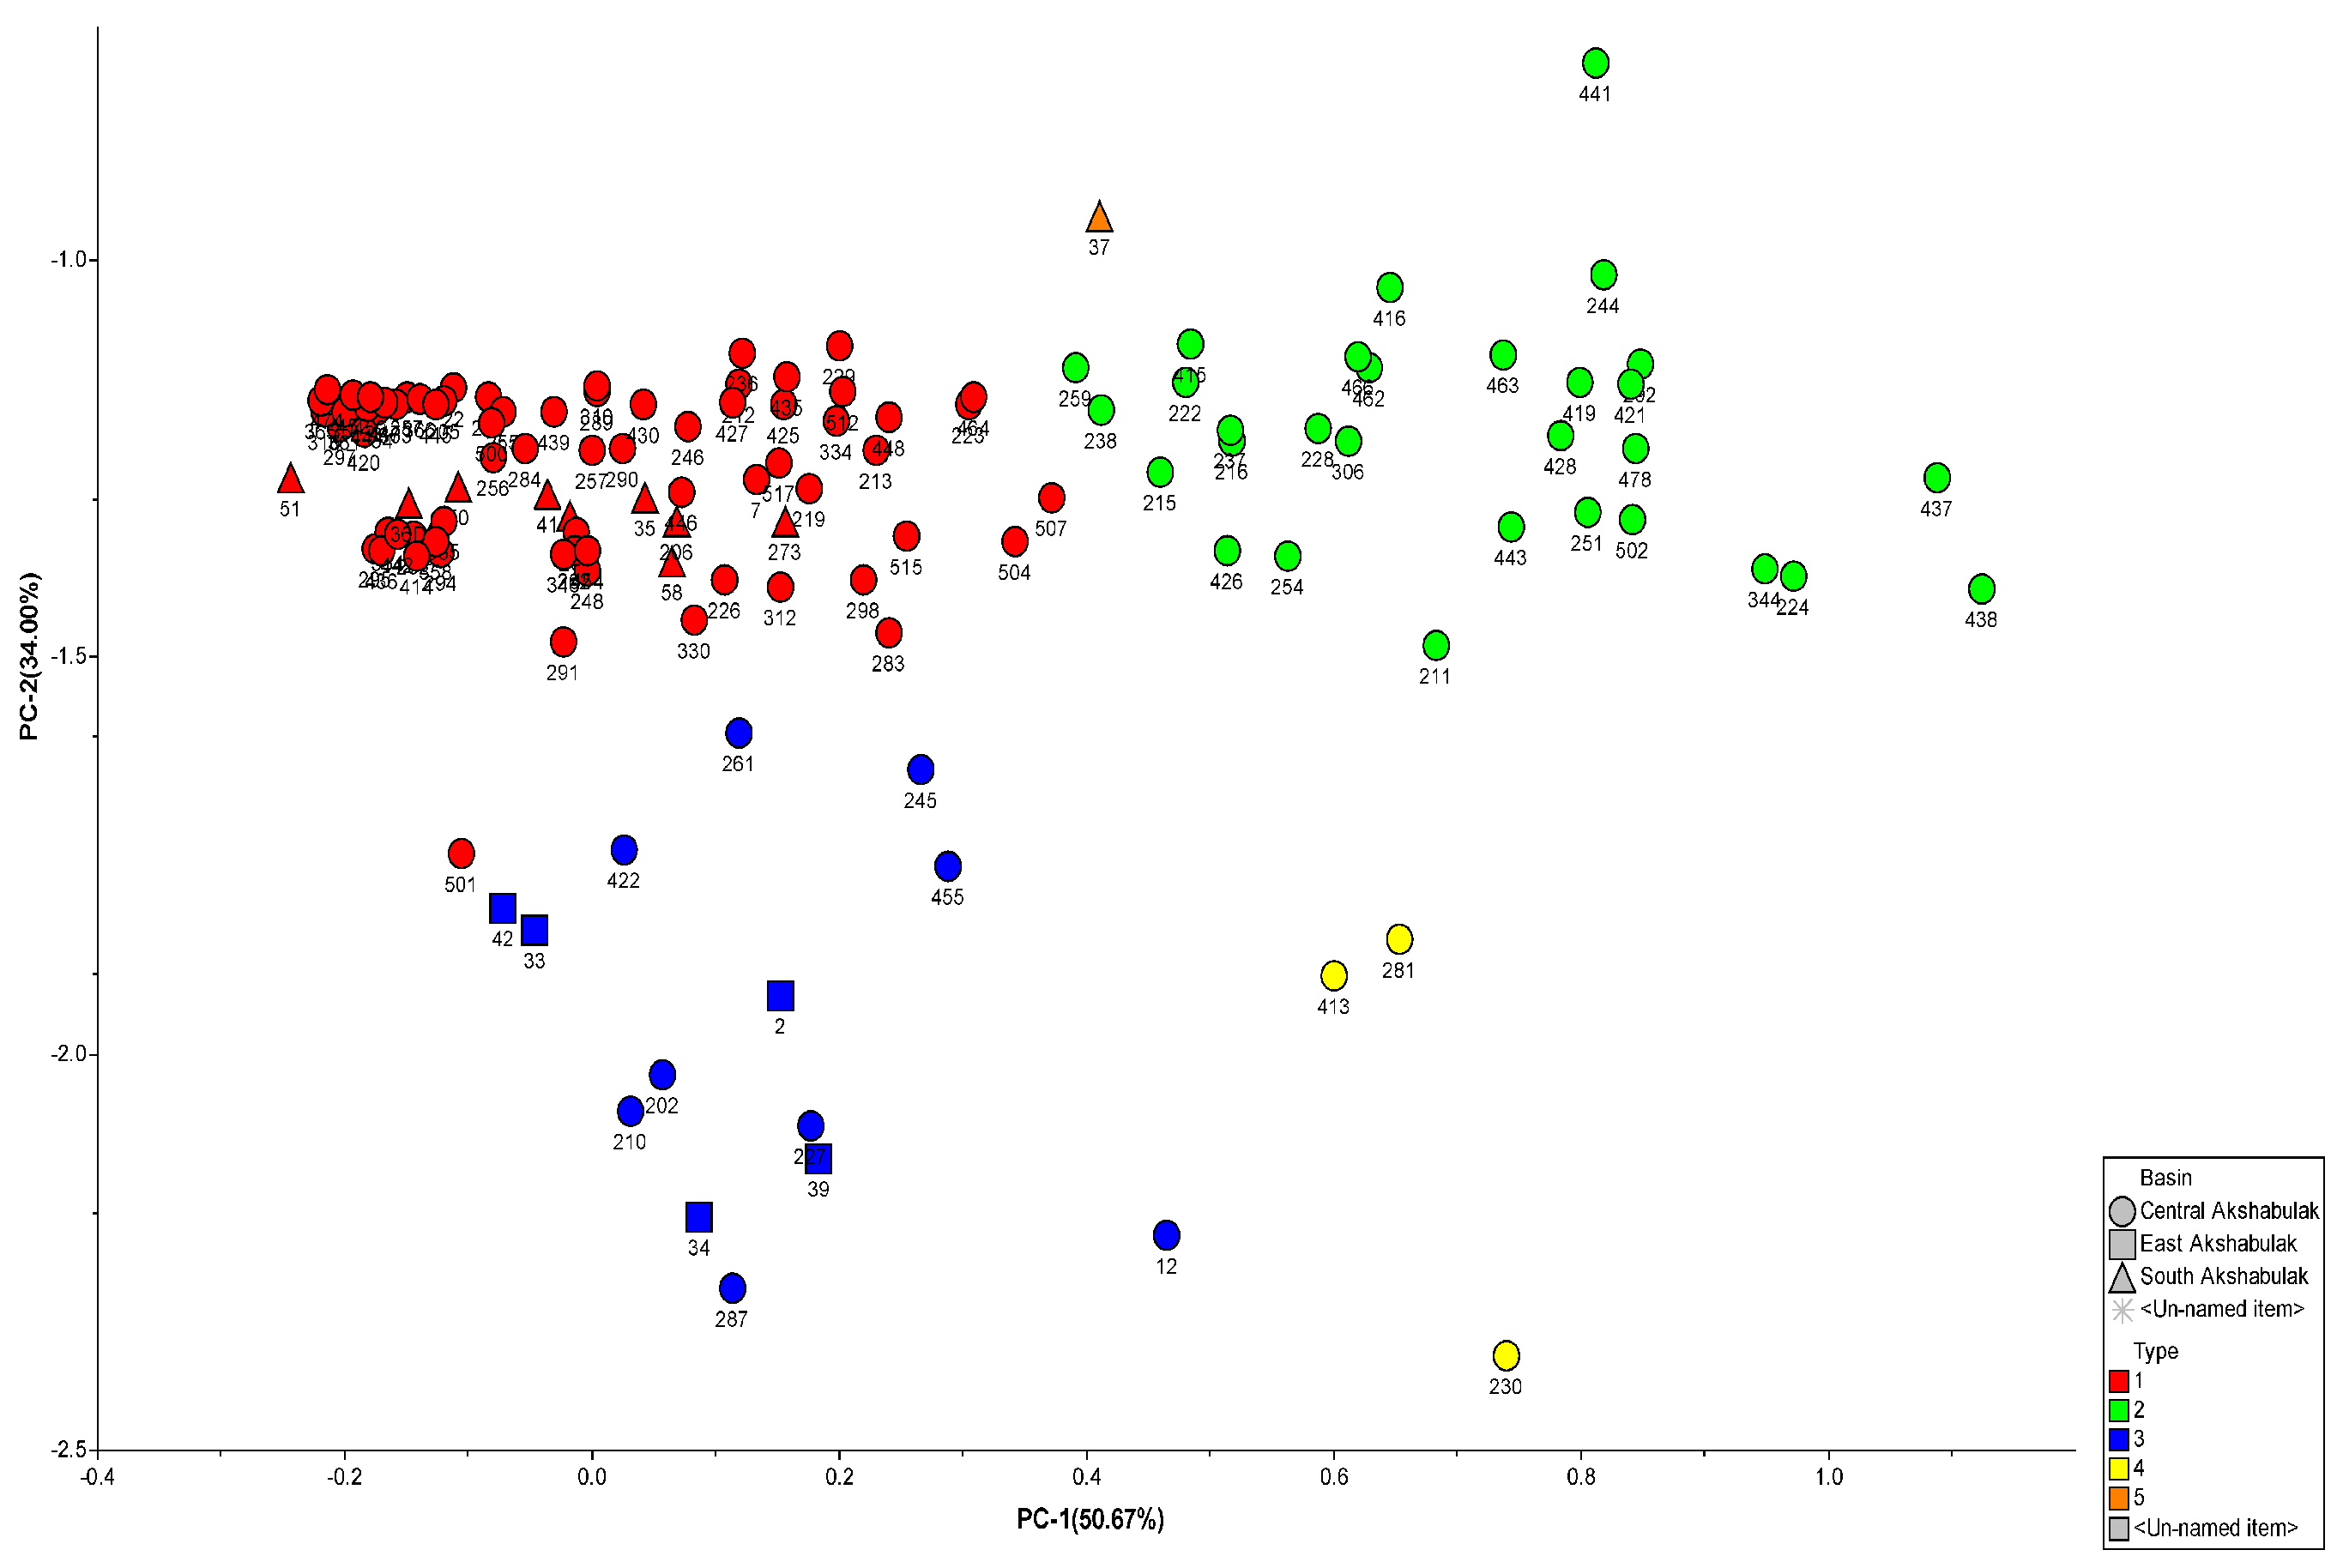
(c) Principal component analysis (PCA). The first and second principal components (PC1 and PC2) explain 50.67% and 34.00% of the total variability, respectively, together accounting for 84.67% of the data variance (Figure 24).
Figure 24.
2D PCA analysis of all oils based on oil fingerprinting [27,29].
The PCA plot confirms the overall results of the star diagram and Ward’s dendrogram, distinguishing three principal oil groups, one mixed subgroup, and one anomalous subtype with distinct geochemical characteristics.
Based on the integrated fingerprinting results, three principal oil groups were identified and marked in red, green, and blue. In addition, a mixed subgroup was distinguished in yellow, whereas the oil from well No. 37 represented an anomalous subtype marked in brown (Figure 22, Figure 23 and Figure 24). Ward’s clustering partially merged the mixed subgroup with the third principal group because of their overlapping geochemical characteristics [23,24].
The first principal component (PC1) and the second principal component (PC2) explain 50.67% and 34.00% of the total variance, respectively, together accounting for 84.67% of the total variance (Figure 24). The PCA results support the integrated classification into three principal oil groups, one mixed subgroup, and one anomalous subtype.
Integration of the star-diagram patterns, Ward’s hierarchical clustering, PCA results, and the structural map of the Akshabulak group allowed the identification of three principal geochemical oil groups, one mixed subgroup, and one anomalous subtype.
The first group (red) is associated with Object I of the southern dome of Central Akshabulak, as well as with the northern-dome objects of South Akshabulak (Figure 25 and Figure 26). A similar oil type is also observed in the lower reservoirs (III, IV, and V) of Central Akshabulak, suggesting compositional similarity among these productive intervals. The similarity of oil characteristics between Object I and Objects III–V may indicate possible vertical hydrocarbon migration from deeper reservoirs.
Figure 25.
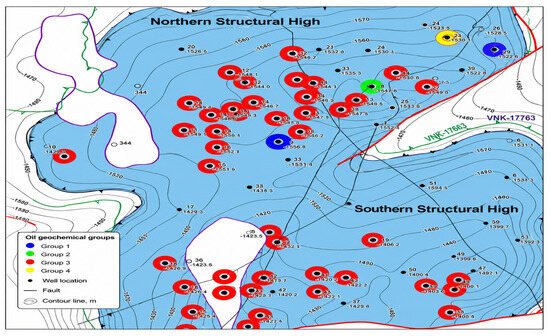
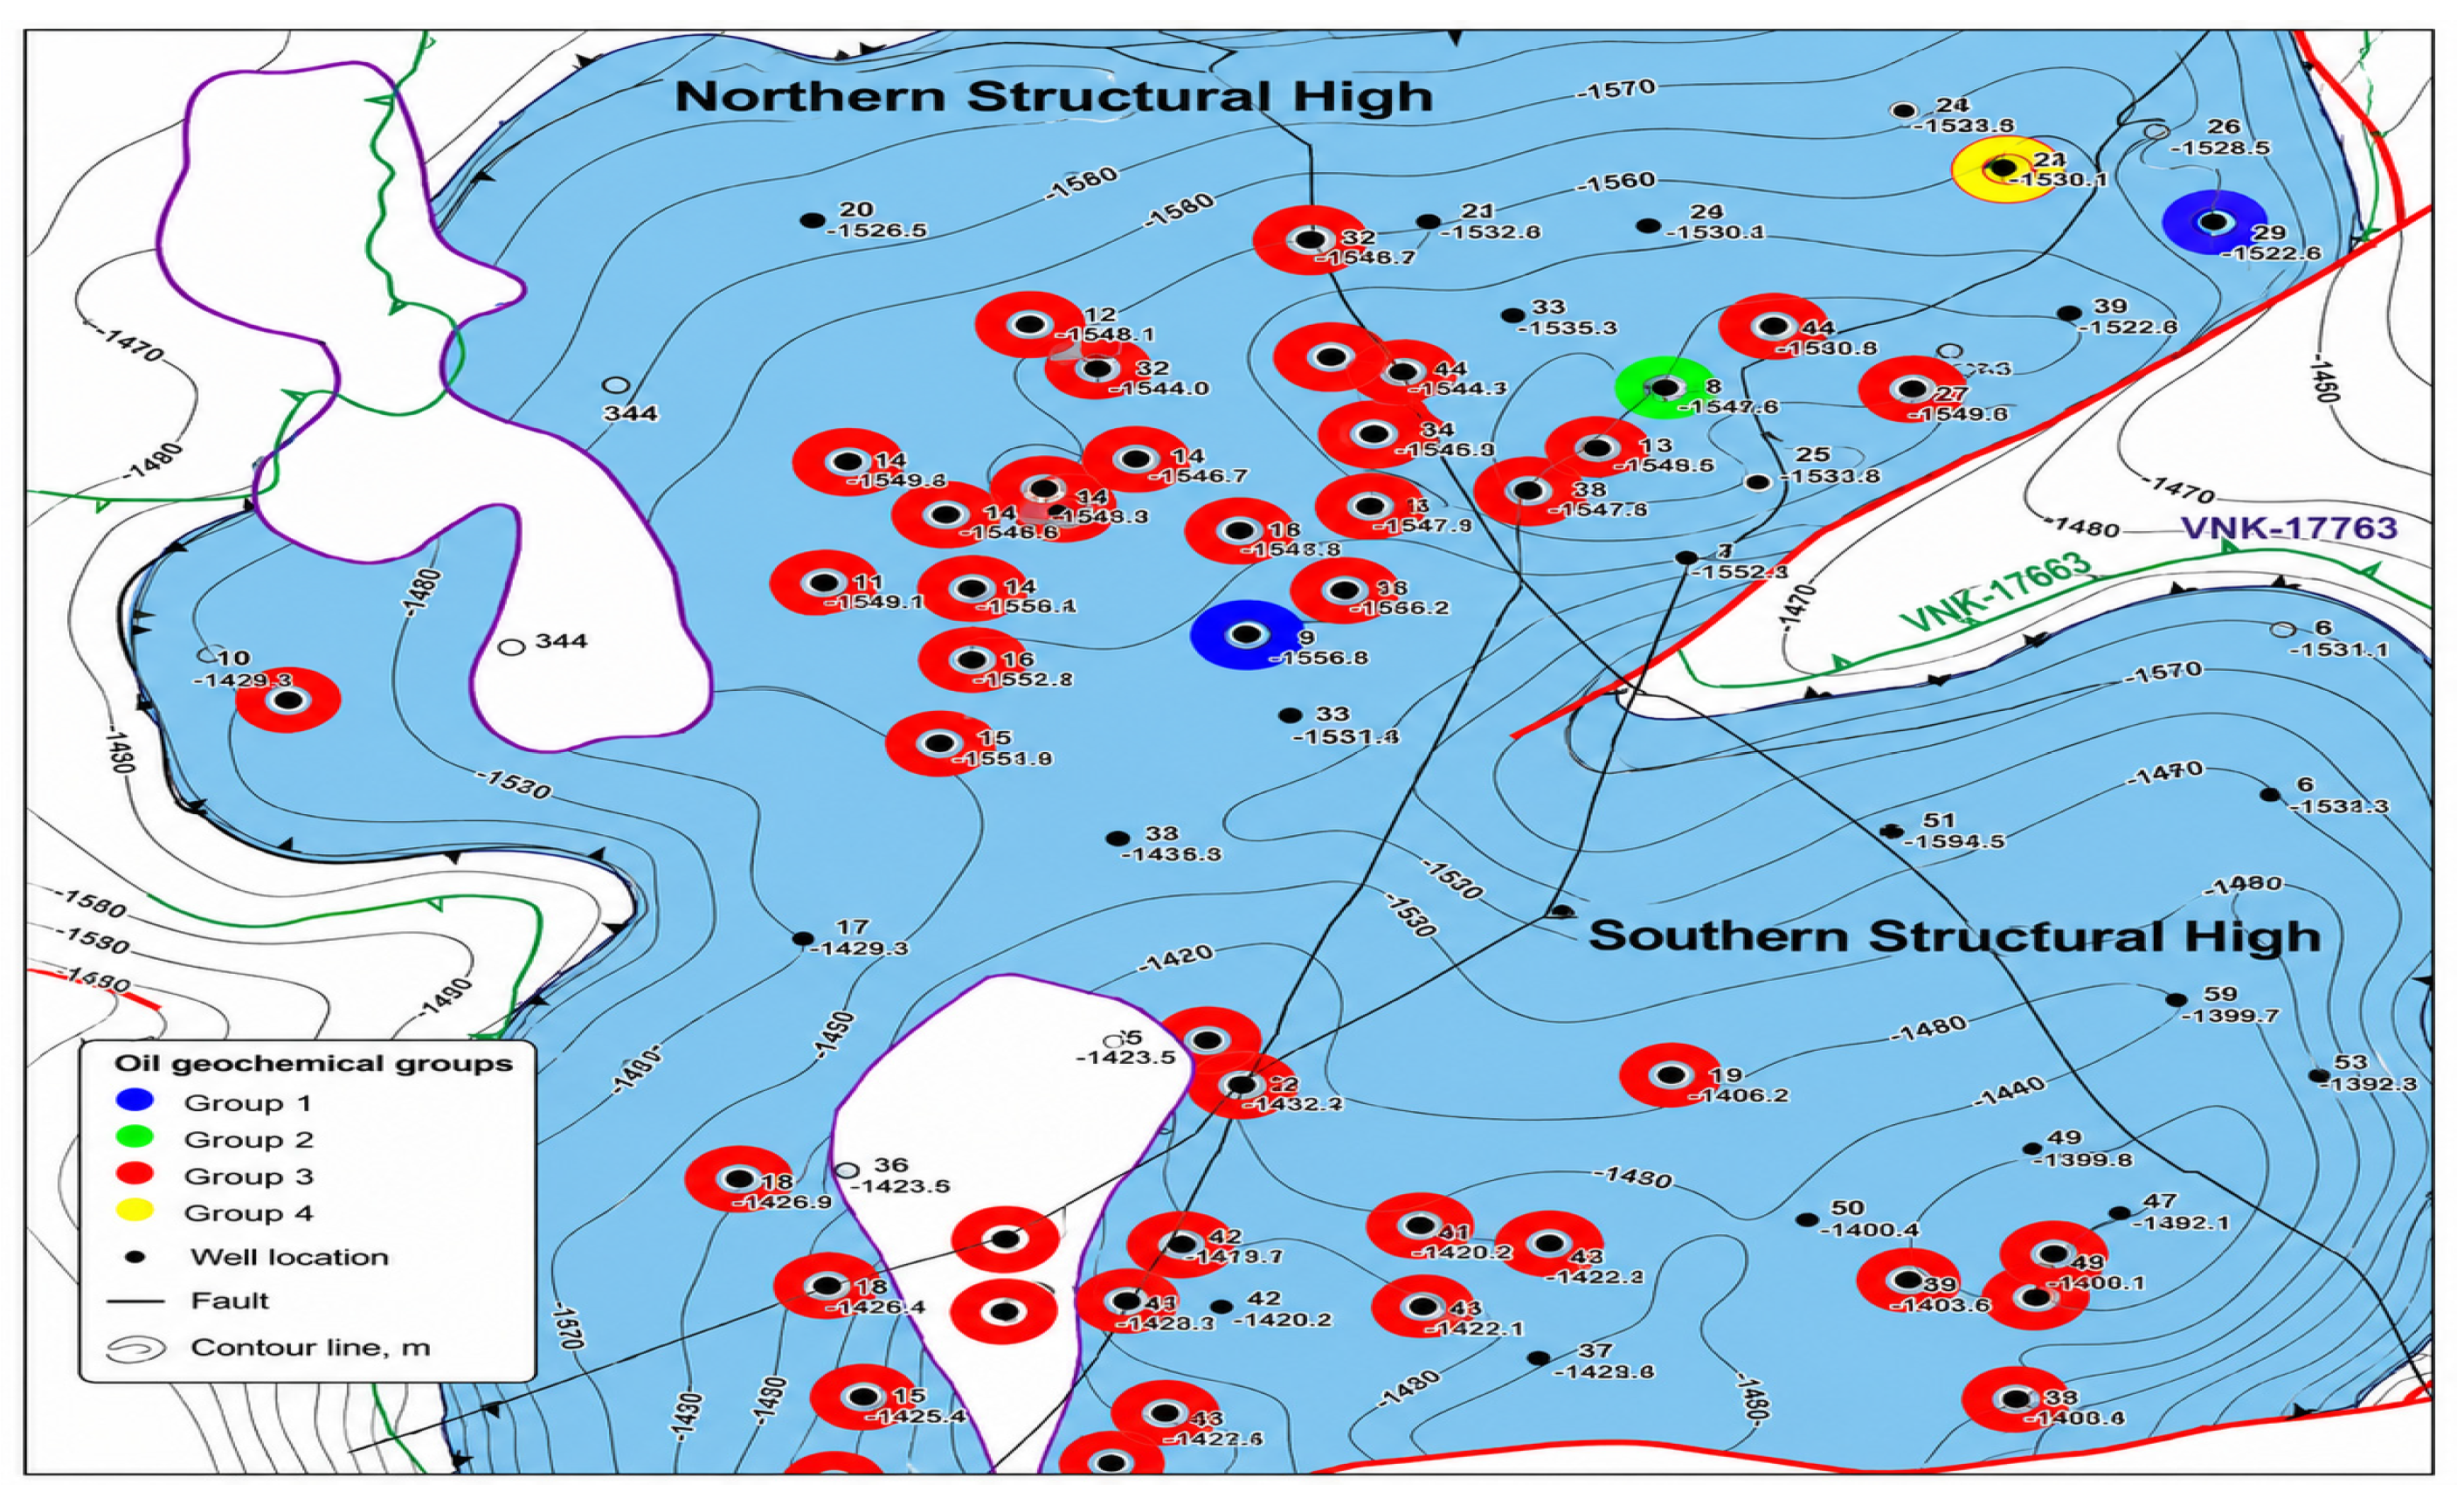
Spatial distribution of oil types within Objects I–II of the Central Akshabulak field based on oil fingerprinting analysis [27,29].
Figure 26.
Distribution of oil types within Objects III–V of the Central Akshabulak field [27,29].
The second group (green) is characteristic of wells in Object I of the northern dome of Central Akshabulak and is also partially observed in the southern dome, indicating limited spatial overlap of fluid types (Figure 26).
The third group (blue color) includes oils from the East Akshabulak field, as well as oils from channel (fluvial) deposits (Object II) of Central Akshabulak (Figure 27 and Figure 28). A mixed subgroup, shown in yellow, is represented by oils from three wells (Nos. 230, 413, and 281) in Central Akshabulak. It is suggested that the paleochannel reservoirs at depths of approximately 1500–1700 m may have been charged by hydrocarbons migrating from the deeper horizons of East Akshabulak (2000–2100 m) through fluvial channel pathways.
Figure 27.
Distribution of oil types in the East Akshabulak field [27,29].
Figure 28.
Distribution of oil types in the South Akshabulak field [27,29].
The anomalous subtype, shown in brown, is represented by a single sample from well No. 37, which penetrated channel No. 13 in South Akshabulak (Figure 28). This oil is characterized by an anomalous geochemical composition and occupies a peripheral position within the system, suggesting the presence of a localized reservoir block within the channel system that requires further detailed investigation.
Oils from wells 36D and 273 of South Akshabulak (channel 3, horizon J-0-2b) correspond to the main type of the northern dome, whereas oil from well 206 (channel 11, horizon J-0-1) does not show significant deviation from the main geochemical group.
Biomarker analysis was performed using an Agilent 7890B gas chromatograph–mass spectrometer in SIM mode. Diagnostic ions m/z 57, 191, 217, and 218 were used, corresponding to n-alkanes and isoprenoid hydrocarbons, terpanes, steranes, and diasteranes, respectively. The oil groups and compositional subtypes identified by fingerprinting were further investigated using biomarker analysis to assess the possible genetic control of their differences across the Akshabulak group of fields.
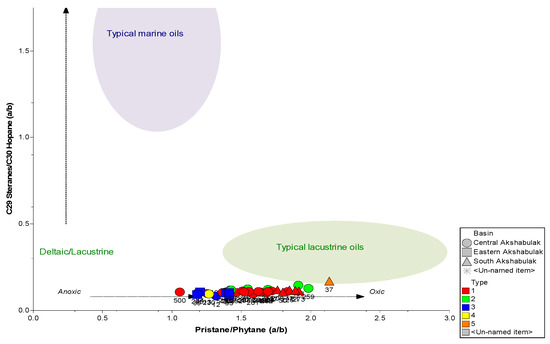
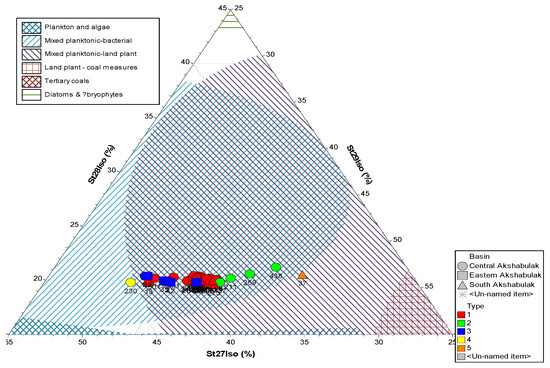
To reconstruct depositional conditions of organic matter, the Pr/Ph ratio versus C29/C30 steranes and terpane ternary were used. The results suggest that the Akshabulak oils were predominantly derived from source rocks deposited under lacustrine conditions, with substantial variability in Pr/Ph values (Figure 29). Relatively high Pr/Ph values may indicate more oxic conditions during organic matter deposition.
Figure 29.
Relationship between the Pr/Ph ratio and the C29 sterane/C30 hopane ratio in oils from the Akshabulak group [27,29].
The pronounced variability in Pr/Ph values among these geographically and geologically related fields may reflect local facies heterogeneity in the depositional environment. On the diagram, oils of the first group (red) occupy an intermediate position between groups 2 (green) and 3 (blue), which may indicate mixing processes.
Additional support for this interpretation is provided by the sterane ternary diagram, in which oils of the first group also occupy an intermediate position between oils from East and Central Akshabulak (Figure 30).
Figure 30.
Sterane ternary diagram of oils from the Akshabulak group [27,29].
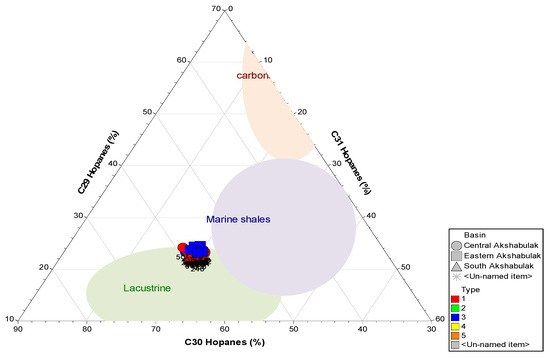
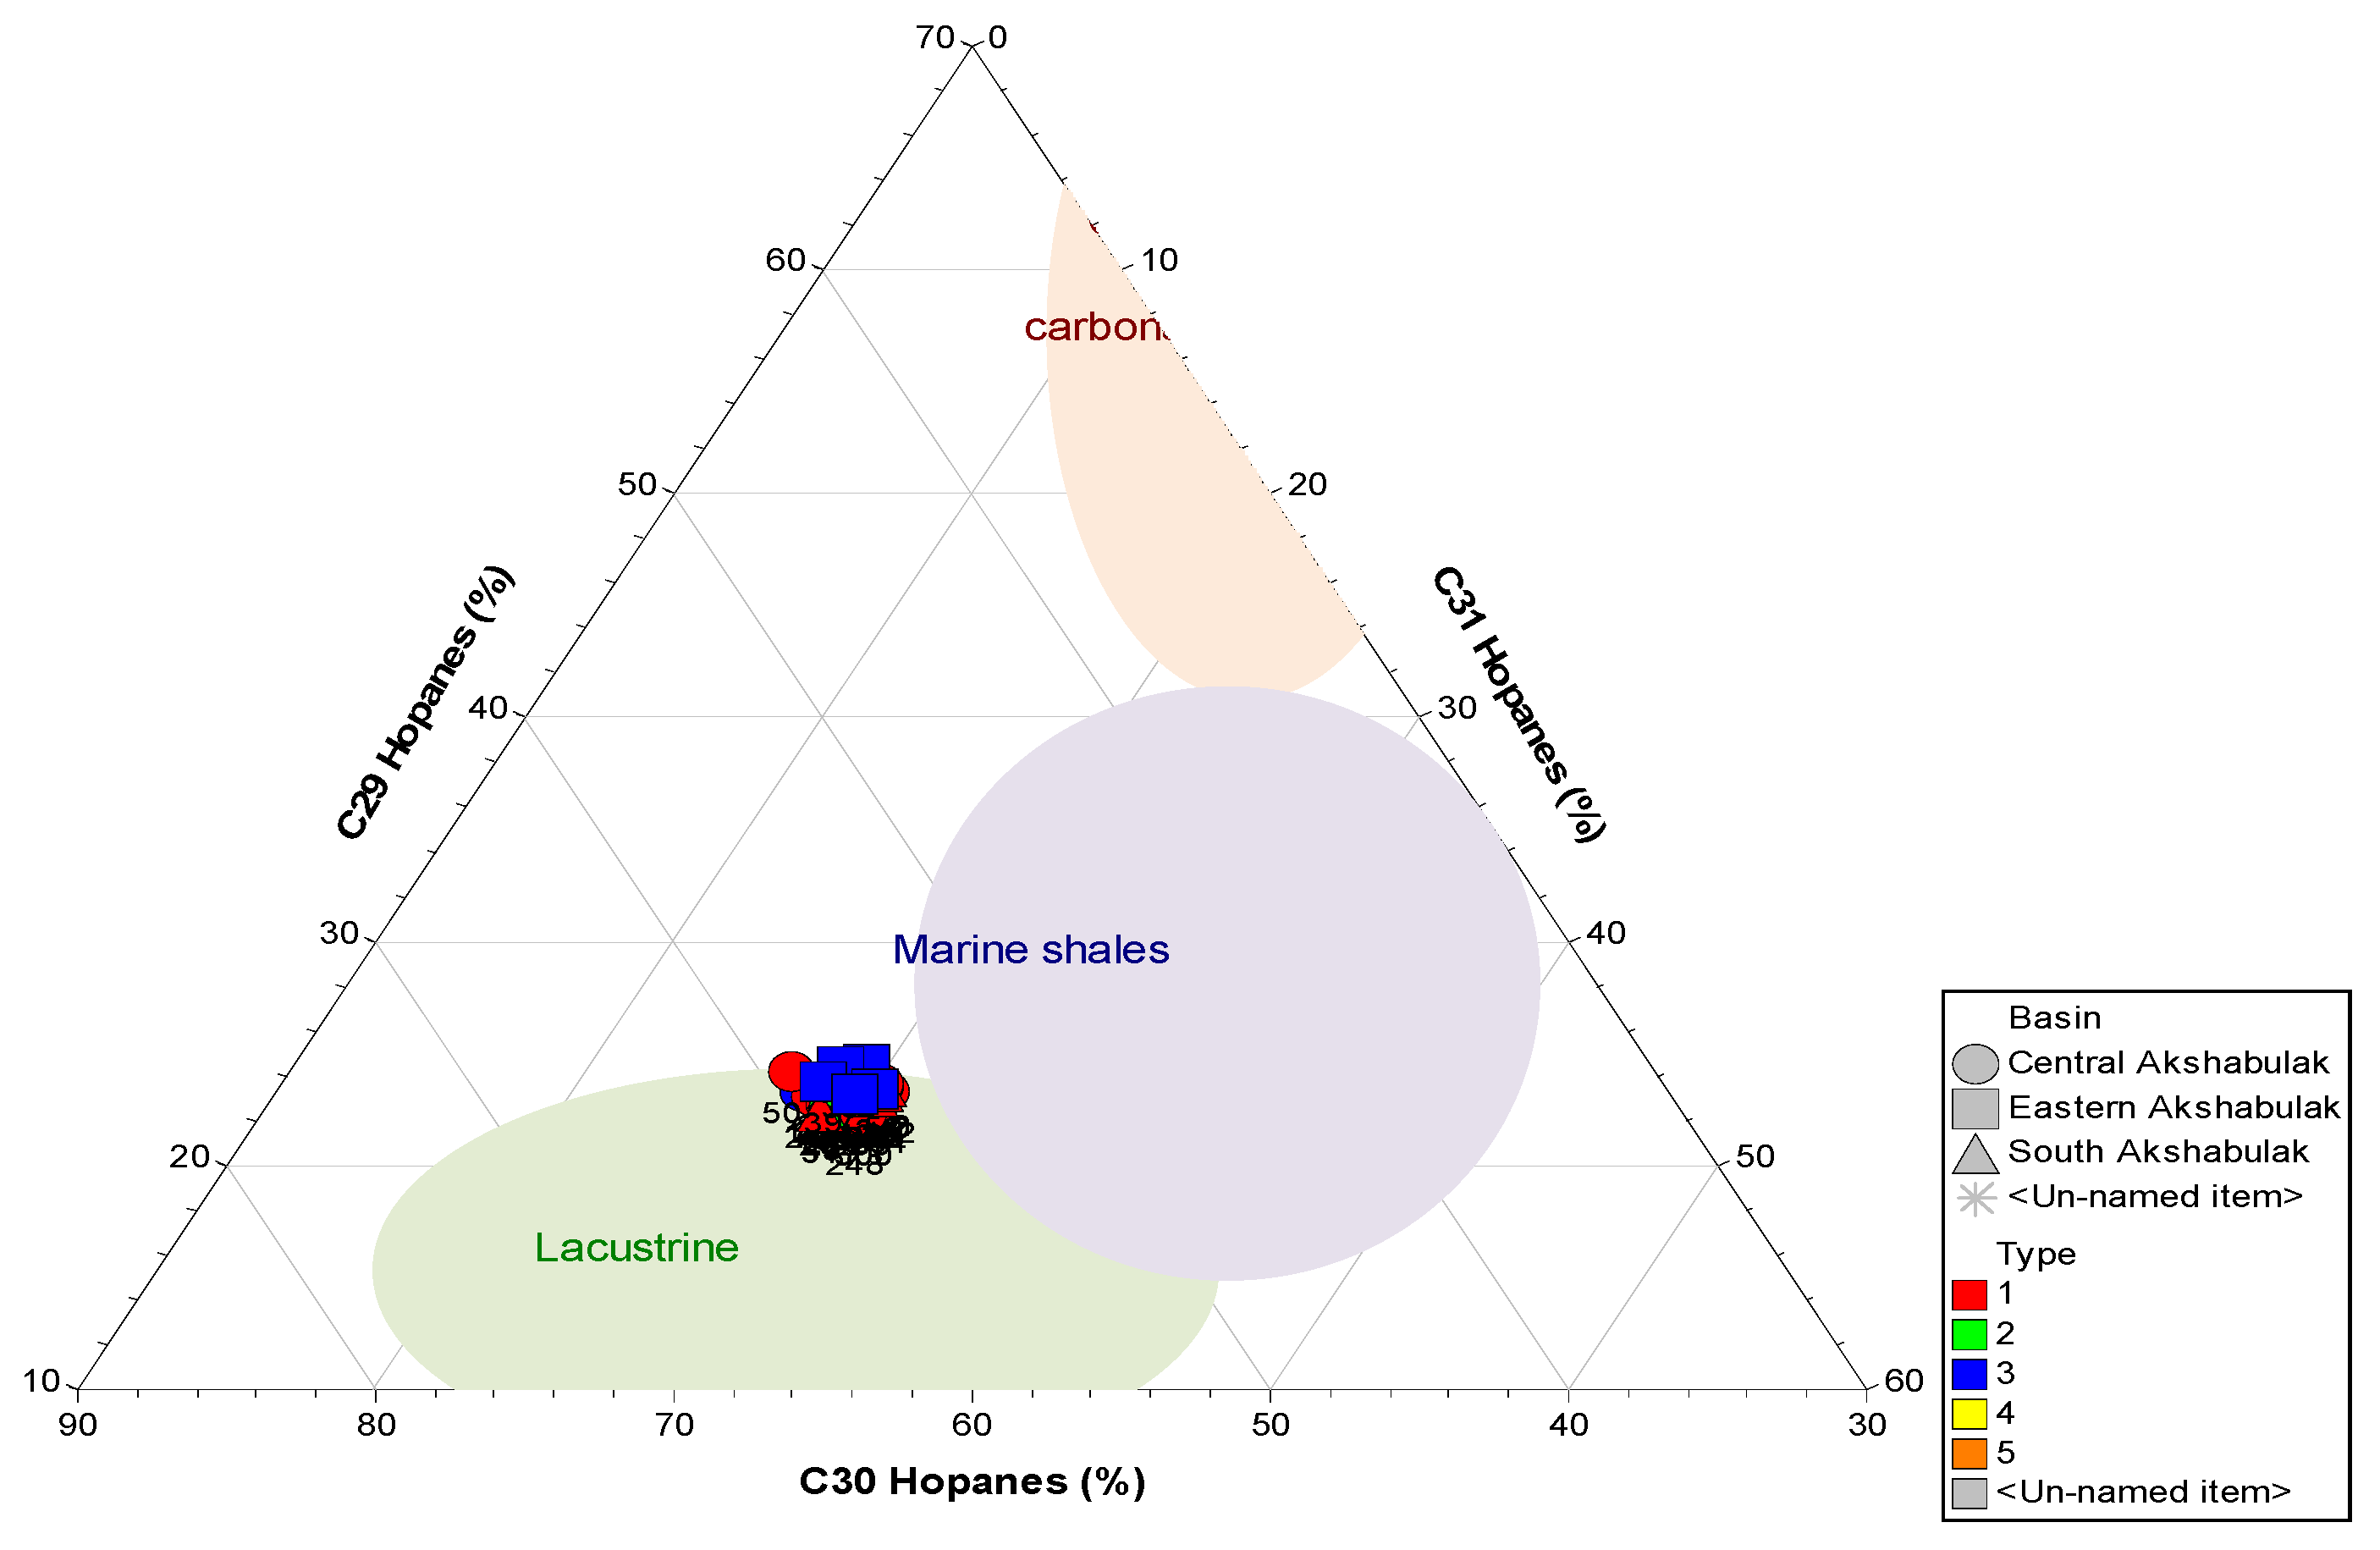
Analysis of the hopane ternary diagram further supports a predominantly lacustrine origin of the source organic matter: the studied oils form a relatively compact field without pronounced differentiation, suggesting broadly similar depositional conditions (Figure 31).
Figure 31.
Hopane ternary diagram of oils from the Akshabulak group [27,29].
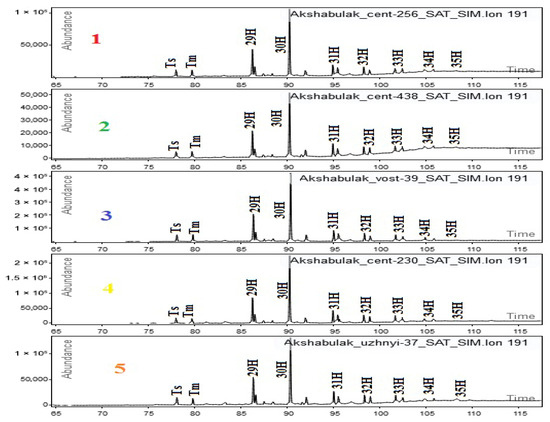
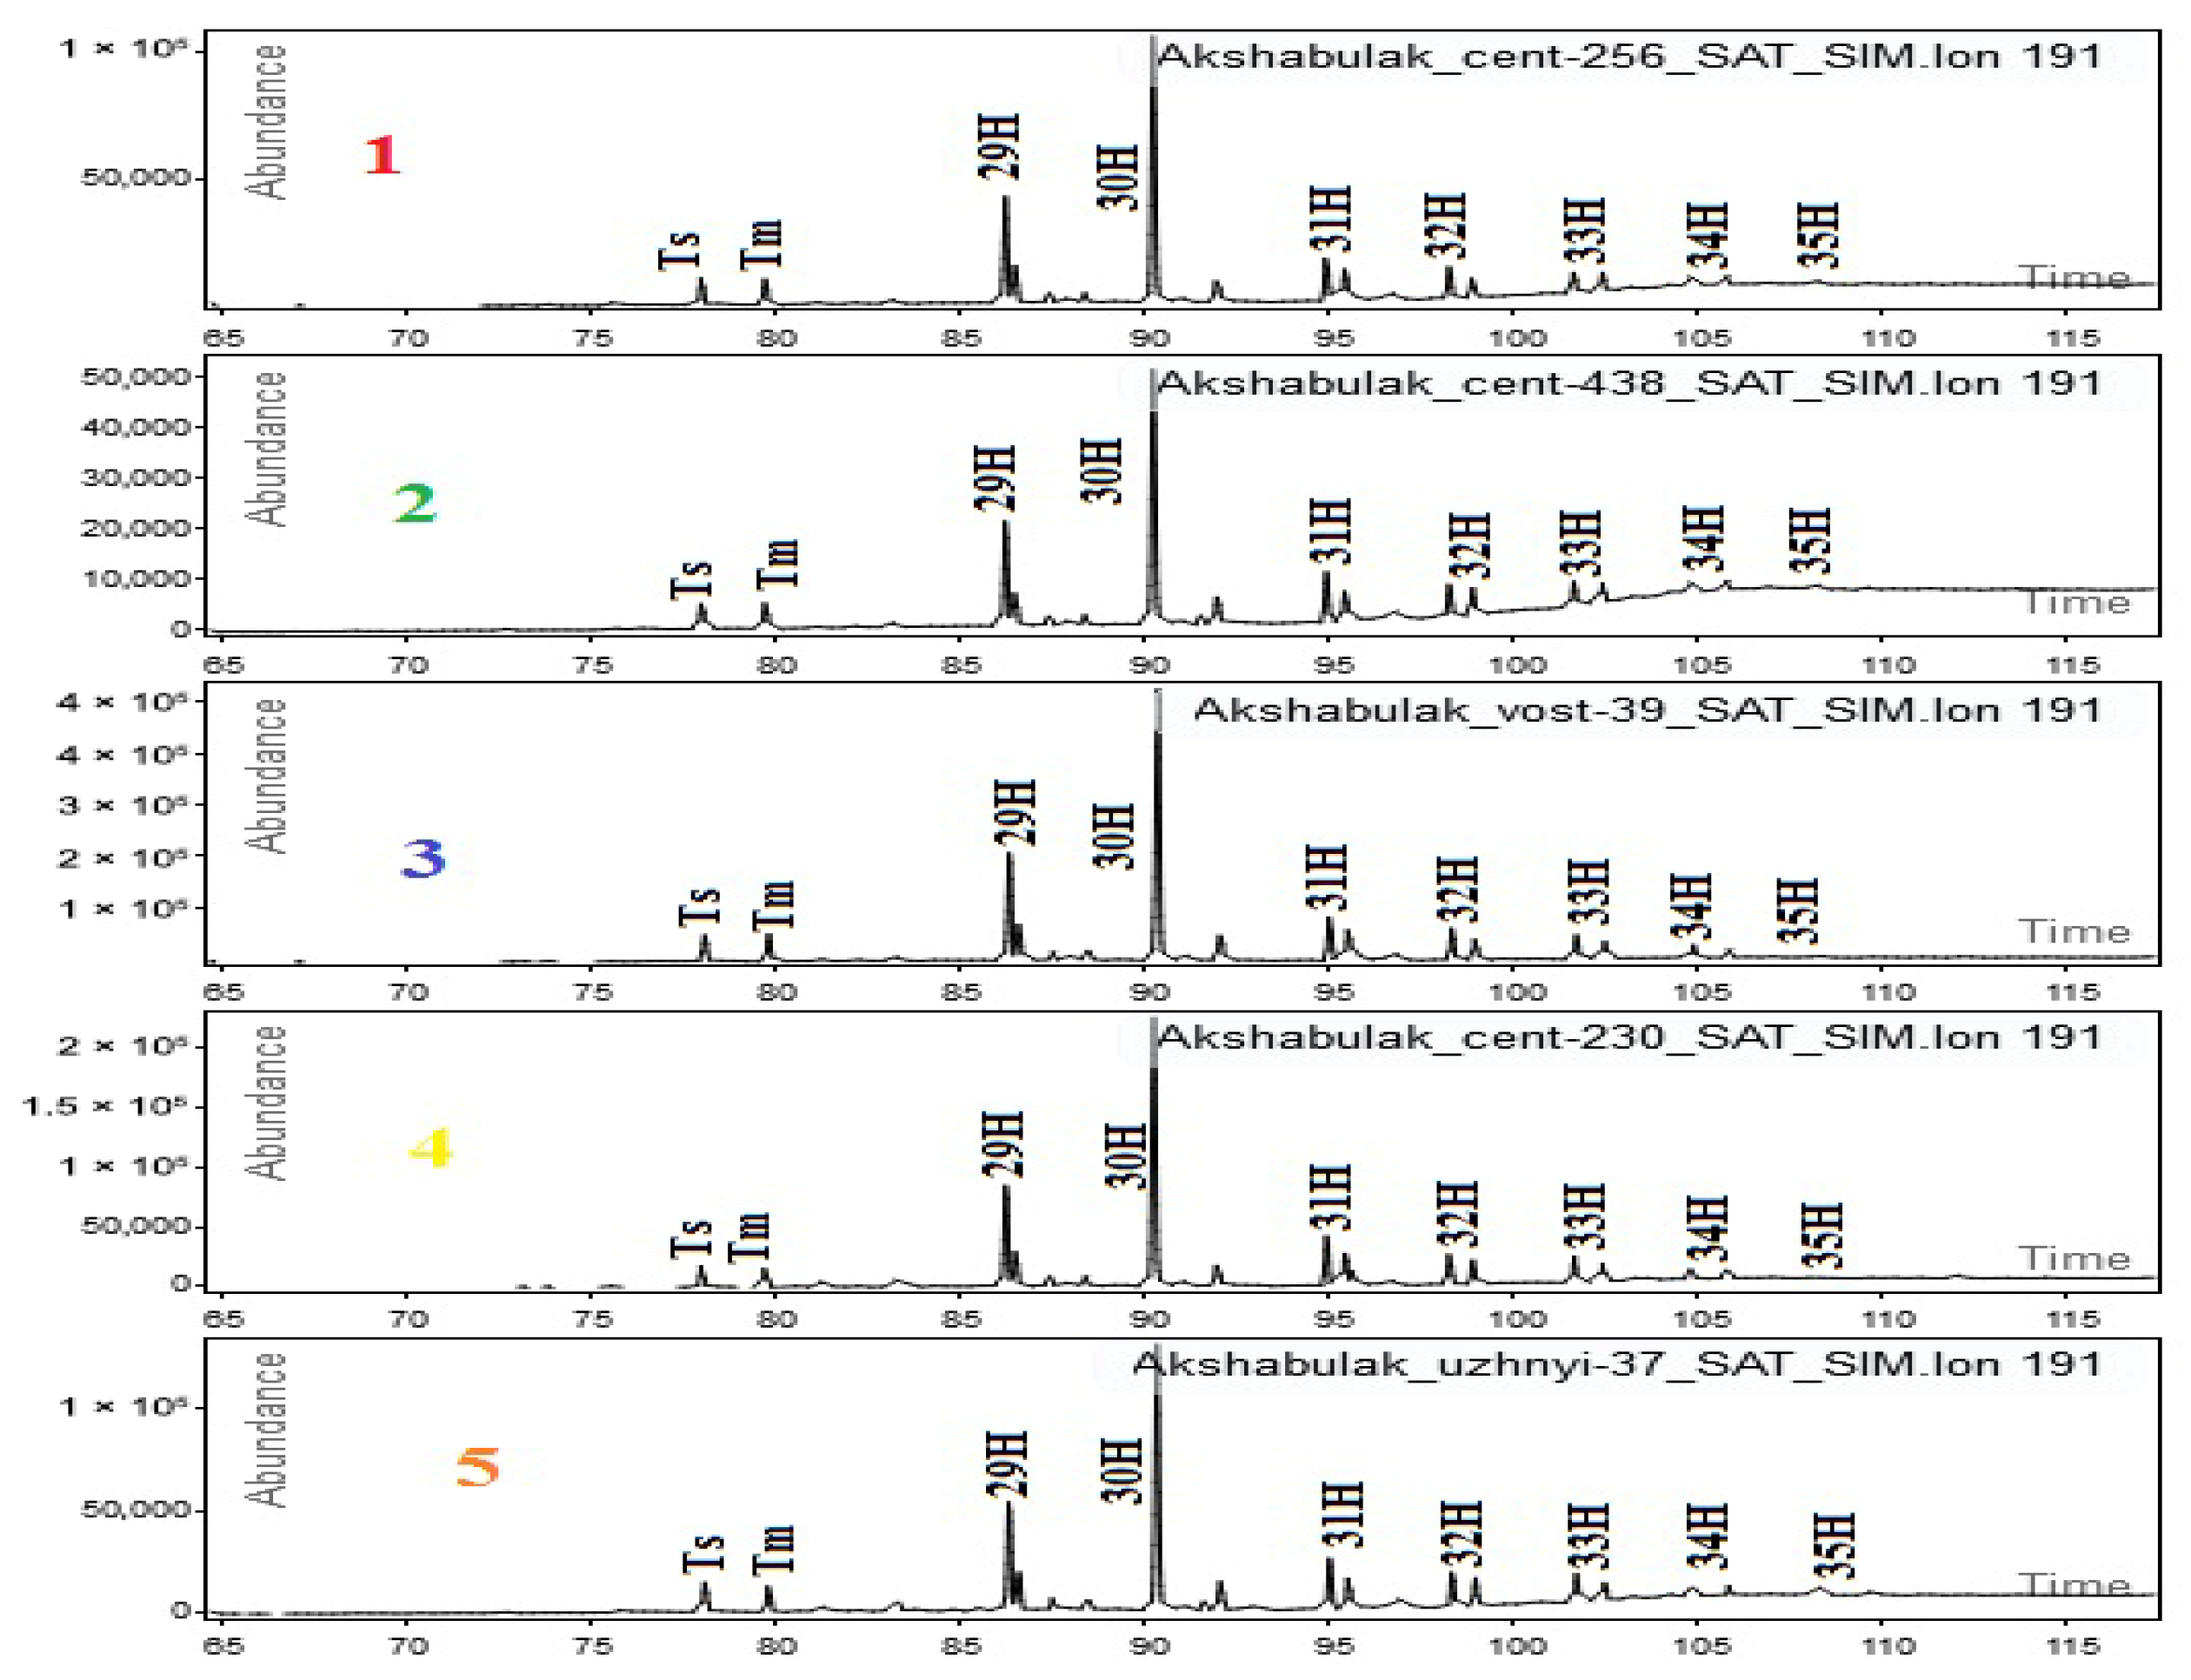
The lithological characteristics of the source rocks were evaluated based on terpane distributions (m/z 191). Low C29/C30 hopane ratios (<1) and low homohopane index values (35H/34H < 1) in the studied oils of the Akshabulak group suggest predominantly shaly (clay-rich) source rocks (Figure 32). These results are also consistent with the observed high diasterane contents and low dibenzothiophene/phenanthrene ratios.
Figure 32.
Mass fragmentograms of terpanes (m/z 191) in representative crude oils [27,29].
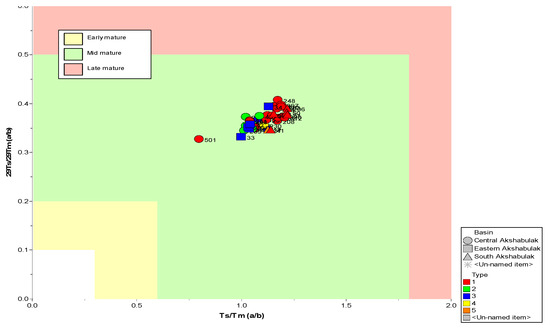
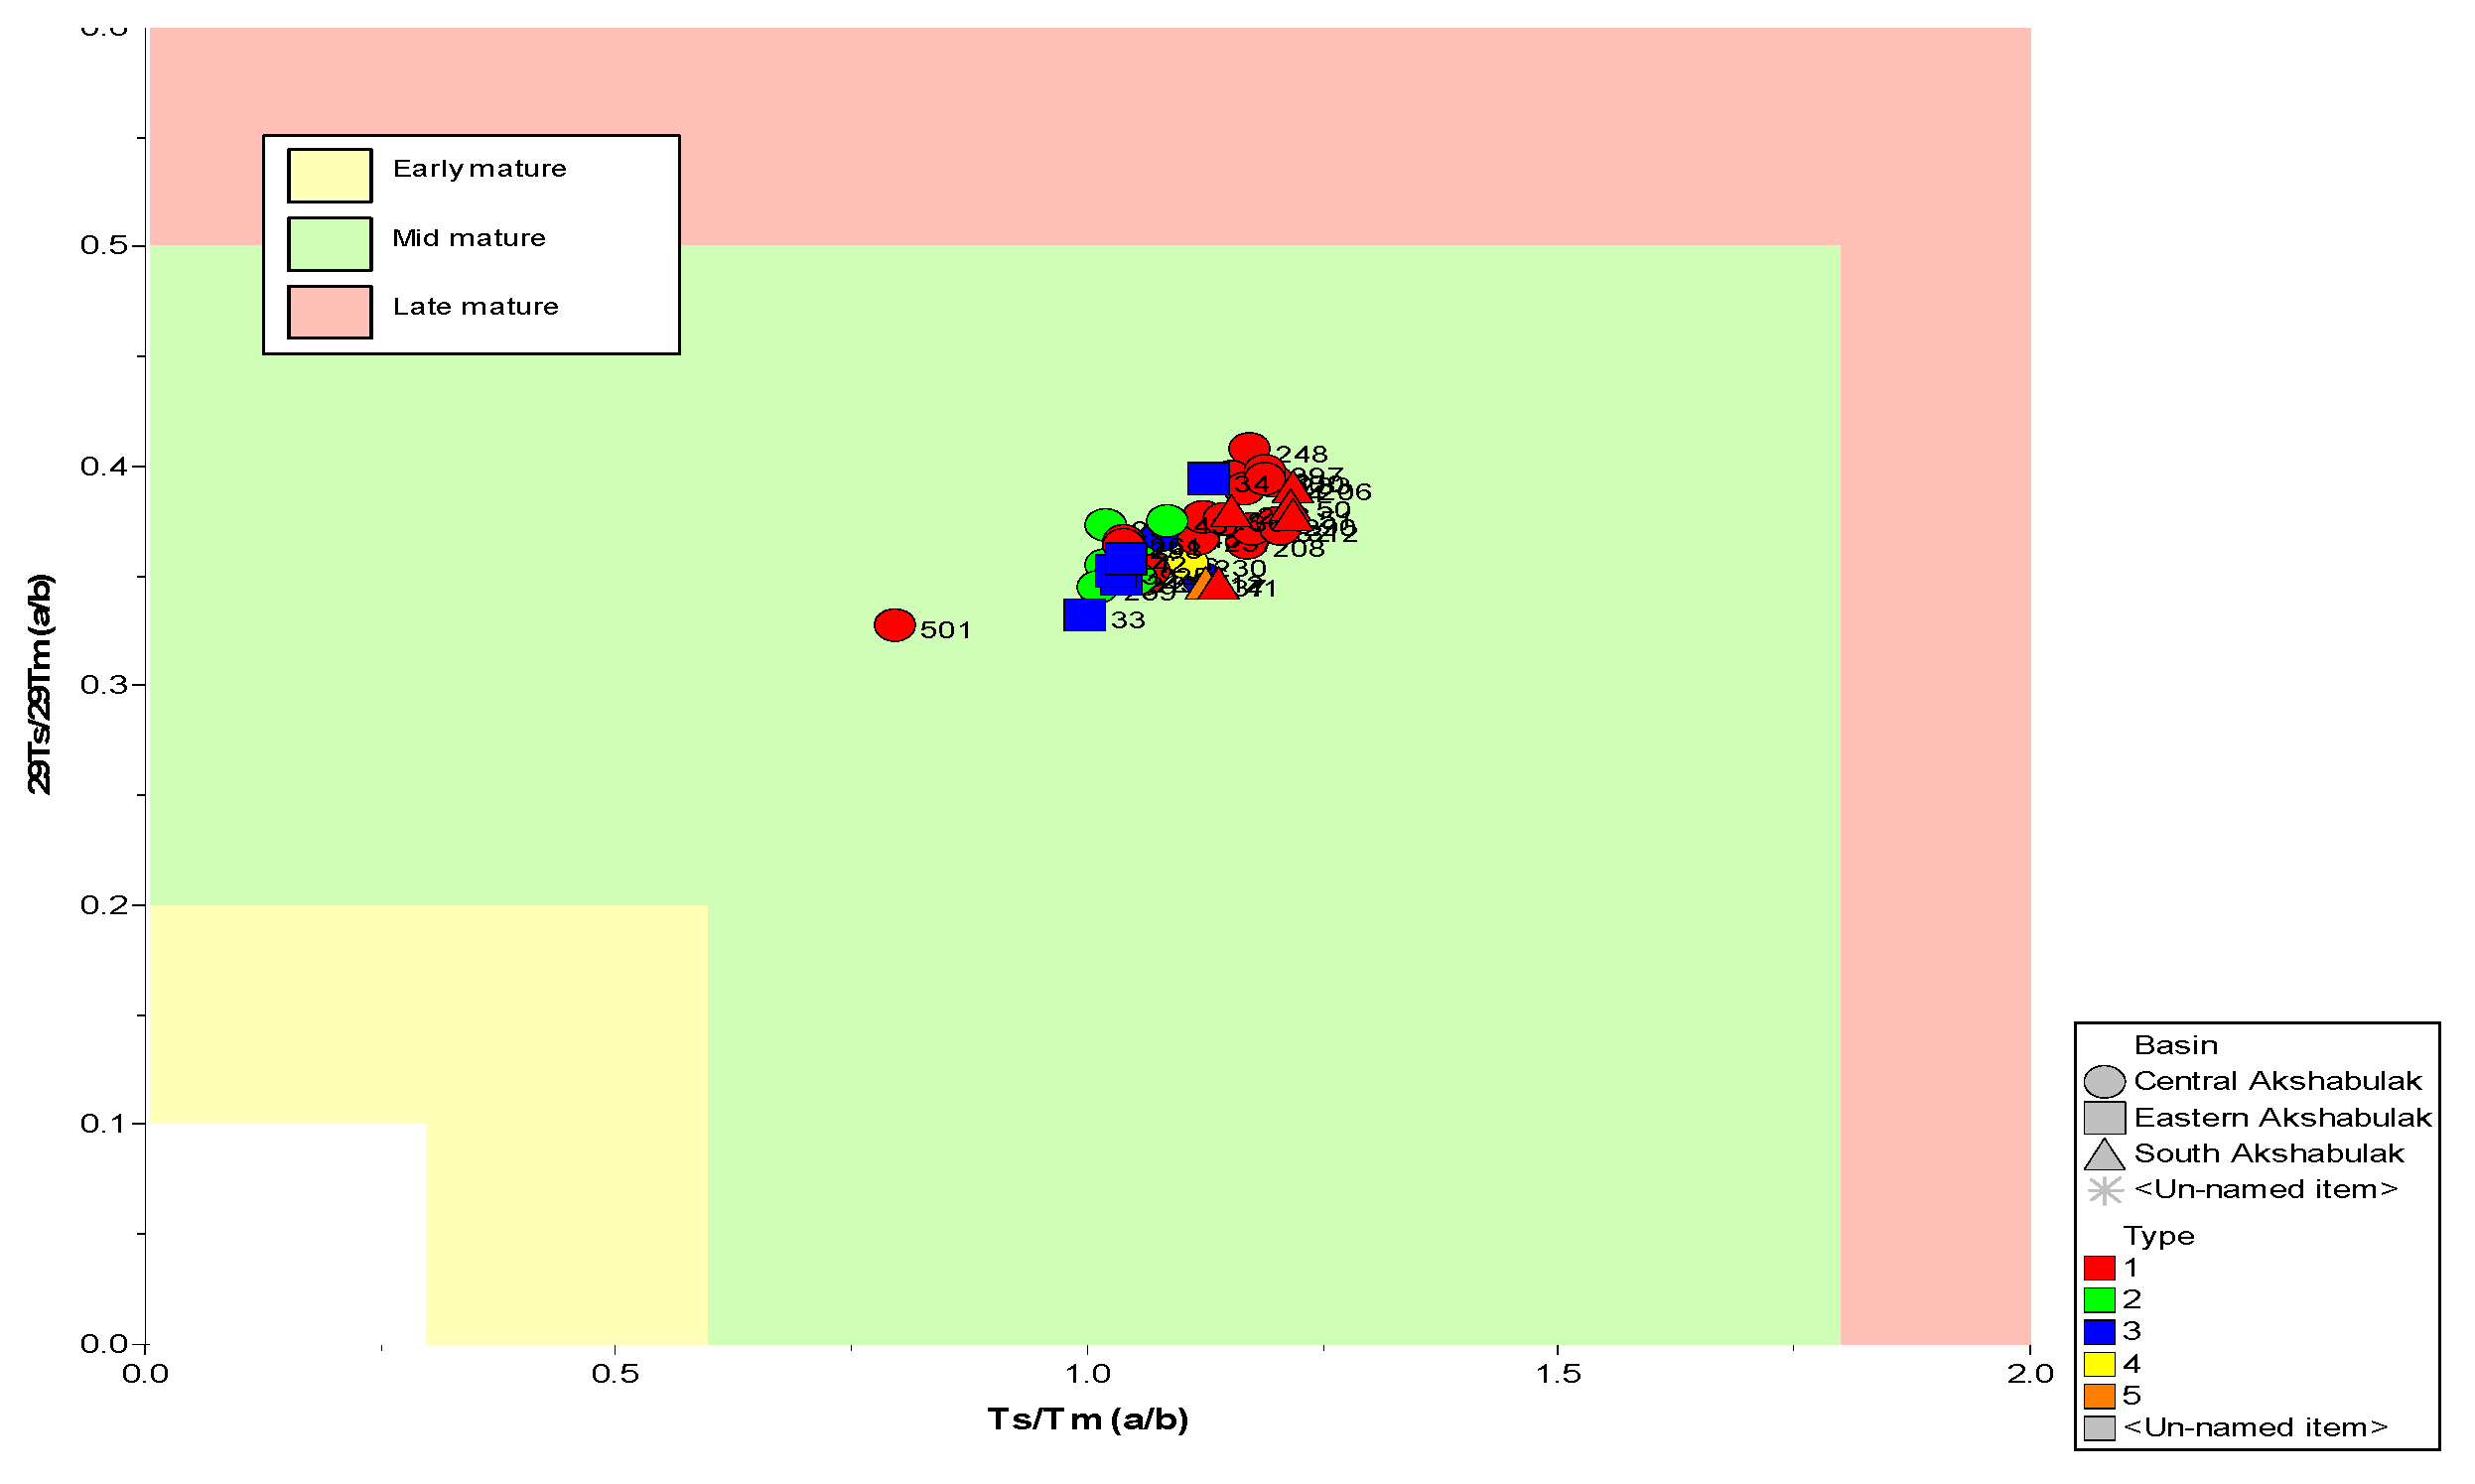
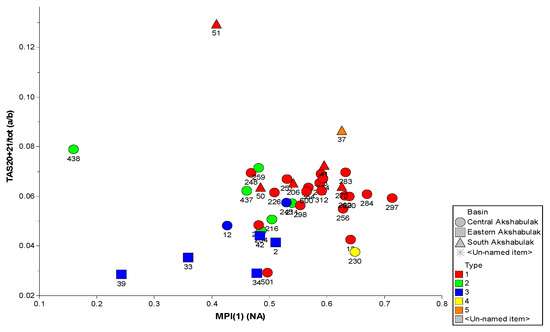
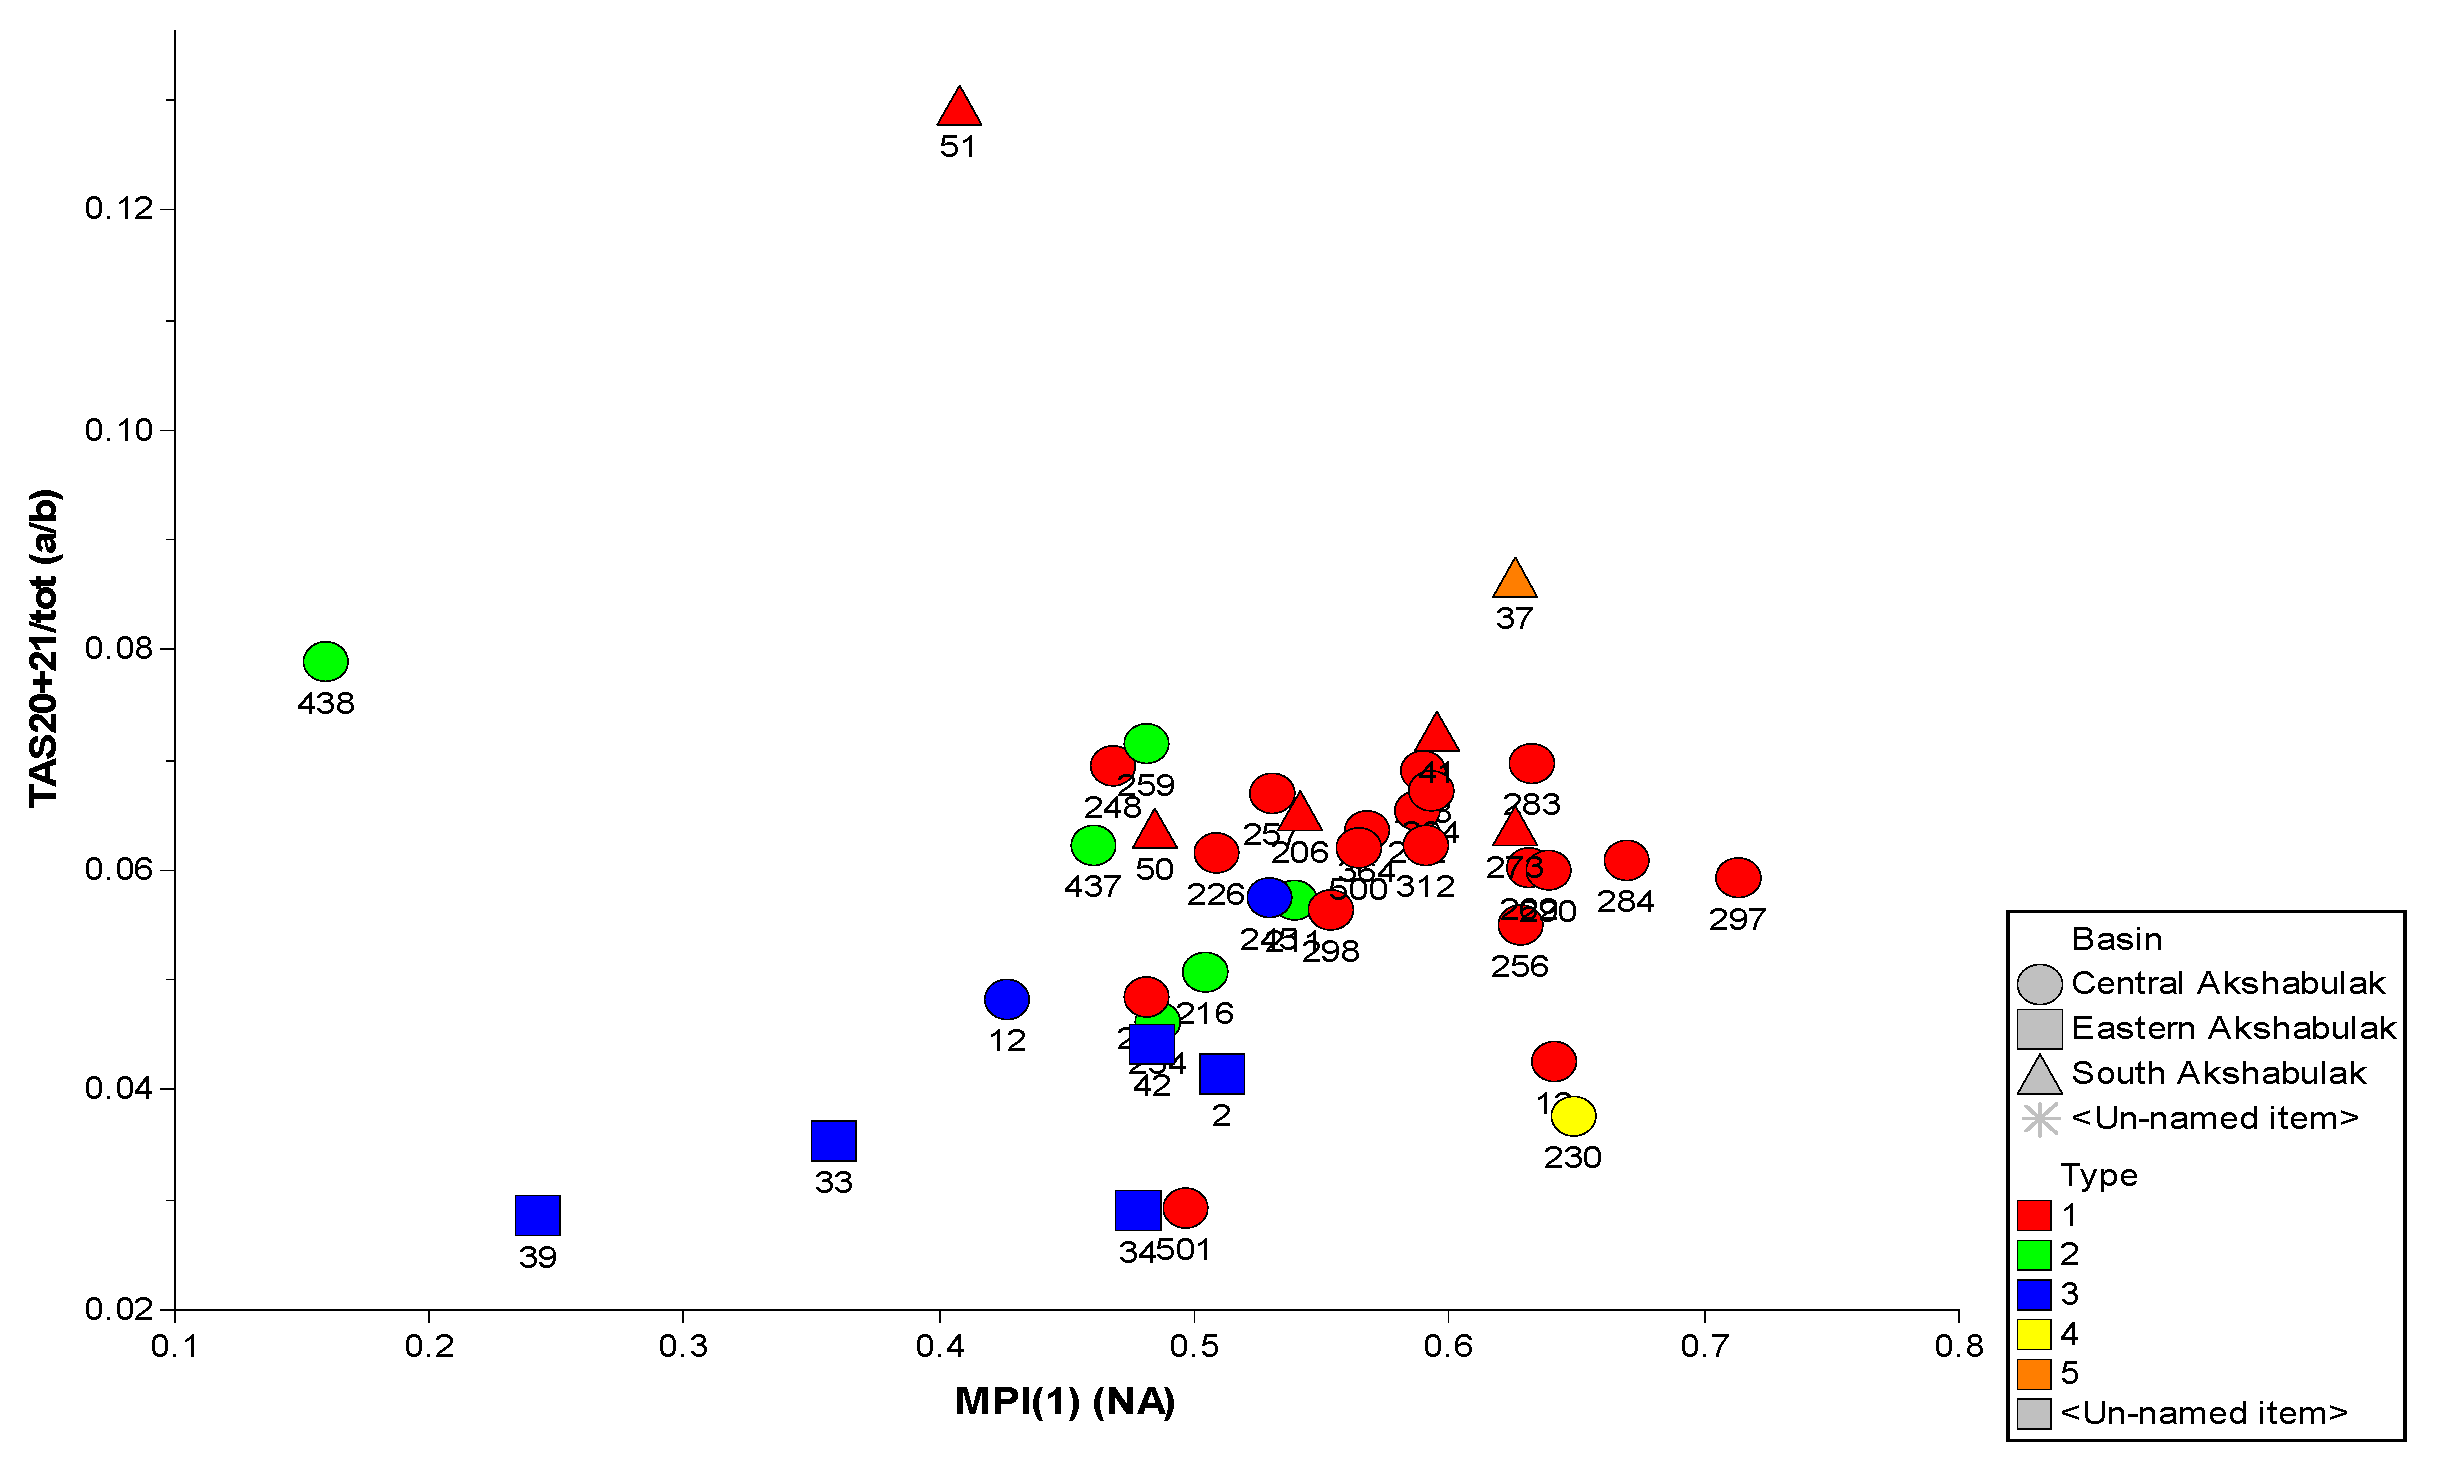
The thermal maturity of oil reflects the degree of transformation of the source organic matter as a result of catagenesis. With increasing thermal maturity, oil molecular weight and density may decrease as a result of thermal cracking of higher-molecular-weight hydrocarbons. To assess thermal maturity, the ratios 29Ts/29Tm versus Ts/Tm and triaromatic steroid indices (TAS 20 + 21/tot versus MPI-1) were used (Figure 33 and Figure 34).
Figure 33.
Relationship between the Ts/Tm and 29Ts/29Tm ratios in the studied [27,29].
Figure 34.
Relationship between the TAS index and MPI-1 in the studied oils [27,29].
The obtained results indicate that oils from the Eastern Akshabulak field exhibit lower thermal maturity compared to those from the Central and Southern Akshabulak fields, except for individual samples from wells 37 and 501.
The PVT data (Table 2) show that oils from the Eastern Akshabulak field have lower gas contents and saturation pressures, together with higher molecular weights, than oils from the Central and Southern Akshabulak fields. These characteristics are consistent with the lower thermal maturity inferred from the biomarker parameters.
Table 2.
PVT characteristics of representative oils from the Akshabulak group.
A lateral increase in thermal maturity is observed from the Eastern Akshabulak field towards the Central and Southern Akshabulak fields, which may reflect the direction of hydrocarbon migration. Oil density serves as an additional indicator: lighter oils are associated with more mature zones, whereas heavier oils are preserved in areas with limited migration.
The average density values support this trend: Eastern Akshabulak—840 kg/m3, Central—836 kg/m3, Southern—822 kg/m3. This indicates a relatively short migration pathway for oils in the Eastern Akshabulak field and a more pronounced retention of heavy fractions during migration. Oils generated at relatively lower maturity levels may contain higher proportions of resin and asphaltene compounds, which can contribute to higher oil density. During thermal maturation and secondary alteration, the relative abundance of these higher-molecular-weight components may decrease, contributing to changes in bulk oil properties.
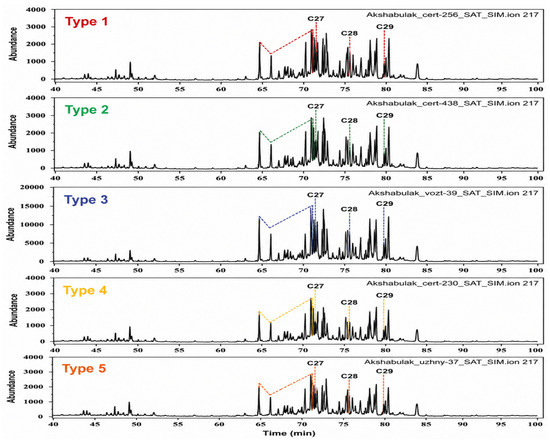
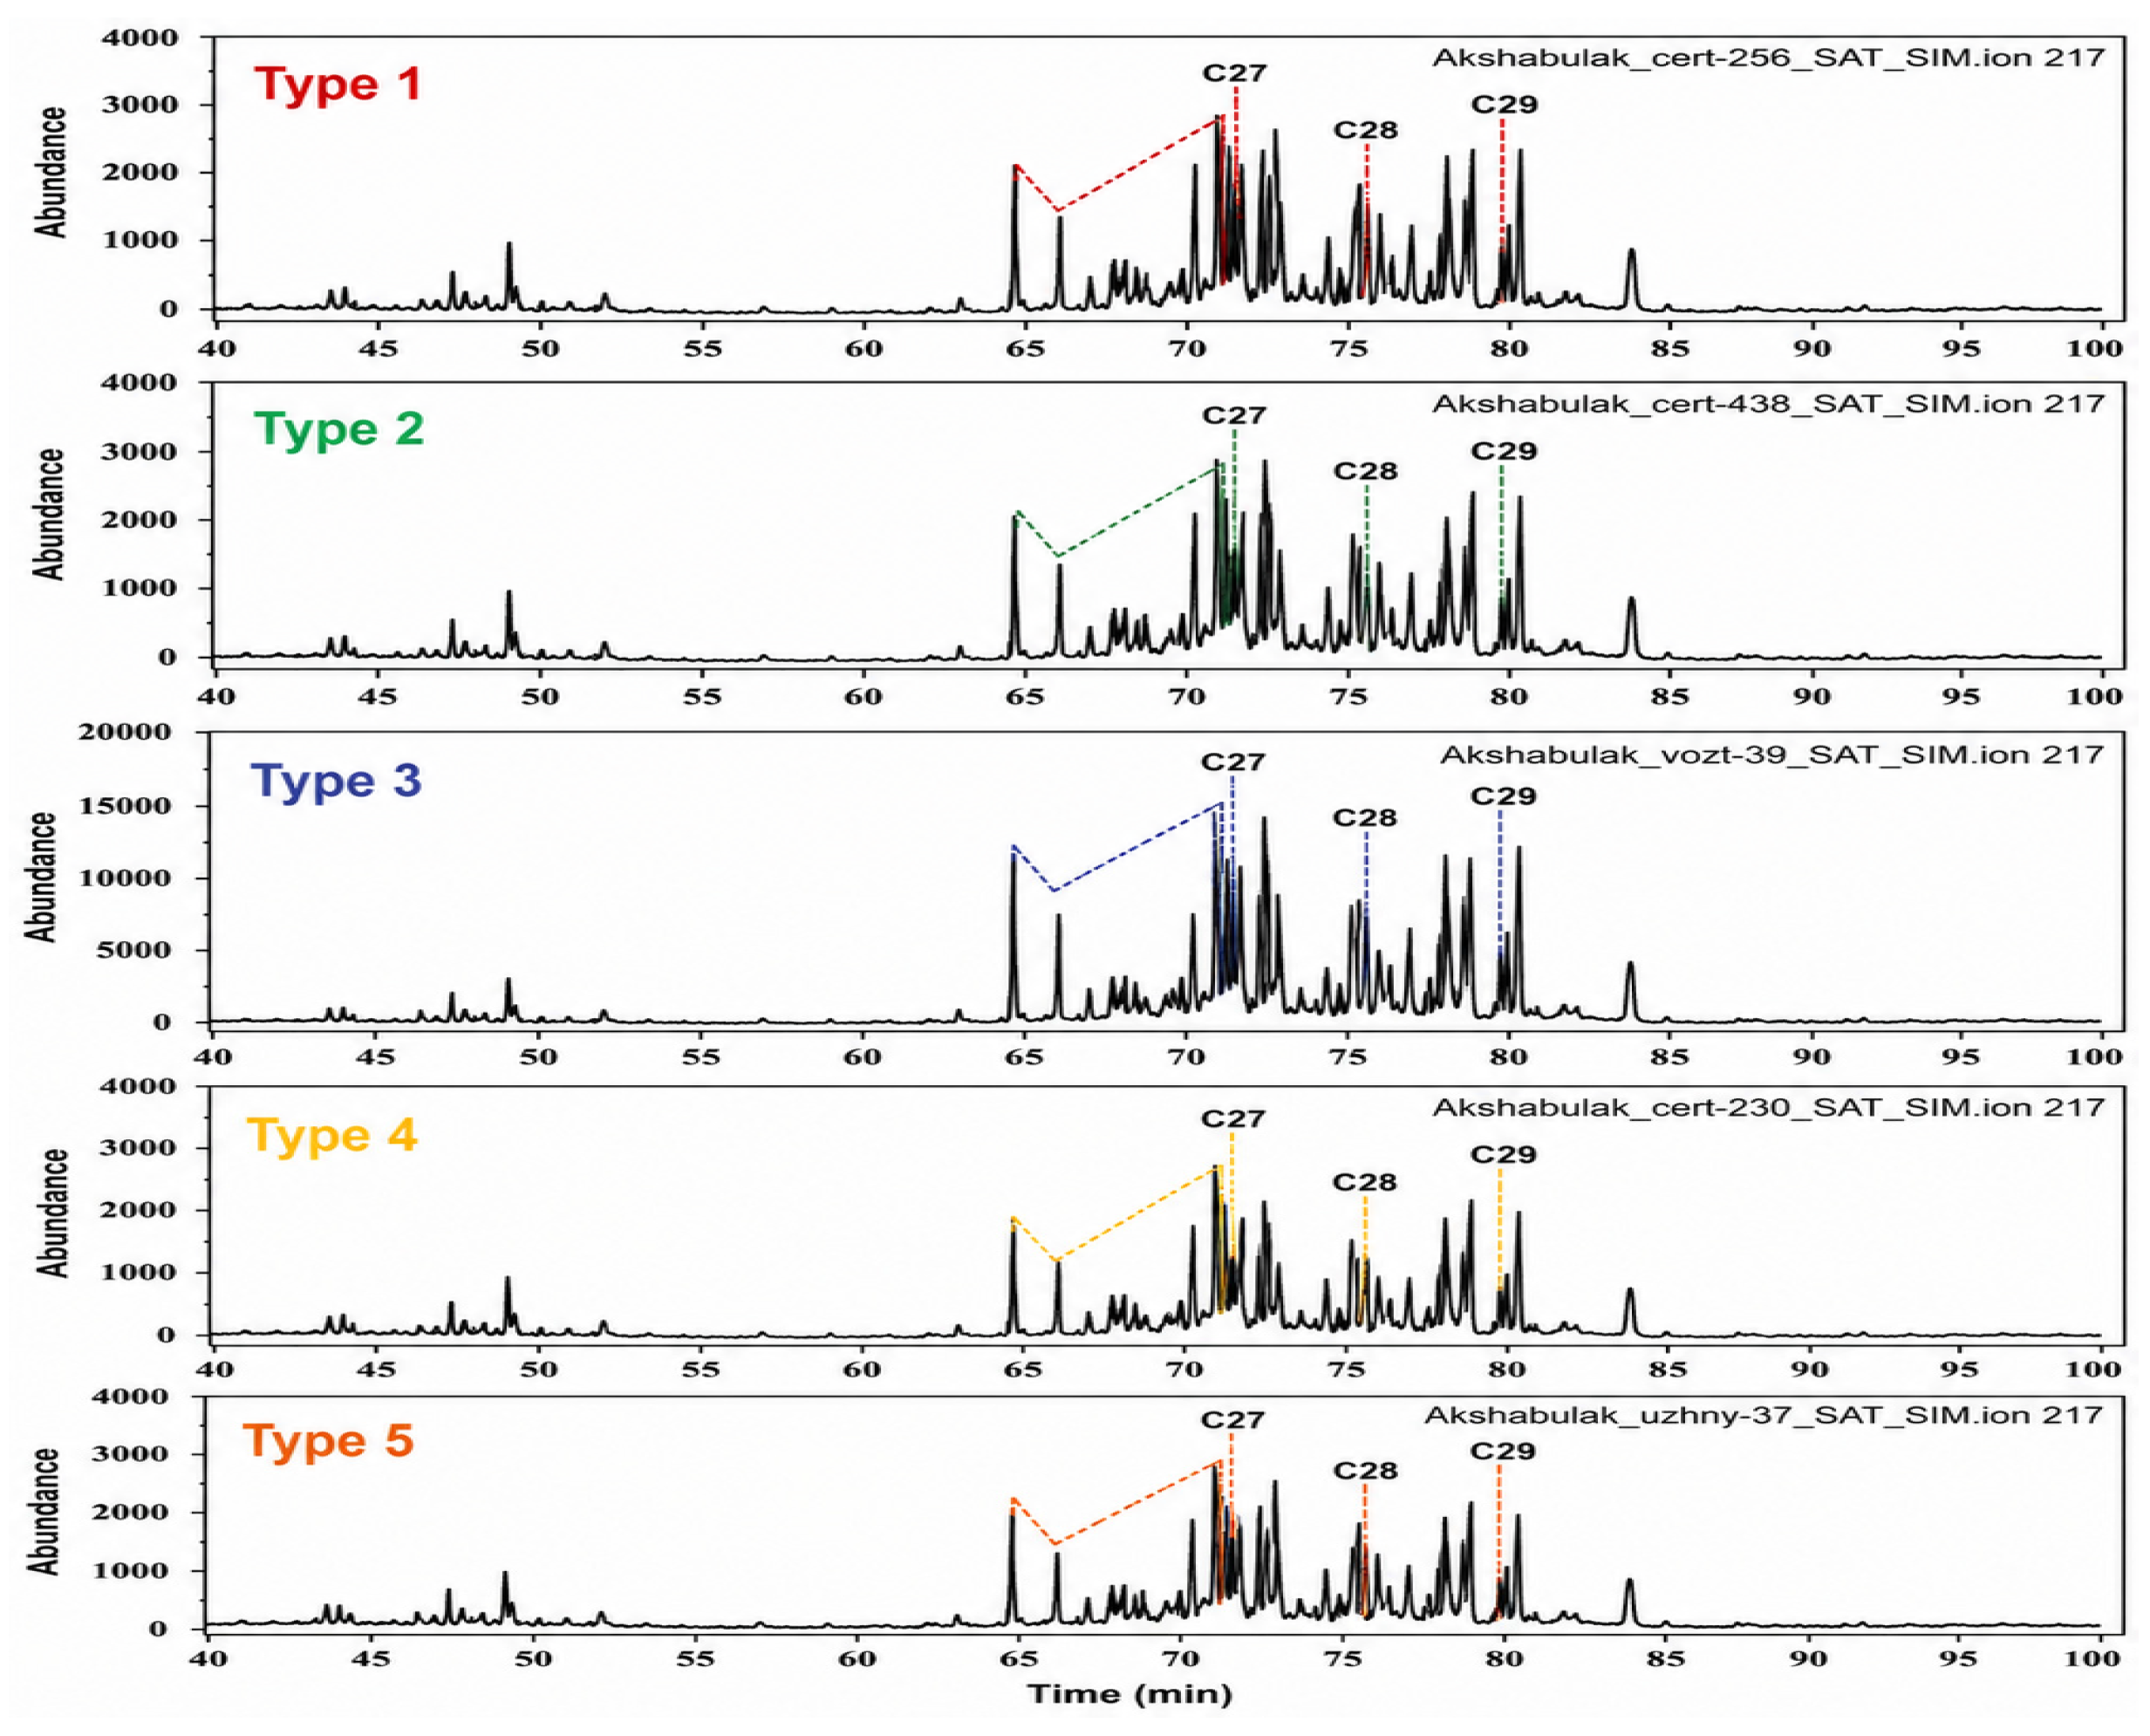
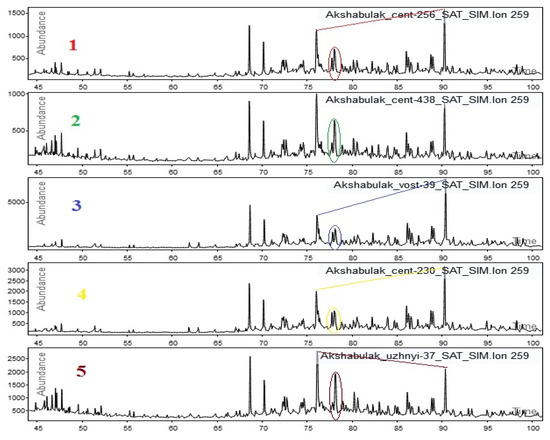
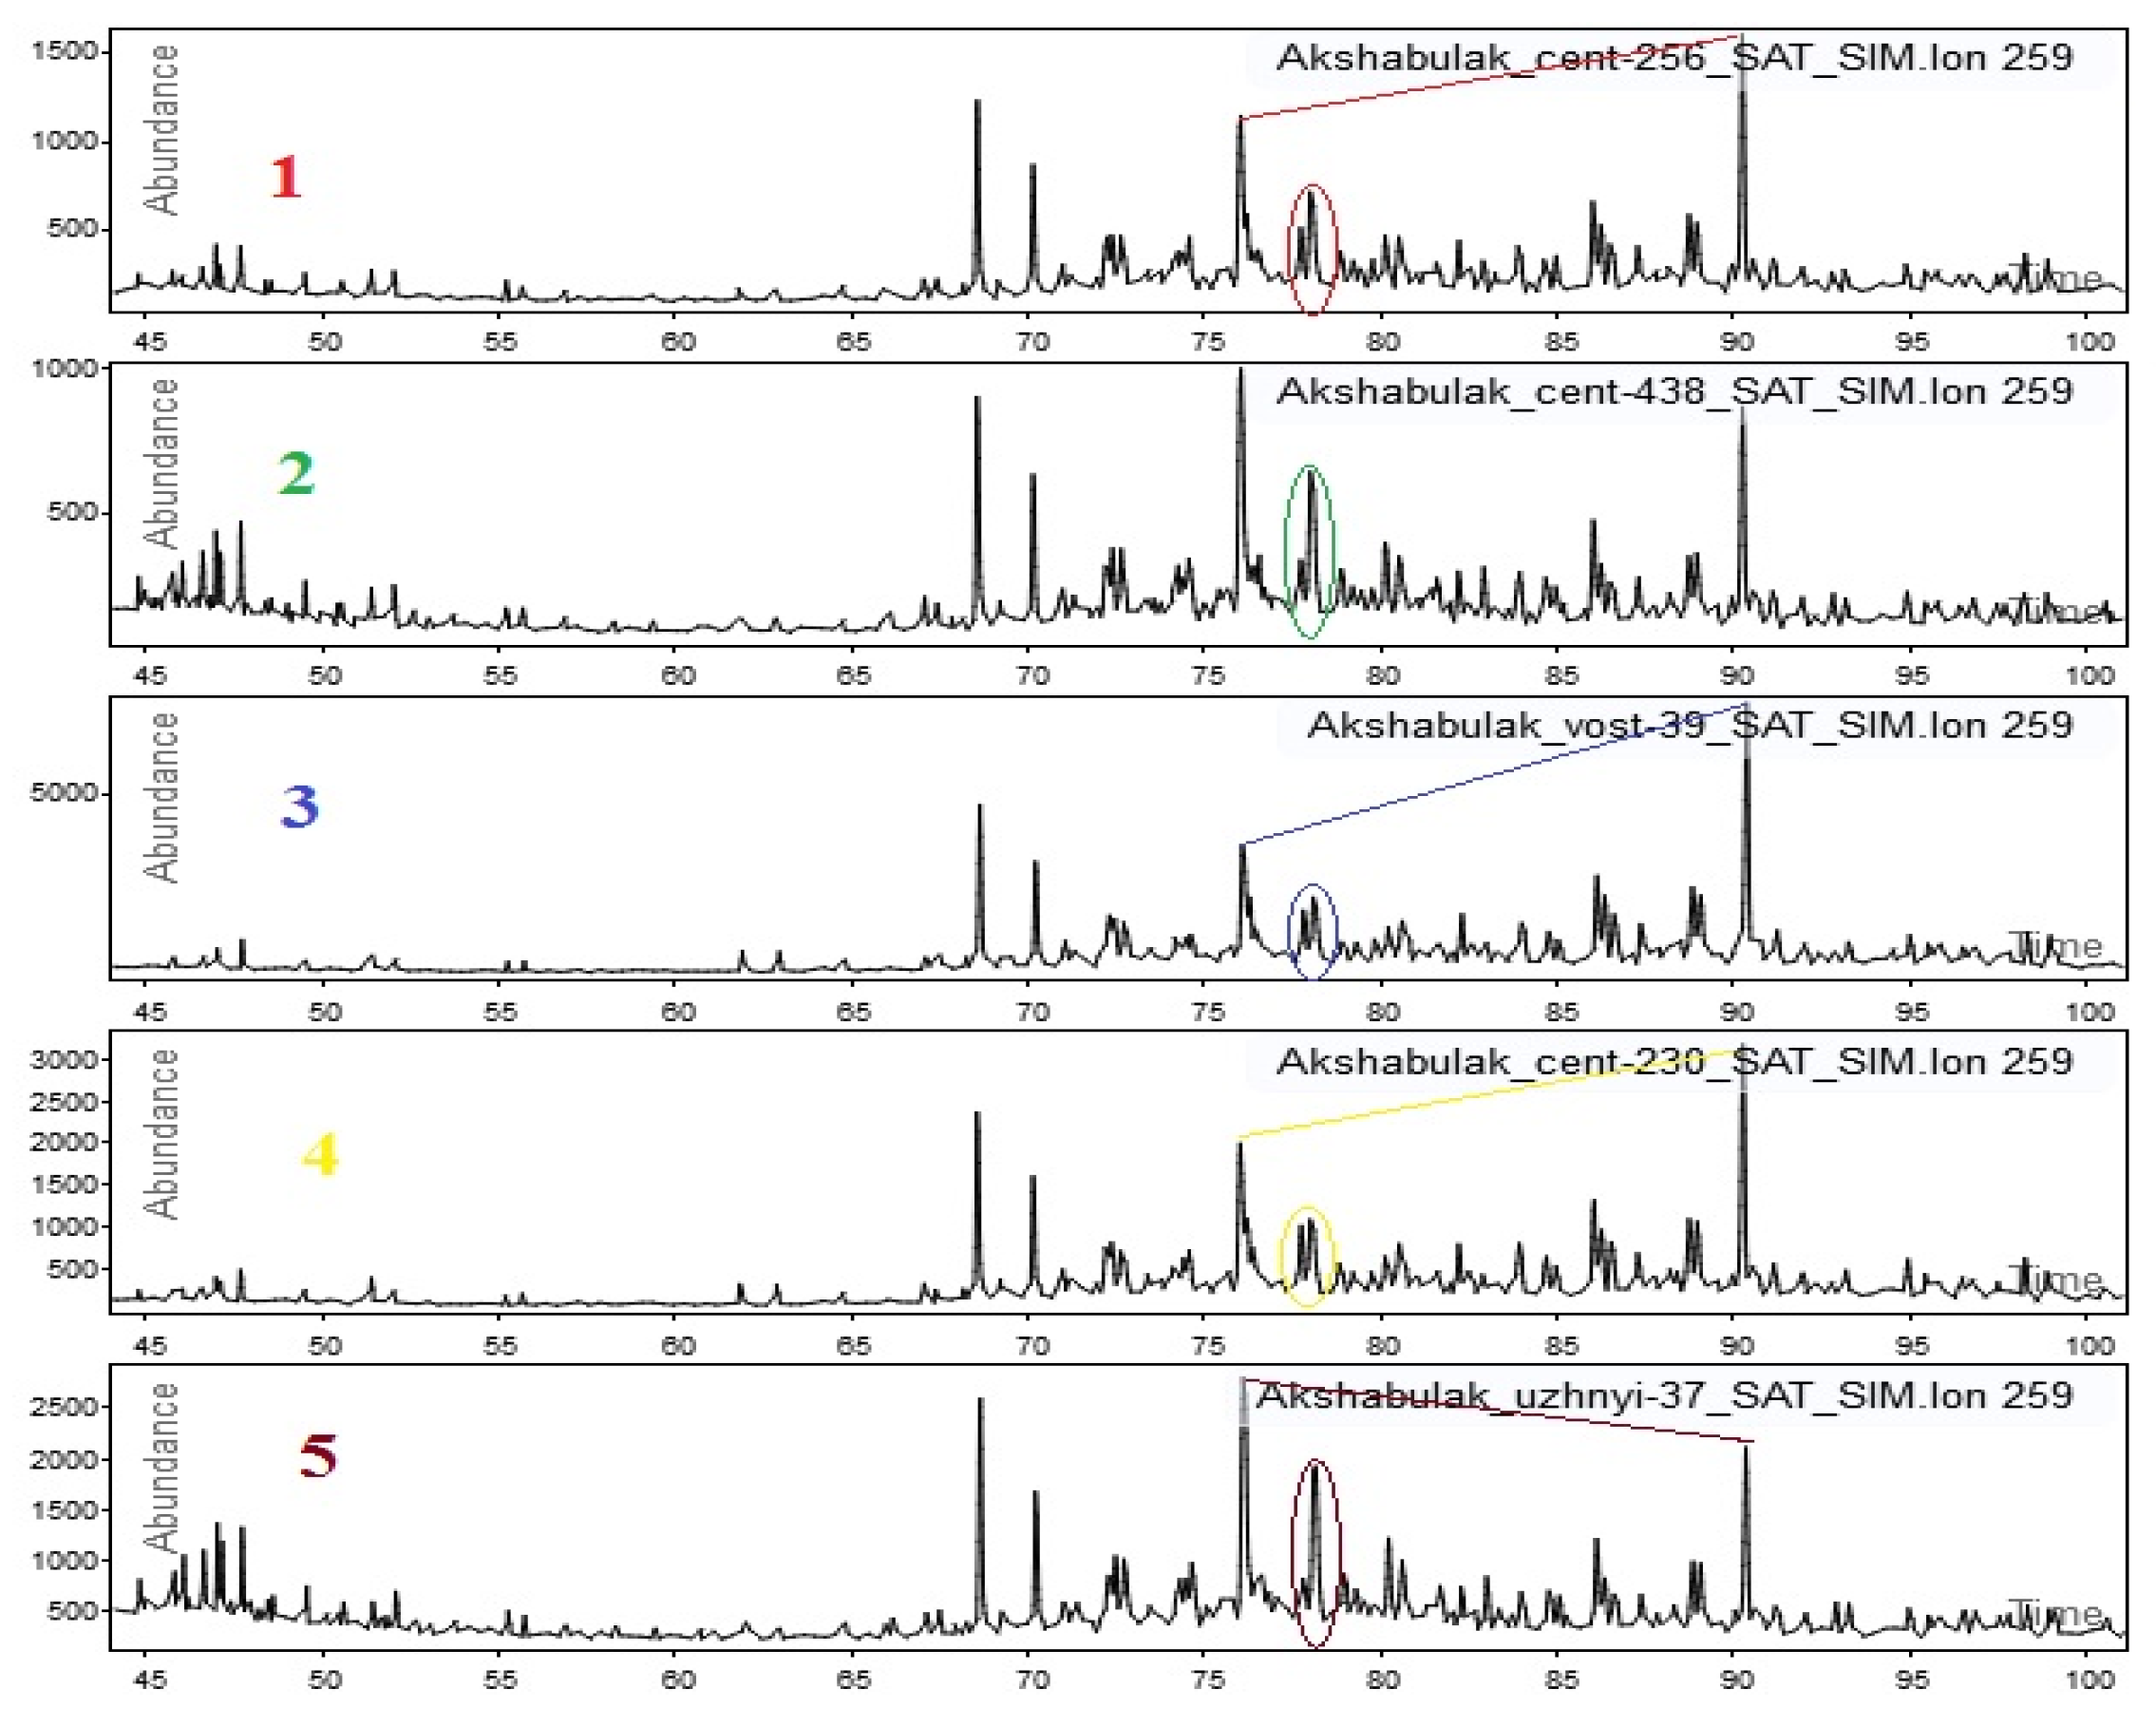
To further evaluate the identified oil groups, sterane (m/z 217) and diasterane (m/z 259) mass fragmentograms were compared (Figure 35 and Figure 36). In oils from the South Turgay Basin, low concentrations of tri- and tetracyclic terpanes are observed; therefore, the focus was placed on steranes and diasteranes.
Figure 35.
Representative m/z 217 mass chromatograms of sterane biomarkers for the principal oil groups, mixed subgroup, and anomalous subtype identified in the Akshabulak group of fields [27,29].
Figure 36.
Representative m/z 259 mass chromatograms of diasteranes for the principal oil groups, mixed subgroup, and anomalous subtype identified in the Akshabulak group of fields [27,29].
Visual analysis showed that the oil from well No. 37 differs in its biomarker profile from the other samples, supporting the oil fingerprinting results. At the same time, oils from Groups 3 and 4 exhibit a high degree of biomarker similarity, suggesting possible genetic affinity.
It should also be noted that the investigated oilfields have been under commercial production for several decades. Long-term reservoir exploitation, accompanied by pressure depletion, water injection, and continuous fluid withdrawal, may locally influence crude oil composition through preferential production of light hydrocarbons and limited mixing of fluids from adjacent reservoir compartments. Nevertheless, the consistency observed between the biomarker, oil-fingerprinting, PCA, and clustering results suggests that the major compositional patterns identified in this study primarily reflect geological controls rather than production-related effects.
The integrated application of oil fingerprinting, biomarker geochemistry, PCA, and hierarchical cluster analysis enabled discrimination among geochemically distinct oil groups, evaluation of reservoir compartmentalization, and identification of possible hydrocarbon migration pathways. These results provide a practical geochemical framework for improving reservoir correlation, supporting field-development strategies, and reducing geological uncertainty within the South Turgay Basin.
4. Discussion
The integrated application of biomarker analysis and oil fingerprinting in this study provides a multi-scale interpretation framework for evaluating petroleum systems in the South Turgay Basin. The results suggest that variability in oil composition reflects two principal controls: (i) genetic factors related to source-rock characteristics and thermal maturity, and (ii) reservoir-scale processes, including compartmentalization, fluid mixing, and hydrocarbon migration.
In the Akshabulak group of fields, the overall consistency of biomarker signatures suggests that the investigated oils may belong to a genetically related oil family derived predominantly from shaly (clay-rich) source rocks deposited under lacustrine conditions. Despite this overall biomarker similarity, oil fingerprinting reveals multiple oil populations distributed across different structural blocks and stratigraphic intervals, which may reflect differences in reservoir connectivity and compartmentalization. These results suggest that the observed compositional variability is influenced substantially by reservoir-scale heterogeneity rather than source-rock variation alone. The observed clustering patterns, together with PCA and hierarchical cluster analysis, suggest limited vertical and lateral fluid communication, consistent with a compartmentalized reservoir system.
The identification of mixed oil populations, particularly within paleochannel deposits, highlights the potential role of high-permeability pathways in controlling secondary hydrocarbon migration. These channels may act as conduits linking otherwise isolated reservoir compartments, resulting in partial homogenization of fluid signatures. This interpretation is consistent with previous oil-fingerprinting studies demonstrating the applicability of compositional fingerprints for evaluating reservoir connectivity and compartmentalization [23]. Therefore, paleochannels may represent important elements in the dynamic evolution of the Akshabulak petroleum system.
The observed variability in Pr/Ph ratios may reflect differences in the original depositional environments and redox conditions of the source rocks rather than reservoir heterogeneity alone. Reservoir compartmentalization may preserve these geochemical differences but is unlikely to represent the primary cause of the observed Pr/Ph variability.
In contrast, the Nuraly field exhibits a more complex geochemical framework, with at least two oil groups characterized by differences in biomarker composition and thermal maturity. Unlike the Akshabulak group of fields, where compositional variability appears to be strongly influenced by reservoir-scale heterogeneity, the Nuraly system may reflect both source-related differences and migration-related processes. The presence of compositionally intermediate samples suggests possible mixing between different petroleum charges and may indicate a complex filling history with overlapping migration pathways.
The lateral maturity trend observed in Nuraly, together with variations in oil density, gas content, and saturation pressure, is consistent with a possible directional migration model involving movement from deeper, more mature zones toward structurally higher, less mature reservoir intervals. The present-day distribution of oil properties may therefore reflect a combination of primary generation characteristics and secondary migration processes.
Variations in crude oil density may partly reflect migration-related fractionation processes. However, oil density is also influenced by thermal maturity, biodegradation, and reservoir alteration; therefore, the observed density variations should be interpreted as the combined result of multiple geological and geochemical processes.
The Nuraly field has been under commercial production for an extended period and currently represents a mature stage of reservoir development. Long-term production, accompanied by pressure depletion and continuous fluid withdrawal, may have locally influenced crude oil composition. Nevertheless, the consistency of the biomarker and fingerprinting patterns observed across the investigated samples suggests that the principal geochemical relationships remain identifiable despite potential production-related effects.
Overall, the combined interpretation suggests that biomarker analysis and oil fingerprinting provide complementary information. Biomarker data primarily support the evaluation of source-related characteristics and thermal maturity, whereas oil fingerprinting provides additional resolution of reservoir-scale compositional variability. Their integration therefore improves the distinction between source-related and reservoir-related controls on oil variability.
These findings have important implications for reservoir modeling and production strategy. In compartmentalized systems such as Akshabulak, particular attention should be given to identifying potential flow barriers and connectivity pathways, whereas in geochemically heterogeneous systems such as Nuraly, understanding charge history and possible migration pathways may improve exploration and development decisions.
Limitations
Despite the high interpretative value of the integrated geochemical approach, this study has several limitations that should be considered when interpreting the results.
First, the study is based on crude oil samples collected from producing wells in the Nuraly field and the Akshabulak field group, without direct geochemical analysis of source rock samples. Consequently, interpretations of oil origin and genetic relationships are inferred from molecular biomarker characteristics and their comparison with established regional geochemical models.
Second, the reconstruction of hydrocarbon migration pathways is based primarily on the spatial distribution of biomarker parameters, oil fingerprinting results, and available geological and structural data. Further refinement of the proposed migration model would benefit from basin modelling, stable isotope geochemistry, and three-dimensional geological and reservoir simulation.
Third, the oil fingerprinting results represent the present-day geochemical characteristics of reservoir fluids at the time of sampling. Potential compositional changes associated with long-term production, reservoir depletion, or secondary alteration processes were beyond the scope of this study.
Despite these limitations, the combination of a representative oil dataset, comprehensive biomarker analysis, oil fingerprinting, and multivariate statistical techniques provides an integrated framework for evaluating source-related and reservoir-related controls on oil composition, interpreting possible hydrocarbon migration pathways, and assessing reservoir compartmentalization within the South Turgay Basin.
Future research should include direct geochemical characterization of potential source rocks, expansion of the study to additional oil fields within the South Turgay Basin, integration of isotopic data, and incorporation of three-dimensional geological and dynamic reservoir models to further improve the understanding of petroleum system evolution.
The proposed integrated workflow is expected to be applicable primarily to petroleum systems with geological characteristics comparable to those of the South Turgay Basin.
5. Conclusions
This study demonstrates the value of an integrated geochemical approach combining biomarker analysis and oil fingerprinting for interpreting complex petroleum systems in the South Turgay Basin. The results suggest that oil compositional variability reflects the combined influence of source-related and reservoir-dynamic processes.
A key outcome is that the application of either biomarkers or oil fingerprinting alone may lead to incomplete or ambiguous interpretations. Biomarker parameters primarily provide information on source-related characteristics, including organic-matter type, depositional environment, and thermal maturity, whereas oil fingerprinting provides additional information on reservoir-scale compositional variability associated with fluid mixing, migration, and compartmentalization. These approaches therefore provide complementary levels of petroleum-system analysis: (i) a source-related geochemical level and (ii) a reservoir-dynamic level.
For the Akshabulak group of fields, the oils exhibit overall biomarker similarity consistent with derivation from predominantly clay-rich source rocks deposited under lacustrine conditions. However, oil fingerprinting reveals pronounced internal compositional heterogeneity expressed by several stable geochemical clusters. This heterogeneity appears to be strongly influenced by reservoir architecture, although the observed Pr/Ph variations may partly reflect local facies heterogeneity within the source system.
In contrast, the Nuraly field exhibits a more complex geochemical framework, characterized by at least two oil groups that differ in biomarker composition and thermal maturity. Oil fingerprinting reveals their spatial distribution and identifies compositionally intermediate samples, suggesting possible fluid mixing and a complex accumulation history. The observed lateral trend in thermal maturity is also consistent with possible directional hydrocarbon migration and secondary redistribution processes.
Overall, the results indicate that petroleum systems in the South Turgay Basin reflect the interaction of hydrocarbon generation, migration, fluid mixing, and reservoir heterogeneity. Integration of biomarker analysis and oil fingerprinting improves the interpretation of these overlapping controls on present-day oil composition.
From a practical perspective, the integration of biomarker analysis and oil fingerprinting may improve petroleum-system interpretation by facilitating the distinction between source-related and reservoir-dynamic controls. The obtained results may contribute to refining geological and hydrodynamic models and supporting field-development strategies. In particular, the identified features of reservoir compartmentalization within the Akshabulak group of fields suggest the need to account for partial hydraulic isolation when designing development strategies and planning the placement of production and injection wells.
The identified mixing zones and possible hydrocarbon migration pathways may provide additional constraints on preferential fluid-flow pathways and oil-accumulation patterns.
For the Nuraly field, the observed geochemical heterogeneity and evidence of possible fluid mixing highlight the need for detailed geochemical differentiation of reservoir fluids and more comprehensive reservoir-modeling approaches.
In summary, the proposed integrated approach may improve geological and hydrodynamic interpretation and support the development of complex petroleum systems in sedimentary basins with comparable geological settings.
Author Contributions
Conceptualization, O.R., S.Y. and S.Z. (Sarkulova Zhadyrassyn); Methodology, O.R., S.Y., S.Z. (Sarkulova Zhadyrassyn), S.N. and H.E.-M.; Validation, S.Y., G.A., K.M., S.Z. (Shilmagambetova Zhadra), M.M., S.N. and H.E.-M.; Formal analysis, S.Y., S.Z. (Sarkulova Zhadyrassyn), S.N. and H.E.-M.; Investigation, O.R., S.Z. (Sarkulova Zhadyrassyn), G.A., K.M., S.Z. (Shilmagambetova Zhadra), I.G., M.M., K.G. and S.N.; Resources, I.G., M.M., K.G. and S.N.; Data curation, S.Z. (Sarkulova Zhadyrassyn), G.A., K.M., S.Z. (Shilmagambetova Zhadra) and K.G.; Writing—original draft preparation, S.Z. (Sarkulova Zhadyrassyn); Writing—review and editing, O.R., S.Y., S.Z. (Sarkulova Zhadyrassyn), G.A., S.Z. (Shilmagambetova Zhadra), S.N. and H.E.-M.; Visualization, S.Z. (Sarkulova Zhadyrassyn); Supervision, H.E.-M.; Project administration, S.Z. (Sarkulova Zhadyrassyn). All authors have read and agreed to the published version of the manuscript.
Funding
This research received no external funding.
Data Availability Statement
The data presented in this study are available on request from the corresponding author.
Conflicts of Interest
Authors, Seitkhaziyev Yessimkhan and Sarsenbekov Nariman, were employed by the Atyrau Branch of KazMunayGas. The remaining authors declare that the research was conducted in the absence of any commercial or financial relationships that could be construed as a potential conflict of interest.
References
- Magoon, L.B.; Dow, W.G. The Petroleum System: From Source to Trap. In AAPG Memoir 60; American Association of Petroleum Geologists: Tulsa, OK, USA, 1994. [Google Scholar] [CrossRef] [Scilit]
- England, W.A. Reservoir geochemistry—A reservoir engineering perspective. J. Pet. Sci. Eng. 2007, 58, 344–354. [Google Scholar] [CrossRef] [Scilit]
- Allen, P.A.; Allen, J.R. Basin Analysis: Principles and Application to Petroleum Play Assessment, 3rd ed.; Wiley-Blackwell: Chichester, UK, 2013; p. 632. Available online: https://www.geokniga.org/books/39632 (accessed on 13 July 2026).
- Schengelaia, Y. Fundamentals of Petrophysics (Springer Geophysics), 2nd ed.; Springer: Berlin/Heidelberg, Germany, 2017; p. 502. [Google Scholar] [CrossRef] [Scilit]
- Franco, P.; Sandoval, L.; Galimberti, R.; Garlichs, T.U.; Venieri, M.; Hughes, N. Reservoir Geochemistry for Production Monitoring and Field Management: A Case Study in the Norwegian Sea. In Proceedings of the 85th EAGE Annual Conference & Exhibition; European Association of Geoscientists & Engineers: Houten, The Netherlands, 2024; pp. 1–5. [Google Scholar] [CrossRef] [Scilit]
- Carpentier, B.; Wilhelms, A.; Mansoori, G.A. Reservoir organic geochemistry: Processes and applications. J. Pet. Sci. Eng. 2007, 58, 341–343. [Google Scholar] [CrossRef] [Scilit]
- Abrams, M.A.; Narimanov, A.A. Geochemical evaluation of hydrocarbons and their potential sources in the western South Caspian depression, Republic of Azerbaijan. Mar. Pet. Geol. 1997, 14, 451–468. [Google Scholar] [CrossRef] [Scilit]
- Feyzullayev, A.A. Migration Pathways of Hydracarbons in South-Caspian Basin. J. Geol. Geosci. 2013, 2, 127. [Google Scholar] [CrossRef]
- Kotarba, M.J.; Bilkiewicz, E.; Jurek, K.; Więcław, D.; Machowski, G. Origin, migration and secondary processes of oil and natural gas in the western part of the Polish Outer Carpathians: Geochemical and geological approach. Int. J. Earth Sci. 2021, 110, 1653–1679. [Google Scholar] [CrossRef] [Scilit]
- Mei, M.; Katz, B. Geochemistry and Mineral Resources; IntechOpen: London, UK, 2022. [Google Scholar] [CrossRef] [Scilit]
- Fu, J.; Sheng, G.; Liu, D. Organic geochemical characteristics of major types of terrestrial petroleum source rocks in China. Geol. Soc. Lond. Spec. Publ. 1988, 40, 279–289. [Google Scholar] [CrossRef] [Scilit]
- Tissot, B.P.; Welte, D.H. Petroleum Formation and Occurrence, 2nd ed.; Springer: Berlin/Heidelberg, Germany, 1984. [Google Scholar] [CrossRef] [Scilit]
- Peters, K.E.; Walters, C.C.; Moldowan, J.M. The Biomarker Guide. In Biomarkers and Isotopes in the Environment and Human History; Cambridge University Press: Cambridge, UK, 2004; Volume 1. [Google Scholar] [CrossRef] [Scilit]
- Hamdy, D.; Ahmed, F.; Qteishat, A.; Arafat, M.; Farouk, S. Geochemical characteristics of the organic-rich Upper Cretaceous carbonates in northern Jordan: Implications for source rock evaluation and depositional settings. Pet. Geosci. 2026, 32, petgeo2024-099. [Google Scholar] [CrossRef] [Scilit]
- Alimzhanova, M.; Abdykarimov, B. Analysis of Kazakhstan Crude Oil Biomarkers by Gas Chromatography in Combination with Mass Spectrometry. Separations 2023, 10, 561. [Google Scholar] [CrossRef] [Scilit]
- He, C.; Huang, H.; Wang, Q.; Li, Z. Correlation of Maturity Parameters Derived from Methylphenanthrenes and Methyldibenzothiophenes in the Carboniferous Source Rocks from Qaidam Basin, NW China. Geofluids 2019, 2019, 5742902. [Google Scholar] [CrossRef] [Scilit]
- Nurmaganbetova, L.A.; Shestoperova, L.V. Geochemical Characteristics of the Oils of Caspian Basin According to the Biomarker Study. Natl. Assoc. Sci. (NAS) 2022, 84, 23–28. [Google Scholar]
- Ari, M.A.I.; Nton, M.E.; Harouna, M. Biomarker geochemistry and oil-oil correlation from reservoir unit oils of the Sokor-1 Formation, Fana low uplift, Termit Basin, southeastern Niger. J. Afr. Earth Sci. 2025, 223, 105522. [Google Scholar] [CrossRef] [Scilit]
- Scott, A.S.; Allen, D.U.; Paul, D.B. Recognition of and Allocation Among Multiple Sources of PAH in Urban Sediments. Environ. Claims J. 2001, 13, 141–158. [Google Scholar] [CrossRef] [Scilit]
- Larter, S.R.; Aplin, A.C. Reservoir Geochemistry: Methods, Applications and Opportunities; Geological Society, London, Special Publications: London, UK, 1995; Volume 86, pp. 5–32. [Google Scholar] [CrossRef] [Scilit]
- Seitkhaziyev, Y.S.; Jarassova, T. Application of oil fingerprinting and biomarker analysis to study fluid connectivity and reservoir isolation and genetic typing of oil obtained from the Eastern Caspian Basin. In Paper Presented at the SPE Caspian Technical Conference and Exhibition, Atyrau, Kazakhstan; Society of Petroleum Engineers: Richardson, TX, USA, 2024. [Google Scholar] [CrossRef] [Scilit]
- Ventura, G.T.; Raghuraman, B.; Nelson, R.K.; Mullins, O.C.; Reddy, C.M. Compound class oil fingerprinting techniques using comprehensive two-dimensional gas chromatography (GC×GC). Org. Geochem. 2010, 41, 1026–1035. [Google Scholar] [CrossRef] [Scilit]
- Sarkulova, Z.; Orazbekova, R.; Gusmanova, A.; Karazhanova, M.; Issengaliyeva, G.; Shayakhmetov, S.; Sarsenbekov, N.; Bazilevskaya, E. Assessment of Hydrodynamic Connectivity and Compartmentalization of Petroleum Reservoirs Based on Oil Fingerprinting. Energies 2026, 19, 3254. [Google Scholar] [CrossRef] [Scilit]
- Sandoval, L.; Riva, M.; Franco, P.; Colombo, I.; Galimberti, R.; Guadagnini, A. An original deconvolution approach for oil production allocation based on geochemical fingerprinting. Fuel 2022, 327, 124715. [Google Scholar] [CrossRef] [Scilit]
- Pavlov, D.; Vasiliev, A. Oil Fingerprinting Technology for Well and Reservoir Management. In Proceedings of the SPE Russian Petroleum Technology Conference, Moscow, Russia, 16–18 October 2017. [Google Scholar] [CrossRef] [Scilit]
- Seitkhaziyev, Y.S.; Uteyev, R.N.; Sarsenbekov, N.D.; Tassemenov, Y.T. Integrating Biomarker Analysis with Carbon Stable Isotope Signatures for Genetic Classification and Tracing Possible Migration Pathways of Hydrocarbons of Pre Caspian Basin. In Proceedings of the SPE Annual Caspian Technical Conference; SPE-202514-MS; Society of Petroleum Engineers: Richardson, TX, USA, 2020. [Google Scholar] [CrossRef] [Scilit]
- Seitkhaziyev, Y.S.; Uteyev, R.N.; Sarsenbekov, N.D. Application of Biomarkers and Oil Fingerprinting for Genetic Classification of Oil and Prediction of Petroleum Migration Pathways of Aryskum Downfold of South-Torgay Depression. In Proceedings of the SPE Annual Caspian Technical Conference; SPE-207037-MS; Society of Petroleum Engineers: Richardson, TX, USA, 2021. [Google Scholar] [CrossRef] [Scilit]
- Seitkhaziyev, Y.S.; Uteyev, R.N.; Mustafaev, M.K.; Liu, S.; Sarsenbekov, N.D.; Dosmukhambetov, A.K.; Dzhumabayev, T.Y. Application of biomarkers and oil fingerprinting for genetic classification of oil families and prediction of oil migration pathways in Nuraly field. Kazakhstan J. Oil Gas Ind. 2021, 3, 61–75. [Google Scholar] [CrossRef] [Scilit]
- Seitkhaziyev, Y.S.; Uteyev, R.N.; Mustafaev, M.K.; Liu, S.; Sarsenbekov, N.D.; Dosmukhambetov, A.K. Fingerprinting and biomarker analysis of oil from Akshabulak group for determining oil types. Kazakhstan J. Oil Gas Ind. 2021, 3, 91–108. [Google Scholar] [CrossRef] [Scilit]
- Nurabayev, N.D. Geological Structure and Petroleum Systems of the Kazakhstan Sector of the Caspian Sea and the South Mangyshlak Sedimentary Basin. Kazakhstan J. Oil Gas Ind. 2024, 6, 5–17. [Google Scholar] [CrossRef] [Scilit]
- Shi, J.; Jin, Z.; Fan, T.; Liu, Q.; Zhang, F.; Fan, X. Sequence development, depositional filling evolution, and prospect forecast in northern Aryskum Depression of South Turgay Basin, Kazakstan. Energy Explor. Exploit. 2016, 34, 621–642. [Google Scholar] [CrossRef] [Scilit]
- Yessengaliyev, D.A.; Zhumagaliyev, Y.U.; Tazhibayev, A.A.; Bekbossynov, Z.A.; Sarkulova, Z.S.; Issengaliyeva, G.A.; Zhubandykova, Z.U.; Semenikhin, V.V.; Yeskalina, K.T.; Ansapov, A.E. Energy Efficiency Trends in Petroleum Extraction: A Bibliometric Study. Energies 2024, 17, 2869. [Google Scholar] [CrossRef] [Scilit]
- Akhmetov, D.A.; Giesemann, K.M.; Koldey, M.; Liu, Z.; Sharipov, Z.K. Analysis of the Prospects for Additional Exploration of Intercut Zones to the Buried Lifting of the M-II-4 Horizon Foundation of the Nuraly Deposit. Oil Gas 2022, 4, 26–38. [Google Scholar] [CrossRef] [Scilit]
- GOST 2517-2012; Petroleum and Petroleum Products—Methods of Sampling. Standartinform: Moscow, Russia, 2014.

Disclaimer/Publisher’s Note: The statements, opinions and data contained in all publications are solely those of the individual author(s) and contributor(s) and not of MDPI and/or the editor(s). MDPI and/or the editor(s) disclaim responsibility for any injury to people or property resulting from any ideas, methods, instructions or products referred to in the content. |
© 2026 by the authors. Licensee MDPI, Basel, Switzerland. This article is an open access article distributed under the terms and conditions of the Creative Commons Attribution (CC BY) license.