


Abstract
This study examines the impact of energy security risk on the economic growth rate of the world’s 74 largest energy-consuming countries. The Energy Security Risk Index is employed to assess national vulnerability to fluctuations in energy security risk over a specified period. To investigate the empirical relationship between energy security risk and economic growth, the analysis utilizes a balanced panel dataset spanning from 1980 to 2025 and applies a series of econometric techniques, including cross-section dependence tests, unit root tests, Pedroni’s residual cointegration test, pooled mean group estimation, and a heterogeneous panel causality test. The empirical findings confirm the presence of a statistically significant causal relationship running from energy security risk to economic growth (LESR → GDPG) at the aggregate panel level. In advanced economies, energy security risk is found to constrain economic growth. Conversely, in developed economies, the results indicate that energy security risk exerts a positive and statistically significant effect on economic growth, which may be attributable to energy-related investments that drive structural transformation. These findings carry important implications for the global community, given that energy continues to serve as the lifeblood of modern production systems.
1. Introduction
The globalized economy depends fundamentally on a reliable energy supply to meet both industrial and non-industrial production needs [1,2]. Energy consumption among the world’s 74 largest energy-consuming countries is rising rapidly, rendering these nations increasingly susceptible to volatility in energy supply and prices [3]. According to the International Energy Agency [4], global energy demand increased by 2.3% in 2018, driven primarily by growing requirements for heating and cooling across expanding economies.
Considerable uncertainty persists within the global business community regarding whether future energy demand can be adequately met or whether production may be constrained by unreliable energy supply [5,6,7]. In contemporary economies, energy underpins operations across all sectors [5,6,7]. The manufacturing sector, for instance, depends on energy for output production, while the service sector requires energy to deliver its offerings. In the absence of a sufficient and stable energy supply, modern economic systems would effectively cease to function, with neither goods produced nor services rendered. Ensuring an efficient energy supply capable of meeting daily industrial requirements remains a strategic priority for modern economies. Energy security constitutes a critical component of national security, and access to affordable, clean energy is essential for the viability of contemporary economic systems [8,9]. Many countries worldwide are extensively engaged in the import and export of oil. Owing to globalization and rapid industrial expansion, the top 74 energy-consuming nations face heightened vulnerability to energy security risks stemming from supply inconsistencies, price volatility, and greenhouse gas emissions [10,11,12,13].
A comparative assessment of energy consumers reveals that Norway ranks as the most energy-secure country, having maintained this position since 2006. Since the 1980s, Norway has consistently ranked among the top three energy-secure nations, with its standing never falling below third place [10]. Several factors further exacerbate energy security risks for the top 74 energy-consuming countries, including armed conflicts, political instability, an unreliable global fuel market, high fuel import dependence and energy expenditures, significant price and market volatility, elevated energy-use intensity, an unreliable electric power sector, energy inefficiency, and rising greenhouse gas emissions [10].
Modern industrial economies have long demonstrated a vested interest in maintaining energy security while simultaneously expanding international trade and domestic production. During the 1960s, the United States became a net oil importer, thereby increasing its vulnerability to oil price fluctuations [14]. Similarly, Brazil, Russia, India, and China (the BRIC economies) have grown increasingly dependent on energy imports as their economies and industrial bases continue to expand rapidly [14]. Japan, Singapore, and South Korea also lack sufficient domestic resources to meet their rising energy demand [14]. These conditions render these global economies heavily reliant on oil imports and susceptible to energy security risks [14].
Concerns surrounding energy security risks have garnered increasing attention among policymakers and practitioners alike. According to Koyama [14], energy security risks may be categorized into two broad types: contingent risks and structural risks. Contingent risks pertain to the effects of unexpected events on energy availability. Common examples include wars, terrorism, civil unrest, natural disasters, and political upheavals [14]. For instance, natural catastrophes such as Hurricane Katrina and the Great East Japan Earthquake significantly heightened energy security risks. Likewise, the first and second oil crises, the Fourth Middle East War, and the Iranian Revolution exemplify geopolitical conflicts and shocks that amplified risks to energy security [14]. Structural risks, by contrast, arise from inherent problems in energy demand and supply, shaped by energy institutions, markets, and international political dynamics. Political embargoes, depletion of energy resources, and strong supply-side market power are among the factors that elevate structural risks [14].
The primary objective of this study is to investigate the empirical relationship between energy security risk and the economic growth rate of the top 74 energy-consuming countries over the period from 1980 to 2025, which represents the most recent available data. This research is warranted for two principal reasons. First, no existing study has examined this relationship specifically for the top 74 energy-consuming nations. While Le and Nguyen [2] assessed energy security using criteria proposed by the Asia Pacific Energy Research Centre, the present study contributes to the literature by analyzing the nexus between the Energy Security Risk (ESR) index and economic growth (GDPG), employing a comprehensive and multidimensional measure of energy security risk compiled by the Global Energy Institute [10]. Second, the ESR index utilized in this study is temporally comparable, as the Global Energy Institute [10] has produced the index consistently for several years. To date, no prior research has employed such a robust and time-consistent measure of energy security risk.
The remainder of this paper is organized as follows. Section 2 reviews the relevant literature, while Section 3 describes the data, variable definitions, econometric methodology, and descriptive statistics. Section 4 presents and discusses the empirical findings. Section 5 concludes the paper and outlines key policy implications.
2. Literature Review
A substantial body of literature has examined energy security risk and the implications of energy insecurity for national economies [2,6,15,16,17]. However, the majority of these studies are qualitative in nature and do not investigate the empirical relationship between energy security risk and economic growth rates [18,19,20]. Among the relatively few studies that do adopt an empirical approach, one notable work utilizes the Asia Pacific Energy Research Centre’s [21] classification framework to identify proxies for energy security risk [2]. The four proxies proposed by the Asia Pacific Energy Research Centre are (1) availability of energy, (2) accessibility of energy, (3) affordability of energy, and (4) acceptability of energy [2].
Notably, several scholars have underscored the conceptual ambiguity surrounding energy security risk, observing that its meaning varies considerably across different contexts and stakeholders [22,23]. Although a precise and universally accepted definition remains elusive, energy security risk is generally understood to refer to the uninterrupted availability of energy supply [22,23]. Consequently, disparate studies have adopted varying proxies to measure energy security, rendering cross-study comparisons of empirical findings challenging.
Based on the extant literature, research on energy security risk and economic growth may be broadly categorized into two streams. The first category encompasses qualitative studies that explore the conceptual and policy dimensions of energy security risk [18,19,20,24]. The second category comprises empirical investigations that estimate the causal or associative relationship between energy security risk and economic growth [2,5,6,7,16,24,25,26,27,28].
Low economic growth may contribute to energy insecurity by curtailing investment in energy infrastructure [29,30]. The energy-growth hypothesis posits a positive effect of energy consumption on economic growth [31,32]. In contrast, the neutrality hypothesis maintains that no systematic relationship exists between energy usage and output [33]. The conservation hypothesis, meanwhile, asserts that economic development drives energy consumption, but not the reverse. Furthermore, geopolitical instability tends to reduce investment in energy infrastructure, thereby exacerbating energy insecurity [34].
The first category of qualitative studies confirms that numerous renewable energy projects are being implemented worldwide to mitigate energy security risk. These initiatives are, however, subject to various socio-economic, political, and environmental risks, which stakeholders must thoroughly understand prior to implementation [18,19,20]. Such projects may also generate environmental stress that adversely affects local communities [18,19,24]. Most of these initiatives aim to enhance energy security at the local level and reduce the burden of oil imports on domestic consumers. To this end, stakeholders are advised to design and implement awareness programs that highlight the positive benefits of renewable energy projects for community welfare [35,36].
The second category encompasses empirical studies that confirm a positive relationship between energy security and economic growth, whereby energy insecurity tends to diminish economic growth [2]. The Energy Security Risk Index employed in this study is based on eight metrics: (1) reliability and diversity of global fuels, (2) fuel imports, (3) energy expenditures, (4) price and market volatility, (5) energy use intensity, (6) energy-generating capacity, (7) efficiency of energy use in the transportation sector, and (8) greenhouse gas emissions [10].
The reliability and diversity of global fuel sources are critical to enhancing energy supply [6,25]. The availability of local fuel sources boosts domestic energy production, thereby reducing dependence on fuel imports. Additionally, oil supply production and availability exert significant influence on oil price volatility [37]. To enhance fuel availability and supply, many national economies are investing substantially in renewable energy projects designed to reduce carbon dioxide emissions and promote sustainable development [5,7,16,24,26,27,28]. Policymakers must implement strategies that ensure the efficient supply of clean energy, as studies have confirmed that energy consumption contributes positively to economic growth [15,17,38]. Zhang et al. [39] found that, in the short run, foreign direct investment and carbon dioxide emissions do not affect health quality in China; however, both improve life expectancy in the long run. Nuţă et al. [40] found that economic growth serves as a key driver of carbon dioxide emissions in emerging European and Asian economies.
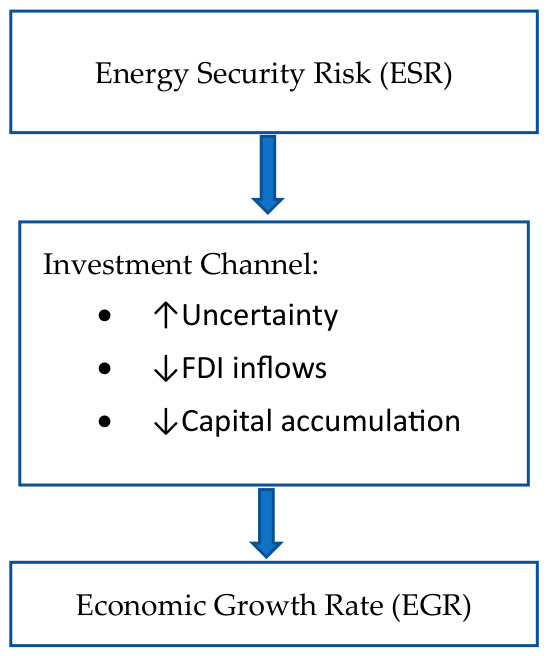
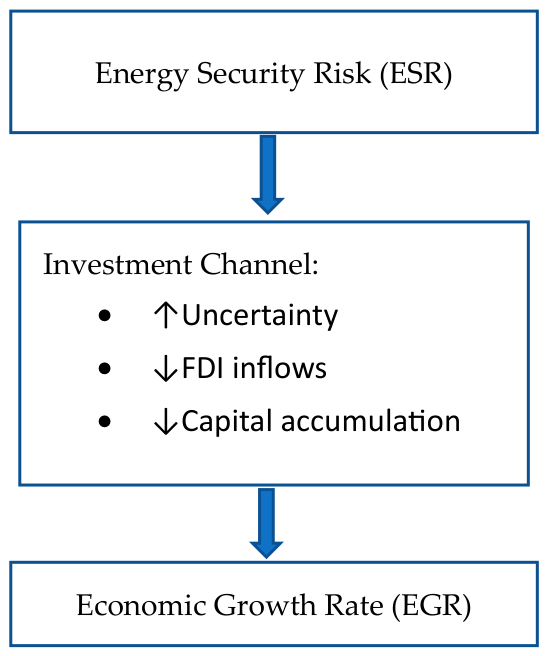
A synthesis of the extant literature reveals that only one study has attempted to empirically examine the relationship between energy security risk and economic growth. While Le and Nguyen [2] utilized the Asia Pacific Energy Research Centre’s measures of energy security risk, the present study employs the Energy Security Risk Index developed by the Global Energy Institute. The use of the Global Energy Institute’s measure offers two key advantages. First, it is more comprehensive, incorporating eight metrics and 29 variables, whereas the Asia Pacific Energy Research Centre’s criteria focus on the four A’s of energy security: availability, accessibility, affordability, and acceptability. Second, the Global Energy Institute provides a detailed index for energy security spanning from 1980 to over several years, whereas the Asia Pacific Energy Research Centre has not yet developed a comparable energy security risk index. Table A1 summarizes the studies reviewed, highlighting the countries examined, periods covered, variables and methods employed, and the key findings (see annex). Figure 1 illustrates the theoretical and empirical pathways through which Energy Security Risk (ESR) influences the Economic Growth Rate (EGR). The diagram delineates three primary transmission channels—investment, productivity, and price—and distinguishes between the direct effect and the indirect effect mediated through Foreign Direct Investment (FDI).
Figure 1.
Transmission Mechanism Through Which Energy Security Risk Affects Economic Growth Rate. Upward arrow mean increase and downward arrow means decreases.
3. Data, Description of the Variables, Econometrics Methodology and Descriptive Statistics
3.1. Data and Description of the Variables Used in This Study Data
This study is based on a balanced panel of the world’s top 74 energy-consuming countries, as identified by the Global Energy Institute [41]. The sample comprises the following nations: Algeria, Argentina, Australia, Austria, Azerbaijan, Bahrain, Bangladesh, Belarus, Belgium, Brazil, Bulgaria, Canada, Chile, China, Colombia, Croatia, Czech Republic, Denmark, Ecuador, Egypt, Finland, France, Germany, Greece, Hungary, India, Indonesia, Iran, Iraq, Ireland, Israel, Italy, Japan, Kazakhstan, Kuwait, Libya, Malaysia, Mexico, Morocco, The Netherlands, New Zealand, Nigeria, Norway, Oman, Pakistan, Paraguay, Peru, Philippines, Poland, Portugal, Qatar, Romania, Russia, Saudi Arabia, Serbia, Singapore, Slovakia, South Africa, South Korea, Spain, Sweden, Switzerland, Thailand, Trinidad and Tobago, Tunisia, Turkey, Turkmenistan, Ukraine, United Arab Emirates, United Kingdom, United States, Uzbekistan, Venezuela, and Vietnam.
The data for this study were obtained from the Global Energy Institute [41] and the World Bank [42] databases, covering the period from 1980 to 2026. To address the issue of missing observations, backward and forward linear interpolation techniques were employed. This method was selected for its straightforwardness, computational efficiency, and ease of implementation, which render it particularly advantageous when working with large panel datasets where processing speed is a priority.
To achieve resilient economic growth while managing energy security risks, nations must adopt a comprehensive strategy encompassing multiple dimensions. These include diversifying energy sources, implementing energy efficiency measures, investing in infrastructure, promoting innovation and technology, undertaking policy and regulatory reforms, developing capacity and skills, conducting risk assessment and management, and enhancing international cooperation and collaboration.
The econometric methodology employed in this study comprises several established techniques for panel data analysis. Panel unit root tests are statistical tools used to determine whether a time series variable is non-stationary or stationary within a panel dataset [43,44,45,46,47,48,49]. These tests enable researchers to ascertain whether variables exhibit long-term trends or tend to revert to their mean values over time. Cross-section dependence tests account for interdependence or correlation among individual units in a panel dataset. Pedroni’s residual cointegration test is employed to determine the presence of cointegration in panel data, which indicates a long-run equilibrium relationship between variables, suggesting that they move together over time despite short-term fluctuations. Long-run output elasticities measure the responsiveness of output to changes in inputs over time, typically when all production factors can be adjusted. Finally, heterogeneous panel causality tests are utilized to investigate causal relationships between variables in panel data when these relationships may vary across individual units or entities within the panel.
3.2. Description of the Variables Used in This Study
The two core variables in this study are the Energy Security Risk Index and the annual GDP growth rate (percentage). The Energy Security Risk Index was computed using eight energy security metrics, which are presented along with their descriptions in Table 1. All components were normalized using min–max scaling and aggregated using weights derived from principal component analysis (PCA). A higher index value indicates greater energy security risk. One of the limitations of the ESR index is that the index focuses mainly on economic and supply risks but omits geopolitical risks, infrastructure resilience and geopolitical risks.
Table 1.
Description of Metrics Used for Computing the Energy Security Risk Index.
The independent variable—economic growth rate—is proxied by the annual GDP growth rate (percentage), while the control variable for investment is proxied by net inflows of foreign direct investment (FDI) as a percentage of GDP. In the initial specification, we included additional control variables, namely proxies for capital stock, labor force, human capital, technological progress, institutional quality, trade openness, energy prices, and renewable energy penetration. However, these variables were subsequently excluded from the final model, retaining only foreign direct investment, as the inclusion of the full set of controls rendered the pooled mean group (PMG) analysis model unstable.
3.3. Econometrics Methodology
3.3.1. Panel Unit Root Tests
Prior to conducting any econometric analysis, it is necessary to test for the presence of unit roots in the sample. We employ the PANIC [50] and CIPS [51] unit root tests, as both are particularly suited for cross-sectionally dependent samples. Bai and Ng [50] developed the Panel Analysis of Nonstationarity in Idiosyncratic and Common components (PANIC) test, which represents one of the most advanced approaches in this domain, as it decomposes panel data into unobserved common factors and idiosyncratic (variable-specific) errors. This decomposition enables researchers to determine whether nonstationarity is driven by systemic or localized shocks. Pesaran [51] developed the Cross-sectionally Augmented IPS (CIPS) test, a second-generation panel unit root test specifically designed to handle panel data with cross-sectional dependence (CSD) by incorporating cross-sectional averages of lagged levels and first differences of individual series. In doing so, the CIPS test accounts for unobserved shocks that influence panel members.
3.3.2. Cross-Section Dependence Test
The recent trajectory of energy generation has increasingly shifted toward renewable energy sources. One major advantage of renewable energy lies in its lower maintenance requirements, coupled with significant health and environmental benefits [52,53]. Globalization has facilitated the cross-border exchange of knowledge and innovative ideas pertaining to renewable energy generation. Several key international organizations support this transfer of knowledge and technical expertise, including the International Energy Agency, the Organization of the Petroleum Exporting Countries (OPEC), the Energy Community, the International Energy Forum, the International Gas Union, the Energy Watch Group, and the International Renewable Energy Agency [54].
Moreover, countries have been actively engaged in the import and export of technologies for energy production and consumption. This interconnectedness implies that energy shocks originating in one country can be readily transmitted to others. Accordingly, this study employs five cross-section dependence tests: (1) the Breusch–Pagan chi-square test, (2) the Pearson LM normal test, (3) the Pearson CD normal test, (4) the Friedman chi-square test, and (5) the Frees Q test [55,56]. Many studies utilize both the CD and LM tests because their respective test statistics perform better under different conditions. For instance, the Lagrange Multiplier (LM) test yields superior results when T > N [57], whereas Pesaran’s [58] cross-section dependence test performs better when T < N. A key advantage of employing both tests is that it enables researchers to assess the robustness of the test statistics across both scenarios.
The panel data model used in this study is represented by Equations (1) and (2):
whereby LG() captures the log of the Energy Security Risk Index, and captures annual GDP growth rate percentage. Equation three captures the Lagrange Multiplier Test statistics [57]:
where represents the pairwise correlations between Equations (1) and (2) and asymptotically follows a chi-square distribution with degrees of freedom. Ignoring cross-section dependence in the sample entails several significant disadvantages. First, it may produce biased estimates, which ultimately lead to incorrect statistical inferences [59]. Second, ordinary least squares (OLS) estimation yields less efficient results in the presence of cross-section dependence. Consequently, it is imperative to test for cross-section dependence in the sample prior to undertaking any further statistical analysis [59].
3.3.3. Pedroni’s Residual Cointegration Test
Upon completion of the panel unit root tests, we proceeded to conduct cointegration analysis. This study employs Pedroni’s residual cointegration test, which examines the null hypothesis of no cointegration using three test statistics: (1) the modified Phillips–Perron t-statistic, (2) the Phillips–Perron t-statistic, and (3) the augmented Dickey–Fuller t-statistic. Pedroni’s test offers several distinct advantages. First, the modified Phillips–Perron t-statistic employs a non-parametric correction that directly accounts for both serial correlation and heteroskedasticity in the data. Second, the Phillips–Perron t-statistic is based on a non-parametric approach and remains robust to general forms of serial correlation and heteroskedasticity without requiring the specification of lag lengths. Third, the augmented Dickey–Fuller t-statistic is better equipped to capture the unique short-run dynamic adjustment processes specific to each cross-sectional unit.
3.3.4. Long-Run Output Elasticities and Short-Run Output Dynamics
The long-run output elasticities for Equations (1) and (2) were estimated using the pooled mean group (PMG) approach [60,61,62,63,64,65]. The general autoregressive distributed lag (ARDL) (1,1,1) specification for country at time in the baseline model is presented as follows:
In Equation (4), represents the coefficient of the lagged dependent variable, which captures the speed of adjustment toward the long-run equilibrium. The coefficients and reflect the short-run coefficients for the current-period variables, while and denote the short-run coefficients for the lagged variables. The term captures the country-specific fixed effect (intercept), and represents the error term. The long-run equation is specified as follows:
The key assumption underlying the pooled mean group (PMG) approach is that long-run coefficients are homogeneous across all countries. The equation employed to estimate the error correction model (ECM) using the PMG methodology is presented below:
In Equation (6), denotes the first-difference operator, such that , and represents the error correction coefficient, which captures the speed of adjustment toward the long-run equilibrium.
3.3.5. Heterogeneous Panel Causality Test
The heterogeneous panel causality test offers several advantages over the conventional Granger causality test for panel data. First, it recognizes that causal relationships may vary across individual cross-sectional units, thereby yielding more accurate and generalizable results. In contrast, the traditional Granger causality test assumes that causal relationships are identical for all entities (countries) in the sample. Second, the heterogeneous panel causality test is particularly powerful when examining countries with differing levels of development, institutional structures, or energy dependencies [66,67]. The equations for the heterogeneous panel causality test are presented in Equations (8) and (9) [68]:
whereby t and j capture the time and number of lags respectively. is expressed as follows:
whereby , and are the parameters that will be estimated by the model.
3.4. Descriptive Statistics of the Variables
The data on the average Energy Security Risk Index and the annual GDP growth rate (%) are presented in Table 2. The ten countries in our sample with the highest average Energy Security Risk Index are Turkmenistan (5225.63), Uzbekistan (3391.20), Azerbaijan (2517.09), Belarus (2411.29), Ukraine (2240.35), Singapore (2010.98), Bulgaria (1761.09), Trinidad and Tobago (1662.89), Iraq (1652.82), and Kazakhstan (1500.19).
Table 2.
Average Energy Security Risk Index and Annual GDP Growth Rate (%).
In contrast, the ten countries with the lowest average Energy Security Risk Index are Norway (693.74), Colombia (699.10), United Kingdom (711.33), Mexico (720.12), New Zealand (766.78), Australia (819.03), Denmark (821.83), Peru (823.34), Canada (829.54), and United States (851.50).
Similarly, the ten countries in our sample with the highest average annual GDP growth rate (%) are China (8.86), Vietnam (6.59), India (6.03), Singapore (6.00), Iraq (5.98), Turkmenistan (5.81), Qatar (5.67), South Korea (5.64), Malaysia (5.51), and Uzbekistan (5.27).
The ten countries with the lowest average annual GDP growth rate (%) are Belarus (−1.27), Ukraine (−0.83), Venezuela (−0.64), Russia (1.04), Greece (1.05), Italy (1.21), Germany (1.53), Hungary (1.57), Japan (1.69), and France (1.74).
4. Research Findings and Discussion
The results of the cross-sectional dependence tests are presented in Table 3. The five tests examine the presence of contemporaneous correlations across the top 74 energy-consuming countries in our sample. The test statistics reject the null hypothesis of cross-sectional independence at the 1% significance level. We therefore conclude that the two series employed in this study, namely LG(ESRI) and GDPG, are cross-sectionally dependent. This finding implies that shocks originating in one country can be readily transmitted to others, thereby affecting both the energy sector and the economic growth rate of the top 74 energy consumers. Based on these results, second-generation panel unit root tests were employed. Key sources of cross-sectional dependence include fluctuations in international oil and energy prices, synchronized business-cycle movements, increasing trade integration, financial-market interconnectedness, and major geopolitical events affecting global energy markets.
Table 3.
Cross-Sectional Dependence Test.
The results of the PANIC [50] and CIPS [51] unit root tests are presented in Table 4. As second-generation panel unit root tests, they are appropriate for cross-sectionally dependent data. The findings indicate that GDPG and FDI are stationary at levels (I(0)), whereas ESR is non-stationary (I(1)). The control variables yielded ambiguous results. Given this mixed order of integration, we employ the pooled mean group (PMG) estimator to determine both the short-run dynamics and the long-run cointegrating relationships.
Table 4.
Panel Unit Root Test.
The results of Pedroni’s residual cointegration test are reported in Table 5. The test statistics indicate that the null hypothesis of no cointegration is rejected for the sample of the top 74 energy consumers at the 1% level of significance. This finding implies that LG(ESRI) and GDPGR share a long-run equilibrium relationship.
Table 5.
Pedroni’s Residual Cointegration Test.
Table 6 reveals considerable heterogeneity across country groups. For the full sample of the top 74 energy consumers, ESR exhibits a negative but statistically insignificant relationship with the GDP growth rate. The control variable, FDI, exerts a positive and marginally significant effect on GDPG (0.0219, p = 0.061).
Table 6.
PMG-ARDL Long Run Estimation.
In the case of developed countries, we find that the effect of ESR is negative and strongly significant (−0.00179, p = 0.000), indicating that, in the long run, energy security risk significantly constrains economic growth in advanced economies. For these countries, rising energy demand, compounded by energy security risks stemming from geological, technical, economic, geopolitical, and environmental factors, exacerbates the vulnerability of their energy systems. This ultimately reflects a widening gap between energy demand and domestic production capacity, compelling most developed countries to rely increasingly on energy imports. Such dependence poses a major impediment to long-term economic growth in these nations.
In contrast to the findings for developed economies, the results for developing countries indicate that ESR exerts a positive and statistically significant impact on GDPG (0.000258, p = 0.006), attributable to energy-related investments that drive structural transformation. Currently, energy-related structural transformations are creating numerous opportunities for developing countries, including digitalization through the rise of trustless energy trading, the integration of energy systems into humanitarian response frameworks, and the emergence of new pathways for resource endowments in clean energy deployment.
For both oil-producing (−0.001337, p = 0.0236) and oil-importing countries (−0.001316, p = 0.0039) in our sample, we find that ESR has a negative and significant effect on GDPG. The control variable remains insignificant across all sample groups.
Table 7 reveals consistent error correction dynamics across all country groups. The error correction term ranges from −0.6285 to −0.7104 and is statistically significant at the 1% level in all specifications, thereby confirming cointegration and validating the long-run relationships. The short-run dynamic coefficients for the control variables, FDI and ESR, are uniformly insignificant across all subsamples, suggesting that contemporaneous changes in these variables do not exert immediate effects on economic growth.
Table 7.
PMG-ARDL Short-Run Estimations.
Table 8 provides strong panel-level evidence that LESR Granger-causes GDPG for at least one country in the sample. The magnitude of the Z-bar statistic indicates a clear and statistically significant causal relationship in the LESR → GDPG direction at the aggregate panel level. Conversely, there is no statistically significant panel-level evidence that GDPG Granger-causes LESR. The negative Z-bar value further suggests that the average individual test result is even weaker than what would be expected by chance under the null hypothesis. It is important to note that Granger causality, as employed here, is a statistical concept indicating predictive ability rather than structural causality, and thus our interpretations should be understood within this predictive framework.
Table 8.
Panel-Level Statistics (Dumitrescu-Hurlin).
Table A2 reveals that only Bangladesh, Iraq, the Netherlands, Thailand, Tunisia, Turkmenistan, and Uzbekistan exhibit statistically significant Granger causality from LESR to GDPG at the conventional 5% significance level. Consistent with the non-significant panel-level result, the reverse causality direction (GDPG → LESR) yields a considerably smaller number of significant countries. Only four countries (approximately 5.4% of the sample) show statistically significant Granger causality at the 5% level: Germany (−0.005), Greece (0.003), India (0.005), and Japan (−0.005).
5. Conclusions, Policy Implications
This study investigated the relationship between energy security risk and the economic growth rate of the top 74 energy-consuming countries over the period 1980–2025. To contribute to the extant literature, energy security risk was treated as a critical explanatory variable, given that no prior studies have comprehensively explored its relationship with the annual GDP growth rate. The study reports several significant findings with implications for policymakers, industry stakeholders, and the broader energy community.
At the full-sample level, the findings confirm that, for the top energy-consuming countries, unidirectional causality flows from energy security risk to the GDP growth rate. Bangladesh, Iraq, The Netherlands, Thailand, Tunisia, Turkmenistan, and Uzbekistan exhibit statistically significant Granger causality from LESR to GDPG at the conventional 5% significance level, while reverse causality is significant for Germany, Greece, India, and Japan. In the long run, energy security risk exhibits a negative but statistically insignificant relationship with the economic growth rate among the top 74 energy consumers. The short-run coefficients are insignificant across all sample groups, indicating that contemporaneous changes in energy security risk do not induce immediate changes in the economic growth rate.
The findings of this study carry several important implications for policymakers and practitioners. Given that the Granger causality results indicate predictive relationships rather than structural ones, the following policy recommendations should be interpreted with this statistical limitation in mind, and their implementation should ideally be supported by country-specific structural analyses. First, countries such as Bangladesh, Iraq, The Netherlands, Thailand, Tunisia, Turkmenistan, and Uzbekistan should implement policies aimed at improving the reliability and diversity of their energy supply. Expanding domestic and international renewable energy projects can reduce dependence on non-renewable energy sources and mitigate energy security risks [18,20,25].
Second, countries including Germany, Greece, India, and Japan should focus on streamlining project approvals and establishing public–private partnerships to finance large-scale renewable infrastructure, given that their economic growth rates pose an energy security risk.
Third, to reduce import vulnerability, governments should promote domestic energy production through targeted research and development (R&D) incentives and investment facilitation. Increasing fuel imports elevates the Energy Security Risk Index, underscoring the vulnerability of energy-importing countries to supply disruptions [10]. National governments can encourage business-level R&D on energy generation by offering tax incentives and subsidies to stimulate domestic energy production for industrial consumption. To render this recommendation actionable, policymakers should consider allocating at least 0.5% of GDP to energy R&D, establishing one-stop investment facilitation centers to expedite domestic energy projects, and providing production tax credits for locally generated energy. These specific targets are derived from observed practices in leading energy-secure nations and international energy policy guidelines.
Fourth, to address price volatility, governments should implement concrete stabilization mechanisms. High energy costs and significant fluctuations in energy prices exacerbate energy security risks [10]. Governments can adopt policies to reduce energy costs and price volatility, such as offering tax concessions on energy-efficient appliances or providing subsidies for energy-saving technologies. Specifically, governments should develop comprehensive emergency oil supply and crisis management plans, including the establishment of strategic petroleum reserves equivalent to 90 days of net imports.
Fifth, reducing carbon dioxide emissions from energy use can lower energy security risks [10]. Policymakers should incentivize clean energy production and consumption through subsidies, tax breaks, and investments in renewable energy infrastructure. This may be achieved by introducing economy-wide carbon pricing mechanisms to reduce carbon emissions and associated risks. Specific policy options include implementing a carbon tax starting at $25 per ton of carbon dioxide or establishing a cap-and-trade system that covers at least 60% of national emissions.
Sixth, diversification of energy sources is critical for reducing energy security threats and promoting economic growth [69]. A stable and sustainable energy supply requires the utilization of multiple energy sources—including renewables and traditional fuels—to mitigate dependence on any single source and manage supply interruptions effectively [46,65]. Investments in renewable energy also stimulate innovation and create opportunities within the green energy sector [32]. Accordingly, it is recommended that each country adopt a national energy mix strategy mandating at least four distinct energy sources, with no single source exceeding a 40% share by 2035.
Seventh, energy efficiency and conservation initiatives in buildings, transportation, enterprises, and appliances can reduce total energy demand, lower costs for businesses and households, and improve energy security by decreasing dependence on imported fuels. Energy efficiency programs also encourage investment in energy-saving technologies and reduce operational costs [32]. It is essential that countries allocate at least 5% of their national budgets to energy infrastructure projects and undertake regulatory reforms that attract private investment in renewable energy mini-grids and off-grid solutions.
Eighth, to ensure reliable supply and distribution, governments should prioritize investment in robust energy infrastructure and pursue coordinated international approaches, particularly in light of the cross-sectional dependence findings, for which all five tests reject independence at the 1% significance level. Robust energy infrastructure—including transportation networks, pipelines, storage facilities, and power grids—enhances energy security by ensuring a consistent supply and distribution of resources. Infrastructure investment also generates employment, stimulates long-term economic growth, and strengthens overall economic activity [30].
Each policy entails its own set of costs and benefits. Carbon pricing mechanisms, for instance, may encounter political resistance and produce regressive distributional effects, whereas subsidy programs often impose substantial fiscal burdens. It is therefore incumbent upon policymakers to carefully balance these considerations and to design complementary measures that address both equity and feasibility concerns.
Limitations and Future Research
This study has certain limitations that should be acknowledged and addressed in future research. First, the analysis is based on a restricted sample of 74 countries. Future studies should consider undertaking similar investigations on more diverse samples to improve the generalizability of the findings. Second, the findings from the Heterogenous Panel Causality approach should be interpreted as evidence of predictive causality rather than strict structural causality. Future researchers should employ instrumental variable approaches or quasi experimental designs to further substantiate the causal interpretations suggested by the results.
Author Contributions
S.N. contributed to the planning, design, writing, data analysis, editing, interpretation and finalization of the manuscript. A.P. contributed to planning, design, writing and editing. All authors have read and agreed to the published version of the manuscript.
Funding
This research received no external funding.
Data Availability Statement
The original contributions presented in this study are included in the article. Further inquiries can be directed to the corresponding author.
Acknowledgments
DeepSeek AI was used solely to support language editing, enhance clarity and establish an academic tone throughout the manuscript. After using this tool/service, the author reviewed and edited the content as needed and takes full responsibility for the accuracy of the ideas published in the article.
Conflicts of Interest
The authors declare no conflict of interest.
Appendix A
Table A1.
Summary of Literature Reviews on Energy Security Risk and Economic Growth Rate.
Table A2.
Heterogeneous Panel Granger Causality Test Results—Individual Countries (Dependent variables as indicated; lag order = 1).
References
- Iorember, P.T.; Tang, C.F.; Ozkan, O.; Nwani, C.; Alola, A.A. Macroeconomic-energy-related uncertainty and economic complexity as drivers of renewable energy investment. Comput. Econ. 2026, 67, 1901–1926. [Google Scholar] [CrossRef] [Scilit]
- Le, T.-H.; Nguyen, C.P. Is energy security a driver for economic growth? Evidence from a global sample. Energy Policy 2019, 129, 436–451. [Google Scholar] [CrossRef] [Scilit]
- World Energy Council. World Energy Scenarios. 2019. Available online: https://www.worldenergy.org/assets/downloads/Scenarios_Report_FINAL_for_website.pdf (accessed on 10 February 2026).
- International Energy Agency. Global Energy Demand Rose by 2.3% in 2018, Its Fastest Pace in the Last Decade. 2019. Available online: https://www.iea.org/news/global-energy-demand-rose-by-23-in-2018-its-fastest-pace-in-the-last-decade (accessed on 10 February 2026).
- Arroyo, M.; Flavio, R.; Miguel, L.J. The Trends of the Energy Intensity and CO2 Emissions Related to Final Energy Consumption in Ecuador: Scenarios of National and Worldwide Strategies. Sustainability 2020, 12, 20. [Google Scholar] [CrossRef] [Scilit]
- Kruyt, B.; van Vuuren, D.; de Vries, H.; Groenenberg, H. Indicators for energy security. Energy Policy 2009, 37, 2166–2181. [Google Scholar] [CrossRef] [Scilit]
- Tucho, G.T. The Impacts of Policy on Energy Justice in Developing Countries. In Energy Justice Across Borders; Springer: Cham, Switzerland, 2020; pp. 137–154. [Google Scholar]
- Ballard, G.A. Less Oil or More Caskets: The National Security Argument for Moving Away from Oil; Prestyge Books: Bloomington, IN, USA; Indiana University Press: Bloomington, IN, USA, 2019. [Google Scholar]
- Whitton, J.; Charnley-Parry, I. The Long Hello: Energy Governance, Public Participation, and ‘Fracking’. In The Palgrave Handbook of Managing Fossil Fuels and Energy Transitions; Palgrave Macmillan: Cham, Switzerland, 2020; pp. 405–425. [Google Scholar]
- Global Energy Institute. International Index of Energy Security Risk: Assessing Risk in a Global Market. 2018. Available online: https://www.globalenergyinstitute.org/sites/default/files/2019-10/Final2018Index.pdf (accessed on 10 February 2026).
- Lal, R.; Kumar, S.; Naidu, S. A cost-benefit analysis of small biofuel projects in Fiji: Lessons and implications. J. Clean. Prod. 2022, 340, 130812. [Google Scholar] [CrossRef] [Scilit]
- Naidu, S. Exploring the dynamic effects of urbanization and real effective exchange rate on tourism output of Singapore. Tour. Anal. 2017, 22, 185–200. [Google Scholar] [CrossRef] [Scilit]
- Naidu, S.; Pandaram, A. Capital investment and economic impact: A long-run causality analysis of the travel and tourism sector in North America. Int. J. Humanit. Soc. Sci. 2026, 16, 115–129. [Google Scholar] [CrossRef] [Scilit]
- Koyama, K. A Discussion on Energy Security Threat and Risk Factors. The Institute of Energy Economics, Japan. 2017. Available online: https://eneken.ieej.or.jp/data/7518.pdf (accessed on 10 February 2026).
- Akinlo, A.E. Energy consumption and economic growth: Evidence from 11 Sub-Sahara African countries. Energy Econ. 2008, 30, 2391–2400. [Google Scholar] [CrossRef] [Scilit]
- Fizaine, F.; Court, V. Energy expenditure, economic growth, and the minimum EROI of society. Energy Policy 2016, 95, 172–186. [Google Scholar] [CrossRef] [Scilit]
- Mehrara, M. Energy consumption and economic growth: The case of oil exporting countries. Energy Policy 2007, 35, 2939–2945. [Google Scholar] [CrossRef] [Scilit]
- Kamran, M.; Fazal, M.R.; Mudassar, M. Towards empowerment of the renewable energy sector in Pakistan for sustainable energy evolution: SWOT analysis. Renew. Energy 2020, 146, 543–558. [Google Scholar] [CrossRef] [Scilit]
- Sen, V.; Kulkarni, A. Promotional Policies and Legislative Support for Grid-Connected Renewable Energy Projects. In Cases on Green Energy and Sustainable Development; IGI Global: Hershey, PA, USA, 2020; pp. 60–94. [Google Scholar]
- Sovacool, B.K.; Bulan, L.C. Energy security and hydropower development in Malaysia: The drivers and challenges facing the Sarawak Corridor of Renewable Energy (SCORE). Renew. Energy 2012, 40, 113–129. [Google Scholar] [CrossRef] [Scilit]
- Asia Pacific Energy Research Centre. Institute of Energy Economics, Japan. 2007. Available online: https://aperc.ieej.or.jp/file/2010/9/26/APERC_2007_A_Quest_for_Energy_Security.pdf (accessed on 10 February 2026).
- Alhajji, A.F. What is energy security? Definitions and concepts. Oil Gas Energy Law J. 2008, 6, 11–26. [Google Scholar]
- Ang, B.; Choong, W.; Ng, T. Energy security: Definitions, dimensions and indexes. Renew. Sustain. Energy Rev. 2015, 42, 1077–1093. [Google Scholar] [CrossRef] [Scilit]
- Gasparatos, A.; Gadda, T. Environmental support, energy security and economic growth in Japan. Energy Policy 2009, 37, 4038–4048. [Google Scholar] [CrossRef] [Scilit]
- Csereklyei, Z.; Stern, D.I. Global energy use: Decoupling or convergence? Energy Econ. 2015, 51, 633–641. [Google Scholar] [CrossRef] [Scilit]
- Holtz-Eakin, D.; Selden, T.M. Stoking the fires? CO2 emissions and economic growth. J. Public Econ. 1995, 57, 85–101. [Google Scholar] [CrossRef] [Scilit]
- Menyah, K.; Wolde-Rufael, Y. CO2 emissions, nuclear energy, renewable energy and economic growth in the US. Energy Policy 2010, 38, 2911–2915. [Google Scholar] [CrossRef] [Scilit]
- Say, N.P.; Yücel, M. Energy consumption and CO2 emissions in Turkey: Empirical analysis and future projection based on an economic growth. Energy Policy 2006, 34, 3870–3876. [Google Scholar] [CrossRef] [Scilit]
- Ivanovski, K.; Iyke, B.N. Does energy security affect tourism? Empir. Econ. 2026, 70, 26. [Google Scholar] [CrossRef] [Scilit]
- Xiong, S.; Attar, R.W.; Ullah, S. Energy security risk and private sector development: A pathway to renewable energy investment in emerging economies. Energy Strategy Rev. 2026, 63, 102012. [Google Scholar] [CrossRef] [Scilit]
- Nguyen, Q.K. Green Energy Is Not Always Green: An Analysis of Renewable Energy, Economic Growth, and CO2 Emissions in Developing Countries. Sustain. Dev. 2026. [Google Scholar] [CrossRef] [Scilit]
- Vi, N.T.; Chung, D.T.K.; Xuan, V.N.; Hoa, P.X. Determinants of economic growth in Korea: The roles of financial development, energy use, trade openness, and open innovation (ARDL evidence). Energy Convers. Manag. X 2026, 30, 101823. [Google Scholar] [CrossRef] [Scilit]
- Endeer, B.; Eweade, B.S.; Henni, M.D.; Uzun, B. Industrialization, ICT, and China’s environmental transition toward carbon neutrality: Evidence from wavelet cross-quantile regression. Environ. Sci. Eur. 2026, 38, 48. [Google Scholar] [CrossRef] [Scilit]
- Zaman, M.; Qin, Q.; Ullah, A. Towards Climate Resilience and Carbon Neutrality Goals: Investigating the Nexus Between Nonrenewable Energy Consumption, Green Finance, Eco-Innovation, and Green Taxes. Bus. Strategy Environ. 2026, 35, 1368–1386. [Google Scholar] [CrossRef] [Scilit]
- Boute, A. Regulatory stability and renewable energy investment: The case of Kazakhstan. Renew. Sustain. Energy Rev. 2020, 121, 109673. [Google Scholar] [CrossRef] [Scilit]
- Cook, T.; Elliott, D. Renewable Energy in Africa: Changing Support Systems. In Renewable Energy and Sustainable Buildings; Springer: Cham, Switzerland, 2020; pp. 235–244. [Google Scholar]
- Razek, N.H.; Michieka, N.M. OPEC and Non-OPEC Production, Global Demand, and the Financialization of Oil. Res. Int. Bus. Financ. 2019, 50, 201–225. [Google Scholar] [CrossRef] [Scilit]
- Lee, C.-C.; Chang, C.-P. The impact of energy consumption on economic growth: Evidence from linear and nonlinear models in Taiwan. Energy 2007, 32, 2282–2294. [Google Scholar] [CrossRef] [Scilit]
- Zhang, Z.; Nuță, F.M.; Dimen, L.; Ullah, I.; Si, X.; Yao, J.; Zhou, Y.; Chen, Y. Relationship between FDI inflow, CO2 emissions, renewable energy consumption, and population health quality in China. Front. Environ. Sci. 2023, 11, 1120970. [Google Scholar] [CrossRef] [Scilit]
- Nuţă, F.M.; Sharafat, A.; Abban, O.J.; Khan, I.; Irfan, M.; Nuţă, A.C.; Dankyi, A.B.; Asghar, M. The relationship among urbanization, economic growth, renewable energy consumption, and environmental degradation: A comparative view of European and Asian emerging economies. Gondwana Res. 2024, 128, 325–339. [Google Scholar] [CrossRef] [Scilit]
- Global Energy Institute. Energy Security Risk Index Data. 2019. Available online: https://www.globalenergyinstitute.org/energy-security-risk-index (accessed on 10 February 2026).
- World Bank Database. GDP Annual Growth Rate Data. 2019. Available online: https://databank.worldbank.org/indicator/NY.GDP.MKTP.KD.ZG/1ff4a498/Popular-Indicators# (accessed on 10 February 2026).
- Abdullah, S.M.; Siddiqua, S.; Huque, R. Is health care a necessary or a luxury product for Asian countries? An answer using the panel approach. Health Econ. Rev. 2017, 7, 4. [Google Scholar] [CrossRef] [Scilit] [PubMed]
- Choi, I. Unit root tests for panel data. J. Int. Money Financ. 2001, 20, 249–272. [Google Scholar] [CrossRef] [Scilit]
- Hadri, K. Testing for stationarity in heterogeneous panel data. Econom. J. 2000, 3, 148–161. [Google Scholar] [CrossRef] [Scilit]
- Hasan, N.; Toma, R.N.; Nahid, A.-A.; Islam, M.M.M.; Kim, J.-M. Electricity theft detection in smart grid systems: A CNN-LSTM based approach. Energies 2019, 12, 3310. [Google Scholar] [CrossRef] [Scilit]
- Im, K.S.; Pesaran, M.; Shin, Y. Testing for unit roots in heterogeneous panels. J. Econom. 2003, 115, 53–74. [Google Scholar] [CrossRef] [Scilit]
- Maddala, G.S.; Wu, S. A comparative study of unit root tests with panel data and a new simple test. Oxf. Bull. Econ. Stat. 1999, 61, 631–652. [Google Scholar] [CrossRef] [Scilit]
- Moon, H.R.; Perron, B. Testing for a unit root in panels with dynamic factors. J. Econom. 2004, 122, 81–126. [Google Scholar] [CrossRef] [Scilit]
- Bai, J.; Ng, S. A PANIC attack on unit roots and cointegration. Econometrica 2004, 72, 1127–1177. [Google Scholar] [CrossRef] [Scilit]
- Pesaran, M.H. A simple panel unit root test in the presence of cross-section dependence. J. Appl. Econom. 2007, 22, 265–312. [Google Scholar] [CrossRef] [Scilit]
- Ellabban, O.; Abu-Rub, H.; Blaabjerg, F. Renewable energy resources: Current status, future prospects and their enabling technology. Renew. Sustain. Energy Rev. 2014, 39, 748–764. [Google Scholar] [CrossRef] [Scilit]
- Schaber, K.; Steinke, F.; Mühlich, P.; Hamacher, T. Parametric study of variable renewable energy integration in Europe: Advantages and costs of transmission grid extensions. Energy Policy 2012, 42, 498–508. [Google Scholar] [CrossRef] [Scilit]
- United Nations Energy. Activities of Member Organizations and Partners of UN-Energy in Support of “2014–2024 United Nations Decade of Sustainable Energy for All”. 2014. Available online: https://sustainabledevelopment.un.org/content/documents/1324Activities%20UN-Energy%20Members%20for%20the%20Decade%20Draft%20Report.pdf (accessed on 10 February 2026).
- Awad, A. Does economic integration damage or benefit the environment? Africa’s experience. Energy Policy 2019, 132, 991–999. [Google Scholar] [CrossRef] [Scilit]
- Rath, B.N.; Akram, V.; Bal, D.P.; Mahalik, M.K. Do fossil fuel and renewable energy consumption affect total factor productivity growth? Evidence from cross-country data with policy insights. Energy Policy 2019, 127, 186–199. [Google Scholar] [CrossRef] [Scilit]
- Breusch, T.S.; Pagan, A.R. The Lagrange multiplier test and its applications to model specification in econometrics. Rev. Econ. Stud. 1980, 47, 239–253. [Google Scholar] [CrossRef] [Scilit]
- Pesaran, M.H. General Diagnostic Tests for Cross Section Dependence in Panels. 2004. Available online: https://papers.ssrn.com/sol3/papers.cfm?abstract_id=572504 (accessed on 10 February 2026).
- Belaïd, F.; Zrelli, M.H. Renewable and non-renewable electricity consumption, environmental degradation and economic development: Evidence from Mediterranean countries. Energy Policy 2019, 133, 110929. [Google Scholar] [CrossRef] [Scilit]
- Narayan, P.K.; Narayan, S.; Popp, S. Does electricity consumption panel Granger cause GDP? A new global evidence. Appl. Energy 2010, 87, 3294–3298. [Google Scholar] [CrossRef] [Scilit]
- Othman, A.N.; Masih, M. Do Profit and Loss Sharing (PLS) Deposits Also Affect PLS Financing? Evidence from Malaysia Based on DOLS, FMOLS and System GMM Techniques. 2015. Available online: https://mpra.ub.uni-muenchen.de/65224/ (accessed on 10 February 2026).
- Pesaran, M.H. Estimation and Inference in Large Heterogenous Panels with Cross Section Dependence. 2003. Available online: https://ssrn.com/abstract=385123 (accessed on 10 February 2026).
- Pesaran, M.H.; Yamagata, T. Testing slope homogeneity in large panels. J. Econom. 2008, 142, 50–93. [Google Scholar] [CrossRef] [Scilit]
- Smith, L.V.; Leybourne, S.; Kim, T.H.; Newbold, P. More powerful panel data unit root tests with an application to mean reversion in real exchange rates. J. Appl. Econom. 2004, 19, 147–170. [Google Scholar] [CrossRef] [Scilit]
- Zidi, S.; Mihoub, A.; Qaisar, S.M.; Krichen, M.; Abu Al-Haija, Q. Theft detection dataset for benchmarking and machine learning based classification in a smart grid environment. J. King Saud Univ. Comput. Inf. Sci. 2023, 35, 13–25. [Google Scholar] [CrossRef] [Scilit]
- Aydoğan, B.; Vardar, G. Evaluating the role of renewable energy, economic growth and agriculture on CO2 emission in E7 countries. Int. J. Sustain. Energy 2019, 39, 335–348. [Google Scholar] [CrossRef] [Scilit]
- Bhattacharya, M.; Paramati, S.R.; Ozturk, I.; Bhattacharya, S. The effect of renewable energy consumption on economic growth: Evidence from top 38 countries. Appl. Energy 2016, 162, 733–741. [Google Scholar] [CrossRef] [Scilit]
- Akkemik, K.A.; Göksal, K. Energy consumption-GDP nexus: Heterogeneous panel causality analysis. Energy Econ. 2012, 34, 865–873. [Google Scholar] [CrossRef] [Scilit]
- Yan, Y.; Khan, K.A.; Adebayo, T.S.; Olanrewaju, V.O. Unveiling energy efficiency and renewable electricity’s role in achieving sustainable development goals 7 and 13 policies. Int. J. Sustain. Dev. World Ecol. 2024, 31, 497–522. [Google Scholar] [CrossRef] [Scilit]

Disclaimer/Publisher’s Note: The statements, opinions and data contained in all publications are solely those of the individual author(s) and contributor(s) and not of MDPI and/or the editor(s). MDPI and/or the editor(s) disclaim responsibility for any injury to people or property resulting from any ideas, methods, instructions or products referred to in the content. |
© 2026 by the authors. Licensee MDPI, Basel, Switzerland. This article is an open access article distributed under the terms and conditions of the Creative Commons Attribution (CC BY) license.