


Abstract
Reactivity-controlled compression ignition (RCCI) enhances engine performance while mitigating the diesel soot–NOx tradeoff. In this work, natural gas (NG) RCCI combustion was investigated on a heavy-duty single-cylinder research engine with three different pilot fuels: diesel, an 80/20 (% v/v) blend of n-butanol and diesel (80B20D), and dipropyl oxymethylene ether (P1P). The experiments were performed at a constant speed of 1339 rev/min, a fixed load (IMEPg = 5 bar), and 1.5 bar boost pressure. Initially, NG RCCI combustion was studied under identical operating conditions, and subsequently with constant combustion phasing (CA50) for all pilot fuel–NG combinations for a levelized comparison. The results revealed that CA50 profoundly impacted the efficiency and unburned hydrocarbon (HC) emissions for all pilot fuels. Maintaining an optimal CA50 of 363 ± 1 CAD, high fuel conversion efficiencies (~40%) and HC emission reductions (~38–49%) were achieved across pilot fuels. The pilot fuel reactivity significantly affected combustion and emissions. The apparent heat release histories transformed from a two-stage to a single-stage Gaussian profile at a much-retarded start of injection (SOI~30 bTDC) for 80B20D-NG compared to diesel–NG and P1P-NG (40 bTDC), leading to significantly lower NOx emissions. More advanced SOIs and lower NOx emissions were possible with diesel–NG and P1P-NG compared to 80B20D-NG.
1. Introduction
Internal combustion engines have been the prime movers of globalization for more than a century in all modes of transportation, from personal mobility vehicles to large oceangoing ships and airplanes. Over the years, tremendous improvements have been achieved in terms of engines’ overall designs and advanced combustion strategies to enhance their performance while reducing emissions. Particularly, diesel-fueled compression ignition engines have been widely used in the heavy-duty transportation sector due to their robustness and power-producing capability. Currently, ~77% of Class 3 and above trucks are powered by diesel fuel [1]. According to the Energy Information Agency (EIA), Class 7 and Class 8 trucks in the U.S. travel nearly 200 billion miles annually. Recent trends indicate that by 2050, this metric will increase to 300 billion miles, highlighting the reliance on heavy-duty diesel trucks [2]. The major concerns with diesel engines are the engine-out emissions of oxides of nitrogen (NOx) and soot. In the 1950s, researchers determined that motor vehicle pollutants contribute to smog and decreased air quality. Since then, the Clean Air Act of 1970 [3] was implemented by the U.S. Environmental Protection Agency (EPA) to regulate the emissions standards for motor vehicles. As a result of these standards, research into diesel engines and exhaust catalysts became more critical to meet regulatory requirements. After decades of effort, we have reached a point where diesel engines now emit lower levels of pollutants than they breathe in [4,5]. Current regulations have become more stringent, focusing on both engine-out pollutants and greenhouse gas emissions, with the aim of achieving net-zero carbon emissions from the transportation sector by 2050.
Many advanced combustion strategies have been investigated over several decades to meet stringent emission standards. One such strategy is dual-fuel combustion, which uses a high-reactive fuel (HRF) to ignite an LRF [6,7,8]. Various techniques have been developed for dual-fuel combustion (DFC), including advanced low pilot-ignited natural gas (ALPING) combustion [9], premixed mixture ignition in the end-gas region (PREMIER) [10], and reactivity-controlled compression ignition (RCCI) [11]. DFC, including RCCI, has proven effective for reducing engine-out emissions with a minimal impact on engine efficiency. In particular, dual-fuel combustion may be adopted to defeat the soot vs NOx tradeoff in conventional diesel combustion.
In addition to advanced combustion strategies, various potential renewable alternative fuels have been studied to achieve the net-zero carbon emissions goal, including renewable diesel [12]; oxymethylene ethers (OMEx) [13] as HRFs; and alcohol-based fuels [14], etc., as low-reactive fuels (LRFs) in DCF. Some of these fuels, such as OMEx and alcohol-based fuels, are oxygenated fuels with auto-ignition properties comparable to those of diesel. The presence of oxygen in these fuels and fewer C-C bonds also leads to decreased soot emissions.
Several studies have shown that OMEx could be a potential renewable replacement for diesel because of their lower well-to-tank (WTT) CO2 emissions, combined with their lower soot emissions because of the lack of C-C bond in their molecular structures. Benajes et al. [15] conducted a WTT analysis comparing diesel, gasoline, and OMEx, and found that CO2 emissions during the production of these fuels are 18.6, 17.2, and −16.8 , respectively. This highlights the lower WTT CO2 emissions of OMEx. Combined with low-temperature combustion (LTC), OMEx reduce NOx and soot emissions simultaneously. OMEx may be potential quick replacements for diesel fuel without any major modification to the existing fuel systems.
Hariharan et al. [16] investigated polyoxymethylene dimethyl ether (POMDME), a methyl-terminated OME variant in a single-cylinder research engine, and optimized the engine control parameters to reduce the HC and CO emissions in DFC. Since it showed good potential as a replacement for diesel as the HRF in DFC, Narayanan et al. [17] investigated propyl oxymethylene ether (P1P) (a higher alkyl-terminated OME) for ignition of NG in the same single-cylinder research engine as in Hariharan et al. The HRF injection timing, boost pressure, and rail pressure were optimized to achieve an IFCE increase of 2.7 percentage points along with a reduction in HC and CO of 24% and 45%, respectively, compared to the baseline values.
Alcohol-based fuels and alcohol blends, particularly n-butanol, have shown potential as renewable pilot fuels due to their low sooting propensity resulting from their oxygen content, as well as their very good miscibility with diesel [18]. Additionally, n-butanol can be produced from renewable feedstocks such as corn, sugar beets, and other biomass [19].
Wang et al. [14] investigated an 80/20% (v/v) n-butanol/diesel blend in a heavy-duty diesel engine that closely matched the engine specifications of a single-cylinder research engine (SCRE). Their results demonstrated that the soot–NOx tradeoff was eliminated up to a load of 16 bar IMEPg. Even with 40% EGR, the soot and NOx emissions were below EURO VI standards. As the injection pressure increased, the CO emissions decreased while the NOx emissions increased; however, the injection pressure had an effect on soot emissions. Due to the low cetane number of the blend, lambda was maintained at 1.55 to achieve stable combustion. They also emphasized that, to extend the operating range, multiple injection strategies need to be implemented at a low load.
Han et al. [20] investigated the performance and emissions of n-butanol in a dual-fuel RCCI combustion strategy using n-heptane as the pilot fuel in a diesel engine. The study examined the effect of different operating parameters, such as start of injection timing, double-injection strategy, boost pressure, and EGR ratio. Advancing the start of injection to 30 bTDC resulted in two different combustion regimes with delayed combustion phasing, leading to increased CO and HC emissions. Increasing the boost under these conditions had a minimal impact on combustion phasing but resulted in increased HC and CO emissions, with decreased NOx emissions. Compared to the single-injection strategy, the double-injection strategy improved efficiency with a minimal emissions penalty, due to improved combustion phasing. Because of the low reactivity of n-butanol, EGR was introduced to achieve combustion phasing slightly after TDC, leading to lower peak pressures, decreased CO emissions, and improved efficiency. This indicates the importance of combustion phasing.
2. Objectives
The primary objectives of the present work are to characterize the following aspects of NG RCCI combustion:
- The impact of different pilot fuels on combustion, performance, and emissions under identical operating conditions.
- A levelized comparison of performance and emissions for different pilot fuels at a fixed combustion phasing (CA50).
Previous studies have demonstrated that low-load dual-fuel operation is quite challenging, due to higher COVIMEPg compared to high loads [21,22,23]. The B-speed is selected based on Mode 9 of the heavy-duty Supplemental Emissions Test (SET) cycle. Mode 9 has the second-highest weighting after the idle condition, highlighting the importance of this operating speed for emissions compliance and its relevance to practical heavy-duty engine operation [24]. Therefore, the present work is targeted toward comparing pilot fuels for NG RCCI at a low load of 5 bar IMEPg and B-speed (1339 rpm).
3. Experimental Setup and Fuel Properties
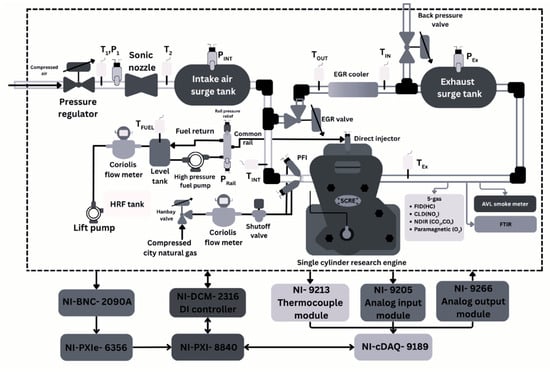
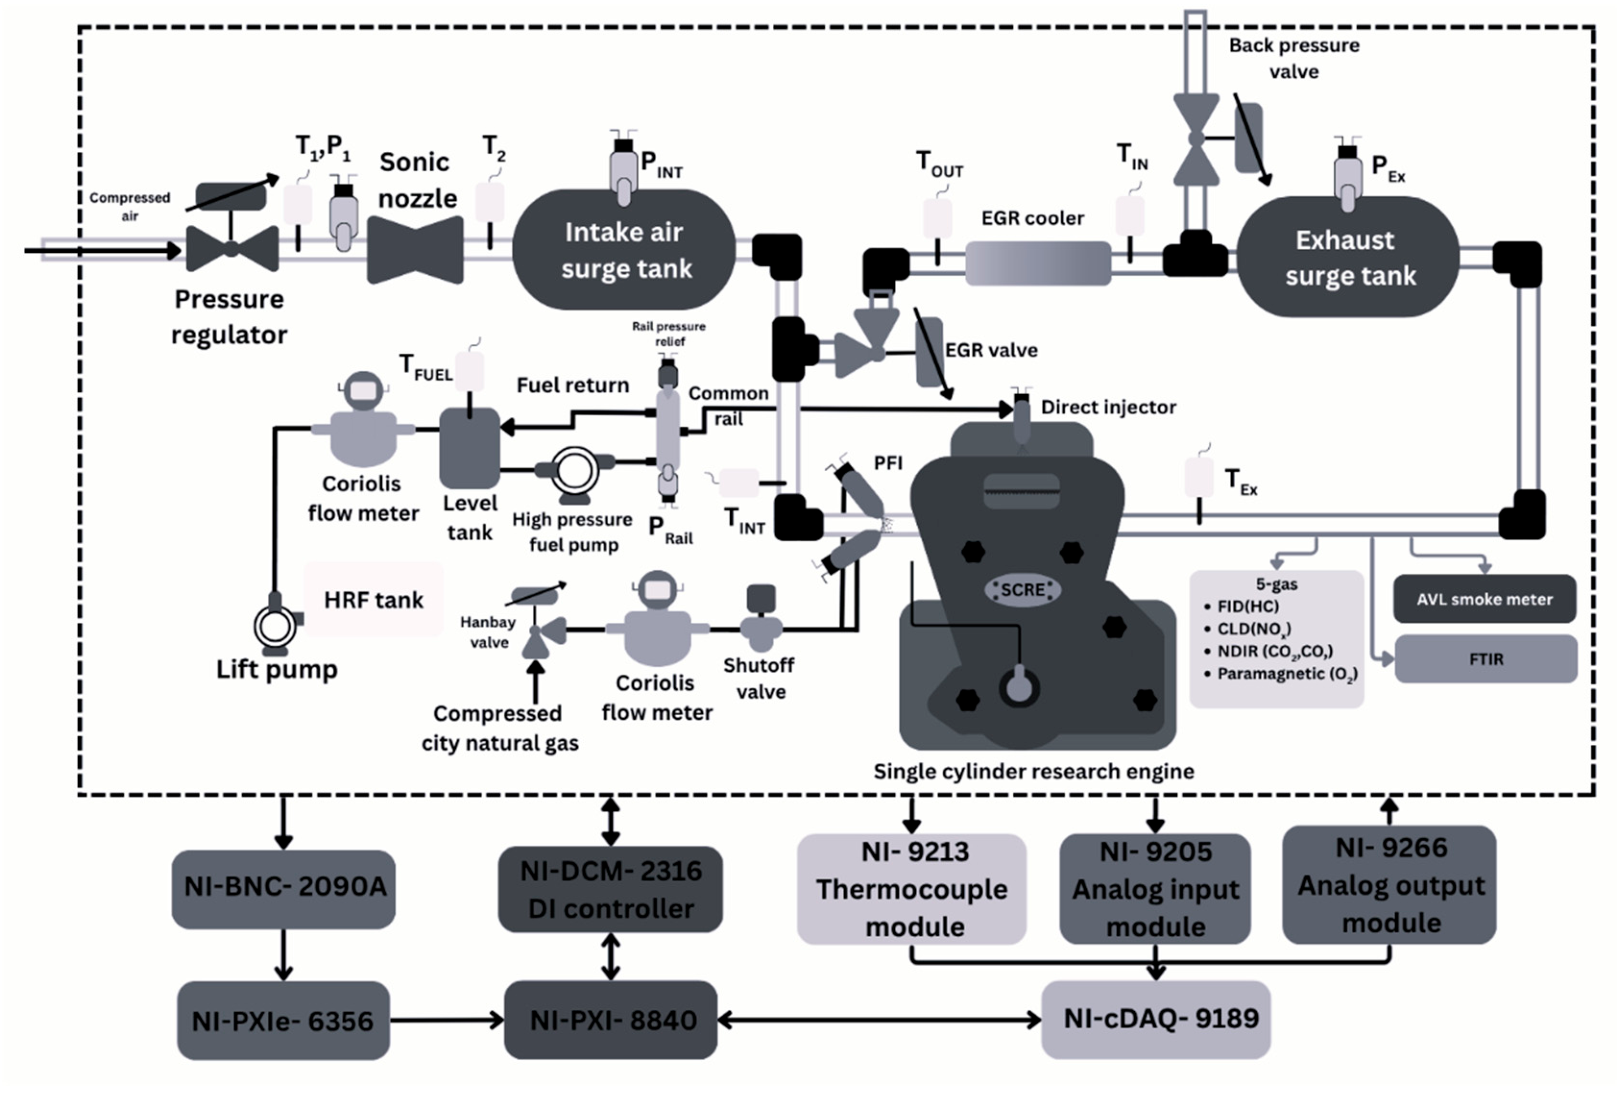
The experiments for this study were conducted on a single-cylinder research engine (SCRE) based on a PACCAR MX-11 multi-cylinder production engine. Table 1 shows the engine specifications, and Figure 1 shows the experimental schematic setup of the SCRE. The SCRE was coupled with a 393 HP AC dynamometer using a Joint Clutch and Gear drive shaft (Romulus, MI, USA), controlled by a Dyne Systems Inter-Loc V controller (Sussex, WI, USA) to maintain constant engine speed.
Table 1.
Engine specifications.
Figure 1.
Experimental setup.
The intake air circuit utilized compressed air to achieve intake pressures of up to 5 bar absolute. The intake air pressure was regulated using an electro-pneumatic pressure regulator (Proportion Air; Model: QB2X; McCordsville, IN, USA). The air flow rate was measured using a sonic nozzle (Flowmaxx; Model: SN16; Roanoke, TX, USA), and the pre-sonic pressure and temperature were used to calculate the air flow rate based on the calibration curve of the sonic nozzle.
A pressure transducer (Setra; Model: 206S; Boxborough, MA, USA) was used to measure the pre-sonic pressure. Both the intake and exhaust manifold dynamic pressures were measured using two water-cooled dynamic piezoresistive pressure transducers (Kistler; Model: 4624A; Amherst, NY, USA) coupled with amplifiers (Kistler; Model: 4049A; Amherst, NY, USA).
Both the LRF and pilot fuel had separate circuits. The LRF (natural gas) was fumigated into the intake manifold. A Coriolis mass flow meter (Micro-Motion; Model: CMFS010M319N0A2ECZZ; Louis, MO, USA) was used to measure the mass flow rate of the LRF. The flow was controlled using an electronic needle valve (Hanbay; Model: MCM-050AB; Virginia Beach, VA, USA) and a pressure regulator (Swagelok; Model: KLF1GJM415A; Birmingham, AL, USA). A solenoid-operated shutoff valve was installed to cut off the LRF supply in case of emergency. The pilot fuel was supplied by a low-pressure (Fuelab; Pontoon beach, IL, USA) lift pump, which was used to increase the pressure to 15 psig (204.7 kPa abs). The mass flow rate was measured using another Coriolis mass flow meter (same make/model as used for the LRF). All the fuel return lines after the flowmeter were routed through a level tank system (MAX; Model: 370-175-000; Healdsburg, CA, USA) to ensure accurate pilot fuel flow rate measurement. Subsequently, a high-pressure (Fuelab; Pontoon beach, IL, USA) lift pump increased the pressure to 60 psig (515 kPa abs), feeding the fuel through an inlet metering valve (Delphi; Model: DFP5; Auburn Hills, MI, USA) to a high-pressure fuel injection pump. The rail pressure was controlled using both the inlet metering valve and a pressure control valve (Delphi; Model: Kendrin 7919073; Auburn Hills, MI, USA) mounted on the common rail. The injection pressure was measured using a piezoresistive absolute pressure sensor (Kistler; Model: 4067E; Amherst, NY, USA), which was mounted on the injector supply line. It was not possible to instrument this specific injector with a needle lift sensor. Therefore, the injection current was measured using a current clamp (Pintek; Model: PA 500; Amherst, NY, USA) to record the commanded start of injection (SOI) and the commanded injection duration. All the pilot fuel system components, including the high-pressure pump, injector, and common rail, were commercial off-the-shelf components.
The coolant circuit used a 50–50% (v/v) ethylene glycol–water mixture as the coolant, which was circulated through the cylinder barrel and cylinder head using a centrifugal pump (Finish Thompson; Model: AC5STS1V420B015C22; Shelbyville, KY; USA). A heat exchanger, utilizing the building’s chilled water as the external coolant, was used to maintain the desired coolant temperature. The lubrication circuit utilized a gear pump (Shurflo; Model: GMCV3VA4T; Lincoln, NE, USA) to circulate SAE 15W-40 oil for lubricating the engine components.
The in-cylinder pressure was measured using a piezoelectric cylinder pressure sensor (Kistler; Model: 6124A; Amherst, NY, USA) coupled with a charge amplifier (Kistler; Model: 5018; Amherst, NY, USA). The crankshaft was coupled to an incremental shaft encoder (BEI; Model: XH25D-SS-3600-ABZC-28V/V-SM18; Attleboro, MA, USA) with a resolution of 0.1 CAD using a flexible coupling. The encoder was used to synchronize the high-speed data in real time and for acquiring the crank angle resolved data. All static pressure measurements were measured using pressure transducers (Omega; Model: PX119; Michigan City, IN, USA), and Type-K thermocouples (Omega; Model: KQ316SS-14G-6; Michigan City, IN, USA) were used to measure all temperatures in the experimental setup.
High-speed data signals were sampled at 360 kHz by a high-speed analog input module (National Instruments (NI); Model: 6356; Austin, TX, USA). The slow-speed pressure measurements and the flow measurements were sampled at 1 kHz using an analog input module (NI; Model: 9250), while all thermocouples were connected to a thermocouple module (NI; Model: 9213). The slow-speed modules were installed in a Compact-DAQ (NI; Model: 9189) data acquisition system. The coolant, oil, and air actuators were controlled using an analog output module (NI; Model: 9266), which was also installed in the Compact-DAQ system. All engine control variables were handled using an NI direct injector control and measurement device (NI; Model: DCM 2316). Vieletech Combustion Analysis Tool (VCAT v2019) software was utilized to interface with the data acquisition system and the DCM. A total of 1000 cycles of high-speed in-cylinder pressure data were acquired and the ensemble average was used to analyze the combustion characteristics using an in-house MATLAB R2025a postprocessing script.
The engine-out emissions were routed through a heated sample line attached to a Richmond five-gas emissions bench. The bench housed a chemiluminescence detector (CLD) analyzer to measure the NOx emissions, a nondispersive infrared (NDIR) analyzer to measure the CO2 and CO, a paramagnetic analyzer to measure the O2 emissions, and a heated flame ionization detector (FID) analyzer to measure the unburned hydrocarbons. An AVL 415S smoke meter (Plymouth, MI, USA) was used to measure the smoke emissions in filter smoke number (FSN) units. For the 80B20D-NG experiments, both the five-gas emissions bench and a Nicolet iS50 Fourier Transform InfraRed (FTIR) spectrometer (Madison, WI, USA) were used. The formaldehyde emissions were also measured for the 80B20D-NG with the FTIR.
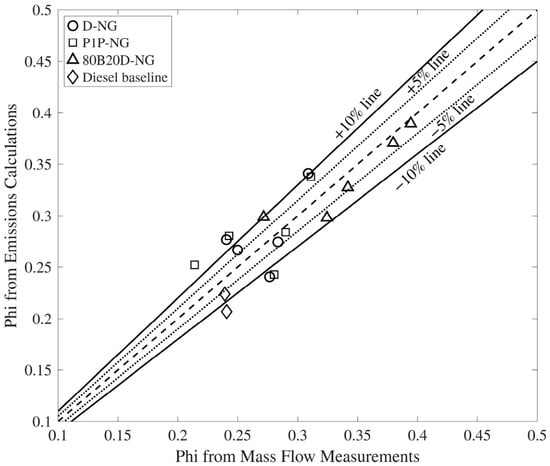
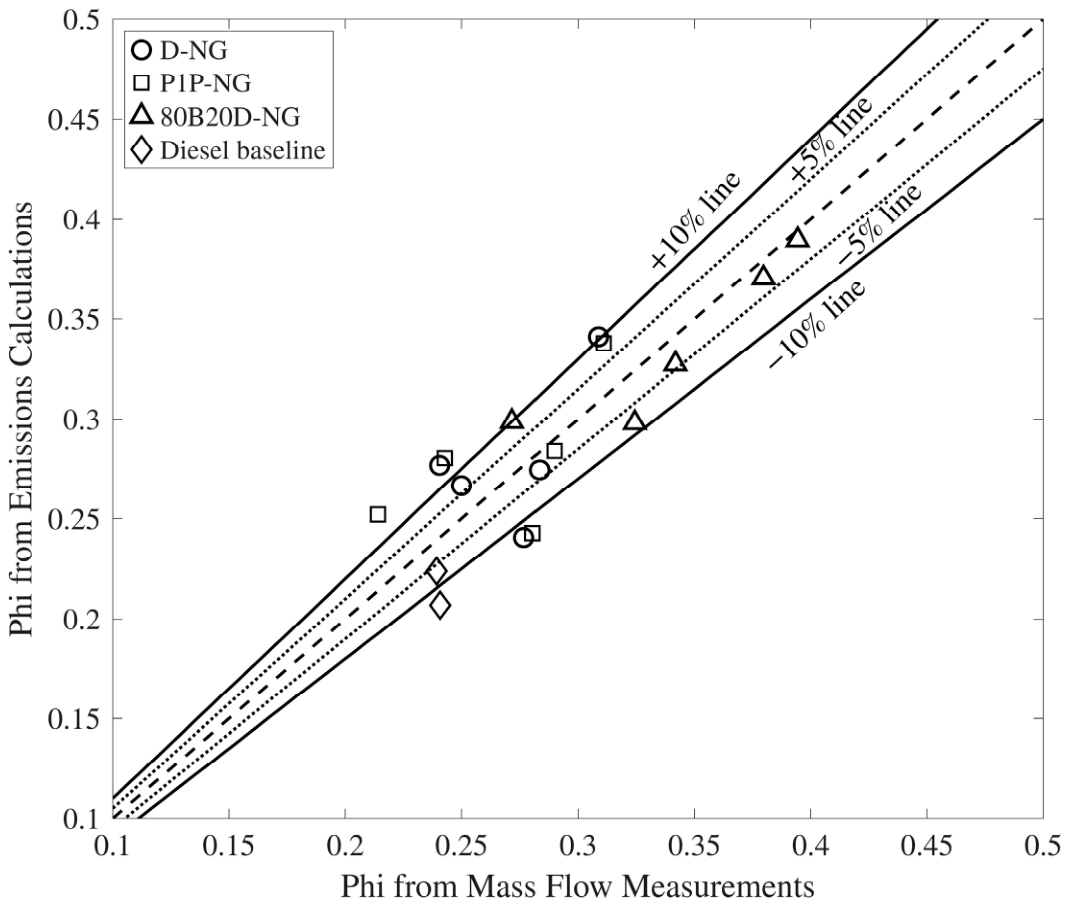
One aspect of data quality verification was comparing the exhaust-based and mass flow-based equivalence ratios for all three pilot fuel–NG combinations, as discussed in Ref. [25]. For all operating conditions presented in this paper, the exhaust-based equivalence ratios agreed with the mass flow-based equivalence ratios to within ±10%, with many points agreeing to within ±5%, as shown in Figure 2. Table 2 discusses the accuracy of the instruments used in the setup.
Figure 2.
Phi from emissions calculations vs phi from mass flow measurements.
Table 2.
Instrumentation details and measurement accuracies.
Fuel Properties
This study investigated three pilot fuels—diesel and two low-carbon fuels, propyl-terminated oxymethylene ether (OMEx), i.e., P1P, and an alcohol blend (80/20 v/v—n-butanol/diesel)—for ignition of natural gas as the LRF. Throughout this work, the 80/20 n-butanol/ diesel blend is referred to as 80B20D. These pilot fuels were selected so that one had a higher reactivity than diesel (P1P—CN~53), diesel represented the baseline (CN ~ 46), and one had a significantly lower reactivity than diesel (80B20D—CN ~ >12).
The general chemical structure of OMEx is R—O—(CH2O)n—R′, where n is the number of oxymethylene units. The absence of C-C bonds in each oxymethylene unit, combined with the presence of oxygen in the fuel structure, can significantly reduce soot emissions. The P1P fuel provides improved blending compatibility with diesel, a higher cetane number, and a greater oxygen content compared to diesel [26]. The chemical structure of P1P is C3H7—O—(CH2O)—C3H7.
Table 3 shows the properties of the fuels used in this experimental campaign. The cetane number of P1P is 13.2% higher compared to diesel, which indicates easier pilot fuel ignitability. The P1P and the 80B20D contain 24% and 14% oxygen, respectively, compared to the 0% oxygen in conventional diesel fuel. The lower heating values (LHVs) of 80B20D and P1P are 15% and 26% lower than diesel, respectively. Consequently, at similar IFCEs, larger quantities of these fuels are required to achieve the same engine load compared to diesel.
N-butanol has a cetane number of ~12 [27], which is about ~74% lower compared to diesel, indicating that it is much more difficult to auto-ignite. To enhance auto-ignition, 20% by volume of diesel was added. As a result, the cetane number likely increased to a new (unknown) value that was still much lower compared to that of pure diesel.
The reported density of diesel and 80B20D was measured using a Mettler Toledo DM45 Delta Range density meter.
Table 3.
Fuel properties.
4. Equations and Definitions
The apparent heat release rate (AHRR) was calculated using the first law of thermodynamics as outlined by Heywood [29], which is shown in Equation (1). The in-cylinder pressure data were used to calculate , while the engine geometry information was used to calculate the instantaneous volume (V) and the rate of change in volume . The in-cylinder bulk gas temperatures were calculated using the ideal gas equation of state. The species mole fractions were estimated using an in-house chemical equilibrium code. The specific enthalpies and internal energies of species were calculated with NASA polynomials as a function of temperature [30].
Equation (2) defines the percentage energy substitution (PES), which is used to quantify the energy provided by the LRF during dual-fuel operation. The equivalence ratio is defined in Equation (3), where is the stoichiometric air–fuel ratio needed to achieve complete combustion, and is the actual air–fuel ratio. With dual-fuel combustion, the SCRE is typically operated under lean conditions, ∅ < 1. Both the LRF and pilot fuel quantities are accounted for in the and calculations.
The IFCE and combustion efficiency (CE) are calculated using Equations (4) and (5), as described by Heywood [29]. The IFCE is defined as the ratio of the gross indicated work output (i.e., ) to the total energy input from both the LRF and the pilot fuel. The CE is determined using the composition of unburned species (H2, CO, HC) in the exhaust. The mass fraction (xi) of each exhaust species and their respective LHVs are used to calculate the ratio of the energy lost in the exhaust to the total input fuel energy. The LHV values of H2, CO, and HC (mostly unburned CH4) were set at 120 MJ/kg, 10.1 MJ/kg, and 50 MJ/kg, respectively, as suggested by Heywood [29].
The indicated specific (IS) emissions for CO, NOx, and HC were calculated using Equation (6) as the ratio of the mass flow rate of exhaust species () to the indicated power ().
5. Results
In this section, the performance and emissions results for NG dual-fuel combustion with different pilot fuels and identical operating conditions are first presented. The PES was then varied to achieve a constant combustion phasing (CA50), enabling a levelized comparison across the different pilot fuels to assess their impact on NG dual-fuel combustion. For all these experiments, the engine speed was fixed at 1339 rev/min (B-speed of the engine) and the load was maintained at 5 bar IMEPg. For all dual-fuel operating conditions presented in this paper, the engine-out smoke emissions were below 0.1 FSN and no special trends were noticed at such low values; consequently, the results for the smoke emissions are not presented separately.
5.1. Impact of Different Pilot Fuels Under Identical Operating Conditions
This section discusses the effect of different pilot fuels on the combustion characteristics, performance, and emissions under identical operating conditions of 30 bTDC SOI, 80% PES, 500 bar rail pressure, and 1.5 bar boost pressure. In addition, diesel baseline operating conditions of 500 bar rail pressure, 1.5 bar boost pressure, and 10 bTDC SOI are also presented for comparison, as shown in Table 4. In this work, the commanded SOI is referred to as SOI, except for the ignition delay calculation, which will be discussed in a later part.
Table 4.
Identical operating conditions for different pilot fuels.
The operating point mentioned in Table 4 for NG dual-fuel combustion was selected based on the earliest possible SOI achievable with 80B20D-NG. Because the pilot fuel reactivity was lowest for 80B20D-NG, advancing the SOI beyond 30 bTDC increased the combustion instability and decreased the IFCE. Therefore, 30 bTDC was selected as the ideal SOI for directly comparing these fuels to investigate the impact of the pilot fuels on NG dual-fuel combustion.
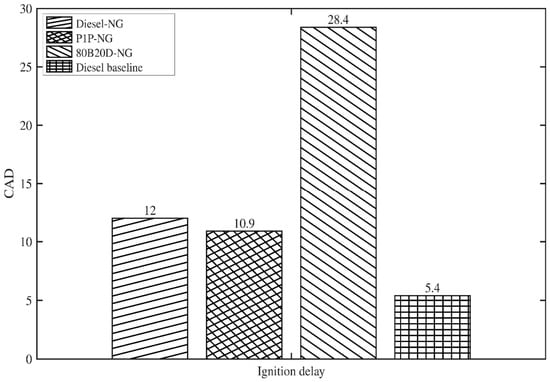
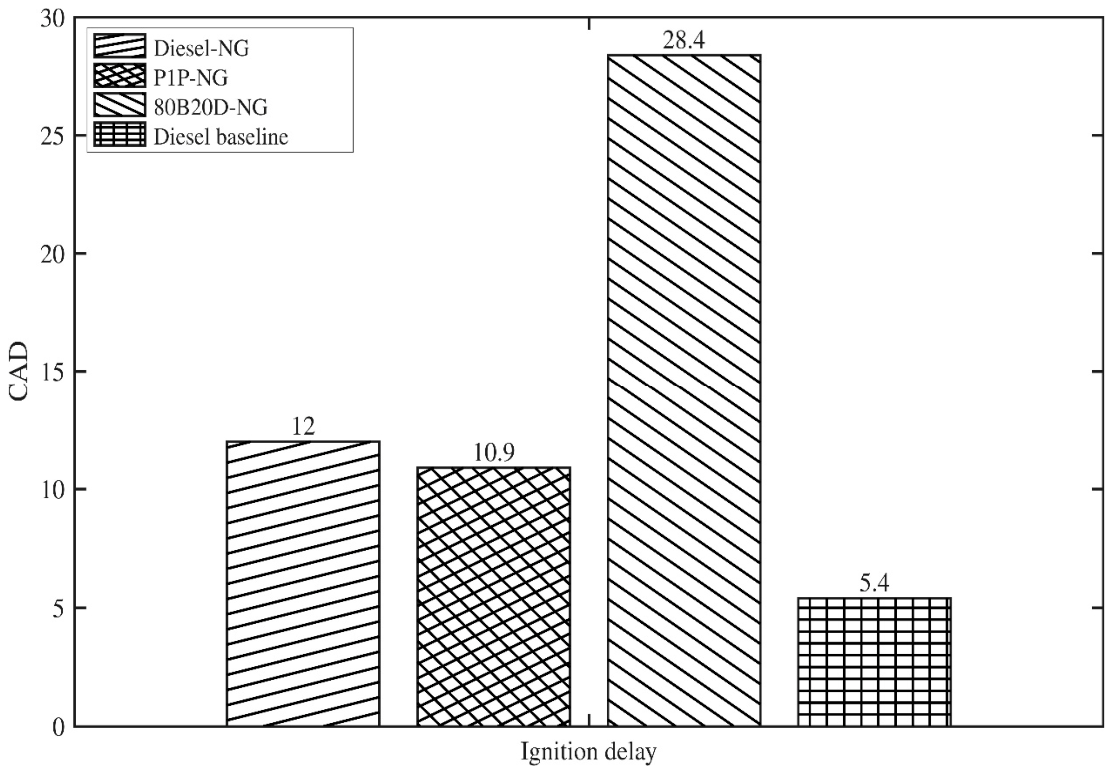
Figure 3 shows the ignition delay trend obtained with the different pilot fuels. The cetane number for P1P (~53) is slightly higher than diesel (~46), while 80B20D has the lowest cetane number (>12, but much lower than 46) among the three pilot fuels. In this regard, it is acknowledged that the reactivity of the 80B20D blend is only partially inferred since the blend’s actual cetane number was not measured. In Figure 3, the ignition delay is calculated as the difference between the actual start of injection (apparent from the CAD, at which the measured average injection pressure decreases) and the CAD corresponding to a 5% cumulative heat release (CA5). It is evident that P1P-NG has the shortest ignition delay at 10.9 CAD, followed by diesel–NG at 12 CAD. Finally, 80B20D-NG shows a much longer ignition delay of ~28 CAD. It is important to note that a longer ignition delay improves the mixing process, which in turn affects the AHRR profile, the start of combustion (CA5), and the combustion phasing (CA50) of these different pilot fuels.
Figure 3.
Ignition delay comparison: SOI = 30 bTDC; Pin = 1.5 bar; PES = 80%; PRail = 500 bar.
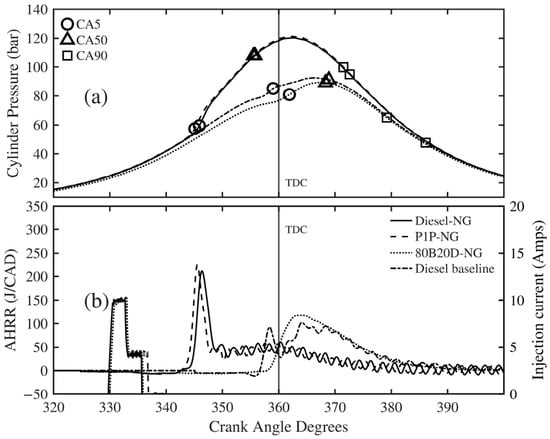
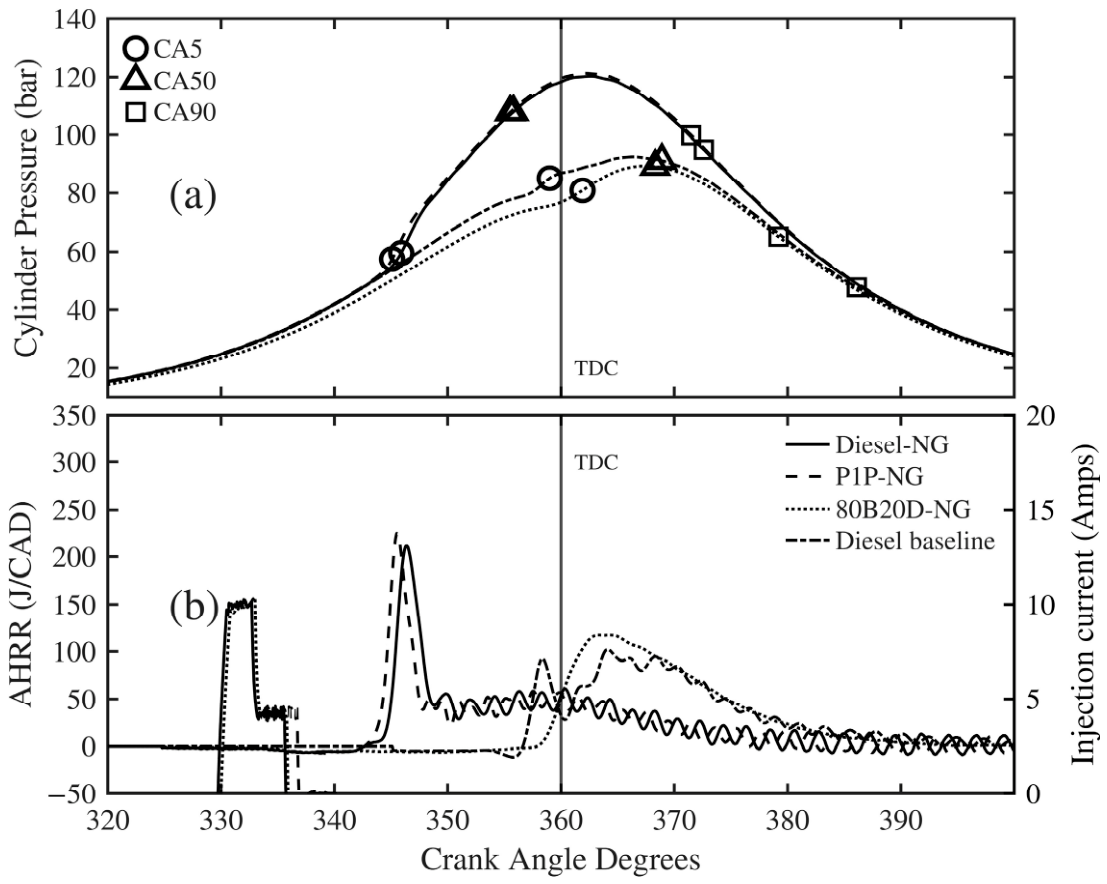
The cylinder pressure histories are shown in Figure 4a. Diesel–NG and P1P-NG exhibit nearly identical pressure traces, with peak pressures of ~120 bar. The CA90 is advanced by about ~1 CAD for P1P-NG due to its slightly faster burn rate. In contrast, 80B20D-NG exhibits a significantly different pressure history with a lower peak pressure and more retarded CA5 and CA50 due to the longer ignition delay. The AHRR profile is also significantly different for 80B20D-NG combustion compared to diesel–NG and P1P-NG combustion, as highlighted in Figure 4b. For reference, Figure 4b also shows the AHRR for diesel baseline operation.
Figure 4.
(a) Cylinder pressure and (b) AHRR comparison: SOI = 30 bTDC; Pin = 1.5 bar; PES = 80%; PRail = 500 bar.
In RCCI dual-fuel combustion, the transformation of the AHRR profile with varying SOI is a well-studied phenomenon [16,17,31,32]. As discussed by Partridge et al. [33,34], the AHRR transformation from a two-stage profile to a smooth, single-stage “Gaussian” profile as SOI is advanced is primarily dictated by fuel stratification rather than in-cylinder temperature and pressure at SOI. This AHRR transformation is significant because, as the AHRR transforms from a two-stage to a single-stage profile, a steep reduction in the engine-out NOx emissions has been observed in all of the aforementioned studies.
In the present context, the AHRR transformation occurs over a more advanced SOI window (30–40 bTDC) for diesel–NG and P1P-NG combustion, with 30 bTDC SOI exhibiting a two-stage AHRR profile and 40 bTDC SOI characterized by a single-stage Gaussian AHRR profile. However, for 80B20D-NG, the single-stage AHRR profile is observed even at 30 bTDC SOI. These trends highlight that as the pilot fuel reactivity decreases, the AHRR transformation occurs at a more retarded SOI due to the longer ignition delay and more homogeneous mixture conditions (less pilot fuel stratification) at ignition.
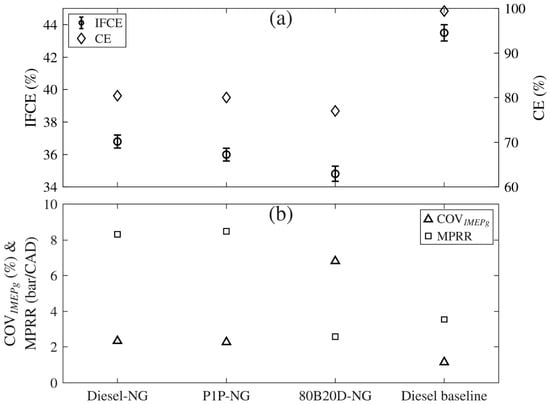
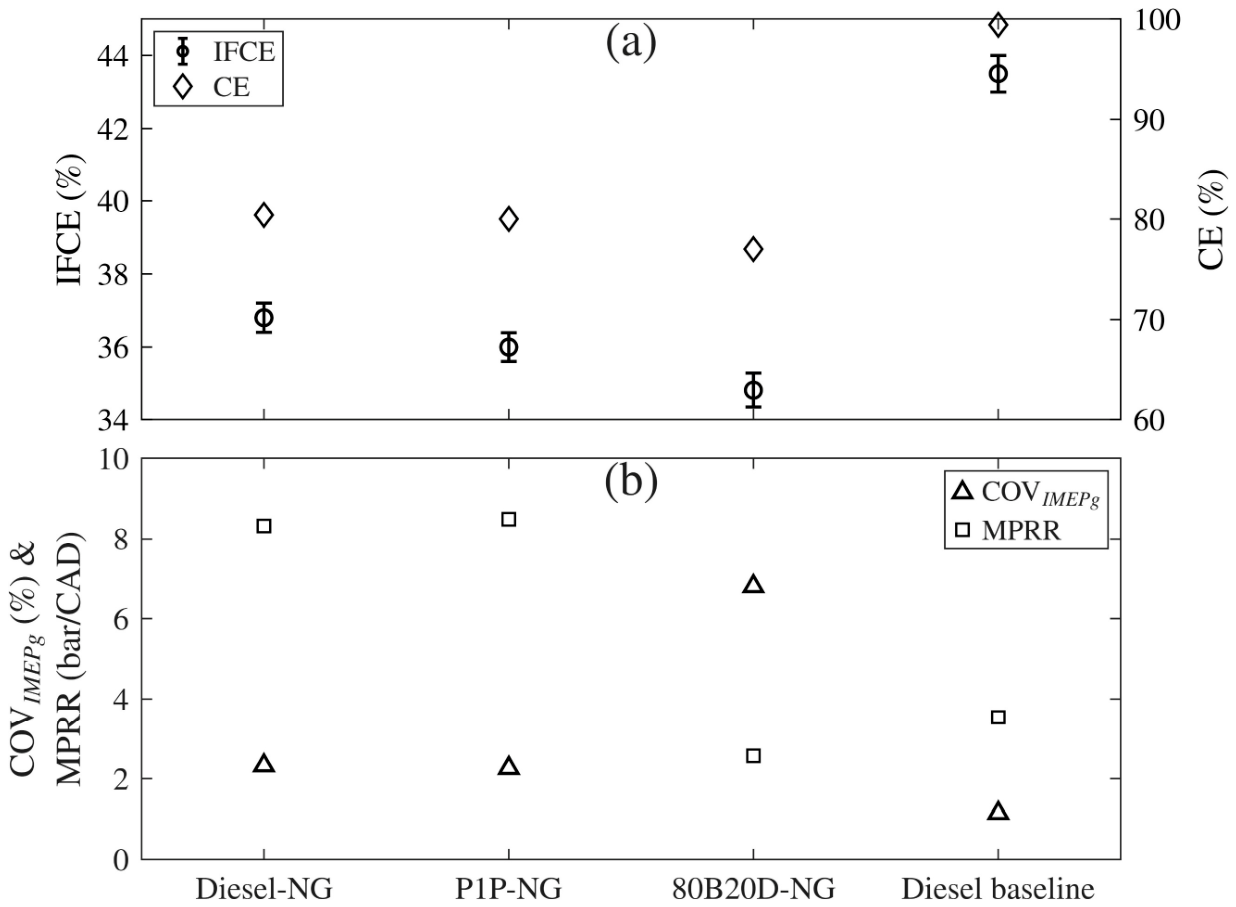
The indicated fuel conversion efficiency (IFCE) and combustion efficiency (CE) trends for the different pilot fuels at similar operating conditions are shown in Figure 5a. An uncertainty propagation analysis was performed for the IFCE calculation, and the resulting error bars are included in the figure. The methodology used for the uncertainty analysis is presented in Appendix A. The uncertainty analysis focused on the IFCE because the phi vs phi comparison validates the data quality for CE. The baseline diesel values are also shown for reference. While the IFCE and CE are similar for diesel–NG and P1P-NG at ~36% and ~80%, respectively, they are lower for 80B20D-NG. The 80B20D-NG exhibits lower efficiencies due to its longer ignition delay and late combustion phasing (CA50 ~ 8 CAD after TDC), as evident from Figure 4a. For diesel–NG and P1P-NG combustion, almost 65% of heat release already occurred before TDC, resulting in a higher IFCE and CE. Compared to NG DFC, the key challenge with NG DFC is high HC and CO emissions resulting in a significant drop in both the IFCE and CE.
Figure 5.
(a) IFCE and CE comparison and (b) MPRR and COVIMEPG: SOI = 30 bTDC; Pin = 1.5 bar; PES = 80%; PRail = 500 bar.
The maximum pressure rise rate (MPRR) and coefficient of variation of IMEPg (COVIMEPg) trends are shown in Figure 5b. The COVIMEPg for diesel–NG and P1P-NG was ~2%, whereas 80B20D-NG was much more unstable, with a COVIMEPg of 6.8%. At the same PES, because of the lower reactivity of 80B20D-NG, it did not ignite NG as consistently compared to the other two pilot fuels with higher reactivities. Therefore, 80B20D-NG operation was more unstable compared to the other two pilot fuels.
On the other hand, compared to diesel–NG and P1P-NG, 80B20D-NG exhibited a 5–6 times lower MPRR under these conditions. Again, this was due to the reduction in fuel stratification, which resulted in more homogeneous combustion and a smoother AHRR, and thus a lower MPRR. The P1P-NG combustion exhibited the highest MPRR due to its sharp AHRR with a higher first peak.
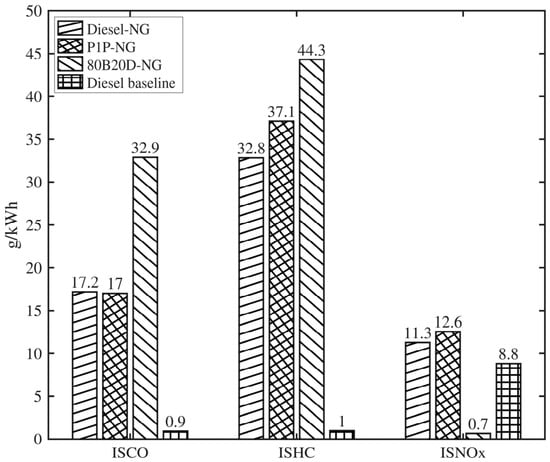
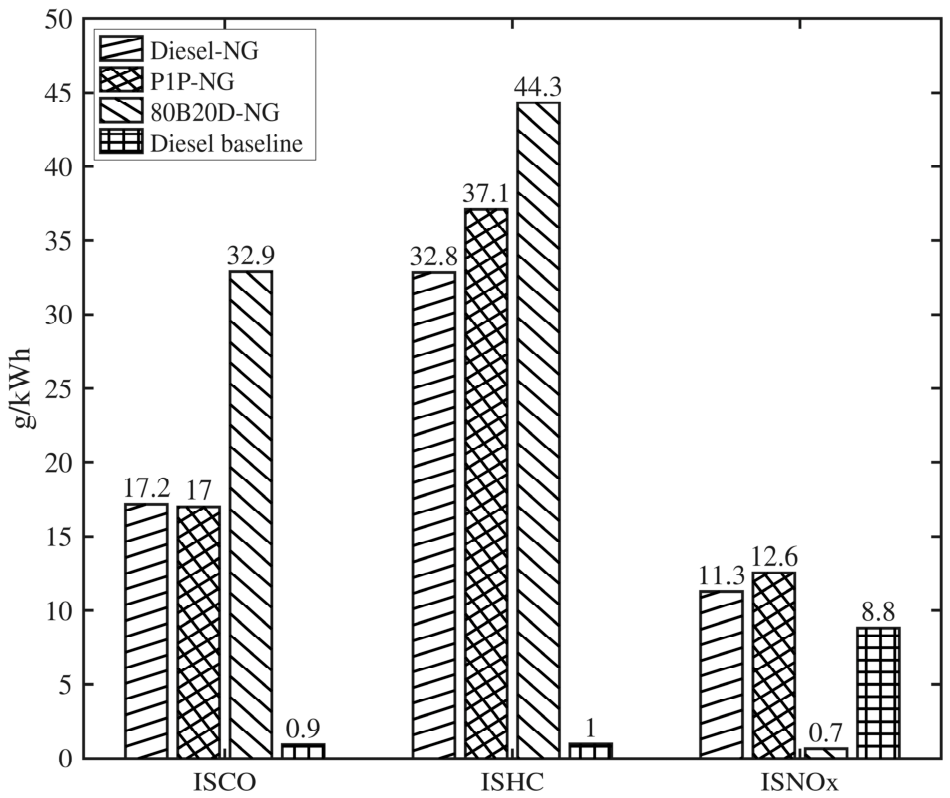
The indicated emissions for the different pilot fuels are shown in Figure 6. The ISHC emissions also increased from diesel–NG to P1P-NG, with the highest ISHC (~44 g/kWh) obtained with 80B20D-NG. Due to its longer combustion duration and higher bulk gas temperatures, the ISHC was reduced for diesel–NG. The ISHC for P1P-NG was slightly higher because, despite its earlier CA5, its shorter combustion duration increased its ISHC. Finally, the ISHC emissions of 80B20D-NG were the highest due to the delayed CA50 and the most unstable operation (i.e., higher COVIMEPg).
Figure 6.
ISCO, ISHC, and ISNOx comparison: SOI = 30 bTDC; Pin = 1.5 bar; PES = 80%; PRail = 500 bar.
The ISNOx emissions showed starkly different trends, due to the fact that the combustion process was more homogeneous with a single-stage Gaussian AHRR profile for 80B20D-NG, whereas it was more stratified with a two-stage AHRR profile for diesel–NG and P1P-NG for an SOI of 30 bTDC. While the ISNOx emissions were the lowest for 80B20D-NG (~0.7 g/kWh), they were an order of magnitude higher (~11–13 g/kWh) for P1P-NG and diesel–NG. For 80B20D-NG, the longer ignition delay, enhanced mixing, and more homogeneous combustion reduced local temperatures, thereby reducing the ISNOx emissions.
Several studies have indicated that in DFC, formaldehyde (HCHO) emissions are observed at ~100 ppm with diesel–NG and over 300 ppm with diesel–propane, particularly when the combustion phasing is retarded [35,36]. While formaldehyde emissions are considered carcinogenic [37], unlike other hazardous pollutants they are not yet regulated. Additionally, HCHO is one among many aldehydes that can cause photochemical smog [38].
In this study, FTIR was used to measure the engine-out HCHO for 80B20D-NG. The concentration at this operating condition for 80B20D-NG was ~157 ppm. The PES of NG was 80%, meaning only 20% of the energy came from 80B20D. The primary reason for this high HCHO was mainly due to the partial oxidation of methane in the NG. Methane oxidation starts with H-atom abstraction, and HCHO is formed as an intermediate species in the initial stages of methane oxidation before it oxidizes into CO [39,40,41]. Typically, if sufficiently high in-cylinder temperatures are eventually attained during combustion, most (if not all) of the HCHO formed during initial methane oxidation is eventually oxidized well before the combustion products are exhausted. However, if high in-cylinder temperatures are not uniformly attained in all regions within the combustion chamber, some HCHO initially formed during the partial oxidation of methane is eventually emitted with the engine exhaust. It is important to emphasize that 80B20D-NG is not uniquely problematic in terms of HCHO emissions, and that it is possible that diesel–NG and P1P-NG may also have similar HCHO emissions levels; unfortunately, FTIR was not available for HCHO measurements for diesel–NG and P1P-NG, thus preventing a direct cross comparison across all pilot fuels in this study.
5.2. Levelized Comparison with Constant CA50 for Different Pilot Fuels
In the first part of this study, the SOI timing of all pilot fuels was fixed and all the operating parameters, including the PES, rail pressure, intake pressure and temperature, and exhaust pressure, were maintained the same while the engine operated at a constant speed of 1339 rev/min and a constant load of 5 bar IMEPg. Due to the differing reactivities of the pilot fuels, the ignition and combustion behaviors were different; particularly for the 80B20D pilot, which exhibited AHRR schedules similar to those of conventional neat diesel combustion. Moreover, the CA50 (midpoint of combustion) was different for each fuel combination, which resulted in each combination having different IFCEs (ranging from 34.8% to 37%); however, the combustion efficiency did not vary much across the different fuel combinations (approx. 80%). It is instructive to note that the combustion efficiency and IFCE for neat diesel combustion were 99% and 43.5%, respectively. The low IFCEs for the different pilot fuel combinations were attributed to suboptimal combustion phasing (CA50). For instance, for diesel–NG and P1P-NG combustion, the CA50 occurred around 355 CAD, which likely resulted in significant heat transfer losses, thereby compromising thermodynamic efficiency.
The second part of this study, discussed in this section, was designed to investigate if there was a way to achieve the same IFCE across the fuel combinations. This was achieved by targeting the nominal combustion phasing (CA50) at 363 ± 1 CAD across the different fuel combinations, in line with the recommendations made by Caton [42] to maximize thermodynamic efficiency. By doing so, we effected a levelized comparison (at least in terms of IFCE) across the different pilot fuel combinations.
To achieve the desired CA50 range, the PES, rail pressure, and SOI were varied. For 80B20D-NG, the PES was reduced to 60% to advance the CA50 to fall within a ~ 363 ± 1 CAD window. For diesel–NG, the PES was reduced to 70%. The rail pressure was maintained at 500 bar for diesel–NG and P1P-NG. For 80B20D-NG, the rail pressure was increased to 1000 bar because reducing the PES to maintain the CA50 within the target window of ~363 ± 1 CAD resulted in increased NOx emissions. Therefore, instead of relying solely on PES to achieve the desired CA50, the rail pressure was utilized as an additional control parameter to attain the target combustion phasing while helping offset the associated NOx penalty. The boost pressure was fixed at 1.5 bar for all fuel combinations, as summarized in Table 5. For the diesel baseline, the rail pressure was increased to 1200 bar with an injection timing of 10 bTDC to achieve CA50 of ~363 ± 1 CAD. Among other parameters, the PES and SOI were the primary variables used to achieve the desired CA50.
Table 5.
Constant CA50 operating conditions for different pilot fuels.
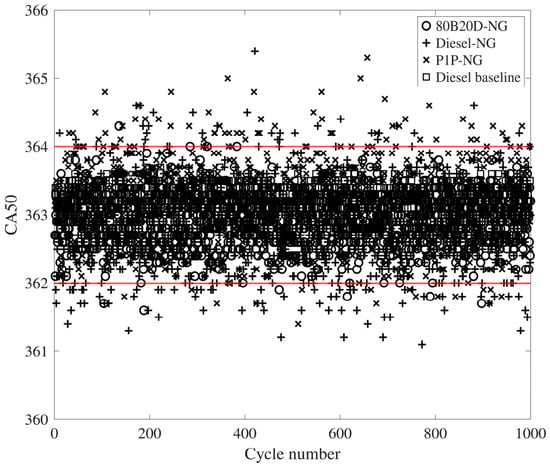
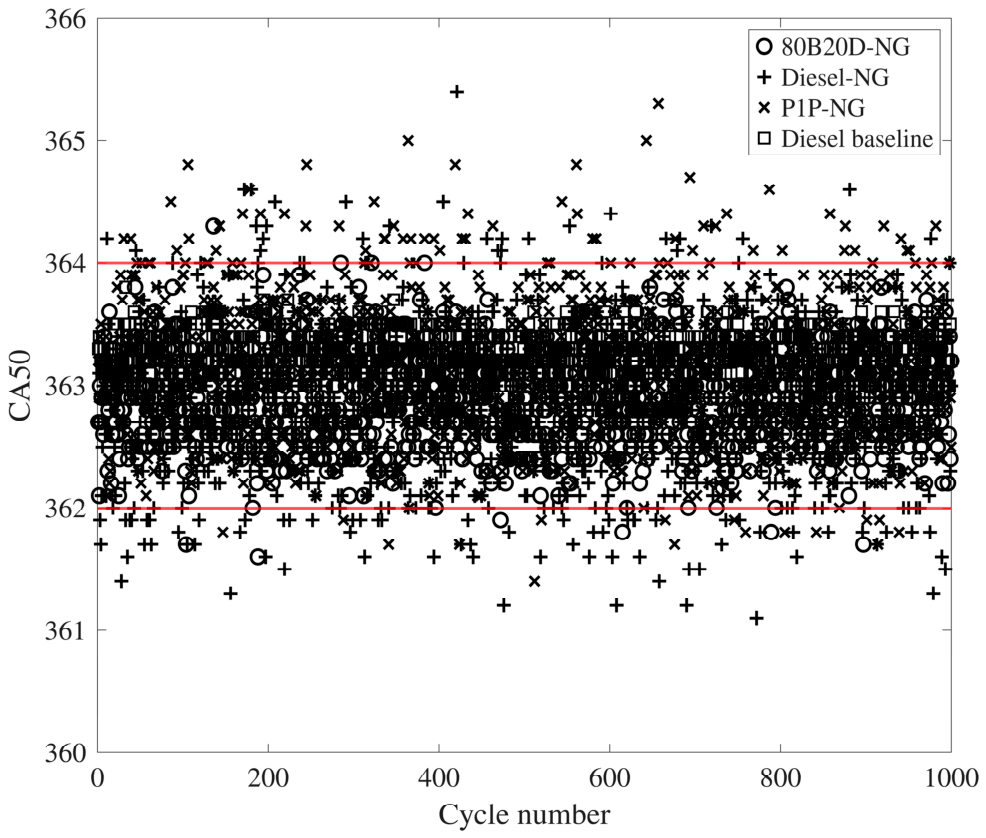
The cycle-to-cycle variations in the CA50 were also analyzed for all the pilot fuel combinations. Figure 7 shows the CA50 spread over 1000 cycles for each pilot fuel–NG combination. Diesel–NG and P1P-NG exhibited slightly higher CA50 variability, with ~11% and ~18% of the 1000 cycles falling outside the desired 363 ± 1 CAD window, respectively, compared to 80B20D-NG and neat diesel, for which less than 1% cycles fell outside the window.
Figure 7.
Cyclic CA50 distributions for different pilot fuels for constant CA50 NG RCCI combustion.
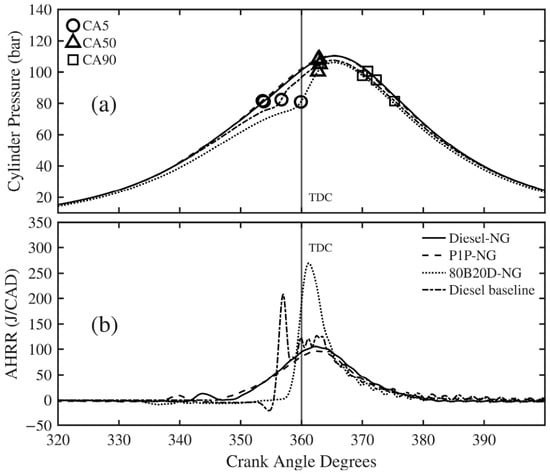
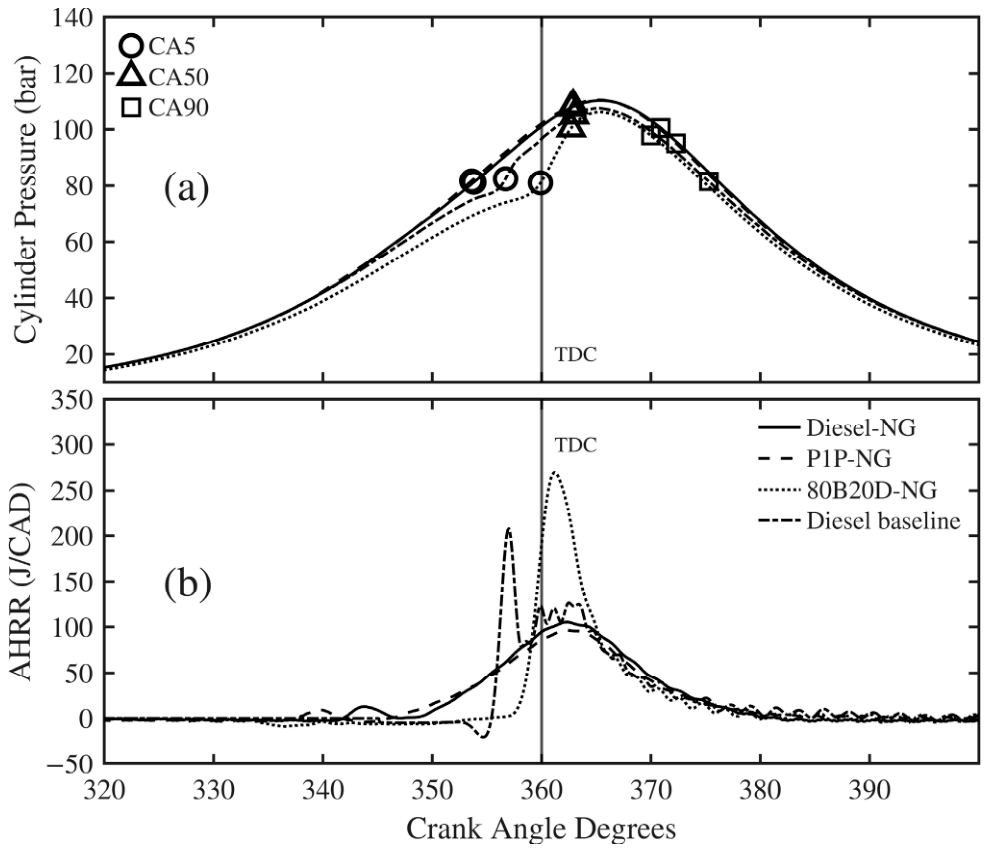
The ensemble-averaged cylinder pressure traces and AHRR profiles for the different pilot fuel–NG combinations are shown in Figure 8a and Figure 8b, respectively. The diesel–NG and P1P-NG exhibited nearly identical pressure traces, with a peak cylinder pressure of 100 bar. The 80B20D-NG showed a longer ignition delay compared to the other pilot fuels; however, the peak cylinder pressure remained similar to that of neat diesel and P1P-NG. The ensemble-averaged CA50 was nearly identical for all the fuels, as shown in Figure 8a. Additionally, the combustion duration of 80B20D-NG was lower compared to the other fuel combinations due to its faster burn rate.
Figure 8.
(a) Cylinder pressure and (b) AHRR comparison: SOI = 50, 30 bTDC; Pin = 1.5 bar; PES = 80, 70, 60%; PRail = 500, 1000 bar.
The AHRR profiles are shown in Figure 8b. All pilot fuel–NG combinations exhibited smooth single-stage Gaussian profiles after advancing the SOI to achieve the same nominal CA50. The peak AHRR for 80B20D-NG combustion was significantly greater compared to diesel–NG and P1P-NG, which can be attributed to the lower PES. Both diesel–NG and P1P-NG showed low-temperature heat release (LTHR) and similar AHRR profiles. In contrast, 80B20D-NG did not show any LTHR despite the single-stage Gaussian AHRR profile, possibly due to the fact that the low-temperature oxidation kinetics of n-butanol do not support ketohydroperoxide radical formation [43], a key marker in LTHR reactions.
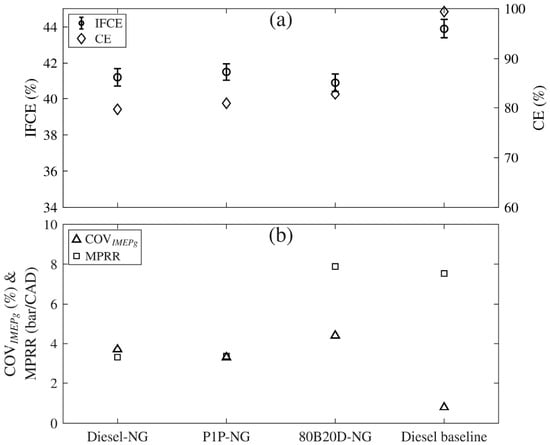
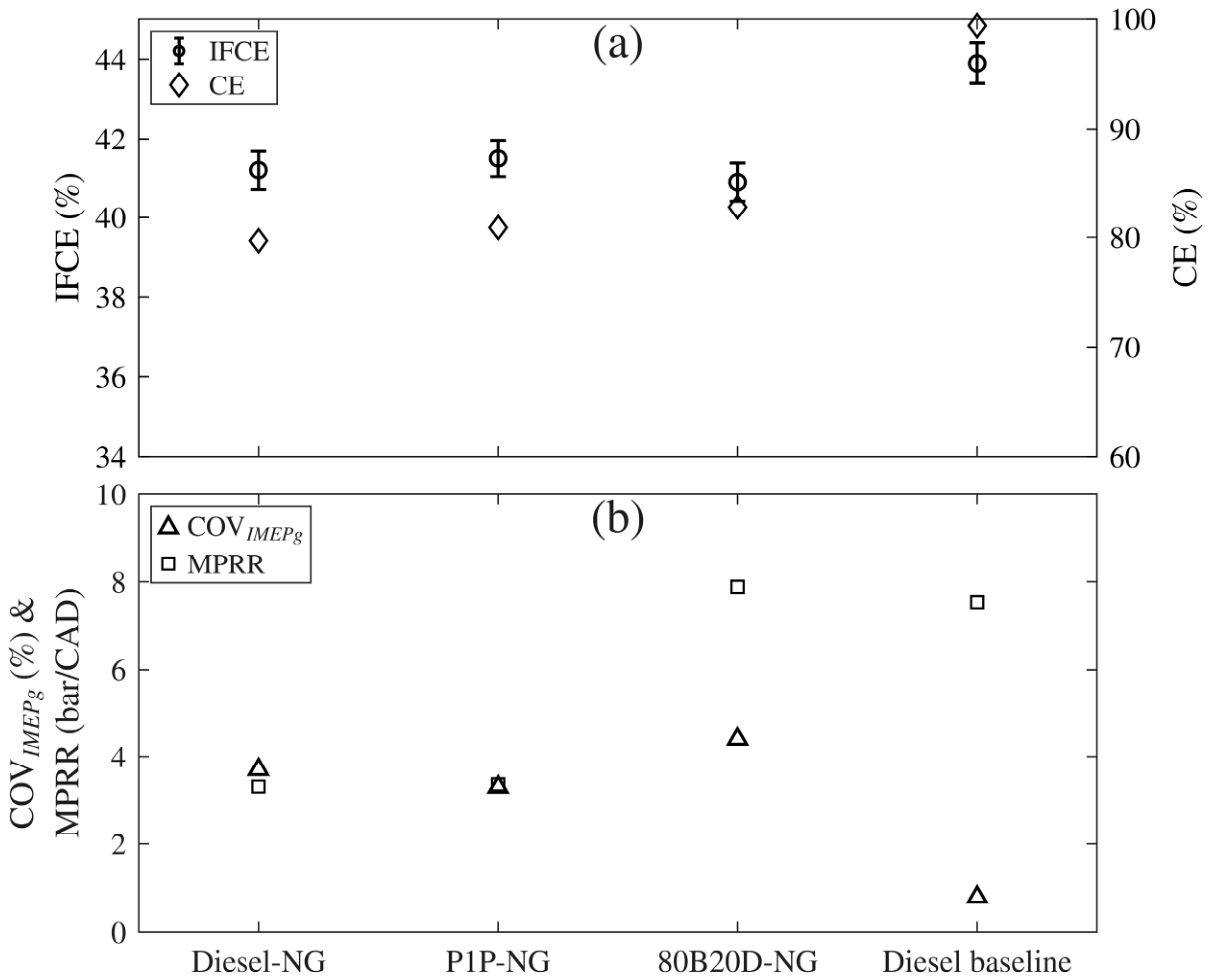
The IFCE and CE trends are shown in Figure 9a. It is evident that when a similar CA50 was ensured slightly after TDC (363 ± 1 CAD), the IFCE values increased significantly (by ~5 percentage points) for all the pilot fuels compared to the previous section and approached the diesel baseline value; however, the CE remained almost similar to that in the previous section. This interesting observation is discussed further in Figure 10a.
Figure 9.
(a) IFCE and CE comparison and (b) MPRR and COVIMEPG: SOI = 50, 30 bTDC; Pin = 1.5 bar; PES = 80, 70, 60%; PRail = 500, 1000 bar.
Figure 10.
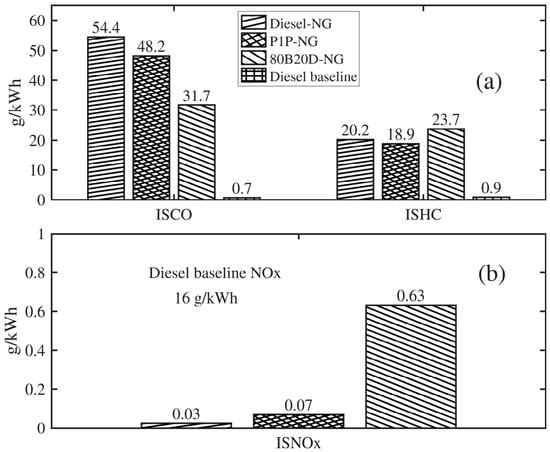
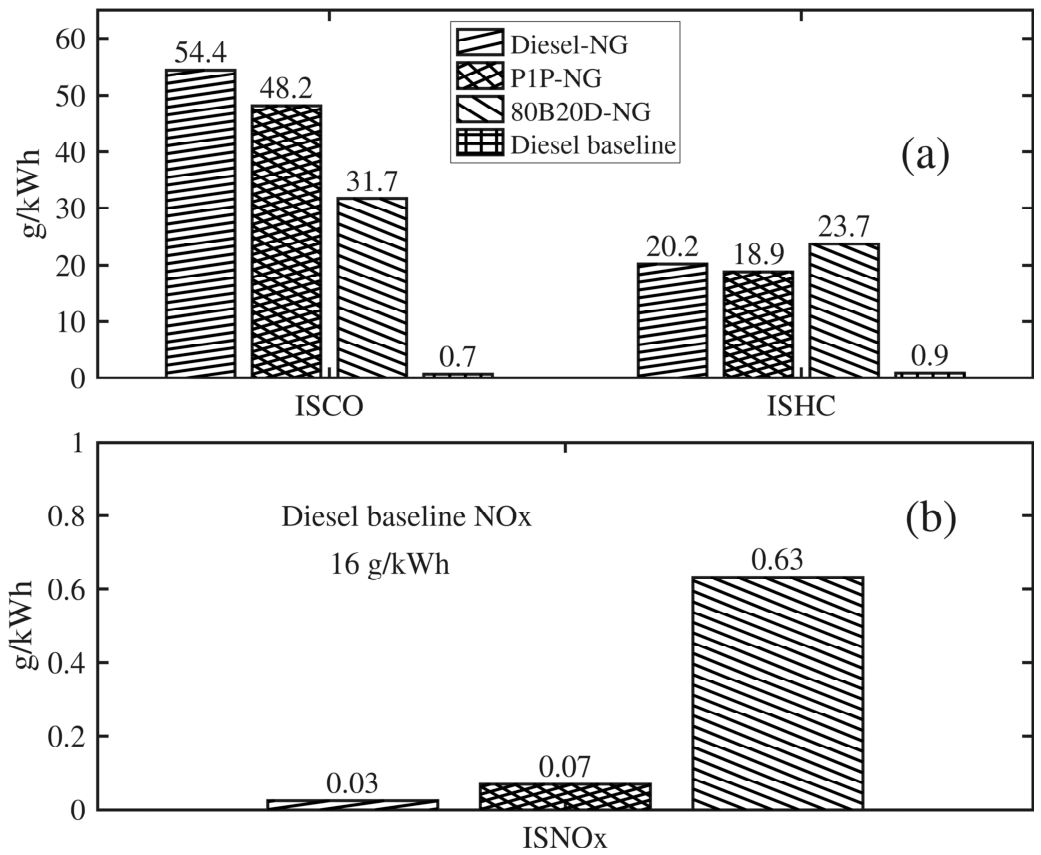
(a) ISCO and ISHC comparison and (b) ISNOx comparison: SOI = 50, 30 bTDC; Pin = 1.5 bar; PES = 80, 70, 60%; PRail = 500, 1000 bar.
The engine instability and MPRR results, shown in Figure 9b, for the constant CA50 operating conditions indicate a nearly similar COVIMEPg of ~3–4% and MPRR between 3 and 8 bar/CAD (much lower than the self-imposed limit of 15 bar/CAD for this engine). Thus, engine operation was relatively stable and smooth for these operating conditions.
The emissions trends for ISCO and ISHC are shown in Figure 10a, and those for ISNOx in Figure 10b. Because CA50 was phased slightly after TDC (363 ± 1 CAD), the ISHC emissions decreased significantly compared to the results shown in Figure 6, i.e., by ~38%, 47%, and 49% for diesel–NG, 80B20D-NG, and P1P-NG, respectively. However, the ISCO emissions increased by 65% and 64% for diesel–NG and P1P-NG, respectively, whereas the ISCO emissions for 80B20D-NG decreased by ~2%. The increase in ISCO emissions for diesel–NG and P1P-NG is attributed to partial oxidation of HC to CO, with subsequent CO oxidation to CO2 impeded significantly due to the lower in-cylinder bulk gas temperatures later in the cycle. On the other hand, the ISHC emissions were reduced for all fuel combinations due to proper combustion phasing and reduced PES.
Due to the counterbalancing effects of CO and HC emissions, the combustion efficiency was largely unaltered. This points to an interesting observation that if the combustion is phased optimally, as in the current study, it is possible to increase the thermodynamic efficiency with little impact on the combustion efficiency. This also means that any further increase in thermodynamic efficiencies beyond these levels to approach diesel-like efficiencies could likely be achieved by improving the combustion efficiency.
Again, for all pilot fuel combinations, including diesel–NG, P1P-NG, and 80B20D-NG, the engine-out NOx emissions were well below 1 g/kWh, with slightly higher values for 80B20D-NG. This was because the SOI was retarded and the PES was decreased to keep the same CA50 for 80B20D-NG RCCI combustion. The increased pilot quantity from the decreased PES and reduced time to mix with the surrounding NG–air mixture due to the relatively retarded SOI resulted in reduced stratification of the pilot. Due to this, ignition and combustion were likely to have occurred at close-to-stoichiometric conditions locally, leading to higher local temperatures, which manifested as increased NOx emissions.
6. Conclusions and Future Work
In this work, the impacts of three different pilot fuels spanning a wide reactivity range (CN ~ 12–54), including two low-carbon fuels (dipropyl oxymethylene ether (P1P) and an 80%/20% v/v blend of n-butanol and diesel (80B20D)), on natural gas (NG) RCCI combustion were characterized at a fixed speed (1339 rev/min) and a fixed load (5 bar IMEPg) on a single-cylinder research engine based on a production PACCAR MX-11 engine platform. Detailed experiments were performed to compare performance, combustion, and emissions, first under identical operating conditions, and later at nearly constant combustion phasing (CA50) to effect a levelized comparison. With the caveat that the results were obtained for a specific set of operating conditions, including a fixed low load and a fixed speed, the major conclusions of this study are as follows:
- For identical operating conditions, the least-reactive pilot fuel (80B20D) led to late combustion phasing, a single-stage Gaussian AHRR profile, and low ISNOx with high ISHC and ISCO emissions compared to a two-stage AHRR profile, high ISNOx, and low ISHC and ISCO for the other pilot fuels.
- The CA50 had a significant impact on the indicated fuel conversion efficiency and ISHC emissions. Regardless of pilot fuel type, at a constant low load of 5 bar IMEPg it was possible to obtain uniformly high IFCEs (>40%) with NG dual-fuel combustion with the CA50 phased slightly after TDC (~363 CAD).
- At a fixed optimal CA50 of 363 ± 1 CAD for all three pilot fuels, the emissions tradeoff was between a higher ISCO and lower ISNOx for diesel–NG and P1P-NG on the one hand and a higher ISNOx and lower ISCO for 80B20D-NG on the other.
- Overall, similarly high IFCEs (~40%) and ~38-49% lower ISHC emissions were obtained for all pilot fuels with the more optimal CA50 compared to the identical (unoptimized) operating conditions.
- As the SOI was advanced, the AHRR transformation (from a two-stage to a single-stage Gaussian-like profile) occurred at a more retarded SOI for 80B20D-NG (30 bTDC) compared to diesel–NG and P1P-NG (40 bTDC).
The following areas are recommended for future work as a continuation of the present study:
- Implement a closed-loop cyclic CA50 control strategy over a range of engine loads and speeds to precisely adjust the CA50 window and identify the operating conditions that yield higher efficiency using the identified sensitive control parameters, including but not limited to the PES and SOI.
- Measure speciated engine-out emissions, particularly HCHO, to understand their relevance when using oxygenated fuels or blends.
- Although low filter smoke numbers (FSNs) were observed in this study, ultrafine particles may still have been present. Therefore, particle number and size distribution measurements should be conducted to provide a more comprehensive assessment of particulate emissions.
Author Contributions
H.T.: Visualization, Methodology, Investigation, Formal analysis, Data curation, and Writing—original draft. K.K.S.: Conceptualization, Methodology, Validation, Investigation, Resources, Writing—review and editing, and Funding Acquisition. S.R.K.: Conceptualization, Methodology, Validation, Investigation, Resources, Writing—review and editing, Supervision, Project administration, and Funding acquisition. All authors have read and agreed to the published version of the manuscript.
Funding
This research received no external funding.
Data Availability Statement
The original contributions presented in this study are included in the article. Further inquiries can be directed to the corresponding author.
Acknowledgments
The first author acknowledges partial financial support provided by the Department of Mechanical Engineering and the College of Engineering at The University of Alabama. The assistance provided by Abhinandhan Narayanan and Yamini Baskara Babu in conducting experiments is also acknowledged. The authors thank Brett Windom’s research group at Colorado State University for providing the P1P fuel used in these experiments.
Conflicts of Interest
The authors declare no conflicts of interest.
Abbreviations
The following abbreviations are used in this manuscript:
| AHRR | Apparent heat release rate |
| CA XX | Crank angle at X percent cumulative heat release |
| CAD | Crank angle degree |
| COVIMEPg | Coefficient of variation of gross indicated mean effective pressure |
| IMEPg | Gross indicated mean effective pressure |
| ISNOx | Indicated specific oxides of nitrogen emissions |
| ISHC | Indicated specific hydrocarbon emissions |
| ISCO | Indicated specific carbon monoxide emissions |
| LRF | Low-reactivity fuel |
| MPRR | Maximum pressure rise rates |
| NG | Natural gas |
| P1P | Dipropyl oxymethylene ether |
| RCCI | Reactivity-controlled compression ignition |
| SCRE | Single-cylinder research engine |
| SOI | Commanded start of injection |
| 80B20D | 80/20 blend of n-butanol and diesel (% v/v) |
Appendix A. Uncertainty Analysis Methodology
The IFCE was calculated using Equation (A1), where is the indicated work:
Since the fuel mass per cycle is calculated from the measured fuel mass flow rate, engine speed (N) and number of revolutions per cycle (two revolutions for a four-stroke engine), Equation (A1) can be rewritten as Equation (A2) for an uncertainty propagation analysis.
The Taylor series method (TSM) [44] for general uncertainty analysis was used in this study to calculate the error propagation, as shown in Equation (A3).
To calculate the total combined uncertainty Uf, two terms are needed: the partial derivative terms, which are called sensitivity coefficients, and the uncertainties of the individual measurements that they multiply, which include both the statistical precision error and the systematic bias error as shown in Equation (A4). This represents a combined version of Type A and Type B uncertainties from the 2008 ISO GUM standard [45].
The IFCE equation was analyzed to identify the uncertainty source terms [46]. Equation (A5) shows all the variables that affect the uncertainty of IFCE, including the indicated work, mass flow rates of both high- and low-reactive fuels, and engine speed.
The sensitivity terms are derived by differentiating Equation (A1) with respect to each variable identified as a source of uncertainty. These partial derivatives are presented in Equations (A6) through (A9).
For the uncertainty term (Ux), the pression error (Up) is calculated as shown in Equation (A10). To establish a 95% confidence interval, the standard error is multiplied by a Z-score of 1.96 [44]. In this study, particularly for the indicated work precision error, 1000 engine cycles were considered. The bias error calculation for the indicated work includes the cylinder pressure transducer, charge amplifier, and manifold absolute air pressure transducer. For the bias errors, the values listed in Table 2 were used.
References
- Which Fuels Power the US Tucks and Buses? Available online: https://enginetechforum.org/trucking (accessed on 11 June 2025).
- Vehicle Miles Traveled for Heavy-Duty Trucks. 2025. Available online: https://www.energy.gov/sites/default/files/202210/Chapter_3-Heavy_Duty_Vehicles.pdf (accessed on 11 June 2025).
- The Clean Air Act of 1970. 2025. Available online: https://www.epa.gov/clean-air-act-overview/evolution-clean-air-act (accessed on 11 June 2025).
- Leach, F.; Kalghatgi, G.; Stone, R.; Miles, P. The scope for improving the efficiency and environmental impact of internal combustion engines. Transp. Eng. 2020, 1, 100005. [Google Scholar] [CrossRef] [Scilit]
- Joshi, A. Review of Vehicle Engine Efficiency and Emissions. SAE Int. J. Adv. Curr. Pract. Mobil. 2020, 2, 2479–2507. [Google Scholar] [CrossRef] [Scilit]
- Weaver, C.S.; Turner, S.H. Dual Fuel Natural Gas/Diesel Engines: Technology, Performance, and Emissions; SAE International: Warrendale, PA, USA, 1994. [Google Scholar]
- Doughty, G.E.; Bell, S.R.; Midkiff, K.C. Natural Gas Fueling of a Caterpillar 3406 Diesel Engine. J. Eng. Gas Turbines Power 1992, 114, 459–465. [Google Scholar] [CrossRef] [Scilit]
- Boyer, R.L. Status of Dual Fuel Engine Development; SAE International: Warrendale, PA, USA, 1949. [Google Scholar]
- Srinivasan, K.K.; Krishnan, S.R.; Singh, S.; Midkiff, K.C.; Bell, S.R.; Gong, W.; Fiveland, S.B.; Willi, M. The Advanced Low Pilot Ignited Natural Gas Engine: A Low NOx Alternative to the Diesel Engine. In Proceedings of the International Joint Power Generation Conference Collocated with TurboExpo 2003, Atlanta, GA, USA, 16–19 June 2003; pp. 905–912. [Google Scholar]
- Azimov, U.; Tomita, E.; Kawahara, N.; Harada, Y. Premixed mixture ignition in the end-gas region (PREMIER) combustion in a natural gas dual-fuel engine: Operating range and exhaust emissions. Int. J. Engine Res. 2011, 12, 484–497. [Google Scholar] [CrossRef] [Scilit]
- Kokjohn, S.L.; Hanson, R.M.; Splitter, D.A.; Reitz, R.D. Fuel reactivity controlled compression ignition (RCCI): A pathway to controlled high-efficiency clean combustion. Int. J. Engine Res. 2011, 12, 209–226. [Google Scholar] [CrossRef] [Scilit]
- Zhao, W.; Li, Z.; Huang, G.; Zhang, Y.; Qian, Y.; Lu, X. Experimental investigation of direct injection dual fuel of n-butanol and biodiesel on Intelligent Charge Compression Ignition (ICCI) Combustion mode. Appl. Energy 2020, 266, 114884. [Google Scholar] [CrossRef] [Scilit]
- Macián, V.; Monsalve-Serrano, J.; Villalta, D.; Fogué-Robles, Á. Extending the potential of the dual-mode dual-fuel combustion towards the prospective EURO VII emissions limits using gasoline and OMEx. Energy Convers. Manag. 2021, 233, 113927. [Google Scholar] [CrossRef] [Scilit]
- Wang, S.; Han, J.; Somers, B. Performance and Emission Studies in a Heavy-Duty Diesel Engine Fueled with an N-Butanol and N-Heptane Blend; SAE International: Warrendale, PA, USA, 2019. [Google Scholar]
- Benajes, J.; García, A.; Monsalve-Serrano, J.; Martínez-Boggio, S. Potential of using OMEx as substitute of diesel in the dual-fuel combustion mode to reduce the global CO2 emissions. Transp. Eng. 2020, 1, 100001. [Google Scholar] [CrossRef] [Scilit]
- Hariharan, D.; Partridge, K.; Narayanan, A.; Srinivasan, K.; Krishnan, S.R.; Anandaraman, N. Strategies for Reduced Engine-Out HC, CO, and NOx Emissions in Diesel-Natural Gas and POMDME-Natural Gas Dual-Fuel Engine. SAE Int. J. Adv. Curr. Pract. Mobil. 2022, 4, 1264–1278. [Google Scholar] [CrossRef] [Scilit]
- Narayanan, A.; Mundy, S.; Thothadri, H.; Gray, J.; Babu, Y.B.; Lucas, S.; Windom, B.; Srinivasan, K.K.; Krishnan, S.R. Propyl Oxymethylene Ether-Ignited Natural Gas Dual Fuel Low Temperature Combustion—A Low Carbon Pathway for High Efficiencies and Low Emissions. In Proceedings of the ASME 2023 ICE Forward Conference, Pittsburgh, PA, USA, 8–11 October 2023. [Google Scholar]
- No, S.-Y. Application of biobutanol in advanced CI engines—A review. Fuel 2016, 183, 641–658. [Google Scholar] [CrossRef] [Scilit]
- Zhen, X.; Wang, Y.; Liu, D. Bio-butanol as a new generation of clean alternative fuel for SI (spark ignition) and CI (compression ignition) engines. Renew. Energy 2020, 147, 2494–2521. [Google Scholar] [CrossRef] [Scilit]
- Han, J.; Bao, H.; Somers, L.M.T. Experimental investigation of reactivity controlled compression ignition with n-butanol/n-heptane in a heavy-duty diesel engine. Appl. Energy 2021, 282, 116164. [Google Scholar] [CrossRef] [Scilit]
- Wei, L.; Geng, P. A review on natural gas/diesel dual fuel combustion, emissions and performance. Fuel Process. Technol. 2016, 142, 264–278. [Google Scholar] [CrossRef] [Scilit]
- Tarabet, L.; Loubar, K.; Lounici, M.S.; Khiari, K.; Belmrabet, T.; Tazerout, M. Experimental investigation of DI diesel engine operating with eucalyptus biodiesel/natural gas under dual fuel mode. Fuel 2014, 133, 129–138. [Google Scholar] [CrossRef] [Scilit]
- Sun, L.; Liu, Y.; Zeng, K.; Yang, R.; Hang, Z. Combustion performance and stability of a dual-fuel diesel–natural-gas engine. Proc. Inst. Mech. Eng. Part D J. Automob. Eng. 2015, 229, 235–246. [Google Scholar] [CrossRef] [Scilit]
- Heavy-Duty Supplemental Emissions Test (SET). 2026. Available online: https://dieselnet.com/standards/cycles/set.php (accessed on 20 July 2026).
- Thothadri, H. The Impact of Different High Reactivity Fuels as Ignition Sources in Natural Gas Dual-Fuel RCCI Combustion; The University of Alabama: Tuscaloosa, AL, USA, 2025; p. 122. [Google Scholar]
- Lucas, S.P.; Chan, F.L.; Fioroni, G.M.; Foust, T.D.; Gilbert, A.; Luecke, J.; McEnally, C.S.; Serdoncillo, J.J.A.; Zdanowicz, A.J.; Zhu, J.; et al. Fuel Properties of Oxymethylene Ethers with Terminating Groups from Methyl to Butyl. Energy Fuels 2022, 36, 10213–10225. [Google Scholar] [CrossRef] [Scilit]
- Pan, M.; Tong, C.; Qian, W.; Lu, F.; Yin, J.; Huang, H. The effect of butanol isomers on diesel engine performance, emission and combustion characteristics under different load conditions. Fuel 2020, 277, 118188. [Google Scholar] [CrossRef] [Scilit]
- Rakopoulos, D.C.; Rakopoulos, C.D.; Hountalas, D.T.; Kakaras, E.C.; Giakoumis, E.G.; Papagiannakis, R.G. Investigation of the performance and emissions of bus engine operating on butanol/diesel fuel blends. Fuel 2010, 89, 2781–2790. [Google Scholar] [CrossRef] [Scilit]
- Heywood, J.B. Internal Combustion Engine Fundamentals, 2nd ed.; McGraw-Hill Education: New York, NY, USA, 2018. [Google Scholar]
- Krishnan, S.R.; Srinivasan, K.K.; Raihan, M.S. The effect of injection parameters and boost pressure on diesel-propane dual fuel low temperature combustion in a single-cylinder research engine. Fuel 2016, 184, 490–502. [Google Scholar] [CrossRef] [Scilit]
- Silvagni, G.; Moro, D.; Ravaglioli, V.; Ponti, F.; Corti, E.; Brusa, A.; Cavina, N.; Narayanan, A.; Srinivasan, K.; Krishnan, S.R. Analysis of the Vibrational Behavior of dual-fuel RCCI combustion in a Heavy-Duty Compression Ignited Engine fueled with Diesel-NG at Low Load. J. Phys. Conf. Ser. 2023, 2648, 012077. [Google Scholar] [CrossRef] [Scilit]
- Willems, R.; Willems, F.; Deen, N.; Somers, B. Heat release rate shaping for optimal gross indicated efficiency in a heavy-duty RCCI engine fueled with E85 and diesel. Fuel 2021, 288, 119656. [Google Scholar] [CrossRef] [Scilit]
- Partridge, K.R.; Jha, P.R.; Srinivasan, K.K.; Krishnan, S.R. An experimental and computational analysis of combustion heat release transformation in dual fuel combustion. Fuel 2023, 341, 127561. [Google Scholar] [CrossRef] [Scilit]
- Roberts, G.; Rousselle, C.M.; Musculus, M.; Wissink, M.; Curran, S.; Eagle, E. RCCI Combustion Regime Transitions in a Single-Cylinder Optical Engine and a Multi-Cylinder Metal Engine. SAE Int. J. Engines 2017, 10, 2392–2413. [Google Scholar] [CrossRef] [Scilit]
- Guerry, E.S.; Raihan, M.S.; Srinivasan, K.K.; Krishnan, S.R.; Sohail, A. Injection timing effects on partially premixed diesel–methane dual fuel low temperature combustion. Appl. Energy 2016, 162, 99–113. [Google Scholar] [CrossRef] [Scilit]
- Polk, A.C.; Carpenter, C.D.; Scott Guerry, E.; Dwivedi, U.; Kumar Srinivasan, K.; Rajan Krishnan, S.; Rowland, Z.L. Diesel-Ignited Propane Dual Fuel Low Temperature Combustion in a Heavy-Duty Diesel Engine. J. Eng. Gas Turbines Power 2014, 136, 091509. [Google Scholar] [CrossRef] [Scilit]
- Cheung, C.S.; Di, Y.; Huang, Z. Experimental investigation of regulated and unregulated emissions from a diesel engine fueled with ultralow-sulfur diesel fuel blended with ethanol and dodecanol. Atmos. Environ. 2008, 42, 8843–8851. [Google Scholar] [CrossRef] [Scilit]
- Bailey, R.A. Chemistry of the Environment; Elsevier Science: Amsterdam, The Netherlands, 2002. [Google Scholar]
- Crawford, J.G.; Wallace, J.S. Engine Operating Parameter Effects on the Speciated Aldehyde and Ketone Emissions from a Natural Gas Fuelled Engine. SAE Trans. 1995, 104, 1659–1672. [Google Scholar]
- Curran, H.J. Developing detailed chemical kinetic mechanisms for fuel combustion. Proc. Combust. Inst. 2019, 37, 57–81. [Google Scholar] [CrossRef] [Scilit]
- Mitchell, C.E.; Olsen, D.B. Formaldehyde Formation in Large Bore Natural Gas Engines Part 1: Formation Mechanisms. J. Eng. Gas Turbines Power 1999, 122, 603–610. [Google Scholar] [CrossRef] [Scilit]
- Caton, J.A. Combustion phasing for maximum efficiency for conventional and high efficiency engines. Energy Convers. Manag. 2014, 77, 564–576. [Google Scholar] [CrossRef] [Scilit]
- Zhang, Y.; Boehman, A.L. Oxidation of 1-butanol and a mixture of n-heptane/1-butanol in a motored engine. Combust. Flame 2010, 157, 1816–1824. [Google Scholar] [CrossRef] [Scilit]
- Coleman, H.; Steele, W.; Buzhuga, M. Experimentation, Validation, and Uncertainty Analysis for Engineers. Noise Control. Eng. J. 2010, 58, 3. [Google Scholar] [CrossRef] [Scilit]
- Joint Committee for Guides in Metrology (JCGM). Evaluation of Measurement Data—Guide to the Expression of Uncertainty in Measurement—The Legacy GUM; Joint Committee for Guides in Metrology (JCGM): Sevres, France, 2008. [Google Scholar] [CrossRef] [Scilit]
- Ellison, S.; Williams, A.; Bettencourt da Silva, R.; Bremser, W.; Brzyski, A.; Fodor, P.; Kaarls, R.; Kaus, R.; Magnuson, B.; Amico di Meane, E.; et al. Quantifying Uncertainty in Analytical Measurement (QUAM); CITAC: Berlin/Heidelberg, Germany, 2012. [Google Scholar]

Disclaimer/Publisher’s Note: The statements, opinions and data contained in all publications are solely those of the individual author(s) and contributor(s) and not of MDPI and/or the editor(s). MDPI and/or the editor(s) disclaim responsibility for any injury to people or property resulting from any ideas, methods, instructions or products referred to in the content. |
© 2026 by the authors. Licensee MDPI, Basel, Switzerland. This article is an open access article distributed under the terms and conditions of the Creative Commons Attribution (CC BY) license.