


Abstract
Natural gas production from mature fields is progressively shifting toward low-rate wells operating near their economic limit, creating challenges for long-term asset management. This study proposes an integrated stochastic decision-support framework combining Arps decline curve analysis, a calibrated Schwartz Type-I mean-reverting jump-diffusion model, Monte Carlo simulation, and Bellman dynamic programming to optimize marginal dry gas well management. The framework evaluates pipeline commercialization and a hybrid strategy integrating on-site electricity generation, while incorporating monetized environmental externalities associated with CO2 emissions from gas combustion and potential post-abandonment CH4 emissions. Application to the Mareógrafo 100 well in Mexico shows that the environmentally adjusted Bellman policy yields a mean NPV of USD 34.84 thousand, exceeding the comparable pipeline-only and hybrid strategies. Internalizing environmental costs reduces the mean optimal NPV by 46.6% relative to the economic-only formulation, while the mean abandonment time is approximately 200 days. Sensitivity analysis identifies electricity price, natural gas price, and pipeline distance as the dominant profitability drivers. The proposed framework provides a transferable methodology for jointly evaluating commercialization, environmental externalities, and abandonment decisions in mature dry gas fields under uncertainty.
1. Introduction
Hydrocarbon production fields naturally evolve toward maturity as reservoir depletion progressively reduces production rates and operating efficiency. During this late stage, many wells become marginal, operating close to their economic limit as declining production is increasingly offset by operating expenditures associated with compression, transportation, and field maintenance. Production forecasting for these assets is commonly performed using decline curve analysis (DCA), where the classical Arps model remains the standard approach for estimating future production and remaining reserves. As mature wells approach boundary-dominated flow, production typically converges toward an exponential decline regime, signaling the onset of economic depletion [1].
Marginal (or stripper) wells are therefore characterized not only by low production rates but also by their proximity to economic abandonment thresholds [2]. Although individually unproductive, these wells collectively represent a significant fraction of the remaining production and reserves in mature basins worldwide [3]. Consequently, operators must determine whether continued operation, infrastructure investment, or permanent plugging and abandonment (P&A) maximizes the remaining economic value of the asset.
Recent advances in distributed energy systems provide an alternative to conventional gas commercialization. Rather than transporting low-rate gas through existing pipeline infrastructure, the remaining resource may be converted into electricity at the wellhead, potentially increasing the value recovered from mature assets.
This paper is organized as follows. Section 1 reviews the relevant literature and identifies the research gap and the principal scientific contributions. Section 2 presents the mathematical formulation of the proposed stochastic decision-support framework. Section 3 presents computational implementation and general simulation results. Section 4 introduces the representative case study, while Section 5 presents and discusses the results of the case study. Finally, Section 6 summarizes the main conclusions.
1.1. Literature Review
The scientific literature on mature gas fields encompasses several complementary research areas, including production decline analysis, stochastic natural gas price modeling, techno-economic assessment of distributed energy systems, and optimization techniques for field development and abandonment decisions. Although these research directions have advanced considerably over the past decades, they have largely evolved independently, with limited integration into decision-support methodologies for marginal dry gas wells. The above statement is based on the review of the following literature, where the main innovations and contributions are established, identifying current methodological limitations, and establishing the research gap addressed by the present work. The proposed stochastic decision-support framework is based on the integration of production forecasting, market uncertainty, sequential decision-making, and hybrid commercialization strategies.
Brito et al. [4] reviewed gas to electricity projects worldwide and concluded that the topic is relevant because it raises the possibility of monetizing untapped gas resources by converting gas to electricity. While the study addressed a broader topic than marginal dry gas wells, it supports the argument that on-site or near-site power generation can overcome limitations in market-access associated with low-volume gas production. Khalilpour and Karimi [5] compared different approaches for monetizing stranded natural gas, including gas-to-electricity. This approach is valuable for treating marginal dry gas wells as a productive asset of stranded gas, where pipeline transport may no longer be economically justified. Ojijiagwo et al. [6] evaluated the economic feasibility of converting otherwise wasted gas into electricity. While the study focused on flared gas, the same economic reasoning could be extended to marginal dry gas wells in cases where transportation expenses surpass the revenue from gas sales. Kerunwa et al. [7] provided an applied example of on-site electricity production using stranded gas. It is helpful for arguing that small-scale gas utilization can shift the decision from abandonment toward local energy conversion. Lima Mota et al. [8] analyzed how gas-to-electricity is an alternative commercialization route rather than merely a technical solution. It supports the economic comparison between pipeline sale and onsite power generation. Milão et al. [9] expanded the gas-to-electricity concept by integrating environmental performance and thermodynamic efficiency. It can support the methodological connection between gas utilization, power generation, and emissions reduction. Emerson et al. [10] focused on marginal natural gas wells. It is valuable because it proposes a non-conventional method to recover value from low-productivity wells rather than treating them only as abandonment candidates. Kaiser [11] provided a production-economics framework for marginal offshore assets. It is useful for defining marginality as an economic condition shaped by production decline, operating costs, and infrastructure constraints. Kaiser and Yu [12] modeled how marginal assets approach economic limits. It can support the decision framework of the study for determining when continued gas sales, on-site production, or abandonment is preferable. Caulk and Tomac [13] analyzed abandoned wells as a form of reusable energy infrastructure. Although geothermal reuse differs from gas-to-electricity, it supports the broader idea that wells should not automatically be treated as liabilities once conventional production becomes marginal. Davis and Michaelides [14] showed that existing wells can be reconsidered as energy assets, which strengthens the conceptual foundation for using marginal gas wells for on-site electricity production. Wight and Bennett [15] contributed to the technical discussion on how existing hydrocarbon wells may be converted into useful energy systems. It is relevant for showing that well reuse can reduce capital barriers compared with new energy infrastructure. Kurnia et al. [16] discussed the technical and economic feasibility of wells. It supports the argument that mature-field infrastructure can retain value beyond conventional hydrocarbon extraction. Nassan et al. [17] discussed the re-purposing of hydrocarbon wells and reservoirs rather than immediate plugging. It can help support a decision hierarchy: reuse first when feasible, plug only when no economic or environmental alternative exists. Jello and Baser [18] reviewed the infrastructure-reuse perspective. For the proposed study, it helps establish that existing wells can be treated as sunk infrastructure that may lower the entry cost of alternative energy systems. Boutot and Kang [19] quantified renewable-energy opportunities associated with abandoned and orphaned well sites. It supports the idea that well sites can become distributed-energy nodes rather than only remediation liabilities. Kang et al. [20] analyzed risk and opportunity. It supports a broader framing in which marginal wells should be assessed not only for plugging costs, but also for potential productive reuse before abandonment. Boutot et al. [21] provided a strong empirical basis on abandoned wells. It helps underscore the need for more rigorous economic and environmental evaluations of abandonment decisions before wells turn into unmanaged liabilities. Raimi et al. [22] discussed the abandonment cost. It shows that plugging costs can vary widely, which supports comparing abandonment costs against the potential value of onsite generation. Kang et al. [23] evaluated mitigation strategies and costs for abandoned wells. It supports the environmental side of the study by showing that plugging is not only an economic decision but also an emissions-management decision. Kang et al. [24] provided core evidence that abandoned wells can emit methane. It is useful for arguing that early reuse or controlled operation may reduce the risk of creating neglected emission sources. Deighton et al. [25] addressed marginal wells by supporting the claim that low-production wells may have disproportionate environmental impacts, strengthening the case for either productive reuse or timely closure. Vogt et al. [26] quantified emissions from low-production well sites. It can support the environmental motivation for comparing abandonment, continued production, and on-site gas utilization. Pekney et al. [27] contributed direct measurement evidence for methane leakage from abandoned wells. It is useful for supporting the argument that passive abandonment can create long-term environmental risks. Riddick et al. [28] compared emissions from active and abandoned wells. It is relevant because the proposed study evaluates whether controlled continued use through power generation may be preferable to neglected abandonment. Gianoutsos et al. [29] evaluated emissions concerning geologic conditions and well integrity. It supports including well condition, reservoir pressure, and site-specific risk as variables in abandonment-versus-reuse decisions. Riddick et al. [30] studied the emissions evidence based on geography. It can be used to show that abandoned-well methane emissions are not limited to one basin and should be included in marginal-well policy and economics. Saint-Vincent et al. [31] identified which well attributes influence emissions. It supports a review methodology where marginal dry gas wells are classified by technical condition before selecting reuse or plugging. Alsubaih et al. [32] summarized environmental impacts associated with neglected and abandoned wells. It provides background for explaining why abandonment is not a neutral endpoint, especially if wells are not properly monitored. Passalacqua et al. [33] discussed gas-to-electricity as a transitional energy option for marginal or depleted gas assets. It can help position on-site production as an intermediate strategy between continued hydrocarbon production and full abandonment.
The reviewed literature shows a clear transition from conventional plugging and abandonment (P&A) strategies toward alternative utilization pathways, including gas-to-electricity systems and geothermal well repurposing. Although these approaches demonstrate the potential to extend the productive life of mature wells, they remain largely technology-specific and do not provide integrated decision-support frameworks capable of jointly addressing reservoir decline, natural gas price uncertainty, and multiple commercialization pathways.
The literature reviewed above was further classified according to the principal methodological components required for an integrated marginal-well decision-support framework. Table 1 provides a systematic comparison of the reviewed research areas and identifies the degree to which production decline, market uncertainty, alternative commercialization pathways, dynamic optimization, abandonment, and environmental effects are jointly considered. This comparison allows the methodological fragmentation identified in the literature to be evaluated explicitly rather than solely through a narrative assessment.
Table 1.
Systematic comparison of the principal research areas identified in the literature review and their coverage of the methodological components required for marginal dry gas well decision-making.
The systematic comparison in Table 1 reveals a marked fragmentation of the existing literature. Among the six research categories identified in the review, none simultaneously incorporates all six methodological dimensions considered necessary for an integrated marginal-well decision framework. Market uncertainty and dynamic sequential optimization are not jointly addressed by any of the reviewed research categories, while production decline is explicitly incorporated primarily in studies focused on marginal-well production and economics. Multiple commercialization pathways are considered mainly in gas-to-electricity and well-repurposing studies, whereas abandonment and environmental effects are concentrated in a separate body of literature. Consequently, the principal limitation is not the absence of research on the individual components, but the absence of their integration within a unified stochastic decision framework capable of simultaneously representing reservoir depletion, market uncertainty, commercialization choice, environmental externalities, and abandonment decisions. This systematic identification of fragmented methodological components follows the broader principle of evaluating existing approaches through their combined limitations rather than considering individual methodological gaps in isolation [34].
1.2. Research Gap
Despite the considerable body of literature on mature gas field management, the systematic comparison presented in Table 1 demonstrates that the principal research gap does not arise from the absence of methods for analyzing individual aspects of marginal-well operation, but from the lack of their integration within a unified decision-support framework. Existing studies provide established approaches for production decline analysis, stranded-gas monetization, gas-to-electricity conversion, well repurposing, abandonment economics, and environmental assessment. However, these methodological components remain largely distributed across separate research streams and are rarely evaluated simultaneously when determining the remaining economic value of a marginal dry gas well.
Three specific methodological gaps emerge from this fragmentation. First, production decline and market uncertainty are generally treated independently. Marginal-well studies characterize declining production and economic limits, whereas gas monetization studies evaluate alternative utilization pathways, but the interaction between reservoir depletion and stochastic natural gas prices is seldom incorporated into the same decision process. Consequently, the economic value of retaining, converting, or abandoning a declining asset cannot be continuously reassessed as both reservoir conditions and market prices evolve.
Second, existing techno-economic studies predominantly evaluate commercialization alternatives as predefined or independent pathways rather than as sequential operating decisions. Pipeline commercialization, gas-to-electricity conversion, repurposing, and abandonment have each been investigated in the literature, but a dynamic framework capable of selecting among these alternatives according to their immediate economic return and future asset value remains lacking. This limitation is particularly relevant for marginal wells because the optimal decision at a given time may depend not only on current profitability but also on the expected value of preserving the well for subsequent operating periods.
Third, economic, infrastructure, and environmental consequences are rarely incorporated within the same optimization criterion. Pipeline distance, electricity and natural gas prices, operating expenditures, power-generation performance, abandonment liabilities, and environmental externalities can jointly determine whether continued operation remains preferable to permanent abandonment. The literature reviewed in Section 1.1 addresses several of these factors individually, but does not provide an integrated stochastic framework capable of evaluating their combined influence on the operating decision.
The resulting research gap can therefore be defined as the absence of a validated stochastic sequential decision framework that simultaneously couples (i) production decline, (ii) natural gas price uncertainty, (iii) alternative and hybrid commercialization pathways, (iv) dynamic optimization of operating and abandonment decisions, and (v) the economic and environmental consequences associated with those decisions. Addressing this integration gap is essential for determining not merely whether a marginal dry gas well remains profitable under a predefined utilization strategy, but which commercialization or abandonment action maximizes its remaining value as reservoir, market, infrastructure, and environmental conditions evolve.
1.3. Contributions of This Study
To address these research gaps, this study proposes an integrated stochastic decision-support framework for mature dry gas wells. The main contributions of this work are:
- (i)
- the integration of production decline forecasting, stochastic natural gas price modeling, Bellman dynamic programming, and hybrid gas commercialization within a unified optimization framework;
- (ii)
- the formulation of an adaptive decision model that optimally allocates produced gas between pipeline transportation and on-site electricity generation under market uncertainty;
- (iii)
- the explicit incorporation of future asset value into operational decision-making through stochastic dynamic programming; and
- (iv)
- the application and single-well demonstration of the proposed methodology using the Mareógrafo 100 mature gas well, illustrating its practical implementation under representative operating conditions of the Burgos Basin.
The novelty of the present study does not reside in the individual methodological components—Arps decline analysis, stochastic price modeling, Monte Carlo simulation, or Bellman dynamic programming—which are established techniques in their respective fields. Rather, the principal contribution lies in their integration within a unified stochastic sequential decision-support framework specifically formulated for marginal dry gas wells. The framework couples declining reservoir deliverability and stochastic natural gas prices with a hybrid commercialization structure in which pipeline sales, on-site power generation, idling, and permanent abandonment are evaluated as state-dependent sequential decisions rather than as independent fixed strategies. In addition, operational feasibility constraints and action-specific environmental externalities are incorporated directly into the decision logic. Consequently, the hybrid gas-allocation rule and abandonment timing emerge endogenously from the Bellman optimization as production and market conditions evolve. The Mareógrafo 100 case study constitutes an applied demonstration of this integrated methodology under representative conditions of the Burgos Basin rather than the source of the methodological novelty itself.
2. Integrated Stochastic Decision-Support Framework
Building upon the research gaps identified in the previous section, this work proposes an integrated stochastic decision-support framework for mature dry gas wells under uncertainty. The framework combines production decline forecasting, stochastic natural gas price modeling, hybrid gas commercialization, and Bellman dynamic programming to determine the economically optimal operating strategy throughout the remaining productive life of the well. The mathematical formulation presented in the following subsections establishes the production, economic, and optimization models that collectively define the proposed decision-support framework.
2.1. Definition of a Marginal Dry Gas Well
In the context of natural gas production, stripper wells constitute a subset of marginal wells characterized by sustained low production rates and proximity to the economic limit of operation. The Interstate Oil and Gas Compact Commission (IOGCC) defines a stripper gas well as one producing 60 Mcf/d or less, whereas U.S. federal tax regulations commonly define gas stripper wells using a threshold of 90 Mcf/d or less [35,36]. Therefore, this study defines a marginal dry gas well as shown in Equation (1):
where is the daily dry gas production rate at time t.
From an economic perspective, marginality is defined by the break-even condition according to Equation (2):
or equivalently:
where denotes the operating profit at time t (USD/day), represents the total revenue generated by the well at time t (USD/day), and corresponds to the total operating expenditure at time t (USD/day), indicating that the well operates at the threshold of economic viability when revenues approximately equal operating costs, a defining characteristic of marginal wells approaching abandonment.
2.2. Production Decline Model
Production is modeled using the Arps decline model [37], as shown in Equation (4), which describes how gas production decreases over time as a function of the initial production rate and decline rate, thereby capturing the progressive depletion dynamics characteristic of mature wells.
where is the initial gas production rate (Mcf/day), is the initial nominal decline rate (time−1), b is the Arps decline exponent (-), and t denotes the elapsed production time.
Special cases include:
Exponential decline ():
Hyperbolic decline ():
Harmonic decline ():
2.3. Stochastic Natural Gas Price Model
Natural gas prices are modeled using a calibrated Schwartz Type-I mean-reverting process with jumps. The Schwartz framework captures the empirical tendency of commodity prices to revert toward a long-run equilibrium level, a well-documented stylized fact of natural gas markets. The jump component accounts for abrupt price discontinuities associated with extreme weather conditions, supply disruptions, geopolitical events, infrastructure failures, and unexpected demand shocks, thereby providing a more realistic representation of observed market dynamics [38,39].
The logarithm of the natural gas price is assumed to follow an Ornstein–Uhlenbeck process with jumps [40,41]. Equation (8) describes the stochastic evolution of natural gas prices through a mean-reverting process that captures both normal market fluctuations and abrupt price shocks, thereby reflecting the observed behavior of natural gas markets by stochastic evolution of the log-price process:
where is the natural logarithm of the natural gas price, is the mean-reversion speed, is the long-run equilibrium log-price, is the diffusion volatility, is a standard Brownian motion, is the corresponding Wiener increment, with , and is the compound jump process.
The jump component is modeled as:
where is the increment of the jump process, is the random jump magnitude, is the increment of a Poisson process with intensity , is the jump intensity (expected number of jumps per unit time), is the mean jump size, and is the standard deviation of the jump size, capturing abrupt deviations from the long-run equilibrium price level by introducing random jump events, thereby representing extreme market movements that cannot be explained solely by the continuous diffusion component.
For numerical implementation, the continuous-time process is discretized and simulated using a Monte Carlo framework:
where is the natural logarithm of the natural gas price at time t, is the natural logarithm of the natural gas price at time , is the simulation time step, is a standard normal random variable, and is the number of jump events occurring during the time interval .
With , , and representing the standard normal random variable, the number of jump events during the time interval , and the random jump magnitude, respectively.
The natural gas price is then recovered through:
where is the natural gas price at time t (USD/MMBtu).
This discrete-time representation is used to generate Monte Carlo realizations of future natural gas prices, combining mean-reverting behavior with random jump events to capture both normal market dynamics and extreme price movements. Additionally, this transformation converts the simulated log-price process into natural gas prices, ensuring strictly positive price values while preserving the mean-reverting and jump characteristics of the underlying stochastic model.
Model parameters , , , , , and are calibrated from historical Henry Hub daily spot prices. Mean-reversion parameters are estimated from the logarithmic price series using an Ornstein–Uhlenbeck specification, while jump parameters are obtained from extreme residual observations exceeding three standard deviations from the calibrated diffusion process. Henry Hub was retained as the reference for natural gas price uncertainty because it provides the long-term market series used to calibrate the stochastic component of the proposed framework [42].
2.4. Markov Chain for Well State
The well state is defined by Equation (12) through discrete operational states of the well, representing its possible conditions over time—operating, idle, or abandoned—thereby enabling the modeling of state transitions and operational uncertainty within a Markov framework.
where O, I, and A denote the operating, idle (temporary shut-in), and abandoned well states, respectively.
The following transition matrix (Equation (13)) defines the probabilities of moving between operational states of the well over time, where each element represents the probability of transitioning from one state to another, and the nature of the abandoned state reflects the irreversible decision of well plugging and abandonment.
The transition probabilities were established based on engineering judgment and reported operational characteristics of marginal wells. High persistence probabilities were assigned to the operating and idle states to reflect the inertia typically observed in field operations, whereas lower transition probabilities were used to represent temporary shut-ins and abandonment events. The abandoned state was treated as irreversible nature related to plugging and abandonment.
2.5. Pipeline Economics
Equation (14) describes the daily net operating profit associated with conventional natural gas commercialization through the existing pipeline network. The formulation accounts for revenues from gas sales and deducts the principal operating costs, including production, gas compression, transportation, and fixed operating expenditures. As production declines during the mature stage of field development, these costs constitute an increasing fraction of total revenues, progressively reducing the economic viability of pipeline commercialization [43,44].
where is the operating profit from pipeline gas sales at time t (USD/day), is the natural gas price (USD/MMBtu), is the daily gas energy production (MMBtu/day), represents the production operating costs, including maintenance and field operations (USD/day), is the gas compression cost required to satisfy pipeline pressure specifications (USD/day), denotes the gathering and transportation cost for delivering natural gas to the pipeline (USD/day), and represents the fixed operating costs associated with monitoring and regulatory compliance (USD/day).
Equation (15) converts volumetric gas production into its corresponding energy content, establishing the fundamental link between reservoir output and its potential for economic valuation and energy conversion.
where is the lower (or higher) heating value of natural gas (MMBtu/Mcf).
For the present case study, a natural gas heating value of MMBtu/Mcf is assumed, representing the typical energy content of dry natural gas.
2.6. On-Site Power Generation
Equation (16) represents the thermodynamic conversion of chemical energy contained in natural gas into electrical energy, where the conversion efficiency accounts for losses in the generation system, such as heat dissipation and mechanical inefficiencies.
where is the electrical energy produced at time t (kWh/day), is the electrical conversion efficiency of the generation system (-), and is the daily natural gas energy input (MMBtu/day).
Equation (17) converts the chemical energy of natural gas into electrical energy in practical units (kWh), enabling direct comparison with electricity market prices or avoided electricity costs, thereby linking reservoir production to economically quantifiable power generation output.
where 293.071 is the thermal energy conversion factor from MMBtu to kWh (kWh/MMBtu).
Equation (18) converts daily electrical energy production into average power output, providing a practical measure of the capacity of a well to operate as a continuous distributed generation unit over time.
where is the average electrical power output at time t (kW), and the factor 24 represents the number of hours per day used to convert daily electrical energy into average power.
Profit: Equation (19) represents the economic performance of converting natural gas into electricity at the wellhead, where revenues depend on electricity valuation while avoiding compression and transportation costs, thereby improving profitability under marginal production conditions.
where is the operating profit from on-site power generation at time t (USD/day), is the electricity selling price or avoided electricity cost (USD/kWh), and represents the operating and maintenance costs of the power generation system (USD/day).
2.7. Decision Rule
The operational management of a marginal gas well is formulated as a sequential decision-making problem under uncertainty. At each decision stage, the operator evaluates the economic performance of all feasible operating alternatives and selects the action that maximizes the expected economic value of the asset. The present framework accounts for both immediate operating profits and the expected future value of the well, thereby distinguishing temporary operational suspension from irreversible abandonment.
The optimal decision is obtained through the Bellman optimality equation [45],
where is the value function of the well at time t under operational state (USD), is the operational decision selected at time t, and denotes the set of feasible actions conditional on the current operational state. The complete action set is . Furthermore, is the instantaneous economic profit associated with action (USD/day), is the corresponding monetized environmental cost (USD/day), is the simulation time step, r is the discount rate expressed on a time basis consistent with , denotes the conditional expectation operator, and is the operational state reached at the next decision stage after applying action .
The environmental-cost term allows the framework to account for action-specific environmental externalities, including CO2 emissions from on-site natural gas combustion and potential methane emissions associated with abandoned wells. Methane emissions are converted to CO2-equivalent emissions using the corresponding global warming potential and subsequently monetized through the applicable carbon shadow price. Because abandoned-well methane emissions depend strongly on well integrity and site-specific geological conditions, this environmental component is retained as a parameterizable term rather than imposing a universal leakage rate.
For clarity, the action-specific net operating benefit is defined as
The value associated with selecting action a at state is then defined through the action-value function
Accordingly, the optimal operating policy is
Equations (22) and (23) clarify that the optimal action is not selected solely according to instantaneous profitability. Rather, each feasible action is evaluated according to the sum of its current net benefit and the discounted expected continuation value of the asset. Therefore, a temporarily negative operating cash flow does not necessarily imply immediate abandonment when preserving the well has positive expected future value.
The Bellman state variable represents the operational condition of the well and takes values in the discrete state space
The decision interval is one day, consistent with the daily production, natural gas price, cash-flow, and environmental calculations used throughout the simulation, such that day. From the operating state, the feasible actions are pipeline commercialization, hybrid gas-to-power commercialization, temporary idling, and permanent abandonment, subject to the corresponding engineering feasibility constraints. From the idle state, the well may restart commercialization, remain idle, or be permanently abandoned. The abandoned state is absorbing; therefore, once , all subsequent states remain abandoned and no further operating revenues are generated.
State transitions between the operating and idle conditions are represented through the transition matrix . Abandonment may occur either through an explicit abandonment decision or through a transition to the absorbing abandoned state. A plugging-and-abandonment liability is charged once when the well enters the abandoned state. In the Mareógrafo 100 case study, . After abandonment, operating revenues cease, whereas the parameterized post-abandonment methane environmental liability remains active over the remaining analysis horizon.
The backward recursion is initialized using the terminal condition
To preserve a consistent full-life-cycle system boundary, if the well reaches the end of the 10-year project horizon without having previously entered the abandoned state, the plugging-and-abandonment liability is imposed at T. This terminal treatment prevents the finite simulation horizon from artificially assigning residual economic value to an unclosed well.
In computational implementation, the Bellman recursion is solved backward from the terminal condition. For each state and decision period, the action values are evaluated for all feasible actions, and the maximizing action is stored as the optimal policy. The resulting policy is subsequently applied in a forward simulation using the same stochastic realizations of production and natural gas prices. An idle decision preserves the possibility of future operation, whereas an abandonment decision triggers the P&A liability and irreversibly transfers the well to the absorbing abandoned state.
This formulation ensures that all commercialization alternatives are evaluated consistently under the same stochastic realizations of gas production and market conditions. At each simulation step, the selected action therefore maximizes the expected economic value of the asset rather than merely its contemporaneous operating profit. Consequently, the proposed methodology provides a dynamically consistent operating and abandonment policy for mature marginal gas wells under uncertainty.
2.8. Hybrid Gas-to-Power Commercialization Strategy
The Bellman optimization framework determines the economically optimal allocation of the available natural gas production among the feasible commercialization alternatives. Rather than assuming that all produced gas is transported through the pipeline network, the proposed methodology allows dynamic allocation between conventional pipeline sales and on-site electricity generation according to the expected economic return.
The progressive depletion of the reservoir is directly translated into a corresponding reduction in electrical energy production, enabling a quantitative assessment of the long-term power generation potential of marginal dry gas wells [44]. Equation (26) couples reservoir production decline with thermodynamic energy conversion by relating the time-dependent gas production forecast to the electrical energy generated by a natural gas reciprocating engine. Unlike a constant-efficiency formulation, the generator efficiency is allowed to vary with the available gas flow and the corresponding operating load. Consequently, the progressive depletion of the reservoir affects not only the amount of fuel available for electricity generation but also the conversion efficiency of the generating unit under partial-load operation.
where is the gross electrical energy generated at time t (kWh/day), is the instantaneous electrical efficiency of the generating unit, is the initial gas production rate (Mcf/day), is the initial decline rate, b is the Arps decline exponent, is the natural gas heating-value conversion factor (MMBtu/Mcf), and 293.071 is the conversion factor from MMBtu to kWh.
To account for efficiency attenuation under variable-load operation, the instantaneous generator efficiency is defined according to the following operating regimes:
where is the electrical efficiency at rated load, is the instantaneous generator load factor, is the available gas production rate (Mcf/day), and is the gas consumption required to operate the generating unit at rated electrical capacity. When sufficient gas is available to operate the generator at full load, and the rated efficiency is applied. As gas production declines below the rated fuel requirement, , the generating unit operates under partial-load conditions and its instantaneous efficiency is corrected through the load-dependent function .
For the partial-load regime, the efficiency correction function is represented by a second-order polynomial:
where , , and are empirical coefficients obtained by fitting the efficiency correction function to the partial-load performance characteristics of a natural gas reciprocating engine. The normalized second-order polynomial was fitted using manufacturer-reported generator efficiencies at 50%, 75%, and 100% load, yielding , , and , respectively [46]. This formulation enables reservoir decline to influence both the gas available for power generation and the corresponding energy-conversion efficiency, thereby improving the accuracy of the dynamic gas allocation between on-site electricity generation and pipeline commercialization.
To ensure physically feasible operation of the on-site generating unit, a minimum stable operating-load constraint is imposed in addition to the load-dependent efficiency correction. The generator is considered available for dispatch only when the instantaneous load factor satisfies
where represents the minimum stable operating load of the natural gas reciprocating engine. Equivalently, the minimum gas flow required for stable generator operation is
Accordingly, the power-generation action is included in the feasible Bellman action set only when
When the available gas production falls below this threshold, on-site power generation is excluded from the feasible action set and the optimization is restricted to the remaining admissible alternatives. This constraint prevents the economic optimization from selecting generator operation at gas-flow rates below the technically stable operating range.
Exponential case: for mature dry gas wells, production commonly approaches an exponential decline regime as the decline exponent tends toward zero. Therefore, taking the limit in Equation (26) yields the exponential decline model showed in Equation (32), representing the exponential decline case of the Arps model, where electrical energy output decreases at a constant proportional rate over time, directly reflecting the progressive depletion of the reservoir and its impact on the well’s power generation capability.
Equation (33) links reservoir production decline directly to average electrical power output, providing a practical measure of the well’s capability to operate as a distributed generation unit and allowing the production threshold for economically viable power generation to be identified.
In mature gas fields, on-site electricity generation represents a viable alternative for monetizing natural gas production when transportation through existing pipeline infrastructure is technically infeasible or economically unattractive. Unlike the conventional commercialization pathway, where natural gas is directly sold into the pipeline network, this alternative converts the produced gas into electrical energy that can subsequently be exported to the power grid. Consequently, the economic performance of this strategy depends not only on the available gas production but also on the conversion efficiency of the generating unit, auxiliary power consumption, and the prevailing electricity selling price.
The generated electricity is subsequently adjusted for auxiliary consumption and economically evaluated through the corresponding revenue and profit functions, enabling direct comparison with the conventional pipeline commercialization alternative.
A fraction of the generated electricity is consumed internally by auxiliary equipment, including compressors, cooling systems, instrumentation, lubrication systems, and other balance-of-plant components. The net electrical energy available for commercialization is obtained by deducting auxiliary consumption from the gross electricity produced in Equation (26); therefore, the net electrical energy available for commercialization is given by
where is the net electrical energy available for commercialization at time t (kWh/day), and denotes the auxiliary electrical energy consumption required for plant operation (kWh/day).
The revenue associated with electricity commercialization is calculated as
where is the revenue obtained from electricity commercialization at time t (USD/day), and is the electricity selling price or avoided electricity cost (USD/kWh).
Depending on the optimal decision obtained from Equation (20), the available gas production may be allocated to either commercialization pathway or simultaneously distributed between both alternatives whenever production is sufficient.
The net profit associated with the power generation alternative is then determined by
To ensure methodological consistency, both commercialization alternatives are evaluated using the same stochastic gas production and natural gas price realizations generated by the Monte Carlo simulation. The electricity selling price is treated as a scenario parameter, and the Bellman optimization framework selects, at each decision stage, the commercialization alternative that maximizes the expected economic return under the operational constraints of the marginal dry gas well.
This hybrid operating strategy enables simultaneous participation in the natural gas and electricity markets while providing the operational flexibility required by the Bellman optimization framework to maximize the long-term economic value of marginal dry gas wells under uncertain market conditions.
3. Computational Implementation and General Simulation Results
The computational framework was implemented in MATLAB®R2024b to integrate stochastic natural gas price simulation, production decline forecasting, economic evaluation, and Bellman dynamic programming. For the case-study implementation, the Bellman objective was further extended through the action-specific environmental cost term introduced in Equations (20)–(22), allowing monetized environmental externalities to be incorporated without modifying the general computational architecture.
Such proposed mathematical framework was implemented as a Monte Carlo decision-support algorithm to evaluate the economic performance of marginal dry gas wells under uncertainty. Before applying the methodology to the Mareógrafo 100 case study, the computational framework is first evaluated through a series of general simulations that illustrate its numerical behavior, decision logic, and economic response under representative operating conditions.
Gas production was estimated using the Arps decline model, while natural gas prices were simulated through the calibrated Schwartz type-I model with jumps, capturing both continuous price fluctuations and abrupt market shocks. The operational status of each well was represented by a discrete-time Markov chain with three possible states: operating, idle, and abandoned.
For each simulation path and time step, the economic performance of two alternative utilization strategies was evaluated: (i) pipeline gas commercialization and (ii) on-site electricity generation. Revenues and operating costs were computed for both alternatives, considering gas production, electricity conversion efficiency, market prices, transportation, compression, generation, and operating expenses. The optimal operating strategy was then selected by maximizing the expected economic return. Whenever both alternatives produced negative cash flows, the well was assigned to an idle or abandoned state according to the simplified Bellman decision rule.
In addition to the optimal operating policy, the framework estimated the corresponding electricity generation, power capacity, NPV distributions, abandonment probability, abandonment timing, and statistical indicators (mean, P5, P50, and P95). This computational implementation provides a quantitative basis for identifying the operating conditions under which on-site power generation becomes economically preferable to conventional pipeline commercialization or well abandonment.
Figure 1 presents the historical Henry Hub natural gas price series employed to calibrate the stochastic price model used throughout this study. The dataset spans nearly three decades and exhibits the characteristic features of natural gas markets, including periods of relative price stability interspersed with episodes of pronounced price spikes and abrupt downward corrections. These dynamics reflect the combined influence of supply–demand imbalances, extreme weather events, geopolitical factors, and market disruptions. The observed historical behavior provides strong motivation for adopting a mean-reverting jump-diffusion process rather than a purely diffusive price model. In particular, the occurrence of large but infrequent price movements supports the inclusion of a jump component within the Schwartz Type-I framework, enabling a more realistic representation of natural gas price uncertainty for the subsequent Monte Carlo simulations and economic optimization.
Figure 1.
Historical Henry Hub natural gas spot prices used to calibrate the Schwartz Type-I mean-reverting jump-diffusion model. The observed price spikes and periods of elevated volatility justify the incorporation of jump processes into the stochastic price dynamics (https://www.eia.gov/ accessed on 17 May 2026 [47]).
Figure 2 compares the mean operating profit obtained under conventional pipeline commercialization, on-site electricity generation, and the optimal operating policy determined through Bellman dynamic programming. The results reveal a clear economic advantage for distributed electricity generation over conventional pipeline gas sales throughout most of the productive life of the well. While pipeline commercialization approaches the break-even threshold relatively early as production declines, the electricity generation alternative maintains positive operating margins over a substantially longer period. The Bellman policy initially follows the economically superior operating alternative and progressively converges toward the break-even condition as reservoir depletion reduces the remaining economic value of the asset. This behavior reflects the sequential optimization process, whereby current operating decisions account not only for immediate profitability but also for the expected future value of the well under uncertain natural gas prices. Overall, the results demonstrate that integrating distributed electricity generation into the commercialization strategy substantially extends the economically productive life of marginal dry gas wells. The proposed stochastic decision-support framework therefore provides greater operational flexibility than conventional pipeline commercialization alone by dynamically adapting the operating policy to changing reservoir and market conditions.
Figure 2.
Mean daily operating profit for the pipeline, on-site power generation, and optimal commercialization strategies. As reservoir production declines, pipeline commercialization becomes economically unattractive sooner than on-site power generation, while the Bellman optimization adaptively selects the optimal operating strategy throughout the simulation horizon.
Sensitivity Analysis of OPEX Escalation Rate
A sensitivity analysis was performed to evaluate the robustness of the proposed utilization strategy under three annual OPEX escalation scenarios representative of marginal dry gas wells: low (0%), base (1%), and high (2%). These scenarios represent the limited maintenance philosophy typically adopted during salvage-value operation in mature fields.
Table 2 shows that the optimal utilization strategy is only marginally affected by reasonable variations in operating cost escalation. Across the three scenarios, the mean NPV decreases by less than 0.2%, while the P5, P50, and P95 percentiles remain nearly unchanged. Furthermore, pipeline commercialization yields negative mean NPVs under all escalation assumptions, whereas the power generation alternative consistently provides the highest economic return.
Table 2.
Sensitivity analysis of the optimal utilization strategy under alternative annual OPEX escalation assumptions.
These results indicate that the proposed strategy is robust to plausible increases in operating costs and that project profitability is governed primarily by production performance and natural gas price uncertainty rather than by OPEX escalation.
Figure 3 presents the temporal evolution of the optimal operating policy obtained from the Bellman dynamic programming optimization across all Monte Carlo trajectories. At the beginning of the simulation horizon, on-site electricity generation dominates the decision space, indicating that distributed power production provides the highest immediate economic return under the prevailing production and market conditions. Pipeline commercialization is selected only in a small fraction of the realizations, whereas temporary shut-in decisions remain relatively uncommon. As reservoir production declines, the proportion of realizations assigned to active operation decreases rapidly, while permanent abandonment progressively becomes the dominant operating decision. This transition reflects the reduction in the remaining economic value of the well as production and expected future revenues diminish, demonstrating the adaptive nature of the proposed stochastic decision-support framework, which continuously adjusts the operating policy according to reservoir depletion and natural gas price uncertainty. The progressive shift from active operation to abandonment identifies the finite economic life of the asset while maximizing its expected long-term economic value.
Figure 3.
Temporal evolution of the optimal operating policy obtained from the Bellman dynamic programming algorithm. The curves represent the fraction of Monte Carlo realizations assigned to each operating state. On-site power generation dominates the initial period, while all realizations transition to permanent abandonment within approximately two years as reservoir depletion renders continued operation uneconomic.
Figure 4 presents the probability distribution of the project Net Present Value (NPV) obtained from 10,000 Monte Carlo simulations under the optimal operating policy. The distribution exhibits a pronounced positive skew, indicating that although most realizations are concentrated around moderate NPV values, a smaller number of favorable market conditions generate substantially higher economic returns. The results show a broad range of economic outcomes driven by natural gas price uncertainty and reservoir depletion. The predominance of positive NPV realizations confirms the economic potential of the proposed hybrid commercialization strategy, while the long right-hand tail highlights the opportunity for significantly enhanced project value under favorable market conditions.
Figure 4.
Distribution of the project Net Present Value (NPV) under the optimal operating policy based on 10,000 Monte Carlo realizations. The right-skewed distribution indicates predominantly positive economic outcomes and significant upside potential under favorable natural gas price conditions.
4. Results
Having demonstrated the general behavior of the computational implementation, the methodology is now applied to the Mareógrafo 100 well in the Burgos Basin, Mexico. The following sections present the numerical results, including stochastic natural gas price simulations, economic performance, optimal operating policy, and project profitability under the proposed hybrid commercialization strategy.
4.1. Case Study
To demonstrate the practical applicability, a representative case study was developed using an actual mature dry gas field known as Mareógrafo located in China, Nuevo Leon, Mexico. The objective of the case study is to evaluate whether distributed power generation constitutes an economically attractive alternative to conventional natural gas commercialization through the existing gathering and pipeline infrastructure.
The case study incorporates actual field infrastructure, historical production information, realistic operating conditions, and commercially available power generation equipment. Consequently, the resulting economic analysis reflects engineering constraints commonly encountered during the late productive life of mature gas reservoirs.
The selected field already possesses natural gas gathering, compression, and dehydration facilities, allowing alternative commercialization strategies to be evaluated without requiring major investments in additional processing infrastructure. This characteristic makes the field particularly suitable for assessing hybrid operating strategies in which natural gas may simultaneously supply the conventional pipeline network and a distributed electricity generation system.
4.2. Field Description
The study was conducted using information from Contractual Area 12 Mareógrafo, located in the Burgos Basin of northeastern Mexico. The field was originally discovered by the Mareógrafo-1 exploration well in 2008 and currently contains multiple producing wells connected to a centralized gathering, compression, and gas dehydration system.
The surface facilities include gas gathering pipelines, liquid separation equipment, compression units, storage tanks, and a triethylene glycol (TEG) dehydration system designed to satisfy commercial gas quality specifications before delivery to the sales point. The dehydration facility consists of three contact towers (DHS-01, DHS-02, and DHS-03), providing a total dehydration capacity of approximately 100 MMscfd. Gas enters the dehydration train at pressures between approximately 850 and 950 psi and leaves the facility with a water content below the contractual specification of 7 lb/MMscf, typically achieving values close to 4 lb/MMscf.
The existing compression facilities provide an important advantage for the present study because they allow direct comparison between conventional gas commercialization through the pipeline network (Los Ramones) and distributed electricity generation without requiring significant additional investments in gas treatment infrastructure.
Figure 5 illustrates the general configuration of the Mareógrafo field and its production infrastructure.
Figure 5.
Natural gas processing infrastructure of the Mareógrafo Contract Area used in the case study. The existing gathering and processing facilities enable the evaluation of the proposed hybrid commercialization strategy by allowing natural gas to be directed either to the National Natural Gas Pipeline System or to on-site power generation [48].
4.3. Selected Well: Mareógrafo 100
According to the technical development plan approved by the Mexican National Hydrocarbons Commission (CNH), the Mareógrafo field is a mature dry-gas asset located in the Burgos Basin, and among the producing and candidate wells available within the contractual area, Mareógrafo 100 was selected [48]. Such document establishes that the well is currently classified as a shut-in well with production recovery potential through a major workover intervention. This operational status makes the well particularly appropriate for evaluating alternative commercialization strategies because future production decisions must simultaneously consider remaining reservoir potential, operating costs, and market conditions.
Mareógrafo 100 is identified as one of the wells proposed for major intervention, indicating the presence of economically recoverable gas volumes that may justify continued operation under favorable economic conditions. Consequently, the well represents a realistic example of the operational challenges commonly encountered in mature dry gas fields approaching the marginal production stage. An additional advantage is its proximity to the existing compression station. The wellhead is located approximately 100 m from the compression facilities, allowing conventional gas transportation to be maintained with minimal additional gathering infrastructure. This characteristic also allows a direct comparison between centralized gas commercialization and decentralized electricity generation under essentially identical field conditions.
Historical production data from Mareógrafo 100 were subsequently employed to calibrate the production decline model described in Section 2. The resulting decline curve constitutes the production basis for all stochastic economic simulations presented in this work.
Figure 6 presents the historical gas production profiles of the principal wells in the Mareógrafo field together with the decline curve models used to characterize production uncertainty and establish the production forecasts adopted in the economic simulations.
Figure 6.
Historical gas production profiles of the principal wells in the Mareógrafo field and the corresponding fitted decline curve models. The P10, P50, and P90 production forecasts provide the production inputs for the stochastic economic simulations and Bellman optimization [48].
It should be emphasized that the Mareógrafo 100 application constitutes a single-well case-study demonstration of the proposed decision-support framework rather than a broad field-scale validation. The case study is intended to demonstrate the complete implementation of the methodology using an actual mature dry gas well for which the production and infrastructure information required by the model was available. Extension of the validation to a larger population of marginal wells is currently constrained by the availability and confidentiality of field-level operational data. Accordingly, the quantitative results obtained for Mareógrafo 100 should not be interpreted as representative of all marginal dry gas wells in the Burgos Basin. Rather, they demonstrate the application of the framework to a specific asset, while broader validation across wells with different production histories, infrastructure configurations, and operating conditions remains an important direction for future work.
4.4. Hybrid Commercialization Configuration
The proposed methodology adopts a hybrid commercialization strategy in which the produced natural gas can be dynamically allocated between pipeline sales and on-site electricity generation. Rather than relying on a single commercialization pathway, the decision algorithm selects the most profitable allocation according to prevailing market conditions while preserving operational flexibility.
When natural gas prices favor conventional commercialization, production is directed to the existing pipeline infrastructure. Conversely, when electricity generation provides higher economic returns, part of the available gas is diverted to an on-site natural gas engine for power production and commercialization through the Mexican Wholesale Electricity Market (MEM). Whenever production is sufficient, both utilization pathways may operate simultaneously. By diversifying revenue sources, the proposed hybrid configuration reduces dependence on a single energy market and enhances the economic resilience of marginal dry gas wells under uncertain market conditions.
Figure 7 illustrates the dynamic gas allocation predicted by the proposed framework. During the early years of production, the gas required to operate the generating unit remains nearly constant at approximately 65 Mcf/d, while the remaining production is available for pipeline commercialization. As reservoir depletion progresses, the surplus gas gradually decreases until the total production approaches the minimum flow required to sustain power generation. Beyond this point, nearly all available gas is allocated to the generating unit, indicating the transition from simultaneous commercialization to power-priority operation. This behavior demonstrates the operational flexibility of the proposed hybrid strategy and its ability to maximize resource utilization throughout the productive life of the well.
Figure 7.
Hybrid natural gas allocation strategy adopted in the case study. Produced gas is preferentially allocated to on-site power generation, with surplus production delivered to the existing pipeline network. As production declines, the surplus gas available for pipeline commercialization is progressively reduced.
4.5. Power Generation Unit
Distributed electricity generation is performed using a commercially available lean-burn natural gas reciprocating engine selected according to the expected production capacity of Mareógrafo 100. According to the manufacturer specifications, the generating unit provides a nominal electrical output of approximately 237 kWe while operating on pipeline-quality natural gas.
The generator requires an average natural gas consumption of approximately 77 Nm3/h under nominal operating conditions, corresponding to approximately 0.065 MMscfd. Preliminary production estimates indicate that the expected production from Mareógrafo 100 is sufficient to continuously supply the generating unit while preserving the possibility of directing surplus gas production toward the existing pipeline infrastructure whenever economically advantageous.
The distributed generation unit is assumed to be installed approximately 10 m from the wellhead. This short fuel supply distance minimizes pressure losses and installation costs while reducing the need for additional gas transportation infrastructure. Electricity generated by the unit is assumed to be exported to the Mexican Wholesale Electricity Market under the prevailing market conditions considered in the simulation scenarios.
Only the technical parameters directly affecting the techno-economic model are incorporated into the present analysis. These include rated electrical capacity, generator efficiency, fuel consumption, electrical output, and operating characteristics required for the economic calculations.
The main technical specifications adopted for the simulation are summarized in Table 3.
Table 3.
Principal technical specifications of the natural gas reciprocating engine adopted in the case study.
4.6. Simulation Scenarios
The stochastic natural gas price process was calibrated using historical Henry Hub spot prices. Model parameters were estimated by fitting the Schwartz Type-I mean-reverting jump-diffusion process to the historical price series, yielding estimates for the mean-reversion rate, long-run equilibrium price, volatility, jump intensity, and jump size distribution. The calibrated model reproduces both the long-term mean-reverting behavior of natural gas prices and the occurrence of abrupt price movements associated with market disruptions. The resulting parameter estimates were subsequently employed to generate the stochastic price trajectories used in the Monte Carlo simulations and Bellman dynamic programming optimization. The calibrated parameters are summarized in Table 4.
Table 4.
Calibrated parameters of the Schwartz Type-I mean-reverting jump-diffusion model.
An out-of-sample rolling one-step validation (80% calibration and 20% validation) was performed to assess the predictive capability of the Schwartz Type I jump-diffusion model. The model yielded an MAE of 0.217 USD/MMBtu, an RMSE of 0.742 USD/MMBtu, and a MAPE of 5.47%. Furthermore, 77.2% of the observed Henry Hub prices were contained within the simulated P5–P95 prediction interval, indicating that the model adequately captures both short-term forecasting accuracy and the uncertainty associated with natural gas price dynamics.
Three electricity-price scenarios were considered to represent the economic conditions of the Mexican Wholesale Electricity Market (MEM). Low, base, and high scenarios of 0.075, 0.115, and 0.160 USD/kWh, respectively, were adopted based on representative Mexican electricity-market conditions [49]. Rather than introducing an additional stochastic process for electricity prices, these scenarios were used to isolate the influence of local electricity-market conditions on the economic attractiveness of distributed generation while preserving the stochastic representation of natural gas price uncertainty.
The base economic scenario assumes an annual operating expenditure escalation rate of 3.5%, representing the long-term inflationary behavior of operating costs. Additional sensitivity analyses are subsequently performed by varying natural gas prices, electricity prices, operating expenditure escalation, generator efficiency, and the distance between the wellhead and the compression facilities.
To improve the transparency and reproducibility of the economic evaluation, Table 5 summarizes the principal economic assumptions explicitly implemented in the Mareógrafo 100 case-study model. The reported values correspond to the base-case inputs used in the stochastic Bellman optimization, while electricity prices are represented through the Low, Base, and High MEM scenarios. Operating costs are expressed on a daily basis and are escalated annually according to the assumed OPEX escalation rate. Transportation cost corresponds to the reference well-to-compression distance and is subsequently adjusted through the distance-dependent scaling implemented in the model.
Table 5.
Principal economic assumptions implemented in the Mareógrafo 100 case-study evaluation.
Table 6 summarizes the simulation scenarios and environmental parameters considered in the case study, while Table 7 presents the corresponding economic results obtained under the environmentally adjusted optimization framework.
Table 6.
Simulation scenarios and environmental parameters considered for evaluating the proposed hybrid commercialization framework.
Table 7.
Economic performance of the environmentally adjusted commercialization strategies under the three electricity-market scenarios. P5, P50, and P95 denote the 5th, 50th, and 95th percentiles, respectively, of the Bellman-optimal NPV distribution.
The NPV metrics reported in Table 7 represent distinct commercialization policies. Pipeline NPV is the mean discounted project value obtained from conventional pipeline commercialization, whereas Hybrid NPV corresponds to the fixed hybrid strategy that prioritizes on-site electricity generation subject to generator capacity and engineering constraints, with surplus gas sold through the pipeline. Optimal NPV represents the mean project value obtained from the Bellman policy, which dynamically selects among the feasible pipeline, hybrid gas-to-power, idle, and abandonment actions by accounting for both current net benefits and expected continuation value. The P5, P50, and P95 values correspond exclusively to the 5th percentile, median, and 95th percentile of the Monte Carlo NPV distribution generated by the Bellman-optimal policy.
The results highlight the strong dependence of commercialization performance on electricity-market conditions. The fixed hybrid strategy yields a negative mean NPV of USD under the Low MEM scenario, but increases to USD 30,449 and USD 72,967 under the Base and High MEM scenarios, respectively. The Bellman-optimal policy yields corresponding mean NPVs of USD 25,096, USD 34,837, and USD 73,318. This progression confirms electricity price as a major determinant of the economic viability of on-site generation, while the negative P5 values across all three scenarios demonstrate that substantial downside risk persists despite the positive mean optimal NPV under Base and High MEM conditions.
The environmental extension uses a natural gas combustion emission factor of 53.06 kg CO2/MMBtu, an abandoned-well methane emission rate of 0.270 kg CH4/day/well, and a CH4 global warming potential of GWP100 = 28 [50]. A carbon shadow price of USD 50/t CO2-eq is adopted as a scenario assumption to monetize these environmental externalities within the Bellman objective. The methane emission rate is treated as a parameterizable case-study assumption because post-abandonment leakage is strongly dependent on well integrity and site-specific conditions, while the carbon shadow price represents an economic valuation parameter rather than an observed or regulated Mexican carbon price.
5. Discussion
This section presents the application of the proposed stochastic decision framework to the selected case study. The results are organized into four complementary analyses. First, the base-case simulation is presented to illustrate the dynamic behavior of the proposed optimization framework. Second, the economic performance of the alternative commercialization pathways is evaluated under stochastic natural gas prices. Third, the optimal operational policy obtained through Bellman dynamic programming is analyzed. Finally, a sensitivity analysis is performed to quantify the robustness of the proposed methodology under varying technical and economic conditions.
Unless otherwise indicated, all reported values correspond to the median results obtained from the Monte Carlo simulations, whereas uncertainty intervals are represented using the corresponding P5 and P95 percentiles.
5.1. Base Case
The base-case simulation represents the expected operating conditions of Mareógrafo 100 using the calibrated production-decline model, the stochastic natural-gas price model, and the hybrid commercialization strategy described in the previous section. Historical Henry Hub spot prices were used to calibrate the Schwartz Type-I mean-reverting jump-diffusion process, while the production forecast was obtained from the decline analysis of the Mareógrafo 100 production history. For each Monte Carlo realization, the Bellman dynamic programming algorithm evaluates the feasible operating alternatives at every decision period and determines the commercialization strategy that maximizes the expected economic value of the asset.
Because the stochastic gas-price model is subsequently used in a long-term investment and abandonment framework, its predictive performance was evaluated using both short-horizon and multi-step out-of-sample validation. To further assess calibration robustness, parameter stability was evaluated through an expanding-window analysis using the same estimation procedure applied to the stochastic price model. Five calibration windows were considered, all beginning on 3 February 1997 and progressively extending through 2010, 2014, 2018, 2022, and June 2026. In each window, jump events were identified from the log-price autoregressive residuals using the criterion , where denotes the standard deviation of the calibration residuals. The jump intensity was estimated from the annualized frequency of the identified events, while and were estimated from their corresponding residual magnitudes. Table 8 reports the resulting parameter estimates and provides an assessment of their sensitivity to the calibration sample.
Table 8.
Expanding-window stability of the calibrated Schwartz Type-I mean-reverting jump-diffusion parameters.
The expanding-window results indicate that the principal stochastic parameters remain within comparable ranges as the calibration sample is progressively extended. The diffusion volatility remains between approximately 0.57 and 0.67, while the estimated jump intensity ranges from 4.18 to 5.10 events per year. The proportion of observations classified as jumps is also relatively stable, ranging from 1.66% to 2.02%. Greater temporal variation is observed in the mean-reversion coefficient and in the jump-size parameters, particularly , whose sign changes in the complete sample. This behavior indicates that the frequency and average direction of extreme price movements are more sample-dependent than the underlying diffusion component. Overall, the expanding-window experiment supports reasonable parameter stability while also explicitly identifying the jump component as the principal source of calibration sensitivity.
Figure 8a presents the rolling one-step validation, in which model parameters were recursively re-estimated as new observations became available. The resulting MAE and RMSE were 0.2171 and 0.7418 USD/MMBtu, respectively, while the MAPE was 5.47%. Approximately 77.46% of the observed Henry Hub prices were contained within the simulated P5–P95 interval. These results confirm that the calibrated process reproduces short-term price movements with relatively low forecast error while retaining the stochastic dispersion associated with volatility and jump events.
Figure 8.
Out-of-sample validation of the calibrated Schwartz Type-I mean-reverting jump-diffusion natural-gas price model. (a) Rolling one-step validation with recursive parameter updating, showing observed Henry Hub prices, the forecast mean, and the P5–P95 prediction interval. (b) Fixed-origin multi-step scenario validation over the complete out-of-sample period, in which the model is calibrated only through 14 July 2020 and simulated forward without subsequent re-estimation. The comparison illustrates the increase in point-forecast error with horizon while preserving broad probabilistic coverage of realized prices.
To evaluate the model under a more demanding long-horizon condition, Figure 8b shows a fixed-origin multi-step validation. In this case, the model was calibrated only once using information available through 14 July 2020 and was subsequently simulated over the complete 985-business-day validation horizon without re-estimation or updating from observed validation prices. As expected, point-forecast errors increased with the forecast horizon: the full-horizon MAE and RMSE reached 1.4663 and 1.9644 USD/MMBtu, respectively, with a MAPE of 44.90%. However, the P5–P95 interval contained 89.64% of the observed prices, indicating that although the conditional mean forecast becomes progressively less accurate over long horizons, the stochastic scenario envelope continues to represent the realized market variability with substantially greater coverage.
The horizon-dependent results further support this interpretation. For the first 20 business days, the multi-step forecast produced an MAE of 0.1376 USD/MMBtu, an RMSE of 0.1921 USD/MMBtu, and 100% P5–P95 coverage. At 60 business days, the corresponding values were 0.3093 and 0.4087 USD/MMBtu, with 100% coverage. At 120 business days, the MAE increased to 0.6700 USD/MMBtu and the P5–P95 coverage remained 95%, while over 252 business days the MAE was 0.9561 USD/MMBtu and coverage remained approximately 96.83%. These results demonstrate the expected deterioration in point-prediction accuracy with increasing horizon while showing that the probabilistic scenario range remains comparatively robust over investment-relevant time scales.
This distinction is particularly important for the present decision framework. The stochastic price model is not used as a deterministic long-term price forecast; rather, it generates probabilistic price scenarios that are propagated through the Monte Carlo and Bellman optimization. Therefore, the long-horizon performance is evaluated primarily in terms of its ability to preserve realistic price dispersion and uncertainty coverage rather than its ability to reproduce the exact future spot-price path. The multi-step validation consequently provides additional support for using the calibrated Schwartz Type-I jump-diffusion process as a stochastic input to the long-term economic decision-support framework, while also making explicit the increasing uncertainty associated with point forecasts at extended horizons.
The use of Henry Hub as the reference series for natural-gas price uncertainty also requires consideration of its applicability to a Mexican field and electricity-market context. In the present framework, Henry Hub is not assumed to reproduce the exact local realization price received by a producer in the Burgos Basin. Rather, it is employed as a liquid and historically extensive benchmark for characterizing the stochastic behavior of the underlying natural-gas commodity, including mean reversion, volatility, and discontinuous price movements. The Mexican market context is incorporated separately through the electricity-price scenarios representative of the Wholesale Electricity Market (MEM), together with the case-specific production, operating, transportation, compression, and infrastructure parameters used in the economic evaluation. This separation allows commodity-price uncertainty and local commercialization conditions to be represented independently within the decision framework. Nevertheless, differences between Henry Hub and the actual regional price available to a Mexican producer introduce basis risk arising from transportation constraints, regional supply–demand conditions, contractual arrangements, and local market differentials. Consequently, the Henry Hub-based stochastic process should be interpreted as a reference price-risk model rather than an exact forecast of the realized Burgos Basin gas price. Where reliable regional price histories or contractual indexation data are available, the framework can be recalibrated directly to the corresponding Mexican price series or extended by incorporating an explicit stochastic basis differential. Accordingly, the present implementation preserves the long-term stochastic characteristics of natural-gas price uncertainty while treating the local Mexican market and MEM conditions through separate case-specific economic inputs.
Figure 9 illustrates the effect of incorporating the load-dependent efficiency correction into the on-site power-generation model. The constant-efficiency and load-corrected power curves remain practically coincident throughout most of the 10-year simulation horizon because gas production remains above the rated fuel requirement of the generating unit. Mareógrafo 100 initially produces 250 Mcf/d, approximately 3.83 times the 65.26 Mcf/d required for rated generator operation, allowing the unit to maintain full-load efficiency during most of the production decline. Partial-load operation begins only after approximately 9.53 years, when the available gas production falls below the rated fuel requirement. Beyond this threshold, the load-dependent formulation produces a slight reduction in generator efficiency from its rated value of 30%, accompanied by a correspondingly small reduction in electrical output. Consequently, the load-efficiency correction has a negligible effect on the economic results for the present case study, since the mean Bellman abandonment time of approximately 200 days occurs substantially earlier than the onset of partial-load operation. Nevertheless, incorporating the correction improves the generality of the framework by allowing generator performance to respond dynamically to production decline in applications where gas availability falls below the rated fuel requirement during the economically active life of the well.
Figure 9.
Effect of load-dependent generator efficiency on average net electrical power over the 10-year simulation horizon. The constant-efficiency and load-corrected formulations remain practically coincident until the partial-load threshold is reached at approximately 9.53 years.
The minimum stable operating-load constraint introduced in Equations (26)–(28) was also evaluated for the Mareógrafo 100 case study to ensure that the hybrid optimization does not select on-site power generation below the technically admissible operating range. A minimum stable load factor of was imposed, corresponding to a minimum gas requirement of 32.63 Mcf/d for the 237-kWe generating unit, compared with its rated fuel requirement of 65.26 Mcf/d. The simulated production trajectory does not fall below this minimum stable gas requirement within the 10-year analysis horizon. Consequently, the constraint is non-binding for the present case study: the environmentally adjusted mean optimal NPV remains unchanged at USD 34,836.68 with and without the constraint, while the mean optimal abandonment time remains approximately 200.1 days. These results confirm that the optimized gas allocation does not rely on operation below the minimum stable load of the generating unit and that the reported economic performance is therefore consistent with the imposed engineering feasibility constraint.
5.2. Economic Performance
The economic performance of the proposed commercialization framework was evaluated by comparing conventional pipeline gas sales with the proposed hybrid commercialization strategy.
For every simulated realization, daily revenues, operating expenditures, electricity sales, and cumulative discounted cash flows were computed over the entire production horizon. The stochastic simulation therefore captures the combined influence of production decline, natural gas price uncertainty, and market-dependent commercialization decisions.
Figure 10 compares the mean daily cash flow obtained under the pipeline-only and environmentally adjusted hybrid commercialization strategies when both alternatives are evaluated under the same stochastic operational transitions and abandonment conditions. During the initial operating period, the hybrid strategy generally provides higher positive cash flows than conventional pipeline commercialization, reflecting the additional value obtained from on-site electricity generation and surplus gas sales. As production declines and an increasing fraction of the simulated trajectories transitions to permanent abandonment, the mean cash flows of both strategies decrease rapidly and converge toward zero. After approximately four years, economic activity becomes negligible because most simulated trajectories have entered the absorbing abandoned state.
Figure 10.
Evolution of the mean daily cash flow for the pipeline, hybrid, and optimal commercialization strategies. The hybrid strategy consistently yields higher cash flows than conventional pipeline commercialization, whereas the optimal operating policy maximizes long-term economic performance throughout the simulation horizon.
Figure 11 compares the cumulative discounted cash flow obtained under the pipeline-only and environmentally adjusted hybrid commercialization strategies when both alternatives are evaluated under the same stochastic operational transitions, abandonment conditions, and life-cycle cost boundary. The hybrid strategy consistently generates a higher cumulative economic value throughout the project horizon, reaching a maximum of approximately USD 31–32 thousand compared with about USD 26–27 thousand for pipeline commercialization. Most of the economic value is accumulated during the first two years, after which the curves gradually decline and stabilize as an increasing fraction of the simulated trajectories reaches the abandoned state. These results confirm that the hybrid configuration preserves an economic advantage even after environmental costs and abandonment liabilities are consistently incorporated into the analysis.
Figure 11.
Evolution of the cumulative discounted cash flow for the pipeline, hybrid, and optimal commercialization strategies. The hybrid strategy improves long-term economic performance relative to pipeline commercialization, whereas the optimal operating policy achieves the highest cumulative discounted cash flow.
The probabilistic distribution of the optimal project NPV is presented in Figure 12, where the median, P5, and P95 values illustrate the economic uncertainty associated with future market conditions.
Figure 12.
Probability distribution of the optimal project Net Present Value (NPV) obtained from 10,000 Monte Carlo simulations. The mean, median (P50), and P5–P95 percentiles summarize the expected economic performance and uncertainty of the proposed hybrid commercialization strategy.
Under the Base MEM scenario, the environmentally adjusted Bellman policy yields a mean project NPV of approximately USD 34,837. The corresponding P5, P50, and P95 values are approximately USD , USD 1400, and USD 258,440, respectively. The wide dispersion of the NPV distribution reflects the combined influence of stochastic natural gas prices, production decline, operational-state transitions, abandonment liabilities, and environmental costs. Although the expected NPV remains positive, the negative P5 indicates material downside risk, while the high P95 demonstrates substantial upside potential under favorable market conditions. The median NPV remains slightly positive, indicating that project profitability is highly sensitive to the realized market and operating trajectory.
The mean abandonment time under the Base MEM scenario is approximately 200 days (0.55 years), indicating that the economic value of continued operation is concentrated primarily in the early stage of the simulated project horizon.
Figure 13 presents the optimal profitability surface as a function of natural gas price and gas production rate, including explicit decision boundaries and NPV contour lines. The revised representation quantifies the transitions among pipeline commercialization, power generation, and abandonment rather than identifying only qualitative decision regions. The Pipeline/Power boundary shifts toward higher gas prices as production increases, whereas the Pipeline/Abandonment boundary moves toward lower gas prices at higher production rates. These trends demonstrate that the optimal commercialization decision depends jointly on market price and remaining well productivity. The projected boundary contours further identify the critical price-production combinations at which the preferred strategy changes.
Figure 13.
Optimal profitability surface for marginal dry gas wells as a function of Henry Hub natural gas price and gas production rate. Decision boundaries between pipeline commercialization, power generation, and abandonment are shown together with projected critical contours and constant-NPV lines.
To quantitatively characterize the decision boundaries identified in Figure 13, Table 9 reports the critical natural gas prices at which the optimal strategy transitions between pipeline commercialization and power generation, and between pipeline commercialization and abandonment, for representative gas production rates across the evaluated range.
Table 9.
Critical gas-price thresholds separating pipeline commercialization, power generation, and abandonment at selected gas production rates.
The critical thresholds reported in Table 9 quantify the decision boundaries illustrated in Figure 13. The Pipeline/Power threshold increases with production rate, from approximately 4.96 USD/MMBtu at 50 Mcf/d to about 7.50 USD/MMBtu at 1500 Mcf/d, indicating that progressively higher gas prices are required for conventional pipeline commercialization to dominate power generation as available production increases. In contrast, the Pipeline/Abandonment threshold decreases from approximately 2.55 USD/MMBtu at 50 Mcf/d to about 1.26 USD/MMBtu at 1500 Mcf/d, reflecting the greater ability of higher production rates to support continued pipeline operation at lower gas prices. The corresponding Power/Abandonment boundary is governed primarily by production rather than gas price in the present formulation, with a critical production threshold of approximately 31.1 Mcf/d. Because this value lies below the 50–1500 Mcf/d range represented in Figure 13, no gas-price-dependent Power/Abandonment crossing occurs within the plotted domain.
To further evaluate the robustness of the economic results, power-generation capital expenditure and fiscal effects were explicitly incorporated into the Bellman framework under the Base MEM scenario. The installed power-generation CAPEX was estimated at USD 296,000, comprising USD 200,000 for the approximately 250-kW generating unit, together with installation and commissioning, interconnection, and civil/peripheral costs estimated at 8%, 18%, and 22% of the equipment cost, respectively. A 30% income-tax rate and straight-line depreciation of 10% annually over 10 years were also considered, while no royalty or subsoil-use fee was applicable to the present project. Using the same 2000 Monte Carlo price realizations, the mean optimal NPV decreased from USD 34,478 in the current formulation to USD 24,936 when the irreversible power-generation CAPEX was introduced. Importantly, the Bellman policy endogenously responded to this investment requirement by reducing the probability of genset installation to zero; consequently, the CAPEX is not actually incurred along the resulting optimal trajectories, and the policy shifts toward pipeline commercialization and abandonment. When the fiscal terms were additionally incorporated, the mean optimal NPV decreased to USD , the median NPV to USD −30,294, and the probability of a positive NPV to 34.85%. An extended CAPEX sensitivity analysis further showed that genset installation occurred in 79.1% of trajectories when CAPEX was zero, with a mean installation time of approximately 35.5 days, whereas no installation occurred from the first tested positive CAPEX level of USD 25,000 onward. Thus, the installation threshold is bracketed between USD 0 and USD 25,000 for the present Base MEM case, substantially below the USD 296,000 engineering screening estimate. These results demonstrate that capital and fiscal terms affect not only project valuation but also the endogenous commercialization strategy selected by the Bellman framework. Such findings are shown in Table 10.
Table 10.
Effect of power-generation CAPEX and fiscal terms on the Bellman-optimal economic performance under the Base MEM scenario.
The results demonstrate the economic impact of introducing distributed electricity generation as a complementary commercialization pathway for mature dry gas wells. Rather than replacing conventional gas sales, the hybrid strategy increases operational flexibility and allows operators to exploit favorable electricity market conditions whenever they provide greater economic value than direct gas commercialization.
5.3. Decision Policy
One of the main contributions of the proposed methodology is the determination of the optimal operating policy through Bellman dynamic programming.
Instead of selecting a commercialization pathway exclusively on the basis of instantaneous revenues, the proposed decision framework evaluates the expected future economic value associated with each feasible operating alternative. Temporary reductions in profitability do not necessarily imply production shutdown or permanent abandonment if future economic recovery remains economically attractive.
Figure 14 shows the evolution of the optimal operational decisions obtained from the environmentally adjusted Bellman dynamic programming framework. During the initial production period, the optimal policy distributes the economically active trajectories primarily between pipeline commercialization and hybrid power generation, while the idle state remains marginal. As production declines, the share of active commercialization strategies decreases rapidly and permanent abandonment becomes progressively dominant. The mean abandonment time obtained across the Monte Carlo realizations is approximately 200 days (0.55 years), although a progressively smaller fraction of trajectories remains economically active beyond this period.
Figure 14.
Evolution of the optimal operating policy under the proposed stochastic decision-support framework. The probability of each operating state evolves throughout the simulation horizon, illustrating the transition between pipeline commercialization, on-site power generation, temporary shut-in, and permanent abandonment as production declines.
The resulting decision policy demonstrates that mature gas wells should not be evaluated using static economic criteria alone. Instead, commercialization decisions should continuously adapt to evolving production conditions and market uncertainty in order to maximize the long-term economic value of the asset.
5.4. Sensitivity Analysis
The robustness of the proposed decision framework was evaluated incorporating a sensitivity analysis considering the principal technical and economic variables affecting mature gas field operation.
Five independent parameters were investigated:
- 1.
- Natural gas price.
- 2.
- Electricity selling price.
- 3.
- Annual operating expenditure escalation.
- 4.
- Generator electrical efficiency.
- 5.
- Distance between the wellhead and the existing compression station.
The influence of natural gas prices was evaluated by modifying the stochastic price trajectories while maintaining identical production forecasts. Electricity market uncertainty was represented through deterministic low-, base-, and high-price scenarios representative of the Mexican Wholesale Electricity Market. Operating expenditure escalation was analyzed using alternative inflation scenarios to evaluate long-term cost uncertainty.
Generator efficiency was varied within the expected operating range reported by the manufacturer to quantify the influence of conversion efficiency on project profitability. Finally, the distance between the wellhead and the compression facilities was modified to evaluate the effect of gathering infrastructure on the economic competitiveness of both commercialization pathways.
Figure 15 summarizes the one-at-a-time sensitivity of the environmentally adjusted optimal NPV to the principal technical and economic parameters. Electricity price is the dominant individual driver of project profitability, producing an NPV range of approximately USD 48,221 across the evaluated scenarios. Natural gas price constitutes the second most influential variable, with an NPV range of approximately USD 41,277, followed by pipeline distance, which produces a variation of approximately USD 27,755. In comparison, OPEX escalation has a substantially smaller effect, with an NPV range of only USD 2267, while variations in generator efficiency produce no observable change in the optimal NPV within the evaluated range. These results indicate that the economic performance of the environmentally adjusted framework is governed primarily by energy-market conditions and infrastructure configuration, whereas moderate variations in operating costs and generator efficiency exert a comparatively limited influence on project value. The three dominant variables identified through this one-at-a-time analysis—electricity price, natural gas price, and pipeline distance—were therefore selected for the subsequent multi-factor interactive sensitivity analysis.
Figure 15.
Sensitivity of the environmentally adjusted optimal NPV to the principal economic, infrastructure, and technical parameters.
The numerical results corresponding to the one-at-a-time sensitivity analysis are summarized in Table 11.
Table 11.
One-at-a-time sensitivity analysis of the principal economic and operational variables.
The negligible sensitivity of optimal NPV to generator efficiency within the evaluated range is a case-specific result rather than an indication that conversion efficiency is generally irrelevant to gas-to-power economics. For Mareógrafo 100, gas production remains sufficiently above the generator fuel requirement during the economically relevant operating period for the unit to operate at or near rated load. The load-dependent efficiency correction becomes active only after approximately 9.53 years, substantially later than the mean Bellman-optimal abandonment time of approximately 200 days. Consequently, variations in generator efficiency do not materially affect gas allocation or optimal NPV before abandonment. The observed zero sensitivity therefore results from the production trajectory, generator sizing, and optimal abandonment timing, rather than from a fixed-fuel assumption or computational limitation.
Overall, the one-at-a-time sensitivity analysis identifies electricity price as the dominant profitability driver, followed by natural gas price and pipeline distance, whereas OPEX escalation and generator efficiency have comparatively minor effects within the evaluated ranges. To account explicitly for interactions among the dominant variables, electricity price, natural gas price, and pipeline distance were subsequently varied simultaneously. Electricity prices from 0.075 to 0.160 USD/kWh were combined with natural gas price multipliers from 0.70 to 1.30 and pipeline distances of 50, 100, and 200 m, producing a factorial design comprising 147 parameter combinations. For each combination, the environmentally adjusted Bellman optimization was re-evaluated using 1000 common Monte Carlo natural gas price trajectories, thereby isolating interaction effects while preserving identical stochastic realizations across scenarios.
Taken together, the one-at-a-time and multi-factor analyses demonstrate that electricity price, natural gas price, and pipeline distance are the principal coupled determinants of economic viability. Favorable combinations generate substantial positive project value, whereas low energy prices combined with greater infrastructure requirements can produce negative optimal NPV. The multi-factor analysis therefore extends the individual sensitivity ranking by identifying the multidimensional economic viability boundary within which continued commercialization remains preferable to abandonment.
Figure 16 reveals a pronounced coupled influence of electricity price, natural gas price, and pipeline distance on project profitability. Optimal NPV increases jointly with electricity price and natural gas price, whereas increasing the distance to the existing compression infrastructure shifts the profitability surface downward. Importantly, the non-uniform displacement of the NPV surface demonstrates that these variables do not affect project value in isolation; rather, the economic effect of one variable depends on the simultaneous values of the others. The interaction is particularly important under unfavorable market conditions. At an electricity price of 0.075 USD/kWh and a gas-price multiplier of 0.70, a pipeline distance of 200 m results in the lowest mean optimal NPV of approximately USD −27,985. Conversely, the combination of an electricity price of 0.160 USD/kWh, a gas-price multiplier of 1.30, and a pipeline distance of 50 m produces the highest mean optimal NPV of approximately USD 125,278.
Figure 16.
Interactive sensitivity of the environmentally adjusted optimal NPV to electricity price, natural gas price, and pipeline distance. The three panels represent pipeline distances of 50, 100, and 200 m, respectively. Dashed contours indicate the zero-NPV boundary separating economically favorable and unfavorable parameter combinations.
The zero-NPV boundaries shown in Figure 16 further demonstrate the interaction among these variables. At relatively low natural gas and electricity prices, increasing pipeline distance expands the region of negative project value, indicating that adverse market conditions and infrastructure requirements reinforce one another rather than acting independently. Conversely, higher electricity or natural gas prices progressively compensate for the economic penalty associated with longer pipeline distances. Thus, the multi-factor analysis confirms that project profitability cannot be fully characterized by isolated parameter variations and that the economic viability boundary depends on the simultaneous configuration of market and infrastructure conditions.
To provide a quantitative summary of the interaction patterns illustrated in Figure 16, Table 12 reports the minimum, maximum, and mean optimal NPV obtained across the combined electricity- and natural-gas-price scenarios for each pipeline distance. The results show a progressive deterioration in overall project value as the distance to the existing compression infrastructure increases, while also highlighting the substantial economic range produced by the simultaneous variation of market conditions.
Table 12.
Summary of the multi-factor interactive sensitivity analysis for different pipeline distances.
Taken together, the one-at-a-time and multi-factor sensitivity analyses show that electricity price, natural gas price, and pipeline distance constitute the dominant coupled determinants of economic viability. Although favorable conditions can generate substantial positive project value, combinations of low energy prices and greater infrastructure requirements can result in negative optimal NPV. The proposed Bellman framework therefore provides not only a ranking of individual sensitivity drivers but also a means of identifying the multidimensional economic viability boundary within which continued commercialization remains preferable to abandonment.
5.5. Environmental Emissions Under the Optimal Policy
The environmental extension of the Bellman framework accounts for direct CO2 emissions from on-site natural gas combustion and potential CH4 emissions following well abandonment, with methane expressed in CO2-equivalent terms. Figure 17 presents the cumulative evolution of both components under the environmentally adjusted optimal policy.
Figure 17.
Cumulative CO2-equivalent emissions under the environmentally adjusted optimal policy, including direct CO2 emissions from on-site natural gas combustion and potential post-abandonment CH4 emissions over the 10-year project horizon.
Cumulative emissions from on-site power generation increase rapidly during the initial operating period and subsequently stabilize at approximately 506 t CO2-eq as the share of active generation progressively decreases and the optimal policy transitions toward abandonment. In contrast, post-abandonment CH4 emissions accumulate throughout the project horizon, reaching approximately 26 t CO2-eq after 10 years. Although substantially lower than combustion-related emissions in the present case, their continued accumulation demonstrates that permanent abandonment does not eliminate environmental externalities.
Internalizing these emissions within the Bellman objective produces a material effect on project valuation. Under the Base MEM scenario and the adopted environmental valuation assumptions, the mean optimal NPV decreases from USD 65,288.71 in the economic-only formulation to USD 34,836.68 after environmental costs are incorporated, corresponding to a reduction of approximately 46.6%. Nevertheless, the environmentally adjusted expected NPV remains positive, indicating that the optimal commercialization strategy preserves economic value after explicitly accounting for the considered environmental externalities.
To explicitly compare the environmental implications of the alternative commercialization strategies, cumulative site-level emissions were evaluated under a common system boundary. Downstream combustion associated with pipeline sales remains outside this boundary, whereas direct CO2 emissions from on-site natural-gas combustion and potential post-abandonment CH4 emissions are included. Immediate abandonment results in 27.602 tCO2e of potential post-abandonment methane emissions over the analysis horizon. Continued operation under the pipeline-only, fixed-hybrid, and Bellman-optimal policies reduces this component to 26.089 tCO2e, corresponding to 1.513 tCO2e of avoided methane emissions relative to immediate abandonment. However, this methane benefit does not translate into a reduction in total site-level emissions for the gas-to-power alternatives because natural-gas combustion produces additional direct CO2. The fixed-hybrid policy generates 713.733 tCO2e of combustion emissions and 739.822 tCO2e in total, whereas the Bellman-optimal policy reduces these values to 506.063 and 532.152 tCO2e, respectively, by limiting exposure to on-site generation. Accordingly, relative to the pipeline-only policy, the fixed-hybrid and Bellman-optimal strategies increase emissions within the adopted site-level boundary by 713.733 and 506.063 tCO2e, respectively. These results therefore show that the environmental contribution of continued operation in the present case is specifically associated with delaying potential post-abandonment methane emissions rather than with an overall reduction in site-level greenhouse-gas emissions. A broader comparison incorporating displaced grid electricity or downstream combustion of pipeline-sold gas would require an expanded life-cycle system boundary and is outside the scope of the present analysis. Such findings are reported in Table 13.
Table 13.
Comparison of cumulative site-level greenhouse-gas emissions among the evaluated commercialization strategies.
5.6. Production-Decline Uncertainty and Joint Economic Propagation
To quantify the uncertainty associated with the production-decline model and evaluate its propagation into the economic optimization, the historical production record of Mareógrafo 100 was independently analyzed using the Arps decline formulation introduced in Section 3. The available production dataset comprises 122 dated observations spanning from 16 September 2009 to 16 October 2019. Comparison between the reported daily production rates and those reconstructed from the corresponding monthly production and operating days yielded an RMSE of 0.002815 MMcf/d and an MAE of 0.002394 MMcf/d, confirming the internal consistency of the production data.
Because the complete production history contains early-time behavior that is not representative of the mature decline regime considered in the economic analysis, the decline interval was identified from the historical record before estimating the Arps parameters. The selected mature-production interval extends from 16 November 2011 to 16 October 2019 and contains 94 positive production observations. Nonlinear least-squares fitting of the Arps model over this interval resulted in an initial rate of MMcf/d, an initial decline rate of yr−1, and an Arps exponent of . The fitted value of b lies effectively at the exponential-decline limit of the Arps formulation, indicating that the mature production history is most consistently represented by an approximately exponential decline. Importantly, the independently estimated decline rate is nearly identical to the value yr−1 adopted in the original case-study parameterization, providing an empirical consistency check for the production decline assumption used in the economic model.
The mature-regime fit produced and adjusted , with an RMSE of 0.1728 MMcf/d and an MAE of 0.1331 MMcf/d. These statistics indicate a moderate explanatory fit, consistent with the operational variability observed around the long-term decline trend. The conventional percentage error is less informative for this production series because rates approaching zero strongly amplify percentage deviations; therefore, RMSE and MAE are used as the principal absolute-error measures for evaluating the mature-well decline fit.
Parameter uncertainty was quantified using 1000 residual-bootstrap realizations of the mature-regime Arps fit. The resulting 95% bootstrap intervals are reported in Table 14. The median bootstrap decline rate was 0.1808 yr−1, again closely reproducing the 0.18 yr−1 value used in the deterministic case-study formulation. Although the central estimate of b remains at the exponential-decline limit, the upper bootstrap bound indicates that alternative hyperbolic decline trajectories remain statistically plausible. Consequently, rather than treating the fitted production decline as deterministic, the bootstrap parameter realizations were propagated through the subsequent stochastic economic analysis.
Table 14.
Arps decline parameters and uncertainty estimated from the mature production regime of Mareógrafo 100.
For joint uncertainty propagation, the historical fitted value of was not directly substituted for the initial production rate of the economic case study because these quantities refer to different temporal reference points. The fitted MMcf/d corresponds to the beginning of the selected historical mature-decline interval in November 2011, whereas the economic simulation is initialized at the case-study production rate of 250 Mcf/d. Accordingly, each bootstrap realization was normalized to Mcf/d while retaining its sampled decline parameters and . The resulting production trajectories were therefore generated as
with the exponential limiting form applied when . This normalization preserves the initial operating condition of the case study while propagating the uncertainty identified from the historical decline behavior.
Production uncertainty was then propagated jointly with stochastic natural-gas price uncertainty by pairing each production realization with a corresponding Schwartz Type-I price realization . A common subset of 1000 Monte Carlo price trajectories was used for both the price-only benchmark and the joint production–price experiment. Using identical stochastic price realizations in both cases isolates the incremental economic effect associated specifically with production-decline uncertainty. For each paired realization, the complete environmentally adjusted Bellman optimization was re-evaluated, including the load-dependent generator efficiency, minimum stable-load constraint, environmental externalities, and abandonment decision.
Figure 18 illustrates both the production uncertainty obtained from the mature-regime bootstrap and its subsequent propagation into the economic optimization. The P5–P95 production envelope in Figure 18a progressively widens with forecast time, reflecting increasing uncertainty in the remaining production trajectory as the effects of the sampled and b parameters accumulate. The deterministic base decline remains close to the central region of the probabilistic forecast, consistent with the close agreement between the original yr−1 assumption and the independently calibrated bootstrap median of 0.1808 yr−1.
Figure 18.
Propagation of production-decline uncertainty into the stochastic economic evaluation of Mareógrafo 100. (a) P5–P95 uncertainty envelope and P50 production trajectory obtained from 1000 mature-regime Arps bootstrap realizations, compared with the deterministic base decline. (b) Optimal-NPV distributions obtained using the same 1000 natural-gas price trajectories under price uncertainty alone and under joint production-and-price uncertainty.
Figure 18b shows the corresponding optimal-NPV distributions. When only natural-gas price uncertainty is considered over the common 1000-path subset, the environmentally adjusted optimal policy yields a mean NPV of USD 41,778.79, with P5, P50, and P95 values of USD , USD 9148.43, and USD 268,595.84, respectively. After simultaneously propagating production and price uncertainty, the mean optimal NPV decreases to USD 40,505.76, while the corresponding P5, P50, and P95 values become USD , USD 8093.89, and USD 262,260.43, respectively. The mean optimal abandonment time remains unchanged at approximately 209.3 days.
The corresponding economic effects are summarized quantitatively in Table 15. Because the two cases use identical natural-gas price realizations, the difference between them represents the incremental effect of production-decline uncertainty rather than differences arising from Monte Carlo sampling.
Table 15.
Effect of production-decline uncertainty on the environmentally adjusted optimal economic results under the Base MEM scenario. Both cases use the same 1000 natural-gas price trajectories.
The inclusion of production-decline uncertainty reduces the mean optimal NPV by approximately USD 1273, equivalent to 3.05% relative to the price-only benchmark evaluated using the same Monte Carlo trajectories. The median NPV decreases by approximately USD 1055, while the P95 value decreases by approximately USD 6335. In contrast, the lower-tail P5 value changes by less than USD 14 and the mean optimal abandonment time remains unchanged. These results indicate that production uncertainty affects the magnitude and dispersion of the recoverable economic value but does not materially alter the timing of the optimal abandonment decision for the Mareógrafo 100 case.
More importantly, the joint analysis demonstrates that the economic uncertainty associated with stochastic energy prices remains substantially larger than the incremental uncertainty introduced by the production-decline model in this particular application. Nevertheless, explicitly propagating the bootstrap production trajectories prevents the economic optimization from relying on a single deterministic production forecast and provides a more complete representation of uncertainty near the economic limit of the well. These results should be interpreted as specific to the Mareógrafo 100 single-well demonstration rather than as evidence that production uncertainty is generally secondary for all marginal gas wells. Wells exhibiting stronger production instability, shorter decline histories, or greater uncertainty in decline parameters may show a substantially larger economic response to production uncertainty.
5.7. Limitations
Although the proposed framework provides an integrated representation of production decline, stochastic natural gas prices, hybrid commercialization, environmental externalities, and sequential operating decisions, several limitations should be considered when interpreting the results.
First, the empirical application is based on a single marginal dry gas well, Mareógrafo 100, and should therefore be interpreted as a single-well demonstration of the proposed decision-support framework rather than as a basin-wide validation. The production history available for this well enables calibration and uncertainty propagation of the decline model, but geological, production, infrastructure, and cost characteristics may differ substantially among wells. Consequently, application to other assets in the Burgos Basin or to other mature gas basins requires case-specific recalibration and validation using local production and facility data.
Second, natural gas price uncertainty and electricity-market conditions are treated differently in the present implementation. Natural gas prices are represented stochastically through the calibrated Schwartz Type-I mean-reverting jump-diffusion process, whereas electricity prices are represented through deterministic Low, Base, and High MEM scenarios. This approach allows the influence of electricity-market conditions to be examined systematically but does not reproduce the temporal volatility, price spikes, congestion effects, or nodal dynamics of the Mexican Wholesale Electricity Market. Future applications should therefore incorporate stochastic or historical nodal electricity-price processes when sufficiently representative data are available.
Third, Henry Hub is used as the stochastic commodity-price benchmark for natural gas rather than as a direct representation of the realized local gas price at the wellhead. Although it provides a transparent and liquid reference for modeling natural gas price uncertainty, differences in transportation, regional supply-demand conditions, contractual arrangements, and local market structure may generate a basis between Henry Hub and the effective Mexican field-level gas price. The resulting basis risk is not modeled as an independent stochastic process in the present formulation and should be incorporated in future basin- or asset-specific applications when reliable local price series are available.
Fourth, the operational representation necessarily simplifies some aspects of field implementation. The framework incorporates generator capacity, load-dependent efficiency, minimum stable load, pipeline distance, compression, idle operation, and irreversible abandonment; however, detailed equipment start-up and shutdown dynamics, minimum up/down times, equipment degradation, maintenance outages, gas-quality variations, pressure constraints, electrical interconnection limitations, and other site-specific process constraints are not explicitly modeled. These factors could be incorporated as additional state variables or feasibility constraints when applying the framework to detailed engineering design or real-time operational optimization.
Fifth, the economic and environmental parameters adopted in the case study are scenario-specific inputs rather than universally applicable values. Transportation and operating costs, environmental liabilities, carbon valuation, abandonment costs, fiscal conditions, and infrastructure requirements may vary among operators and fields. Accordingly, the numerical NPV and abandonment results reported for Mareógrafo 100 should not be interpreted as directly transferable to other wells. The principal transferable contribution of this study is the stochastic decision architecture itself, whose parameters can be recalibrated to alternative geological, market, regulatory, environmental, and infrastructure conditions.
These limitations define the scope of the present study while also identifying the principal directions for further development. Multi-well validation, stochastic MEM electricity-price modeling, explicit regional gas-basis dynamics, and higher-fidelity operational constraints constitute natural extensions toward basin-scale and field-deployment applications of the proposed framework.
The decision space considered in the present framework is intentionally restricted to pipeline commercialization, on-site gas-to-power conversion, temporary idling, and abandonment, and should not be interpreted as an exhaustive representation of all technically possible gas-utilization pathways. Alternative routes include small-scale LNG, gas-to-methanol conversion, and gas reinjection. However, their applicability to an individual marginal dry-gas well depends on additional scale, infrastructure, processing, reservoir, and economic requirements that are not represented by the available single-well data. LNG requires gas conditioning, liquefaction, storage, and transport infrastructure; methanol production introduces reforming, synthesis, and product-processing requirements; and reinjection requires reservoir pressure, injectivity, compression, and injection-well information. Including these alternatives in the Bellman decision space without their corresponding technical and economic data would therefore introduce unsupported assumptions. Accordingly, pipeline and modular on-site generation were selected as the two active commercialization pathways evaluated in the present demonstration, while the extension of the decision space to LNG, methanol, reinjection, and other utilization technologies is identified as an important direction for future field-specific applications of the framework (Table 16).
Table 16.
Scope of gas-utilization alternatives considered in the present framework and potential extensions.
5.8. Cross-Validation Against Least-Squares Monte Carlo
To evaluate whether the results obtained from the Bellman dynamic programming formulation depend materially on the selected optimization algorithm, an independent cross-validation was performed using a Least-Squares Monte Carlo (LSMC) approach based on the Longstaff–Schwartz regression principle. The comparison was conducted under the Base MEM scenario using identical stochastic natural-gas price realizations, production assumptions, environmental costs, engineering constraints, discounting assumptions, Markov transition probabilities, and random realizations of the operational-state transitions. Consequently, differences between the two solutions can be attributed to the optimization method rather than to differences in stochastic sampling.
The LSMC implementation extends the conventional Longstaff–Schwartz continuation-value approximation to the multi-action decision structure used in this study. At each decision stage, the expected continuation values were estimated through least-squares regression using a third-order polynomial basis of the normalized logarithmic natural-gas price state. The resulting continuation values were then combined with the current action-specific net benefits to evaluate the same feasible alternatives considered by the Bellman formulation: pipeline commercialization, hybrid gas-to-power commercialization, temporary idling, and permanent abandonment. Both algorithms were evaluated using a common set of 2000 Monte Carlo trajectories over the 10-year project horizon.
Table 17 compares the principal economic and computational results obtained from the two optimization approaches.
Table 17.
Comparison between Bellman dynamic programming and Least-Squares Monte Carlo optimization under the Base MEM scenario using identical stochastic realizations.
The two optimization methods produce identical economic results for the common Monte Carlo experiment. The mean optimal NPV is USD 37,745 under both approaches, while the corresponding P5, P50, and P95 values are USD , USD , and USD 277,670, respectively. The probability of obtaining a positive NPV is 48.7% in both cases, and the mean and median abandonment times are also identical at approximately 200.5 and 134.5 days, respectively. Thus, no economically significant difference is observed between the Bellman and LSMC solutions when both methods are evaluated under identical stochastic and operational conditions.
The agreement extends beyond aggregate NPV statistics to the realized operating policy. Bellman DP and LSMC allocate approximately 1.60% of the simulated decision-time observations to pipeline commercialization, 3.92% to hybrid gas-to-power operation, and 94.48% to the abandoned state, while neither method selects temporary idling in the realized forward simulation. The absence of differences in these action shares indicates that both approaches identify the same decision boundaries for the present case study.
The principal difference between the two methods is computational rather than economic. Bellman dynamic programming required approximately 1.73 s for the optimization, compared with 3.90 s for the regression-based LSMC solution, making the Bellman implementation approximately 2.25 times faster under the common computational experiment. This difference arises because LSMC requires repeated least-squares estimation of continuation values at each decision stage, whereas the Bellman implementation directly performs the backward recursion over the discretized operational state space.
These results should therefore not be interpreted as evidence that Bellman dynamic programming universally produces a higher economic value than LSMC. Rather, the independent LSMC benchmark reproduces the same optimal-policy distribution and operating decisions, providing a cross-validation of the dynamic optimization results. For the relatively low-dimensional state space of the present marginal-well problem, Bellman dynamic programming offers the same economic solution with lower computational cost. LSMC may nevertheless become advantageous in extensions involving substantially higher-dimensional continuous state spaces, for which explicit dynamic-programming representations may become computationally burdensome.
6. Conclusions
This study demonstrates that integrating production decline forecasting, stochastic natural gas price modeling, Monte Carlo simulation, Bellman dynamic programming, and hybrid gas commercialization provides an effective decision-support framework for the management of marginal dry gas wells under uncertain market conditions. Rolling one-step validation of the calibrated Schwartz Type-I mean-reverting jump-diffusion model yielded a MAPE of 5.47%, confirming that the proposed stochastic price model adequately reproduces Henry Hub price dynamics for long-term techno-economic evaluations.
Application of the framework to the Mareógrafo 100 case study demonstrated the economic advantage of combining on-site electricity generation with conventional pipeline commercialization. Under the Base MEM scenario, the environmentally adjusted pipeline-only and hybrid strategies yielded mean NPVs of approximately USD 25.3 thousand and USD 30.4 thousand, respectively, whereas the Bellman optimal policy increased the expected NPV to approximately USD 34.8 thousand. The optimization dynamically selected among the feasible operating alternatives as production and market conditions evolved, with a mean abandonment time of approximately 200 days (0.55 years), indicating that most of the remaining economic value of the marginal well is concentrated in its early operating period.
The stochastic analysis also revealed substantial economic uncertainty. Under the Base MEM scenario, the environmentally adjusted optimal policy produced a mean NPV of approximately USD 34.8 thousand and a median of only USD 1.4 thousand, with P5 and P95 values of approximately USD thousand and USD 258.4 thousand, respectively. The negative lower percentile demonstrates material downside risk, whereas the substantially higher upper percentile indicates considerable upside potential under favorable market realizations. This asymmetric distribution emphasizes the importance of explicitly incorporating stochastic price behavior and sequential decision-making when evaluating marginal assets operating near their economic limit.
The environmental extension further demonstrated that incorporating action-specific externalities can materially affect asset valuation and optimal decision-making. Under the Base MEM scenario, cumulative emissions associated with on-site natural gas combustion reached approximately 506 t CO2-eq, while potential post-abandonment methane emissions accumulated to approximately 26 t CO2-eq over the 10-year horizon. Under the adopted environmental valuation assumptions, internalizing these externalities reduced the mean optimal NPV from approximately USD 65.3 thousand in the economic-only formulation to USD 34.8 thousand, corresponding to a reduction of approximately 46.6%. Nevertheless, the environmentally adjusted expected NPV remained positive, demonstrating that economic value can still be preserved while explicitly incorporating the considered environmental externalities into the optimization criterion.
Sensitivity analysis identified electricity price as the dominant profitability driver, followed by natural gas price and distance to the existing pipeline infrastructure, whereas OPEX escalation and generator efficiency exhibited comparatively smaller effects within the evaluated ranges. The transition of the hybrid strategy from a negative mean NPV of approximately USD thousand under the Low MEM scenario to positive values of approximately USD 30.4 thousand and USD 73.0 thousand under the Base and High MEM scenarios, respectively, further demonstrates the critical influence of electricity market conditions on the viability of on-site power generation. Importantly, this hierarchy of economic drivers persists after environmental externalities and abandonment liabilities are incorporated.
From a theoretical and methodological perspective, the principal contribution of this study lies in the integration of production decline, stochastic energy prices, sequential operating decisions, hybrid gas-to-power commercialization, engineering feasibility constraints, and parameterizable environmental externalities within a unified Bellman optimization framework. Unlike fixed techno-economic comparisons, the proposed formulation treats commercialization and abandonment as sequential decisions whose optimality can change as production and market conditions evolve. The framework therefore provides a generalizable methodology for quantifying the remaining economic value of a marginal dry gas asset while explicitly representing uncertainty, operational constraints, and the environmental consequences associated with alternative decisions.
From a practical engineering perspective, the Mareógrafo 100 results indicate that implementation should focus primarily on variables that materially affect the operating decision rather than on marginal improvements in parameters with limited economic influence. Electricity selling price, natural gas price, and distance to existing compression infrastructure should therefore be evaluated before committing capital to on-site generation. For the conditions analyzed, the environmentally adjusted Bellman policy yields a mean optimal NPV of approximately USD 34.8 thousand and an optimal mean abandonment time of only approximately 200 days, indicating a relatively narrow economic window for extracting the remaining value of the well. Generator operation is technically feasible throughout this relevant operating period: the imposed 50% minimum stable-load constraint corresponds to 32.63 Mcf/d and remains non-binding over the analyzed horizon. Consequently, investment and operating decisions for comparable marginal wells should be based on integrated production, market, infrastructure, and environmental screening rather than on production rate alone.
As an additional methodological validation, the Bellman dynamic programming solution was cross-validated against an independent Least-Squares Monte Carlo (LSMC) implementation based on the Longstaff–Schwartz regression principle. Using identical stochastic realizations and operating assumptions, both methods produced the same economic and operational solution, with a mean optimal NPV of USD 37.7 thousand, P5, P50, and P95 values of approximately USD thousand, USD thousand, and USD 277.7 thousand, respectively, and a mean abandonment time of approximately 200.5 days. The realized operating-action shares were also identical, providing independent cross-validation of the Bellman-optimal policy. However, Bellman dynamic programming required approximately 1.73 s compared with 3.90 s for LSMC, indicating that, for the relatively low-dimensional state space considered in this study, the Bellman formulation reproduces the same optimal solution with lower computational cost. This result does not imply universal superiority of Bellman dynamic programming, as regression-based Monte Carlo methods may become advantageous for higher-dimensional extensions of the decision problem.
For practical application in the Burgos Basin, the quantitative findings reported for Mareógrafo 100 should be interpreted as a single-well demonstration and should not be generalized directly to the broader population of marginal dry gas wells in the Burgos Basin. Although the mathematical and computational framework is transferable through case-specific recalibration, broader validation requires application to additional wells with different decline behavior, infrastructure configurations, market exposure, and operating constraints. Such multi-well validation constitutes an important direction for future research as additional field-level operational data become available to support a staged well-screening procedure. Marginal dry gas wells should first be ranked according to remaining production potential and proximity to existing gathering and compression infrastructure, followed by evaluation of the locally attainable electricity price and expected natural gas price conditions. Wells located close to existing infrastructure retain greater flexibility for pipeline commercialization, whereas on-site generation becomes progressively more attractive as electricity prices increase. Conversely, combinations of low electricity and natural gas prices and greater pipeline distances can produce negative project value, as demonstrated by the multi-factor sensitivity analysis, and should trigger early evaluation of idling or abandonment rather than continued operation by default. For candidate gas-to-power projects, generator capacity should be matched to the declining well deliverability and operation restricted to the technically admissible load range. Finally, abandonment decisions should incorporate potential post-abandonment methane emissions and site-specific well-integrity information whenever available. Accordingly, the proposed framework is not intended to prescribe a single commercialization strategy for all Burgos Basin marginal wells, but to provide a repeatable engineering procedure for identifying which wells should remain connected to pipeline infrastructure, transition to on-site power generation, or proceed toward abandonment as their technical and economic conditions evolve.
Author Contributions
Conceptualization, O.G.A.-M., R.V.-M., J.R.R.-V. and D.A.-T.; methodology, O.G.A.-M. and R.V.-M.; software, O.G.A.-M. and J.V.-Á.; validation, O.G.A.-M., R.V.-M. and J.V.-Á.; formal analysis, O.G.A.-M. and J.V.-Á.; investigation, O.G.A.-M. and E.M.-S.; resources, O.G.A.-M. and J.R.R.-V.; data curation, O.G.A.-M., E.M.-S., J.V.-Á., R.V.-M., J.R.R.-V. and D.A.-T.; writing—original draft preparation, O.G.A.-M.; writing—review and editing, O.G.A.-M., J.V.-Á., R.V.-M. and D.A.-T.; visualization, R.V.-M. and J.V.-Á.; supervision, E.M.-S. and R.V.-M.; project administration, O.G.A.-M.; funding acquisition, O.G.A.-M. and J.R.R.-V. All authors have read and agreed to the published version of the manuscript.
Funding
This research received no external funding.
Data Availability Statement
The data presented in this study are available on request from the corresponding author. The data are not publicly available due to confidentiality obligations under Non-Disclosure Agreements (NDAs).
Acknowledgments
Alvarado gratefully acknowledges the support provided by the Secretaría de Ciencia, Humanidades, Tecnología e Innovación (SECIHTI) through a research scholarship. Daniel Aguilar-Torres acknowledges the support of SECIHTI for the postdoctoral fellowship (CVU: 829790) at CICATA-Querétaro of the IPN. Special thanks are extended to Hector Manuel Bernal Ramirez for his valuable contributions to the conceptual development of this work, as well as for his technical guidance throughout its development.
Conflicts of Interest
The authors declare no conflict of interest.
References
- Fetkovich, M.J. Decline Curve Analysis Using Type Curves. J. Pet. Technol. 1980, 32, 1065–1077. [Google Scholar] [CrossRef] [Scilit]
- Hyne, N.J. Nontechnical Guide to Petroleum Geology, Exploration, Drilling and Production, 3rd ed.; PennWell Corporation: Tulsa, OK, USA, 2012. [Google Scholar]
- U.S. Energy Information Administration. U.S. Oil and Natural Gas Wells by Production Rate. 2025. Available online: https://www.eia.gov/petroleum/wells/ (accessed on 26 June 2026).
- Brito, T.; Galvão, C.; Fonseca, A.; Costa, H.; Moutinho dos Santos, E. A review of gas-to-wire (GtW) projects worldwide: State-of-art and developments. Energy Policy 2022, 163, 112859. [Google Scholar] [CrossRef] [Scilit]
- Khalilpour, R.; Karimi, I. Evaluation of utilization alternatives for stranded natural gas. Energy 2012, 40, 317–328. [Google Scholar] [CrossRef] [Scilit]
- Ojijiagwo, E.; Oduoza, C.F.; Emekwuru, N. Economics of gas to wire technology applied in gas flare management. Eng. Sci. Technol. Int. J. 2016, 19, 2109–2118. [Google Scholar] [CrossRef] [Scilit]
- Kerunwa, A.; Toochukwu Ekwueme, S.; Julian Obibuike, U. Utilization of Stranded Associated Flare Gases for Electricity Generation in Situ Through Gas-to-Wire in the Niger Delta. Int. J. Oil Gas Coal Eng. 2020, 8, 28. [Google Scholar] [CrossRef] [Scilit]
- Lima Mota de, L.; Santos Baleeiro, D.; Peixoto Cortez, B. Gas to Wire as an Alternative to Natural Gas Monetization of the Pre-Salt Province in Brazil. In Proceedings of the Offshore Technology Conference Brasil, Rio de Janeiro, Brazil, 28 October 2019. [Google Scholar] [CrossRef] [Scilit]
- Milão, R.d.F.D.; de Medeiros, J.L.; Interlenghi, S.F.; Araújo, O.d.Q.F. Low-emission Gas-to-Wire with thermodynamic efficiency: Monetization of carbon dioxide rich natural gas from offshore fields. Gas Sci. Eng. 2023, 115, 205021. [Google Scholar] [CrossRef] [Scilit]
- Emerson, D.F.; Al Ghatta, A.; Woolston, B.M.; Fay, A.; Kumar, A.; Stephanopoulos, G. Theoretical analysis of natural gas recovery from marginal wells with a deep well reactor. AIChE J. 2017, 63, 3642–3650. [Google Scholar] [CrossRef] [Scilit]
- Kaiser, M.J. Marginal production in the Gulf of Mexico—I. Historical statistics & model framework. Appl. Energy 2010, 87, 2535–2550. [Google Scholar] [CrossRef] [Scilit]
- Kaiser, M.J.; Yu, Y. Marginal production in the Gulf of Mexico – II. Model results. Appl. Energy 2010, 87, 2526–2534. [Google Scholar] [CrossRef] [Scilit]
- Caulk, R.A.; Tomac, I. Reuse of abandoned oil and gas wells for geothermal energy production. Renew. Energy 2017, 112, 388–397. [Google Scholar] [CrossRef] [Scilit]
- Davis, A.P.; Michaelides, E.E. Geothermal power production from abandoned oil wells. Energy 2009, 34, 866–872. [Google Scholar] [CrossRef] [Scilit]
- Wight, N.; Bennett, N. Geothermal energy from abandoned oil and gas wells using water in combination with a closed wellbore. Appl. Therm. Eng. 2015, 89, 908–915. [Google Scholar] [CrossRef] [Scilit]
- Kurnia, J.C.; Shatri, M.S.; Putra, Z.A.; Zaini, J.; Caesarendra, W.; Sasmito, A.P. Geothermal energy extraction using abandoned oil and gas wells:Techno-economicand policy review. Int. J. Energy Res. 2021, 46, 28–60. [Google Scholar] [CrossRef] [Scilit]
- Nassan, T.; Baganz, D.; Alkan, H.; Amro, M. Reuse of Abandoned Hydrocarbon Wells and Reservoirs for Geothermal Energy. In Proceedings of the International Petroleum Technology Conference, Dhahran, Saudi Arabia, 12 February 2024. [Google Scholar] [CrossRef] [Scilit]
- Jello, J.; Baser, T. Utilization of existing hydrocarbon wells for geothermal system development: A review. Appl. Energy 2023, 348, 121456. [Google Scholar] [CrossRef] [Scilit]
- Boutot, J.; Kang, M. Renewable energy production potential of abandoned and orphaned oil and gas wells and sites. Environ. Res. Lett. 2025, 20, 054037. [Google Scholar] [CrossRef] [Scilit]
- Kang, M.; Boutot, J.; McVay, R.C.; Roberts, K.A.; Jasechko, S.; Perrone, D.; Wen, T.; Lackey, G.; Raimi, D.; Digiulio, D.C.; et al. Environmental risks and opportunities of orphaned oil and gas wells in the United States. Environ. Res. Lett. 2023, 18, 074012. [Google Scholar] [CrossRef] [Scilit]
- Boutot, J.; Peltz, A.S.; McVay, R.; Kang, M. Documented Orphaned Oil and Gas Wells Across the United States. Environ. Sci. Technol. 2022, 56, 14228–14236. [Google Scholar] [CrossRef] [Scilit] [PubMed]
- Raimi, D.; Krupnick, A.J.; Shah, J.S.; Thompson, A. Decommissioning Orphaned and Abandoned Oil and Gas Wells: New Estimates and Cost Drivers. Environ. Sci. Technol. 2021, 55, 10224–10230. [Google Scholar] [CrossRef] [Scilit] [PubMed]
- Kang, M.; Mauzerall, D.L.; Ma, D.Z.; Celia, M.A. Reducing methane emissions from abandoned oil and gas wells: Strategies and costs. Energy Policy 2019, 132, 594–601. [Google Scholar] [CrossRef] [Scilit]
- Kang, M.; Kanno, C.M.; Reid, M.C.; Zhang, X.; Mauzerall, D.L.; Celia, M.A.; Chen, Y.; Onstott, T.C. Direct measurements of methane emissions from abandoned oil and gas wells in Pennsylvania. Proc. Natl. Acad. Sci. USA 2014, 111, 18173–18177. [Google Scholar] [CrossRef] [Scilit] [PubMed]
- Deighton, J.A.; Townsend-Small, A.; Sturmer, S.J.; Hoschouer, J.; Heldman, L. Measurements show that marginal wells are a disproportionate source of methane relative to production. J. Air Waste Manag. Assoc. 2020, 70, 1030–1042. [Google Scholar] [CrossRef] [Scilit] [PubMed]
- Vogt, J.; Laforest, J.; Argento, M.; Kennedy, S.; Bourlon, E.; Lavoie, M.; Risk, D. Active and inactive oil and gas sites contribute to methane emissions in western Saskatchewan, Canada. Elem. Sci. Anthr. 2022, 10, 00014. [Google Scholar] [CrossRef] [Scilit]
- Pekney, N.J.; Diehl, J.R.; Ruehl, D.; Sams, J.; Veloski, G.; Patel, A.; Schmidt, C.; Card, T. Measurement of methane emissions from abandoned oil and gas wells in Hillman State Park, Pennsylvania. Carbon Manag. 2018, 9, 165–175. [Google Scholar] [CrossRef] [Scilit]
- Riddick, S.N.; Mauzerall, D.L.; Celia, M.A.; Kang, M.; Bressler, K.; Chu, C.; Gum, C.D. Measuring methane emissions from abandoned and active oil and gas wells in West Virginia. Sci. Total Environ. 2019, 651, 1849–1856. [Google Scholar] [CrossRef] [Scilit] [PubMed]
- Gianoutsos, N.J.; Haase, K.B.; Birdwell, J.E. Geologic sources and well integrity impact methane emissions from orphaned and abandoned oil and gas wells. Sci. Total Environ. 2024, 912, 169584. [Google Scholar] [CrossRef] [Scilit] [PubMed]
- Riddick, S.N.; Mbua, M.; Santos, A.; Emerson, E.W.; Cheptonui, F.; Houlihan, C.; Hodshire, A.L.; Anand, A.; Hartzell, W.; Zimmerle, D.J. Methane emissions from abandoned oil and gas wells in Colorado. Sci. Total Environ. 2024, 922, 170990. [Google Scholar] [CrossRef] [Scilit] [PubMed]
- Saint-Vincent, P.M.B.; Reeder, M.D.; Sams, J.I.; Pekney, N.J. An Analysis of Abandoned Oil Well Characteristics Affecting Methane Emissions Estimates in the Cherokee Platform in Eastern Oklahoma. Geophys. Res. Lett. 2020, 47, e2020GL089663. [Google Scholar] [CrossRef] [Scilit]
- Alsubaih, A.; Sepehrnoori, K.; Delshad, M. Environmental Impacts of Orphaned and Abandoned Wells: Methane Emissions, and Implications for Carbon Storage. Appl. Sci. 2024, 14, 11518. [Google Scholar] [CrossRef] [Scilit]
- Passalacqua, H.; Turki I Alsaba, M. Energy Transitions: An Academia Take on Shaping the Future Professionals of Oil and Gas. In Proceedings of the SPE Annual Technical Conference and Exhibition, Virtual, 19 October 2020. [Google Scholar] [CrossRef] [Scilit]
- Yan, J.; Zhou, N.; Cheng, Y.; Zhang, F.; Wang, H.; Wang, M.; Jin, B.; Li, M.; Lu, Q.; Zhang, W. Application of machine-vision-driven physics-informed neural networks in pantograph–catenary system state detection. Mech. Syst. Signal Process. 2026, 257, 114577. [Google Scholar] [CrossRef] [Scilit]
- Interstate Oil and Gas Compact Commission. Marginal Wells: Fueling America’s Economy; Technical report; Interstate Oil and Gas Compact Commission: Oklahoma City, OK, USA, 2016. [Google Scholar]
- United States Congress. 26 U.S. Code § 613A—Limitations with Respect to Percentage Depletion for Oil and Gas Wells; Defines Stripper Gas Production for Tax Purposes Under U.S. Federal Tax Legislation; Legal Information Institute, Cornell Law School: Ithaca, NY, USA, 2024; Available online: https://www.law.cornell.edu/uscode/text/26/613A (accessed on 6 July 2026).
- Arps, J.J. Analysis of Decline Curves. Trans. AIME 1945, 160, 228–247. [Google Scholar] [CrossRef] [Scilit]
- Frau, C.; Fanelli, V. Seasonality in Commodity Prices: New Approaches for Pricing and Calibration. Ann. Oper. Res. 2024, 336, 1089–1131. [Google Scholar] [CrossRef] [Scilit]
- Rotondi, F. Seasonality and Spikes in the Natural Gas Market. Energy Econ. 2025, 148, 108586. [Google Scholar] [CrossRef] [Scilit]
- Schwartz, E.S. The Stochastic Behavior of Commodity Prices: Implications for Valuation and Hedging. J. Financ. 1997, 52, 923–973. [Google Scholar] [CrossRef]
- Dias, M.A.G.; Rocha, K. Petroleum Concessions with Extendible Options: Investment Timing and Value Using Mean Reversion and Jump Processes for Oil Prices. In Proceedings of the 3rd Annual International Conference on Real Options, Wassenaar, The Netherlands, 6–8 June 1999. [Google Scholar]
- Puterman, M.L. Markov Decision Processes: Discrete Stochastic Dynamic Programming, 2nd ed.; John Wiley & Sons: Hoboken, NJ, USA, 2014. [Google Scholar]
- Menon, E.S. Gas Pipeline Hydraulics; CRC Press: Boca Raton, FL, USA, 2005. [Google Scholar]
- Çengel, Y.A.; Boles, M.A. Thermodynamics: An Engineering Approach, 9th ed.; McGraw-Hill Education: New York, NY, USA, 2019. [Google Scholar]
- Powell, W.B. Reinforcement Learning and Stochastic Optimization: A Unified Framework for Sequential Decisions; John Wiley & Sons: Hoboken, NJ, USA, 2022. [Google Scholar]
- Caterpillar Inc. G3520 Gas Engine Technical Data; Technical Report EM4299-04; Natural Gas Generator Performance Data at 50%, 75%, and 100% Load; Genset Efficiencies Reported According to ISO 3046/1; Caterpillar Inc.: Irving, TX, USA, 2021. [Google Scholar]
- U.S. Energy Information Administration. Henry Hub Natural Gas Spot Price. 2025. Available online: https://www.eia.gov/ (accessed on 17 May 2026).
- Comisión Nacional de Hidrocarburos. Dictamen Técnico de la Modificación al Plan de Desarrollo para la Extracción de Hidrocarburos: Contrato CNH-R01-L03-A12/2015, Grupo Mareógrafo, S.A. de C.V; Technical Report; Technical Opinion on the Modification of the Hydrocarbon Extraction Development Plan; Comisión Nacional de Hidrocarburos (CNH): Ciudad de México, México, 2022. [Google Scholar]
- Centro Nacional de Control de Energía (CENACE). Diccionario de Datos Abiertos del Mercado Eléctrico de Corto Plazo; Information on Local Marginal Prices (PML) in the Mexican Wholesale Electricity Market (MEM); Centro Nacional de Control de Energía (CENACE): Mexico City, Mexico, 2023; Available online: https://www.cenace.gob.mx/Docs/Cenace/Documentos/DatosAbiertos/DICCIONARIO/Diccionario_Datos_Abiertos_CENACE_MECP.pdf (accessed on 8 August 2026).
- U.S. Environmental Protection Agency. GHG Emission Factors Hub; Technical report; Emission Factors for Greenhouse Gas Inventories, Including Stationary Combustion and Global Warming Potentials; U.S. Environmental Protection Agency: Washington, DC, USA, 2025.
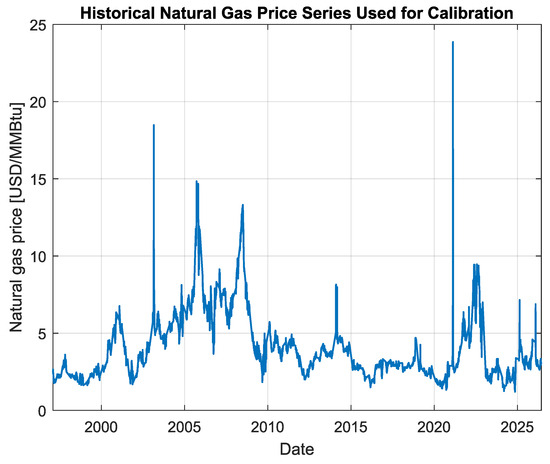
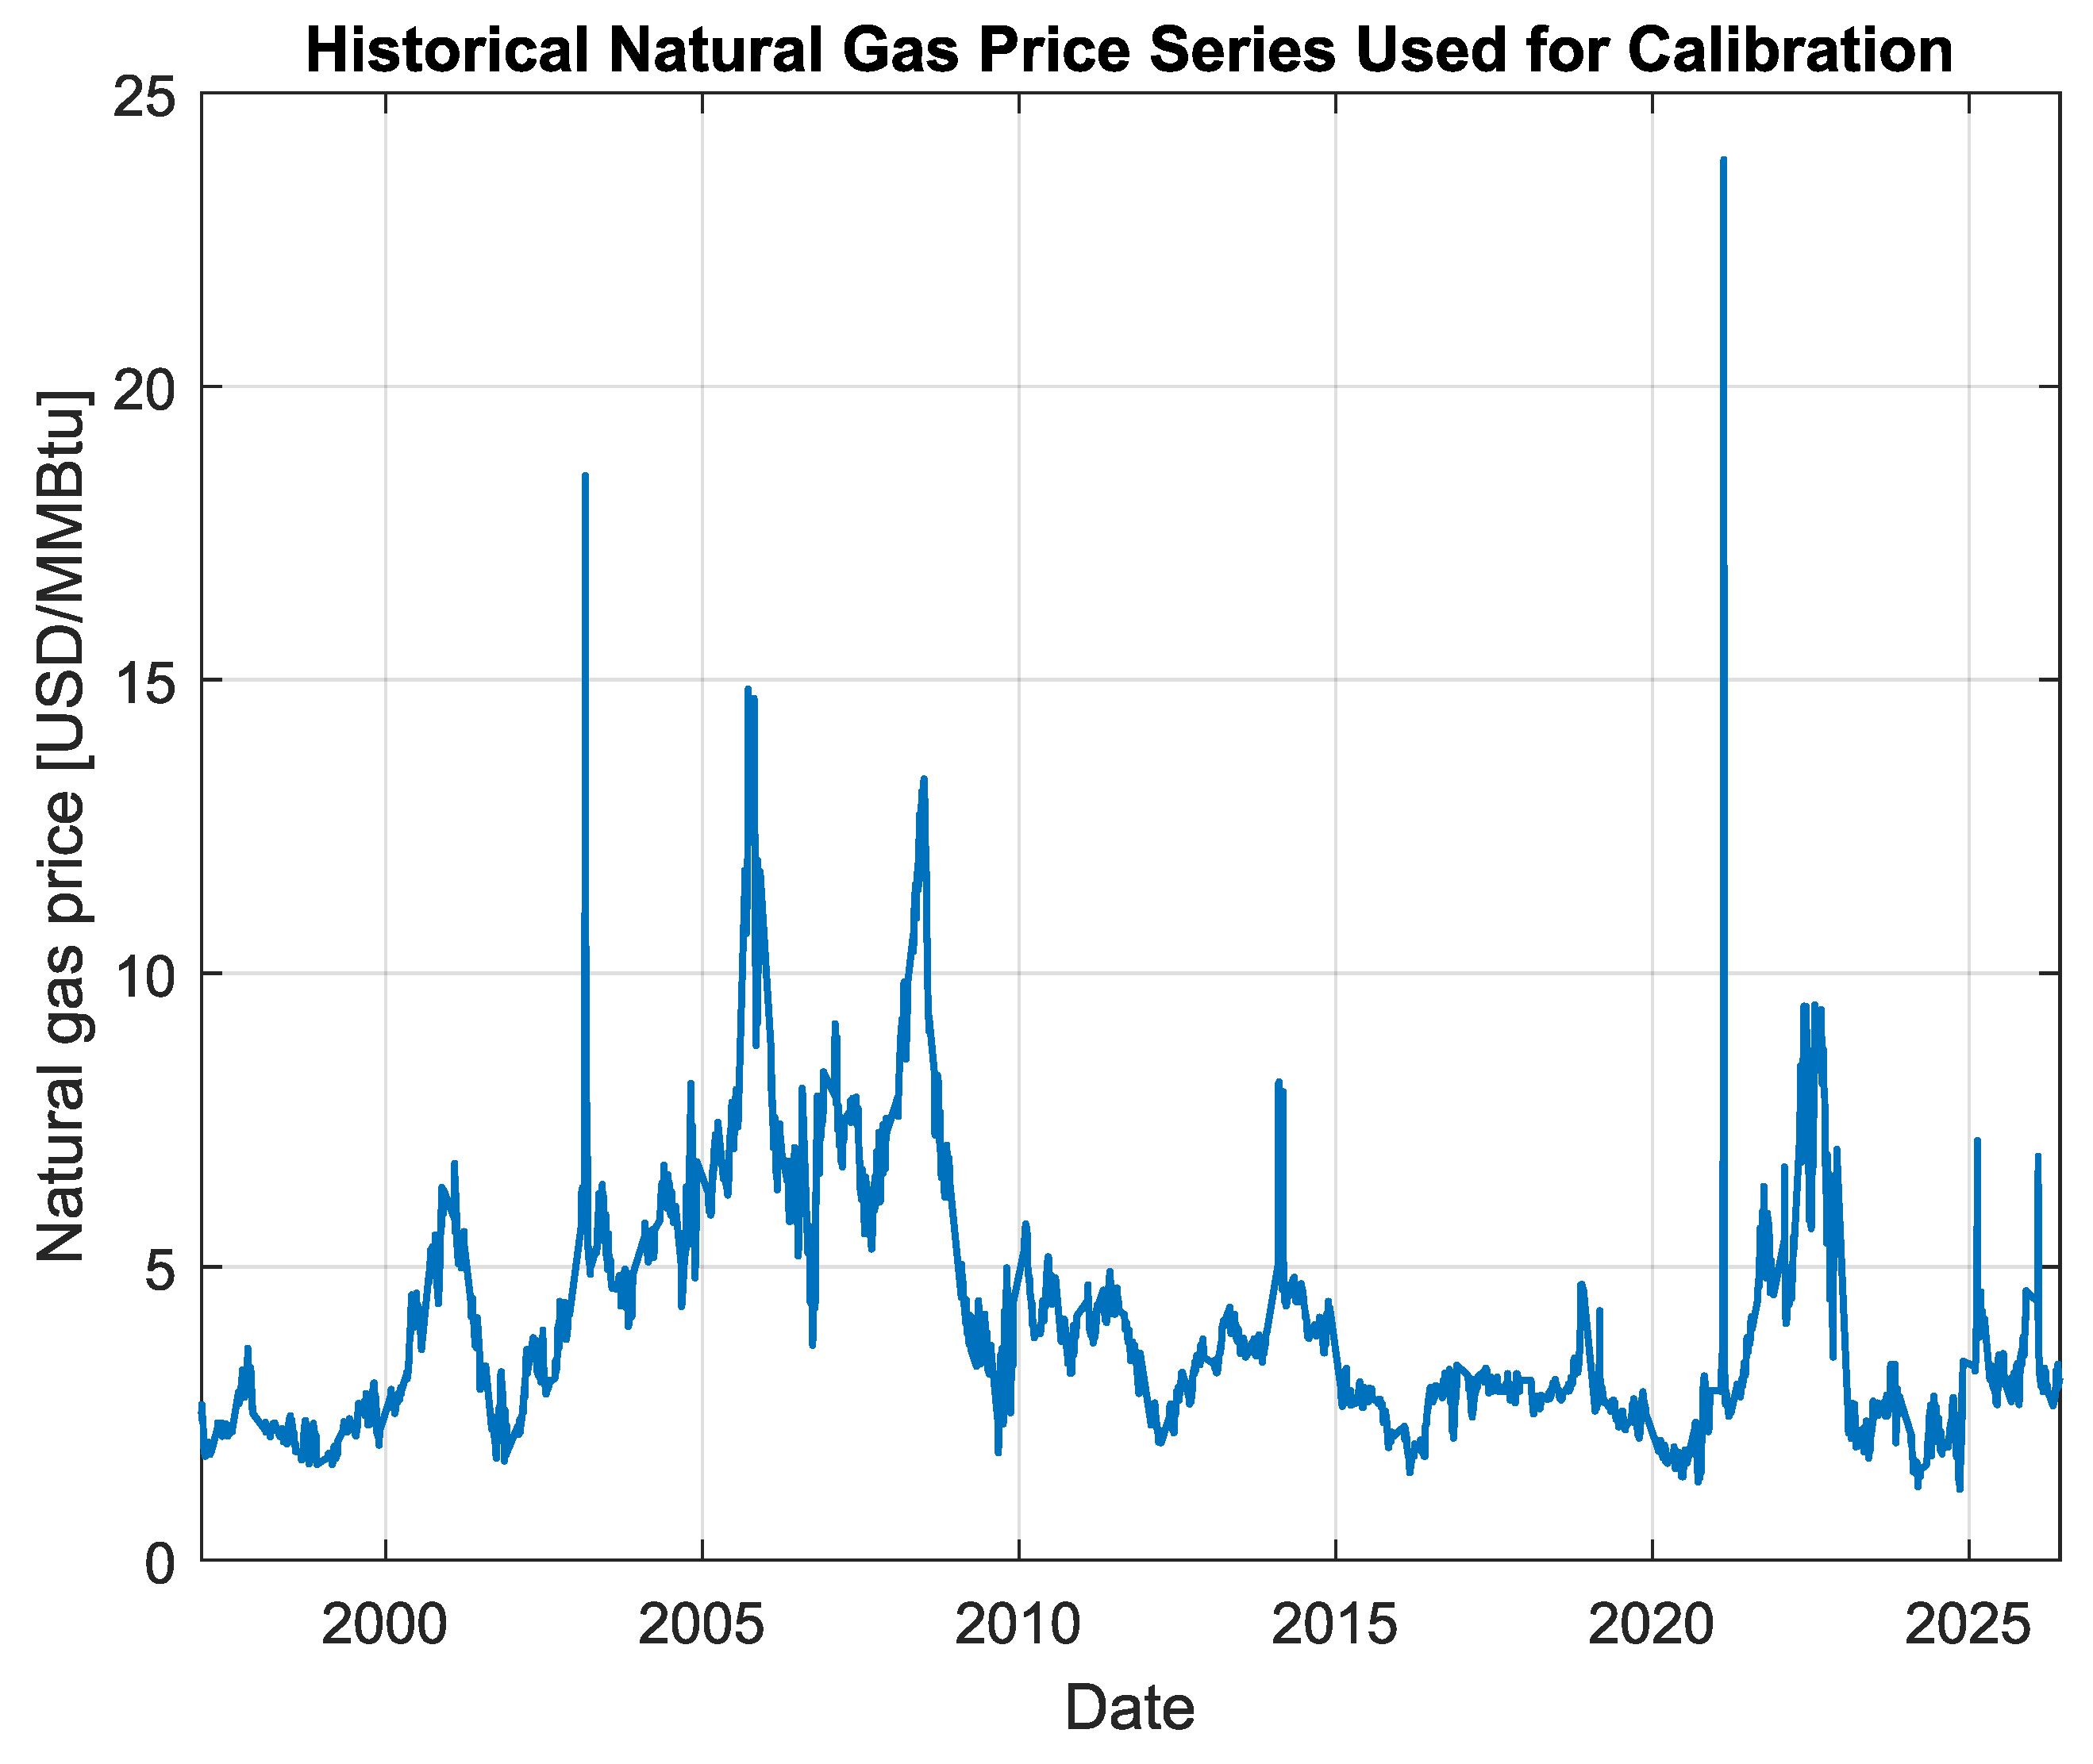
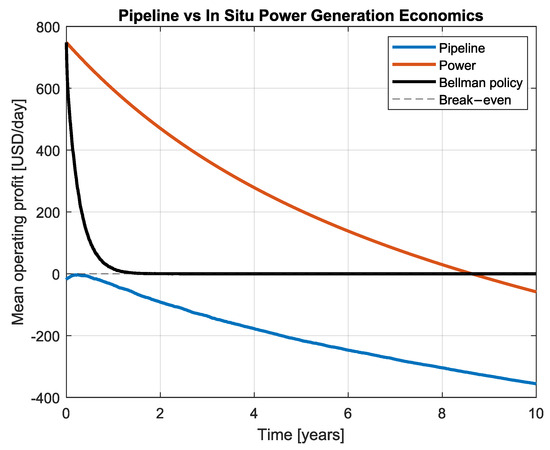
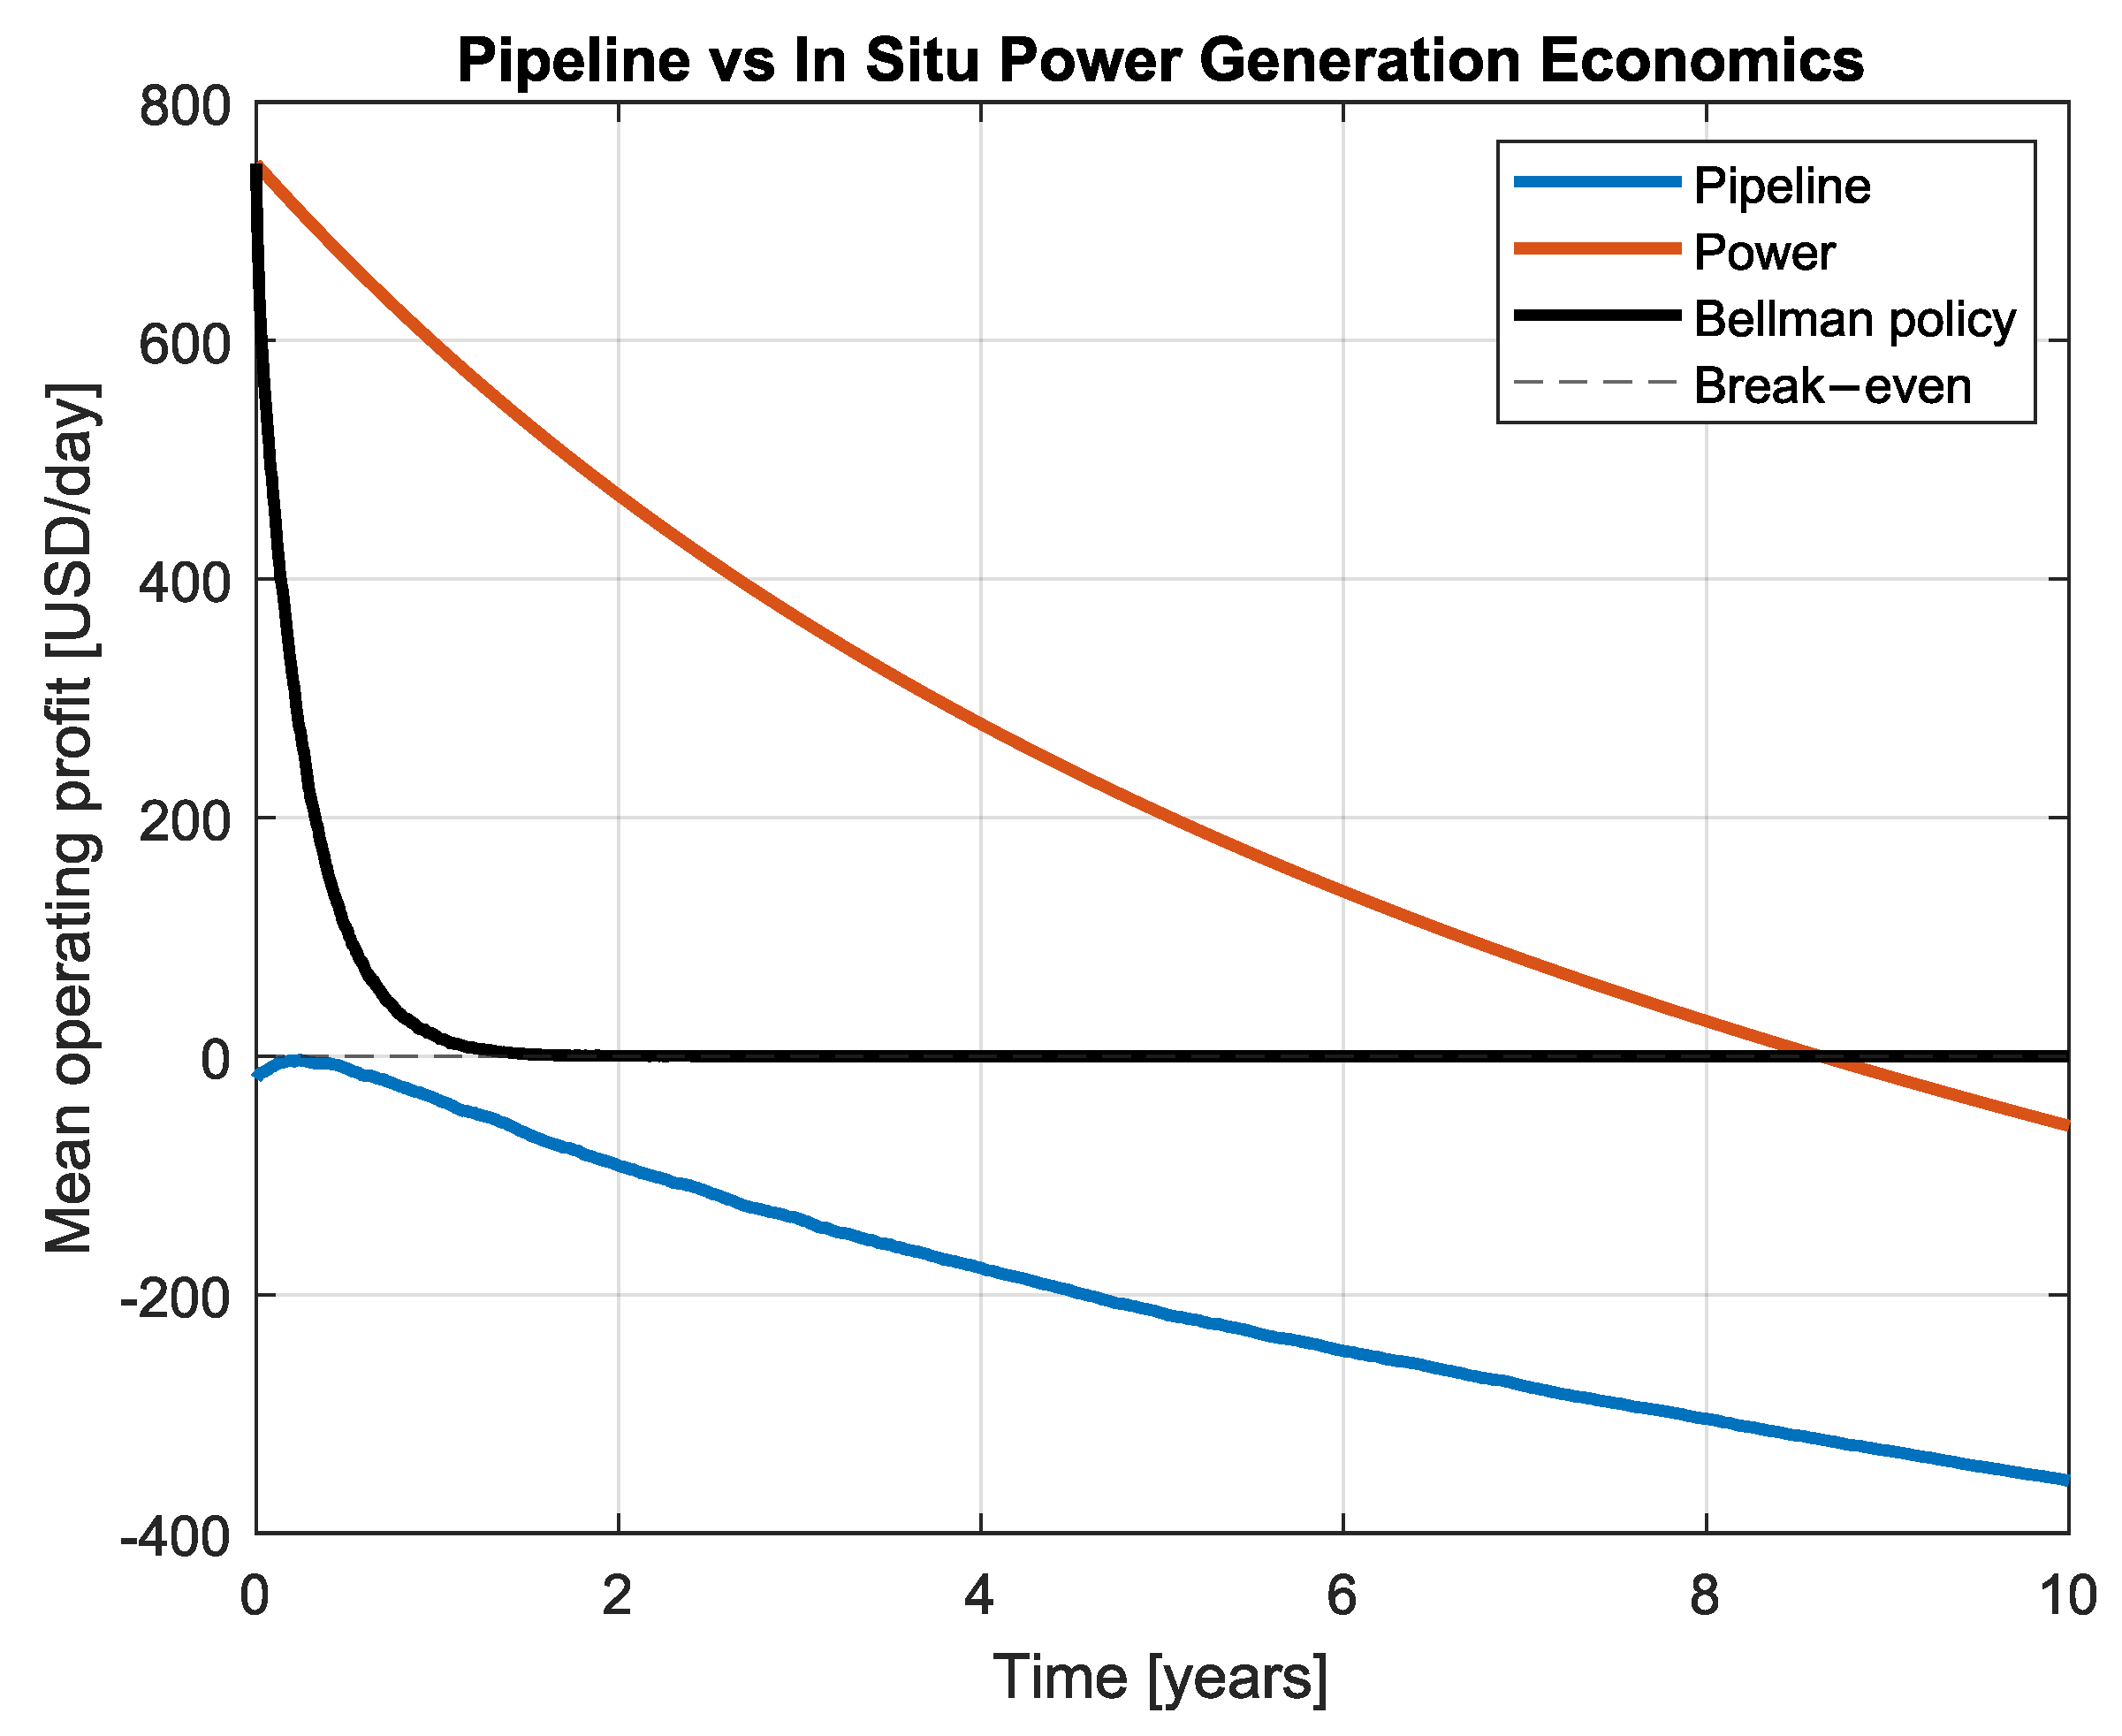
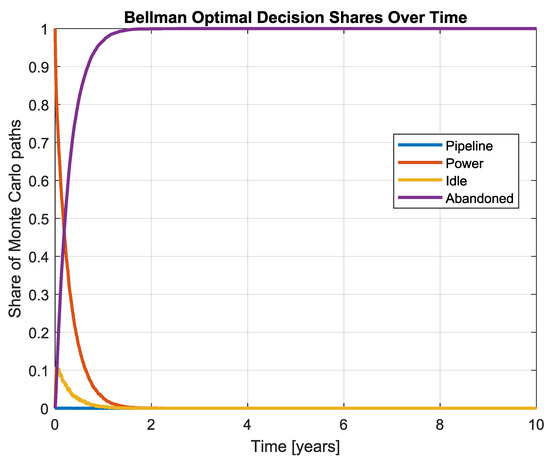
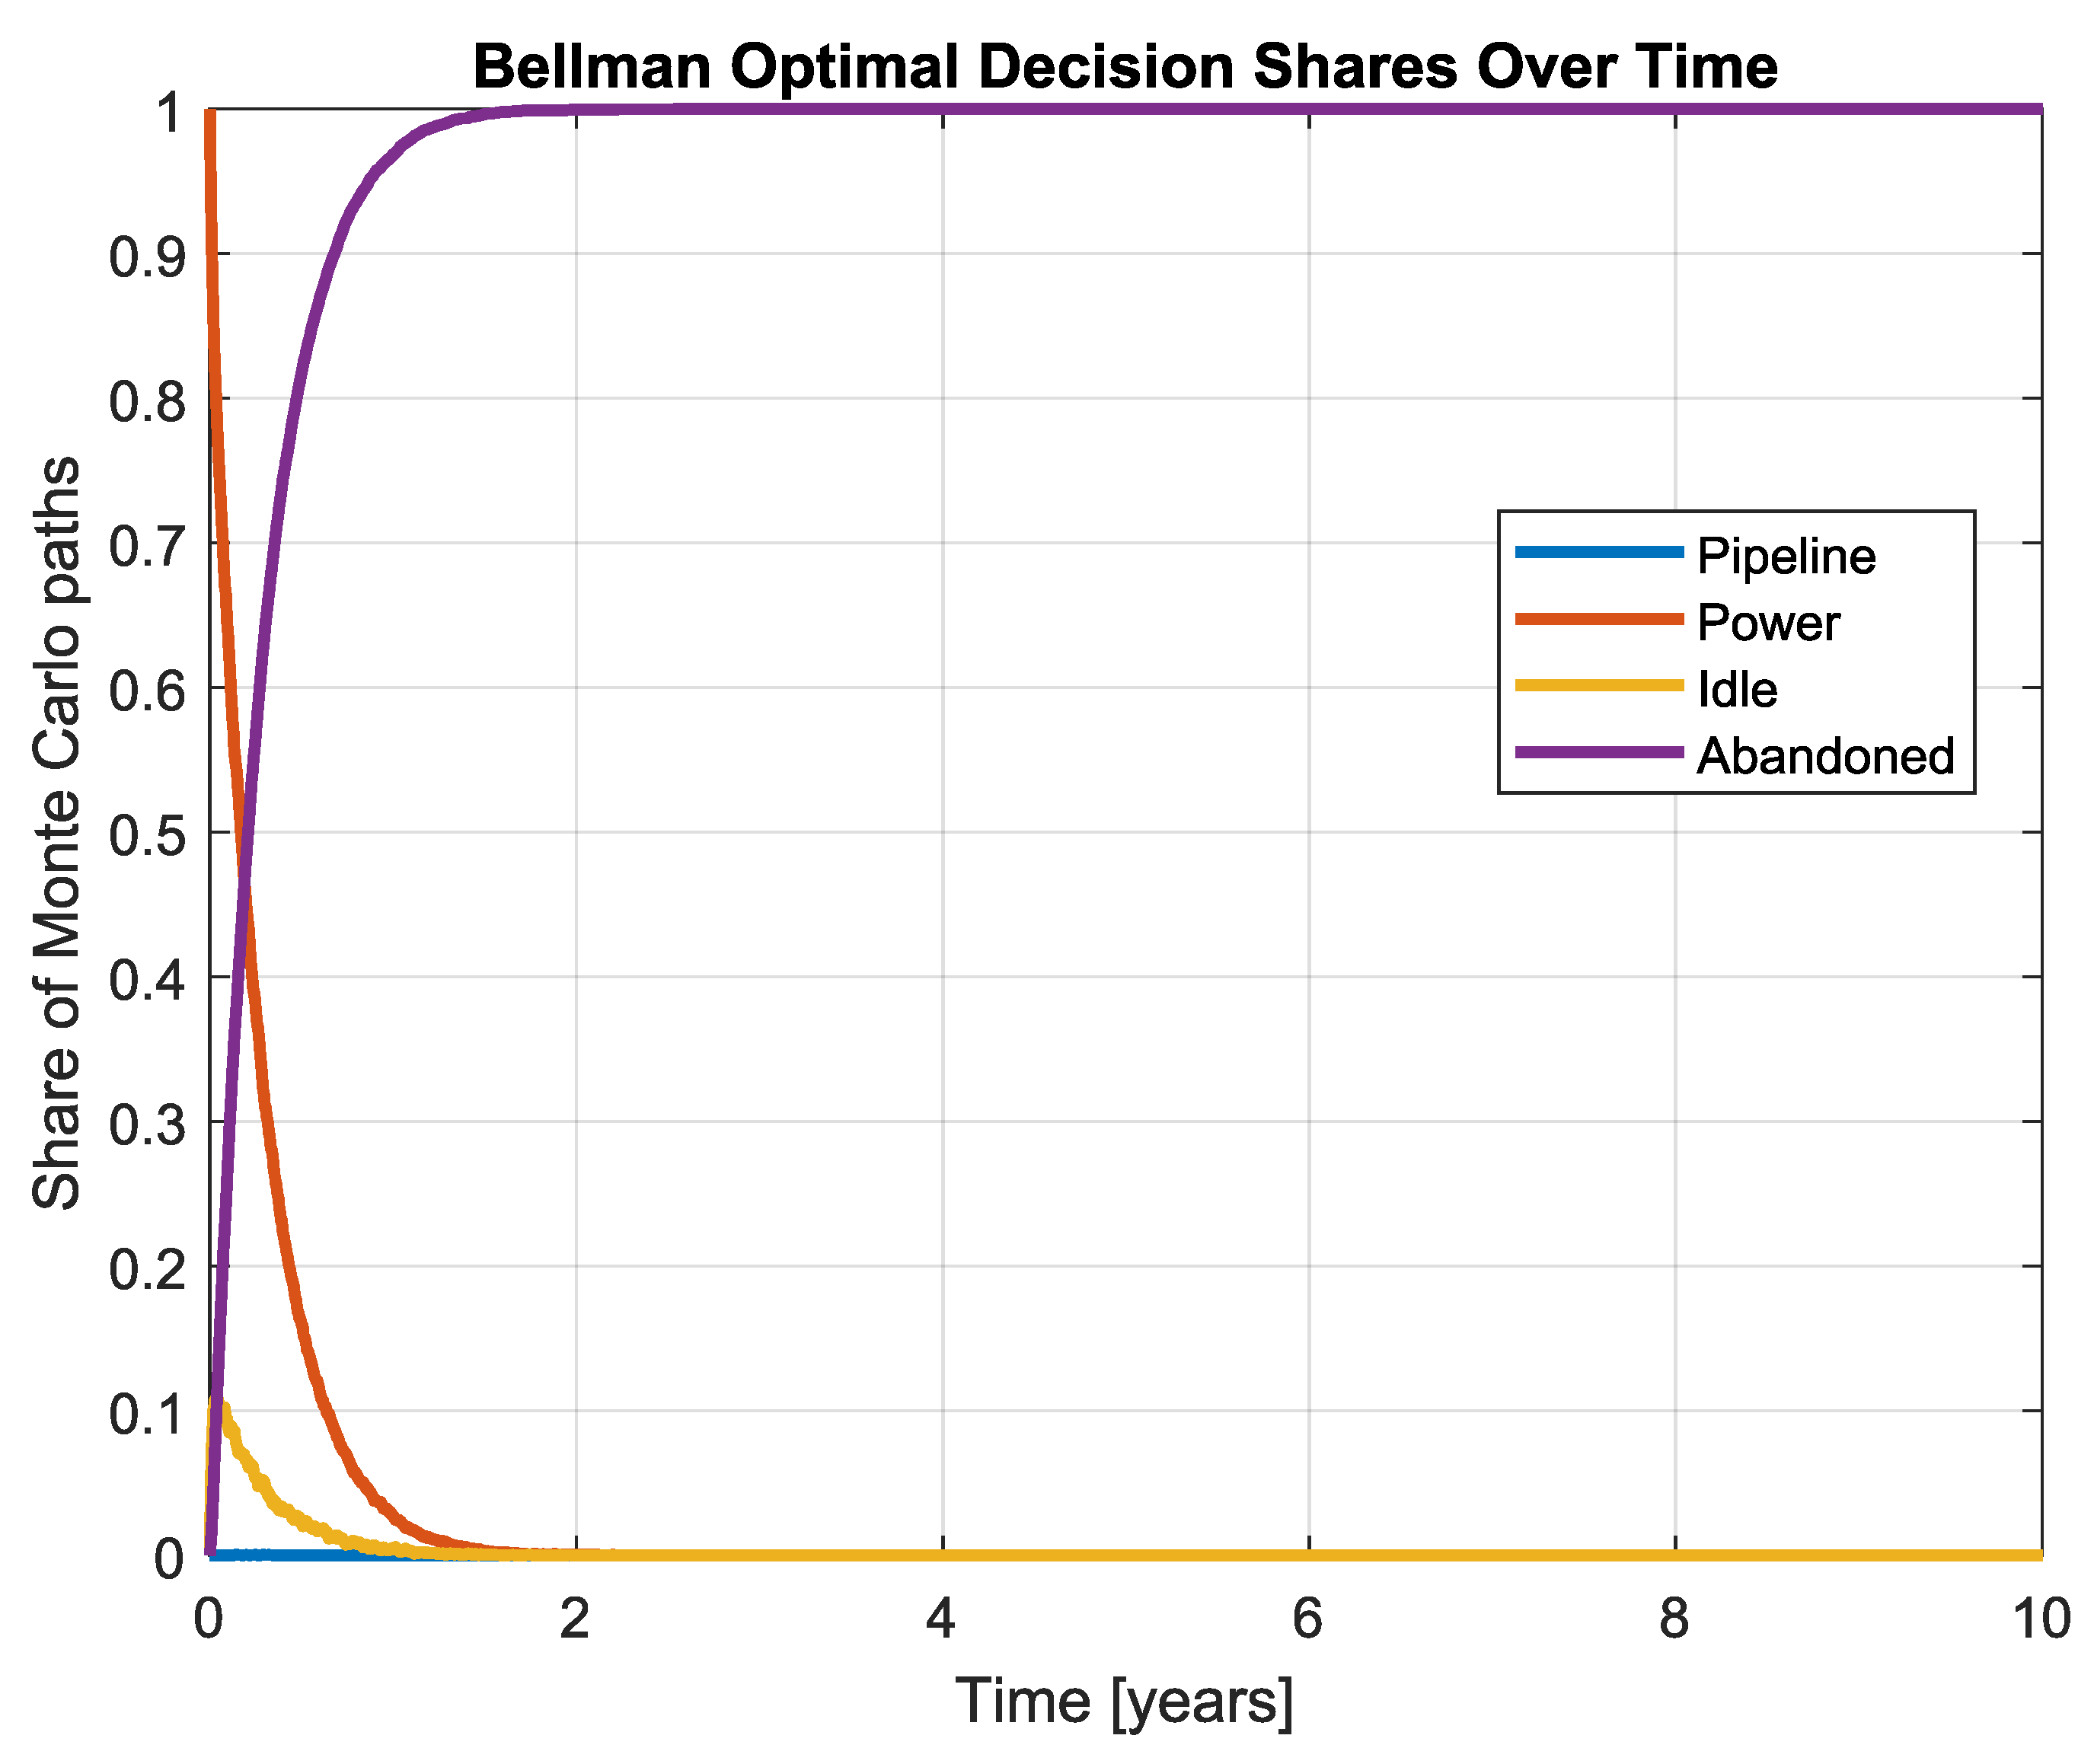
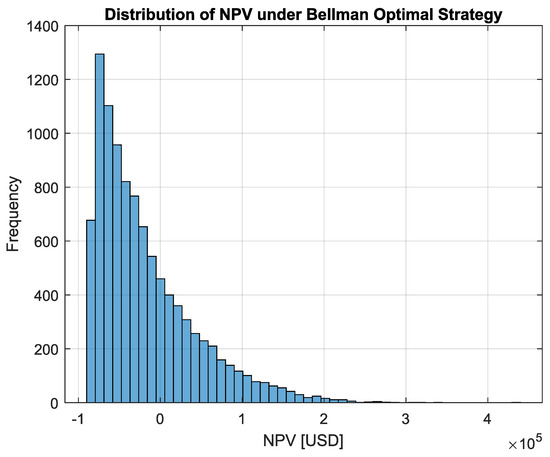
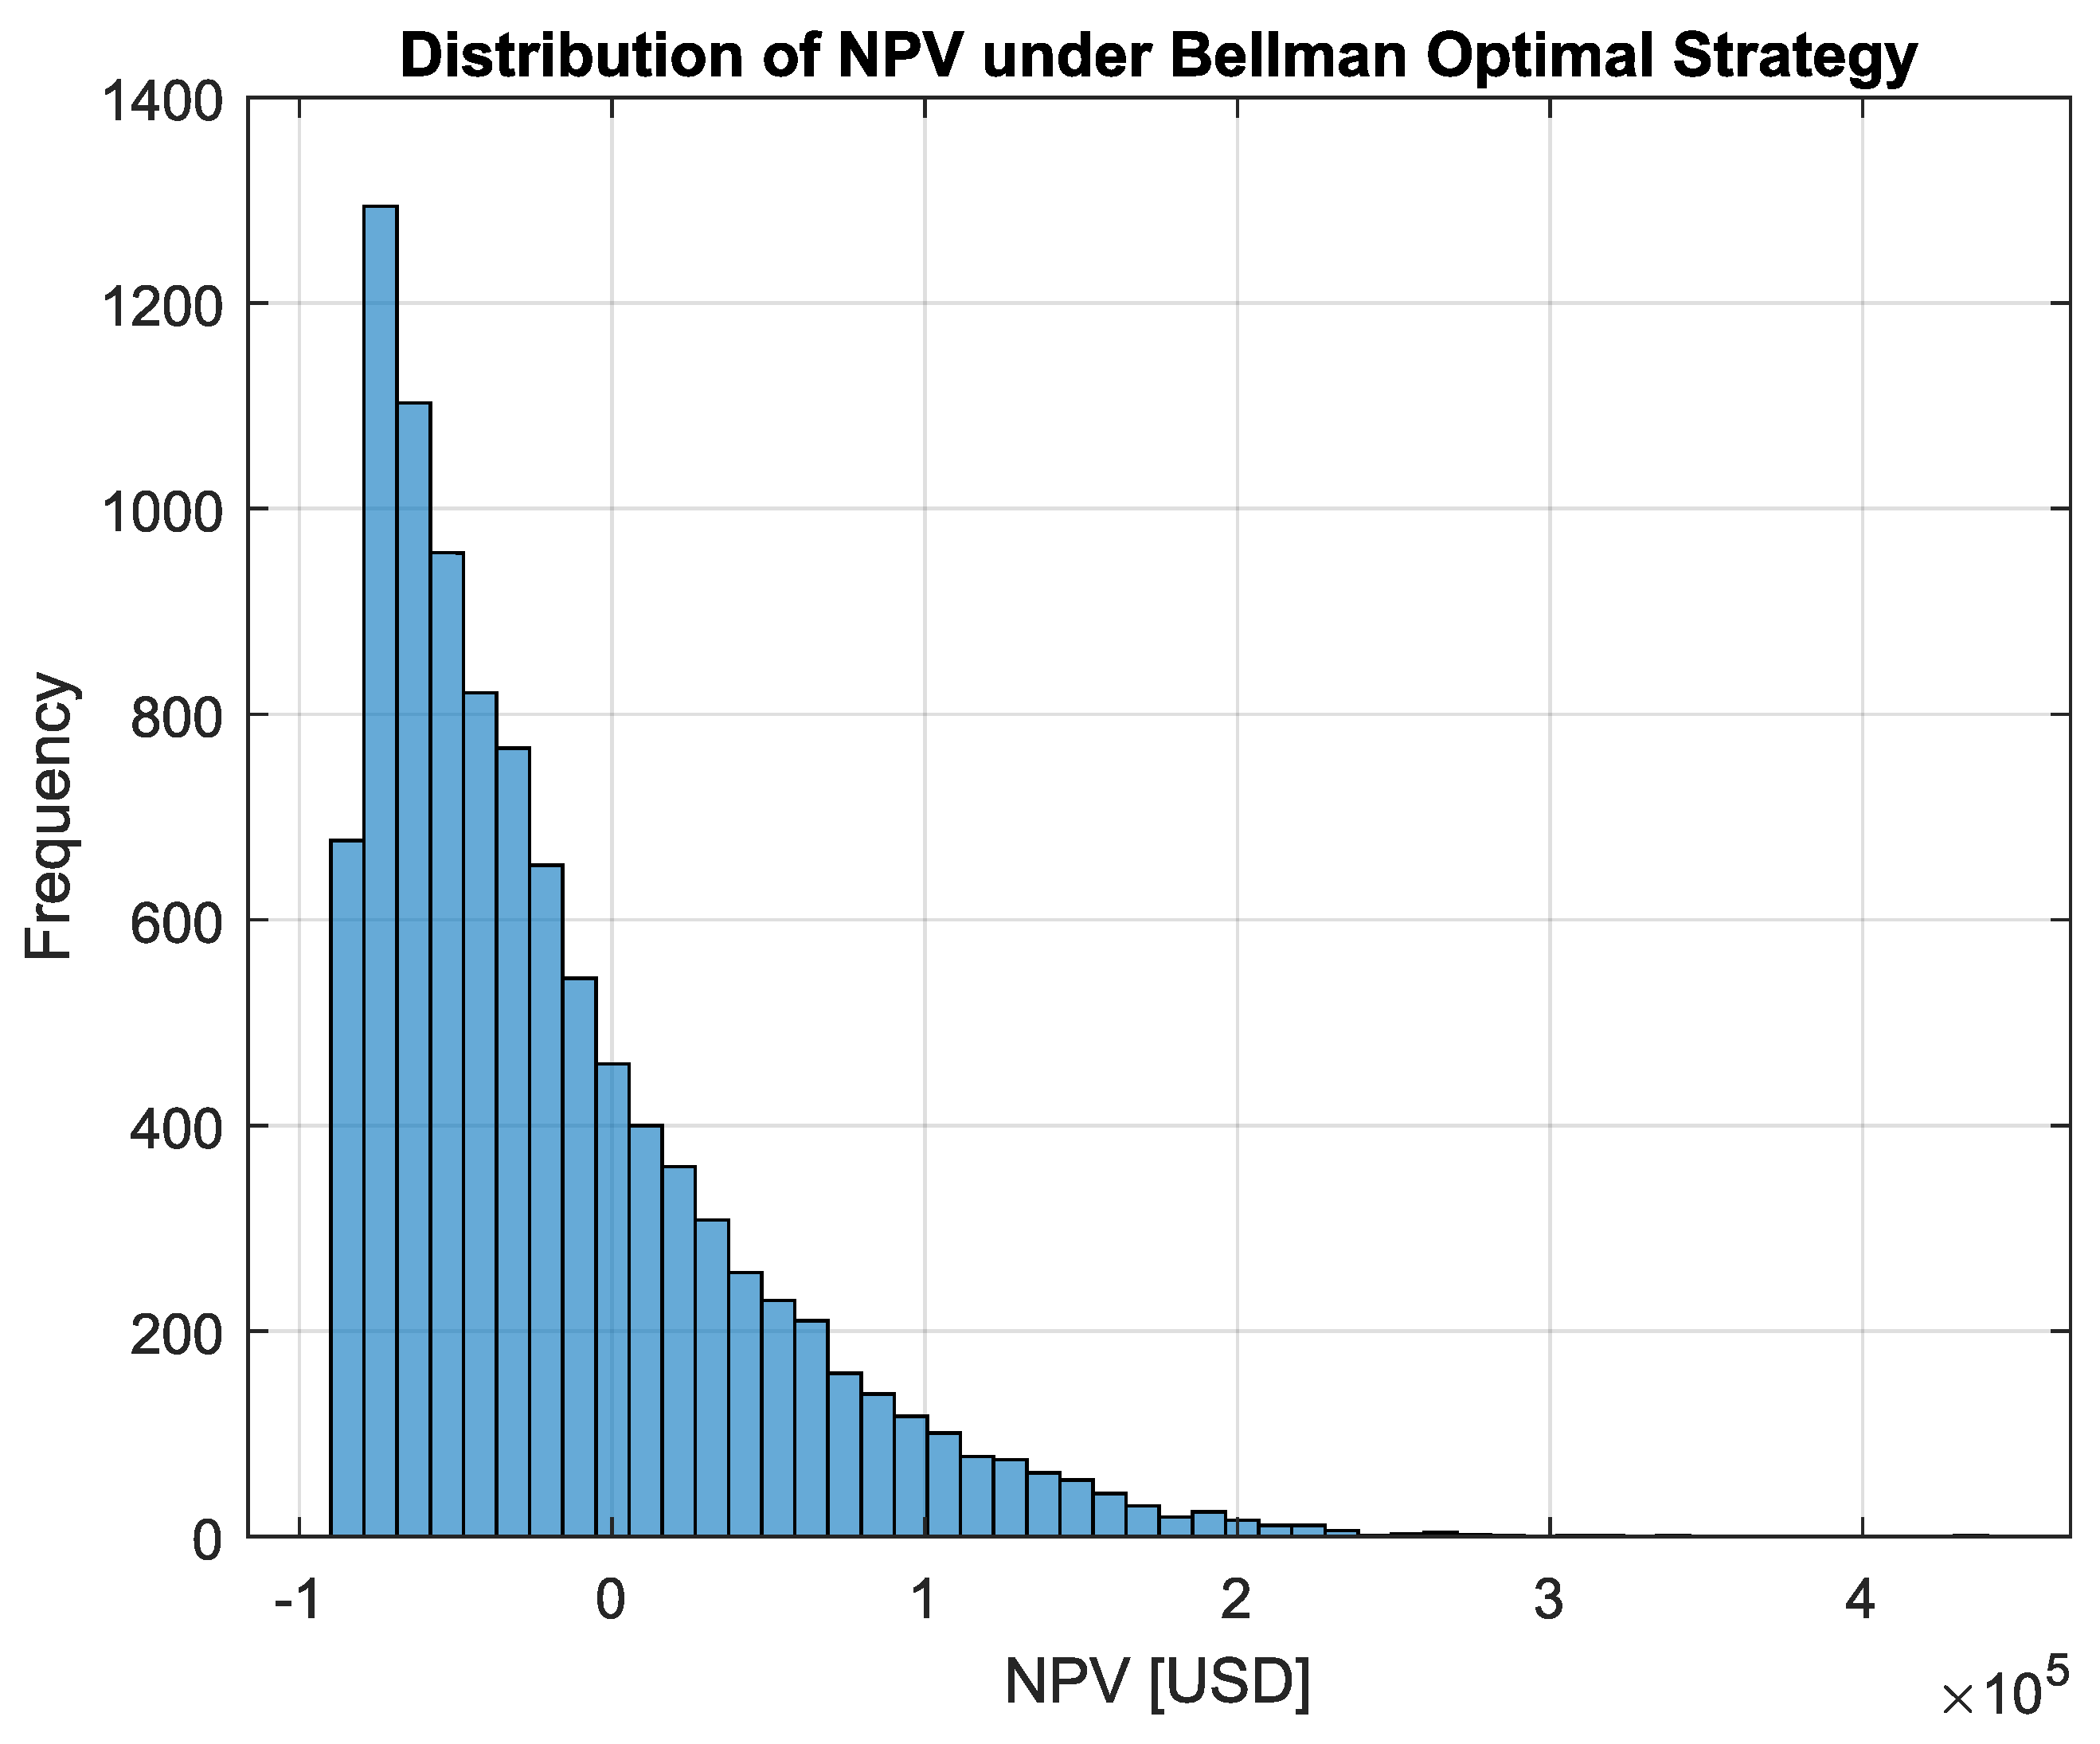
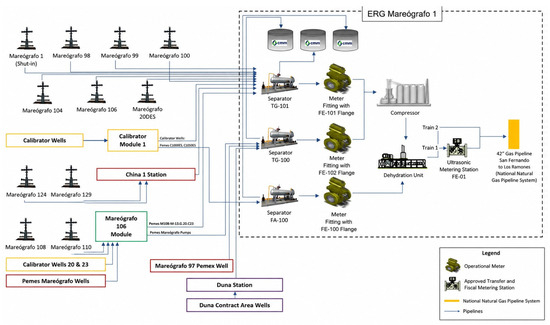
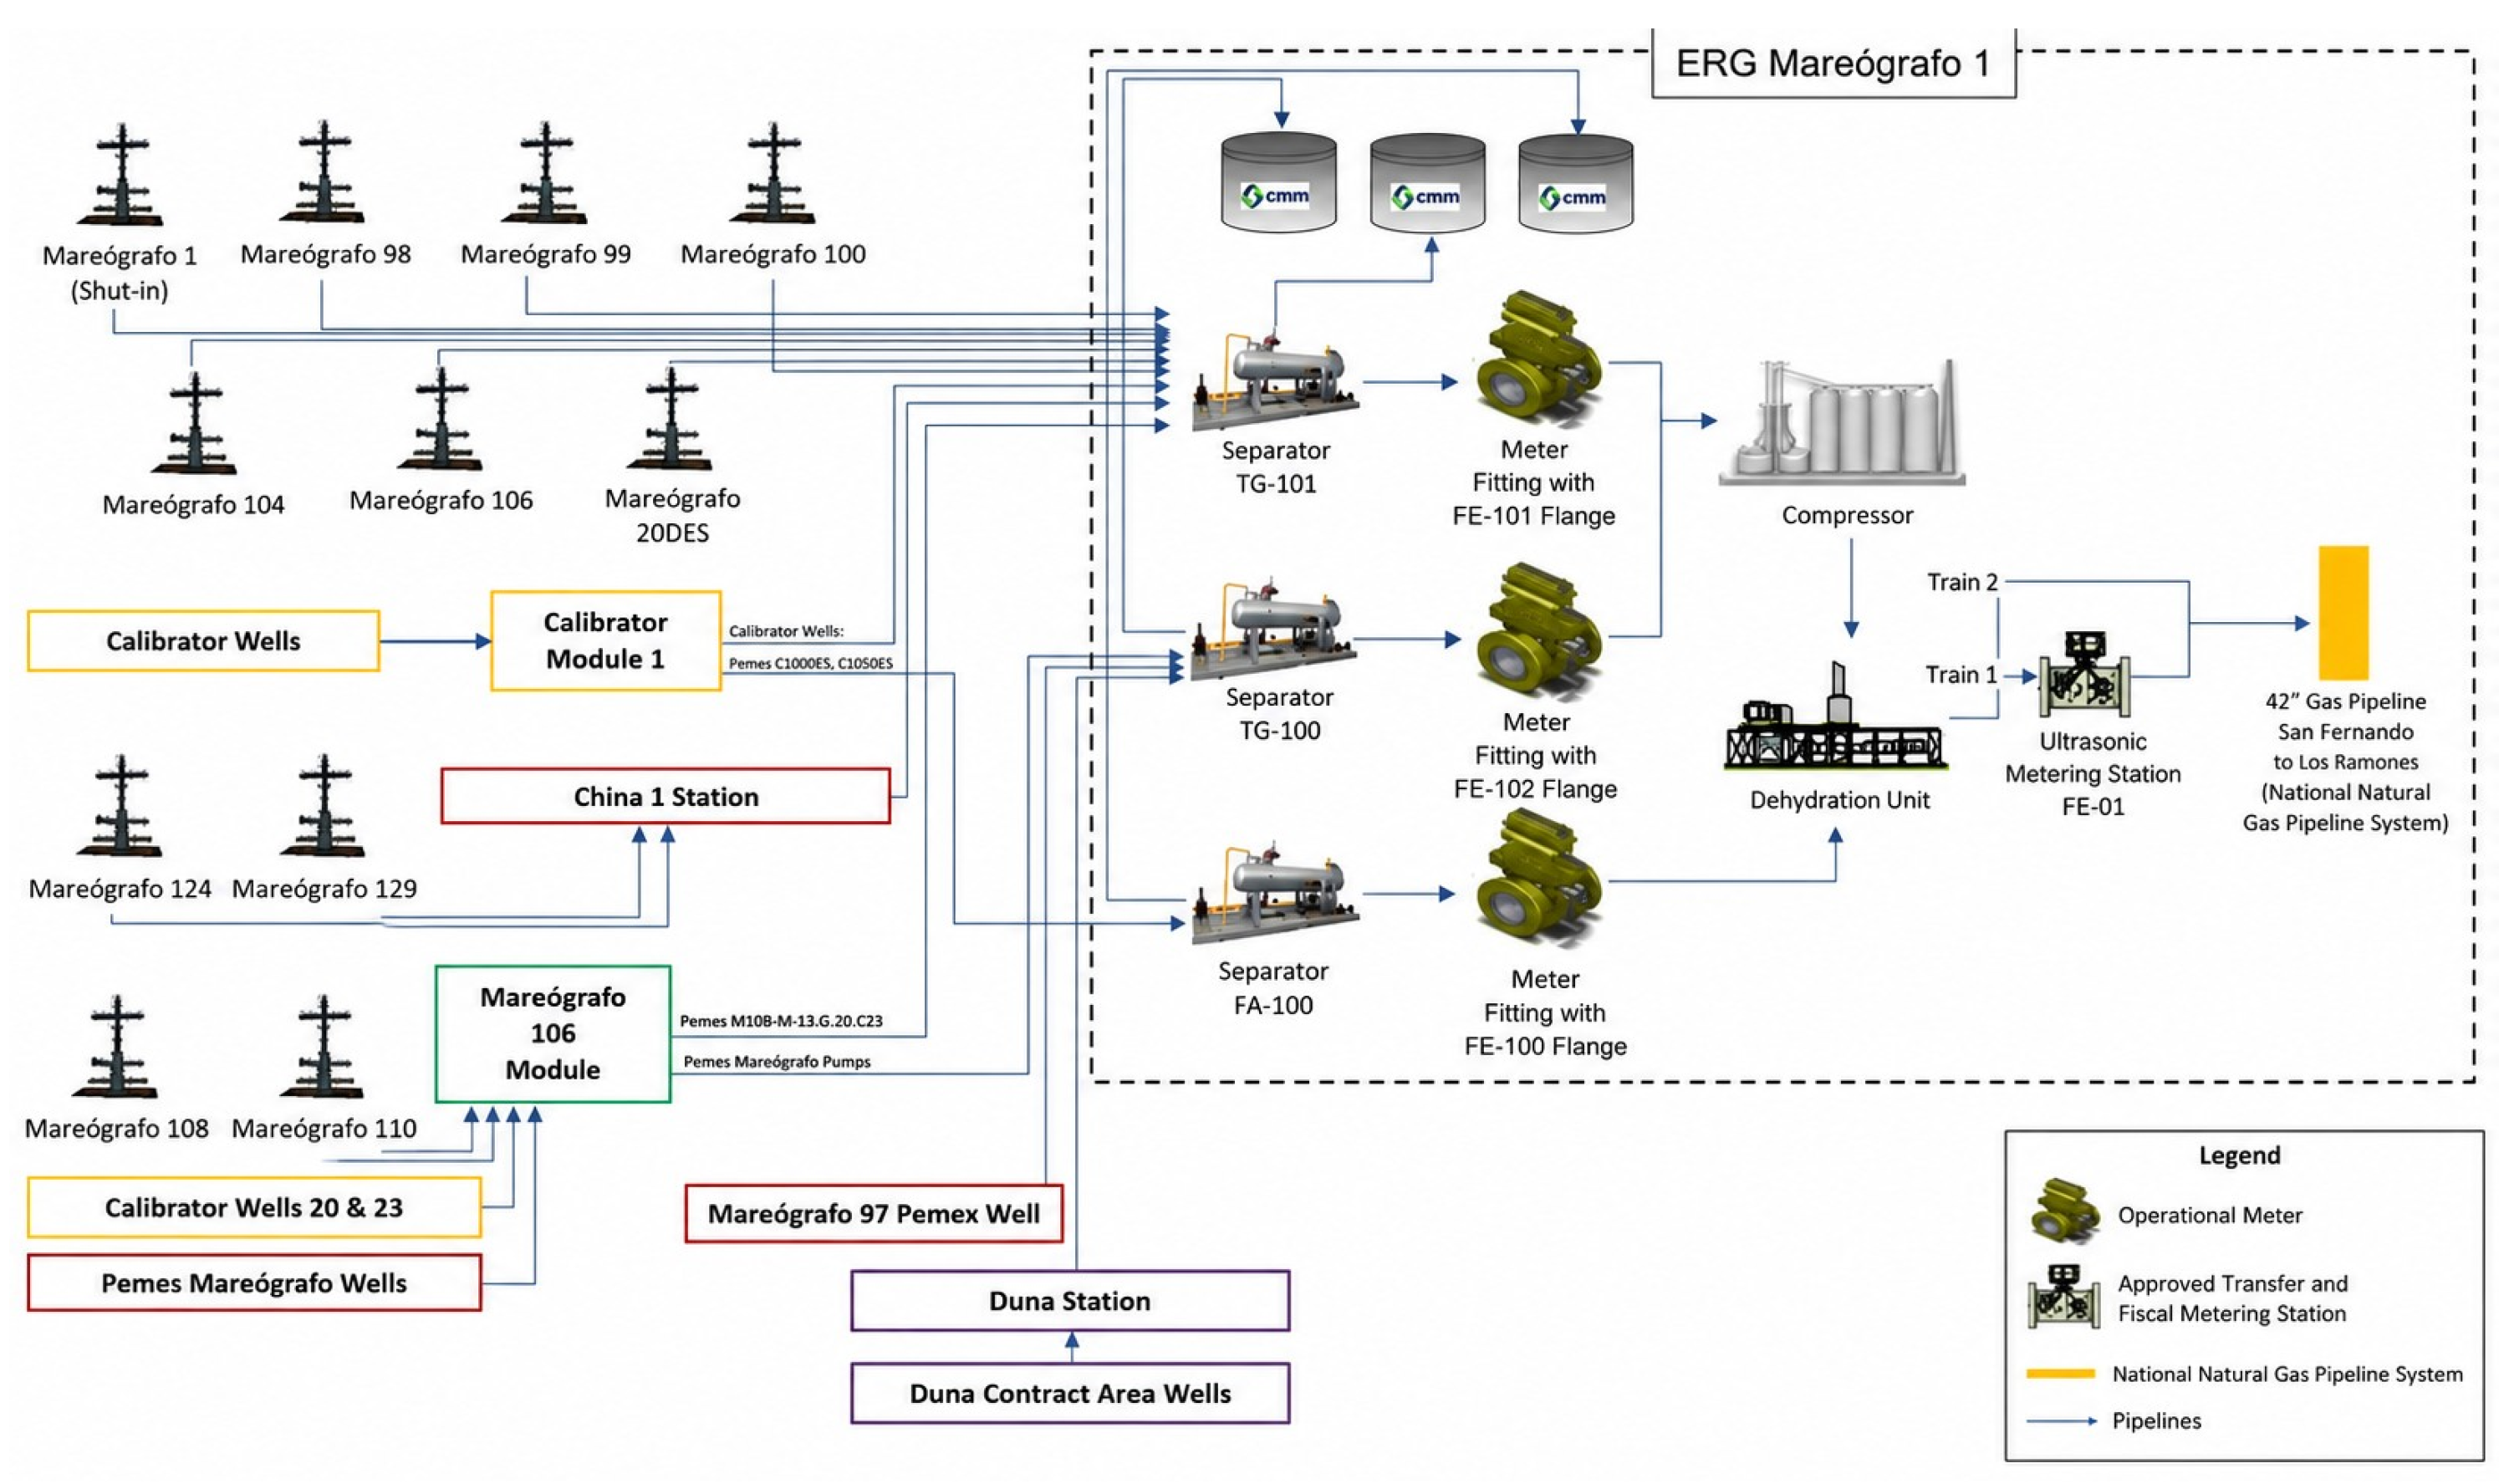
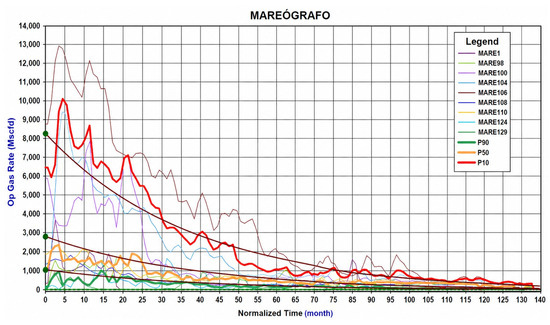
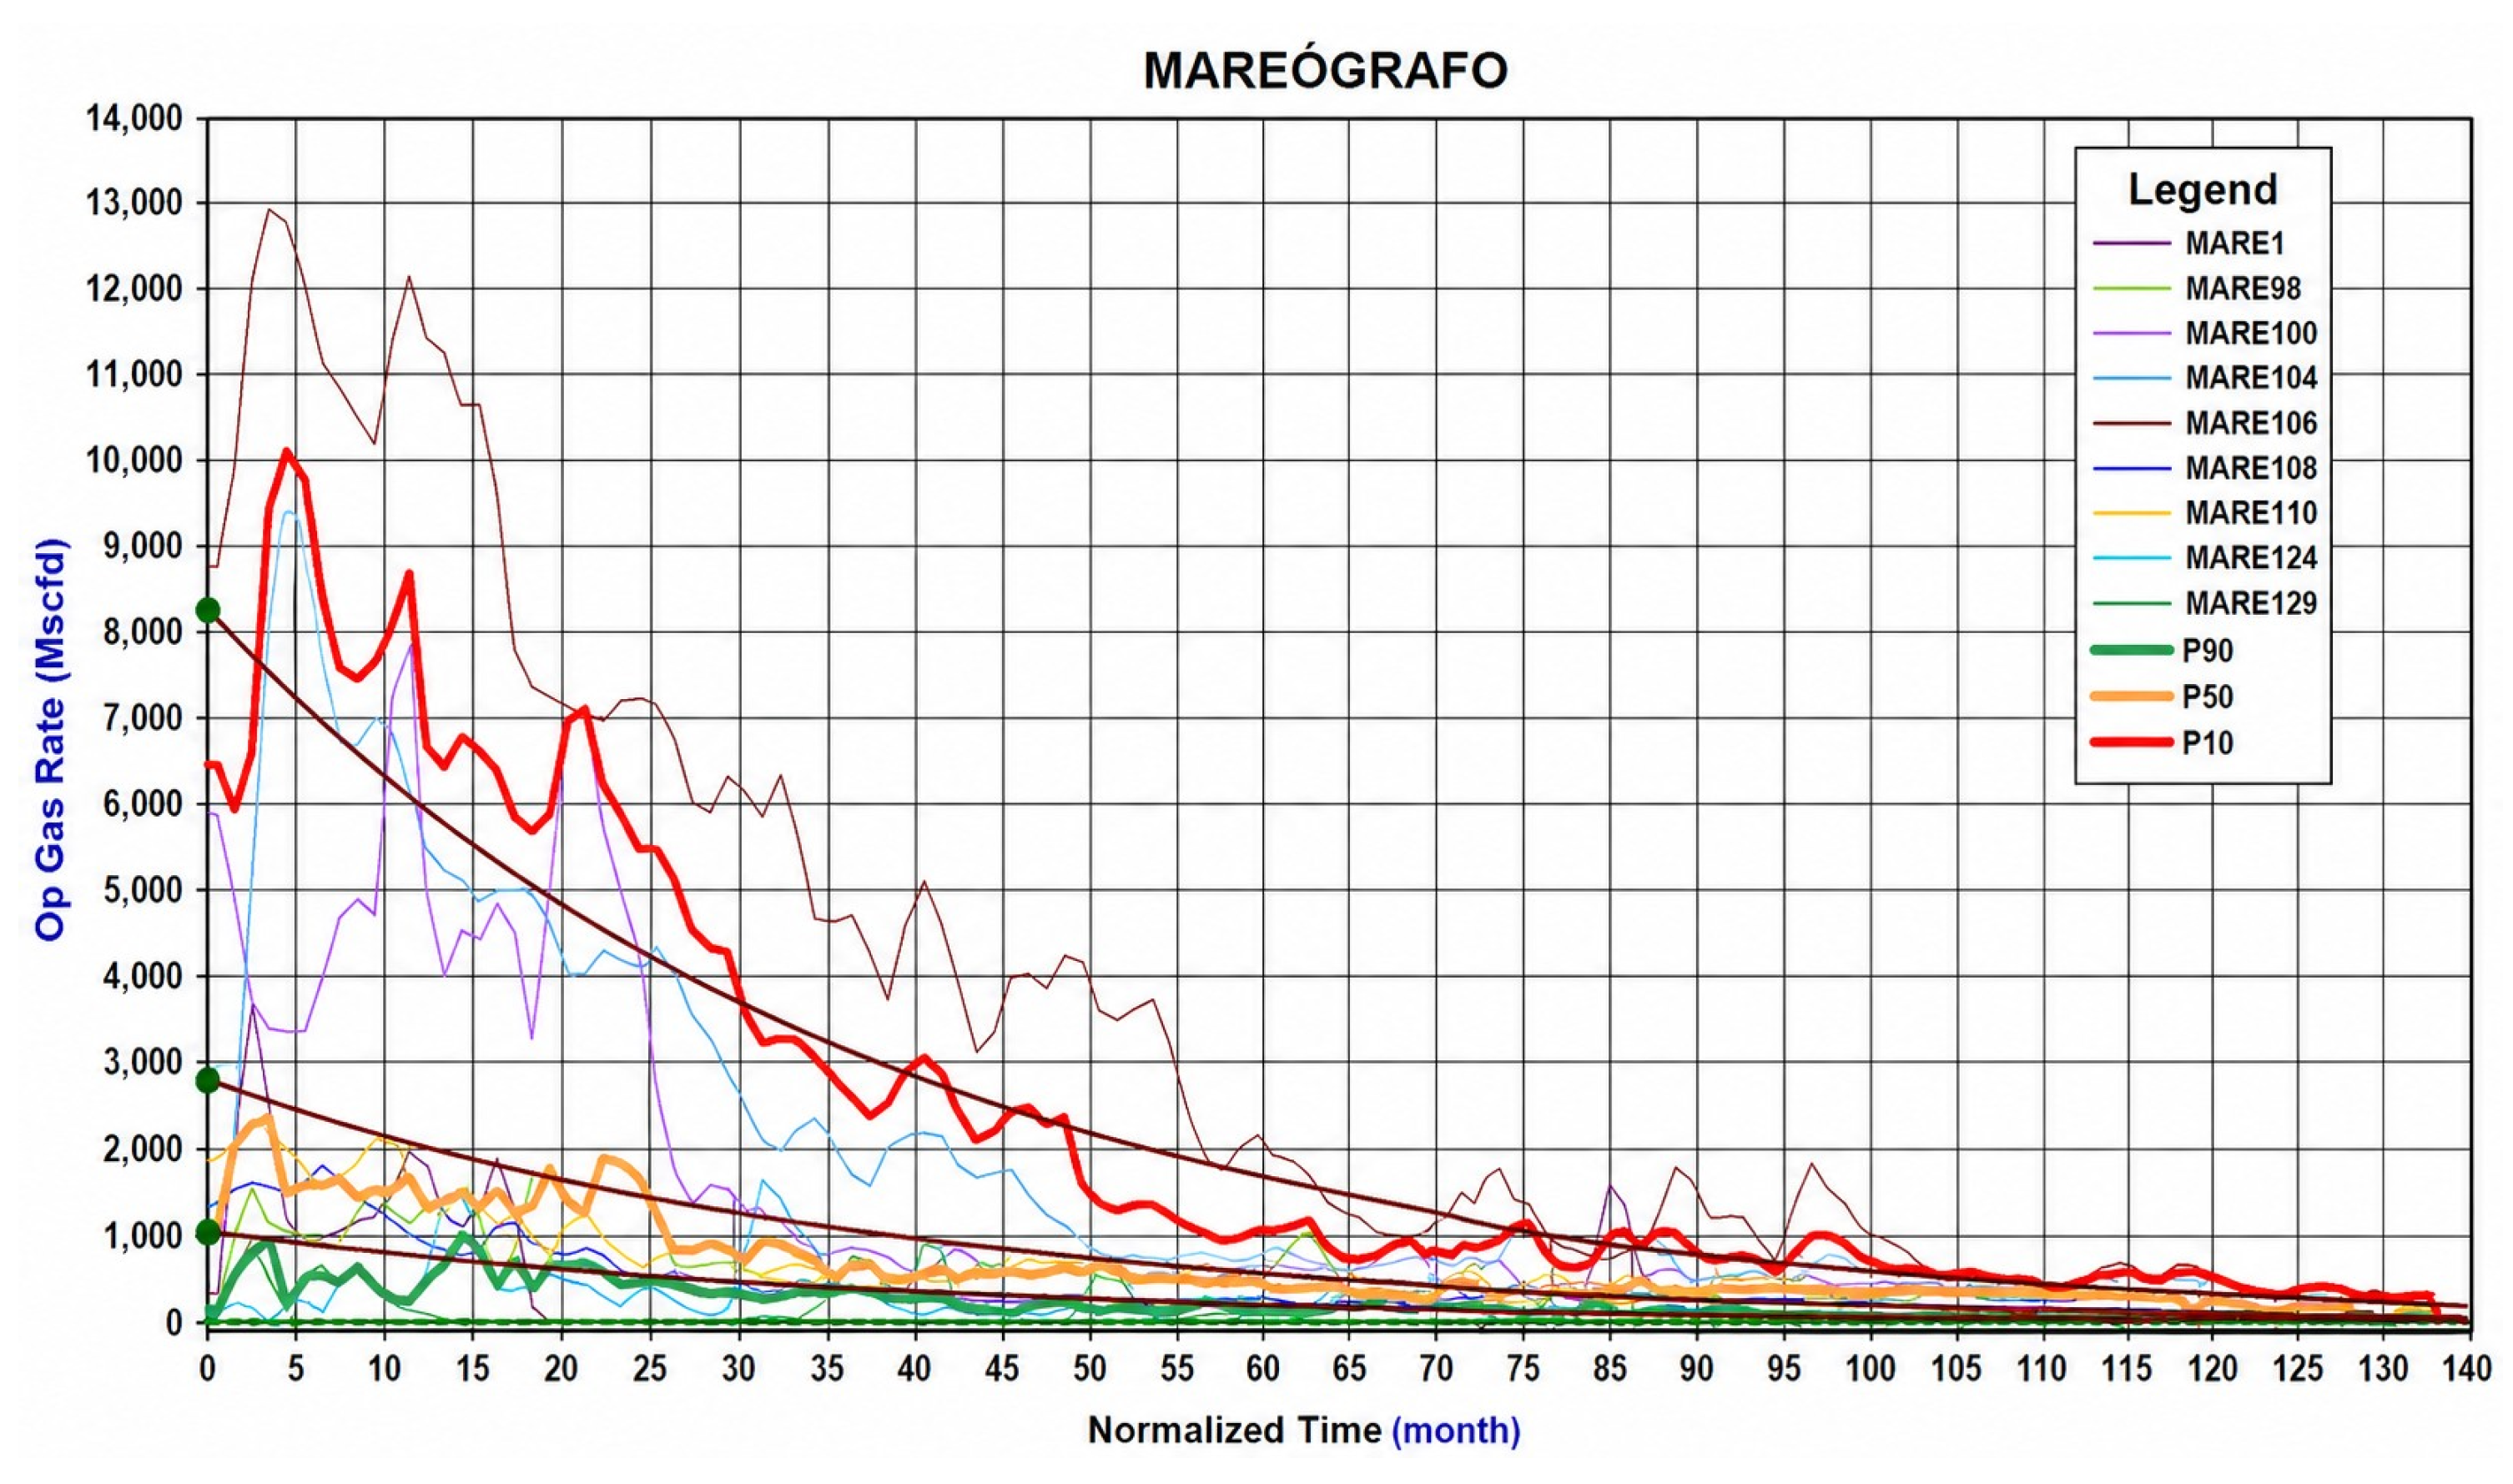
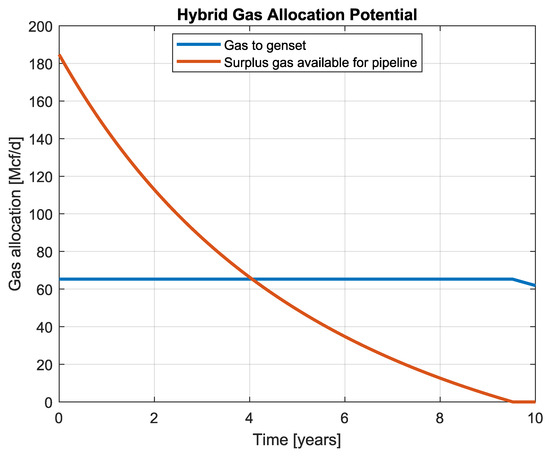
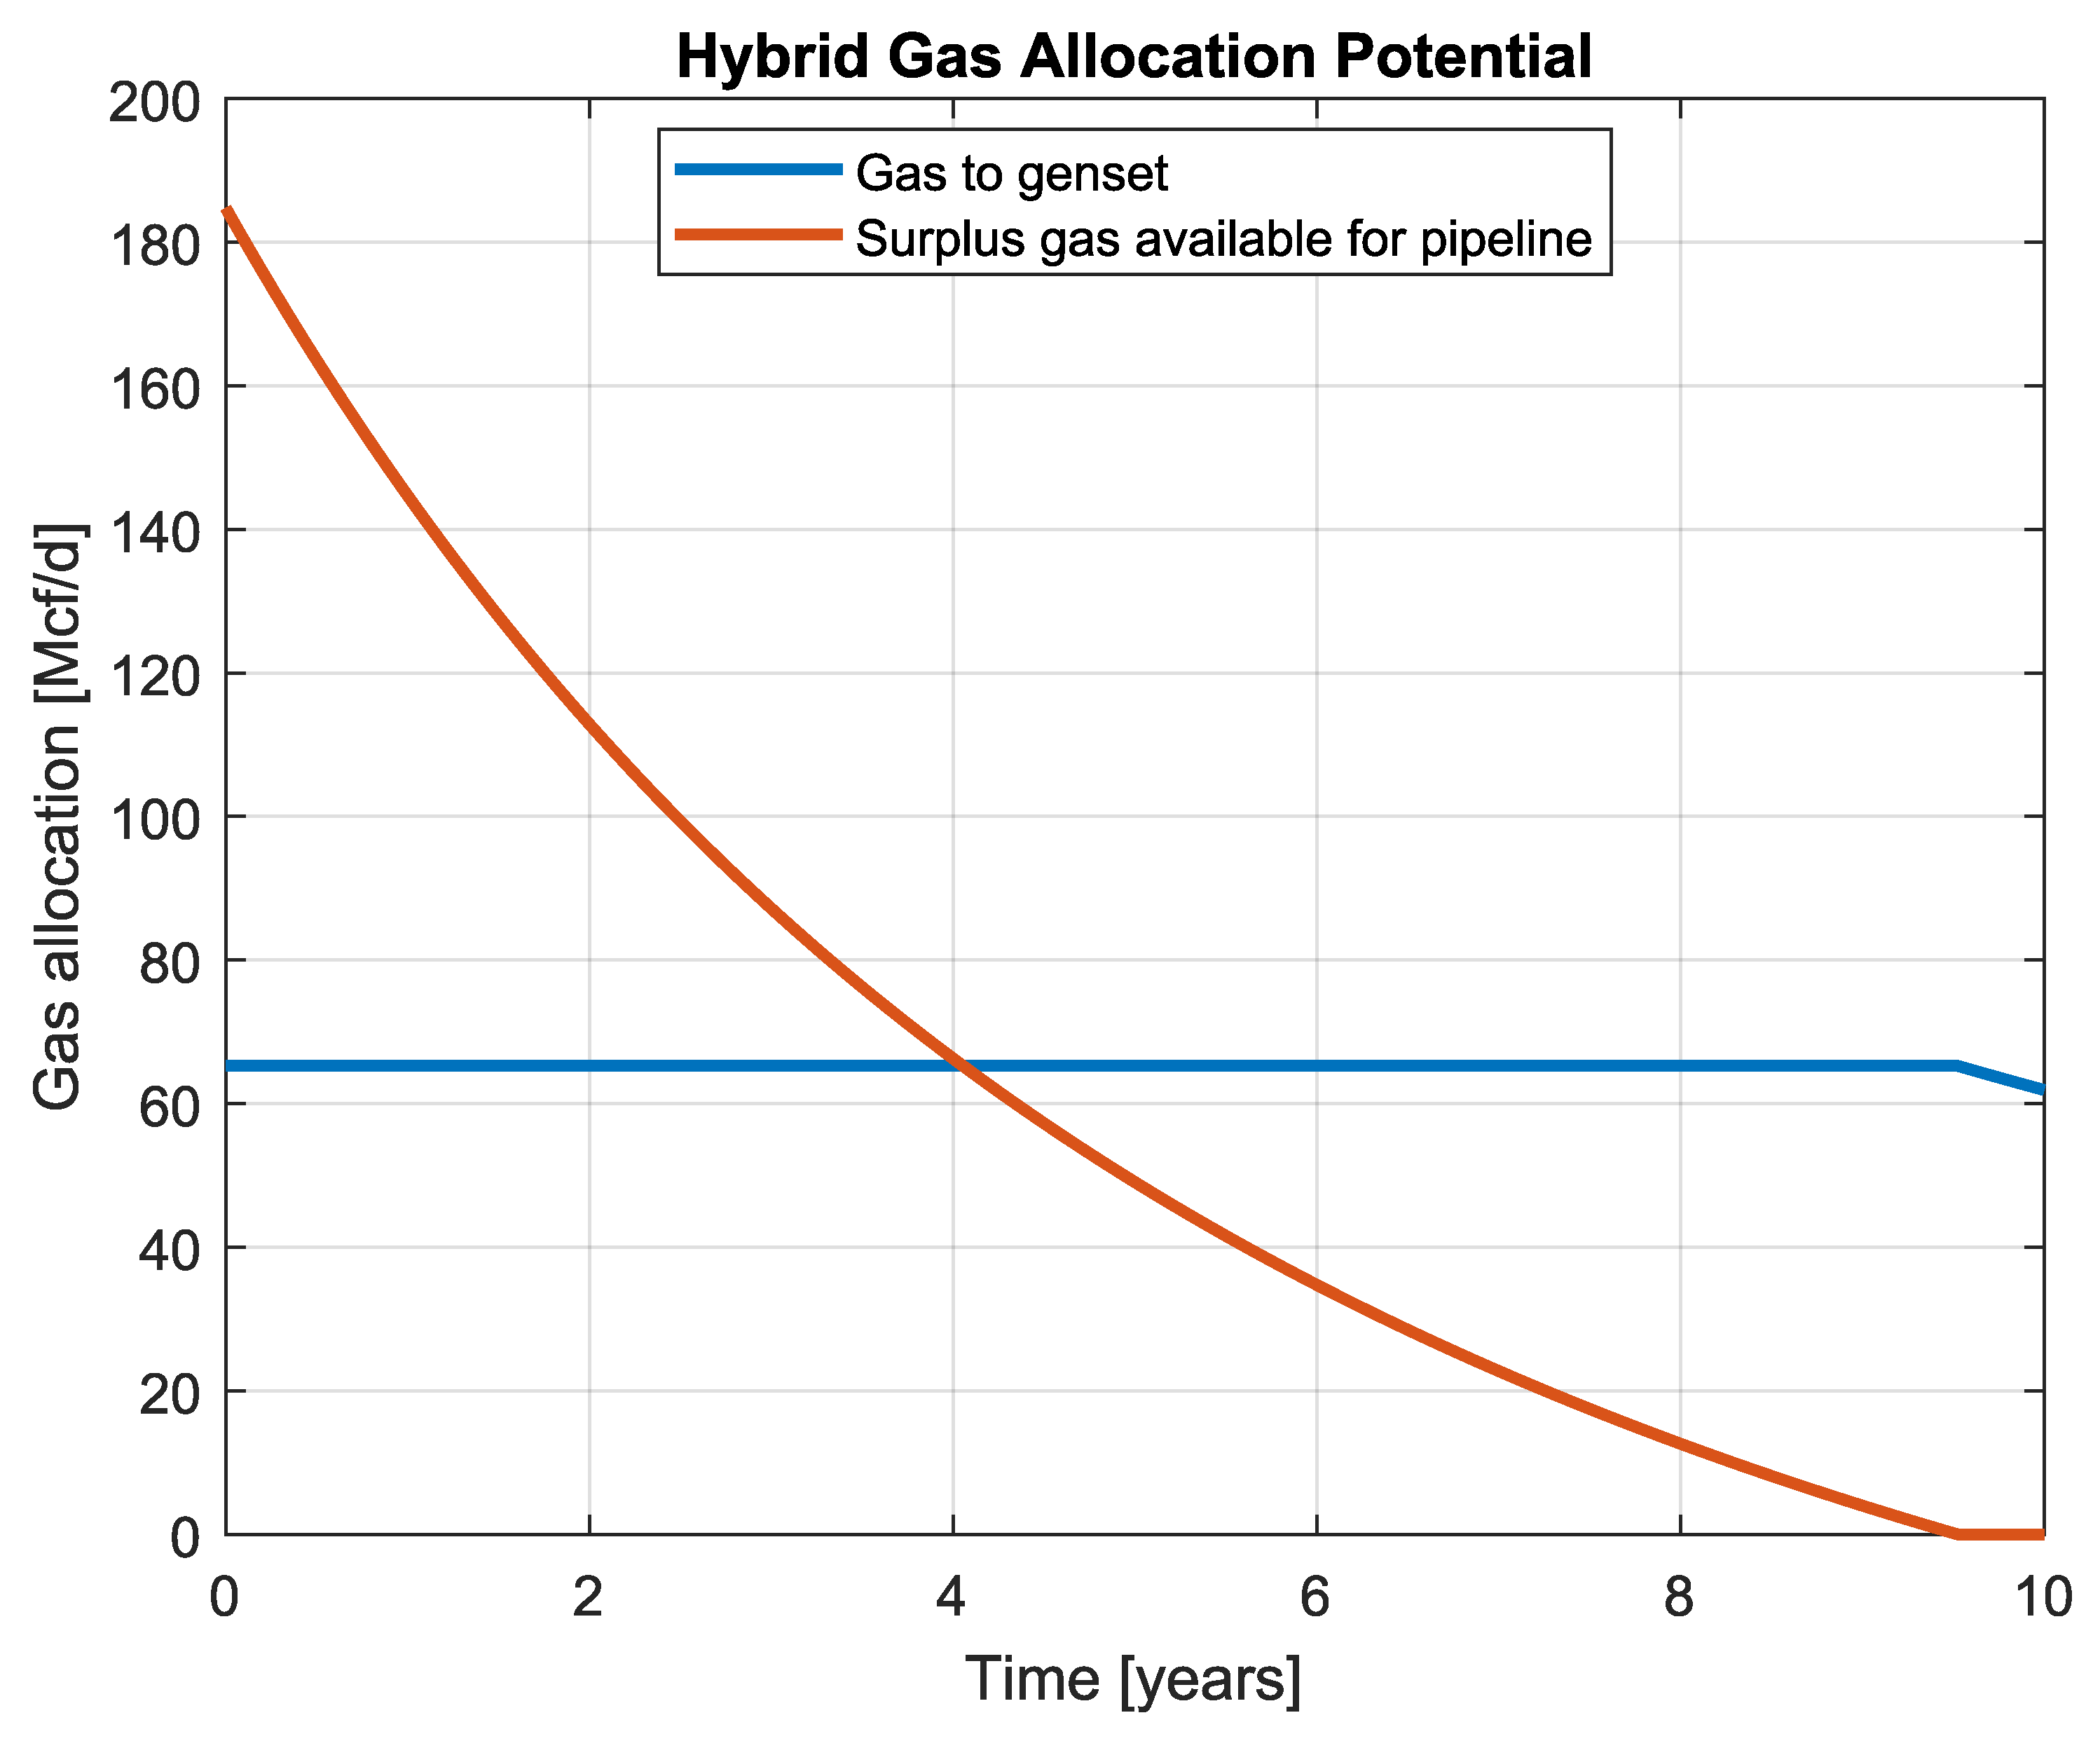
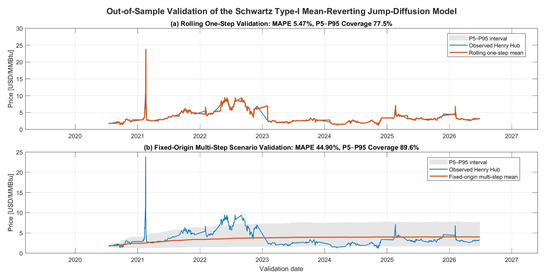
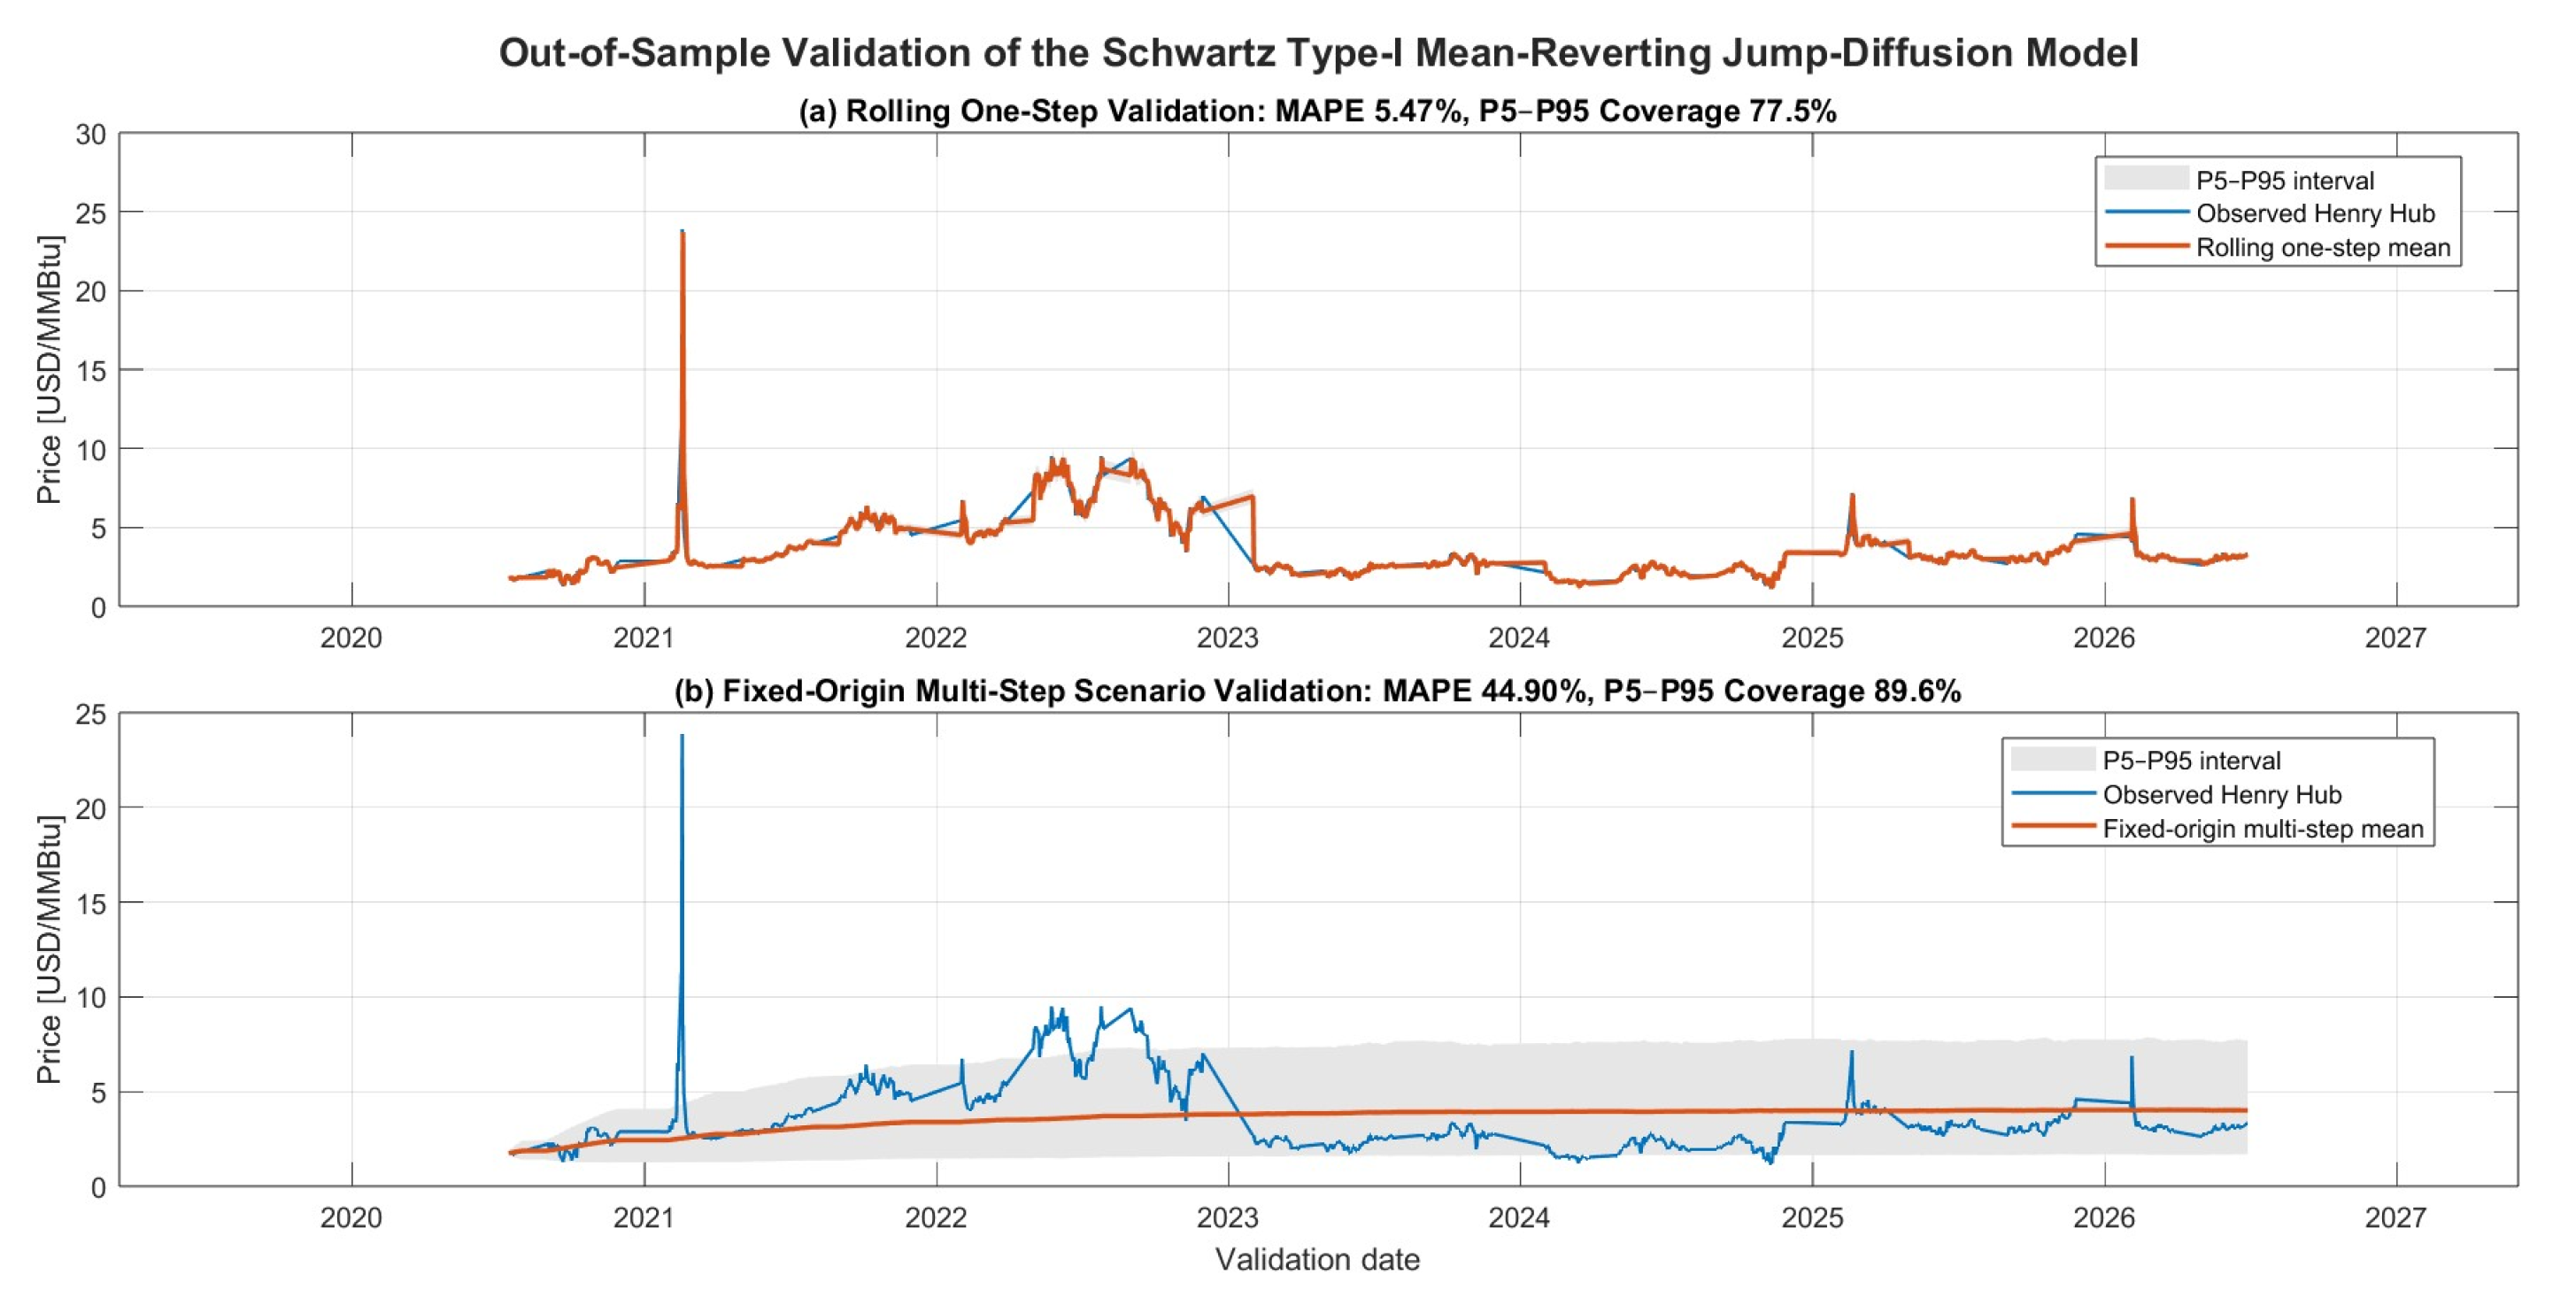
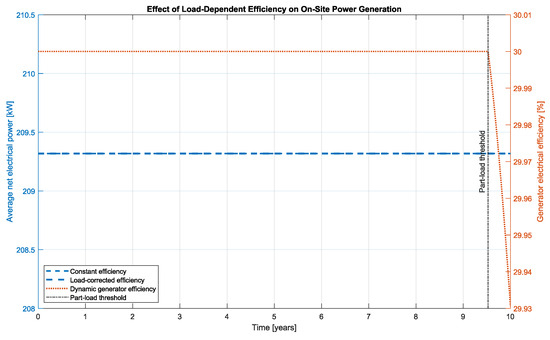
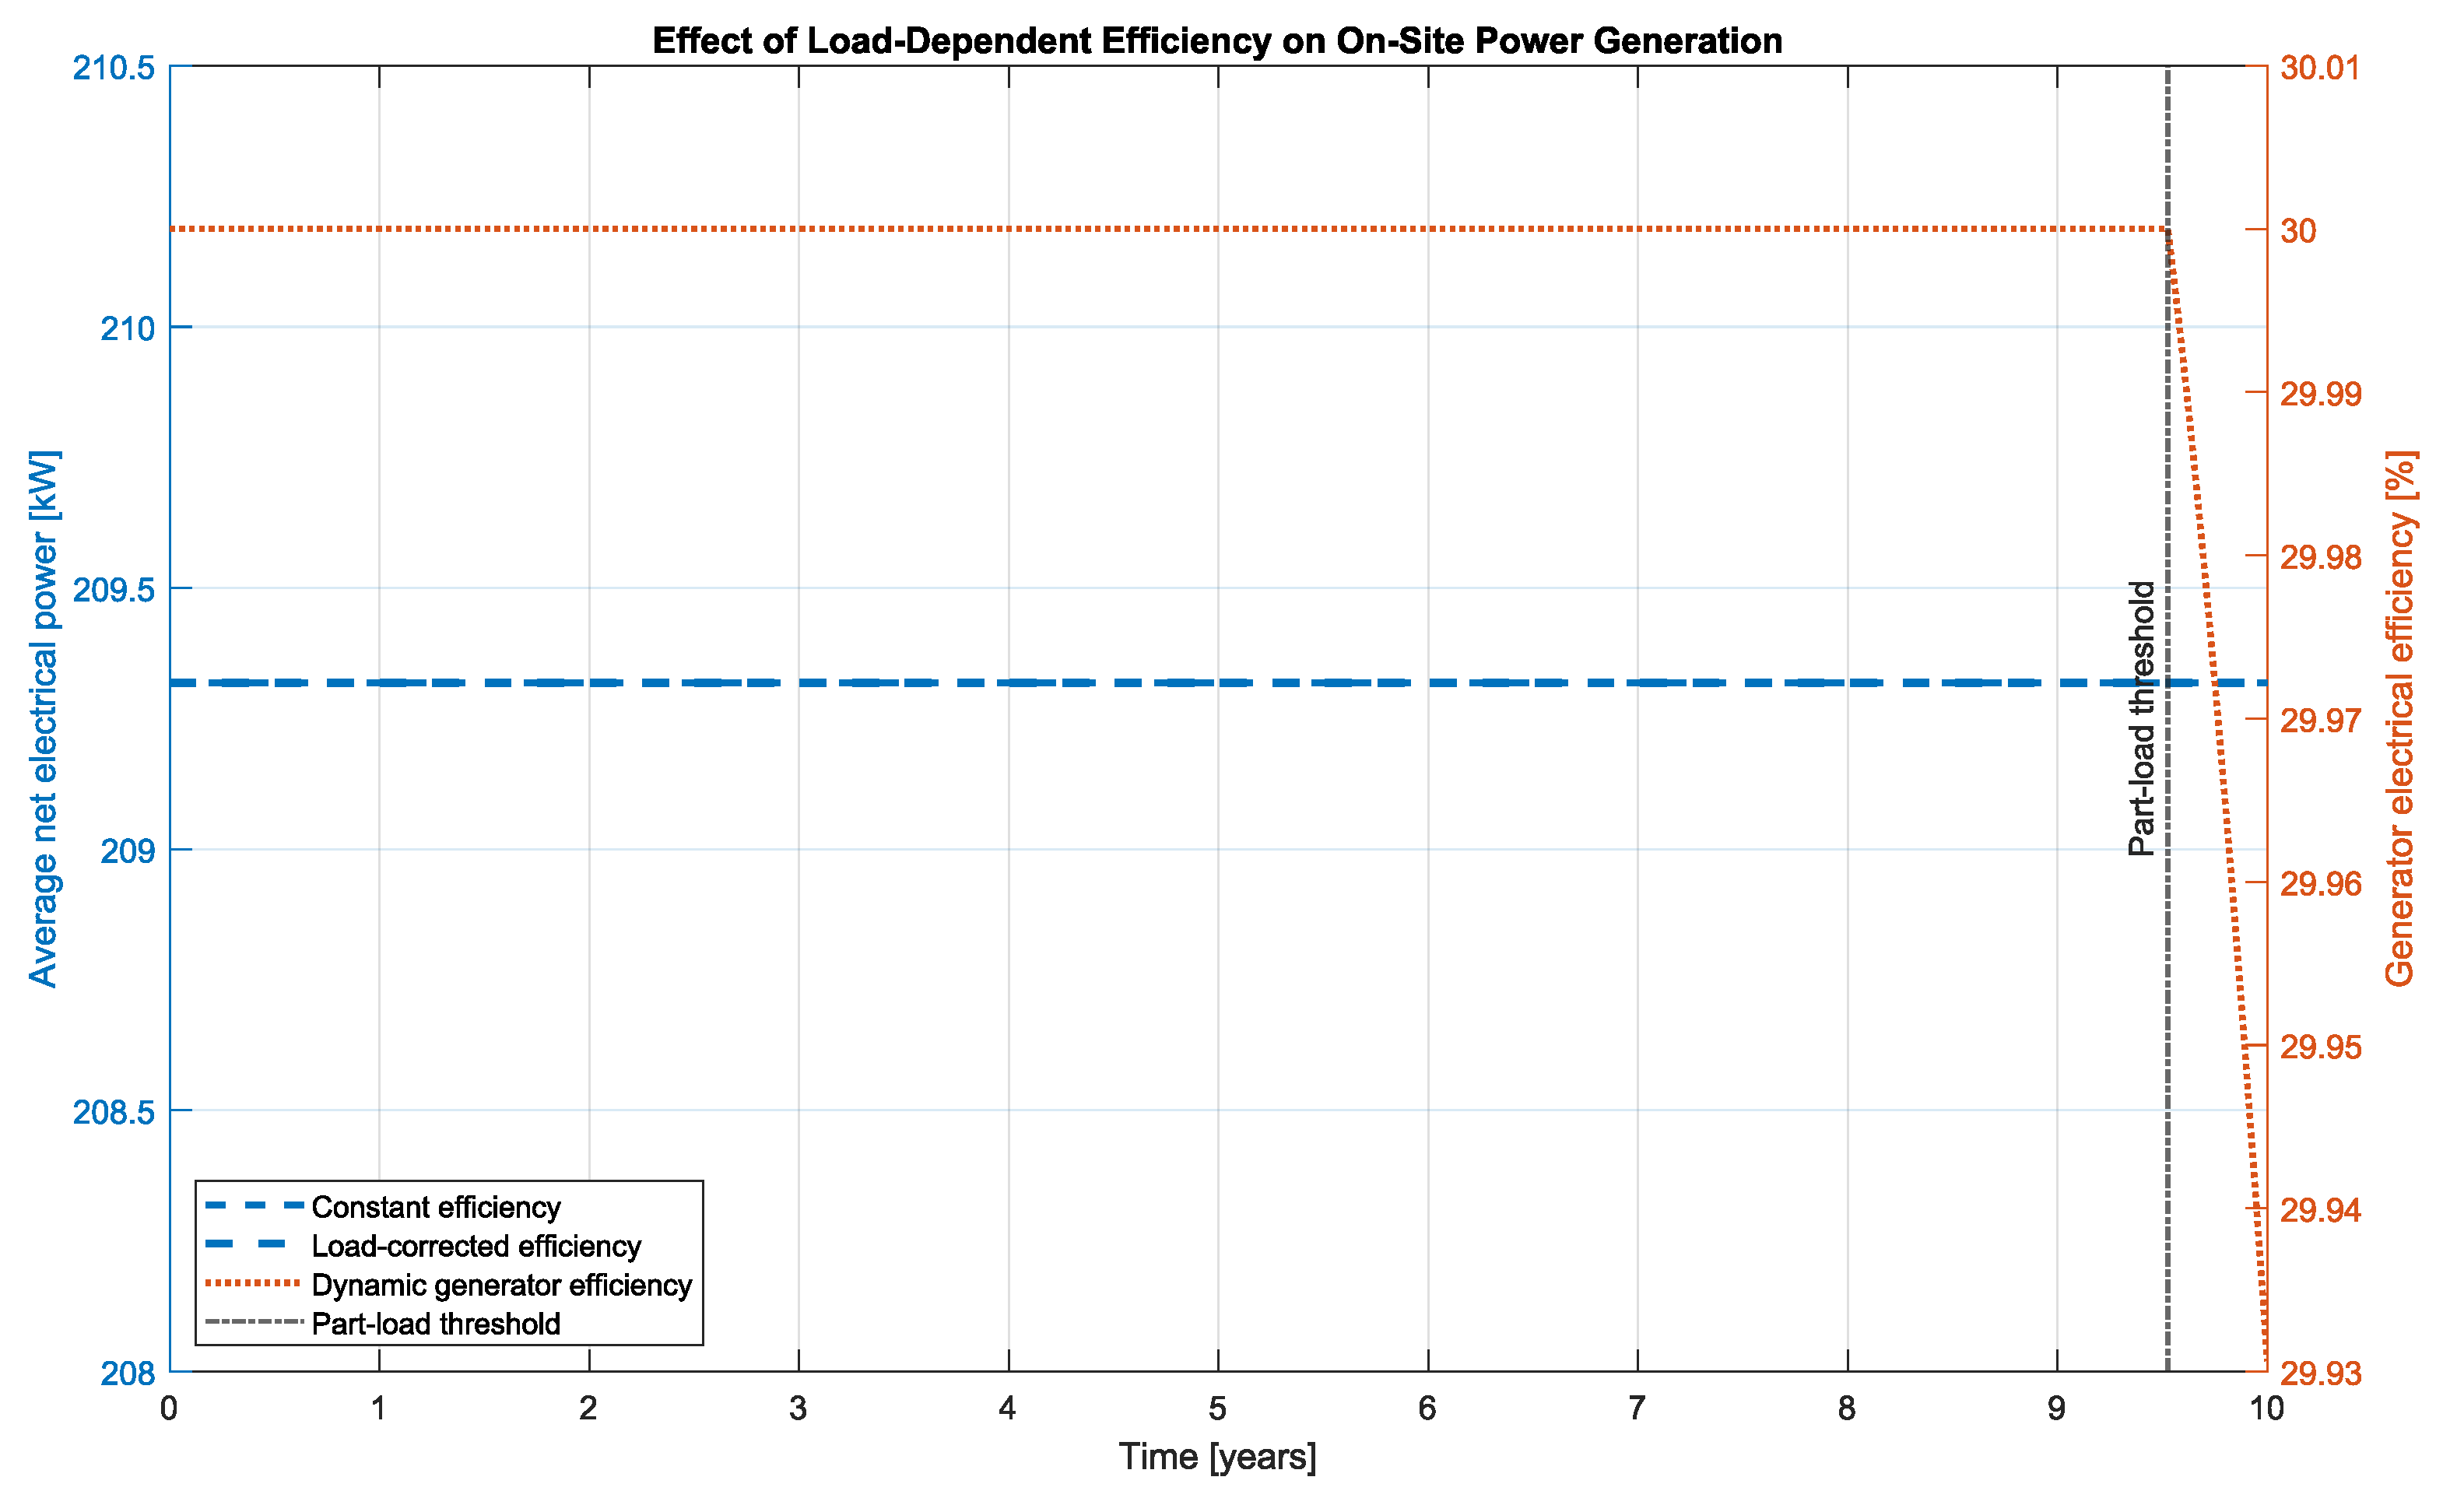
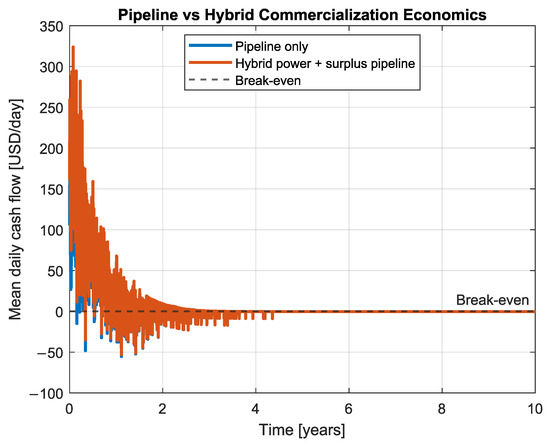
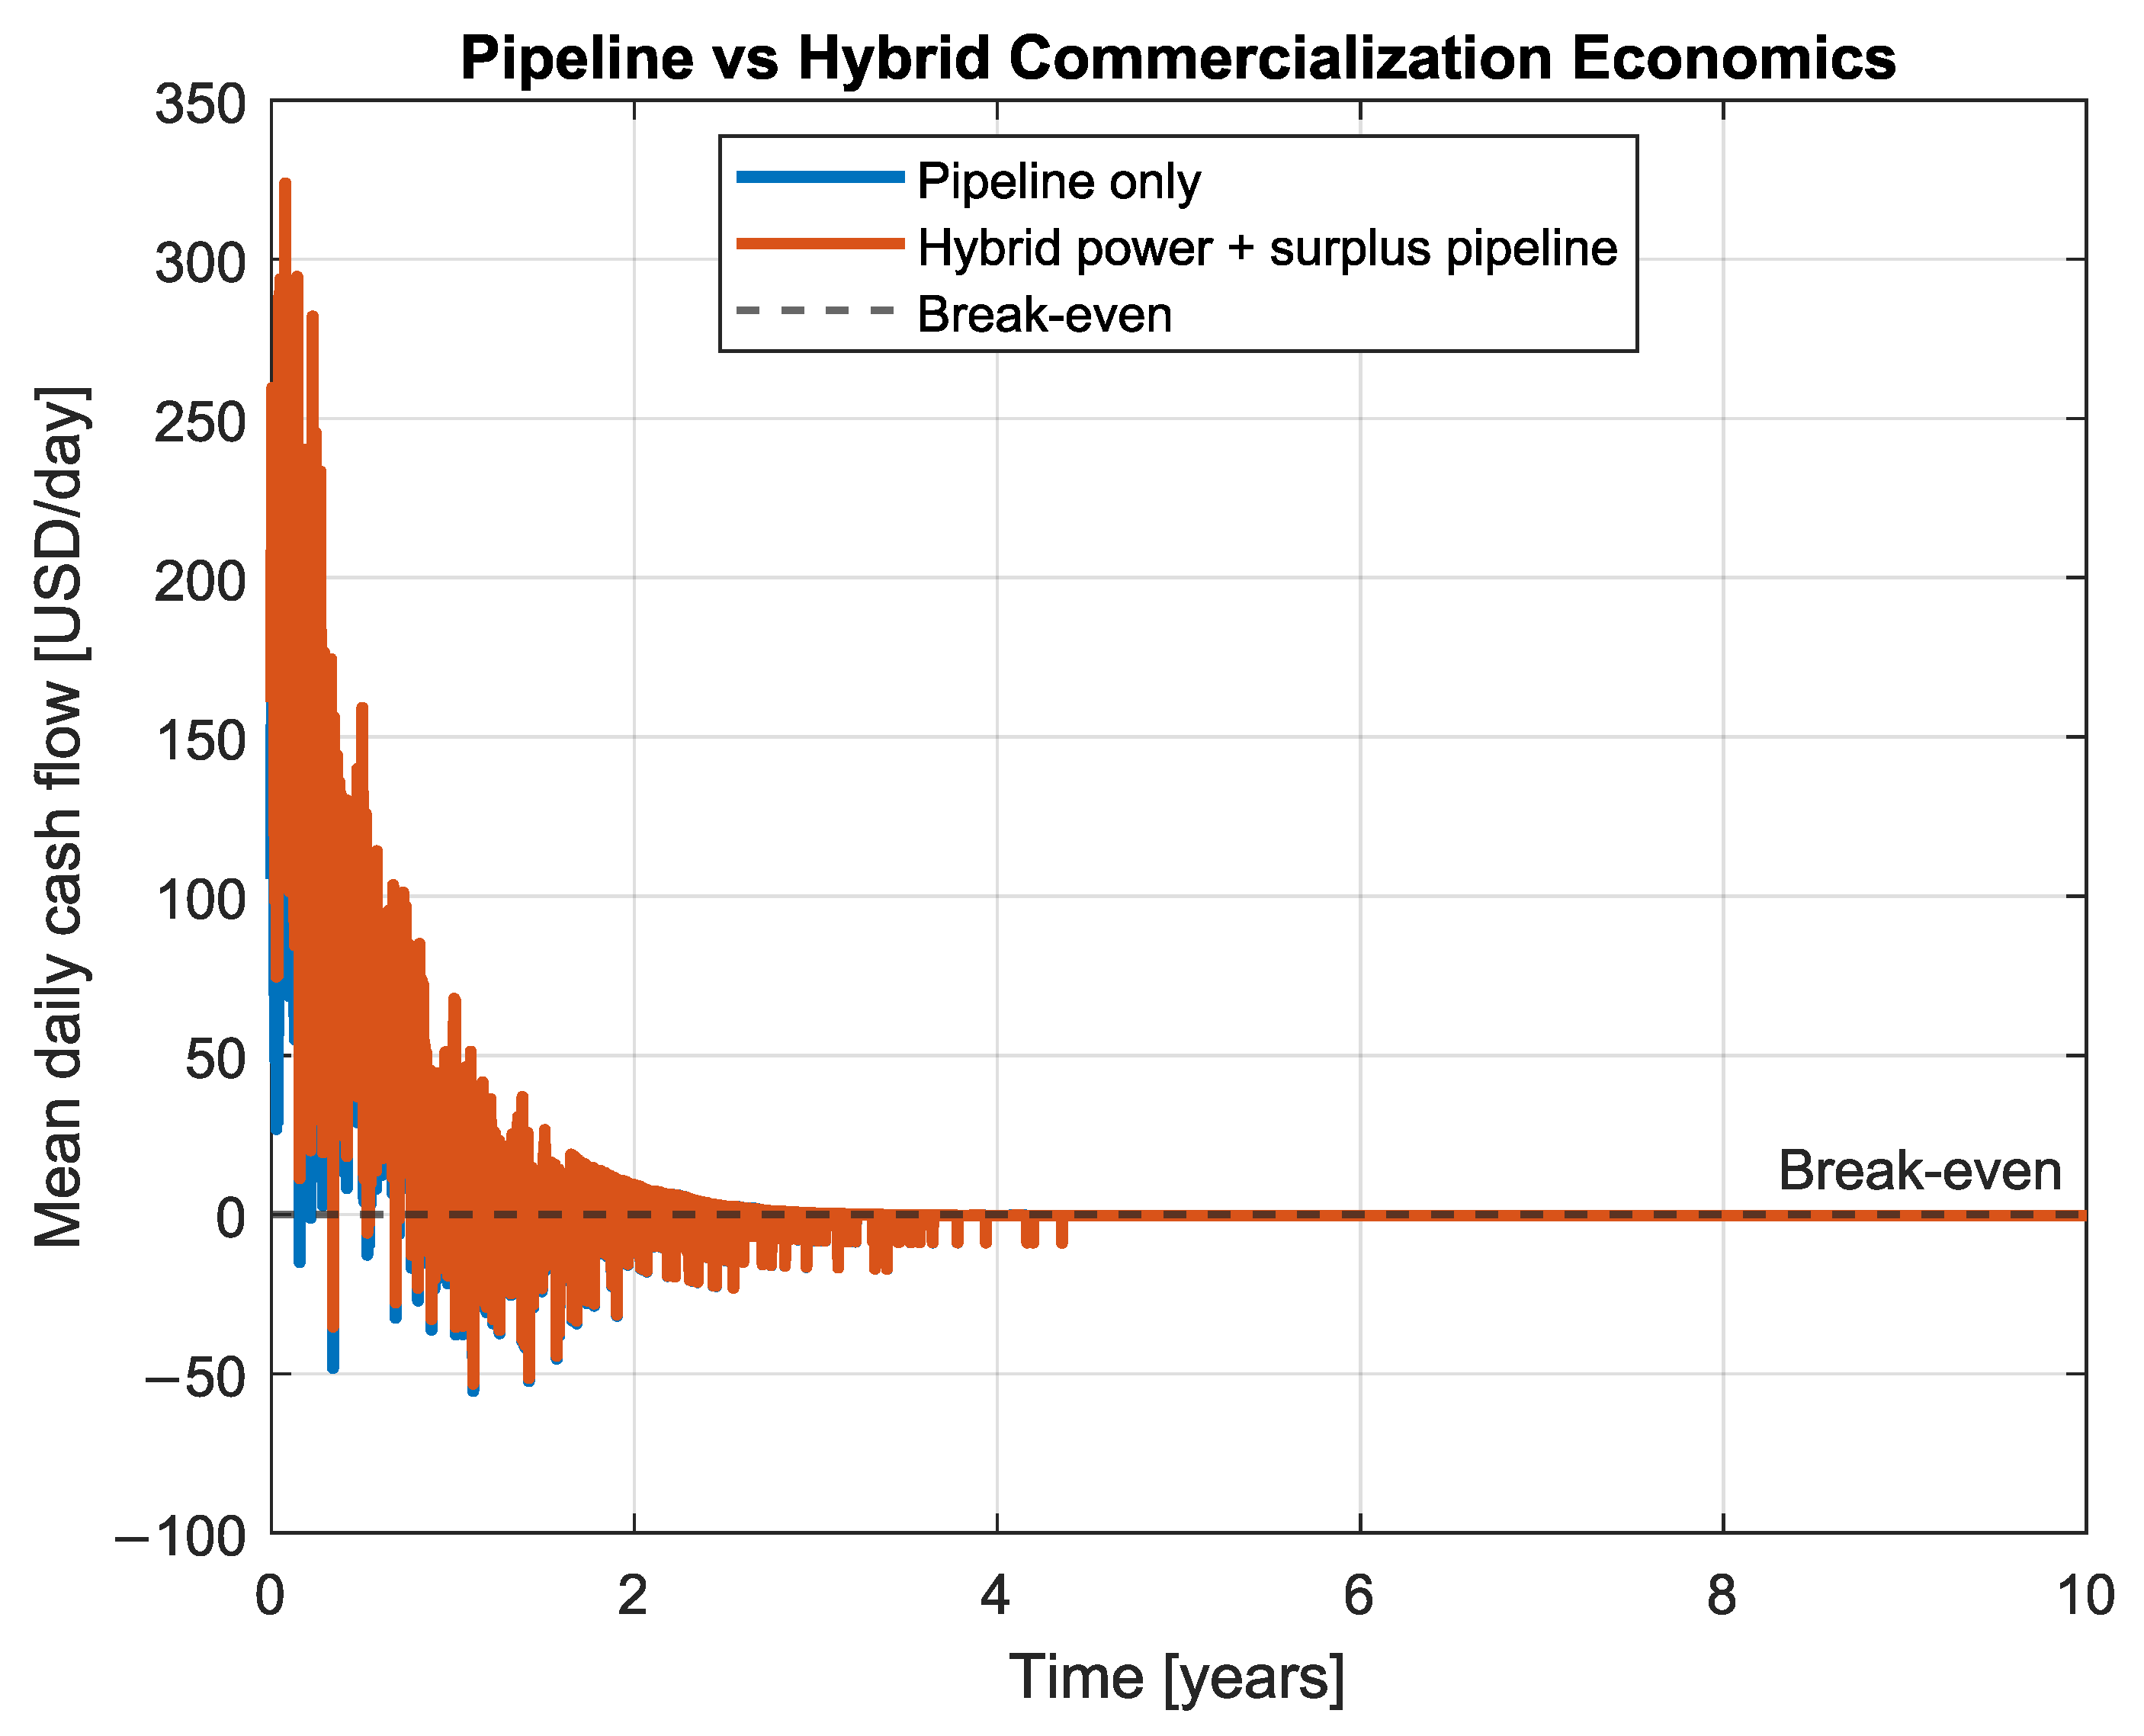
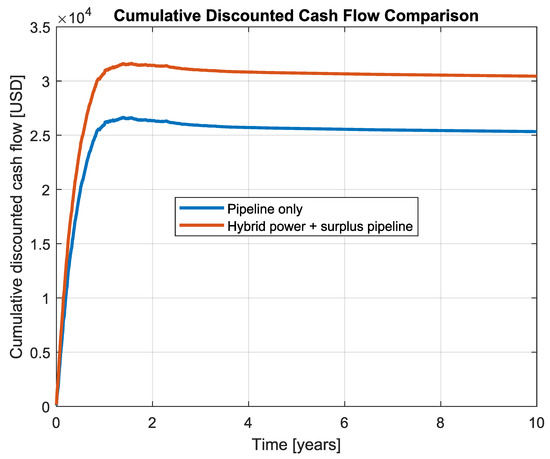
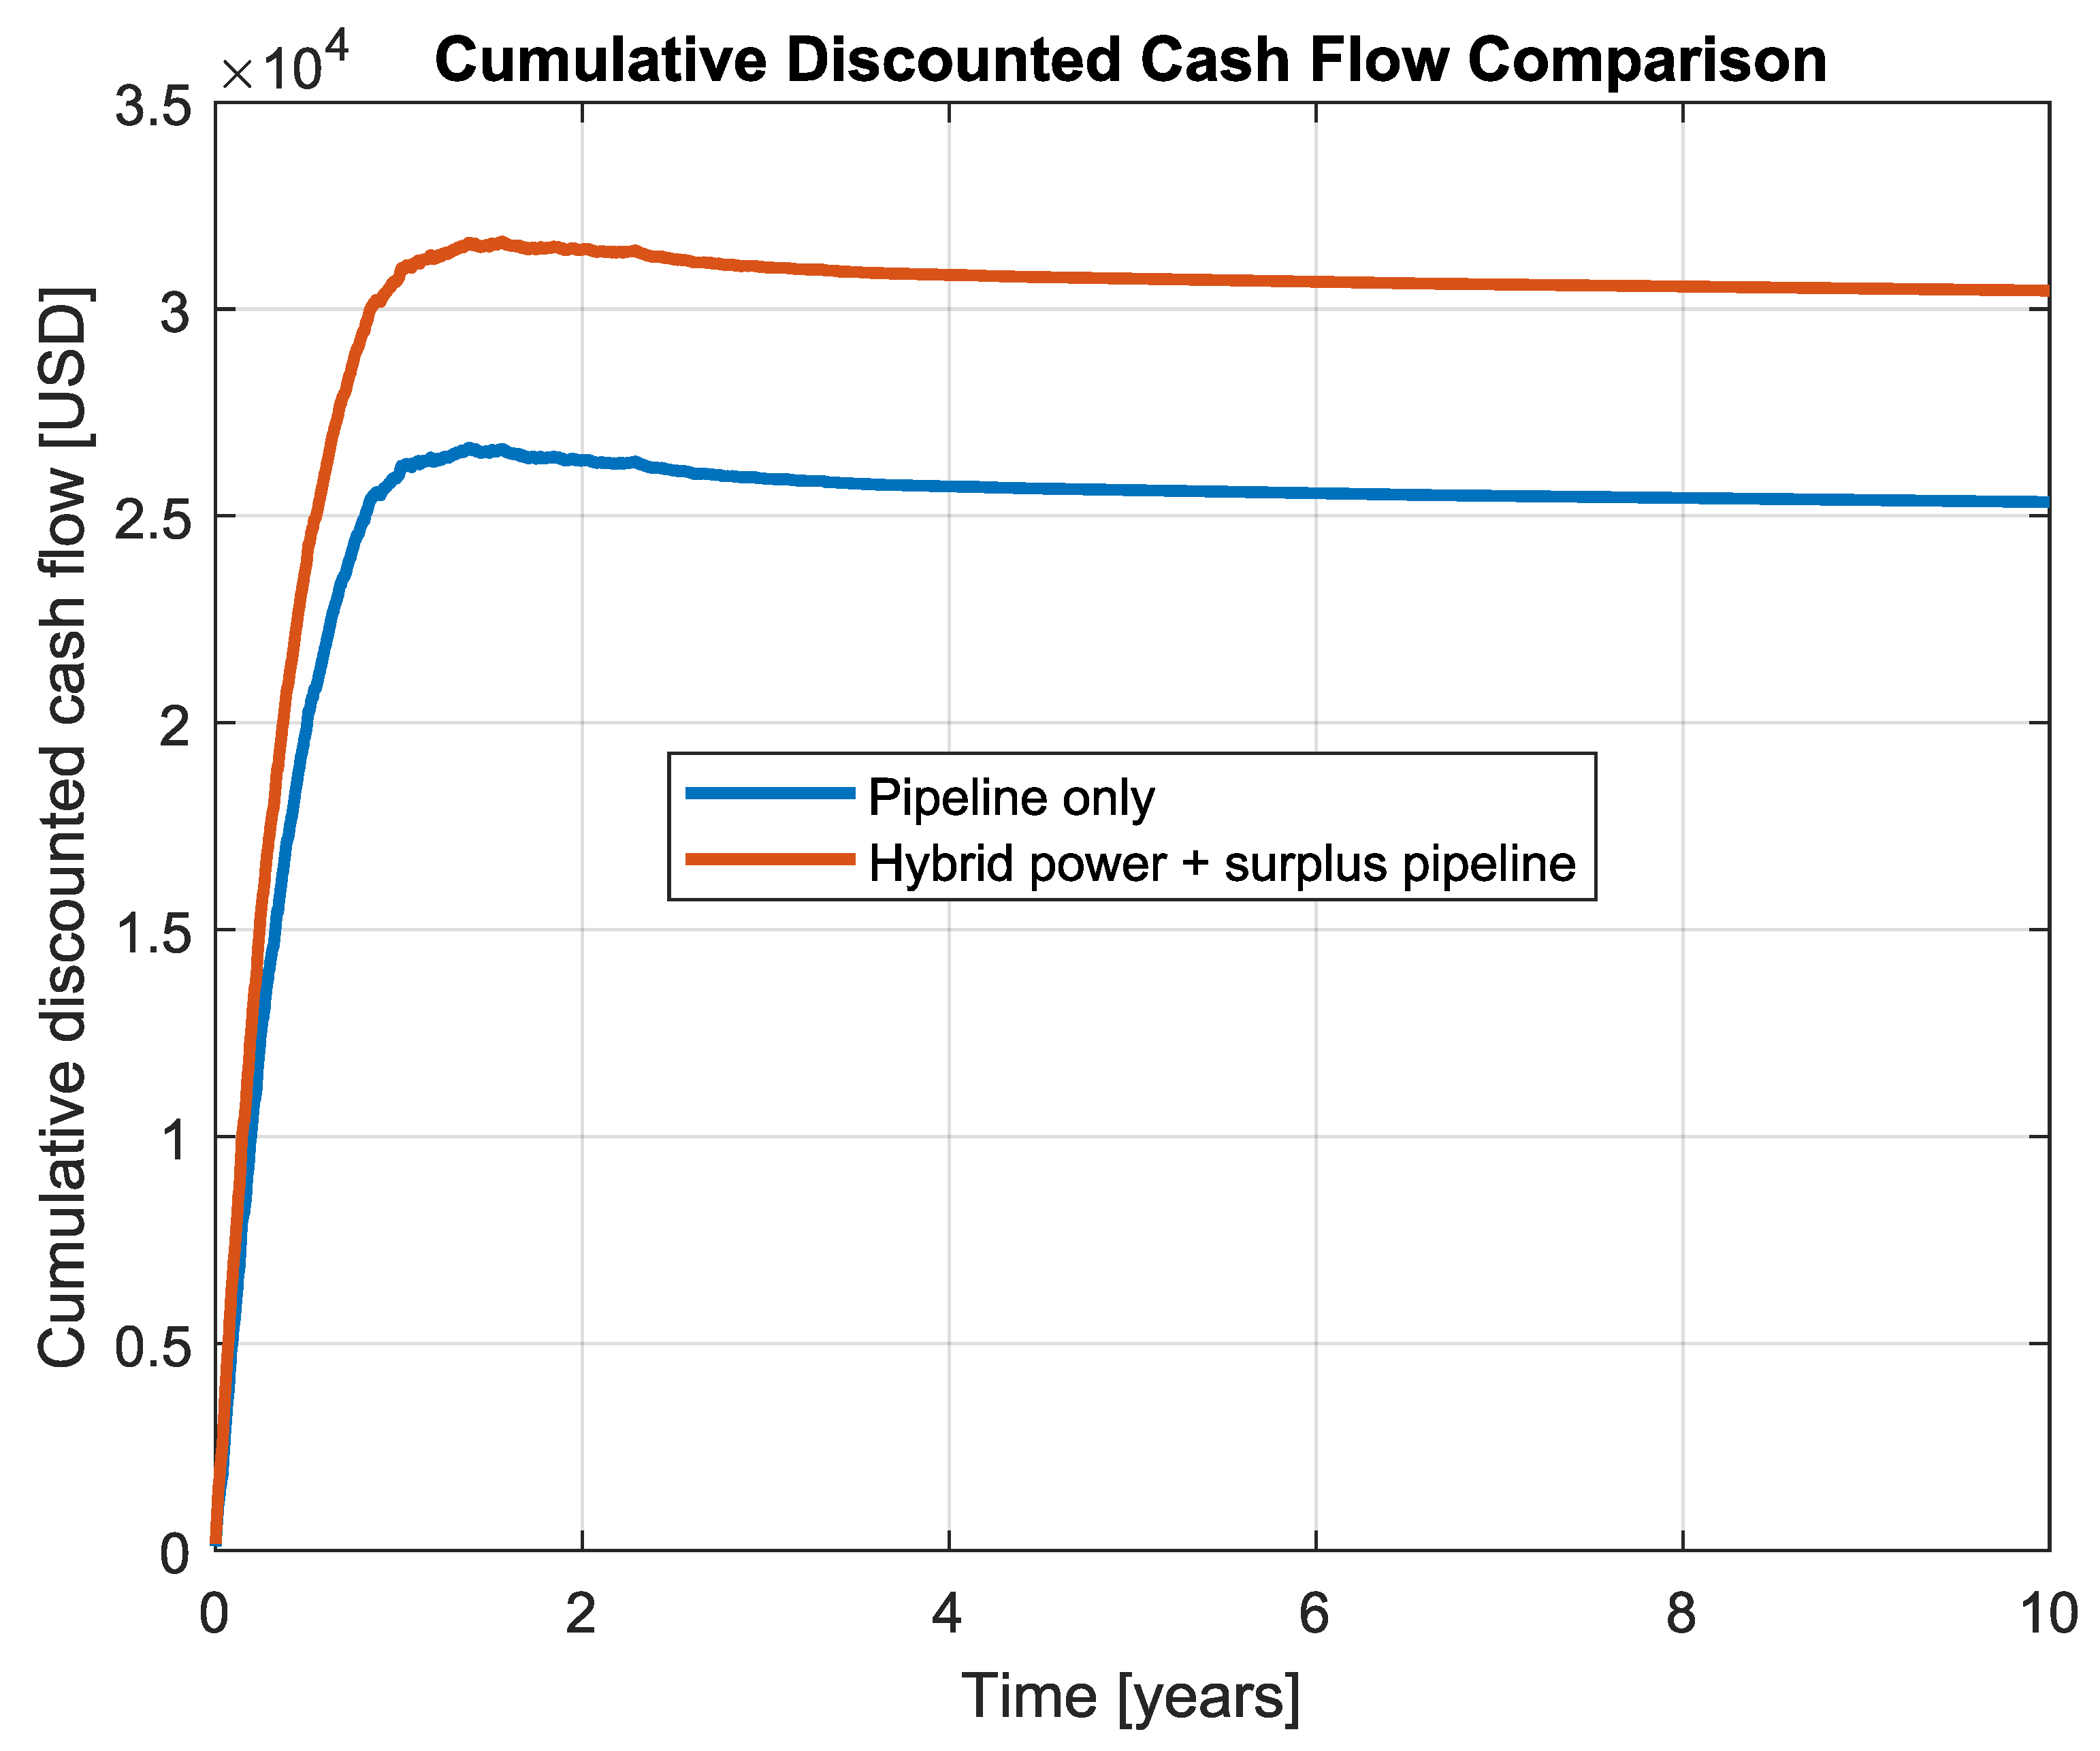
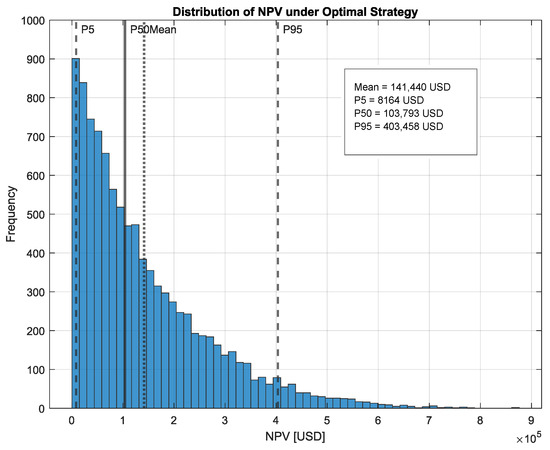
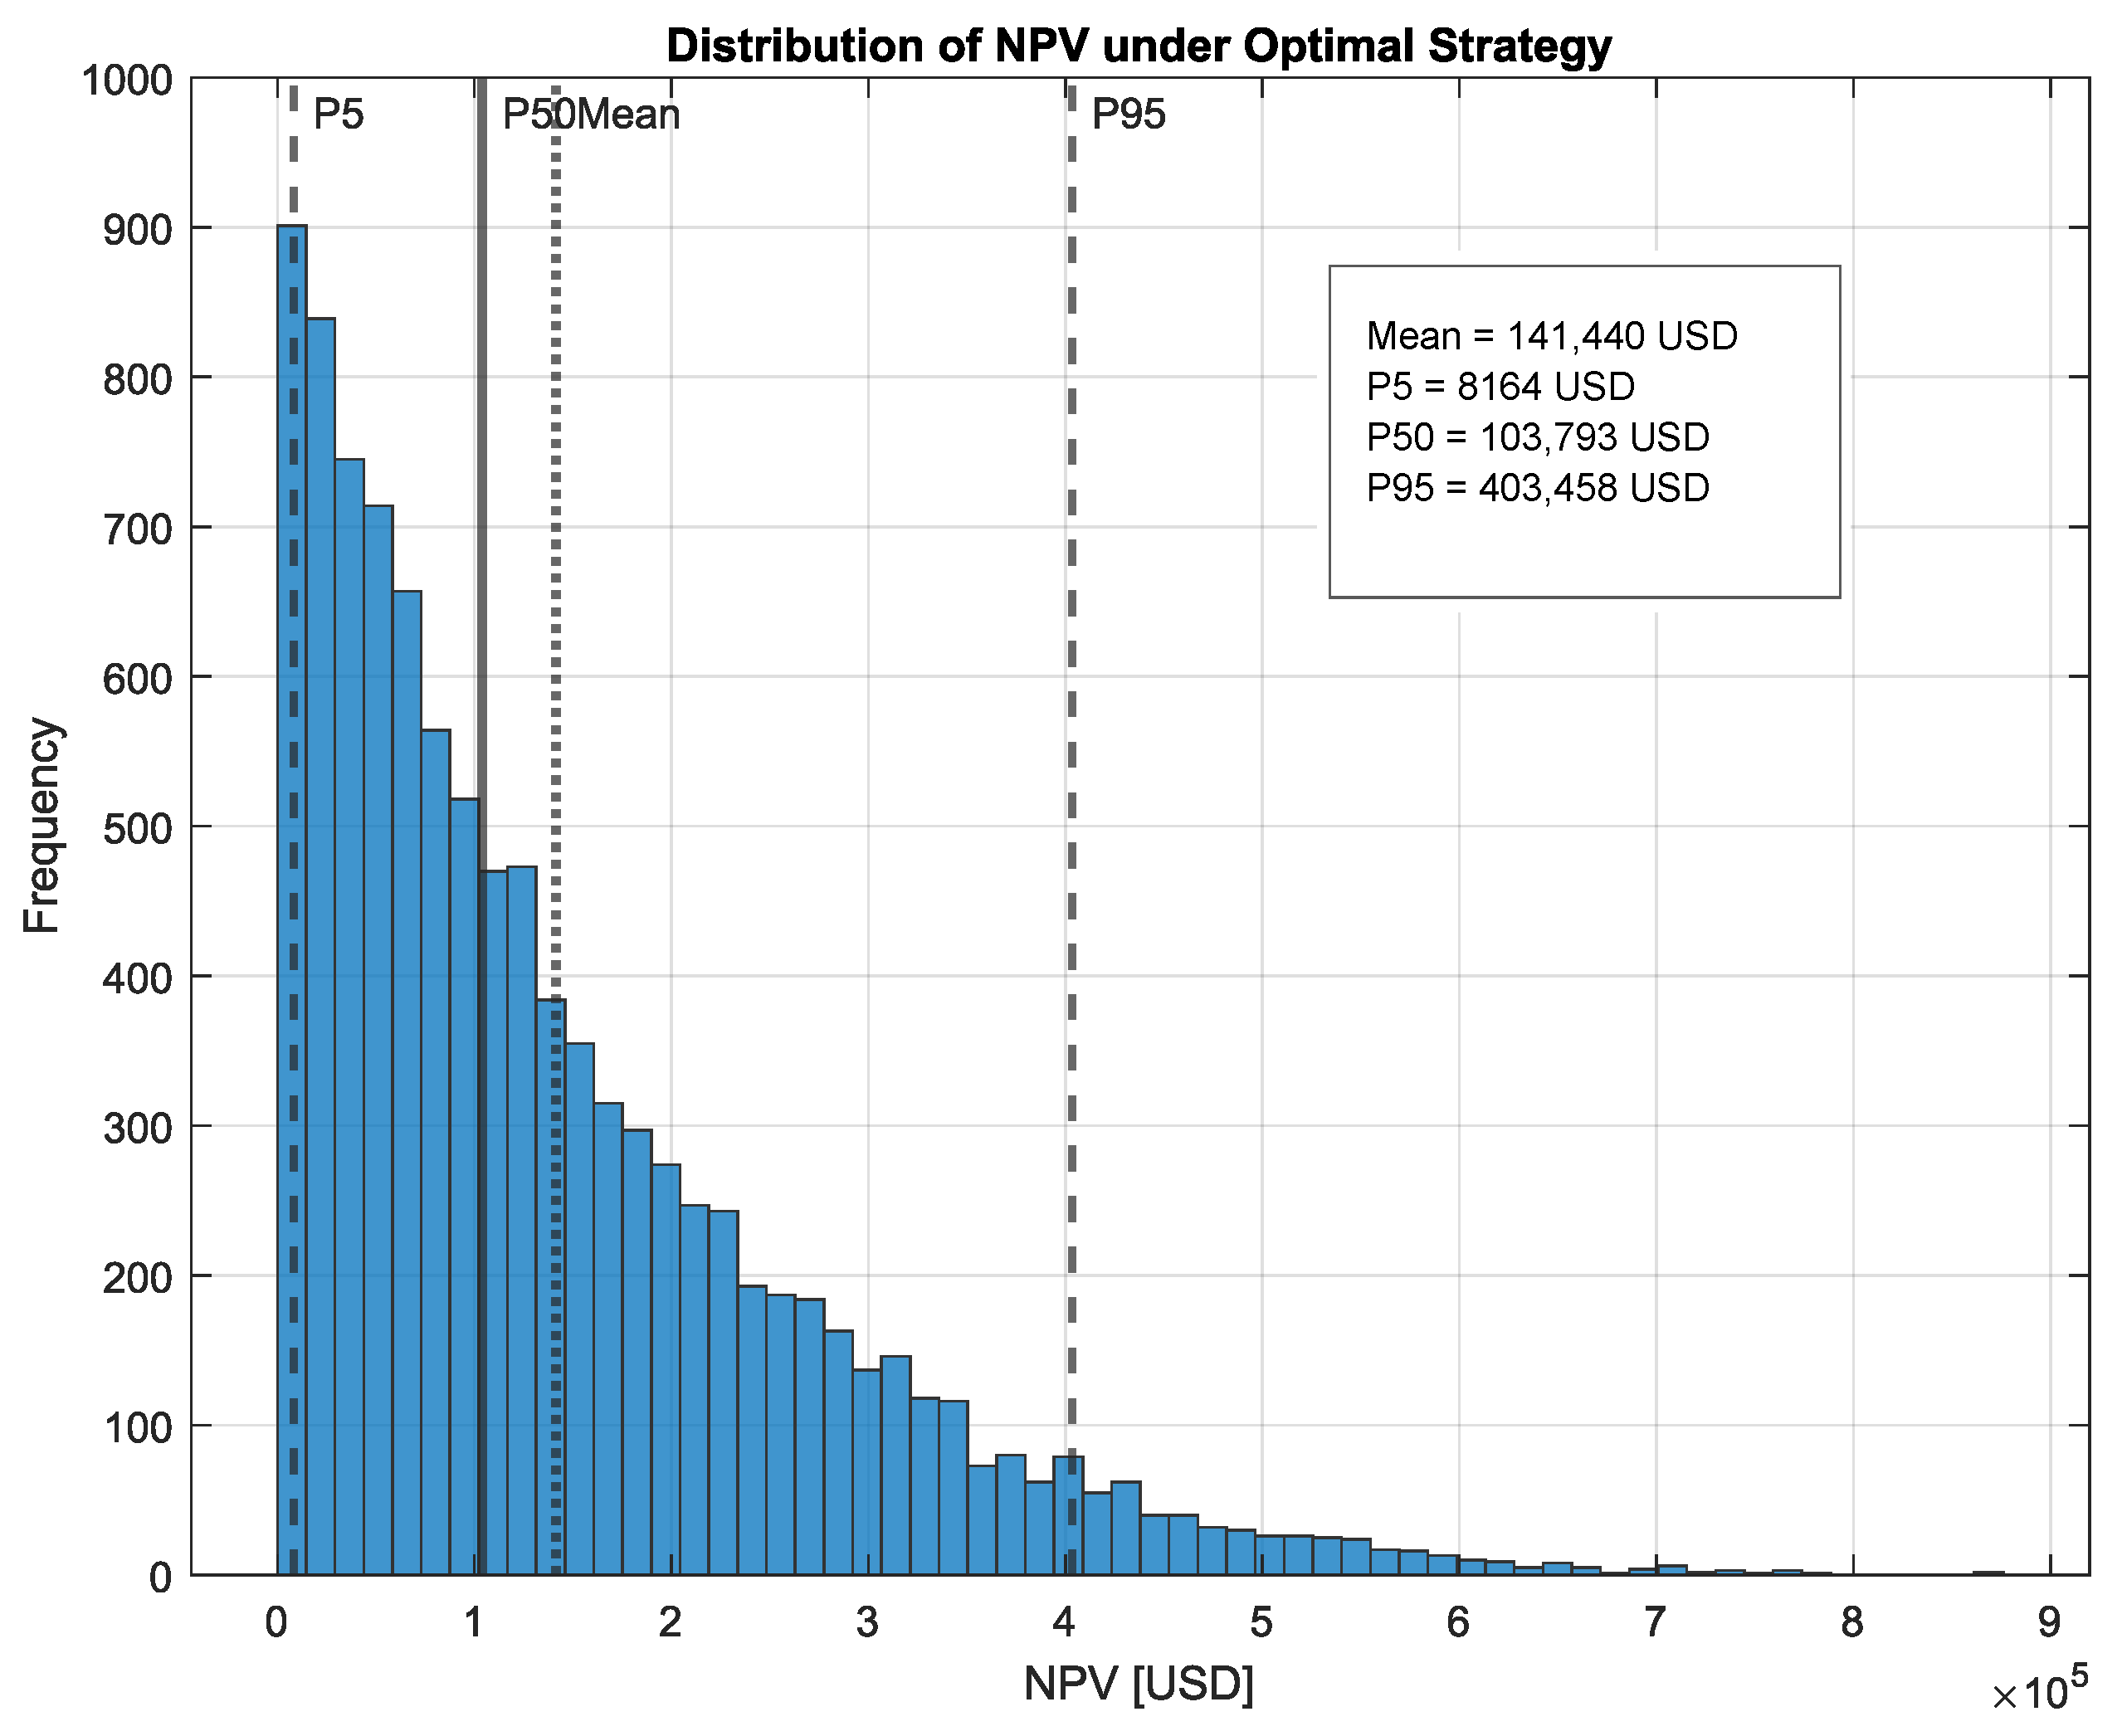
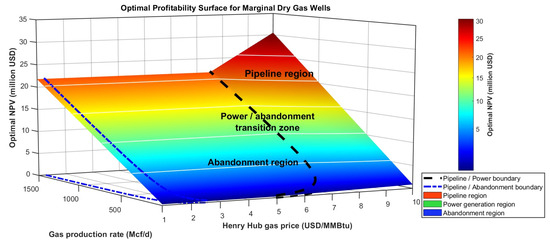
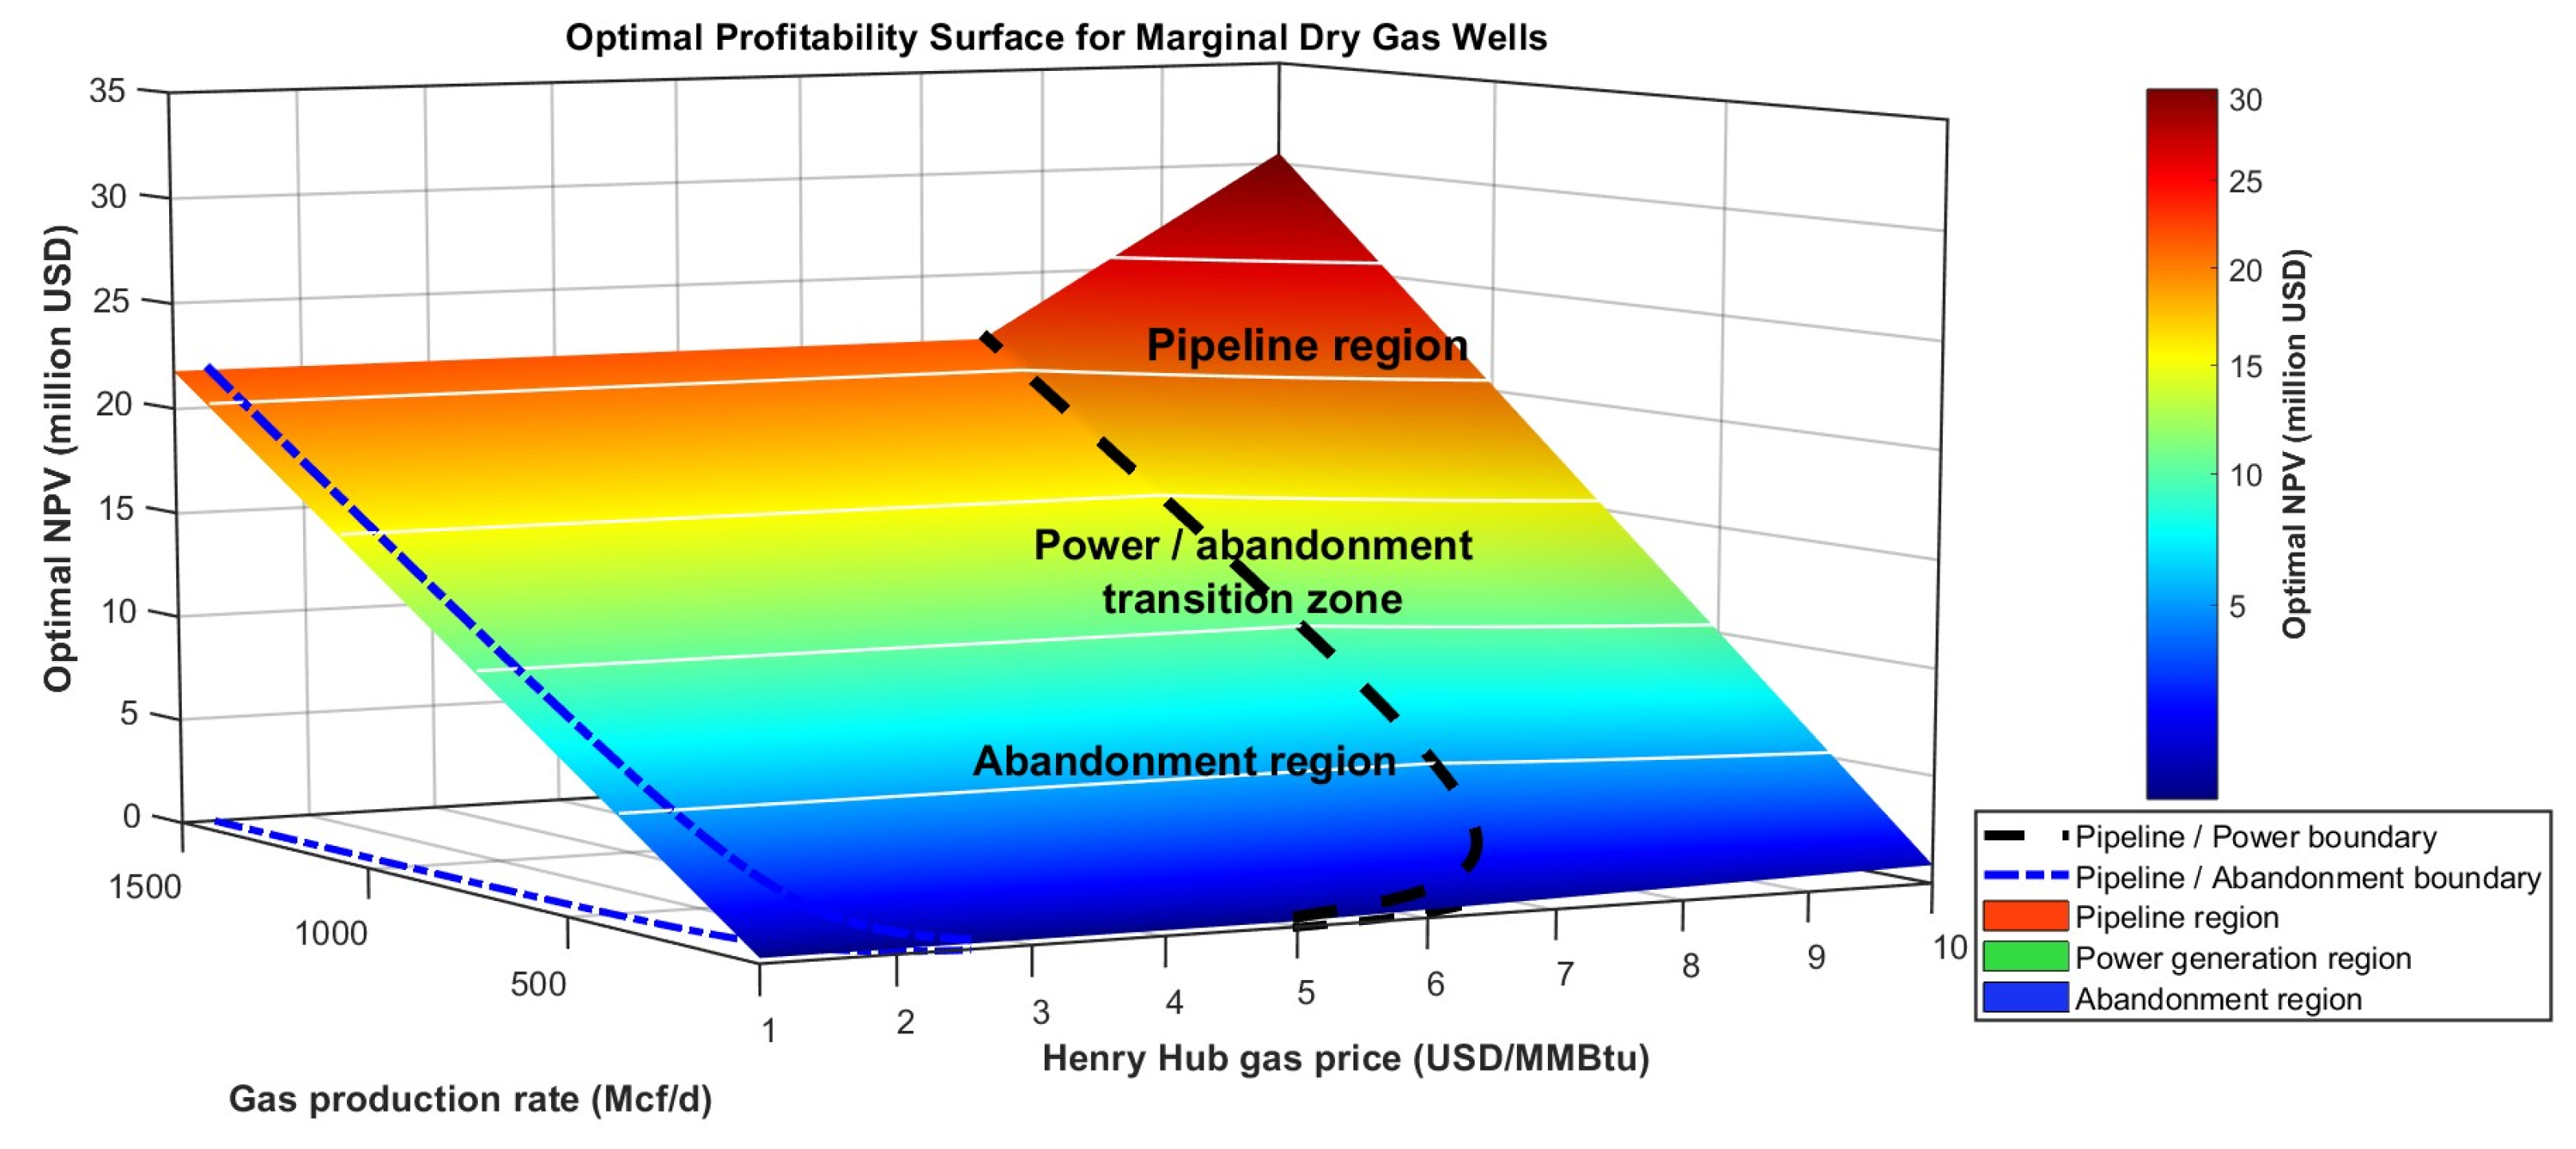
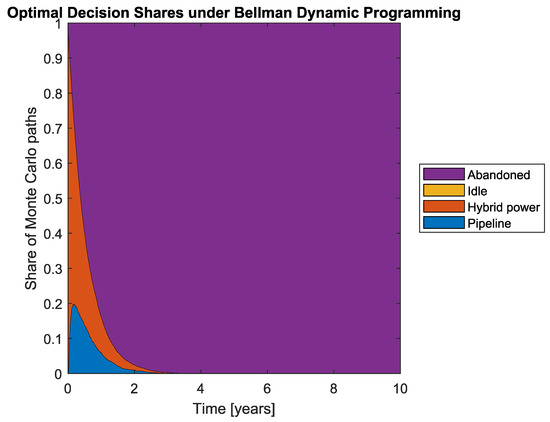
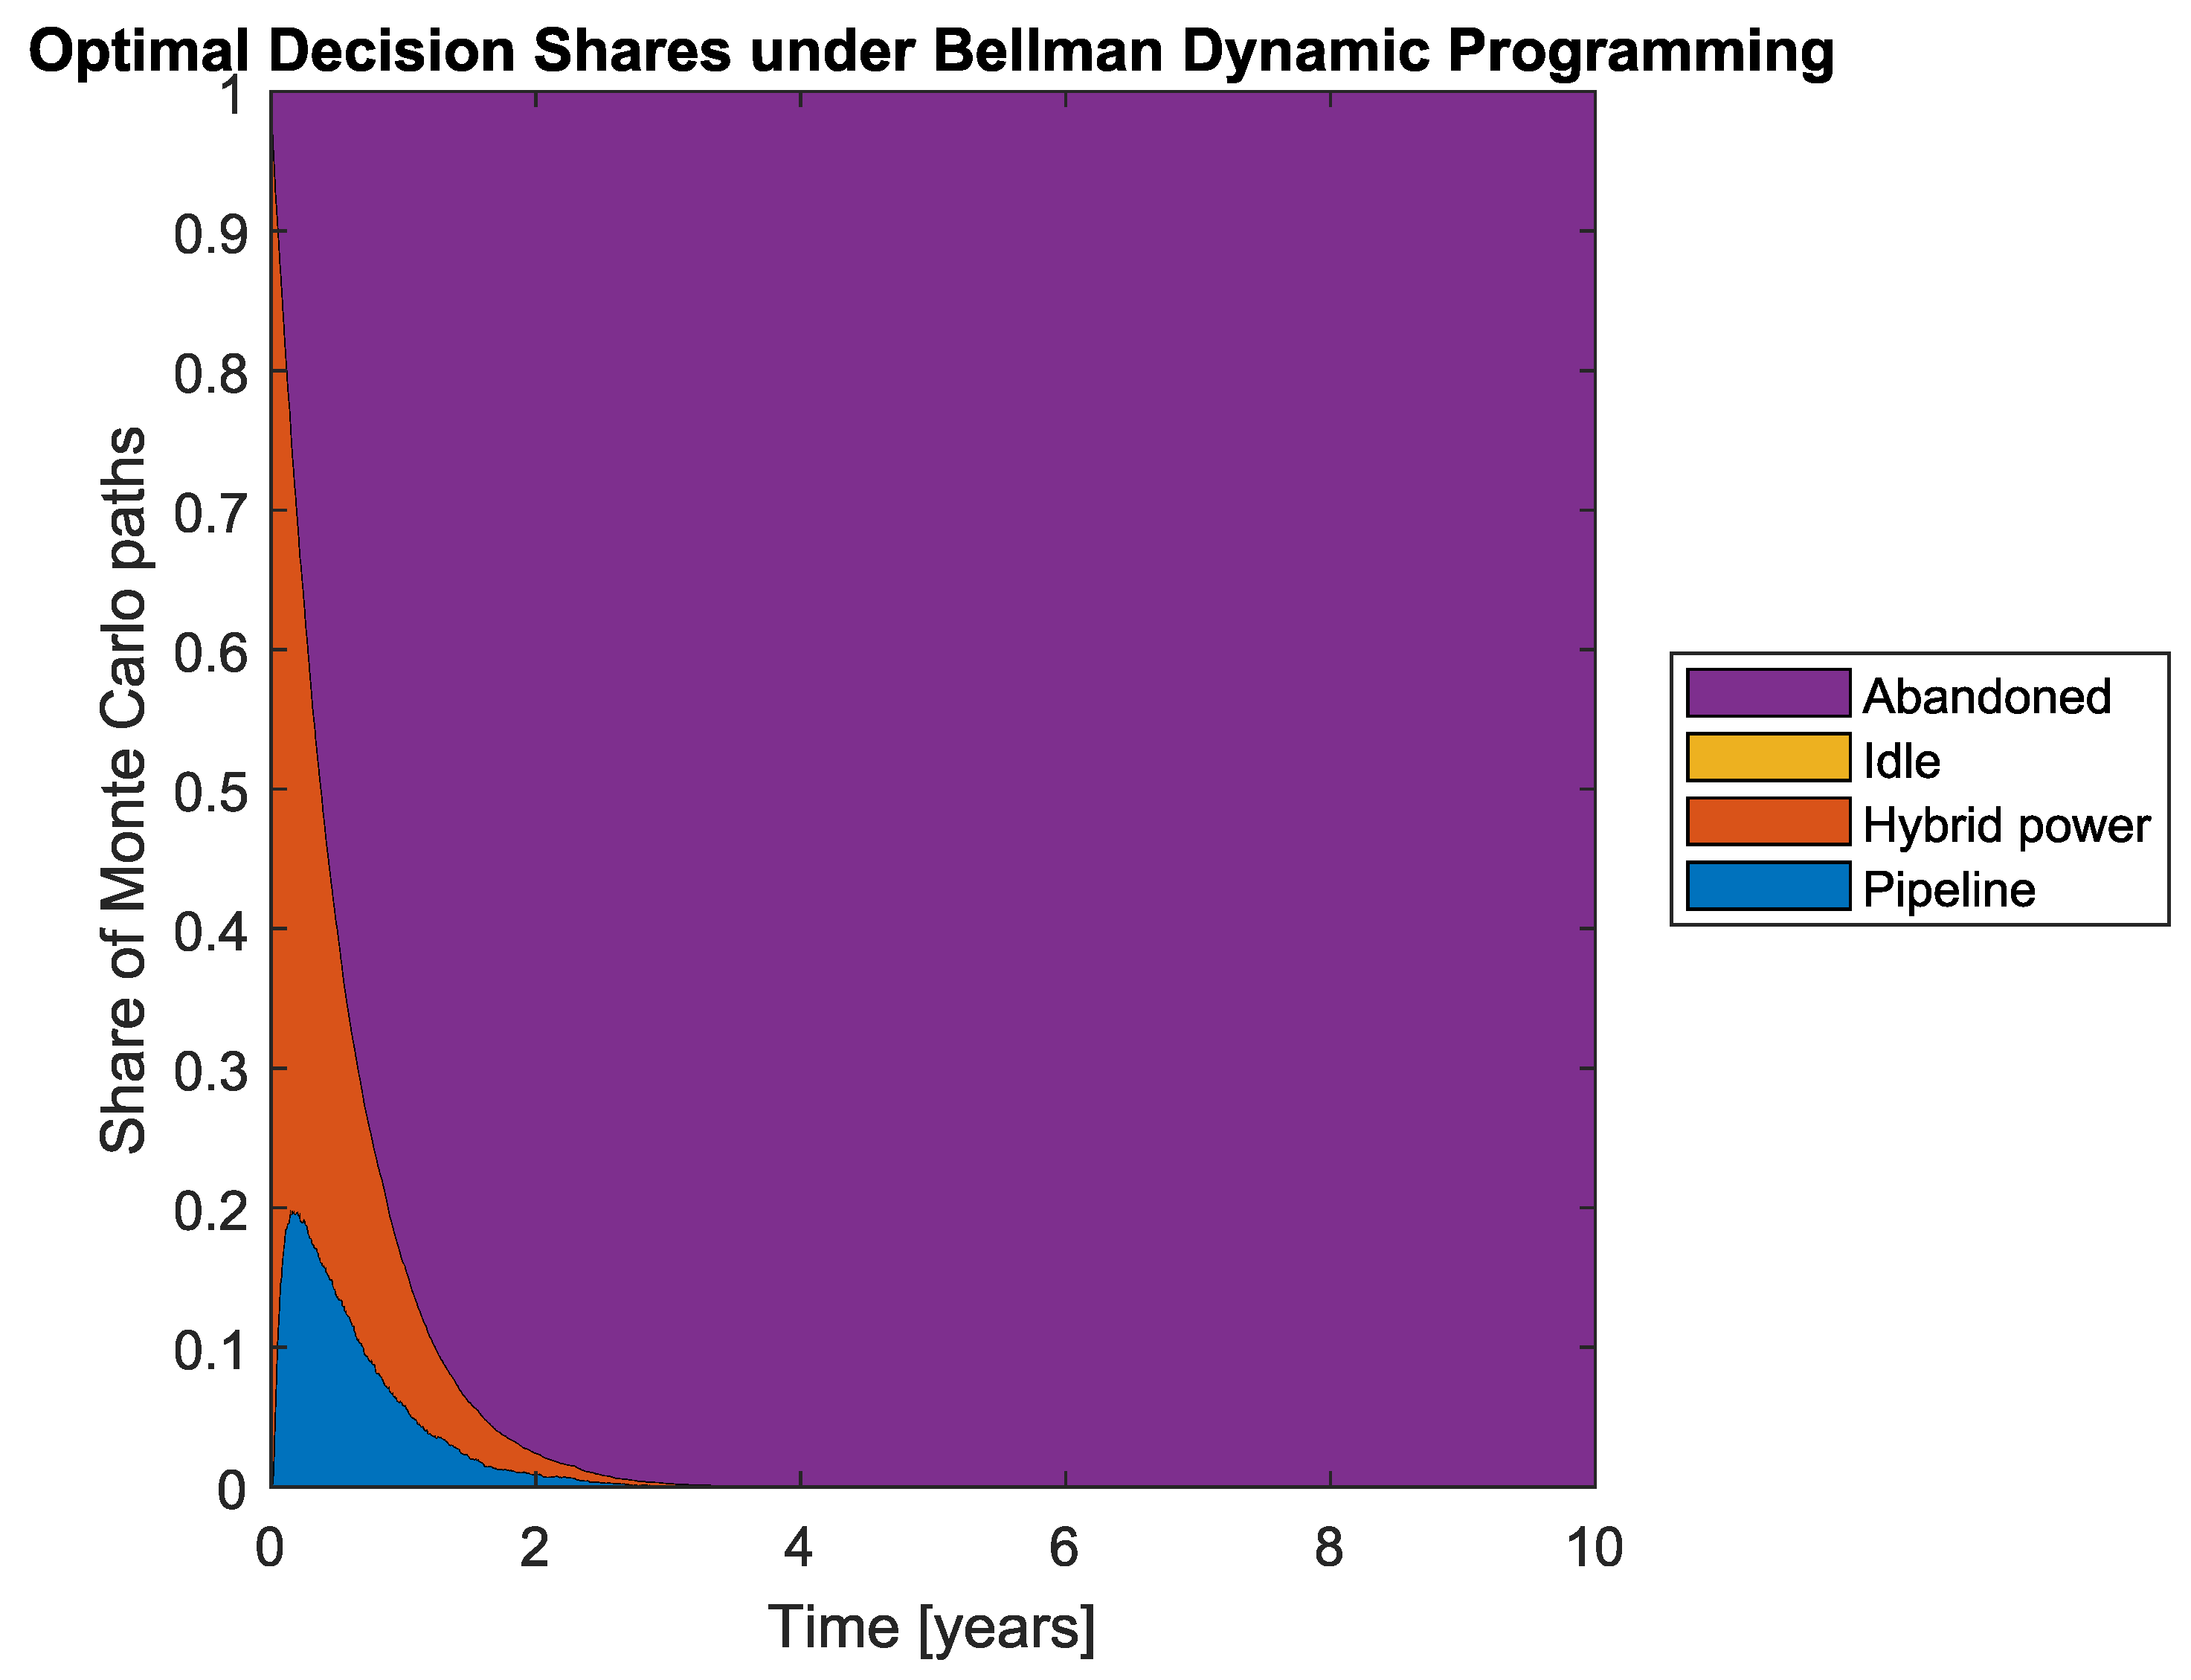
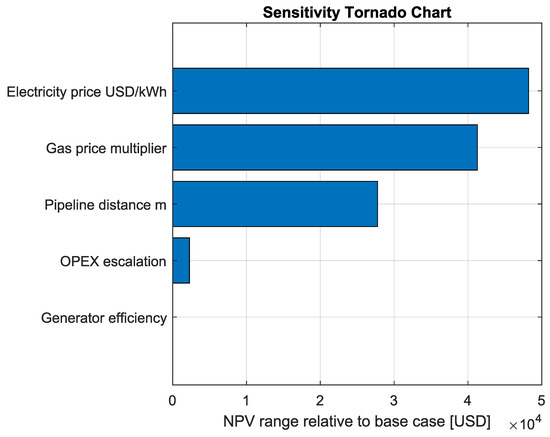
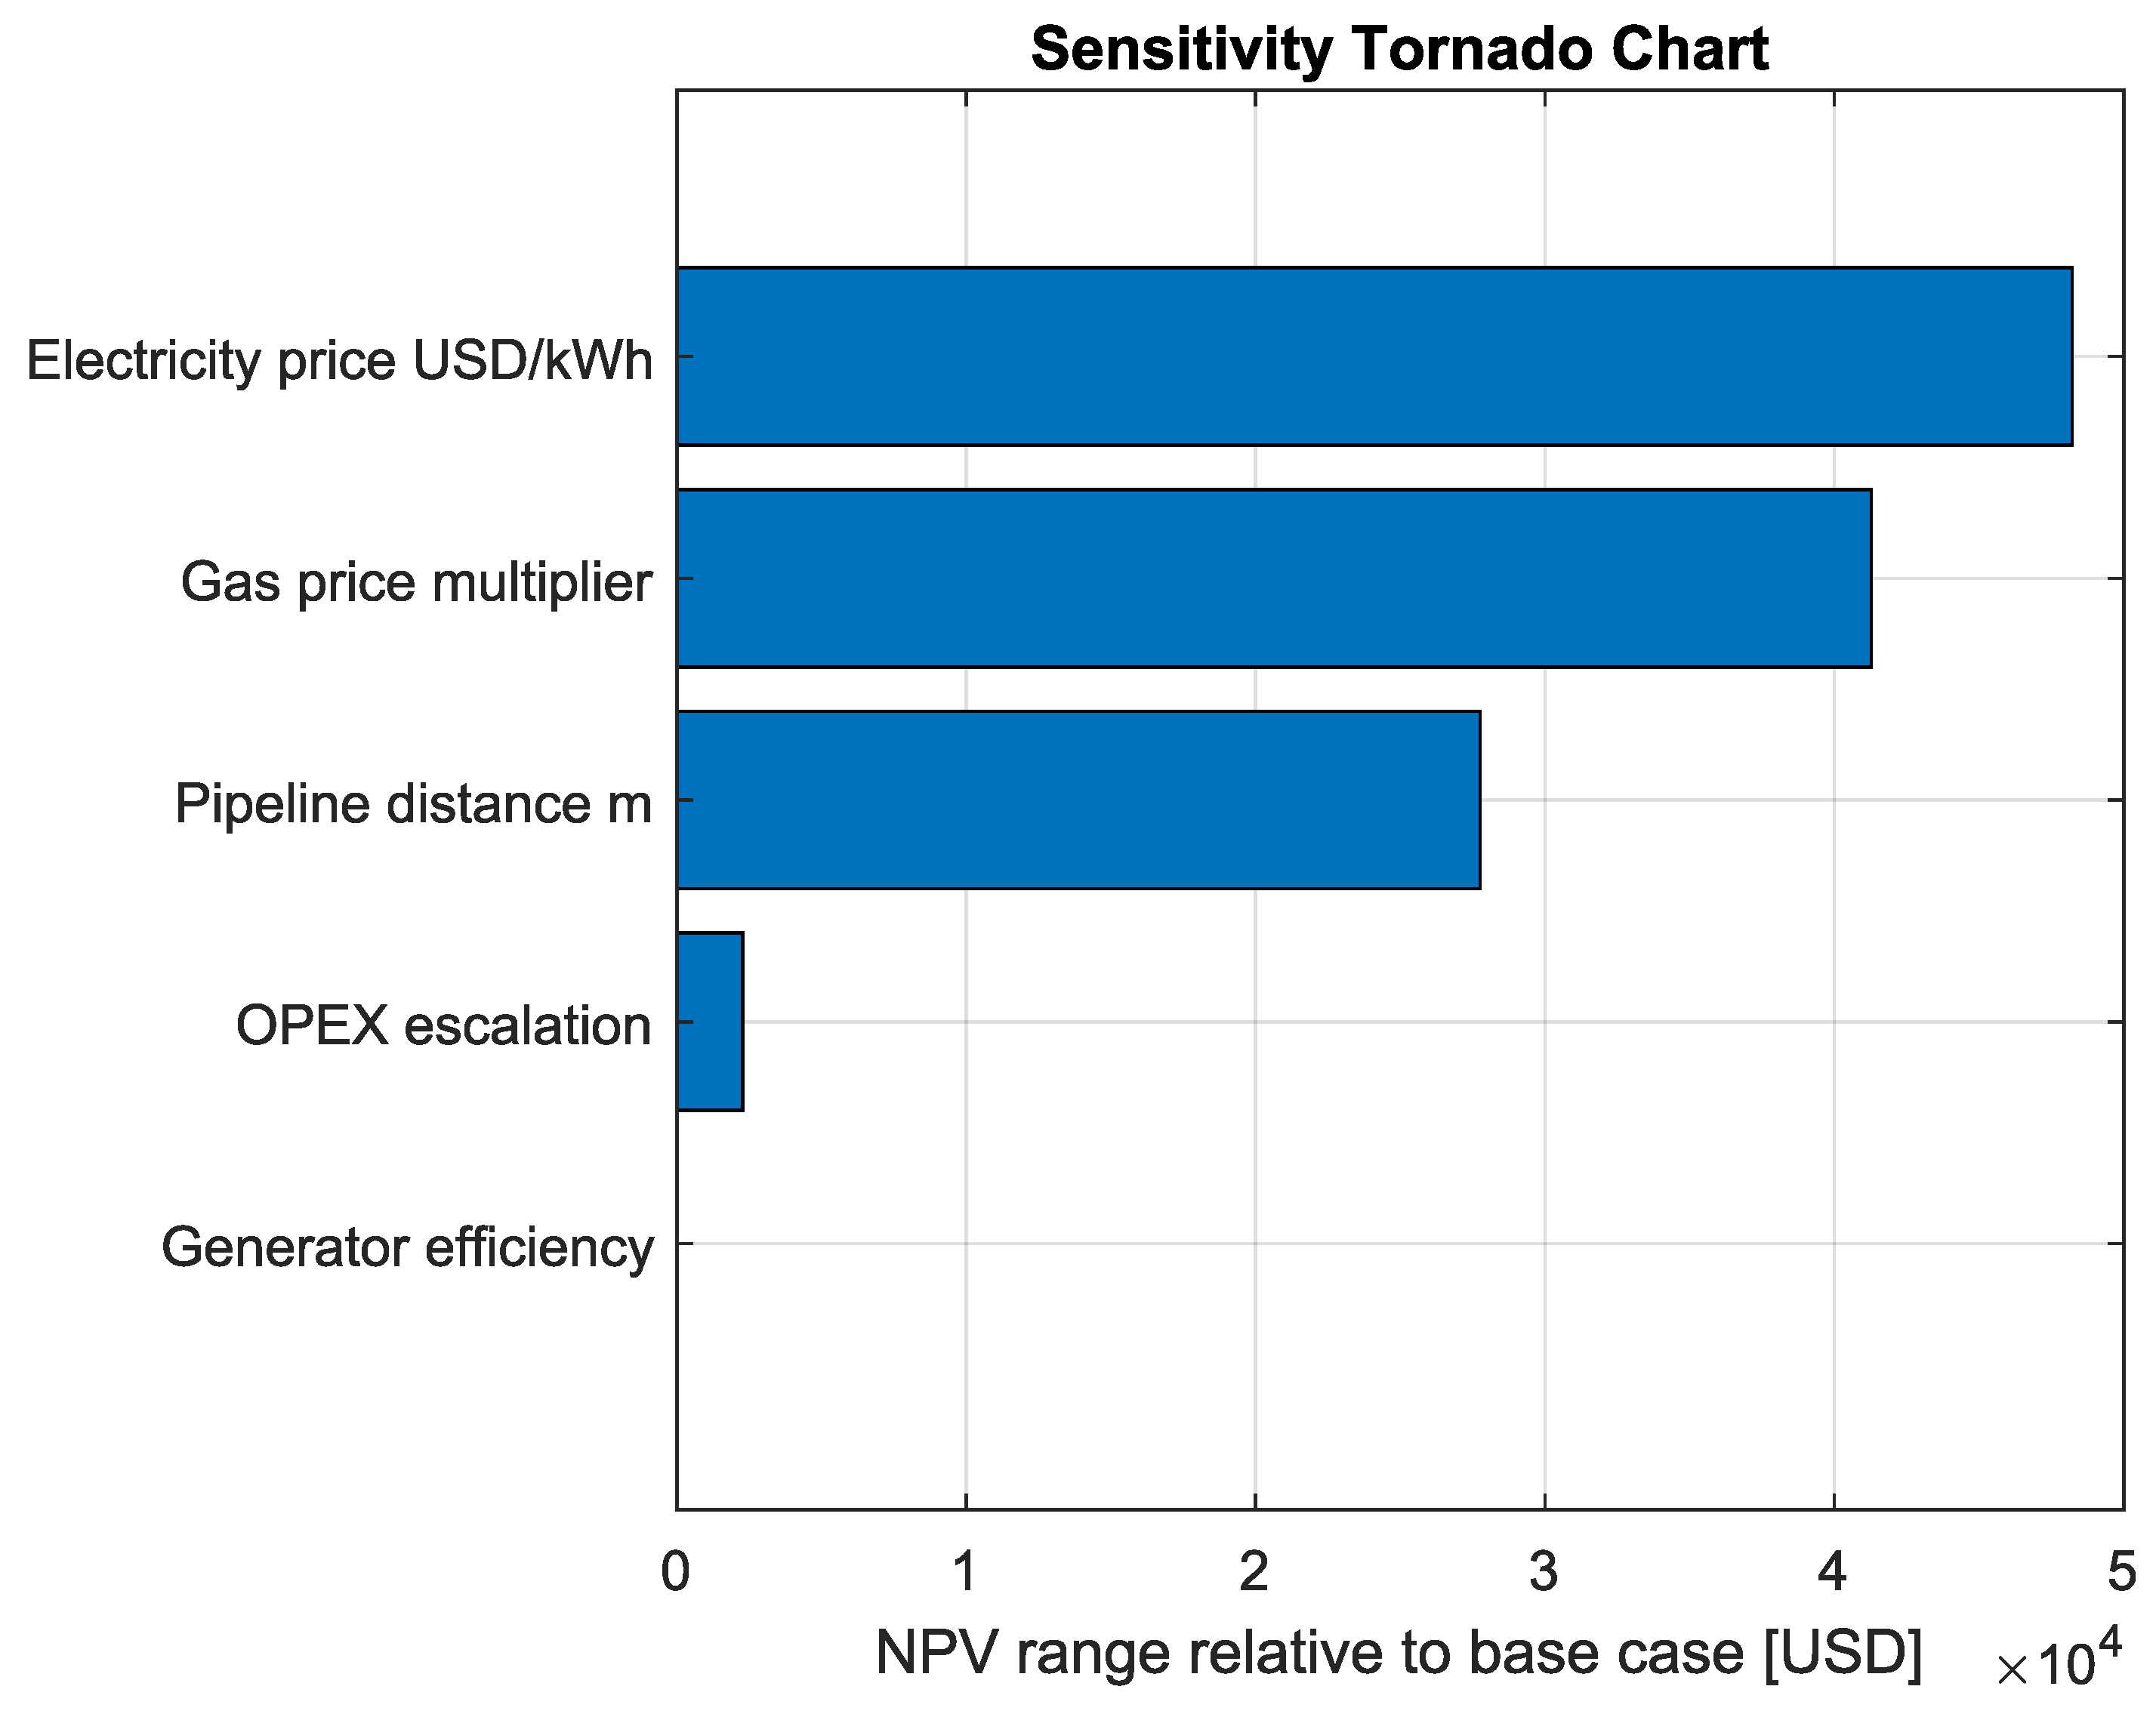
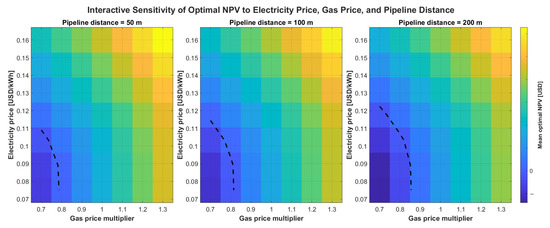
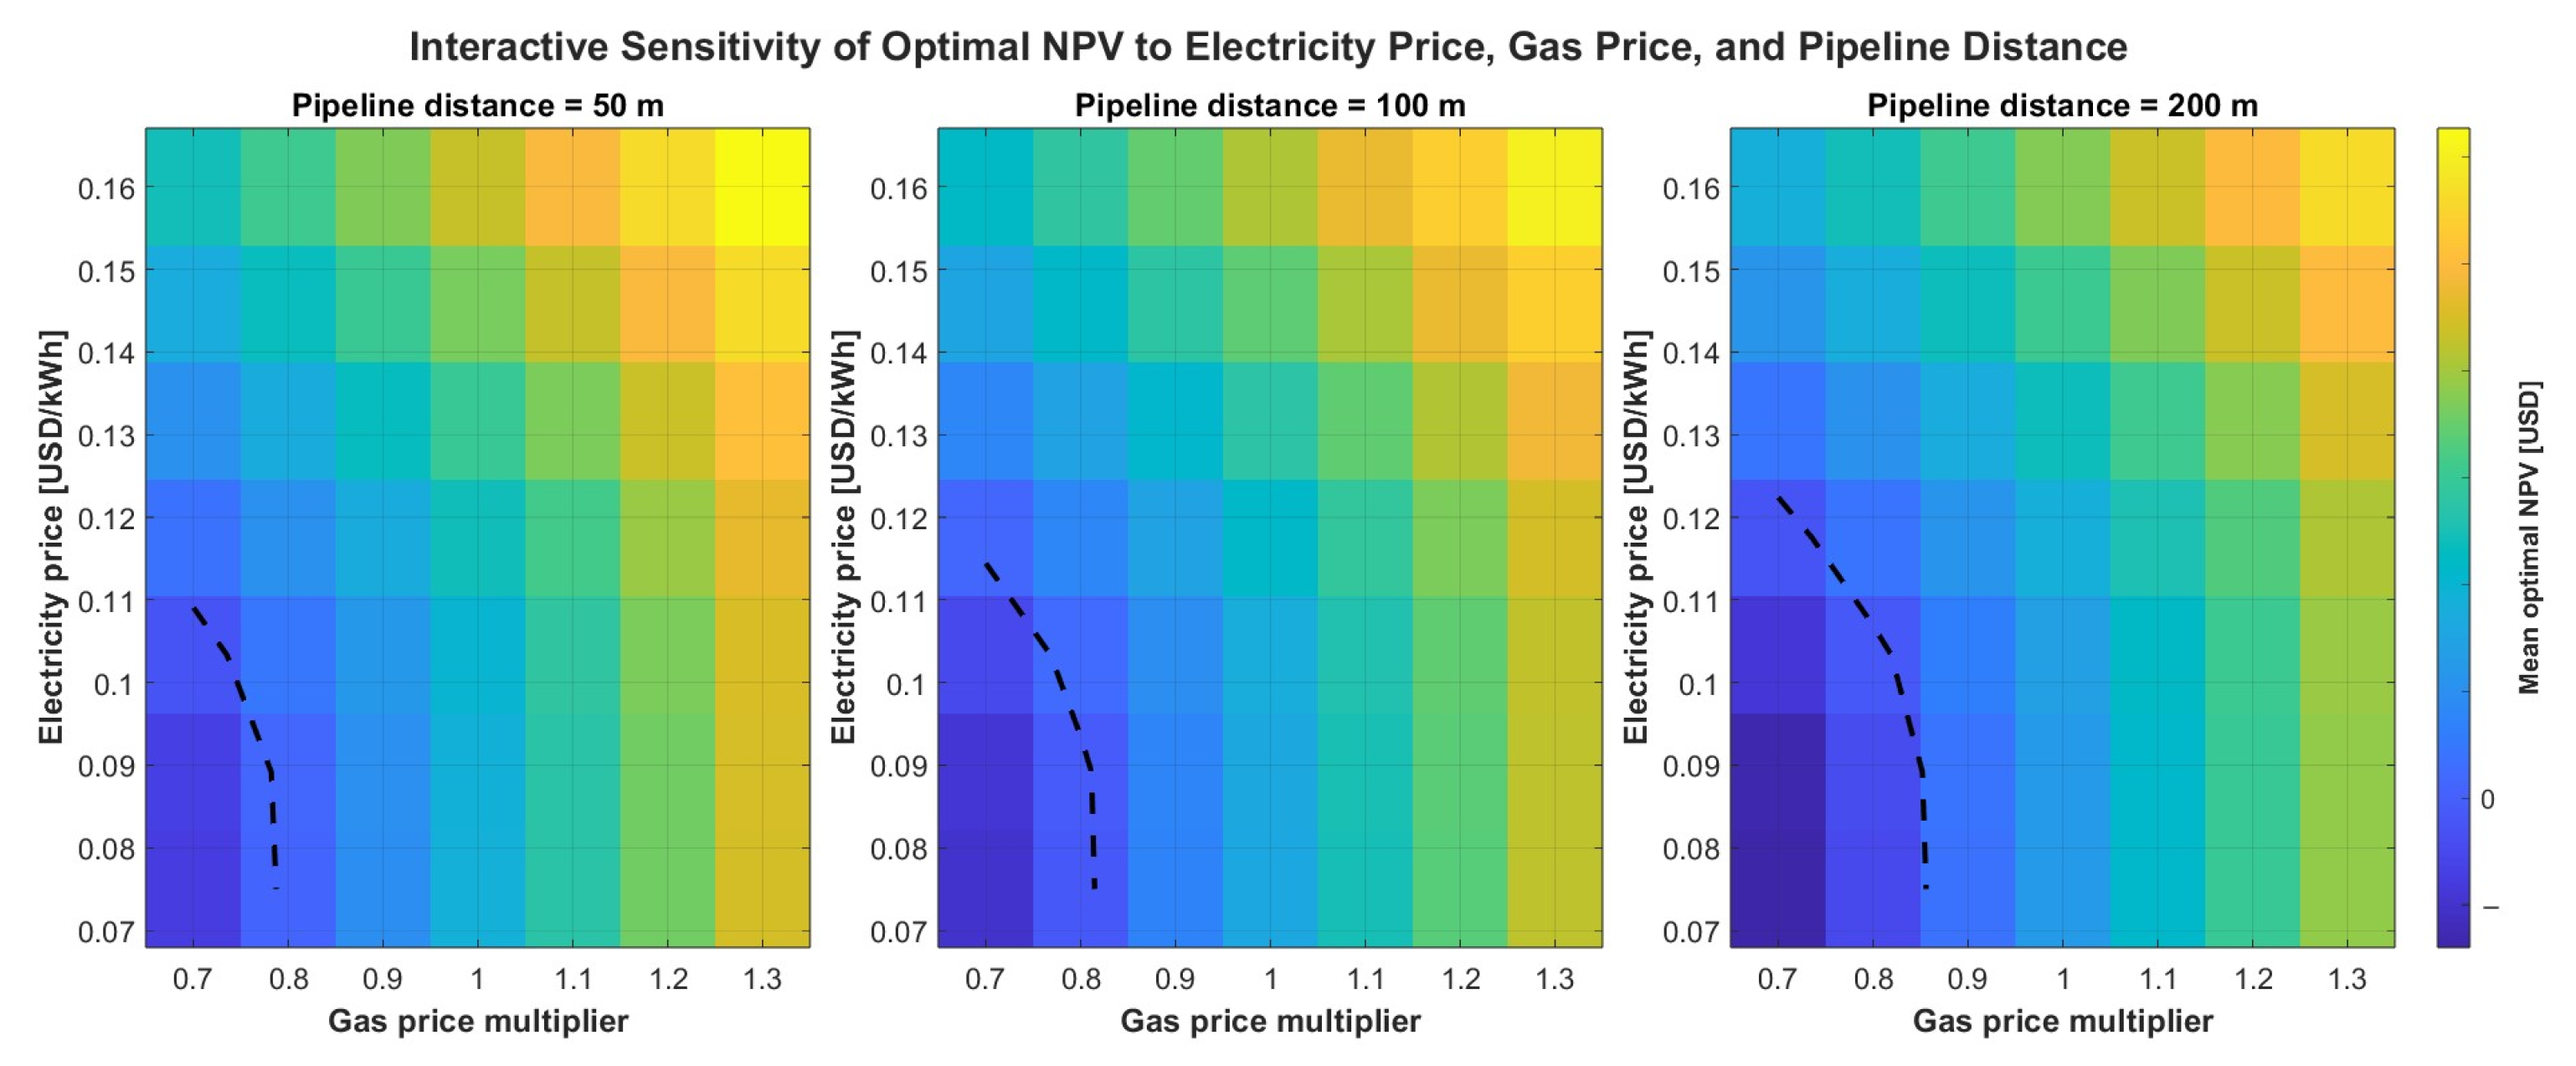
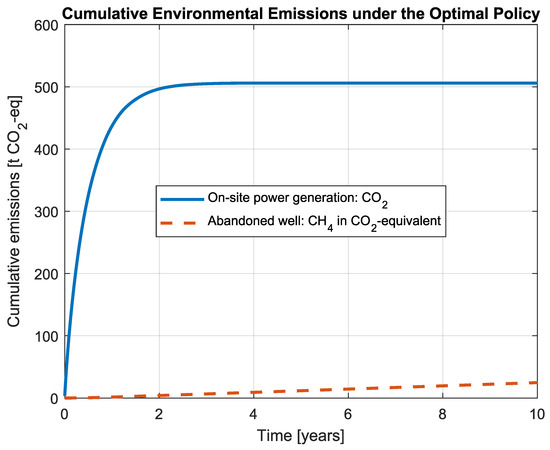
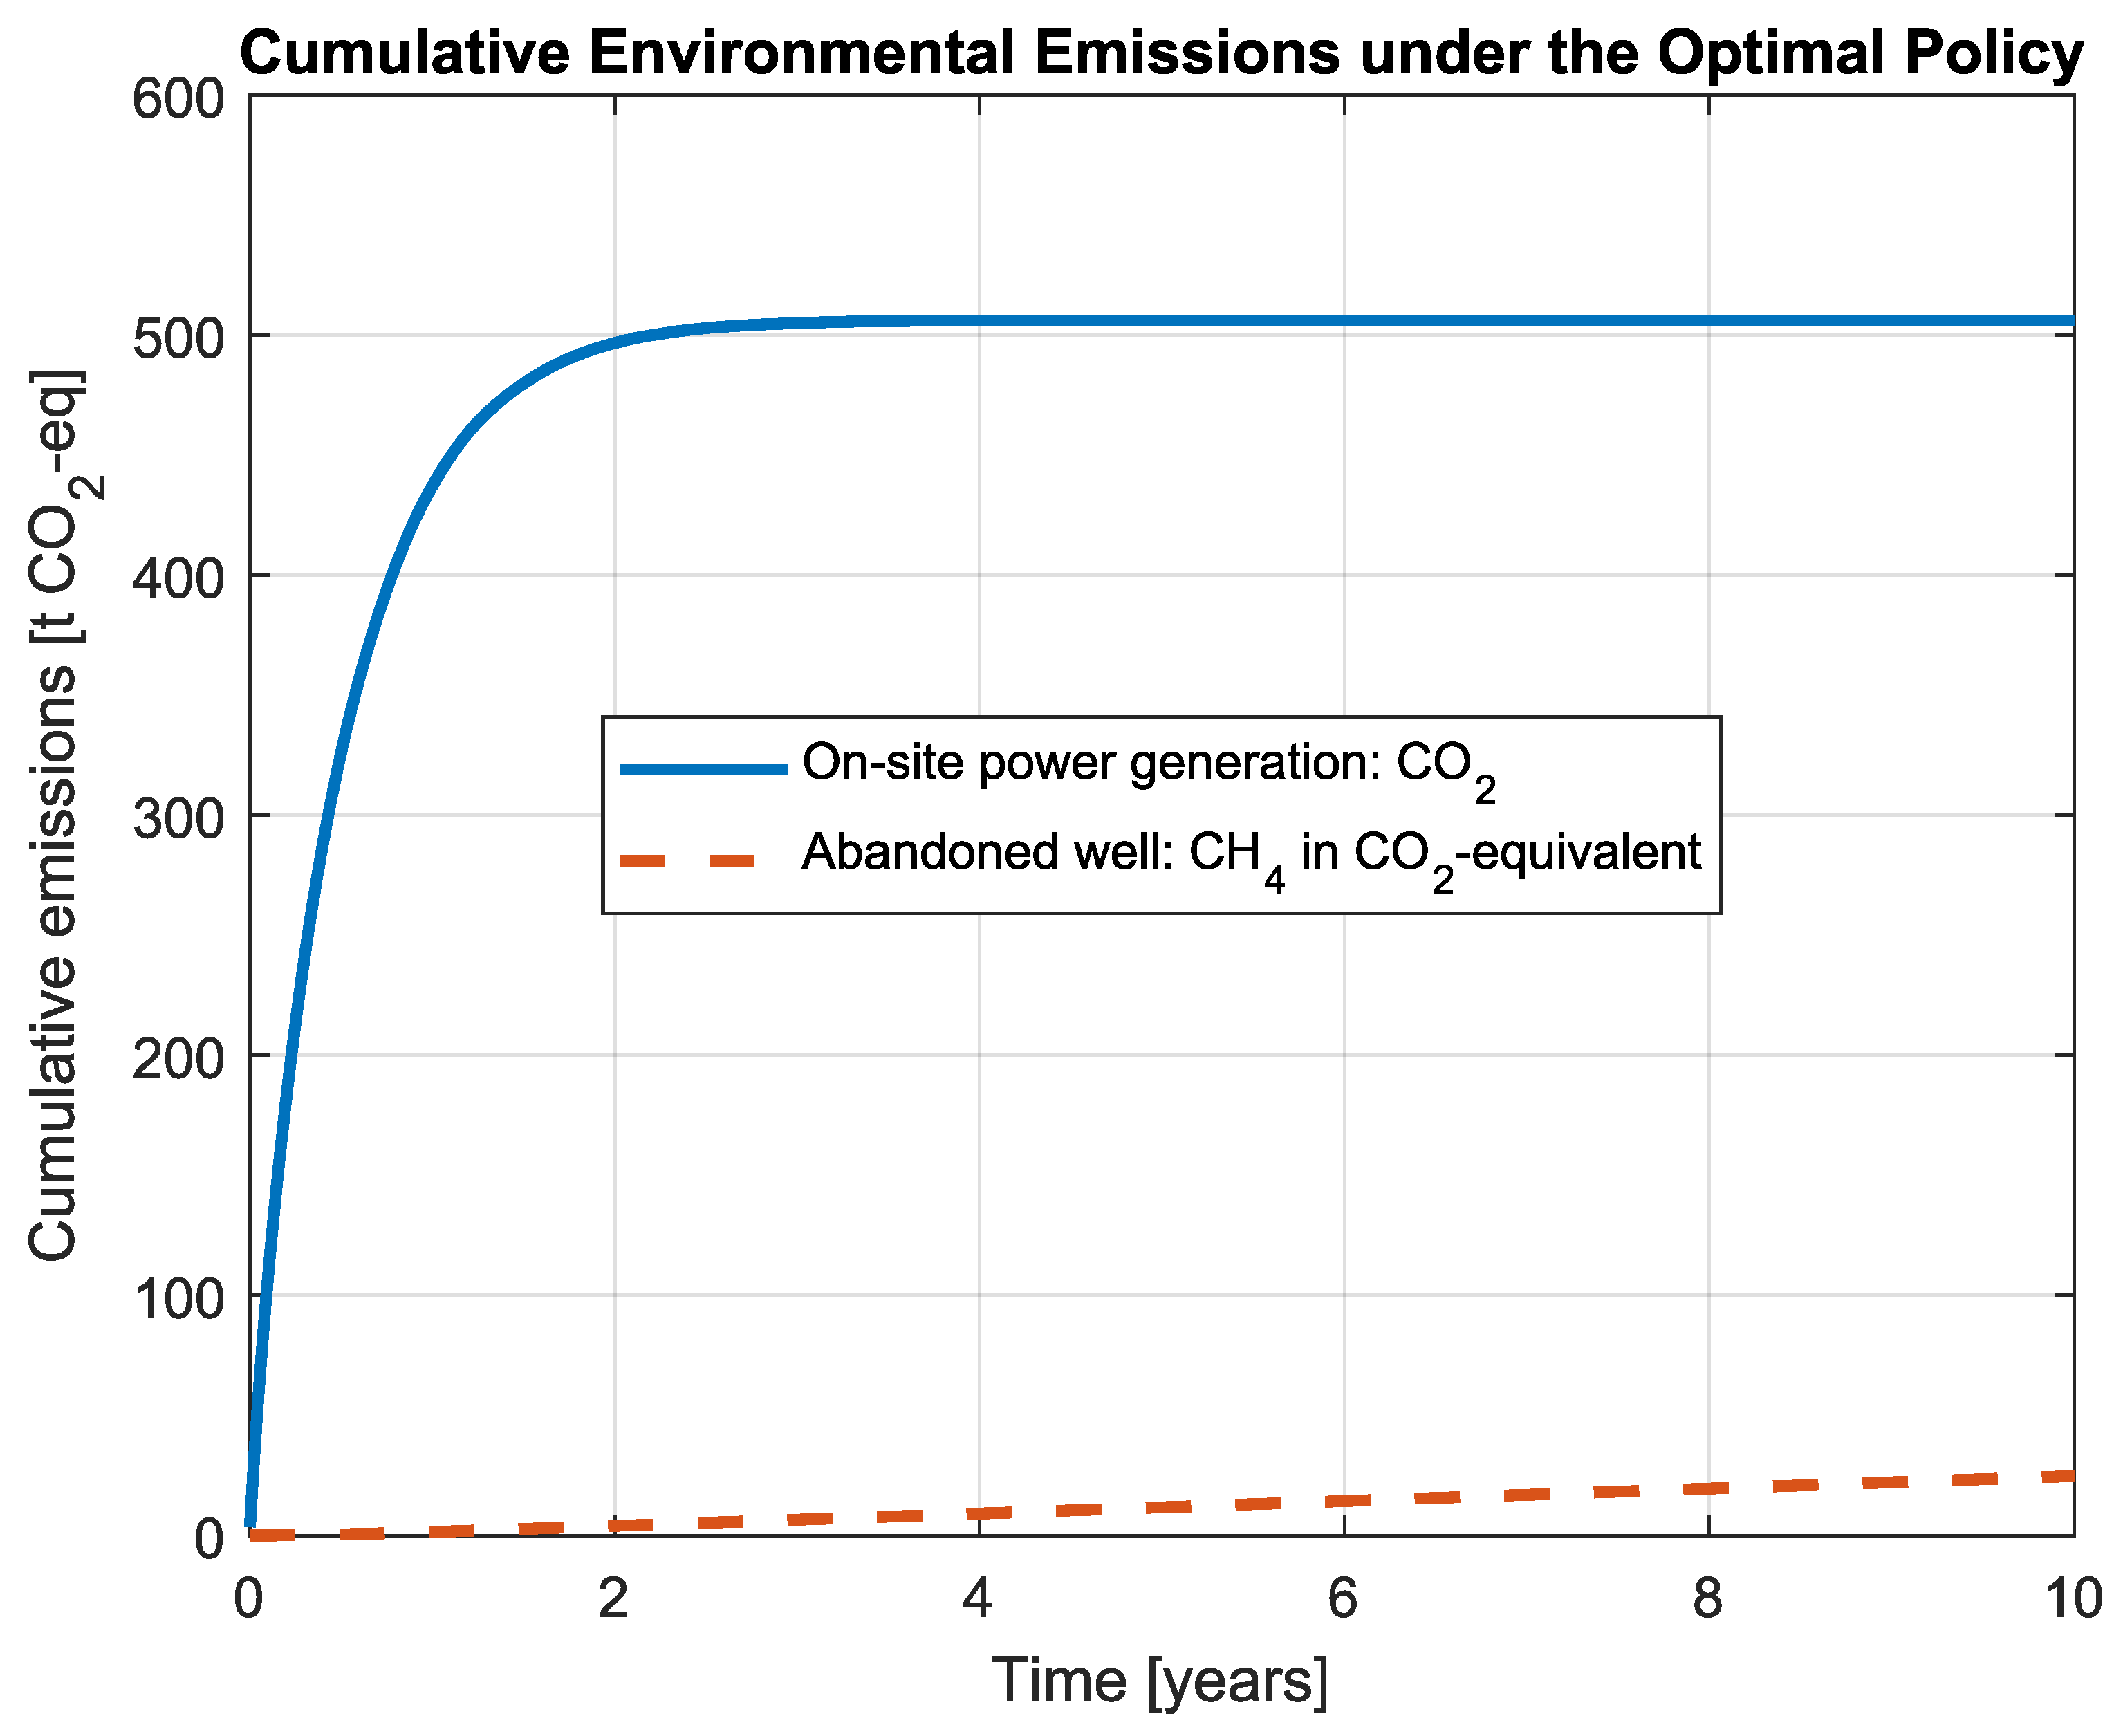
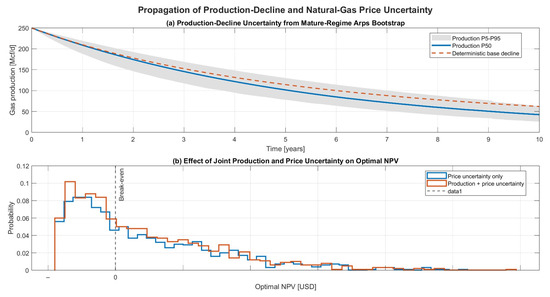
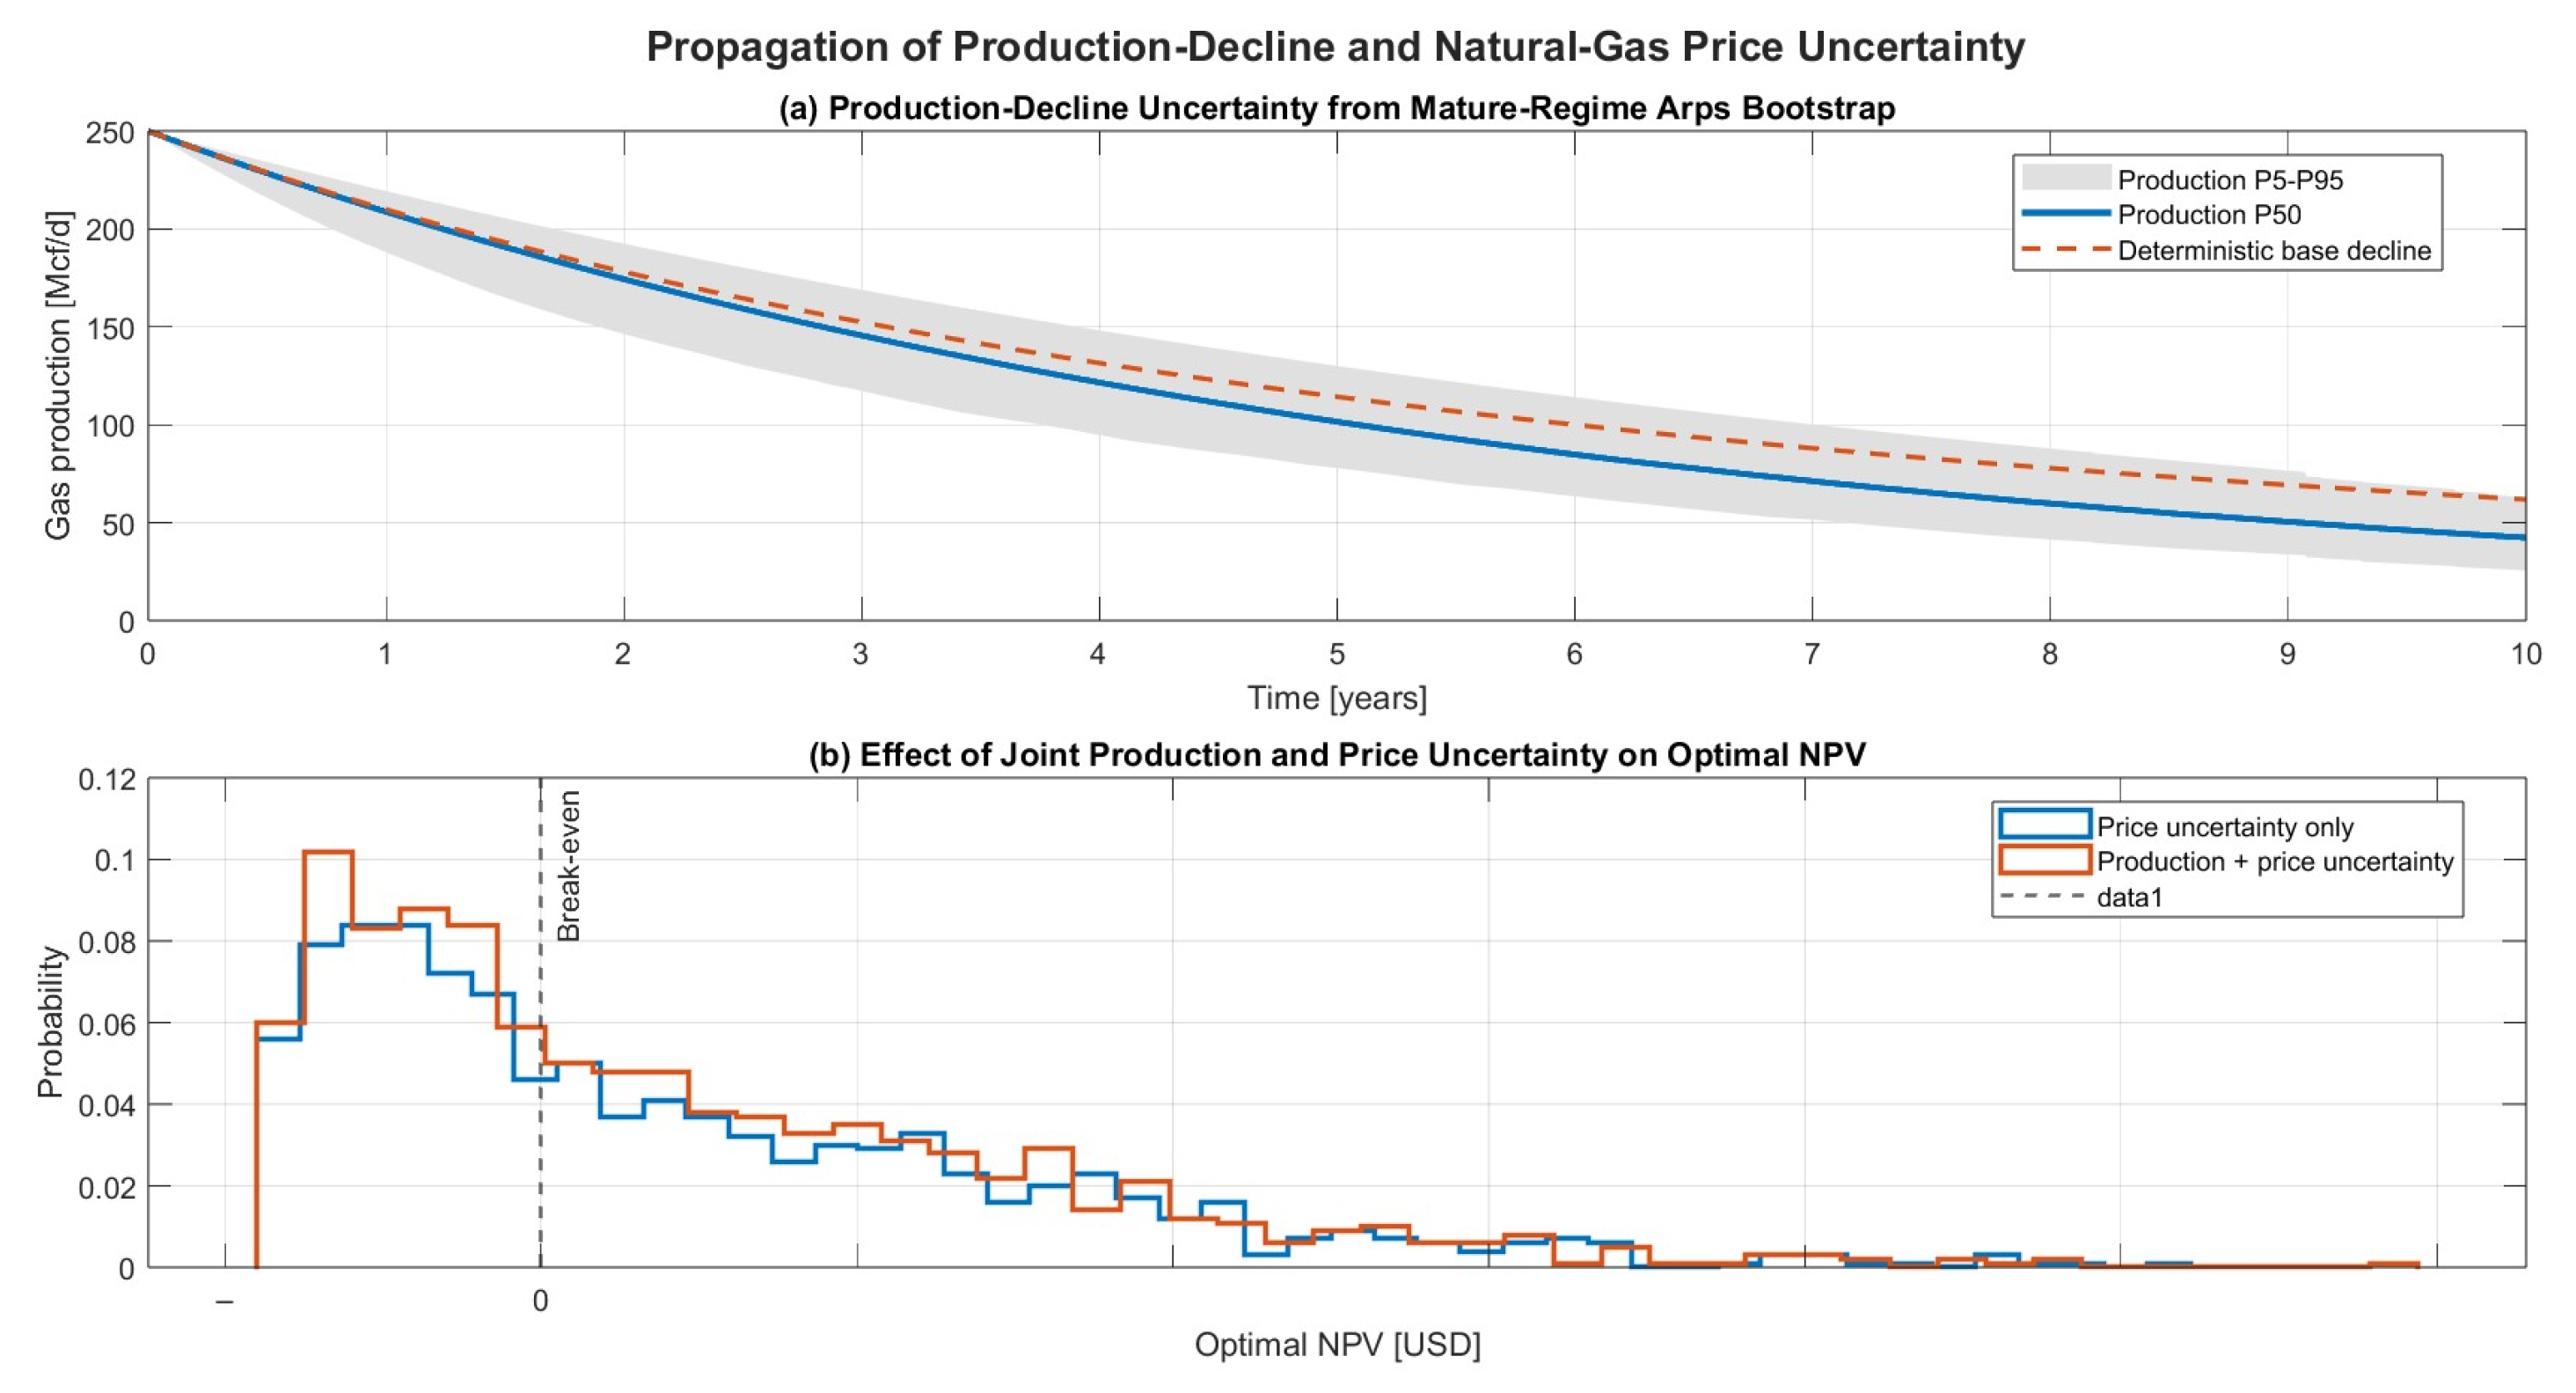

Disclaimer/Publisher’s Note: The statements, opinions and data contained in all publications are solely those of the individual author(s) and contributor(s) and not of MDPI and/or the editor(s). MDPI and/or the editor(s) disclaim responsibility for any injury to people or property resulting from any ideas, methods, instructions or products referred to in the content. |
© 2026 by the authors. Licensee MDPI, Basel, Switzerland. This article is an open access article distributed under the terms and conditions of the Creative Commons Attribution (CC BY) license.