


Abstract
As variable renewable generation grows, intermittent dispatch of run-of-river hydropower plants may transfer required environmental-flow releases from turbines to spillways, creating conditions that favor total dissolved gas (TDG) supersaturation and may constrain hydropower flexibility. This study presents a reproducible basin-scale screening assessment for 24 selected hydropower plants in the Brazilian Amazon and Tocantins–Araguaia basins. The analysis combines a plant inventory, spillway typology, standardized environmental-flow scenarios, and two configuration-specific linear relationships between unit discharge and the increase in TDG saturation (ΔTDG), derived from digitized Pubugou and Gongzui observations. Two release configurations were examined: flow distributed among all available bays and flow concentrated in a single bay as a theoretical hydraulic bounding case. The Pubugou-based relationship was applied only to broadly comparable ski-jump configurations within 9.1 ≤ UD ≤ 72.3 m3 m−1 s−1, whereas the Gongzui-based relationship was provisionally assigned, as an inventory-level first-order analog, to controlled spillways discharging into stilling basins within 34.6 ≤ UD ≤ 234.6 m3 m−1 s−1. Hydraulically dissimilar cases were classified as NE-H, and cases outside the applicable empirical domain as NE-UD. Digitization sensitivity, regression uncertainty, and model-form selection were explicitly evaluated and documented. None of the distributed-flow scenarios produced a numerical estimate: cases assigned to the Pubugou- or Gongzui-based relationships were classified as NE-UD, whereas hydraulically dissimilar free-surface cases were classified as NE-H. Four single-bay scenarios produced configuration-specific increments: 22.5–33.4 percentage points for three Gongzui-based cases and 13.6 percentage points for one Pubugou-based case. Upstream TDG was not added, and no plant-specific final concentration or universal ranking was reported. Sinop and Colíder observations were retained as qualitative contextual evidence of limited transferability and the importance of site-specific hydraulics. The outputs support conditional monitoring prioritization under standardized assumptions, not compliance prediction, ecological-risk assessment, or gate-operation recommendations. Synchronized monitoring and plant-specific rating curves are required before TDG-related variables can be incorporated into operational planning.
1. Introduction
Brazil’s electricity system relies heavily on renewable generation, and hydropower provides energy, capacity, and balancing services. The rapid growth of wind and solar generation, together with transmission and reliability constraints, has increased curtailment and short-notice redispatch in the National Interconnected System (SIN) [1]. These conditions can expose hydropower plants (HPPs) to more frequent load reductions and turbine shutdowns. However, the hydraulic and ecological consequences of redispatch depend on plant configuration, inflow, storage, minimum-flow obligations, and event duration; they cannot be inferred from curtailment alone [2]. In this context, hydropower flexibility should not be evaluated only from the perspective of electromechanical availability and reservoir operation, but also from the hydraulic-environmental constraints that may emerge when dispatch changes modify downstream release pathways.
These interactions are especially relevant for run-of-river plants in the Amazon, where limited active storage reduces the ability to buffer inflow and dispatch changes. When turbine discharge is reduced, the required downstream flow may be maintained through the remaining generating units, dedicated outlets, or spillways. Spillway use is therefore conditional rather than automatic.
Publicly available records do not allow the frequency of dispatch-related spillway operation to be reconstructed consistently across all selected facilities. Environmental flows may be released through operating turbines, dedicated generating units, bottom outlets, or spillways, depending on plant configuration and operating conditions. Accordingly, this study does not assume that reduced generation routinely leads to spillway operation at every plant. The evaluated release configurations are standardized screening scenarios, and plant-specific operating conditions are considered documented only when supported by technical, licensing, or operator sources.
Where spill is required, gate configuration and release timing transfer part of the power-system variability to hydraulic structures and downstream environments.
Spillway releases can entrain air and dissolve atmospheric gases under high turbulence, deep bubble penetration, and elevated hydrostatic pressure, producing TDG supersaturation downstream [3,4]. TDG generation depends on spillway geometry, jet regime, tailwater depth, gate opening, unit discharge, water temperature, atmospheric pressure, and upstream gas saturation. Biological effects range from sublethal stress to gas bubble disease and mortality, with severity influenced by exposure level, duration, depth compensation, species, and life stage [5,6,7].
Previous studies have separately addressed TDG generation, transport, biological effects, and mitigation. However, fewer studies have examined how dispatch-driven hydropower operation, environmental-flow obligations, and spillway gate configurations interact to create hydraulic-environmental constraints on flexible hydropower operation at the basin scale. This gap is particularly relevant for tropical run-of-river cascades, where limited storage, minimum-flow requirements, and short-notice redispatch may alter the balance between turbine and spillway releases. A recent field-and-laboratory study at Sinop HPP established TDG as a potential operational constraint and documented the vulnerability of representative Neotropical fish species [8]. The present manuscript builds on the same motivating problem but is distinct in scope: while [8] provides a site-specific field and laboratory assessment for a single plant, this study contributes a basin-scale, reproducible screening framework spanning 24 selected plants and two idealized gate configurations. This delineation is intended to make the independent contribution explicit and to avoid redundant publication.
The two studies also address different scientific questions and use different datasets and analytical approaches. Ferraz et al. [8] investigated whether field observations and biological evidence at Sinop HPP support the interpretation of TDG as a site-specific operational constraint. The present study asks whether a standardized, basin-scale screening framework can identify hydropower plants and release configurations that should be prioritized for monitoring and plant-specific investigation. Its unique contributions are the compilation of a 24-plant inventory, the classification of spillway configurations, the examination of distributed- and single-bay release scenarios against the hydraulic and empirical applicability criteria, the controlled application of two externally derived, configuration-specific unit-discharge relationships within their respective empirical domains, and the resulting regional prioritization. Thus, the novelty lies not simply in expanding the geographic coverage, but in developing and testing a reproducible comparative screening method.
This study develops a comparative screening framework for selected HPPs in the Amazon and Tocantins–Araguaia basins. It combines a plant inventory, spillway classification, environmental-flow scenarios, and two configuration-specific empirical unit-discharge relationships derived from published data to identify where spillway-related TDG-generation potential may become relevant to flexible hydropower dispatch. The objectives are to (i) identify plants and release configurations that warrant priority TDG monitoring; (ii) determine whether the distributed- and single-bay screening scenarios fall within the hydraulic and empirical applicability domains of the corresponding relationships; and (iii) define the hydraulic, operational, and environmental data required for plant-specific TDG rating curves that could support future dispatch and scheduling decisions. The objective is not to predict actual downstream TDG concentrations, establish a universal plant ranking, or quantify ecological risk. Rather, the study identifies hydraulic configurations that can be evaluated using the available empirical relationships and supports monitoring prioritization under standardized screening assumptions.
From an energy-system perspective, TDG supersaturation is relevant because it may transform environmental-flow releases and spillway operation into operational constraints on hydropower flexibility. In systems with increasing wind and solar participation, hydropower plants are increasingly required to provide balancing, ramping, and reserve services. However, when turbine shutdowns or minimum-generation conditions require spillway releases, the ability of a plant to follow dispatch instructions may become conditioned by downstream hydraulic and ecological limits. Therefore, the potential for TDG supersaturation should not be treated only as a local environmental issue but also as a potential constraint on dispatch feasibility, curtailment allocation, and hydropower participation in flexible system operation.
The framework is not a hydraulic simulation, a compliance model, or a biological-threshold assessment. It does not establish causality between dispatch events and fish mortality, and it does not support universal prescriptions regarding the number of gates that should be opened. Its results are intended to support conditional monitoring prioritization based on relative TDG-generation potential within the defined applicability groups and to guide model calibration and site-specific operational studies.
2. Background: TDG Generation and Fish-Tolerance Benchmarks
Spillway-induced TDG supersaturation results from air entrainment, bubble breakup, hydrostatic compression, and gas–liquid mass transfer. Ogee/Creager spillways with stilling basins can promote deep bubble penetration and long residence times, whereas ski-jump or flip-bucket structures may allow partial degassing during airborne transport but can regenerate TDG at impact [3,9,10,11,12,13,14,15,16,17]. The response is site-specific and depends on tailwater depth, jet regime, gate sequence, unit discharge, and upstream saturation.
Discharge distribution among bays cannot be treated as a universally monotonic control. Some configurations may reduce TDG at lower unit discharge, whereas coherent surface jets or deflectors can reduce deep air entrainment under more concentrated releases. Consequently, the effect of distributing flow must be verified with plant-specific monitoring or physical/CFD modeling rather than assumed from unit discharge alone [12,15,18,19].
Biological risk increases with the magnitude and duration of exposure, but tolerance varies among species and life stages. The current Washington State freshwater criterion is 110% saturation, subject to specified exceptions, and is used here only as an external screening benchmark rather than a Brazilian regulatory limit [5]. Experimental studies commonly report increased adverse effects above approximately 120–125% [6,7,20,21,22,23,24]; however, these values are not universal thresholds. Recent controlled experiments show that sublethal endpoints—delayed migration, reduced passage success, and impaired swimming performance—can occur at lower saturations and are strongly modulated by flow velocity, species, and life stage [25,26,27]. Regulatory benchmarks and ecotoxicological evidence should therefore be reported separately rather than combined into a single tolerance figure.
3. Study Area and Hydropower Inventory
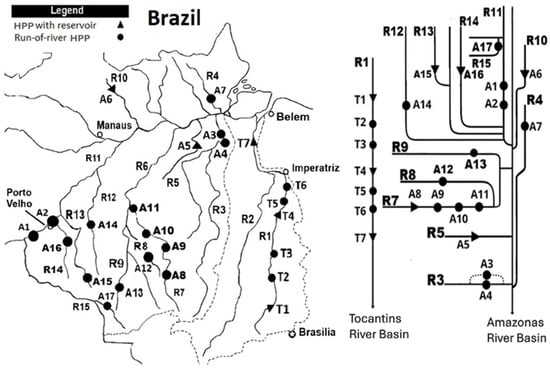
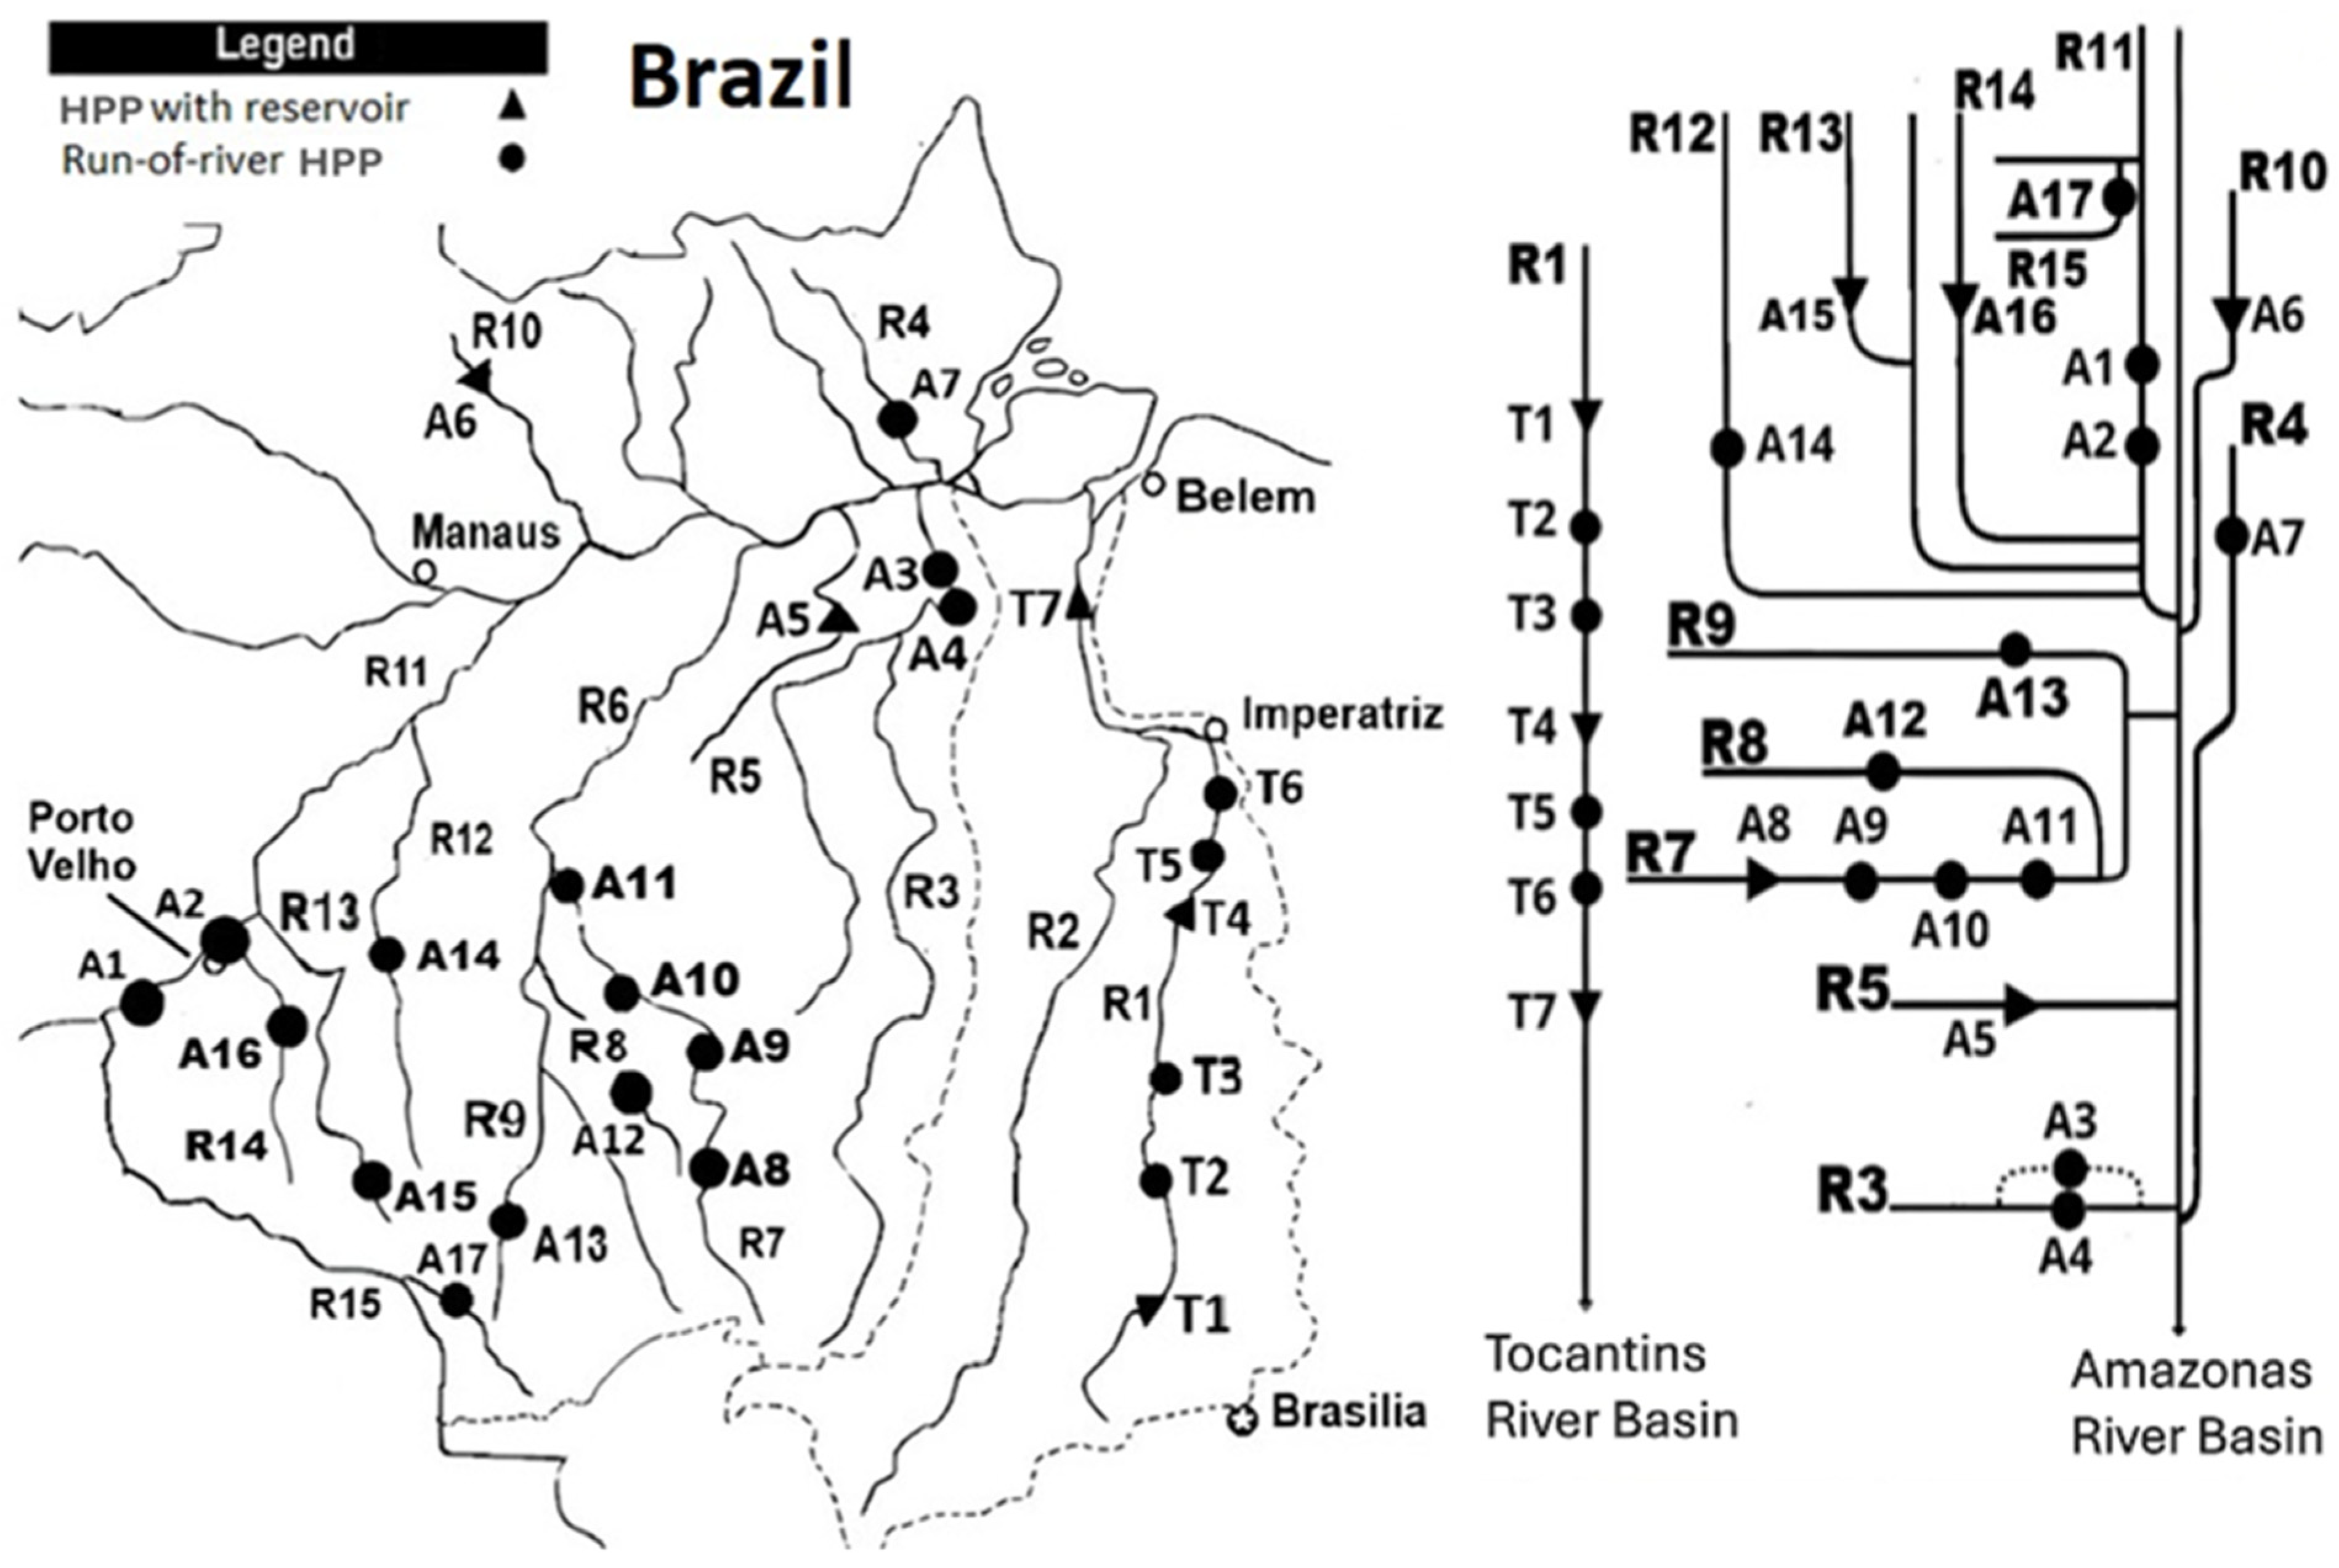
This study covers the Amazon and Tocantins–Araguaia hydrographic regions and evaluates 24 hydropower plants selected to provide broad coverage of the main plant scales, reservoir-operation types, cascade positions, spillway configurations, and energy-dissipation arrangements found in these regions. Plant identification and dam information were compiled from the National Dam Safety Information System (SNISB), ANEEL’s Generation Information System (SIGA), operator documents, emergency action plans, and technical reports [28,29,30,31]. Selection also required sufficiently detailed, verifiable, and readily accessible information on the hydraulic and operational variables needed for the screening analysis. Facilities for which the minimum information could not be consistently obtained or verified were not included. The resulting inventory is therefore a purposive, data-conditioned screening dataset intended to provide broad regional and typological coverage, rather than a complete census, a statistically representative sample, or a comprehensive hydraulic design database. Figure 1 maps the selected HPPs and classifies them as run-of-river or storage/regulation projects.
Figure 1.
Amazon and Tocantins–Araguaia hydrographic regions and selected hydropower plants, classified by reservoir-operation type (left), with a schematic of the river-network position of each plant (right). Plant codes correspond to Table 1. Sources: SNISB and ANEEL SIGA [28,30]; basin boundaries: ANA [29]. Map compiled by the authors from SNISB, ANEEL SIGA, and ANA hydrographic-region data. The figure was prepared for basin-scale screening purposes and should be interpreted as a schematic representation of plant location and reservoir-operation type rather than a legal or cadastral map.
Installed capacity and generation contributions vary with the database date, hydrological conditions, and aggregation method. In this study, SIGA data are used to contextualize the selected hydropower plants within Brazil’s hydropower fleet, without attempting to establish definitive regional installed-capacity totals [30]. Selected projects considered in the inventory include Belo Monte, Jirau, Santo Antônio, Tucuruí, Serra da Mesa, and the Teles Pires cascade [8,31,32,33,34,35,36,37,38,39,40,41,42,43,44,45,46,47,48,49,50,51,52,53,54,55,56]. Table 1 summarizes the variables used in the screening analysis.
Previously reported operational records from Sinop HPP illustrate the mechanism motivating the screening framework. ONS generation data show rapid changes in dispatched power, and the Sinop TDG monitoring record reported by Ribeiro [57] shows an increase during spillway operation followed by a decrease after the return to generation [8,58]. In this section, these records are used only to illustrate the temporal sequence motivating the screening framework. They are not used as inputs to the regional calculations. Their later comparison with the screening estimate is limited to a qualitative assessment of model transferability. To avoid duplicating figures from the companion article, these time series are not reproduced here; the reader is referred to Figures 1 and 2 of Ferraz et al. [8], where related time series were published and analyzed in detail. The temporal association does not establish a single causal mechanism for the associated fish-kill event.
Environmental-flow inputs were not obtained from plant-specific licensing or operating requirements. For all facilities, the adopted values were regulation-based regional surrogates derived from the state-level residual-flow and water-allocation criteria compiled by Silva et al. [59]. They provide a common reference for comparative screening and should not be interpreted as the actual operating obligation of any individual plant.
Table 1.
Main characteristics of selected hydropower plants in the Amazon and Tocantins–Araguaia basins.
A post-mortem examination associated with the Sinop event was inconclusive because specimens were collected more than six hours after the event; gas bubbles may dissipate or be confounded by post-mortem changes, limiting diagnostic certainty [74]. Accordingly, the field episode is used only as circumstantial operational context, and additional stressors were not excluded.
4. Materials and Methods
The screening workflow comprised five steps: (i) plant inventory and data provenance; (ii) spillway classification; (iii) digitization and fitting of configuration-specific unit-discharge relationships; (iv) definition of release scenarios; and (v) uncertainty and applicability checks. The workflow is intended to support conditional monitoring prioritization based on relative TDG-generation potential within the defined applicability groups and does not replace physical modeling, CFD, or calibrated site-specific rating curves.
In this study, “relative TDG-generation potential” denotes the model-based tendency of a standardized release scenario to produce higher or lower TDG estimates within the defined hydraulic and numerical applicability domains. It does not quantify the probability or frequency of spillway operation, exposure duration, biological consequences, or risk in the formal probabilistic sense.
4.1. Hydropower Plant Dataset and Spillway Classification
The inventory included 24 selected HPPs in the two hydrographic regions. Selection sought broad regional and typological coverage across plant scales, reservoir-operation types, cascade positions, spillway configurations, and energy-dissipation arrangements, while requiring sufficiently detailed, verifiable, and readily accessible technical information. Spillway operation was considered plausible during environmental-flow releases or dispatch-related operating changes. For each plant, the compiled fields were plant code, river basin, reservoir-operation type, installed capacity, spillway and energy-dissipation type, number of bays, design discharge, effective width, and environmental-flow input. Facilities for which the minimum hydraulic or structural information could not be consistently obtained or verified were not included. The resulting inventory is therefore purposive and data-conditioned rather than exhaustive or statistically representative.
Spillways were classified by their dominant hydraulic configuration: controlled ogee/Creager spillways discharging to stilling basins; controlled spillways with ski-jump energy dissipation; and free-overflow arrangements. This classification provides a first-order mechanistic context but does not capture gate geometry, aeration devices, tailwater level, plunge-pool depth, or jet regime—variables that are major determinants of TDG generation.
The number of bays and effective width were used to compute scenario-specific unit discharge. Plant typology was used only to interpret the plausibility and limitations of transferring empirical relationships. The source values were compiled from the plant-specific technical and institutional references cited in Table 1 and should be interpreted as screening inputs rather than a complete hydraulic design database.
4.2. Spillway Typology and TDG Generation Mechanisms
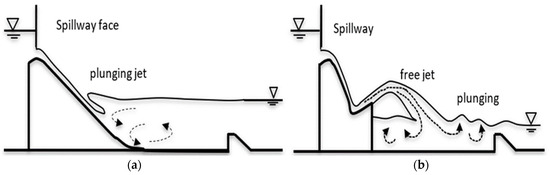
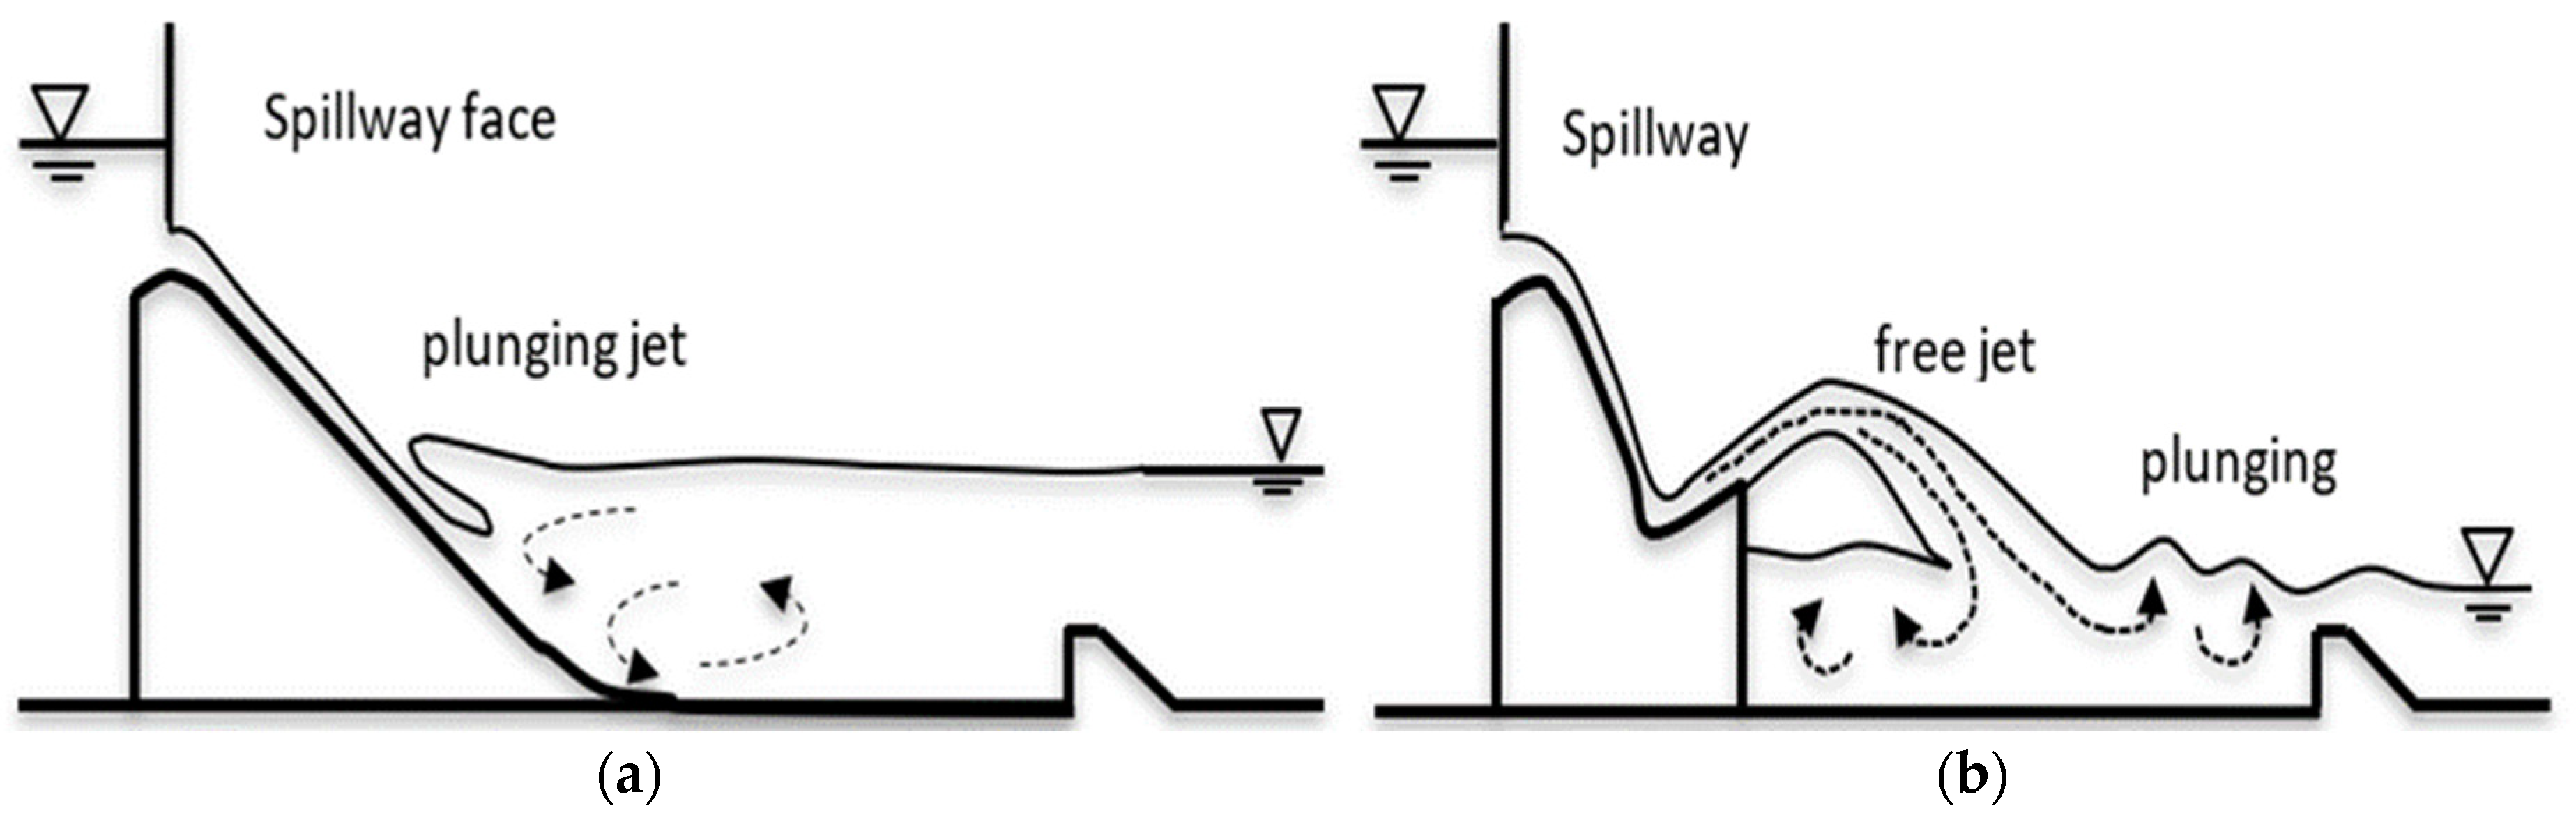
TDG generation is governed by coupled hydrodynamic and mass-transfer processes. In ogee/Creager spillways, plunging flow and hydraulic jumps can entrain air and transport bubbles to regions of elevated pressure. Ski-jump structures expose the jet to the atmosphere and may promote partial degassing before impact, but renewed entrainment can occur in the receiving pool [3,9,10,11,12,13,14,15,16]. Figure 2 illustrates these conceptual configurations, which were redrawn by the authors.
Figure 2.
Conceptual spillway configurations considered in the screening classification: (a) ogee/Creager spillway with stilling basin, where a plunging jet entrains air into a submerged roller; and (b) ski-jump/flip-bucket spillway, where a free jet is aerated in flight and can re-entrain air on impact. Schematic redrawn by the authors to represent the hydraulic mechanisms described in [3,9,10,11,12,13,14,15,16]; not to scale.
Hydrostatic pressure, bubble residence time, turbulence, jet trajectory, tailwater depth, and pre-existing TDG jointly control downstream saturation. Cascade effects may arise when supersaturated water is transported into downstream reservoirs or tailraces [12,14,19,75]. Structural measures such as deflectors and baffle blocks can reduce deep bubble penetration under specific conditions, but their effectiveness is regime- and site-dependent, and design details (deflector elevation, length, and approach flow) govern performance [15,36,76]. Therefore, spillway type and unit discharge are screening variables rather than sufficient predictors.
Accordingly, a monotonic relationship between unit discharge and ΔTDG can be considered reasonable only as a local first-order approximation when the spillway configuration, jet regime, tailwater conditions, and energy-dissipation mechanism remain broadly comparable to those represented in the underlying dataset. The approximation is not expected to remain valid across hydraulic-regime transitions or major differences in spillway geometry and aeration conditions.
4.3. Configuration-Specific Unit-Discharge-Based ΔTDG Screening Relationships
Published field studies and water-quality management assessments indicate that TDG generation during spillway operation is influenced by hydraulic loading and by site-specific conditions, including spillway configuration, tailwater depth, and operating regime [77,78]. The relationship between unit discharge and total dissolved gas (TDG) generation was re-examined using the field observations presented in Figure 2 of Feng et al. [77]. The published figure was rendered from the original PDF at 600 dpi, and both axes were calibrated using all visible numerical tick marks. Marker coordinates were then digitized separately for each hydropower plant. Five observations were obtained for Pubugou and twenty for Gongzui. The digitized TDG saturation values were converted into saturation increments according to ΔTDG = TDG − 100%, and the complete digitized dataset is provided in Table S1.
The Tongjiezi observations were not included in the regression analysis because Feng et al. [77] reported that no clear relationship between TDG saturation and unit discharge could be identified for that facility. In contrast, the Pubugou and Gongzui datasets showed generally increasing trends. Feng et al. [77] also emphasized that unit discharge is not the sole determinant of TDG generation, which is additionally affected by downstream water depth, jet regime, spillway geometry, and the energy-dissipation arrangement.
Digitization sensitivity was evaluated through three computational extractions using alternative color-segmentation, marker-center, and axis-calibration procedures. The mean standard deviation among the extractions was approximately 0.18 m2 s−1 for unit discharge and 0.024 percentage points for TDG saturation at Pubugou, and 0.16 m2 s−1 and 0.011 percentage points, respectively, at Gongzui. These values indicate that graphical extraction uncertainty was small relative to the observed dispersion. They do not, however, represent the measurement uncertainty of the original field observations.
Linear and exponential relationships were fitted separately to the Pubugou and Gongzui datasets. Model performance was evaluated using the coefficient of determination (R2), root-mean-square error (RMSE), corrected Akaike information criterion (AICc), coefficient confidence intervals, and residual inspection. For Pubugou, the linear model yielded R2 = 0.896, RMSE = 1.13 percentage points, and AICc = 11.23, whereas the exponential model yielded R2 = 0.878, RMSE = 1.22 percentage points, and AICc = 11.99. For Gongzui, the two formulations showed similar performance, but the linear model remained marginally preferable, with R2 = 0.600, RMSE = 4.61 percentage points, and AICc = 65.82, compared with R2 = 0.598, RMSE = 4.62 percentage points, and AICc = 65.94 for the exponential model. Linear relationships were therefore retained because they provided equal or better statistical performance, required fewer assumptions regarding curvature, and avoided unsupported extrapolation.
To characterize the residual uncertainty associated with the fitted relationships, 95% regression prediction intervals were calculated for the numerical screening estimates. For a given unit discharge, the prediction interval accounts for the residual dispersion of the observations around the fitted source relationship. These intervals characterize regression uncertainty only and do not incorporate additional uncertainty associated with hydraulic transferability, environmental-flow inputs, gate configuration, tailwater conditions, or other plant-specific variables.
The suitability of combining the two datasets into a single relationship was also evaluated. Comparison of a pooled linear model with separate plant-specific linear models indicated a statistically relevant loss of fit when the observations were combined [F(2,21) = 3.68, p = 0.043]. The corresponding comparison for the exponential models produced F(2,21) = 5.30 and p = 0.014. Because the statistical response differed between the two plants and their energy-dissipation systems are hydraulically distinct, the observations were not considered sufficiently homogeneous to support a single transferable relationship.
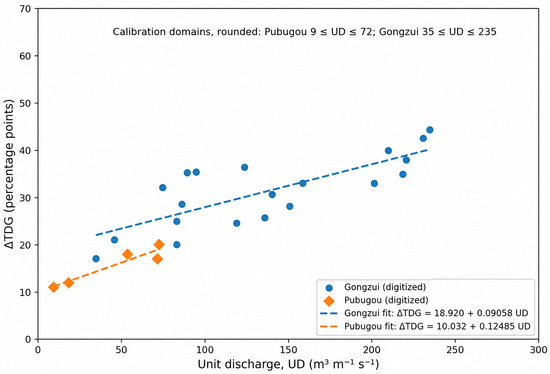
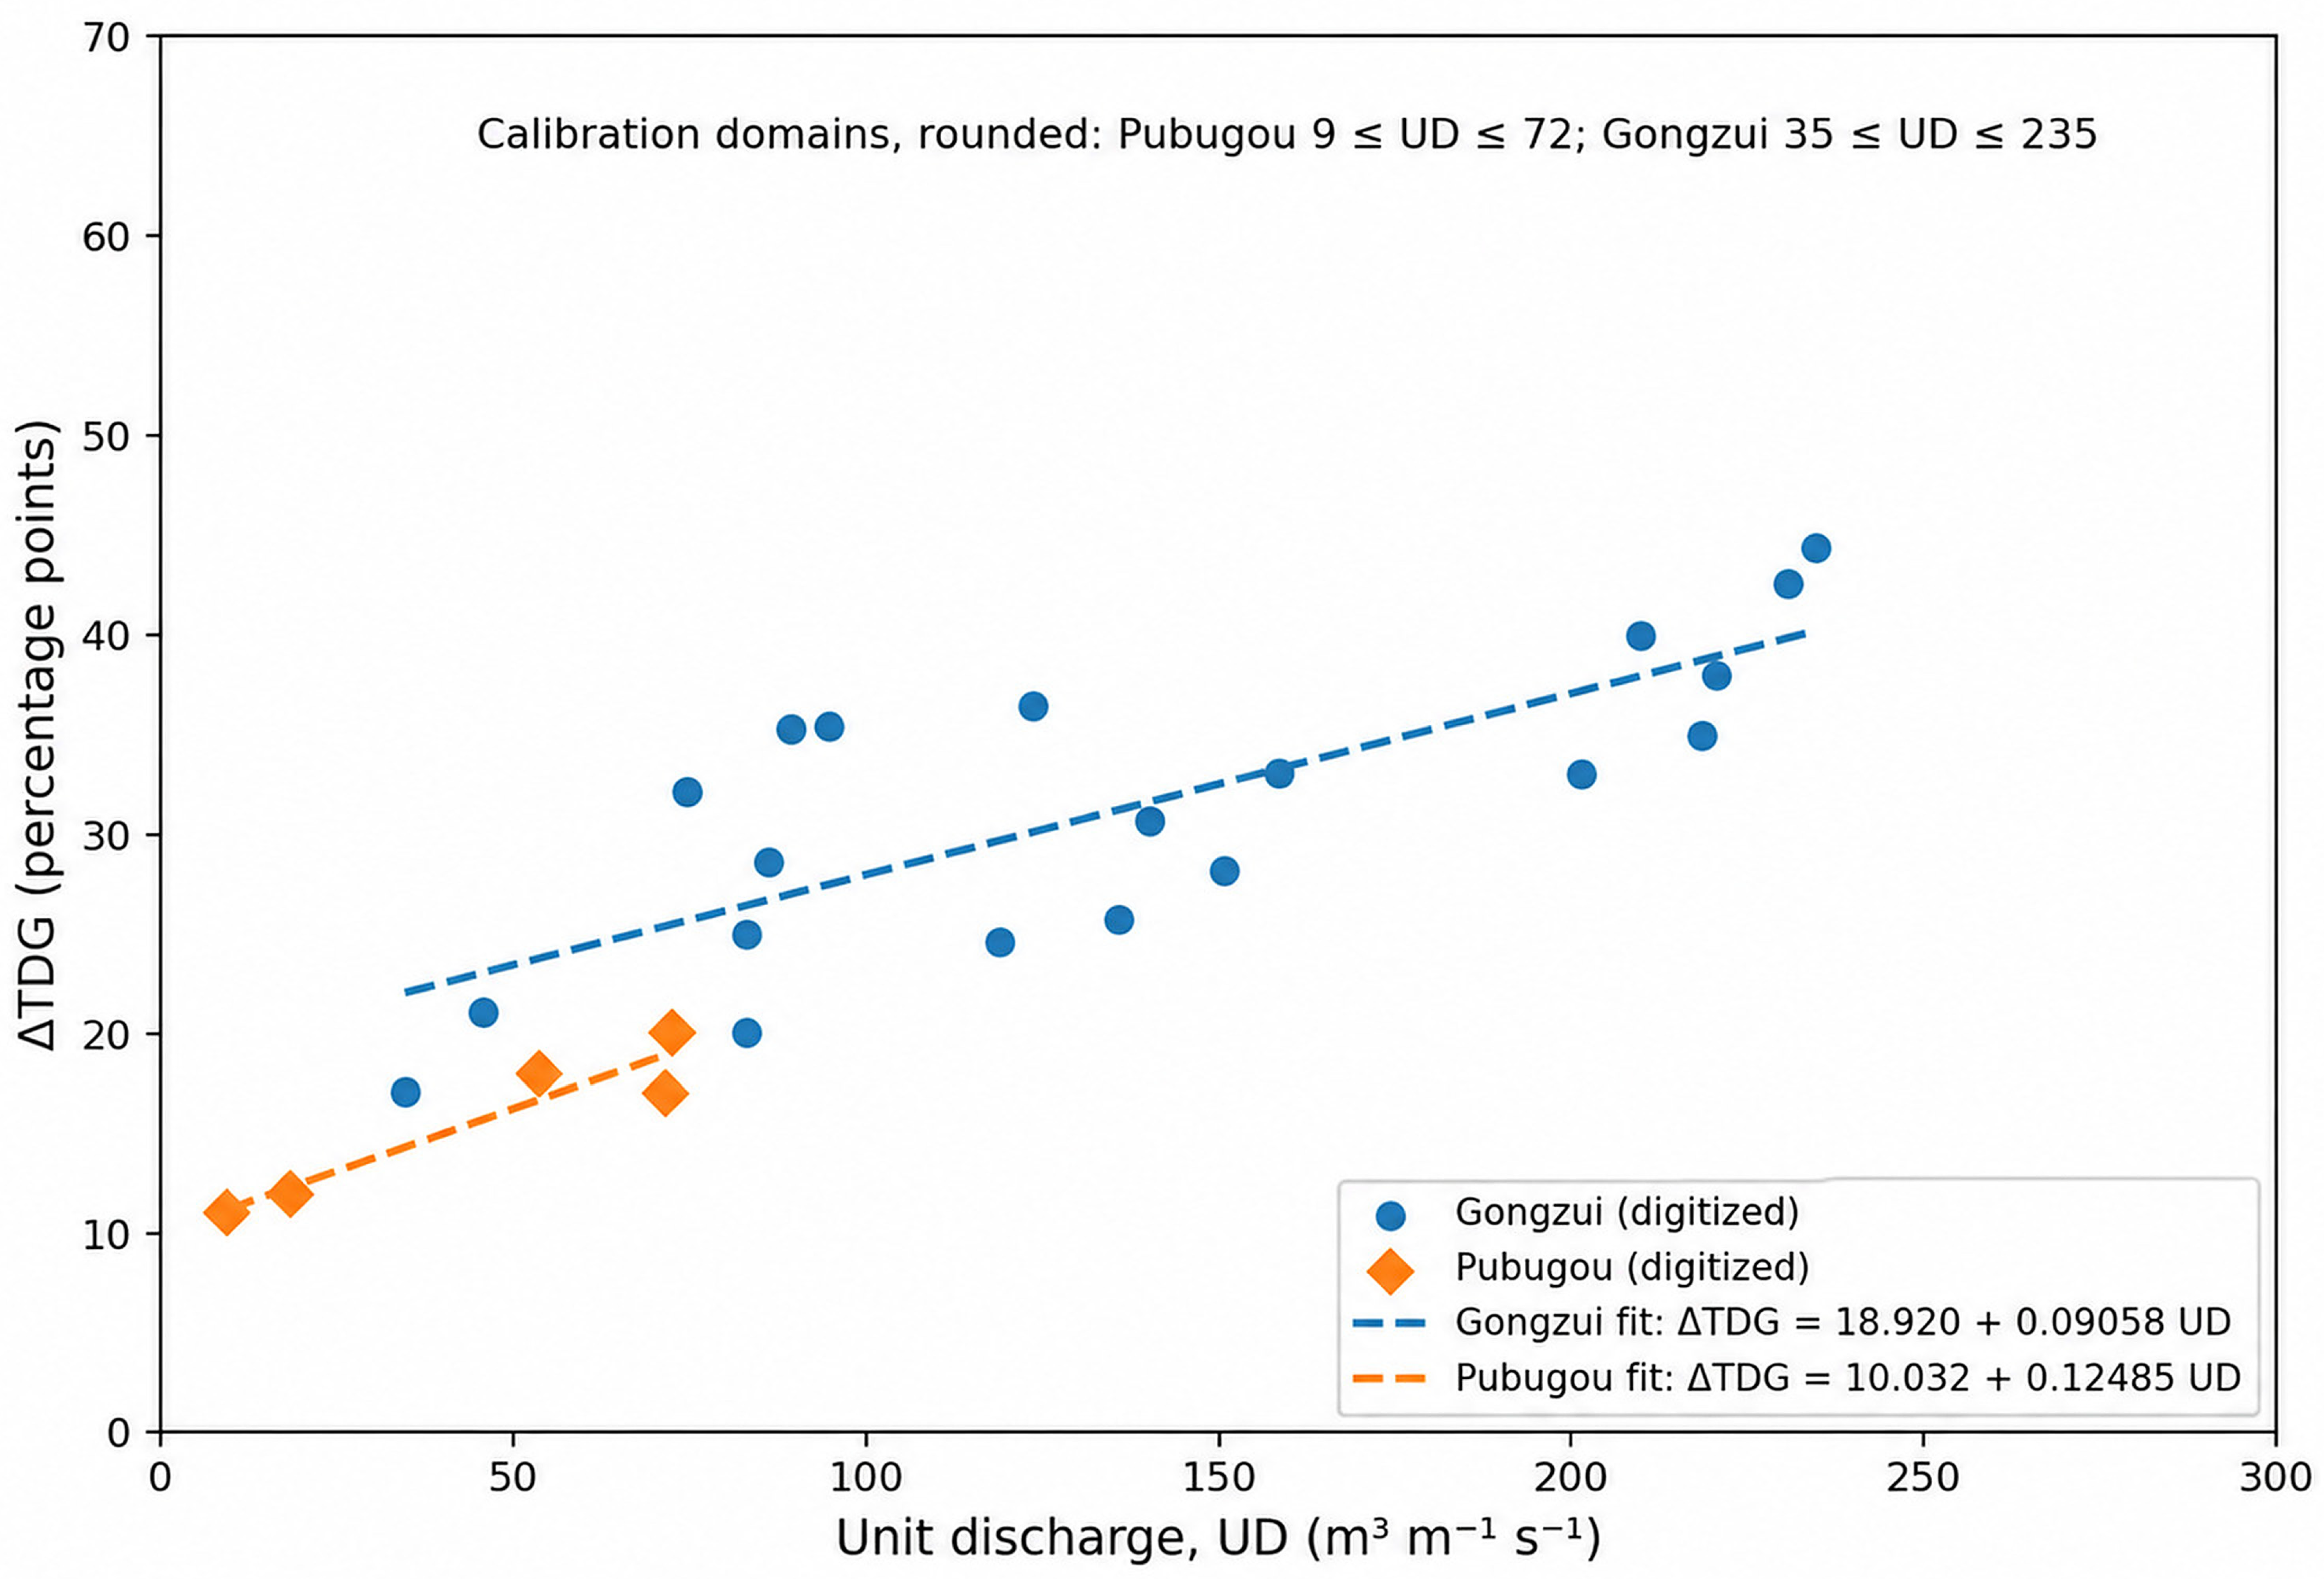
Figure 3 presents the digitized observations and the two configuration-specific linear relationships. Pubugou uses ski-jump energy dissipation, whereas Gongzui is characterized by surface-flow energy dissipation [77]. The fitted lines are shown only within their respective empirical calibration domains.
Figure 3.
Increase in TDG saturation (ΔTDG, percentage points) versus unit discharge for spill-release observations digitized from Feng et al. [77]. Symbols represent the Pubugou and Gongzui datasets, and the dashed lines show the separate linear screening relationships fitted to each facility. The fitted lines are restricted to their respective empirical calibration domains; no pooled relationship is applied.
For configurations broadly comparable to the ski-jump energy-dissipation arrangement at Pubugou, the screening relationship is:
with an empirical applicability range of 9.1 ≤ UD ≤ 72.3 m3 m−1 s−1. The 95% confidence intervals were 5.945–14.120 for the intercept and 0.04650–0.20319 for the slope.
ΔTDGP = 10.032 + 0.12485 UD
For configurations broadly comparable to the surface-flow energy-dissipation arrangement at Gongzui, the screening relationship is:
with an empirical applicability range of 34.6 ≤ UD ≤ 234.6 m3 m−1 s−1. The 95% confidence intervals were 13.421–24.419 for the intercept and 0.05398–0.12717 for the slope.
ΔTDGG = 18.920 + 0.09058 UD
In Equations (1) and (2), UD is the unit discharge and ΔTDG is the estimated increase in TDG saturation, expressed in percentage points. The equations were neither averaged nor combined. Equation (1) was applied only where the available technical information supported broad hydraulic comparability with the Pubugou ski-jump configuration. Equation (2) was provisionally assigned to controlled spillways discharging into stilling basins as an inventory-level first-order analog of the Gongzui configuration. These requirements refer to the energy-dissipation regime and the principal hydraulic mechanism rather than to nominal spillway labels alone. This assignment does not demonstrate that the Brazilian facilities reproduce the surface-flow regime, tailwater conditions, or detailed energy-dissipation hydraulics observed at Gongzui. Cases lacking sufficient evidence of hydraulic comparability were classified as not evaluated because of hydraulic dissimilarity (NE-H). Cases with unit discharge outside the empirical range of the corresponding equation were classified as not evaluated because of unit discharge (NE-UD). Neither NE-H nor NE-UD indicates low, negligible, or absent TDG-generation potential. These classifications indicate only that the available empirical relationships do not support a numerical estimate.
Equations (1) and (2) provide configuration-specific screening estimates rather than calibrated predictions for the assessed Brazilian facilities. They do not explicitly represent exact gate opening, tailwater elevation, local spillway geometry, air entrainment, water temperature, upstream supersaturation, powerhouse dilution, measurement location, exposure duration, or downstream TDG dissipation. The resulting values should therefore be interpreted only as conditional screening indicators used to identify conditions that warrant monitoring, hydraulic modeling, or plant-specific investigation. They should not be interpreted as compliance values, ecological-risk estimates, biological thresholds, or evidence that a specific TDG level will occur during actual plant operation.
4.4. Operational Scenarios for Environmental-Flow Releases
Two standardized release configurations were evaluated. In the distributed scenario, the environmental-flow release was divided equally among all available bays. In the single-bay scenario, the same flow was assigned to one bay as a theoretical hydraulic bounding case intended to maximize unit discharge for a fixed environmental-flow input. The single-bay scenario does not represent routine, expected, or recommended operation and should not be interpreted as a reconstruction of plant-specific gate-opening schedules. The two scenarios isolate the effect of effective discharge width within the screening framework and do not demonstrate that either configuration is operationally feasible or environmentally preferable at a particular facility.
The scenarios represent standardized release configurations rather than the observed frequency or historical pattern of spillway operation. Because complete gate-position, turbine-status, and dispatch records were not publicly available for all plants, the analysis distinguishes plant characteristics obtained from documented sources from release configurations introduced as screening assumptions.
For each scenario, , where is the adopted environmental-flow release and is the effective discharge width. For every plant, represents a regulation-based regional surrogate derived from the state-level criteria reported in [59], rather than a plant-specific licensing or operating requirement. The scenarios therefore provide a standardized basis for comparing hydraulic loading among the selected facilities. For the distributed scenario, is the total width of the available bays; for the single-bay scenario, it is the nominal width of one bay. Equal-flow distribution, uniform gate geometry, and steady hydraulic conditions were assumed idealizations that should be compared with actual operating rules where data are available.
Where design information was available, the calculated single-bay unit discharge was compared with the reported design unit discharge as a nominal screening-level capacity check. This comparison does not establish operational feasibility, which also depends on gate-opening limits, minimum controllable discharge, structural and dam-safety requirements, tailwater conditions, licensing constraints, and plant-specific operating procedures.
Rather than estimating plant-specific final downstream TDG saturation, the analysis uses the configuration-specific increase in saturation, , as a conditional screening indicator. A numerical value was calculated only when the inventory-level classification supported application of either the Pubugou-based ski-jump relationship or the provisionally assigned Gongzui-based stilling-basin analog, and when UD remained within the empirical domain of the applicable relationship. Cases without sufficient hydraulic comparability were classified as not evaluated because of hydraulic dissimilarity (NE-H). Cases outside the empirical range of the applicable relationship were classified as not evaluated because of unit discharge (NE-UD). Neither classification indicates low or negligible TDG-generation potential; it indicates only that the available empirical relationship does not support a numerical estimate.
Upstream TDG saturation was not added to and was not used in the prioritization procedure. Upstream conditions are strongly site- and time-dependent and may be particularly important in cascaded systems. Consequently, the analysis does not report plant-specific final TDG concentrations. The calculated values represent only the increase associated with the standardized hydraulic scenario and the applicable source relationship.
The results were not used to establish a universal ordinal ranking of expected TDG among all assessed plants. Instead, they support a conditional screening prioritization under standardized assumptions regarding environmental flow, active discharge width, and gate-flow distribution. Comparisons were restricted to plants evaluated within the same hydraulically comparable configuration group and under the same release scenario. Values obtained using the Pubugou and Gongzui relationships were not combined into a single cross-configuration ranking.
Accordingly, the monitoring prioritization is conditional on the adopted hydraulic analog and on the standardized assumptions for the environmental-flow surrogate (Qs), effective discharge width, resulting unit discharge, and release configuration. A priority indication is meaningful only when the evaluated scenario remains within the empirical applicability domain of the corresponding source relationship. Changes in any of these assumptions may alter both the applicability classification and the relative monitoring prioritization. The framework therefore adds information beyond spillway classification alone by incorporating scenario-specific effective release width, unit discharge, release configuration, and empirical-domain applicability.
Within each applicable group, comparatively larger values were interpreted as identifying plants or operating conditions that may warrant greater priority for field monitoring, hydraulic modeling, or plant-specific investigation. This interpretation does not demonstrate that the plant will produce a higher downstream TDG concentration during actual operation, that the same ordering would persist under different upstream TDG levels, environmental flows, active widths, gate arrangements, or regression parameters, or that the facility presents greater ecological risk.
The outputs should therefore be interpreted as comparative screening indicators rather than compliance predictions, operating limits, biological-effect estimates, or gate-operation recommendations. Site-specific monitoring, operational data, and hydraulic modeling are required before conclusions are drawn regarding actual TDG levels or appropriate spillway operation.
4.5. Uncertainty and Limitations
The main uncertainties are model transferability, environmental-flow input quality, the equal-flow assumption, and omitted hydraulic variables. Tailwater depth, gate opening, jet regime, basin geometry, aeration, temperature, atmospheric pressure, and upstream saturation are not represented.
In addition to the 95% confidence intervals reported for the fitted coefficients, 95% regression prediction intervals were calculated for the four numerical screening outputs. These intervals represent the residual variability of the source regressions but do not constitute fully propagated uncertainty bounds for the Brazilian plants, because uncertainty associated with hydraulic transferability, environmental-flow inputs, effective discharge width, gate configuration, and other site-specific variables is not included.
Both relationships were fitted to limited external datasets. These limitations are material and accompany every numerical result.
Simultaneous upstream and downstream TDG records are scarce for the selected Brazilian plants. Upstream TDG was not included in the calculated screening increments because it is strongly site- and time-dependent, particularly in cascaded systems. Plant-specific downstream TDG assessment would require synchronized upstream measurements. A sensitivity analysis using measured or scenario-based upstream saturations is therefore recommended. Environmental-flow releases may vary seasonally and according to plant-specific licensing or operating rules. Such variation may alter unit discharge, applicability classification, and the resulting monitoring prioritization within each hydraulic configuration group. Accordingly, the prioritization should be interpreted as conditional on the adopted reference-flow scenario rather than as temporally invariant. Future plant-specific evaluation should use synchronized records of upstream and downstream TDG, spill and turbine discharge, gate position, tailwater level, water temperature, and barometric pressure, complemented, where feasible, by rapid biological observations.
5. Results
Table 2 reports the scenario-specific unit discharges and the corresponding configuration-specific indicators. Numerical estimates were assigned only when the inventory-level classification supported application of either the Pubugou-based ski-jump relationship or the provisionally assigned Gongzui-based stilling-basin analog, and when the calculated unit discharge remained within the empirical domain of the applicable relationship. The Pubugou-based relationship was assigned to controlled spillways with ski-jump energy dissipation and was applied only within . The Gongzui-based relationship was assigned to controlled spillways discharging into stilling basins and was applied only within . This assignment represents a first-order screening analogue based on the available inventory-level classification and does not establish equivalence of detailed jet, tailwater, aeration, or stilling-basin hydraulics.
Table 2.
Scenario-specific unit discharge and configuration-specific indicators for selected hydropower plants in the Amazon and Tocantins–Araguaia basins.
Free-surface overflow facilities and other configurations for which hydraulic comparability with either source configuration could not be established were classified as not evaluated because of hydraulic dissimilarity (NE-H). Cases assigned to a source relationship but falling outside its empirical unit-discharge domain were classified as not evaluated because of unit discharge (NE-UD). Neither classification indicates low or negligible TDG-generation potential; it indicates only that the available empirical relationships do not support a numerical estimate under the evaluated scenario. When either the distributed-flow or single-bay scenario was classified as NE-H or NE-UD, no numerical comparison between the two release configurations was performed for that facility. In such cases, the table indicates only whether each scenario could be evaluated within the hydraulic and empirical limits of the applicable relationship.
All distributed-flow scenarios assigned to the Pubugou- or Gongzui-based relationships fell below the corresponding empirical domain. The remaining distributed-flow cases were classified as NE-H because hydraulic comparability with either source configuration could not be established. Four single-bay cases produced numerical screening indicators: Estreito, Jirau, and Santo Antônio under the Gongzui-based relationship, and Teles Pires under the Pubugou-based relationship. The corresponding 95% regression prediction intervals were 11.4–33.5 p.p. for Estreito, 20.2–41.1 p.p. for Jirau, 22.9–43.9 p.p. for Santo Antônio, and 8.3–18.8 p.p. for Teles Pires. The width of these intervals, particularly for the Gongzui-based cases, reinforces that the reported values should be interpreted as reference screening scenarios rather than precise plant-specific predictions. Because the corresponding distributed-flow cases were classified as NE-UD, the single-bay indicators cannot be interpreted as numerical increases relative to distributed operation. Consequently, no quantitative comparison between the two scenarios is made for these facilities; the results indicate only that the single-bay bounding case entered the empirical domain of the applicable relationship.
These results arise mechanically from concentrating the adopted environmental-flow surrogate over a smaller effective discharge width. The single-bay scenario remains a theoretical hydraulic bounding case and should not be interpreted as expected plant operation, evidence that one-bay releases are routinely used, or confirmation that such configurations are operationally permitted.
The results are interpreted as a screening prioritization under standardized assumptions rather than as a ranking of actual downstream TDG conditions. Larger calculated values indicate greater relative TDG-generation potential only among facilities evaluated with the same empirical relationship and under the same release scenario. Because the Pubugou- and Gongzui-based relationships have different coefficients, calibration domains, uncertainty levels, and energy-dissipation configurations, their numerical outputs were not combined into a universal cross-configuration or ordinal plant ranking.
Within each applicable hydraulic group, comparatively larger values identify facilities or operating conditions that may warrant greater priority for field monitoring, hydraulic modeling, or plant-specific investigation. This designation does not demonstrate that the identified plants will generate higher downstream TDG concentrations during actual operation, that the same ordering would persist under different environmental flows, active widths, gate configurations, upstream TDG levels, or regression parameters, or that these facilities present greater ecological risks.
Upstream TDG saturation was not added to the calculated increments, and plant-specific final downstream TDG concentrations are therefore not reported. This avoids imposing a uniform assumption on facilities with potentially different background conditions, particularly in cascade systems. The numerical outputs are configuration-specific increments expressed in percentage points. They are intended solely as comparative screening indicators and should not be interpreted as compliance predictions, ecological-risk estimates, biological thresholds, operating limits, or gate-operation recommendations.
The Sinop TDG-monitoring record reported by Ribeiro [57] is retained as qualitative contextual evidence of the limitations of transferring unit-discharge relationships among hydropower plants. A direct numerical comparison with is not possible because the available record does not provide a complete synchronized dataset containing upstream TDG, effective gate opening, discharge distribution, tailwater conditions, temperature, and the other variables required to reproduce the screening assumptions. The Sinop observations are therefore not used for regression validation, prediction-error calculation, or model recalibration. They nevertheless reinforce that unit discharge alone cannot represent the full set of processes controlling TDG generation.
Andriolo et al. [36] reported lower downstream TDG after spillway deflectors were installed at Colíder HPP. Because a complete simultaneous upstream series was not available, the observed change cannot be attributed exclusively to the deflectors under varying background conditions. The Colíder case is not used to validate Equations (1) or (2). Instead, it is retained as contextual evidence that structural modifications, tailwater conditions, and site-specific hydraulic processes may alter TDG generation beyond the effect represented by unit discharge alone.
6. Discussion
TDG management should combine monitoring, operational evaluation, and structural assessment. Cascade coordination can reduce overlapping exposure events, while gradual gate changes may limit rapid hydraulic transients. However, the relationship between discharge distribution and TDG is not universally monotonic: coherent surface jets, plunging jets, tailwater depth, and aeration can reverse the trend predicted from unit discharge alone [12,15,18,19]. Accordingly, the single-bay and all-bay scenarios should be used to prioritize tests, not to prescribe gate operation.
The present screening framework does not evaluate generation schedules, redispatch frequency, ramping trajectories, energy losses, costs, or system optimization. Therefore, its implications for dispatch feasibility and cascade coordination should be regarded as hypotheses for future plant-specific and energy-system analyses. A TDG-related variable could eventually be incorporated into operational planning as a calibrated downstream-TDG constraint, a plant-specific spill-to-TDG response function, or a penalty associated with the magnitude and duration of TDG exceedance. Such formulations would require synchronized hydraulic and TDG data, operational constraints, and explicit representation of generation and redispatch costs.
The ecological interpretation should likewise remain cautious. Beyond acute mortality, TDG supersaturation produces sublethal and behavioral effects—delayed or reduced upstream passage and impaired swimming capacity—that emerge at moderate saturations and depend strongly on flow velocity, species, and life stage [25,26,27]. Because the high fish diversity of the Teles Pires basin includes species with contrasting tolerances and migratory behaviors [79], screening estimates should be paired with site- and species-specific ecological evaluation rather than a single tolerance figure.
Continuous upstream and downstream TDG monitoring should be synchronized with discharge, gate position, tailwater elevation, temperature, and atmospheric pressure. These data can support plant-specific rating curves, uncertainty bounds, operational alarms, and advanced empirical or data-driven models for sparsely monitored settings [80]. At a minimum, the development of plant-specific TDG rating curves would require synchronized measurements of upstream and downstream TDG saturation, spill discharge, gate opening or effective active width, headwater and tailwater elevations, water temperature, and spillway and powerhouse operating status. Turbine discharge, atmospheric pressure, sensor location and depth, and hydraulic travel time should also be recorded where feasible. All measurements should use a common time reference and cover multiple discharge, gate, tailwater, and upstream-TDG conditions. A comprehensive plant-specific operational framework should also characterize TDG changes through the turbine pathway and under mixed turbine–spillway releases. This would require synchronized measurements of forebay and tailrace TDG, turbine discharge, spill discharge, gate configuration, and downstream mixing conditions. Such relationships were not available consistently for the selected facilities and therefore remain a priority for future research. Where recurrent exceedances are observed, physical or CFD models can evaluate gate sequences, deflectors, stilling-basin modifications, and dedicated degassing measures [76].
Operational restrictions should be considered only within an approved decision framework that accounts for dam safety, environmental-flow obligations, system reliability, and site-specific ecological criteria. The Washington 110% criterion is a useful international benchmark but is not directly a Brazilian legal limit [5]. Brazilian operating criteria should be developed jointly with regulators, plant operators, dam-safety authorities, and ecological specialists. The screening framework does not quantify maintenance-related effects, opportunity costs, or power-system consequences; these require separate operational and economic analyses and should not be inferred from the present TDG calculations.
Structural options include spillway deflectors, energy-dissipator modifications, and purpose-designed degassing structures. Their feasibility depends on dam safety, foundation conditions, hydraulic loads, environmental licensing, construction outages, and performance across the operating envelope. Because aeration can either promote degassing or increase gas dissolution, generic aerator recommendations should be avoided without site-specific physical or CFD testing and safety evaluation [15,36,76].
7. Conclusions
This study presents a basin-scale screening framework for spillway-related TDG-generation potential under intermittent hydropower operation in the Brazilian Amazon and Tocantins–Araguaia basins. The framework combines plant-inventory data, standardized environmental-flow scenarios, and two configuration-specific empirical unit-discharge relationships derived separately from the Pubugou and Gongzui datasets. It is suitable for conditional screening prioritization under standardized assumptions only; it is not a compliance model or a substitute for hydraulic simulation and field calibration. The quantitative outputs are configuration-specific increases in TDG saturation, expressed as in percentage points, rather than predictions of final downstream TDG concentrations. The single-bay scenario was designed solely to examine the hydraulic effect of concentrating a fixed release over the minimum effective width and should not be interpreted as expected, documented, recommended, or necessarily feasible plant operation. Quantitative estimates were assigned only when the inventory-level classification supported application of either the Pubugou-based ski-jump relationship or the provisionally assigned Gongzui-based stilling-basin analog, and when unit discharge remained within the empirical domain of the applicable relationship. This classification represents a first-order screening analogue and does not establish equivalence of detailed jet, tailwater, aeration, or energy-dissipation hydraulics. Free-surface overflow facilities and other configurations without sufficient evidence of hydraulic comparability were classified as NE-H, whereas hydraulically comparable cases outside the applicable unit-discharge domain were classified as NE-UD.
No distributed-flow scenario produced a numerical estimate: scenarios assigned to the Pubugou- or Gongzui-based relationships were classified as NE-UD, whereas hydraulically dissimilar free-surface cases were classified as NE-H. Accordingly, NE-UD and NE-H should not be interpreted as indicating low TDG-generation potential, and numerical comparisons between distributed and single-bay operation cannot be made when either scenario is not evaluated. The retained numerical outputs represent only configuration-specific screening increments under standardized assumptions and support prioritization for monitoring rather than prediction of actual downstream TDG. Values derived from the Pubugou- and Gongzui-based relationships were not combined into a universal cross-configuration or ordinal plant ranking.
The Sinop and Colíder observations provide regional contextual evidence of the limits of transferring unit-discharge relationships among hydropower plants. The Sinop monitoring record reported by Ribeiro [57] cannot be directly compared numerically with the screening indicators because a complete synchronized dataset containing upstream TDG, effective gate opening, discharge distribution, tailwater conditions, temperature, and other required variables was not available. Likewise, the reduction in downstream TDG reported after the installation of spillway deflectors at Colíder [36] cannot be attributed exclusively to the structural intervention because a complete simultaneous upstream series was unavailable. These cases are therefore not used for model validation or recalibration, but they reinforce that structural characteristics, tailwater conditions, upstream saturation, gate operation, temperature, and other site-specific factors may dominate TDG generation and model transferability.
The screening indicators also do not constitute an ecological-risk assessment. They do not represent exposure duration, water depth, species or life-stage sensitivity, avoidance behavior, upstream saturation, or downstream dissipation. Biological-effect ranges are therefore used, where mentioned, only as contextual information and not as thresholds for interpreting the calculated values.
The main operational implication is not a universal requirement to open more gates. Likewise, the results do not support concentrating releases in one bay or prescribing any specific gate configuration. Actual gate-operation strategies require plant-specific assessment of hydraulic capacity, dam safety, operating rules, licensing conditions, and downstream environmental responses. Rather, facilities producing comparatively larger indicators within the same hydraulic configuration group and standardized scenario, as well as recurrently spilling facilities and NE-H cases requiring site-specific assessment, should be prioritized for synchronized monitoring and plant-specific rating curves. Gate strategies, cascade coordination, and structural measures should be evaluated with physical or numerical modeling and ecological criteria before they are incorporated into dispatch rules.
Future work should give particular attention to plant-specific environmental-flow rules, the uncertainty and transferability of both configuration-specific relationships, hydraulic applicability, and site-specific evaluation using complete, simultaneous upstream and downstream TDG and hydraulic measurements. The accompanying calculation dataset, spreadsheet, and code improve the reproducibility of the screening analysis. Biological assessment may complement these campaigns when appropriate. The present study does not establish causality for fish mortality, universal tolerance thresholds, or universally applicable spillway-operation rules.
Supplementary Materials
The following supporting information can be downloaded at https://www.mdpi.com/article/10.3390/en19163932/s1, Table S1, Digitized Pubugou and Gongzui data; Table S2, Complete plant-level dataset, source traceability, and hydraulic classification; Table S3, Complete scenario calculations, including unit discharge, applicable relationship, empirical-domain checks, NE-H and NE-UD classifications, and indicators; Data S1, Formula-based spreadsheet used to reproduce Table 2 and Figure 3; and Code S1, Python script used to reproduce the calculation table and Figure 3.
Author Contributions
Conceptualization, G.M.F.F. and C.B.M.; methodology, G.M.F.F., C.B.M. and W.M.F.d.S.; software and data curation, G.M.F.F., D.S.R. and G.S.B.; formal analysis, G.M.F.F. and W.M.F.d.S.; investigation, G.M.F.F., A.L.F.d.C., L.B.N., J.M.N., L.R., B.C.M. and R.R.V.d.C.; resources, J.M.N., L.R., B.C.M. and R.R.V.d.C.; writing—original draft preparation, G.M.F.F.; writing—review and editing, C.B.M., D.S.R., G.S.B., W.M.F.d.S., A.L.F.d.C. and L.B.N.; visualization, G.M.F.F.; supervision, C.B.M.; project administration, C.B.M. and J.M.N.; funding acquisition, C.B.M. and J.M.N. All authors have read and agreed to the published version of the manuscript.
Funding
This research was funded by Sinop Energia S.A., under the project “Quantifying Lethality and Fish Behavior under Gas Supersaturation Exposure in Rivers Influenced by Hydropower Plants,” Agreement/Process No. AP 23088.012191/2023-30.
Data Availability Statement
The plant-level input dataset, source traceability, hydraulic classifications, digitized Pubugou and Gongzui observations, regression results, complete scenario calculations, and the spreadsheet and Python 3.13.5 script used to reproduce Table 2 and Figure 3 are provided in the Supplementary Materials. The Sinop operational and TDG-monitoring records used as contextual evidence were made available to the research team under the conditions of the research agreement with Sinop Energia S.A. The complete operational dataset remains under the control of Sinop Energia S.A. and cannot be publicly released because it contains restricted plant-operation information. Requests for access may be submitted to the corresponding author and will be considered jointly with Sinop Energia S.A., subject to confidentiality, contractual, and operational-security restrictions. All other external data used in the study are available from the publicly accessible sources cited in the manuscript.
Acknowledgments
The authors acknowledge Sinop Energia S.A. for operational data access and technical support, and ONS, ANEEL, ANA, and EPE for the public datasets used in the inventory and contextual analysis.
Conflicts of Interest
The authors declare that this study received funding from Sinop Energia S.A. The funder provided access to selected plant-operational information and technical clarification regarding the Sinop facility. The academic authors were responsible for defining the screening methodology, regression analysis, interpretation of the results, and preparation of the scientific conclusions. Representatives of Sinop Energia S.A. reviewed the manuscript for factual accuracy concerning plant characteristics, operational information, and confidentiality restrictions.
Abbreviations
The following abbreviations are used in this manuscript:
| AICC | Akaike information criterion |
| ANA | National Water and Sanitation Agency |
| ANEEL | Brazilian Electricity Regulatory Agency |
| CFD | Computational fluid dynamics |
| CS | Controlled spillway |
| EPE | Energy Research Company |
| FS | Free-surface overflow |
| HPP | Hydropower plants |
| NA | Not available/not applicable |
| NE-H | Not evaluated (hydraulically dissimilar) |
| NE-UD | Not evaluated (unit discharge outside empirical domain) |
| ONS | National System Operator |
| RMSE | Root-mean-square error |
| ROR | Run-of-river |
| SB | Stilling basin |
| SIGA | Generation Information System (ANEEL) |
| SIN | National Interconnected System |
| SJ | Ski jump |
| SNISB | National Dam Safety Information System |
| SR | Storage regulation |
| TDG | Total dissolved gas |
| UD | Unit discharge |
References
- Operador Nacional do Sistema Elétrico (ONS). Diagnóstico e Perspectiva da Evolução dos Cortes de Geração no Brasil; RT ONS DGL 0189/2025; Grupo de Trabalho Cortes de Geração: Rio de Janeiro, Brazil, 2025. [Google Scholar]
- Bastos, A.S.; Ribeiro, D.S.; Martinez, C.B. Generation Losses Due to the Temporal Factor Influence in Load Loss: A Study Case of SHP Repi. J. Eng. Res. 2022, 2, 2–11. [Google Scholar] [CrossRef] [Scilit]
- Li, P.; Zhu, D.Z.; Li, R.; Wang, Y.; Crossman, J.A.; Kuhn, W.L. Production of Total Dissolved Gas Supersaturation at Hydropower Facilities and Its Transport: A Review. Water Res. 2022, 223, 119012. [Google Scholar] [CrossRef] [Scilit] [PubMed]
- Kusnierz, P.C. Reducing Total Dissolved Gas and Gas Bubble Trauma in a Regulated River. Fishes 2024, 9, 427. [Google Scholar] [CrossRef] [Scilit]
- Washington State Legislature. WAC 173-201A-200: Fresh Water Designated Uses and Criteria; Washington State Legislature: Olympia, WA, USA. Available online: https://app.leg.wa.gov/wac/default.aspx?cite=173-201A-200 (accessed on 6 July 2026).
- Deng, Y.; Cao, C.; Liu, X.; Yuan, Q.; Feng, C.; Shi, H.; Yang, Y.; Wu, Y. Effect of Total Dissolved Gas Supersaturation on the Survival of Bighead Carp (Hypophthalmichthys nobilis). Animals 2020, 10, 166. [Google Scholar] [CrossRef] [Scilit] [PubMed]
- Agostinho, A.A.; Alves, D.C.; Gomes, L.C.; Dias, R.M.; Petrere, M., Jr.; Pelicice, F.M. Fish Die-Off in River and Reservoir: A Review on Anoxia and Gas Supersaturation. Neotrop. Ichthyol. 2021, 19, e210037. [Google Scholar] [CrossRef] [Scilit]
- Ferraz, G.M.F.; Martinez, C.B.; Ribeiro, D.S.; Bastos, G.S.; de Castro, A.L.F.; Nogueira, L.B.; Neves, J.M.; Rosa, L.; Macedo, B.C.; Carvalho, R.R.V. Total Dissolved Gas Supersaturation as a System-Level Constraint on Flexible Hydropower Dispatch: An Engineering Assessment Within the Water–Energy–Environment Nexus. Water 2026, 18, 1633. [Google Scholar] [CrossRef] [Scilit]
- Geldert, D.A.; Gulliver, J.S.; Wilhelms, S.C. Modeling Dissolved Gas Supersaturation Below Spillway Plunge Pools. J. Hydraul. Eng. 1998, 124, 513–521. [Google Scholar] [CrossRef] [Scilit]
- Wang, Y.; Politano, M.; Weber, L. Spillway Jet Regime and Total Dissolved Gas Prediction with a Multiphase Flow Model. J. Hydraul. Res. 2019, 57, 26–38. [Google Scholar] [CrossRef] [Scilit]
- Kamal, R.; Zhu, D.Z.; Leake, A.; Crossman, J.A. Dissipation of Supersaturated Total Dissolved Gases in the Intermediate Mixing Zone of a Regulated River. J. Environ. Eng. 2019, 145, 04018145. [Google Scholar] [CrossRef] [Scilit]
- Kamal, R.; Zhu, D.Z.; Crossman, J.A.; Leake, A. A System Model for Total Dissolved Gas Risk Assessment Due to Multidam Spill Operations. J. Water Resour. Plan. Manag. 2021, 147, 04021086. [Google Scholar] [CrossRef] [Scilit]
- Politano, M.; Carrica, P.; Weber, L. A Multiphase Model for the Hydrodynamics and Total Dissolved Gas in Tailraces. Int. J. Multiph. Flow 2009, 35, 1036–1050. [Google Scholar] [CrossRef] [Scilit]
- Huang, J.; Lu, J.; Li, R.; Feng, J.; Yang, H. Numerical Study on the Cumulative Effect of Supersaturated TDG Through the Spillway. Ecohydrol. Hydrobiol. 2021, 21, 292–298. [Google Scholar] [CrossRef] [Scilit]
- Huang, J.; Li, R.; Feng, J.; Li, Z.; Cheng, X.; Wang, Z. The Application of Baffle Block in Mitigating TDGS of Dams with Different Discharge Patterns. Ecol. Indic. 2021, 133, 108418. [Google Scholar] [CrossRef] [Scilit]
- Lu, J.; Li, R.; Ma, Q.; Feng, J.; Xu, W.; Zhang, F.; Tian, Z. Model for Total Dissolved Gas Supersaturation from Plunging Jets in High Dams. J. Hydraul. Eng. 2019, 145, 04018082. [Google Scholar] [CrossRef] [Scilit]
- Myers, R.; Parkinson, S.E. Hells Canyon Complex Total Dissolved Gas Study; Idaho Power Company: Boise, ID, USA, 2003. [Google Scholar]
- U.S. Army Corps of Engineers (USACE). Technical Analysis of TDG Processes; Northwest Division, Environmental Resources and Fish Planning Offices: Portland, OR, USA, 2005.
- Politano, M.; Castro, A.; Hadjerioua, B. Modeling Total Dissolved Gas for Optimal Operation of Multireservoir Systems. J. Hydraul. Eng. 2017, 143, 04017007. [Google Scholar] [CrossRef] [Scilit]
- Chen, X.; Zhang, Z.; Qin, Y.; Liu, S.; Wang, Y.; Feng, J.; Li, K. An In-Situ Study in the Xijiang River Basin Revealed Adverse Effects of Total Dissolved Gas Supersaturation on Fish. Ecotoxicol. Environ. Saf. 2025, 289, 117663. [Google Scholar] [CrossRef] [Scilit] [PubMed]
- Weitkamp, D.E.; Katz, M. A Review of Dissolved Gas Supersaturation Literature. Trans. Am. Fish. Soc. 1980, 109, 659–702. [Google Scholar] [CrossRef] [Scilit]
- Fan, Z.; Deng, Y.; Yuan, Q.; Liu, X.; Shi, H.; Feng, C.; Yang, Y.; Xu, L. Effect of Total Dissolved Gas Supersaturation on the Tolerance of Grass Carp (Ctenopharyngodon idellus). Environ. Sci. Eur. 2020, 32, 55. [Google Scholar] [CrossRef] [Scilit]
- Ji, Q.; Xue, S.; Yuan, Q.; Yuan, Y.; Wang, Y.; Liang, R.; Feng, J.; Li, K.; Li, R. The Tolerance Characteristics of Resident Fish in the Upper Yangtze River Under Varying Gas Supersaturation. Int. J. Environ. Res. Public Health 2019, 16, 2021. [Google Scholar] [CrossRef] [Scilit] [PubMed]
- Yuan, Y.; Wei, Q.; Yuan, Q.; Wang, Y.; Liang, R.; Li, K.; Zhu, D.Z. Impact of TDG Supersaturation on Native Fish Species Under Different Hydropower Flood Discharge Programs. Aquat. Toxicol. 2021, 237, 105898. [Google Scholar] [CrossRef] [Scilit] [PubMed]
- Li, M.; Ou, Y.; Zhu, B.; Liao, J.; Yang, X.; Shi, X.; Yuan, Q. Assessment of Total Dissolved Gas Supersaturation Stress on Passage Performance of Bighead Carp (Hypophthalmichthys nobilis) in a Vertical Slot Fishway. Front. Mar. Sci. 2025, 12, 1549115. [Google Scholar] [CrossRef] [Scilit]
- Yang, X.; Shi, H.; Liu, X.; Ou, Y.; Liu, X.; Li, M.; Yuan, Q. Effect of Total Dissolved Gas Supersaturation on the Passage Behavior of Silver Carp (Hypophthalmichthys molitrix) and Ya-Fish (Schizothorax prenanti) Through an Experimental Vertical Slot Fishway. Ecotoxicol. Environ. Saf. 2024, 277, 116370. [Google Scholar] [CrossRef] [Scilit] [PubMed]
- Yuan, Q.; Du, J.; Li, K.; Wang, Y.; Liang, R. Effect of Total Dissolved Gas Supersaturation and Flow Velocity on Survival and Swimming Ability of Juvenile Schizothorax prenanti. Conserv. Physiol. 2023, 11, coad091. [Google Scholar] [CrossRef] [Scilit] [PubMed]
- Agência Nacional de Águas e Saneamento Básico (ANA). Sistema Nacional de Informações sobre Segurança de Barragens (SNISB). Available online: https://www.snisb.gov.br/portal-snisb/inicio (accessed on 24 June 2026).
- Agência Nacional de Águas e Saneamento Básico (ANA). Conjuntura dos Recursos Hídricos no Brasil: Informe Anual 2024; ANA: Brasília, Brazil, 2024.
- Agência Nacional de Energia Elétrica (ANEEL). SIGA—Sistema de Informações de Geração da ANEEL; Portal de Dados Abertos da ANEEL: Brasília, Brazil, 2026. Available online: https://dadosabertos.aneel.gov.br/dataset/siga-sistema-de-informacoes-de-geracao-da-aneel (accessed on 24 June 2026).
- Empresa de Pesquisa Energética (EPE). Matriz Energética e Elétrica; ABCDEnergia, Ministério de Minas e Energia: Brasília, Brazil. Available online: https://www.epe.gov.br/pt/abcdenergia/matriz-energetica-e-eletrica (accessed on 24 June 2026).
- Operador Nacional do Sistema Elétrico (ONS). ONS Implementa Nova Rotina que Permite Revisão de Dados da Geração Eólica e Solar; ONS: Rio de Janeiro, Brazil, 2025; Available online: https://www.ons.org.br/Paginas/Noticias/details.aspx?i=11538 (accessed on 24 June 2026).
- La Rovere, E.L.; Mendes, F.E. Tucuruí Hydropower Complex, Brazil: A WCD Case Study; World Commission on Dams Secretariat: Cape Town, South Africa, 2000; Available online: https://www.riverresourcehub.org/wp-content/uploads/files/attached-files/csbrmain.pdf (accessed on 24 June 2026).
- Comitê Brasileiro de Grandes Barragens (CBDB). Main Brazilian Dams: Design, Construction and Performance, 1st ed.; CBDB: Rio de Janeiro, Brazil, 1982; Volume 1. [Google Scholar]
- Agência CanalEnergia. UHE Balbina Inicia Abertura do Vertedouro; CanalEnergia: Rio de Janeiro, Brazil, 2023; Available online: https://www.canalenergia.com.br/noticias/53239505/uhe-balbina-inicia-abertura-do-vertedouro (accessed on 24 June 2026).
- Andriolo, M.V.; Araújo, A.N.; Fontanelli, C.; Paranhos, C.S.A.; Politano, M.; Dettmer, P.H.C. Installation of Deflector in Colíder Dam to Minimize the Percentage of Total Dissolved Gases. RBRH 2023, 28, e25. [Google Scholar] [CrossRef] [Scilit]
- Yamakawa, F.H.S.; Ribas-Terabe, F.; Ota, J.J.; Girardi, G.M. Avaliação da Erosão a Jusante da Bacia de Dissipação por Ressalto Hidráulico em Modelo Reduzido. In Anais do XX Simpósio Brasileiro de Recursos Hídricos; ABRHidro: Bento Gonçalves, Brazil, 2013; pp. 1–7. [Google Scholar]
- Andriolo, M.V.; de Oliveira, E. Proteção Contra Erosão Regressiva em Rocha Branda na Saída da Bacia de Dissipação—O Exemplo da UHE Colíder. In XXX Seminário Nacional de Grandes Barragens; CBDB: Foz do Iguaçu, Brazil, 2015; pp. 1–18. [Google Scholar]
- Trevisan, L.A. Plano de Ação de Emergência (PAE) Barragem da UHE São Manoel; UHE: São Manoel, Brazil, 2022. [Google Scholar]
- Fill, G.C.; Ota, J.J.; Fabiani, A.L.T. Modelagem Hidrodinâmica 3D de Escoamentos em Vertedouros. In XXI Simpósio Brasileiro de Recursos Hídricos; ABRHidro: Brasília, Brazil, 2015. [Google Scholar]
- de Souza, D.F.; Bermann, C.; Fonseca, C.R.; Soares da Silva, E.A. UHE Teles Pires: Um Estudo de Caso de Geração Hidroelétrica na Amazônia; Barra das Garças, Brazil, 2016. [Google Scholar]
- Eletrobras Furnas. Usina de Serra da Mesa. Available online: https://www.furnas.com.br/subsecao/129/usina-de-serra-da-mesa (accessed on 24 June 2026).
- ENGIE Brasil Energia S.A. Usina Hidrelétrica Cana Brava; Relatório Anual; ENGIE: Goiânia, Brazil, 2018; Available online: https://www.engie.com.br (accessed on 24 June 2026).
- ENGIE Brasil Energia. Usina Hidrelétrica Cana Brava. Available online: https://www.engie.com.br/usinas/usina-hidreletrica-cana-brava/ (accessed on 24 June 2026).
- Dettmer, P.H.C. Estudo da Capacidade de Descarga de Vertedouros de Baixa Queda com Elevado Grau de Submergência. Master’s Thesis, Universidade Federal do Paraná, Curitiba, Brazil, 2013. [Google Scholar]
- de Castro, G. Plano de Ação de Emergência—PAE, Barragem da UHE Peixe Angical; Enerpeixe S.A.: Tocantins, Brazil, 2017. [Google Scholar]
- Eletrobras Furnas. Usina de Peixe Angical. Available online: https://www.furnas.com.br/subsecao/127/usina-de-peixe-angical (accessed on 24 June 2026).
- EDP Brasil/Investco S.A. UHE Lajeado. Available online: https://www.investco.com.br/pt-br (accessed on 24 June 2026).
- Themag Engenharia. Usina Hidrelétrica Lajeado—Estudo de Impacto Ambiental (EIA); Themag: São Paulo, Brazil, 1996. [Google Scholar]
- Consórcio Estreito Energia. Usina de Estreito—Informações Técnicas. Available online: https://uhe-estreito.com.br/o-empreendimento/informacoes-tecnicas.html (accessed on 24 June 2026).
- Eletrobras. Plano de Ação de Emergência UHE Santo Antônio; Eletrobras: Porto Velho, Brazil, 2025. [Google Scholar]
- Eletrobras. Usinas Hidrelétricas. Available online: https://eletrobras.com/pt/Paginas/Usinas.aspx (accessed on 24 June 2026).
- Norte Energia S.A. Usina Hidrelétrica de Belo Monte. Available online: https://www.norteenergiasa.com.br/ (accessed on 24 June 2026).
- Santos Sobrinho, L.T.; Todan, H.L.; Ramos, R.A.; de Lara, P.G. Plano de Segurança de Barragem—Plano de Ação de Emergência: UHE Santo Antônio do Jari; Companhia Energética do Jari—CEJA S.A.: Laranjal do Jari, Brazil, 2022. [Google Scholar]
- Fractal Engenharia e Sistemas. Plano de Ação de Emergência—UHE Santo Antônio do Jari, Rev. 1; Document 983-JAR-RT-PAE-0001-1; Fractal Engenharia e Sistemas: Laranjal do Jari, Brazil, 2024. [Google Scholar]
- Companhia Energética Sinop. UHE Sinop—PBA Projeto Básico Ambiental; Companhia Energética Sinop: Sinop, Brazil, 2013. [Google Scholar]
- Ribeiro, D.S. Impactos da Operação Intermitente de UHEs na Mortandade de Peixes Devido à Supersaturação Gasosa. Ph.D. Thesis, Federal University of Itajubá, Itajubá, Brazil, 2026. [Google Scholar]
- Operador Nacional do Sistema Elétrico (ONS). Carga e Geração. Available online: https://www.ons.org.br/paginas/energia-agora/carga-e-geracao (accessed on 15 July 2025).
- da Silva, W.M.F.; Bastos, A.S.; de F. Viana, E.M.; Martinez, C.B. The Impact of Residual Flow on Energy Generation in Hydroelectric Power Plants. REM Int. Eng. J. 2024, 77, 39–48. [Google Scholar] [CrossRef] [Scilit]
- Faerman, H. UHE Sinop é Multada em R$ 50 Milhões por Poluição e Morte de Peixes; Agência CanalEnergia: Rio de Janeiro, Brazil, 2019; (In Portuguese). Available online: https://www.canalenergia.com.br/noticias/53090355 (accessed on 24 June 2026).
- Ministério de Minas e Energia. Portaria nº 112, de 19 de Março de 2014; MME: Brasília, Brazil, 2014.
- Centro de Pesquisas de Energia Elétrica (CEPEL). Revisão Ordinária de Garantia Física de Energia das Usinas Hidrelétricas (UHEs); CEPEL: Brasília, Brazil, 2016. [Google Scholar]
- Ernesto, P.; Gouveia, B.G.; Pereira, J.M. Plano de Ação de Emergência UHE Salto Apiacás—RN1064-23 ANEEL; Enel Green Power: Rio de Janeiro, Brazil, 2023. [Google Scholar]
- Ministério de Minas e Energia. Portaria nº 600/GM/MME, de 10 de Janeiro de 2022; MME: Brasília, Brazil, 2022.
- Agência Nacional de Energia Elétrica (ANEEL). Despacho nº 3.854, de 19 de Dezembro de 2024; ANEEL: Brasília, Brazil, 2024. Available online: https://biblioteca.aneel.gov.br (accessed on 6 January 2026).
- UHE Juruena Ltd.a. Plano de Ação de Emergência—UHE Juruena; Document JUR-PAE-001, Rev. 01; UHE Juruena Ltd.a.: Campos de Júlio, Brazil, 2024. [Google Scholar]
- dos Santos, C.Z. Plano de Segurança da Barragem: UHE Juruena; UHE Juruena Ltda.: Campos de Júlio, Brazil, 2024. [Google Scholar]
- Agência Nacional de Energia Elétrica (ANEEL). Nota Técnica nº 436/2023-SCE/ANEEL; ANEEL: Brasília, Brazil, 2023.
- Neoenergia. UHE Dardanelos. Available online: https://www.neoenergia.com/ri/port/negocios/geracao/distribuicao/dardanelos (accessed on 6 January 2026).
- Energética Águas da Pedra S.A. UHE Dardanelos—Plano de Ação de Emergência Externo (PAE), Seção III, Rev. 04; Document DARM-PI-CE-BR-C10-00003; Energética Águas da Pedra S.A.: Aripuanã, Brazil, 2024. [Google Scholar]
- Costa, L.; Almeida, C.; Becker, P. PCH Rondon—Plano de Ação de Emergências; Prosenge Projetos e Engenharia Ltda.: Florianópolis, Brazil, 2024. [Google Scholar]
- Ministério de Minas e Energia. Usina Hidrelétrica Samuel—Memória Técnica, 1st ed.; MME: Brasília, Brazil, 1996; Volume 1.
- Global Energy Monitor. Guaporé Hydroelectric Plant. Global Hydropower Tracker, GEM Wiki, 2026. Available online: https://www.gem.wiki/Guapor%C3%A9_hydroelectric_plant (accessed on 24 June 2026).
- Fickeisen, D.H.; Schneider, M.J. (Eds.) Gas Bubble Disease: Proceedings of a Workshop Held at Richland, Washington, October 8–9, 1974; CONF-741033; Technical Information Center, ERDA: Oak Ridge, TN, USA, 1976.
- Wang, C.; Wang, J.; Feng, J.; Wang, H.; Li, R.; Wang, Y.; Li, K. Predicting the Transport Time of Supersaturated Total Dissolved Gas in a Large Deep Reservoir. Water Resour. Res. 2025, 61, e2024WR038631. [Google Scholar] [CrossRef] [Scilit]
- Li, P.; Zhu, D.Z.; Crossman, J.A.; Cheng, X. Spillway Deflector Designs for Mitigating Supersaturated Total Dissolved Gases. J. Clean. Prod. 2023, 426, 139027. [Google Scholar] [CrossRef] [Scilit]
- Feng, J.; Wang, L.; Li, R.; Li, K.; Pu, X.; Li, Y. Operational Regulation of a Hydropower Cascade Based on the Mitigation of Total Dissolved Gas Supersaturation. Ecol. Indic. 2018, 92, 124–132. [Google Scholar] [CrossRef] [Scilit]
- Washington State Department of Ecology. Lower Columbia River Total Maximum Daily Load for Total Dissolved Gas and Water Quality Management Plan; Publication No. 02-03-004; WA Dept. of Ecology: Olympia, WA, USA, 2002. Available online: https://apps.ecology.wa.gov/publications/documents/0203004.pdf (accessed on 6 July 2026).
- Ohara, W.M.; Lima, F.C.T.; Salvador, G.N.; Andrade, M.C. Peixes do Rio Teles Pires: Diversidade e Guia de Identificação, 1st ed.; Gráfica e Editora Amazonas: Aparecida de Goiânia, Brazil, 2017; Volume 1. [Google Scholar]
- Farooque, A.A.; Khosravi, K. Modeling Total Dissolved Gas Supersaturation in High Dam Reservoir Using Advanced Novel Bidirectional Best-First Disjoint Aggregating M5-Rule-Based Algorithms. J. Hydrol. 2024, 641, 131795. [Google Scholar] [CrossRef] [Scilit]

Disclaimer/Publisher’s Note: The statements, opinions and data contained in all publications are solely those of the individual author(s) and contributor(s) and not of MDPI and/or the editor(s). MDPI and/or the editor(s) disclaim responsibility for any injury to people or property resulting from any ideas, methods, instructions or products referred to in the content. |
© 2026 by the authors. Licensee MDPI, Basel, Switzerland. This article is an open access article distributed under the terms and conditions of the Creative Commons Attribution (CC BY) license.