


Abstract
Photovoltaic parks support climate change mitigation by generating low-emission electricity. However, their environmental impacts strongly depend on site features and proximity to environmentally sensitive areas. The aim of the present paper is to develop and apply an innovative methodological framework that integrates an environment-based Rapid Impact Assessment Matrix with selected indicators. Six environmental components are linked to ten measurable indicators. Each indicator is documented through an inventory sheet and evaluated using adapted RIAM criteria. The proposed methodology is applied to the existing photovoltaic farm installations located in the Regional Unit of Messinia, Greece. The results show that most indicators produced positive Environmental Scores across the examined installations. The negative impacts are mainly associated with the proximity of the projects to wildlife refuges. The largest variations were associated with distance from wildlife refuges and forested areas, with standard deviations of 67.9 and 58.4, respectively. PV7 received major negative Environmental Scores of −96 and −72 because it is located within a wildlife refuge and forested land, while PV8 received a score of −72 due to its overlap with sclerophyllous vegetation. On the other hand, the positive impacts are mainly reflected in CO2 reduction across all photovoltaic parks in the study area. These findings confirm that appropriate site selection of photovoltaic parks is a decisive factor in either reducing or eliminating environmental impacts. The proposed methodology can be applied to any photovoltaic farm and study area, enabling quantification of environmental impacts and facilitating comparative assessment of these projects.
1. Introduction
1.1. Motivation and Background
Solar energy is considered a clean form of energy because it produces no carbon dioxide emissions during electricity generation. Photovoltaic (PV) parks are a technology for harvesting solar radiation and converting it into electrical energy. The maintenance requirements of photovoltaic systems are relatively low compared with other renewable energy sources, and they can provide services over an extended operational lifetime. Depending on the scale and size of photovoltaic parks, their energy production capacity increases accordingly. Globally, the total installed photovoltaic capacity amounts to 627 GW, and by the end of 2019 Greece had developed sufficient capacity to cover approximately 5% of its electricity demand [1].
However, despite their significant benefits, photovoltaic parks remain technical infrastructure projects that affect both the natural and the anthropogenic environment. Their installation may lead to changes in land use, landscape characteristics, and biodiversity, and in many cases may generate strong social reactions if sited inappropriately. These reactions do not necessarily stem from opposition to the concept of renewable energy itself, but rather from the way in which such projects are implemented, their spatial impacts, and the absence of public consultation or compensatory benefits [2,3]. For this reason, the assessment of the environmental impacts of such projects is particularly important, as it enables the early identification of potential adverse effects and the adoption of appropriate measures for prevention, mitigation, and restoration. A project-specific environmental impact assessment is required to evaluate the positive climate benefits and potential local environmental pressures related to the project’s siting and operation.
1.2. Literature Review and Research Gap
The methodologies and tools used for environmental impact assessment may range from relatively simple to highly complex approaches. In all cases, their purpose is to facilitate the organization of large volumes of heterogeneous data, the concise presentation of information, the aggregation of data into smaller units with the minimum possible loss of information, and the appropriate representation of both primary data and the information derived from them [4].
Methods used for the identification and determination of environmental impacts include:
- (a)
- Checklists, which focus on environmental characteristics and factors requiring consideration [5,6];
- (b)
- Impact matrices, which consist of tables where one axis presents the environmental characteristics or components, while the other axis presents the activities associated with the project or intervention [7,8,9];
- (c)
- The Rapid Impact Assessment Matrix (RIAM), which represents a contemporary development of the impact matrix approach [10,11,12,13,14];
- (d)
- Overlay maps, which provide a straightforward spatial representation of impacts [15,16,17];
- (e)
- Networks, which examine cause–effect relationships and analyze the different areas that may potentially be affected by a specific project or activity [18,19,20];
- (f)
- The Battelle Environmental Evaluation System, in which environmental impacts are classified into four categories: ecology, pollution, esthetics and human interest [21,22,23];
- (g)
- Expert judgment, which is usually employed as a complementary assessment tool [24,25];
- (h)
- Mathematical or statistical models [26,27,28];
- (i)
- Indicators [29,30].
Among the above methodologies, the Rapid Impact Assessment Matrix (RIAM) and environmental indicators are of particular interest. The RIAM is a systematic, semi-quantitative approach for identifying and assessing the environmental impacts of a project. It categorizes impacts based on relevant environmental components and evaluates each using two groups of criteria. Group A assesses the importance of the affected condition and the magnitude of change, while Group B evaluates the impact’s permanence, reversibility, and cumulative nature. These scores are combined mathematically to compute an Environmental Score, which is then converted into a predefined range indicating whether the impact is positive or negative and its relative significance.
Arani et al. [10] conducted a study aiming to identify, determine and predict the impacts of the Sepid-Farab Kavir steel development project in the city of Aran va Bidgol, located in the northern part of Isfahan Province, Iran. The components examined included physicochemical, biological, economic, social and cultural parameters, as well as pollutants emitted into the local atmosphere from hot rolling processes. Subsequently, the impacts were assessed during both the construction and operational phases of the project. The collected data were analyzed using the Leopold matrix and the RIAM method [10].
Taheri et al. [11] applied the RIAM method to assess the environmental impacts of different municipal solid waste disposal options in Tabriz, north-western Iran, a city facing high daily waste generation. The alternatives examined included open dumping, sanitary landfilling, recycling and composting. The assessment considered 9 physicochemical components, 5 biological–ecological components, 9 sociocultural components and 10 economic–operational components.
The positive and negative impacts of constructing and operating the Goliran coal mine in northern Iran were identified through a checklist in [12]. The authors then entered this information into the RIAM for analysis. The EIA considered environmental factors based on 17 site activities, including 9 physical/chemical (PC), 8 biological/ecological (BE), 10 sociological/cultural, and 3 economic/operational (EO) components. The findings show that the most negatively impacted components are the physical/chemical ones—such as air pollution, dust, and surface and groundwater pollution—scoring -D due to tunnel excavation and the construction of the coal transport rail line. Following this, the biological/ecological components (such as animal migration, populations, and habitats) received a −C score because of construction and coal transportation activities.
Abbasi et al. [13] applied an innovative RIAM approach to assess environmental impacts under disaster conditions, especially COVID-19’s effects in Iran. Their study examined environmental indicators such as CO2 emissions, other harmful gases, and noise pollution. The findings showed ecological restoration through reduced pressure on tourism destinations, protection of plant and animal species, and reduced density in populated areas. Conversely, the study noted increased medical waste, protective gear disposal, and infectious waste management in the environment. Overall, the adverse environmental effects associated with the project during the COVID-19 pandemic have lessened and improved.
Similarly, various case studies have used indicators to assess environmental impacts. Wu et al. [29] used the Driving-Pressure–Status–Impact-Response (DPSIR) framework to develop an indicator system to assess the ecological and environmental impacts of desert photovoltaic development. Their study examines effects across three sites: the on-site (WPS), transitional zone (TPS), and off-site (OPS) areas of Qinghai Gonghe Photovoltaic Park in China. The results show that the first site (WPS) has better ecological and environmental conditions compared to the second (TPS) and third (OPS). The ecological and environmental evaluation score for the WPS was categorized as “general” (0.439), whereas the scores for the TPS (0.286) and OPS (0.28) were judged as “poor”, highlighting considerable potential for improvement.
In the study conducted by [30], the development of a domestic and international airport in Sydney was proposed. Within the environmental impact assessment (EIA), a number of alternative options were examined to increase airport capacity and respond to anticipated growth in passenger demand. These alternatives included different locations, as well as expanding the capacity of the existing airport. For each alternative, potential impacts were examined in relation to metropolitan, regional, and local planning; existing and future land uses; noise; and, more broadly, the physical, biological, social, and economic effects that could result from implementing the project [30]. The EIA used a mixed methodological approach, combining static input–output analysis with conventional environmental impact assessment. Input–output analysis was applied to economic and environmental indicators and provided the total indicator intensities associated with the examined alternatives.
RIAM applications typically evaluate broadly defined environmental factors and often rely on qualitative descriptions, which can limit transparency, reproducibility, and cross-project comparison. Notably, the specific measurable variables and threshold values used for each score are frequently not clearly documented. However, the advantage of the RIAM method is that it considers impact characteristics such as importance, magnitude, permanence, reversibility, and cumulative effects.
On the other hand, although indicators do not represent impact characteristics, they link environmental conditions to measurable or observable variables. Previous photovoltaic studies have used indicators related to land cover, biodiversity, soil, climate, water, emissions, technical performance, and socioeconomic conditions. However, many indicator-based studies aggregate these variables into a single index or ranking, which may conceal severe negative impacts in individual environmental dimensions.
Therefore, a gap persists between the RIAM, which offers a structured classification of impact significance, and indicator-based assessment, which enhances measurability and traceability. To the authors’ knowledge, no study has explicitly combined indicator-based assessment with the RIAM scoring system to assess and compare the environmental performance of operational photovoltaic parks.
Table 1 outlines the key features of existing RIAM- and indicator-based approaches, emphasizing the advantages and contributions of the proposed methodology compared to previous studies.
Table 1.
Comparison of existing RIAM-based and indicator-based approaches with the proposed integrated methodology.
1.3. Objective, Contributions and Structure of the Paper
In this study, we developed an innovative methodology that combines an environment-based Rapid Impact Assessment Matrix (RIAM) with indicators to assess the environmental impacts of photovoltaic parks in the Regional Unit of Messinia, Greece.
This study makes two main contributions: (i) creating a comprehensive set of environmental components and measurable indicators, and (ii) tailoring the RIAM assessment scales to suit indicator-specific quantitative and qualitative thresholds. Additionally, the paper presents an inventory sheet for each indicator, outlining its conceptual and operational definitions, measurement units, assessment frequency, relevant life-cycle phase, and data sources. Overall, this framework enables comparative analysis of environmental factors that differentiate photovoltaic parks.
2. Environmental Impacts of Photovoltaic Parks
Like any industrial product, manufacturing solar cells and panels may affect health and the environment, and proper waste management and minimization at production facilities are essential. Chen et al. [31] support the idea that the environmental impacts of photovoltaic parks vary by site and cannot be based only on their renewable energy advantages. However, once installed in the field, photovoltaic systems are generally environmentally safe because they do not produce noise or emit toxic gases or greenhouse gases. During operation, inverter cooling fans, transformer stations, electrical substations, tracking-system motors, and maintenance vehicles may produce localized noise.
Zhang et al. [32] note that although photovoltaic (PV) technology markedly decreases pollutant and greenhouse gas emissions, it also has environmental impacts, including biodiversity loss and habitat degradation, climate impacts, resource consumption, and challenges associated with PV module disposal. As also noted in [33], some of the most significant environmental impacts of PV solar power plants are related to land use, hazardous materials, greenhouse gas emissions (GHG), water use, visual impact, air pollution, and temporary or localized noise associated mainly with construction activities and accompanying operational equipment. As highlighted by Luo et al. [34], with the large-scale deployment of photovoltaic resources, international researchers have begun examining how photovoltaic power plant operations affect local, regional, and global ecological and environmental conditions to better understand their ecological and climate effects.
Construction activities disrupt the land and may cause damage to the soil. As highlighted by [35], applying a PV system on once-cultivable land can damage productive soil areas. Lambert et al. [36] observed that construction machinery reduces soil physical quality by increasing bulk density [37]. Alongside vegetation destruction, this reduction in physical soil quality can lead to soil sealing, thereby decreasing soil moisture, a vital component of soil functionality [38]. In addition, ref. [39] reported that maintaining and cleaning photovoltaic panels pose significant challenges and harm soil.
Converting agricultural or natural land for energy use often involves clearing natural vegetation, leveling the ground, and removing existing habitats, which reduces the landscape’s ecological value. Disrupting ecological continuity reduces landscape connectivity, restricts species movement pathways, and can degrade biodiversity, especially in semi-natural mosaics of agricultural and natural areas [40]. The disturbance is more intense during construction, but some impacts (e.g., permanent infrastructure, roads) remain during operation. For this reason, installing photovoltaic systems near areas with special protection status, such as protected areas and wildlife refuges, must be undertaken with caution.
Another important factor influencing environmental impacts is terrain slope. Variations in topography can reduce the usable land area and cause shading on solar panels, leading to decreased energy output and increased costs [41].
Furthermore, solar radiation absorption and heat accumulation can create microclimatic changes [42]. Large-scale arrays of panels have been recorded to locally increase surface temperature (the “photovoltaic heat island’ phenomenon), which can affect plant physiology and soil micro-organisms, especially in arid and thermally dry environments [42].
Solar panels alter the microclimate, reducing light availability, lowering daytime temperatures, and decreasing soil moisture after rainfall, whereas nighttime temperatures and moisture levels may be higher during dry periods [37,43]. Furthermore, in high-humidity areas, photovoltaic installations are negatively affected because water molecules absorb solar radiation.
Water use refers to the volume and quality of water consumed or discharged by a photovoltaic (PV) power plant, which can influence the availability and sustainability of regional water resources [44]. While photovoltaic solar cells do not require water to produce electricity, water may be needed for cleaning and maintenance. The impact on water use depends primarily on the specific PV technology employed and the installation’s geographical location. However, as noted by [45], photovoltaics has the lowest water footprint among renewable technologies.
For several PV projects, visual impacts often do not concern installers, but they depend on the installation area, with larger PV projects expected to have a more noticeable negative effect [33]. However, one notable case with visual impact is PV installations near highways, where reflected sunlight disturbed drivers [46].
One of the primary benefits of using solar energy is reduced carbon dioxide emissions [33]. However, installing solar power plants in forests requires careful planning, as trees must be cut down to less than 1 m tall or removed entirely to prevent shading of the panels [47,48]. This process reduces total CO2 emissions.
3. Study Area and Methodology
3.1. Study Area
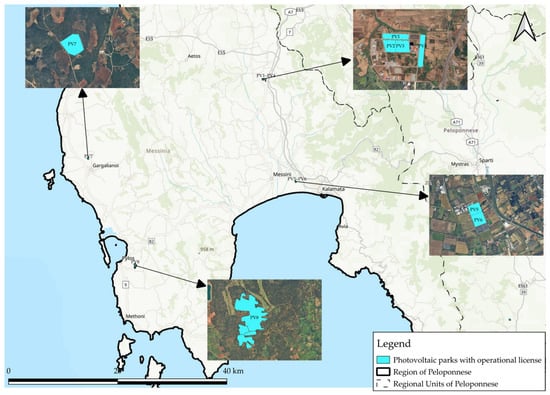
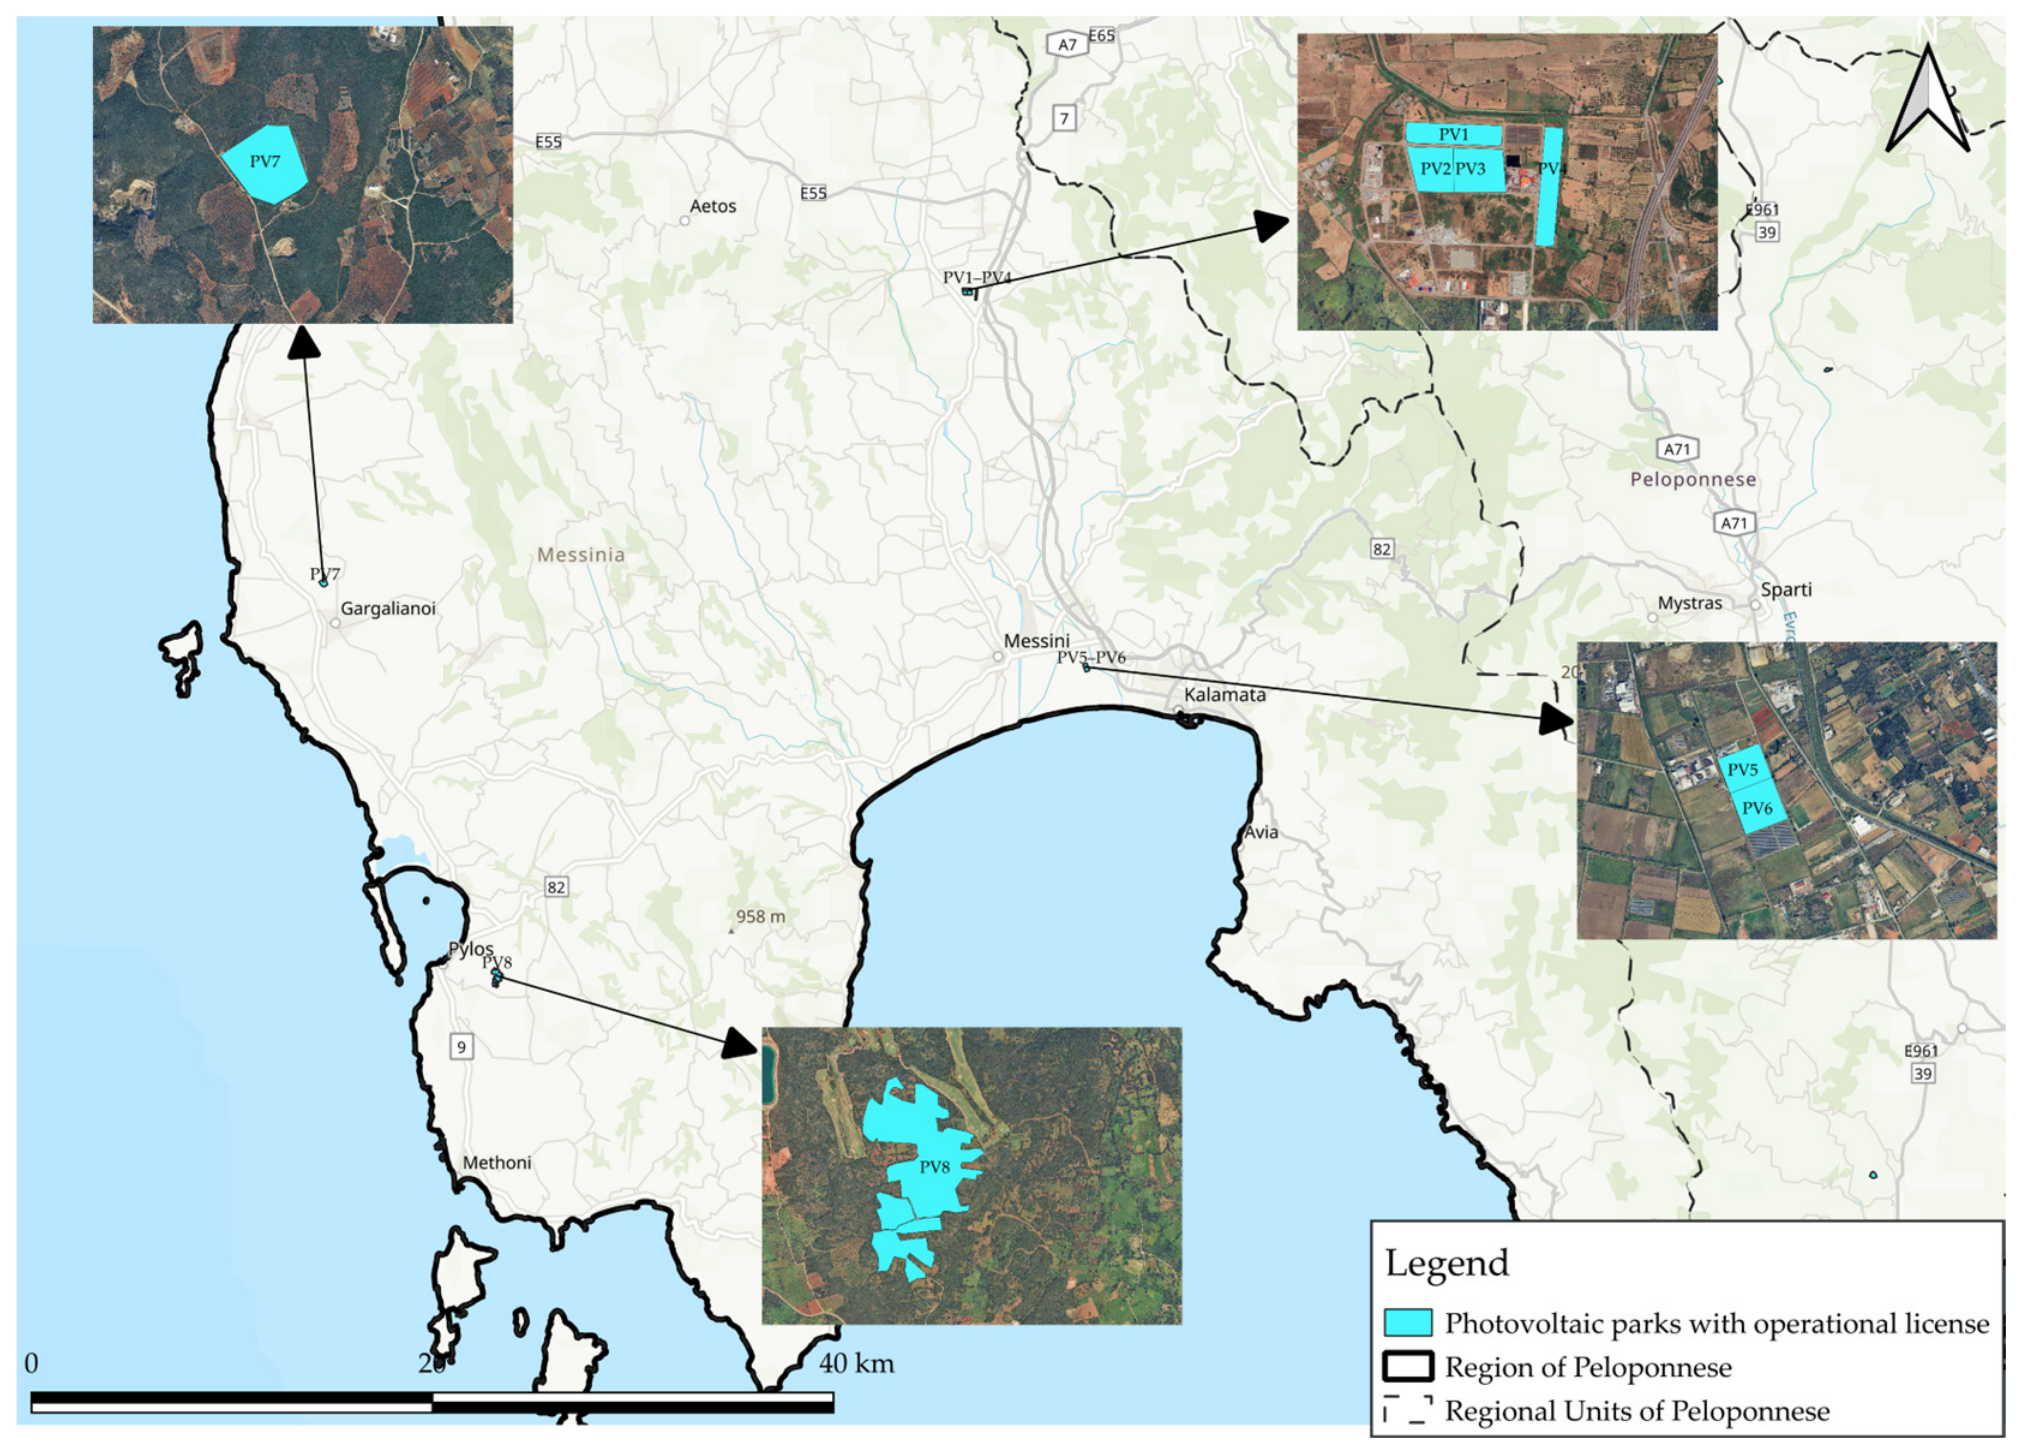
The Regional Unit of Messinia was selected as the study area. The Regional Unit of Messinia is located in the southwestern part of the Peloponnese Region and covers a total area of 2.991 km2. Within this specific Regional Unit, eight operating PV parks have been identified, according to the Regulatory Authority for Waste, Energy and Water (RAAEY) [49]. The PV installations are located in four areas across the Regional Unit. The map below presents the locations of the PV park installations. In Figure 1, four PV parks are identified near the settlement of Meligala in the Municipality of Oichalia (PV1-PV4), two photovoltaic parks outside Asprochoma in the Municipality of Kalamata (PV5 and PV6), one photovoltaic park at the KAZ Skotomenos-Petralexis in the Municipality of Trifylia (PV7), and one photovoltaic park in the Municipality of Pylos-Nestor (PV8). Regarding the power and the issuance date of the operating license (MW/year of operation), the following apply to the examined PVs: PV1: 2.168 MW/2009; PV2: 1.999 MW/2008; PV3: 1.999 MW/2008; PV4: 1.971 MW/2009; PV5: 1.575 MW/2010; PV6: 2.131 MW/2010; PV7: 4.9 MW/2009; PV8: 11.963 MW/2010.
Figure 1.
The study area and the examined PV parks.
3.2. Methodological Framework
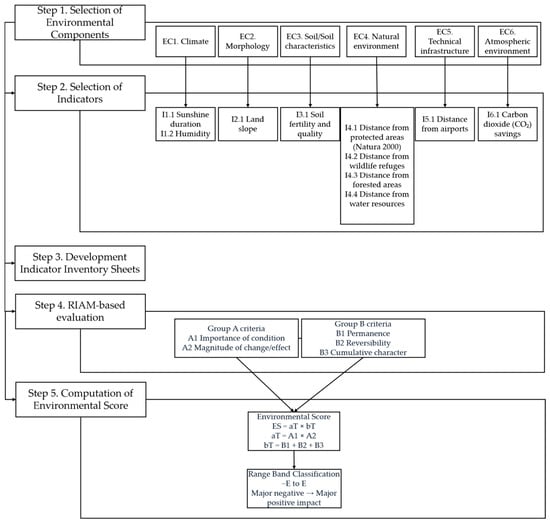
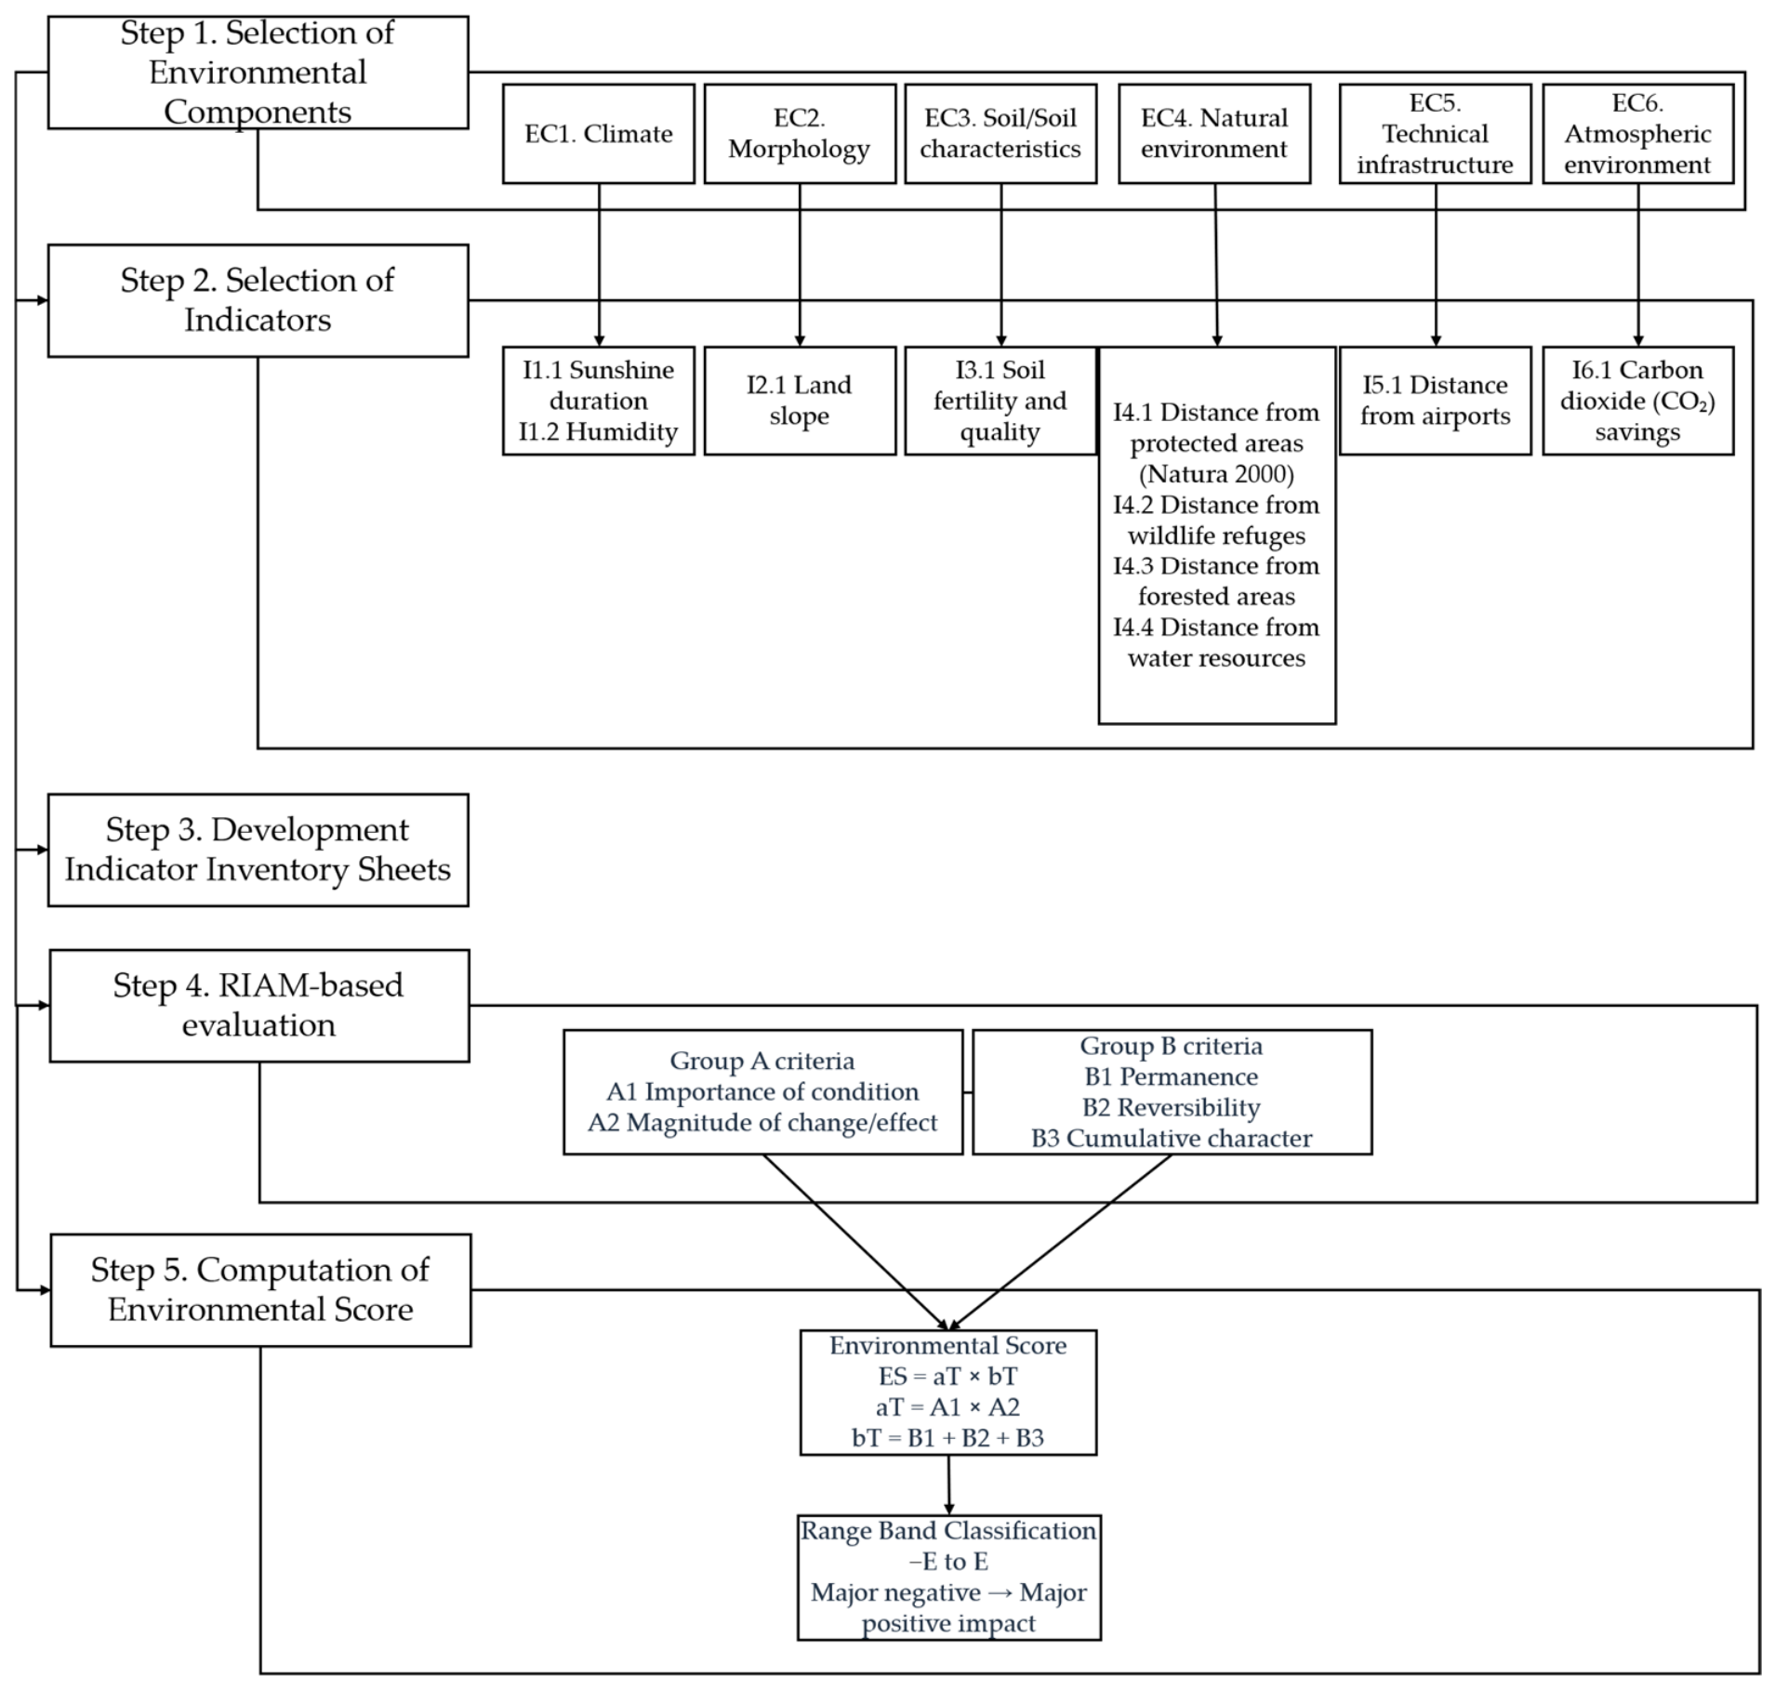
The methodological framework (Figure 2) consists of five steps, described below.
Figure 2.
Methodological framework for the environmental impact assessment of photovoltaic parks.
Step 1: Selection of Environmental Components
The first step in the methodological approach is to select the environmental components (EC) affected by the deployment of photovoltaic (PV) parks. We based this selection on findings from the international literature on environmental impacts, as discussed above in the section on environmental effects. The selected components include climate, morphology, soil and soil characteristics, the natural environment, technical infrastructure, and the atmospheric environment.
Step 2: Selection of Indicators for Each Environmental Component
Subsequently, appropriate indicators were selected for each environmental component to assess the respective impacts. Table 2 presents the indicators developed for each environmental component.
Table 2.
Environmental components and indicators.
For optimal PV system performance, adequate solar radiation is required. Therefore, sunshine duration and humidity were examined as climate-related indicators, as both factors play a decisive role in the efficiency of photovoltaic installations. Regarding morphology, land slope was examined, as installing a PV park on steep terrain often requires excavation, which can alter the area’s morphology.
Regarding soil and its characteristics, soil fertility and quality were examined following the installation of a PV park. For the natural environment, we used data on distance to protected areas, including Natura 2000 sites, wildlife refuges, and forested areas, as such installations may disturb local biodiversity. In addition, data on the distance to water resources were incorporated, as these resources may be affected by PV park operations. Moreover, humidity associated with proximity to water bodies may negatively influence the maximum performance of photovoltaic systems.
For the technical infrastructure, data on distances from airports were used. The proximity of a PV park to an airport may create operational difficulties during aircraft landings due to glare and reflections from the photovoltaic panels. Finally, for the atmospheric environment, the carbon dioxide (CO2) savings indicator was used, as PV systems reduce atmospheric pollutant emissions.
Step 3: Development of an Indicator Inventory Sheet
The indicator reference framework proposed by [50] served as the basis for developing the indicator inventory sheet used in the present study (Table 3). The indicator inventory sheet facilitates a comprehensive understanding of each indicator by providing definitions, formulas, and measurement units. Initially, the indicator’s name is provided, followed by its association with the corresponding environmental component. For the substantive description of an indicator, it is necessary to include its definition, the mathematical formula used for its calculation, the relevant unit of measurement, and the frequency with which the indicator is applied. Furthermore, it is important to specify the sources from which the data needed to measure the indicator may be obtained. Finally, depending on the indicator’s nature, additional comments or observations may be included to clarify specific issues.
Table 3.
Indicator inventory sheet [50].
Step 4: Evaluation of Environmental Indicators Based on Selected Characteristics
At this stage, the indicators associated with each environmental component analyzed previously are evaluated. The evaluation is based on two groups of assessment criteria. Group A includes assessment criteria critical to the condition under evaluation that can alter the resulting score. These criteria are A1: Importance of condition and A2: Magnitude of change/effect. By contrast, Group B includes assessment criteria relevant to the condition but that, individually, cannot alter the resulting score. These criteria are B1: Permanence, B2: Reversibility, and B3: Cumulative character. Permanence reflects the duration of the impact, differentiating temporary effects from permanent effects. Reversibility measures whether the environmental condition can return to its original condition after the impact influence, either naturally or via mitigation and restoration measures. Cumulative character indicates whether the impact interacts with other impacts and environmental pressures, resulting in additive or synergistic effects.
Step 5: Computation of the Environmental Score of Each Indicator
Subsequently, the Environmental Score is calculated for each indicator. At this step, a table is developed with cells representing the indicators used for each environmental component. For each cell, and in accordance with the RIAM methodology, the Environmental Score (ES) is calculated using the following formula (Equation (1)):
where aT is the result of the multiplication of the scores assigned to Group A criteria (aT = A1 × A2), while bT is the result of the summation of the scores assigned to Group B criteria (bT = B1 + B2 + B3).
ES = aT × bT
For the purpose of comprehending the computations performed in this study, the generalized equation of the RIAM method is given as follows (Equation (2)):
, denote the examined photovoltaic (PV) parks, and the environmental indicators.
At this point, it should be noted that, for each indicator, the description of the assessment scales defined by [51] was adapted accordingly. As an example, Table 4 presents Indicator 4.1, distance from protected areas (Natura 2000).
Table 4.
Assessment Criteria for Indicator 4.1, distance from protected areas (Natura 2000), under Environmental Component 4, Natural Environment.
For each indicator, a numerical score is assigned to criteria A1, A2, B1, B2, and B3 according to the relevant descriptive or quantitative condition. Indicatively, this numerical score for Indicator 4.1 refers to the discrete numerical value selected from the criterion-specific assessment scale.
The distance classes were developed as literature-based justifications for the comparative assessment of the examined photovoltaic parks and should not be considered internationally acceptable thresholds. More specifically, a Greek solar-farm study distinguished between thresholds of siting criteria installations located within a protected area (sensitive), within a 0–500 m buffer (intermediate), and more than 500 m away (possible) [52]. In addition, except for one study that applied a 10,000 m exclusion limit from a specific protected area, the remaining studies in a systematic review of site-selection procedures for PV and CSP technologies [53] applied exclusion limits from protected areas ranging from 0 to 2000 m. Based on this, the present study adopted thresholds of 500, 1000, and 2000 m as comparative spatial-compatibility boundaries.
Both authors assigned RIAM scores using predefined descriptive and numerical scales for each criterion. The scoring considered the environmental impact assessment studies/reports of the photovoltaic installations, relevant spatial and environmental data, and the scientific literature on their environmental impacts. Notably, one author has extensive professional and research experience in environmental impact assessment (e.g., [54,55]) and in siting renewable energy projects (e.g., [56,57]), which helped interpret the evidence and adapt the RIAM criteria to photovoltaic installations’ specific features. To ensure consistency, the authors collaboratively reviewed the evidence, applied uniform scoring rules across all eight photovoltaic parks, and resolved discrepancies through discussion and consensus.
Finally, the Environmental Scores (ESs) were converted into Range Bands based on Table 5 to determine their corresponding classification. The “+” sign denotes a positive impact, the “−” sign denotes a negative impact, and 0 denotes no change or a non-applicable condition. Positive values show beneficial environmental impacts, negative values indicate negative impacts, and zero indicates no change, the status quo, or a non-applicable condition. These intervals assign the calculated Environmental Score to the corresponding Range Band.
Table 5.
Conversion of Environmental Scores into Range Bands [51].
4. Results and Discussion
In the Regional Unit of Messinia, eight photovoltaic parks were identified, to which the proposed methodology was applied. The data sources were derived from: (i) Hellenic National Meteorological Agency [58], (ii) Geospatial Information Portal of the Ministry of Environment and Energy [59], (iii) Natura 2000 Expert Viewer [60], and (iv) Energy Register [61]. Annual CO2 savings were calculated using the indicator’s operational definition, which states that each MW prevents the annual release of approximately 1300 tonnes of CO2 [62]. Indicatively, Table 6 presents the indicator sheet for indicator 2.1, land slope.
Table 6.
Indicator sheet for Indicator 2.1: land slope.
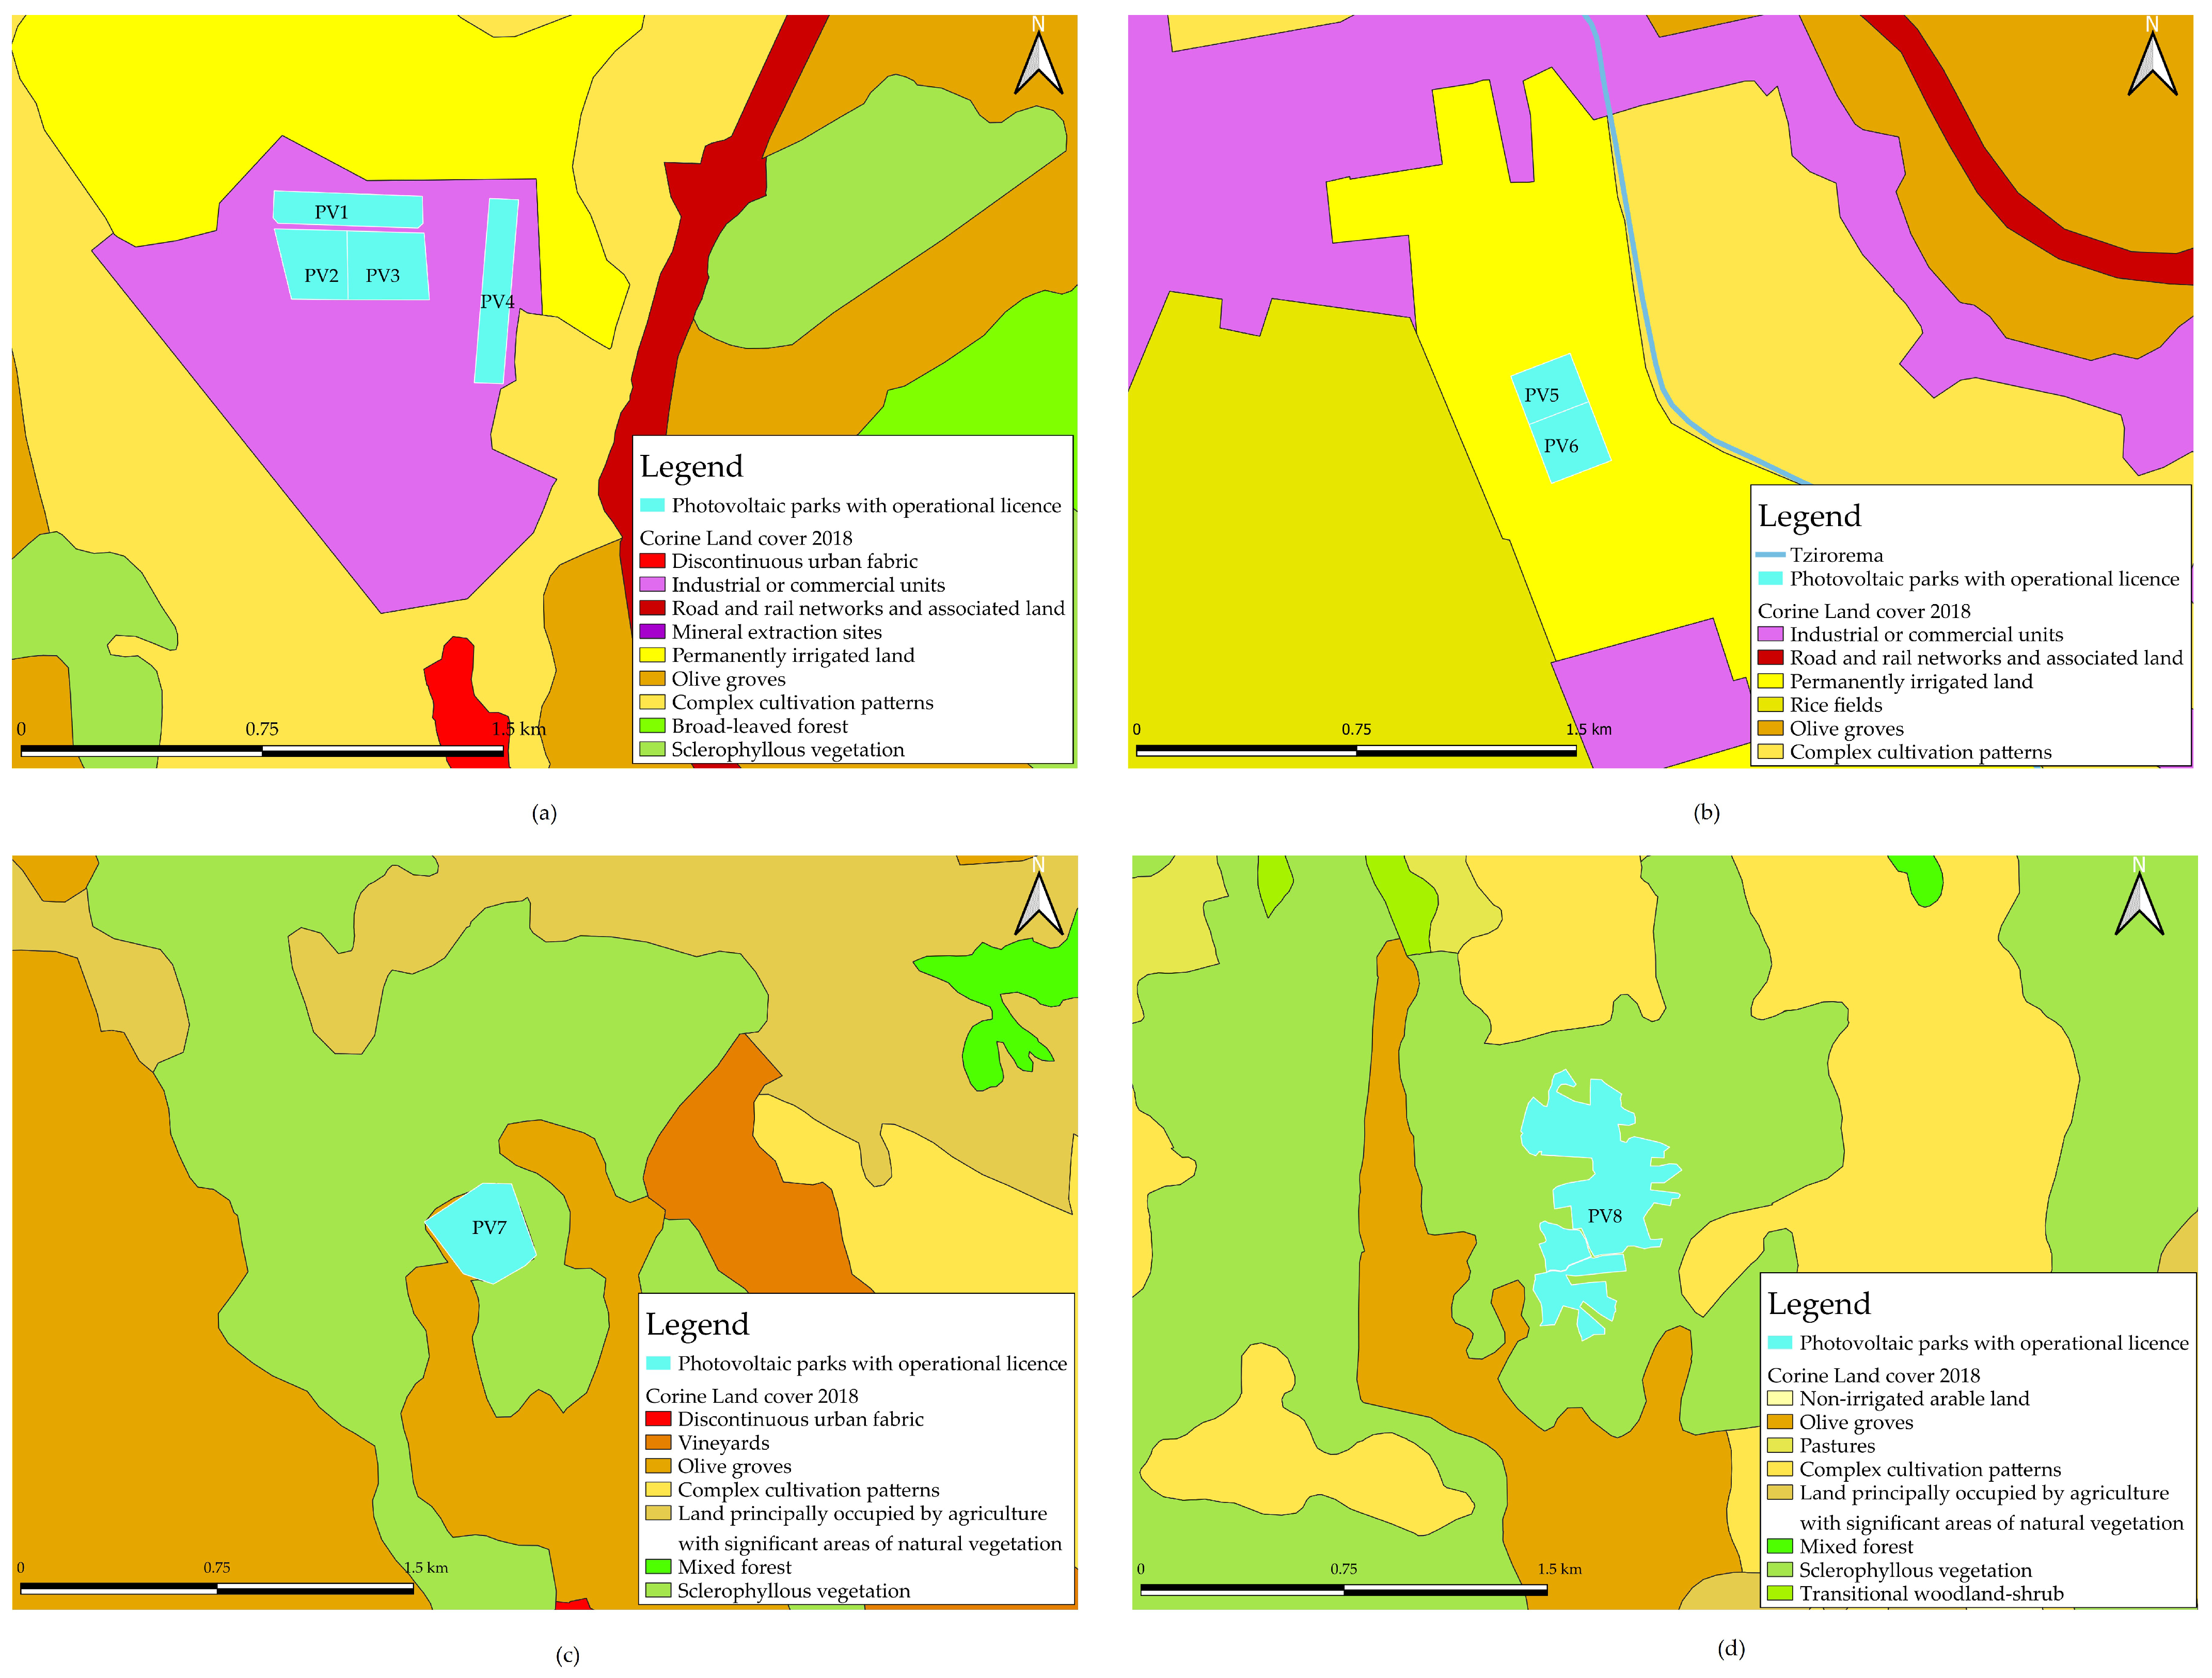
Figure 3.
(a–d) Corine land cover classes and examined PV parks of the study area.
Table 7.
Site characteristics of the examined PV parks.
The examined PV parks are divided into four groups based on their locations within the study area: (i) PV1, PV2, PV3, and PV4 are situated in Meligala, Municipality of Oichalia, on flat inland agricultural land over 9 km from the nearest wildlife refuge and 18 km from Natura 2000 boundaries; (ii) PV5 and PV6 are in Asprochoma, Municipality of Kalamata, closer to the coast, near the Tzirorema stream (277–341 m), and about 2 km from Kalamata international airport, with distances from wildlife refuges and forests exceeding 11 km and 3.5 km respectively; (iii) PV7 is located in Trifylia, within a designated wildlife refuge and forested area; and (iv) PV8 is in Pylos-Nestor, which is land covered with sclerophyllous vegetation, but outside any designated wildlife refuge. The land slope in the PV parks’ installation areas is minimal, ranging from 0% to 6%. Additionally, as per [58], the two meteorological stations in the study region (Methoni and Kalamata) record an average of eight hours of sunshine per month. Average monthly humidity is 73% in Methoni and 69% in Kalamata.
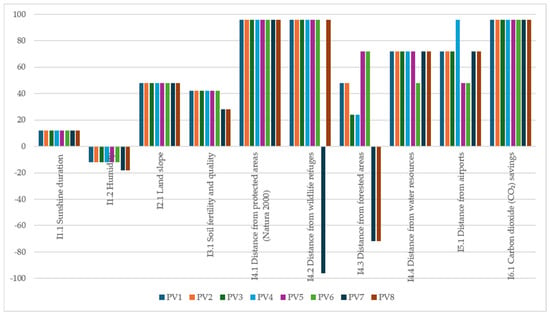
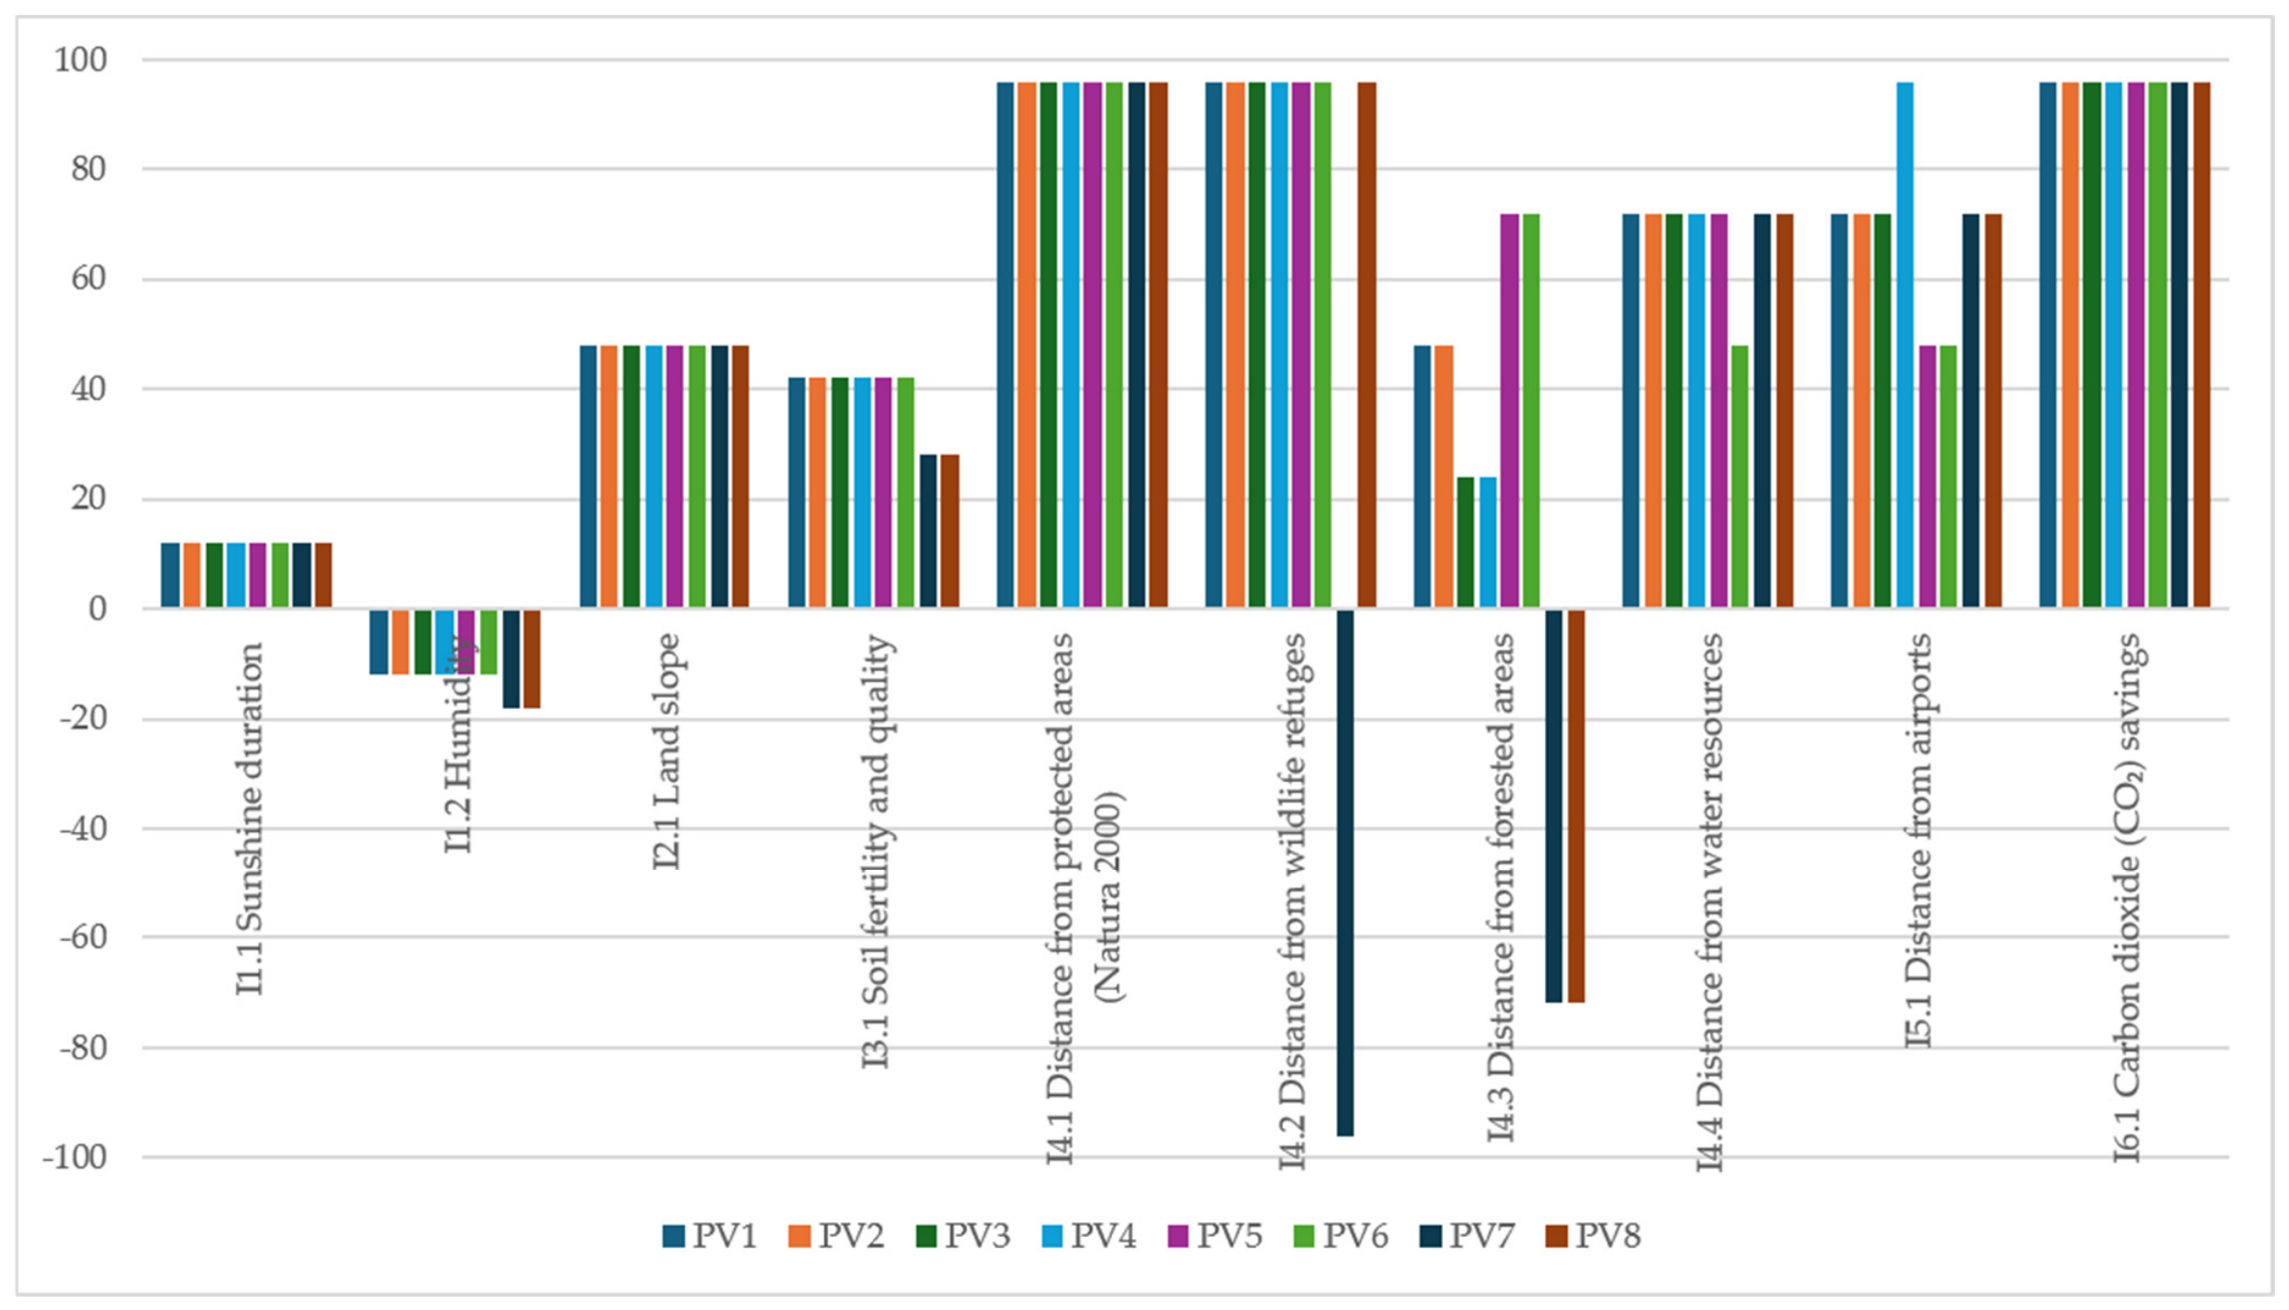
The results of the environment-based RIAM analysis, namely the Environmental Scores (ESs) and Range Bands (RB) for each indicator for the photovoltaic parks in the study area, along with the descriptive statistics of Environmental Scores for each indicator across the eight photovoltaic parks, are presented in Table 8, while Figure 4 presents a comparison of the Environmental Score values of the indicators for the eight photovoltaic parks in the study area. The RIAM tables for each PV park are displayed in Appendix A. Columns A1 and A2 of all Tables in Appendix A represent the Group A criteria: the importance of the environmental condition and the magnitude of the change or effect, respectively. Columns B1, B2, and B3 in all Appendix A tables represent the Group B criteria: permanence, reversibility, and cumulative character. The numerical value assigned to each criterion is selected from the predefined indicator-specific scoring scale. For example, for indicator I3.1, soil fertility and quality, in PV1, the assigned values are A1 = 2, A2 = 3, B1 = 3, B2 = 2, and B3 = 2. Therefore: aT = 2 × 3 = 6; bT = 3 + 2 + 2 = 7; and ES = 6 × 7 = 42. According to Table 5, an Environmental Score of 42 falls within the range +36 to +71, corresponding to Range Band D and indicating a significant positive impact.
Table 8.
Environmental Scores (ESs) of indicators and their descriptive statistics across the eight examined PV parks.
Figure 4.
Environmental Scores of indicators for the examined PVs.
All environmental indicators for the first group, except humidity (I1.2), score positively. The only differentiation within this group is a gradual decrease in distance from forested areas (I4.3), which lowers the forest-distance band from D to C but does not make it negative. For PV7, both distance from wildlife refuges (I4.2) and distance from forested areas (I4.3) consequently score as major negative impacts (−E). For PV8, the distance from forested areas indicator (I4.3) turns negative, while the distance from wildlife refuges indicator (I4.2) remains positive. PV8 also has the largest installed capacity (11.963 MW) and CO2 savings (15,552 t/yr), presenting an installation that combines the strongest climate benefit with a locally negative biodiversity impact.
Six of the ten indicators (I1.1, I2.1, I4.1, I4.4, I5.1, and I6.1) are either constant or vary only slightly across the eight parks and are classified as slightly positive to major-positive change/impacts (bands A to E) at every site. Four indicators (I1.1, I2.1, I4.1, and I6.1) have the same Environmental Score and a zero standard deviation because they either did not vary across the study area on the assessment day or showed identical impacts related to PV deployment. The other six indicators display real variability, with the greatest dispersion observed in I4.2 (SD = 67.9) and I4.3 (SD = 58.4). These results quantitatively confirm that differences among the eight parks are mainly influenced by proximity to wildlife refuges and forests (specifically PV7 and PV8), while other environmental factors remain relatively consistent throughout the study area. Therefore, the driving indicators that differentiate environmental performance among the examined PV parks are distance from wildlife refuges (I4.2) and distance from forested areas (I4.3).
As outlined in the methodology, the selected environmental components were based on the international literature on environmental impacts. Comprehensive reviews of solar farm effects [33,35,40,44] consistently highlight biodiversity, land use/cover changes, soil disturbance, water consumption, and local microclimate as the main environmental concerns for PV deployment, with generally minimal impacts on atmospheric and infrastructure aspects. These findings align with the present study, as the environmental components and indicator set directly address these categories. Moreover, natural/environment indicators, particularly distance from wildlife refuges and forests, explain nearly all the variance among the eight parks, while climate, technical-infrastructure, and atmospheric indicators remain consistently positive. The most significant negative effects relate to the spatial relationship between PV installations and protected natural areas, particularly wildlife refuges and forests. PV7 is located within a wildlife refuge and forested area, while PV8 is situated in sclerophyllous vegetation. Therefore, PV1–PV6 typically show more positive environmental profiles, while PV7 and PV8 face significant local ecological challenges. These results emphasize that the environmental performance and sustainability of PV parks depend on strategic site selection.
The RIAM method has primarily been used for waste management, water, and mining projects, as well as some renewable energy technologies such as geothermal [63]. However, to the authors’ knowledge, it has not been previously applied to photovoltaic installations. This study’s findings support the effectiveness of the RIAM in organizing diverse environmental information and distinguishing between positive and negative impacts on various environmental components. Regarding environmental indicators, the current study aligns with the Romanian indicator-based assessment of photovoltaic parks, which highlights that the environmental and socioeconomic impacts of PV development differ across regions due to local land features and development patterns [64]. However, an important methodological difference between the present study and previous ones (e.g., [65,66]) regarding the use of indicators is that several previous studies aggregate multiple indicators into a single sustainability index or ranking to compare projects, technologies, or geographical areas.
All environmental impact assessments involve uncertainty related to data, measurements, model structure, and expert judgment. In the present study, data uncertainty is primarily associated with using multiple sources that may differ in reference year and spatial resolution. Measurement uncertainty may arise from distance measurements and variable classification. Model uncertainty stems from converting indicator values into discrete RIAM scoring classes and Range Bands, as well as from selecting the relevant thresholds. Regarding expert judgment, as outlined in the methodology section, the authors jointly reviewed the evidence, applied consistent scoring rules across all eight photovoltaic parks, and resolved any disagreements through discussion and consensus. However, the absence of independent external validation remains a limitation. Therefore, the results should be interpreted as comparative estimates rather than exact predictions.
5. Conclusions
Green energy sources, and renewable energy sources (RESs) in particular, have a positive impact on the environment, as they generate significantly lower levels of pollution than conventional energy sources during their operational phase. They can produce clean energy without emitting atmospheric pollutants or causing substantial environmental alterations. However, the environmental impacts associated with photovoltaic parks relate to biodiversity, soil quality, the water required for operation and maintenance, and the technical infrastructure that may be present in the wider area of the installation.
The RIAM method is a useful tool in the process of environmental impact assessment. For RES projects, the RIAM can be used both to select a new siting location and to assess the impacts of existing projects. Its application enables the assessment of impacts through specific criteria, which are evaluated and scored using numerical values and scales based on defined qualitative and quantitative parameters. The quantification of impacts through assessment scales allows, to the greatest possible extent, a more objective comparison and analysis of the results.
Indicators are tools for quantifying data, enabling complex information to be represented in a simple, comprehensible, and measurable manner. Their use may be applied across various fields of project assessment and monitoring, including RES projects. Each indicator is associated with a specific objective or purpose and may be used for the assessment of environmental impacts. Through the systematic use and monitoring of indicators, environmental protection can be ensured to the greatest possible extent.
This study developed and used an environment-based RIAM framework to evaluate the environmental impacts of eight photovoltaic parks in the Regional Unit of Messinia, Greece. These installations ranged from about 1.58 to 11.963 MW. After assessing these parks, it was found that their environmental impact largely depends on their location and proximity to environmentally sensitive areas. PV1–PV6, situated outside protected zones and wildlife refuges, generally scored well on environmental indicators, with differences mainly related to their closeness to forests, water sources, and airports. The most significant negative impacts were observed for PV7 and PV8. PV7, located within a wildlife refuge and forested area, received scores of −96 and −72, indicating major negative effects. PV8, overlapping with sclerophyllous vegetation, scored −72. Therefore, these findings highlight how crucial site selection is during permitting. The atmospheric indicator showed positive effects across all parks by reducing CO2 emissions, with PV8 providing the greatest benefit due to its higher capacity.
Limitations and Future Research
However, the present study has some limitations that should be acknowledged. Although the study focuses mainly on selected environmental components highlighted in the international literature on PV environmental impacts, it does not include possible economic and social impacts, which would allow for a more comprehensive assessment aligned with the full four-category structure of the original RIAM framework. In addition, the methodology relies on available spatial and environmental datasets; consequently, the accuracy of the results primarily depends on the quality and resolution of the data sources. Specifically, the indicators related to the climate–environmental component (sunshine duration and humidity) are evaluated based on data recorded on a particular day characterized by cloudy conditions, which may not be representative of the broader climatic conditions of the study area. The findings and limitations of the present study point to several directions for future research. The proposed indicator-based modified RIAM framework could be extended to incorporate economic and social impacts, enabling a more integrated assessment that covers all sustainability aspects associated with PV deployment. Regarding the economic aspect, future research may combine environmental RIAM outcomes with techno-economic indicators such as the levelized cost of electricity, net present value, internal rate of return, and payback period to ensure a more thorough sustainability assessment. The integration of Geographic Information Systems (GISs) and remote sensing data into the indicator measurement process is suggested to ensure accuracy and reliability in indicator measurements. In addition, deploying a weighted version of the framework that includes multi-criteria decision analysis techniques to assign weights to environmental components and indicators could enhance its effectiveness as a decision-support tool for authorities responsible for permitting and monitoring renewable energy projects. Finally, including an independent external expert panel for RIAM application and assessment would enhance the future applications of the proposed framework.
It is considered particularly important that indicator assessment be carried out at regular intervals for all RES projects and across all phases of their life cycle, and that the resulting findings be subsequently quantified. In this way, potential negative environmental impacts can be identified in a timely manner, thereby enabling the relevant authorities to adopt the appropriate measures.
Author Contributions
Conceptualization, D.K. and D.G.V.; methodology, D.K. and D.G.V.; software, D.K. and D.G.V.; formal analysis, D.K. and D.G.V.; investigation, D.K.; data curation, D.K.; writing—original draft preparation, D.G.V.; writing—review and editing, D.K. and D.G.V.; visualization, D.K. and D.G.V.; supervision, D.G.V. All authors have read and agreed to the published version of the manuscript.
Funding
This research received no external funding.
Data Availability Statement
The original contributions presented in this study are included in the article. Further inquiries can be directed to the corresponding author.
Conflicts of Interest
The authors declare no conflicts of interest.
Appendix A
Table A1.
RIAM analysis for PV1.
Table A2.
RIAM analysis for PV2.
Table A3.
RIAM analysis for PV3.
Table A4.
RIAM analysis for PV4.
Table A5.
RIAM analysis for PV5.
Table A6.
RIAM analysis for PV6.
Table A7.
RIAM analysis for PV7.
Table A8.
RIAM analysis for PV8.
References
- REN21. Renewables 2020: Global Status Report; REN21: Paris, France, 2020. [Google Scholar]
- Devine-Wright, P. Rethinking NIMBYism: The role of place attachment and place identity in explaining place-protective action. J. Community Appl. Soc. Psychol. 2009, 19, 426–441. [Google Scholar] [CrossRef] [Scilit]
- Wolsink, M. Planning of renewables schemes: Deliberative and fair decision-making on landscape issues instead of reproachful accusations of non-cooperation. Energy Policy 2007, 35, 2692–2704. [Google Scholar] [CrossRef] [Scilit]
- Vagiona, D. Environmental Impact Studies: Theory and Applications, 2nd ed.; Disigma Publications: Thessaloniki, Greece, 2021. (In Greek) [Google Scholar]
- Mora Barrantes, J.; Piedra-Marin, G.; Sibaja Brenes, J.; Cordero, M. Environmental impact follow up: A case study of several construction projects in various university campuses. WIT Trans. Ecol. Environ. 2019, 231, 21–33. [Google Scholar] [CrossRef] [Scilit]
- Abramic, A.; Cordero-Penin, V.; Haroun, R. Environmental impact assessment framework for offshore wind energy developments based on the marine Good Environmental Status. Environ. Impact Assess. Rev. 2022, 97, 106862. [Google Scholar] [CrossRef] [Scilit]
- Al-Nasrawi, F.A.; Kareem, S.L.; Saleh, L.A. Using the Leopold matrix procedure to assess the environmental impact of pollution from drinking water projects in Karbala City, Iraq. IOP Conf. Ser. Mater. Sci. Eng. 2020, 671, 012078. [Google Scholar] [CrossRef] [Scilit]
- Josimović, B.; Petrić, J.; Milijić, S. The use of the Leopold matrix in carrying out the EIA for wind farms in Serbia. Energy Environ. Res. 2014, 4, 43–54. [Google Scholar] [CrossRef] [Scilit]
- Sajjadi, S.A.; Aliakbari, Z.; Matlabi, M.; Biglari, H.; Rasouli, S.S. Environmental impact assessment of Gonabad municipal waste landfill site using Leopold Matrix. Electron. Physician 2017, 9, 3714–3719. [Google Scholar] [CrossRef] [Scilit] [PubMed]
- Arani, M.H.; Mohammadzadeh, M.; Kalantary, R.R.; Rad, S.H.; Moslemzadeh, M.; Jaafarzadeh, N. Environmental impact assessment of a steel industry development plan using combined method involving Leopold matrix and RIAM. J. Environ. Health Sci. Eng. 2021, 19, 1997–2011. [Google Scholar] [CrossRef] [Scilit] [PubMed]
- Taheri, M.; Gholamalifard, M.; Ghazizade, M.J.; Rahimoghli, S. Environmental impact assessment of municipal solid waste disposal site in Tabriz, Iran using rapid impact assessment matrix. Impact Assess. Proj. Apprais. 2014, 32, 162–169. [Google Scholar] [CrossRef] [Scilit]
- Tianliang, W.; Aghalari, Z.; Mubanga, R.; Sosa-Hernandez, J.E.; Martínez-Ruiz, M.; Parra-Saldívar, R. Assessing environmental health impacts of coal mining exploitation in Iran: A Rapid Impact Assessment Matrix approach for environmental protection. PLoS ONE 2023, 18, e0293973. [Google Scholar] [CrossRef] [Scilit] [PubMed]
- Abbasi, S.; Modibbo, U.M.; Jafari Kolashlou, H.; Ali, I.; Kavousi, N. Environmental impact assessment with rapid impact assessment matrix method: During disaster conditions. Front. Appl. Math. Stat. 2024, 10, 1344158. [Google Scholar] [CrossRef] [Scilit]
- Suthar, S.; Sajwan, A. Rapid impact assessment matrix (RIAM) analysis as decision tool to select new site for municipal solid waste disposal: A case study of Dehradun city, India. Sustain. Cities Soc. 2014, 13, 12–19. [Google Scholar] [CrossRef] [Scilit]
- Atkinson, S.F.; Canter, L.W. Assessing the cumulative effects of projects using geographic information systems. Environ. Impact Assess. Rev. 2011, 31, 457–464. [Google Scholar] [CrossRef] [Scilit]
- Elsayed, M.A.; Ismaeel, W.S.E. Environmental assessment for major development projects: A case study “Qattara Depression”. J. Clean. Prod. 2019, 215, 522–533. [Google Scholar] [CrossRef] [Scilit]
- Dong, J.; Liang, X.; Du, B.; Ju, Y.; Wang, Y.; Guo, H. Applications of Geographic Information Systems in Ecological Impact Assessment: A Methods Landscape, Practical Bottlenecks, and Future Pathways. Sustainability 2025, 17, 10358. [Google Scholar] [CrossRef] [Scilit]
- Martínez, L.F.; Toro, J.; León, C.J. A complex network approach to environmental impact assessment. Impact Assess. Proj. Apprais. 2019, 37, 407–420. [Google Scholar] [CrossRef] [Scilit]
- Peeters, L.J.M.; Holland, K.L.; Huddlestone-Holmes, C.; Boulton, A.J. A spatial causal network approach for multi-stressor risk analysis and mapping for environmental impact assessments. Sci. Total Environ. 2022, 802, 149845. [Google Scholar] [CrossRef] [Scilit] [PubMed]
- Malakar, Y.; Peeters, L.J.M.; Walton, A.; O’Sullivan, D. A causal network approach using a community well-being framework for an initial impact assessment of large-scale energy infrastructure projects. Environ. Impact Assess. Rev. 2023, 102, 107188. [Google Scholar] [CrossRef] [Scilit]
- Karhade, V.R.; Kahalekar, U.J. Environmental impact assessment of watershed—A case study of Ohar watershed, Dist. Aurangabad. J. Indian Water Resour. Soc. 2022, 42, 1–7. [Google Scholar]
- Karhade, V.R.; Kamble, A.L.; Vangujare, S.B.; Wadgaonkar, P.S.; Gadekar, G.S.; Godihal, J. Environmental impact assessment of anthropogenic activities and conceptual restoration strategy for Kham River in Aurangabad, India. Curr. World Environ. 2020, 15, 663–682. [Google Scholar] [CrossRef] [Scilit]
- Wagh, C.H.; Gujar, M.G. The environmental impact assessment by using the Battelle method. Int. J. Sci. Res. 2014, 3, 82–86. [Google Scholar]
- Sas-Bojarska, A.; Orzechowska-Szajda, I.; Puzdrakiewicz, K.; Kiejzik-Głowińska, M. Landscape, EIA and decision-making. A case study of the Vistula Spit Canal, Poland. Impact Assess. Proj. Apprais. 2024, 42, 2–29. [Google Scholar] [CrossRef] [Scilit]
- Saffari, A.; Ataei, M.; Sereshki, F.; Naderi, M. Environmental impact assessment (EIA) by using the Fuzzy Delphi Folchi (FDF) method: Case study: Shahrood cement plant, Iran. Environ. Dev. Sustain. 2019, 21, 817–860. [Google Scholar] [CrossRef] [Scilit]
- Chou, W.-R.; Hsieh, H.-Y.; Hong, G.-K.; Ko, F.-C.; Meng, P.-J.; Tew, K.S. Verification of an Environmental Impact Assessment Using a Multivariate Statistical Model. J. Mar. Sci. Eng. 2022, 10, 1023. [Google Scholar] [CrossRef] [Scilit]
- Kaya, T.; Kahraman, C. An integrated fuzzy AHP–ELECTRE methodology for environmental impact assessment. Expert Syst. Appl. 2011, 38, 8553–8562. [Google Scholar] [CrossRef] [Scilit]
- Mirmohammadi, M.; Gholamnejad, J.; Fattahpour, V.; Seyedsadri, P.; Ghorbani, Y. Designing of an environmental assessment algorithm for surface mining projects. J. Environ. Manag. 2009, 90, 2422–2435. [Google Scholar] [CrossRef] [Scilit] [PubMed]
- Wu, W.; Chen, H.; Li, C.; Lu, G.; Ye, D.; Ma, C.; Ren, L.; Li, G. Assessment of the ecological and environmental effects of large-scale photovoltaic development in desert areas. Sci. Rep. 2024, 14, 22456. [Google Scholar] [CrossRef] [Scilit] [PubMed]
- Lenzen, M.; Murray, S.A.; Korte, B.; Dey, C.J. Environmental impact assessment including indirect effects—A case study using input–output analysis. Environ. Impact Assess. Rev. 2003, 23, 263–282. [Google Scholar] [CrossRef] [Scilit]
- Chen, H.; Wu, W.; Li, C.; Lu, G.; Ye, D.; Ma, C.; Ren, L.; Li, G. Ecological and environmental effects of global photovoltaic power plants: A meta-analysis. J. Environ. Manag. 2025, 373, 123785. [Google Scholar] [CrossRef] [Scilit] [PubMed]
- Zhang, H.; Yu, Z.; Zhu, C.; Yang, R.; Yan, B.; Jiang, G. Green or Not? Environmental Challenges from Photovoltaic Technology. Environ. Pollut. 2023, 320, 121066. [Google Scholar] [CrossRef] [Scilit] [PubMed]
- Tawalbeh, M.; Al-Othman, A.; Kafiah, F.; Abdelsalam, E.; Almomani, F.; Alkasrawi, M. Environmental Impacts of Solar Photovoltaic Systems: A Critical Review of Recent Progress and Future Outlook. Sci. Total Environ. 2021, 759, 143528. [Google Scholar] [CrossRef] [Scilit] [PubMed]
- Luo, L.; Zhuang, Y.; Liu, H.; Zhao, W.; Chen, J.; Du, W.; Gao, X. Environmental impacts of photovoltaic power plants in northwest China. Sustain. Energy Technol. Assess. 2023, 56, 103120. [Google Scholar] [CrossRef] [Scilit]
- Tsoutsos, T.; Frantzeskaki, N.; Gekas, V. Environmental impacts from the solar energy technologies. Energy Policy 2005, 33, 289–296. [Google Scholar] [CrossRef] [Scilit]
- Lambert, Q.; Bischoff, A.; Gros, R. Effects of habitat restoration and solar panels on soil properties and functions in solar parks. Appl. Soil Ecol. 2024, 203, 105614. [Google Scholar] [CrossRef] [Scilit]
- Lambert, Q.; Bischoff, A.; Cueff, S.; Cluchier, A.; Gros, R. Effects of solar park construction and solar panels on soil quality, microclimate, CO2 effluxes, and vegetation under a Mediterranean climate. Land Degrad. Dev. 2021, 32, 5190–5202. [Google Scholar] [CrossRef] [Scilit]
- Armstrong, A.; Waldron, S.; Whitaker, J.; Ostle, N.J. Wind farm and solar park effects on plant–soil carbon cycling: Uncertain impacts of changes in ground-level microclimate. Glob. Change Biol. 2014, 20, 1699–1706. [Google Scholar] [CrossRef] [Scilit] [PubMed]
- Deb, D.; Brahmbhatt, N.L. Review of yield increase of solar panels through soiling prevention, and a proposed water-free automated cleaning solution. Renew. Sustain. Energy Rev. 2018, 82, 3306–3313. [Google Scholar] [CrossRef] [Scilit]
- Hernandez, R.R.; Easter, S.B.; Murphy-Mariscal, M.L.; Maestre, F.T.; Tavassoli, M.; Allen, E.B.; Barrows, C.W.; Belnap, J.; Ochoa-Hueso, R.; Ravi, S.; et al. Environmental impacts of utility-scale solar energy. Renew. Sustain. Energy Rev. 2014, 29, 766–779. [Google Scholar] [CrossRef] [Scilit]
- Tao, Y.; Zheng, N.; Cheng, Y.; Zhu, J.; Zhong, W.; Sun, Y.; Zhao, J.; Dong, B.; Wang, Y.; Ren, J. A Linear Optimization for Slope Leveling of Ground-Mounted Centralized Photovoltaic Sites. Buildings 2024, 14, 1858. [Google Scholar] [CrossRef] [Scilit]
- Barron-Gafford, G.A.; Minor, R.L.; Allen, N.A.; Cronin, A.D.; Brooks, A.E.; Pavao-Zuckerman, M.A. The Photovoltaic Heat Island Effect: Larger solar power plants increase local temperatures. Sci. Rep. 2016, 6, 35070. [Google Scholar] [CrossRef] [Scilit] [PubMed]
- Uldrijan, D.; Kováčiková, M.; Jakimiuk, A.; Vaverková, M.D.; Winkler, J. Ecological effects of preferential vegetation composition developed on sites with photovoltaic power plants. Ecol. Eng. 2021, 168, 106274. [Google Scholar] [CrossRef] [Scilit]
- Bošnjaković, M.; Santa, R.; Crnac, Z.; Bošnjaković, T. Environmental Impact of PV Power Systems. Sustainability 2023, 15, 11888. [Google Scholar] [CrossRef] [Scilit]
- Jin, Y.; Behrens, P.; Tukker, A.; Scherer, L. Water use of electricity technologies: A global meta-analysis. Renew. Sustain. Energy Rev. 2019, 115, 109391. [Google Scholar] [CrossRef] [Scilit]
- Guerin, T. A case study identifying and mitigating the environmental and community impacts from construction of a utility-scale solar photovoltaic power plant in eastern Australia. Sol. Energy 2017, 146, 94–104. [Google Scholar] [CrossRef] [Scilit]
- Turney, D.; Fthenakis, V. Environmental impacts from the installation and operation of large-scale solar power plants. Renew. Sustain. Energy Rev. 2011, 15, 3261–3270. [Google Scholar] [CrossRef] [Scilit]
- Swart, A.J.; Hertzog, P.E. Varying percentages of full uniform shading of a PV module in a controlled environment yields linear power reduction. J. Energy S. Afr. 2016, 27, 28–38. [Google Scholar] [CrossRef] [Scilit][Green Version]
- RAE GeoPortal. Available online: https://geo.rae.gr/ (accessed on 1 December 2025).
- Cloquell-Ballester, V.A.; Monterde-Díaz, R.; Santamarina-Siurana, M.C. Indicators Validation for the Improvement of Environmental and Social Impact Quantitative Assessment. Environ. Impact Assess. Rev. 2006, 26, 79–105. [Google Scholar] [CrossRef] [Scilit]
- Pastakia, C.M.R.; Jensen, A. The Rapid Impact Assessment Matrix (RIAM) for EIA. Environ. Impact Assess. Rev. 1998, 18, 461–482. [Google Scholar] [CrossRef] [Scilit]
- Codemo, A.; Barbini, A.; Mantouza, A.; Bitziadis, A.; Albatici, R. Integration of Public Perception in the Assessment of Licensed Solar Farms: A Case Study in Greece. Sustainability 2023, 15, 9899. [Google Scholar] [CrossRef] [Scilit]
- Spyridonidou, S.; Vagiona, D.G. A systematic review of site-selection procedures of PV and CSP technologies. Energy Rep. 2023, 9, 2947–2979. [Google Scholar] [CrossRef] [Scilit]
- Vagiona, D. Environmental performance value of projects: An environmental impact assessment tool. Int. J. Sustain. Dev. Plan. 2015, 10, 315–330. [Google Scholar] [CrossRef] [Scilit]
- Ourtzani, O.; Vagiona, D.G. Sustainability Assessment of Onshore Wind Farms: A Case Study in the Region of Thessaly. Sustainability 2026, 18, 3656. [Google Scholar] [CrossRef] [Scilit]
- Vagiona, D.G.; Tzekakis, G.; Loukogeorgaki, E.; Karanikolas, N. Site Selection of Offshore Solar Farm Deployment in the Aegean Sea, Greece. J. Mar. Sci. Eng. 2022, 10, 224. [Google Scholar] [CrossRef] [Scilit]
- Spyridonidou, S.; Loukogeorgaki, E.; Vagiona, D.G.; Bertrand, T. Towards a Sustainable Spatial Planning Approach for PV Site Selection in Portugal. Energies 2022, 15, 8515. [Google Scholar] [CrossRef] [Scilit]
- Hellenic National Meteorological Agency. Available online: https://www.emy.gr/en/climatic-data?tab=statistics-tab (accessed on 30 July 2026).
- Geospatial Information Portal of the Ministry of Environment and Energy. Available online: https://mapsportal.ypen.gr/ (accessed on 10 December 2025).
- Natura 2000 Expert Viewer. Available online: https://natura2000.eea.europa.eu/expertviewer/ (accessed on 10 December 2025).
- Energy Register. Available online: https://www.energyregister.gr/ (accessed on 10 December 2025).
- Hellenic Association of Photovoltaic Companies. Photovoltaics and the Environment; Hellenic Association of Photovoltaic Companies: Athens, Greece, 2011; Available online: https://www.helapco.gr/ims/file/solar_energy/PV_Environment.pdf (accessed on 21 May 2025).
- Yousefi, H.; Ehara, S.; Yousefi, A.; Seiedi, F. Environmental Impact Assessment of Sabalan Geothermal Power Plant, NW Iran. In Proceedings of the Thirty-Fourth Workshop on Geothermal Reservoir Engineering, Stanford, CA, USA, 9–11 February 2009; SGP-TR-187. pp. 54–62. [Google Scholar]
- Dumitrașcu, M.; Grigorescu, I.; Vrînceanu, A.; Mocanu, I.; Mitrică, B.; Dumitrică, C.; Șerban, P. An indicator-based approach to assess and compare the environmental and socio-economic consequences of photovoltaic parks in Romania’s development regions. Environ. Dev. Sustain. 2025, 27, 24963–25003. [Google Scholar] [CrossRef] [Scilit]
- Cucchiella, F.; D’Adamo, I. A multicriteria analysis of photovoltaic systems: Energetic, environmental, and economic assessments. Int. J. Photoenergy 2015, 2015, 627454. [Google Scholar] [CrossRef] [Scilit]
- Ding, W.; Zhao, X.; Meng, W.; Wang, H. Smart evaluation of sustainability of photovoltaic projects in the context of carbon neutrality target. Sustainability 2022, 14, 14925. [Google Scholar] [CrossRef] [Scilit]

Disclaimer/Publisher’s Note: The statements, opinions and data contained in all publications are solely those of the individual author(s) and contributor(s) and not of MDPI and/or the editor(s). MDPI and/or the editor(s) disclaim responsibility for any injury to people or property resulting from any ideas, methods, instructions or products referred to in the content. |
© 2026 by the authors. Licensee MDPI, Basel, Switzerland. This article is an open access article distributed under the terms and conditions of the Creative Commons Attribution (CC BY) license.