


Abstract
The digitalization of sustainable energy systems increasingly relies on containerized Internet of Things services deployed across cloud–edge architectures. These services introduce software supply-chain risks associated with public container images and their dependencies. This study evaluates 22 container images representing 13 official or vendor-maintained technologies used for data storage and processing, communication, proxy and API services, and application runtime environments. Each image was analysed using Trivy and Grype, resulting in 44 vulnerability scans performed using vulnerability databases available on 14 June 2026. The effect of image minimization was assessed using five strictly matched standard–minimized pairs, while scanner agreement was evaluated for all images using unique CVE sets, the Jaccard coefficient, and symmetrical and directional Tversky indices. Across the complete sample, Trivy reported 7006 vulnerability findings and Grype reported 2299. Within the strictly matched sample, findings decreased from 5181 to 193 for Trivy and from 982 to 290 for Grype. However, these reductions were strongly influenced by the Ruby image, and the exact Wilcoxon signed-rank test did not confirm a statistically significant general minimization effect (). Redis, HAProxy, and Ruby showed substantial reductions, whereas Caddy remained unchanged and both .NET SDK variants produced zero findings. The set-based analysis revealed incomplete and asymmetric agreement between the scanners, demonstrating that similar aggregate counts may represent different CVE profiles. Operational prioritization of six selected image variants further showed differences in remediation availability, EPSS scores, and CISA KEV inclusion. The results indicate that image minimization can reduce scanner findings but does not independently confirm container security. A multi-tool DevSecOps process combining immutable digest verification, Software Bills of Materials, vulnerability prioritization, image rebuilding, and continuous rescanning is therefore recommended.
1. Introduction
The transformation of energy systems is driven by both the need to mitigate climate change and binding international commitments and European Union regulations. The Paris Agreement established a global framework for limiting the increase in average temperature and progressively reducing greenhouse gas emissions [1]. Within the European Union, these objectives were legally embedded in the European Climate Law, which establishes the binding objective of achieving climate neutrality by 2050 and reducing net greenhouse gas emissions by at least 55% by 2030 compared with 1990 levels [2].
Meeting these commitments requires a fundamental transformation of the production and use of energy. The revised Renewable Energy Directive, commonly referred to as RED III, establishes a binding Union-level target of at least 42.5% renewable energy in gross final energy consumption by 2030, accompanied by a collective ambition to reach 45% [3]. This direction is complemented by the revised Energy Efficiency Directive, which requires an additional 11.7% reduction in energy consumption by 2030 compared with the projections of the 2020 reference scenario [4]. The REPowerEU Plan has further accelerated the deployment of renewable energy, energy-efficiency measures, and supply diversification in response to the need to reduce dependence on imported fossil fuels [5].
Consequently, renewable energy sources are becoming a principal component of the energy mix, fundamentally changing the architecture and operating conditions of power systems.
Regulatory transformation and the deployment of renewable energy sources are gradually changing the architecture of the power system. The traditional model was primarily based on large, centrally controlled generating units, from which electricity was transmitted through transmission and distribution networks to end users. Contemporary power systems increasingly comprise distributed energy resources, prosumer installations, energy storage systems, electric vehicles, and flexible loads. Consumers can simultaneously consume, store, and inject electricity into the grid, replacing the conventional unidirectional supply model with multidirectional flows of energy and information [6].
This transformation creates new opportunities for decarbonisation, local energy balancing, and enhanced system resilience, but it also increases operational complexity. The growing penetration of wind and photovoltaic generation increases variability and uncertainty on the supply side because available power depends on weather conditions and cannot be dispatched in the same manner as conventional generating units. Power systems therefore require greater flexibility to maintain the balance between generation and demand across different time scales. Such flexibility may be provided by energy storage, dispatchable generation, demand response, and the coordinated operation of distributed energy resources [6,7].
The variable and stochastic characteristics of solar and wind generation increase the importance of generation forecasting and continuous system-state assessment. Accurate forecasts can reduce balancing costs and improve the scheduling of energy storage systems, reserve generation, and flexible loads [8]. At the same time, the presence of thousands of distributed devices requires near-real-time monitoring, automated control, and bidirectional data exchange among generators, consumers, storage systems, and network operators. Consequently, the operation of modern power systems increasingly depends not only on physical infrastructure but also on communication, information, and software layers.
Digitalisation is a fundamental prerequisite for the operation of decentralised energy systems. The growing number of distributed energy resources, storage systems, prosumers, and flexible loads requires access to current and reliable data, enabling system-state observation, coordinated resource operation, and the adaptation of generation and consumption to technical and market conditions. The EU Action Plan on Digitalising the Energy System emphasises that digital technologies should support renewable energy integration, active prosumer participation, and the interoperability of energy data, platforms, and services [9].
The Internet of Things is a fundamental element of this transformation, interconnecting smart meters, sensors, actuators, and controllers deployed across energy generation, transmission, distribution, and consumption systems. These devices enable automated data acquisition, bidirectional communication, and the remote monitoring and control of energy resources [10]. Advanced metering infrastructures provide data on power, energy consumption, power-quality parameters, equipment status, and environmental conditions. Such data form the basis for energy management systems, forecasting, anomaly detection, demand response, and the optimisation of distributed energy resources.
However, the large number of devices and the high frequency of measurements result in a rapid increase in the volume of generated data. Transmitting all information directly to a centralised cloud may increase latency, network load, and dependence on the continuous availability of communication links. Energy IoT architectures therefore increasingly employ a cloud–edge model in which part of the data is stored and processed close to the metering devices. Edge and fog computing support functions requiring short response times, whereas cloud infrastructure provides the resources needed for long-term data storage, historical analysis, and the coordination of services operating on a larger scale [11,12].
From a software architecture perspective, such systems require the cooperation of multiple services responsible for data acquisition, transmission, buffering, storage, analysis, and access. Databases store metering and operational data, communication servers support information exchange, APIs integrate devices and applications, and runtime environments execute analytical and management logic. Containerisation enables these functions to be deployed as modular and portable software services across edge, on-premises, and cloud environments. It facilitates infrastructure scaling, updating, and automation and is therefore increasingly considered an enabling technology for digital smart-grid platforms and advanced metering infrastructures [13].
To clarify the relationship between the analysed container technologies and sustainable energy systems, Figure 1 presents a reference architecture of a containerized IoT platform supporting energy monitoring and management. The architecture links physical energy assets and metering devices with edge gateways, containerized data storage, communication, API, and application-runtime services, as well as cloud-based monitoring and energy-management functions. The highlighted software layer defines the application context of the present vulnerability assessment. The analysed technologies do not represent components of a single deployed energy installation; rather, they constitute transferable software building blocks that may be used in different digital energy platforms.
Figure 1.
Reference architecture of a containerized IoT platform for sustainable energy systems and the scope of the vulnerability assessment conducted in this study, source: Authors’ own elaboration.
The architecture presented in Figure 1 also has a regulatory and cybersecurity dimension. The NIS2 Directive establishes common cybersecurity risk-management and incident-reporting requirements for critical sectors, including the energy sector [14]. It is complemented by the Critical Entities Resilience Directive, which aims to strengthen the ability of organisations providing essential services to prevent, respond to, and recover from disruptions [15]. Therefore, the digitalisation of energy systems must be accompanied by measures ensuring the resilience of infrastructure, digital services, and their software supply chains.
The expansion of the digital layer of energy systems simultaneously increases their attack surface. Smart meters, sensors, communication gateways, APIs, databases, and services operating in cloud and edge environments create multiple access points to data and operational functions. A security breach affecting one of these components may result in service unavailability, credential theft, manipulation of metering data, or disruption of information exchanged by energy management systems. The significance of this issue is reflected in the NIS2 Directive, which covers the energy sector and requires cybersecurity risk-management measures, including supply-chain security, vulnerability handling, and incident management [14].
Containerisation transfers part of the risk from physical devices to the software layer. A container image includes not only the target application but also base operating-system packages, libraries, runtime environments, and transitive dependencies. A vulnerability affecting one of these elements may be inherited by every service created from the image. Kernel sharing and incorrect container configurations may further increase the risk of compromising the isolation between a container, other services, and the host operating system [16].
The use of ready-made images obtained from public registries accelerates the development and deployment of IoT services but increases dependence on external providers and makes it more difficult to maintain full control over the origin of all software components. Studies of Docker Hub have demonstrated that known vulnerabilities are also present in official and widely used images [17]. An analysis of 2500 images further showed that the number of vulnerabilities was not correlated with pull counts, user ratings, or the time elapsed since the most recent update. Image popularity therefore cannot be considered a reliable indicator of security [18].
This risk is particularly important when the same base images are reused across multiple services. A vulnerable component may be propagated to numerous services responsible for acquiring, storing, and processing energy-related data. Under these conditions, the traceability of software components and continuous security assessment become necessary. A Software Bill of Materials provides a structured inventory of the components and dependencies contained in a software artifact, enabling organisations to determine more rapidly which services are affected by a newly disclosed vulnerability [19].
Automated software composition analysis can be conducted using scanners that compare identified packages and libraries against databases of known CVEs. Trivy analyses files and metadata contained in container images and can detect vulnerabilities, misconfigurations, and exposed secrets [20]. Grype can scan container images, filesystems, and existing SBOM documents [21]. However, these tools employ different component-cataloguing mechanisms, vulnerability databases, and matching rules. Relying on a single scanner may therefore result in an incomplete risk assessment, which justifies a comparative evaluation of outputs generated by different tools.
Existing research can be divided into two principal streams. The first concerns the cybersecurity of smart grids, energy-related Internet of Things systems, and cloud–edge architectures. It primarily focuses on the security of metering devices, communication protocols, data transmission, and control systems [10,11,12,13]. The second stream examines container security, public image registries, and software supply-chain risks [16,17,18]. Although these areas are technologically interconnected, the security of containerized components forming the software layer of energy IoT platforms has received less attention than device- and communication-level security.
Studies of public registries confirm that vulnerabilities are not limited to unofficial or infrequently updated images. Wist et al. analysed 2500 Docker Hub images and found no correlation between vulnerability counts and image pull counts, user ratings, or the time elapsed since the most recent update [18]. Research based on the concept of technical lag further demonstrated that even the most recent available package versions cannot guarantee the absence of known vulnerabilities [22]. Consequently, image popularity, official status, and recency cannot independently be treated as reliable indicators of security.
Diverging views are also present in the literature concerning the effectiveness of image minimization. On the one hand, removing unused packages is considered a method of reducing the attack surface. Kaur et al., comparing the results of four vulnerability scanners, found that software updates removed approximately two-thirds of the identified vulnerabilities and that eliminating unused packages further improved the security profile of the images [23]. These findings support the use of Slim, Alpine, and other container variants containing a reduced set of components.
On the other hand, a smaller image does not necessarily imply a proportional reduction in security risk. Minimization primarily removes operating-system packages, while vulnerable application dependencies, language-specific libraries, and components embedded in compiled executable files may remain. Javed and Toor demonstrated that the evaluated scanners had limited capability to detect vulnerabilities in application packages and that even the best-performing tool missed some known vulnerabilities [24]. This creates an important interpretative ambiguity: a low reported vulnerability count may reflect either a genuine reduction in the attack surface or insufficient scanner coverage of the application layer.
The lack of full agreement between scanning tools remains another important issue. Individual scanners use different data sources, package-identification rules, identifier formats, and mechanisms for mapping software components to vulnerabilities. They may therefore report different CVE sets for the same artifact. O’Donoghue et al. used Trivy and Grype to assess 1151 SBOM documents, illustrating the relevance of multi-tool software supply-chain analysis [25]. The challenges concern not only detection coverage but also the presentation and interpretation of results. Kim et al. demonstrated that scanner reports may hinder vulnerability prioritization and remediation decision-making [26].
Recent research on scanner consistency confirms that comparing only aggregate vulnerability counts is insufficient. Churakova, Ekstedt, and Schmid applied the Jaccard coefficient and the Tversky measure to compare the outputs of seven tools analysing container images and VEX documents. The authors reported a generally low level of consistency, although some tool pairs, including Trivy and Grype, exhibited greater similarity than other combinations [27]. These findings demonstrate that similar vulnerability counts do not necessarily represent identical sets of detected vulnerabilities.
Previous research therefore confirms the importance of image minimization, software updates, and SBOM adoption, but does not conclusively determine the extent to which standard and minimized variants of the same technologies produce comparable vulnerability profiles across different scanners. In particular, relatively few studies simultaneously examine several software architecture layers—databases, communication services, APIs, and application runtime environments—that may form the basis of containerized IoT platforms used in energy systems.
Despite these advances, the available literature provides limited evidence from studies that simultaneously:
- compare standard and minimized variants of the same technologies;
- cover different software architecture layers, including databases, communication services, APIs, and application runtime environments;
- employ more than one vulnerability scanner under identical experimental conditions;
- assess how image minimization affects the reported vulnerability profile across different software component types;
- evaluate not only aggregate vulnerability counts but also the agreement and asymmetry between the CVE sets reported by individual tools.
The research gap does not concern the use of the Jaccard coefficient or the Tversky measure alone, as both have already been applied in scanner-comparison studies [27]. Rather, it concerns their application to the comparison of standard and minimized variants of 13 technologies representing different layers of containerized IoT platforms potentially used in digital energy systems. This approach enables the assessment of whether image-size reduction genuinely decreases known vulnerabilities and to what extent the resulting vulnerability profile depends on the selected scanning tool.
The aim of this study is to provide a quantitative and qualitative vulnerability assessment of official container images representing three fundamental software layers commonly found in containerized IoT platforms: data storage and processing, network communication and API services, and application runtime environments. The analysed technologies were not treated as components of a single deployed energy system. Instead, they constitute a cross-sectional set of software components that may support monitoring, data exchange, and management functions in digital energy systems.
The study covered 13 official or vendor-maintained technologies represented by 22 distinct container images. Each image was analysed using Trivy and Grype, resulting in 44 vulnerability-scanning operations. Five strictly matched standard–minimized pairs were used as the primary sample for assessing the effect of image minimization, while partially matched, version-mismatched, and unpaired images were retained for descriptive and scanner-agreement analyses. The agreement and asymmetry between the scanner outputs were evaluated for all 22 images using deduplicated CVE sets, the Jaccard similarity coefficient, and symmetrical and weighted directional Tversky indices. The vulnerability databases used in the experiment reflected the state available on 14 June 2026, enabling comparison under consistent temporal conditions. Based on the literature review and the identified research gap, the following hypotheses were formulated:
H1.
For most of the analysed technologies, minimized container image variants report fewer vulnerabilities than their corresponding standard variants; however, the magnitude and direction of this change depend on the technology and vulnerability scanner used.
H2.
Trivy and Grype produce non-equivalent vulnerability profiles for the same container images, as reflected in differences in reported vulnerability counts and incomplete overlap between the detected CVE sets.
H3.
Image minimization may substantially reduce the total number of reported vulnerabilities without producing a proportional reduction in Critical-severity vulnerabilities.
The main contributions of this study are as follows:
- the construction of a reproducible experimental sample comprising 22 immutable container images representing 13 official or vendor-maintained technologies, documented using complete tags, SHA-256 digests, creation dates, image sizes, architectures, retrieval dates, and base distributions;
- the introduction of a four-class comparability framework distinguishing strictly matched, partially matched, version-mismatched, and unpaired image variants, with five strictly matched pairs used for the primary assessment of image minimization;
- a standardized comparison of Trivy and Grype based on 44 vulnerability-scanning operations performed under the same experimental and temporal conditions;
- a multidimensional analysis separating total scanner findings, unique CVE identifiers, severity distributions, paired changes, and scanner agreement assessed using the Jaccard coefficient and symmetrical and weighted directional Tversky indices;
- an operational-prioritization analysis for selected image variants incorporating remediation availability, EPSS scores, and inclusion in the CISA Known Exploited Vulnerabilities catalogue;
- the formulation of DevSecOps recommendations for containerized software components that may support cloud–edge and Internet of Things platforms used in sustainable energy systems.
The principal findings indicate that image minimization can substantially reduce scanner-reported findings for selected technologies, although the effect was not uniform across the strictly matched sample. Redis, HAProxy, and Ruby showed reductions in both scanners; Caddy produced unchanged results, and both .NET SDK variants produced zero findings. The exact Wilcoxon signed-rank test did not confirm a statistically significant general minimization effect (), reflecting the small number of informative matched pairs. The comparison of all 22 images also revealed substantial differences between Trivy and Grype in aggregate findings and unique CVE sets. The Jaccard and Tversky analyses demonstrated that similar scanner totals may represent different and asymmetric vulnerability profiles. Operational prioritization using remediation availability, EPSS, and CISA KEV information further confirmed that total finding counts and CVSS severity alone provide an incomplete basis for deployment decisions. These results support a multi-tool DevSecOps approach combining SBOM generation, immutable digest verification, vulnerability prioritization, regular image rebuilding, and continuous rescanning.
The remainder of this article is organized as follows. Section 2 reviews the literature on container vulnerabilities, public image registries, scanning methods, and software supply-chain security. Section 3 describes the research sample, experimental environment, tools, and data-analysis methods. Section 4 presents the scanning results and compares the identified vulnerability profiles. Section 5 discusses the findings, evaluates the research hypotheses, outlines the limitations, and considers the implications for containerized IoT platforms supporting energy systems. Finally, Section 6 presents the conclusions and recommendations for future research.
2. Containerization and Public Image Registries in Modern Software Engineering
Containerization has become an important mechanism for developing, distributing, and deploying modern software systems. A container image packages application code together with the libraries, dependencies, and runtime configuration required for its execution. Unlike conventional virtual machines, containers share the host operating-system kernel, which generally reduces resource overhead and startup time while facilitating portability across local, cloud, and edge environments [16,28].
These characteristics have contributed to the widespread adoption of containers in microservice architectures, distributed systems, and Internet of Things platforms. Individual services responsible for data acquisition, communication, storage, processing, and application logic can be deployed and updated independently. In digital energy systems, this model can support the implementation of databases, communication servers, APIs, and runtime environments used for monitoring distributed energy resources and processing operational data [13].
The Docker platform has played a major role in the adoption of containerization by standardizing the processes of building, running, and distributing container images. Docker Hub serves as a public registry through which developers can publish and retrieve ready-made images representing operating systems, databases, communication services, application runtimes, and infrastructure tools. The reuse of such images accelerates software delivery and supports CI/CD automation, but it also creates dependencies on externally developed and maintained software components [17,18].
A public image may contain operating-system packages, application libraries, runtime components, and transitive dependencies originating from multiple providers. Vulnerabilities embedded in these elements may be inherited by every service built from the image. Moreover, new CVEs may be disclosed after an image has been published, meaning that an image considered acceptable at one point in time may later become vulnerable. Therefore, image popularity, official status, pull count, or recent publication should not be treated as substitutes for an independent security assessment [18,22].
Empirical studies confirm the scale of this problem. Wist et al. analysed 2500 Docker Hub images and found no meaningful correlation between vulnerability counts and pull counts, user ratings, or the time elapsed since the most recent update [18]. Industry observations similarly indicate that High- and Critical-severity vulnerabilities remain widespread in production container environments, including cases in which security fixes are already available but have not been applied [29]. These findings demonstrate that the efficiency offered by public registries must be accompanied by continuous vulnerability assessment and software component traceability.
2.1. Software Supply-Chain Security and Trust in Public Container Images
Software supply-chain security encompasses the protection of source code, third-party libraries, build systems, container images, public registries, and deployment pipelines throughout the software lifecycle. Contemporary software development relies extensively on the reuse of externally maintained components. Consequently, a deployed container image may incorporate operating-system packages, application libraries, runtime environments, and transitive dependencies originating from multiple providers. This approach accelerates software delivery but reduces direct control over component provenance, maintenance status, and vulnerability exposure [16,17].
The consequences of this dependency are particularly important in containerized IoT platforms, in which the same base image or software library may be reused across numerous services. A compromised or vulnerable component can therefore propagate to databases, communication servers, APIs, and application runtime environments. In systems supporting energy monitoring and management, such propagation may affect the confidentiality, integrity, and availability of operational and metering data.
Public container registries further increase this exposure by enabling the direct reuse of ready-made artifacts. Relevant threats include typosquatting, malicious code embedded in image layers, exposed credentials and cryptographic material, outdated dependencies, and unauthorized modification of published artifacts. Liu et al. demonstrated that container registries are susceptible to typosquatting attacks in which malicious images are published under names resembling legitimate projects [30]. Dahlmanns et al. identified credentials, private keys, certificates, and other sensitive information embedded in publicly accessible container images, confirming that secret leakage represents a significant supply-chain risk [31].
Trust in a public container image should therefore not be inferred solely from its name, popularity, official status, or availability in a widely used registry [32]. It should instead be based on verifiable properties, including image provenance, immutable digests, cryptographic signatures, an inventory of included components, and an assessment of known vulnerabilities. Because the vulnerability profile of an image may change after publication as new CVEs are disclosed, verification should be treated as a continuous process rather than a one-time activity [19,22].
The threats associated with public container registries are diverse and may affect both the integrity of the software artifact and the confidentiality of the systems in which it is deployed. The principal threat categories identified in the literature include malicious image content, typosquatting, exposed secrets, outdated dependencies, and unauthorized artifact modification. These risks are summarized in Table 1. They should not be considered mutually exclusive, because a single container image may simultaneously contain vulnerable dependencies, embedded credentials, and malicious or unauthorized modifications [17,18,22,30,31].
Table 1.
Principal threats associated with public container image registries.
The presence of these threats demonstrates that trust in a container image must be established through verifiable technical evidence rather than inferred from its availability in a public registry. This requirement has contributed to the development of mechanisms supporting software provenance, component transparency, and cryptographic artifact verification.
In response to software supply-chain risks, mechanisms have been developed to improve component transparency, artifact provenance, and integrity verification. A Software Bill of Materials provides a structured inventory of the packages, libraries, and dependencies included in a software artifact. It enables organizations to determine whether a newly disclosed vulnerability affects particular container images and deployed services. However, an SBOM does not independently confirm that an artifact was produced by an authorized build process or remained unmodified after creation [19].
The Supply-chain Levels for Software Artifacts framework complements component inventories by defining progressively stronger requirements for software provenance and build integrity. SLSA provenance records information about the entity that produced an artifact, the build process, and the inputs used during its creation. Higher assurance levels introduce stronger protection against unauthorized modification of the build process, provenance metadata, and resulting artifacts [33].
Cryptographic signing provides an additional mechanism for verifying container images. Sigstore and its Cosign tool support the signing and verification of container images, including identity-based signing using short-lived certificates associated with OpenID Connect authentication. Verification can establish whether an artifact is associated with the expected identity and whether it has been modified after signing. Consequently, SBOM, provenance metadata, vulnerability scanning, and cryptographic signatures should be treated as complementary controls rather than interchangeable security measures [19,33,34].
These mechanisms establish complementary layers of trust in the software supply chain. SBOM documents support component transparency, SLSA provenance records provide information about the origin and integrity of the build process, and cryptographic signatures enable verification of artifact identity and modification. However, none of these mechanisms independently confirms the absence of known vulnerabilities. They should therefore be combined with continuous vulnerability scanning and automated deployment policies [19,33,34]. The operational integration of these controls into DevSecOps processes is discussed in Section 2.4.
2.2. Vulnerability Identification and Severity Assessment in Container Images
Common Vulnerabilities and Exposures (CVE) provides standardized identifiers for publicly disclosed vulnerabilities in software and hardware. Each vulnerability is assigned a unique identifier following the CVE-YYYY-NNNNN format, which enables consistent tracking across vulnerability databases, security advisories, scanning tools, and remediation processes. The National Vulnerability Database (NVD), maintained by the National Institute of Standards and Technology (NIST), enriches CVE records with additional metadata, including affected products and versions, technical references, attack characteristics, and severity information.
The severity of publicly disclosed vulnerabilities is commonly assessed using the Common Vulnerability Scoring System (CVSS). CVSS assigns a numerical score ranging from 0.0 to 10.0 based on technical characteristics related to exploitability and potential impact on confidentiality, integrity, and availability. Numerical scores are subsequently mapped to qualitative severity categories, commonly defined as Low, Medium, High, and Critical. These categories facilitate the interpretation of scanner results, particularly when a single container image contains numerous operating-system packages, application libraries, runtime components, and transitive dependencies.
Severity-based classification performs three principal functions in container vulnerability assessment:
- –
- Data aggregation—it enables the security profile of a container image to be summarized without analysing every CVE independently. Reporting the numbers of Low-, Medium-, High-, and Critical-severity vulnerabilities provides a more interpretable representation of the results than a single average CVSS score. This approach also makes it possible to compare the vulnerability structures of different image variants and technologies.
- –
- Remediation prioritization—development and security teams may be unable to address all reported vulnerabilities simultaneously. Severity categories support the identification of findings requiring immediate attention and enable automated controls to be implemented in CI/CD pipelines. For example, deployment may be blocked when an image contains vulnerabilities exceeding an accepted severity threshold. Industry observations indicate that High- and Critical-severity vulnerabilities remain widespread in containerized production environments, including cases in which available fixes have not yet been implemented [35].
- –
- Comparative assessment—severity distributions make it possible to evaluate whether a reduction in the total number of reported vulnerabilities is accompanied by a corresponding reduction in the most severe findings. This distinction is important when comparing standard and minimized image variants. A smaller number of scanner alerts does not independently confirm that the most security-relevant vulnerabilities have been removed.
Aggregate vulnerability counts should therefore not be interpreted as direct measures of security risk. Two container images may contain similar total numbers of reported vulnerabilities while differing substantially in the numbers of High- and Critical-severity findings. Conversely, image minimization may remove numerous operating-system packages and substantially decrease the overall number of detected vulnerabilities without producing a proportional reduction in Critical-severity vulnerabilities. The total vulnerability count and the severity distribution should therefore be analysed as complementary rather than interchangeable characteristics.
This distinction is particularly relevant to Alpine- and Slim-based images. Removing unnecessary packages can reduce the potential attack surface and limit the number of inherited operating-system vulnerabilities. However, application dependencies, language-specific libraries, runtime components, and statically linked binaries may remain present in minimized images. A low aggregate vulnerability count may therefore reflect either a genuine reduction in the number of affected components or differences in scanner coverage and component-identification mechanisms. Previous research has also demonstrated that image popularity, pull counts, user ratings, and update recency cannot be treated as reliable independent indicators of vulnerability exposure [18].
The interpretation of vulnerability severity is further complicated by differences between scanning tools. Scanner outputs depend on the vulnerability databases, package metadata, component-cataloguing methods, matching rules, and severity sources used by each tool. Consequently, the same container image may receive different vulnerability counts and severity distributions depending on the scanner. Differences may also occur when one tool identifies vulnerabilities in operating-system packages while another detects additional findings in application libraries or compiled components. For this reason, comparative container assessment should consider both aggregate counts and the structure of the reported vulnerability profile.
The technical consequences of a container vulnerability also depend on the isolation model of the environment in which the image is deployed. Unlike conventional virtual machines, containers share the kernel of the host operating system [28]. This architecture generally reduces resource overhead but creates a common dependency on the security of the kernel, container runtime, and isolation configuration. Vulnerabilities or configuration weaknesses affecting these components may contribute to container escape, privilege escalation, unauthorized access to host resources, or lateral movement between services [16]. The consequences may extend beyond the compromised container itself. Documented campaigns targeting exposed and insufficiently secured container infrastructures demonstrate that vulnerable or misconfigured Docker environments may be exploited for unauthorized resource consumption, malware deployment, and cryptojacking activities [36]. Such incidents illustrate the need to consider vulnerability severity together with system exposure, runtime configuration, available exploits, and the operational role of the affected service.
In containerized IoT platforms supporting sustainable energy systems, vulnerabilities may affect services responsible for acquiring, transmitting, storing, and processing operational or metering data. Exploitation may consequently disrupt energy-monitoring functions, compromise the integrity of measurements, expose access credentials, or reduce the availability of communication between edge and cloud components. Severity assessment should therefore form part of a broader risk-management process combining vulnerability scanning, component traceability, secure configuration, continuous image rebuilding, and automated deployment policies.
2.3. Previous Research on Container Image Vulnerability Scanning
An important challenge in container security is not only the presence of vulnerabilities but also the way in which developers interpret and act on scanner-generated reports. Kim et al. evaluated the usability of leading Docker image vulnerability scanners, including Trivy and Grype, and identified 239 issues related to report presentation and user interaction [26]. Their findings indicate that scanner outputs may overwhelm engineering teams with large volumes of alerts while providing insufficient support for vulnerability prioritization and remediation. The principal categories of the identified usability problems are summarized in Figure 2.
Figure 2.
Categories of usability problems identified in container vulnerability scanner reports. Source: Authors’ own elaboration based on Kim et al. [26].
This challenge is further intensified by differences in vulnerability detection coverage across software layers. Javed and Toor demonstrated that vulnerability scanners analysing Java-based container images were more effective in identifying operating-system packages than application-level libraries and dependencies [24]. As a result, scanner reports could contain numerous operating-system alerts while omitting vulnerabilities embedded in application components. The comparison presented in Figure 3 illustrates the difference between the detection coverage achieved for operating-system and application-level vulnerabilities.
Figure 3.
Detection coverage of operating-system and application-level vulnerabilities by selected scanners. Source: Authors’ own elaboration based on Javed and Toor [24].
The high number of vulnerabilities reported at the operating-system level is closely associated with technical lag and software ageing in container environments. Zerouali et al. demonstrated that delays between the release of updated packages by Linux distribution maintainers and their inclusion in container base images may extend the period of exposure to known vulnerabilities [22]. This problem may be intensified by the layered structure of container images, because outdated components inherited from base layers can remain present in subsequently built images. O’Donoghue et al. further demonstrated that vulnerability accumulation and insufficient update frequency represent persistent challenges in software supply-chain management [25].
Empirical studies demonstrate the scale of these risks in public container registries. Shu et al., in their study of the DIVA framework, showed that official Docker Hub images may retain known vulnerabilities and remain outdated for extended periods [17]. More recent large-scale evidence was provided by Shi et al., who developed the DITector framework and analysed 33,952 influential images selected from the Docker Hub ecosystem. Known vulnerabilities were identified in 93.7% of the analysed images, while 4437 images contained exposed secrets and 31 executed malicious files. The authors also demonstrated that threats present in base images may propagate to downstream images through software dependency relationships [37,38].
One response to this problem in DevSecOps practice is the use of minimized base images. Minimalist distributions, such as Alpine Linux, contain fewer operating-system packages and system libraries than standard image variants, which may reduce the number of inherited vulnerabilities and limit the potential attack surface [23]. A smaller number of system-level components can also reduce the volume of scanner alerts and facilitate the prioritization of findings by engineering teams [24,26]. However, image minimization does not guarantee the removal of application-level vulnerabilities or a proportional decrease in High- and Critical-severity findings. Aggregate vulnerability counts and severity distributions should therefore be analysed jointly when comparing standard and minimized image variants.
Previous research also demonstrates that the vulnerability profile of a software artifact may depend on the scanner, vulnerability data sources, and component-matching rules applied during the analysis. O’Donoghue et al. used Trivy and Grype to analyse 1151 Software Bills of Materials obtained from open-source repositories, confirming the relevance of multi-tool assessment in software supply-chain security [25]. Studies comparing scanner outputs using the Jaccard coefficient and the Tversky measure have further shown that similar aggregate counts do not necessarily correspond to identical sets of detected CVEs [27].
Nevertheless, the available literature provides limited evidence from standardized studies that simultaneously compare standard and minimized variants of the same technologies, cover several software architecture layers, employ multiple scanners under identical temporal conditions, and evaluate total vulnerability counts, severity distributions, and differences between the detected CVE sets. Addressing these dimensions jointly is necessary to determine whether image minimization produces a consistent improvement in the reported vulnerability profile and whether conclusions remain stable across different scanning tools.
2.4. Automated Vulnerability Scanning in DevSecOps Processes
DevSecOps integrates security activities into the entire software development lifecycle rather than treating security verification as a separate stage performed immediately before deployment. This approach is closely associated with the Shift-Left principle, according to which security weaknesses should be identified as early as possible during design, development, build, and testing. Early detection reduces the probability that vulnerable components will become embedded in production architectures and facilitates remediation before software artifacts are distributed across cloud, edge, or on-premises environments.
In containerized systems, automated security assessment should begin with the selection of the base image and continue throughout the build, registry, deployment, and maintenance stages. Software Composition Analysis identifies packages, libraries, and transitive dependencies included in an image and compares them with databases of known vulnerabilities. Trivy supports the analysis of container images, filesystems, configuration files, exposed secrets, and software dependencies [20]. Grype can analyse container images, directories, filesystems, and existing Software Bills of Materials [21]. Both tools can be integrated into CI/CD pipelines and configured to generate machine-readable reports or prevent the deployment of artifacts that do not satisfy predefined security requirements.
Container-image scanning represents only one element of a broader DevSecOps control framework. Static Application Security Testing examines source code and configuration files without executing the application, enabling the early detection of insecure coding patterns, hard-coded credentials, and configuration weaknesses. Dynamic Application Security Testing evaluates a running service from an external perspective and may identify weaknesses in authentication, input validation, exposed interfaces, and server configuration [39]. These methods address different stages and layers of the software lifecycle and should therefore be treated as complementary rather than interchangeable. Container security additionally requires verification of runtime configuration, privileges, exposed ports, mounted resources, network policies, and orchestration settings [40].
Automated vulnerability scanning should also be combined with mechanisms supporting component transparency and artifact integrity. An SBOM provides a structured inventory of packages, libraries, and dependencies included in a container image, allowing organisations to identify the services affected by newly disclosed vulnerabilities [19]. SLSA provenance records provide information about the origin of an artifact, its build process, and the inputs used during its creation [33]. Cryptographic signing, for example using Sigstore and Cosign, enables verification of image identity and detection of unauthorized artifact modification [34]. These controls address different dimensions of software supply-chain security: scanning identifies known vulnerabilities, an SBOM documents included components, provenance describes the build process, and signatures support artifact-integrity verification [41,42,43,44].
The effectiveness of automated scanning nevertheless depends on the scope and quality of the tools used. Vulnerability scanners may apply different package-cataloguing mechanisms, vulnerability databases, severity sources, identifier formats, and component-matching rules. Consequently, two tools analysing the same container image may produce different vulnerability counts and different sets of CVE identifiers. The problem is not limited to detection coverage. Scanner reports may contain large numbers of alerts and provide insufficient support for prioritization and remediation, increasing the risk of alert fatigue among development and security teams [26]. Comparative research also demonstrates that similar aggregate vulnerability counts do not necessarily correspond to equivalent sets of detected vulnerabilities [27].
For this reason, automated deployment policies should not rely exclusively on the total number of scanner findings. Security gates may incorporate several criteria, including vulnerability severity, availability of a fixed package version, exposure of the affected component, the operational function of the service, and organisational risk acceptance. A container image containing a large number of Low-severity findings may require a different response from an image containing a small number of Critical-severity vulnerabilities. Similarly, a reduction in the total number of reported vulnerabilities after image minimization does not necessarily indicate a proportional reduction in the most severe security exposure.
A representative DevSecOps workflow for containerized software may therefore comprise the following stages: selection of an approved base image, creation of the container artifact, generation of an SBOM, vulnerability scanning, verification of provenance and signatures, application of a security policy gate, deployment to the target environment, and continuous rescanning. When a newly disclosed vulnerability affects a deployed component, the image should be rebuilt using updated dependencies, rescanned, signed, and redeployed. This process reflects the dynamic nature of vulnerability databases, because the security profile of an unchanged container image may evolve as new CVEs are published.
The use of more than one scanner can provide additional evidence during security assessment, particularly when the tools employ different component-identification and vulnerability-matching mechanisms. Multi-tool assessment does not guarantee the identification of every vulnerability and should not be treated as a substitute for manual validation or runtime security controls. However, differences between scanner outputs may reveal tool-specific blind spots and support a more informed prioritization of remediation activities. The comparison of scanner results should therefore include not only aggregate counts but also severity distributions and the overlap between unique CVE sets.
In containerized IoT platforms supporting sustainable energy systems, DevSecOps controls may be applied to software services responsible for data acquisition, communication, storage, analytics, and energy-management functions. Automated scanning and deployment policies can reduce the probability that vulnerable images will be introduced into edge gateways, cloud platforms, or services processing operational and metering data. However, effective policies require evidence concerning how image variants and scanner selection affect the reported vulnerability profile. This requirement provides the direct justification for the experimental comparison of standard and minimized container images using Trivy and Grype conducted in the present study.
3. Materials and Methods
3.1. Sample Selection, Image Classification, and Pair Comparability
The research sample comprised 13 container technologies selected to represent three software layers commonly used in containerized cloud–edge and Internet of Things platforms: data storage and processing, communication, proxy and API services, and application runtime environments. The selection was purposive and was based on the availability of an official or vendor-maintained container image, compatibility with both vulnerability scanners used in the study, relevance to the defined software architecture layers, and the availability of reproducible image metadata.
The sample included five data-storage and processing technologies—CouchDB, InfluxDB, Cassandra, Redis, and Neo4j—four communication, proxy, and API technologies—Traefik, Kong, Caddy, and HAProxy—and four application runtime environments—PHP-FPM, Ruby, Dart, and .NET SDK. The technologies were treated as transferable software building blocks that may support data acquisition, communication, storage, processing, and management functions in digital energy platforms. The sample was not intended to provide a statistically representative survey of the entire energy-IoT ecosystem.
The study was deliberately limited to the three software layers defined above. Consequently, MQTT brokers, stream-processing platforms, time-series data agents, and device-management services were outside the experimental scope. Their exclusion limits the generalizability of the findings to the complete energy-IoT technology ecosystem and is therefore acknowledged as a direction for future extension of the research sample.
The final experimental sample comprised 22 distinct container images. Each image was independently analysed using Trivy and Grype, resulting in 44 vulnerability-scanning operations. The use of 22 images, rather than 26 nominal image variants, reflects the fact that a distinct minimized or alternative image was not available for every analysed technology. Repeated scans of the same image digest were not treated as separate standard–minimized comparisons.
After retrieval, each image was identified using its immutable SHA-256 repository digest. The recorded metadata included the complete repository and tag, application version, image digest, creation date, image size, architecture, retrieval date, and base operating-system distribution. Software Bills of Materials were also generated to verify the package composition and to support the assessment of whether the standard and alternative images contained comparable application and dependency versions. The complete metadata of the 22 analysed container images are presented in Table 2.
Table 2.
Metadata of the 22 analysed container images.
To prevent differences in application versions from being incorrectly interpreted as effects of image minimization, the analysed images were divided into four comparability classes.
The first class comprised strictly matched pairs in which the standard and minimized images contained the same principal application version but used different base-image variants. This group included Redis 8.8.0 and 8.8.0-alpine, Caddy 2.9.1 and 2.9.1-alpine, HAProxy 3.0.2 and 3.0.2-alpine, Ruby 3.4.1 and 3.4.1-alpine, and .NET SDK 8.0 and 8.0-alpine. These five pairs formed the primary sample used to assess the effect of the image variant under controlled application-version conditions.
The second class comprised a partially matched pair: CouchDB 3.5.2.1 and CouchDB 3.5.2.1-nouveau. Although the principal version identifier was consistent, the nouveau variant introduced a different dependency composition. This pair was therefore retained for descriptive analysis but was not interpreted as a pure comparison of base-image minimization.
The third class included version-mismatched exploratory pairs: InfluxDB 3.10.3-core and 2.7.11-alpine, Neo4j 5.21.0 and 5.12.0-alpine, and PHP-FPM 8.5-fpm and 8.3.11-fpm-alpine. In these cases, differences in scanner outputs may reflect both the base operating system and the application or dependency version. These pairs were included in descriptive and scanner-agreement analyses but excluded from inferential conclusions concerning the isolated effect of image minimization.
The fourth class comprised unpaired images for which a distinct and technically appropriate alternative variant was not included in the experiment: Cassandra 4.1.20, Traefik v3.7.8, Kong 3.9.3, and Dart 3.11.0. These images contributed to the comparison of Trivy and Grype, the analysis of unique CVE sets, and the assessment of scanner-specific differences, but they were not used in standard–minimized paired comparisons.
Table 3 summarizes the comparability classification of the analysed images and identifies which pairs were included in the primary paired analysis, descriptive analysis, or scanner-agreement analysis. This distinction separates the full scanner-comparison sample from the strictly matched subset used to evaluate the effects of image variants and reduces the risk of attributing software-version or dependency differences solely to image minimization.
Table 3.
Comparability classification and analytical use of the analysed container images.
3.2. Test Bench Architecture and Runtime Environment
All experimental procedures, including container-image retrieval, metadata registration, local storage, Software Bill of Materials generation, vulnerability scanning, and report collection, were conducted in a dedicated virtual environment. The isolated test environment ensured that all images were processed under the same hardware and runtime conditions and reduced interference from unrelated software components.
The test environment was implemented using the Microsoft Hyper-V hypervisor. The virtual machine was configured with the following resources:
- –
- operating system: Windows 11 Pro, 64-bit;
- –
- memory: 8 GB RAM;
- –
- processor allocation: four virtual CPUs;
- –
- storage: 150 GB SSD-based VHDX virtual disk.
The container runtime was provided by Docker Desktop version 4.77.0, operating with the Windows Subsystem for Linux 2 backend and an Ubuntu Linux distribution. WSL2 provided the Linux kernel environment required to retrieve and analyse Linux-based container images while maintaining the isolation of the experimental platform.
All analysed images used the linux/amd64 architecture and were retrieved on 14 June 2026 from official or vendor-maintained public repositories. After each image had been retrieved, its immutable SHA-256 repository digest was recorded together with the complete repository name and tag, creation date, compressed image size, architecture, and base operating-system distribution. The complete image metadata are reported in Table 2.
The experiment involved static analysis of container-image contents. The services contained in the images were not deployed as operational applications, and the study did not include penetration testing, runtime exploitation, network attack simulation, or workload-based reachability analysis. The assessment covered software components, operating-system packages, application dependencies, and known vulnerabilities identifiable from image contents, metadata, scanner reports, and generated component inventories.
Each image was processed as a separate experimental unit. Raw machine-readable reports were retained for subsequent extraction of scanner findings, unique CVE identifiers, affected packages, severity levels, and remediation information. A zero value in a scanner report was interpreted as the absence of findings reported by that specific tool under the applied configuration rather than as evidence that the analysed image was free from vulnerabilities.
To limit the influence of previously downloaded layers and cached artifacts, each image was removed from the local environment after its metadata, component inventory, and vulnerability reports had been generated. Unused Docker images, layers, and build artifacts were subsequently removed using the following command:
docker system prune -a -f
The same processing procedure was applied to all 22 container images. This produced a consistent experimental environment for the 44 vulnerability scans performed using Trivy and Grype.
3.3. Scanner Configuration and Vulnerability Classification
Two open-source vulnerability scanners, Trivy and Grype, were used to determine whether the reported vulnerability profile depended on the selected scanning tool. Both tools support the analysis of locally stored container images and the export of machine-readable results in JSON format [20,21].
The experiment was conducted using Trivy version 0.71.0 and Grype version 0.114.0. Both scanners analysed the same locally stored image artifact identified by its immutable SHA-256 repository digest. This procedure ensured that differences between the scanner outputs were not caused by changes in mutable registry tags between separate image downloads.
Trivy scans were performed using the following command:
trivy image --scanners vuln --format json --output <output_file.json> <image_reference>
Grype scans were performed using the following command:
grype <image_reference> -o json > <output_file.json>
No severity filter was applied during the scanning stage. Findings classified as Critical, High, Medium, and Low were therefore retained for subsequent analysis. Vulnerabilities without an available fixed version were not excluded. Consequently, the scanner outputs contained both fixable and currently unfixable findings where such information was reported by the corresponding tool.
No command-line option was used to disable the identification of supported language-specific dependencies. Operating-system packages and supported application-level packages identified under the default cataloguing configuration of each scanner were therefore retained in the JSON reports. Differences in package identification, package URLs, CPE mappings, vulnerability-database mappings, and application-dependency coverage were treated as potential sources of disagreement between Trivy and Grype.
The vulnerability databases used by both scanners were retrieved and applied on 14 June 2026. Because vulnerability intelligence is continuously updated, all direct comparisons were restricted to reports generated during the same experimental session. The principal configuration parameters applied during the experiment are summarized in Table 4.
Table 4.
Configuration of the vulnerability scanners used in the study.
The analysis retained the severity categories assigned by the individual scanners. These classifications were not recalculated using a single external severity source because the differences between scanner-assigned severities formed part of the tool-dependent vulnerability profile investigated in the study.
Where CVSS v3.x numerical scores were available, the qualitative levels were interpreted according to the following ranges [45]:
- –
- Critical: 9.0–10.0;
- –
- High: 7.0–8.9;
- –
- Medium: 4.0–6.9;
- –
- Low: 0.1–3.9.
Scanner-assigned severity represents the technical characteristics and potential impact of a vulnerability record, but it does not independently determine the probability of exploitation in a specific operational environment. Therefore, CVSS severity was complemented in the subsequent analysis by remediation availability, EPSS scores, and inclusion in the CISA Known Exploited Vulnerabilities catalogue.
Total scanner findings and unique CVE identifiers were treated as separate measures. A scanner finding represented an individual vulnerability-to-component mapping and could occur more than once when the same CVE affected multiple packages or components. Unique CVE counts were obtained after deduplication of vulnerability identifiers within each scanner–image combination.
3.4. Experimental Procedure and Automated Data Collection
The experimental procedure was implemented as an automated workflow executed using a dedicated Bash script in the WSL2 environment. Automation ensured that the same sequence of image retrieval, vulnerability scanning, report generation, data extraction, and environment cleanup was applied to every analysed container image.
All 22 distinct container images were retrieved and scanned on 14 June 2026. Each image was downloaded from its official or vendor-maintained public repository using the full repository name and tag specified in Table 2. Immediately after retrieval, the corresponding SHA-256 repository digest was recorded to identify the immutable image artifact used in the experiment.
Each experimental cycle comprised the following stages:
- Image retrieval and identification.The Docker daemon downloaded the specified container image to the local environment. The complete image reference and SHA-256 digest were recorded together with the metadata presented in Table 2.
- Trivy scanning.The locally stored image was scanned using Trivy. The results were exported as a separate JSON report containing the vulnerability identifiers, affected packages, installed versions, scanner-assigned severity levels, and available fixed versions where reported.
- Grype scanning.The same locally stored image artifact was subsequently scanned using Grype. The results were also exported in JSON format. Scanning the same local artifact ensured that the direct comparison between the tools was not affected by a registry-tag update occurring between the two scans.
- Raw-report verification.The generated JSON files were checked for existence and non-zero file size. A missing or empty report was classified as a scanning or report-generation error and was not interpreted as an image containing zero vulnerabilities.
- Automated data extraction.The JSON reports were processed using jq. Scanner findings were initially aggregated according to image, scanner, and severity category: Critical, High, Medium, and Low. The aggregated results were exported to a structured semicolon-separated CSV file.
- Retention of raw reports.The original Trivy and Grype JSON reports were retained to support the subsequent extraction of unique CVE identifiers, affected packages, installed and fixed versions, and the set-based comparison of scanner outputs.
- Environment cleanup.After both reports had been generated and verified, the analysed image was removed from the local Docker environment. Unused layers, cached images, and other Docker artifacts were removed after completion of the experimental cycles using:docker system prune -a -f
Each of the 22 container images was processed once by each scanner, producing 44 scanner–image observations. A scanner result equal to zero was interpreted only as the absence of vulnerability findings reported by that tool under the applied configuration. It was not interpreted as proof that the image was free from vulnerabilities.
3.5. Data Processing and Quantitative Analysis
The raw JSON scanner reports and Software Bills of Materials were transformed into linked analytical datasets. The unit of observation in the full scanner-comparison sample was a scanner–image combination. The complete sample therefore comprised 44 observations obtained from 22 images analysed independently using Trivy and Grype.
Four complementary representations of the vulnerability results were retained: total scanner findings, unique CVE identifiers, severity distributions, and operationally prioritized vulnerabilities. These measures were analysed separately because a single CVE may be reported more than once when it is mapped to several packages, files, or components within the same image. The operational-prioritization analysis was restricted to the six selected image variants presented in Section 4.4.
3.5.1. Vulnerability-Count Representations
Two complementary count representations were used in the quantitative analysis: total scanner findings and unique CVE identifiers. They were analysed separately because a single CVE may be mapped to several packages, files, or components within the same container image.
A scanner finding was defined as an individual vulnerability-to-component mapping contained in the output of Trivy or Grype. Total findings therefore represented the complete number of records reported by a scanner before deduplication.
A unique CVE was defined as a distinct CVE identifier reported for a given scanner–image combination. Repeated occurrences of the same CVE within several packages or components were counted once in the unique-CVE dataset.
Package-normalized vulnerability density was not included in the final analysis because complete package-level summary results were not retained for all analysed images. Findings normalized by compressed image size were also excluded from the final results because image size was unavailable for selected images and does not directly represent the number, type, or operational reachability of software components. The final quantitative comparison therefore focused on total scanner findings and unique CVE identifiers, which were available consistently for all 22 images.
3.5.2. Assessment of Strictly Matched Image Pairs
The inferential assessment of image minimization was restricted to the five strictly matched pairs identified in Table 3: Redis, Caddy, HAProxy, Ruby, and .NET SDK. Each pair contained the same principal application version in a standard and minimized image variant.
CouchDB was treated as a partially matched pair, while InfluxDB, Neo4j, and PHP-FPM were treated as version-mismatched exploratory pairs. These images were retained in descriptive and scanner-agreement analyses but were excluded from statistical conclusions concerning the isolated effect of image minimization.
For each strictly matched pair and scanner, the relative change between the standard and minimized variants was calculated as:
where represented one of the following measures:
- –
- total scanner findings;
- –
- unique CVEs;
- –
- Critical-severity CVEs;
- –
- combined High- and Critical-severity CVEs;
A positive value of indicated a reduction in the minimized image, zero indicated no change, and a negative value indicated an increase.
The proportion of Critical-severity vulnerabilities was calculated as:
where was the number of unique Critical-severity CVEs and was the total number of unique CVEs reported for the corresponding scanner–image combination. The proportion was treated as not applicable when no unique CVE was reported.
Because the vulnerability counts were strongly skewed and the standard and minimized images formed paired observations, the differences were assessed using an exact Wilcoxon signed-rank test. The analysis was performed separately for Trivy and Grype. Median paired differences, percentage changes, rank-biserial effect sizes, and 95% confidence intervals for paired differences were reported together with the test results. The 95% confidence intervals for the median paired differences were estimated using percentile bootstrap resampling with 10,000 repetitions. Because the strictly matched sample contained five technology pairs, statistical significance was not interpreted independently of effect magnitude and uncertainty. The direction, consistency, and size of the observed effects were therefore considered together with the exact test results and confidence intervals.
3.5.3. Agreement Between Trivy and Grype CVE Sets
For each of the 22 images, let denote the set of unique CVE identifiers reported by Trivy and the corresponding set reported by Grype.
The overlap between the scanner outputs was assessed using the Jaccard similarity coefficient:
The coefficient ranges from 0 to 1. A value of 0 indicates that the scanners reported no common CVE identifiers, whereas a value of 1 indicates identical sets.
Scanner asymmetry was evaluated using the Tversky index:
Three Tversky-index variants were calculated. The symmetrical variant used and , assigning equal weights to CVEs reported exclusively by Trivy and exclusively by Grype. The first directional variant used and , assigning a greater penalty to CVEs reported exclusively by Trivy. The second directional variant used and , assigning a greater penalty to CVEs reported exclusively by Grype.
The symmetrical variant was calculated as:
The Trivy-weighted directional variant was calculated as:
The Grype-weighted directional variant was calculated as:
The following values were also reported for every image:
- –
- the number of common CVEs;
- –
- the number of CVEs reported only by Trivy;
- –
- the number of CVEs reported only by Grype;
- –
- the Jaccard coefficient;
- –
- the symmetrical Tversky index and the two weighted directional variants.
The calculations were performed for the complete unique-CVE sets and separately for Critical, High, Medium, and Low severity categories. Severity-specific comparisons used the classifications assigned by the corresponding scanner. Consequently, differences in severity sources and classification rules formed part of the observed scanner disagreement.
When both scanners reported empty CVE sets for a given comparison, the similarity coefficient was recorded as not applicable rather than interpreted as evidence of perfect agreement. When only one set was empty, the Jaccard coefficient was equal to zero.
3.5.4. Operational Vulnerability Prioritization
To complement CVSS severity, the unique CVE records were enriched using three additional indicators:
Remediation availability, indicating whether a corrected package or component version was reported;
EPSS, representing the estimated probability of exploitation activity within the following 30 days;
CISA Known Exploited Vulnerabilities catalogue inclusion, identifying vulnerabilities for which exploitation in real-world attacks has been confirmed.
The operational analysis separately reported:
- –
- the number of High- and Critical-severity unique CVEs;
- –
- the number of High- and Critical-severity CVEs with an available fix;
- –
- the number of CVEs included in the CISA KEV catalogue;
- –
- the number of CVEs with an EPSS score of at least 0.10;
- –
- the number of CVEs without an available fixed version;
- –
- the number of vulnerabilities satisfying more than one prioritization criterion.
An unavailable fixed version was not interpreted as evidence of acceptable risk. An unfixed vulnerability could still require immediate compensating controls when it was included in CISA KEV, had a high EPSS score, or affected an operationally important component.
The study did not perform application-level reachability analysis or runtime exploitation testing. The prioritization results therefore indicate evidence of practical exploitation potential and remediation urgency, but they do not confirm that a vulnerability was reachable in every possible deployment configuration.
3.5.5. Scope of Statistical Interpretation
The five strictly matched pairs constituted the primary sample for evaluating the effect of minimized image variants. Partially matched and version-mismatched pairs were interpreted descriptively and were not included in inferential conclusions concerning the isolated effect of minimization.
All 22 images were included in the comparison of Trivy and Grype because scanner agreement could be assessed independently of the availability of a corresponding minimized variant.
The previously used Pearson correlation between aggregate findings and Critical-severity findings was not treated as primary evidence of the effect of minimization. The principal analysis instead considered paired changes in total scanner findings, Critical-severity CVEs, combined High- and Critical-severity CVEs, Critical-severity proportions, and unique CVE identifiers.
All statistical tests were two-sided, and the results were interpreted using an alpha level of 0.05. Exact p-values, effect sizes, confidence intervals, sample sizes, and the number of non-zero paired differences were reported.
3.6. Verification of Selected CVE Records and Anomalous Scanner Outputs
Anomalous scanner outputs were identified using the complete comparison of the vulnerability findings reported by Trivy and Grype for the 22 analysed container images. Particular attention was given to images for which one or both scanners reported no vulnerability findings and to cases characterised by substantial differences between the numbers of findings reported by the two tools.
The assessment combined three existing analytical datasets. First, the aggregate scanner-results dataset was used to identify zero-result cases and the largest numerical differences between Trivy and Grype. Second, the unique-CVE datasets and the corresponding Jaccard and Tversky results were used to determine whether numerical differences were accompanied by differences in the actual CVE identifiers reported by the scanners. Third, selected vulnerability records were examined using the detailed data collected for individual CVEs.
For the selected CVE records, the verification covered:
- − the CVE identifier;
- − the scanner-assigned CVSS severity;
- − the EPSS score;
- − inclusion in the CISA Known Exploited Vulnerabilities catalogue;
- − remediation status;
- − the affected package name;
- − the installed package version;
- − the available fixed version.
The aggregated operational-risk indicators are reported in the table presenting the numbers of High- and Critical-severity CVEs, vulnerabilities with available fixes, CISA KEV entries, vulnerabilities exceeding the adopted EPSS threshold, and unfixed vulnerabilities.
The comparison was used to distinguish between three situations:
- an image for which both scanners reported no matched vulnerability records;
- an image for which only one scanner reported vulnerability records;
- an image for which both scanners reported findings but differed substantially in their counts or unique-CVE sets.
A zero result was interpreted as the absence of vulnerability records matched by the corresponding scanner under the applied configuration and vulnerability-database snapshot. It was not interpreted as evidence that the container image was inherently free from security weaknesses.
Differences between the tools were interpreted in conjunction with the unique-CVE overlap and the available package-level information. Where the scanners reported different CVE sets for the same image, the result was treated as evidence of tool-dependent component identification, vulnerability mapping, or severity classification rather than as proof that one scanner provided a complete reference result.
The verification was limited to the static information available in the scanner reports and the external vulnerability-intelligence records used in the study. Runtime exploitability, application-level reachability, and penetration testing were outside the scope of the experiment.
4. Results
4.1. Overall Vulnerability Findings in the Final Sample
The final experimental sample comprised 22 distinct container images representing 13 technologies. Each image was analysed once using Trivy and once using Grype, resulting in 44 scanner–image observations. Table 5 presents the total number of vulnerability findings reported for each image and scanner.
Table 5.
Summary of scanner-reported vulnerability findings for the investigated container technologies.
The values shown in Table 5 represent all vulnerability-to-component mappings contained in the scanner reports before CVE deduplication. Consequently, the same CVE may contribute more than one finding when it affects several packages or components within the same image. Total findings were therefore treated as a measure of scanner output volume rather than as the number of distinct vulnerabilities. Unique CVE sets and scanner agreement are analysed separately in Section 4.5.
Across the complete sample, Trivy reported 7006 vulnerability findings, whereas Grype reported 2299 findings. The difference between these aggregate totals was strongly influenced by individual images containing large numbers of repeated vulnerability-to-component mappings. The most pronounced example was ruby:3.4.1, for which Trivy reported 4827 findings and Grype reported 606.
The scanners produced different total findings for 18 of the 22 analysed images. Trivy reported the higher value for nine images, Grype reported the higher value for nine images, and the tools produced equal totals for four images. The equal results concerned cases in which both scanners reported zero findings: influxdb:2.7.11-alpine, neo4j:5.12.0-alpine, mcr.microsoft.com/dotnet/sdk:8.0, and mcr.microsoft.com/dotnet/sdk:8.0-alpine.
A scanner-specific zero result was observed for redis:8.8.0-alpine, for which Trivy reported no findings and Grype reported two. Such results indicate that no vulnerability records were matched by the corresponding scanner under the applied configuration and database snapshot. They do not demonstrate that the image was inherently free from security weaknesses.
The substantial variation in scanner outputs confirms that aggregate counts alone are insufficient for assessing the vulnerability profile of a container image. The subsequent analyses therefore distinguish between total findings, unique CVE identifiers, severity distributions, remediation availability, and the overlap between the CVE sets reported by Trivy and Grype.
4.2. Distribution of Vulnerability Findings by Software Category
The distribution of scanner-reported vulnerability findings differed substantially across the three software categories represented in the sample. As shown in Table 5, the database category comprised nine images, the WWW/API/proxy category comprised six images, and the application-runtime category comprised seven images. The category-level totals should therefore be interpreted descriptively, because the categories contained different numbers of images and different proportions of paired and unpaired variants.
For the database category, Trivy reported 759 vulnerability findings, whereas Grype reported 625. The largest image-level totals in this category were obtained for neo4j:5.21.0 and cassandra:4.1.20. Trivy reported 264 findings for the standard Neo4j image and 202 for Cassandra, whereas Grype reported 145 and 194 findings, respectively. By contrast, both scanners reported zero findings for influxdb:2.7.11-alpine and neo4j:5.12.0-alpine. Trivy also reported zero findings for redis:8.8.0-alpine, while Grype reported two.
The WWW/API/proxy category produced 458 findings in Trivy and 657 in Grype. The difference was influenced primarily by caddy:2.9.1, caddy:2.9.1-alpine, and kong:3.9.3, for which Grype reported higher totals than Trivy. Both Caddy variants produced identical scanner totals despite having different image digests and base operating-system distributions: Trivy reported 128 findings for each image, whereas Grype reported 205 for each image. For HAProxy, the minimized Alpine image produced substantially fewer findings than the standard image in both scanners.
The application-runtime category accounted for the largest proportion of all reported findings. Trivy reported 5789 findings in this category, representing approximately 82.6% of its complete output, whereas Grype reported 1017 findings, corresponding to approximately 44.2% of its total. This result was dominated by ruby:3.4.1, for which Trivy reported 4827 findings and Grype reported 606. The standard Ruby image alone accounted for approximately 83.4% of the Trivy findings and 59.6% of the Grype findings within the runtime category.
Large scanner differences were also observed for PHP-FPM. Trivy reported 623 findings for php:8.5-fpm, whereas Grype reported 57. For the alternative php:8.3.11-fpm-alpine image, the direction was reversed: Trivy reported 50 findings and Grype reported 112. Because these two PHP-FPM images contain different application versions, the observed difference cannot be attributed solely to the use of an Alpine-based image.
The category-level results demonstrate that scanner output volume was strongly affected by individual image composition and by a small number of high-count cases. Consequently, aggregate category totals do not provide independent evidence of the effect of image minimization. The matched-pair comparison presented in Section 4.3 therefore considers only image pairs containing the same principal application version.
4.3. Paired Comparison of Strictly Matched Image Variants
The assessment of the effect of image minimization was restricted to the five strictly matched pairs identified in Table 3: Redis, Caddy, HAProxy, Ruby, and .NET SDK. In each pair, the standard and minimized images represented the same principal application version. CouchDB, InfluxDB, Neo4j, and PHP-FPM were excluded from this inferential comparison because their image pairs differed in dependency composition or application version.
Table 6 presents the total scanner-reported findings for the strictly matched image pairs and the relative change between the standard and minimized variants. Positive percentage values indicate a reduction in the minimized image.
Table 6.
Paired comparison of total scanner-reported findings for strictly matched image variants.
Three of the five strictly matched pairs—Redis, HAProxy, and Ruby—showed reductions in total findings for both scanners. Caddy produced identical totals in its standard and Alpine-based variants, whereas both .NET SDK images produced zero findings in Trivy and Grype.
For Redis, the number of Trivy findings decreased from 66 to zero, while the Grype result decreased from 39 to 2. HAProxy findings decreased from 160 to 31 in Trivy and from 132 to 39 in Grype, corresponding to reductions of 80.6% and 70.5%, respectively. The largest reduction was observed for Ruby: Trivy findings decreased from 4827 to 34, and Grype findings decreased from 606 to 44.
In aggregate, the total number of findings decreased from 5181 to 193 for Trivy and from 982 to 290 for Grype. These values correspond to reductions of 96.3% and 70.5%, respectively. However, the aggregate result was strongly influenced by the standard Ruby image, which accounted for most of the Trivy findings in the strictly matched sample. Aggregate totals were therefore not treated as independent evidence of a uniform minimization effect.
The median paired difference was 66 findings for Trivy and 37 findings for Grype. The 95% bootstrap confidence intervals were wide—0 to 4793 findings for Trivy and 0 to 562 findings for Grype—reflecting the small sample size and the influence of the Ruby image.
Zero differences occurred for Caddy and .NET SDK. After these tied observations were excluded, the exact two-sided Wilcoxon signed-rank test was based on three non-zero pairs. All three differences represented reductions in the minimized variants. The test produced for both Trivy and Grype. The paired rank-biserial effect size was , indicating a consistently directed effect among the non-zero pairs. Nevertheless, the result did not reach statistical significance because only three informative paired differences were available.
The results therefore provide descriptive evidence that minimized variants can substantially reduce scanner output for selected technologies, but they do not support a universal or statistically conclusive effect across all software components. The unchanged Caddy results and the zero findings for both .NET SDK variants demonstrate that the effect depends on the image composition and on the scanner’s component-identification and vulnerability-matching mechanisms.
4.4. High- and Critical-Severity Findings and Operational Prioritization
Aggregate vulnerability counts and CVSS severity levels describe the volume and potential technical impact of scanner findings, but they do not independently determine remediation urgency. Therefore, selected unique-CVE records were enriched with three operational indicators: the availability of a corrected package version, the Exploit Prediction Scoring System score, and inclusion in the CISA Known Exploited Vulnerabilities catalogue.
The operational-prioritization dataset covered six selected image variants: couchdb:3.5.2.1, couchdb:3.5.2.1-nouveau, influxdb:3.10.3-core, influxdb:2.7.11-alpine, redis:8.8.0, and redis:8.8.0-alpine. The analysis considered the number of High- and Critical-severity CVEs, the availability of fixes, CISA KEV inclusion, EPSS values exceeding 0.10, and the number of vulnerabilities without an available corrected version. The results are presented in Table 7.
Table 7.
Operational prioritization of vulnerabilities in selected container-image variants using severity, remediation availability, EPSS, and CISA KEV indicators.
The standard CouchDB image contained 44 High- and Critical-severity CVEs, of which 39 had an available fix and five had no available corrected version. Four CVEs exceeded the adopted EPSS threshold, and one CVE was included in the CISA KEV catalogue. The minimized CouchDB variant contained 31 High- and Critical-severity CVEs, including 28 with an available fix and three without an available fix. Two CVEs exceeded the EPSS threshold, while no CISA KEV entry was identified.
The standard InfluxDB image contained three High- and Critical-severity CVEs, all of which had an available fix. No CVE exceeded the EPSS threshold or was included in the CISA KEV catalogue. The alternative InfluxDB image contained no High- or Critical-severity CVEs in the analysed dataset. Because the two InfluxDB images represented different application versions, this difference was interpreted descriptively and was not attributed solely to image minimization.
The standard Redis image contained 22 High- and Critical-severity CVEs. An available fix was identified for 19 records, three CVEs had no available fix, and one CVE exceeded the EPSS threshold. The strictly matched minimized Redis image contained no High- or Critical-severity CVEs in the analysed dataset.
The results show that CVSS severity, exploitation probability, confirmed exploitation, and remediation availability provide complementary information. For most High- and Critical-severity CVEs identified in the selected standard images, a corrected version was available. These findings can therefore support image rebuilding and dependency-update decisions.
The absence of an available fix was not treated as evidence of acceptable risk. Such vulnerabilities may require compensating controls, including component isolation, restricted network access, reduced privileges, runtime monitoring, or replacement of the affected container image.
The results presented in Table 7 concern the six selected image variants and complement the complete scanner-count and CVE-set comparisons reported in the remaining subsections.
4.5. CVE-Set Agreement Between Trivy and Grype
The comparison of total scanner findings presented in Table 5 showed that Trivy and Grype frequently produced different output volumes for the same container image. To determine whether the tools nevertheless identified the same vulnerability records, the scanner outputs were additionally compared using deduplicated CVE identifiers.
The set-based analysis covered all 22 container images and was performed separately for the Critical, High, Medium, and Low severity categories. For each image and severity level, the analysis recorded the numbers of CVEs reported by Trivy and Grype, the intersection of the two sets, the CVEs reported exclusively by each scanner, and the union of both sets. Table 8 presents the resulting Jaccard coefficients.
Table 8.
Image- and severity-level agreement between the unique CVE sets reported by Trivy and Grype, measured using the Jaccard coefficient.
The degree of agreement varied substantially across the analysed images and severity levels. Among the non-empty Critical-severity comparisons, the highest Jaccard coefficient was obtained for Neo4j 5.21.0 (0.6923), followed by Redis 8.8.0 (0.6667) and Ruby 3.4.1 (0.6538). These values indicate partial rather than complete overlap between the Critical-severity CVE sets reported by the scanners.
The overlap was also comparatively high for selected Medium-severity results, including Redis 8.8.0 (0.5833), Dart 3.11.0 (0.5690), and Cassandra 4.1.20 (0.5526). In contrast, Low-severity findings frequently showed limited agreement. For Redis 8.8.0, the Low-severity Jaccard coefficient was 0.0625, compared with 0.6667 for Critical-severity CVEs and 0.5833 for Medium-severity CVEs. Cassandra showed a similar pattern, with a Low-severity coefficient of 0.0921.
Particularly limited agreement was observed for the standard PHP-FPM and Ruby images. For PHP-FPM 8.5-fpm, the Jaccard coefficient was 0.0442 for Medium-severity CVEs and 0.0102 for Low-severity CVEs. For Ruby 3.4.1, the corresponding values were 0.0643 and 0.0829. These results show that the large differences in scanner-reported findings for these images were accompanied by differences in the actual CVE identifiers reported by the tools.
Identical aggregate scanner counts did not imply complete agreement between the detected CVE sets. Both Caddy variants produced identical total findings within each scanner, yet the Jaccard coefficient was 0.1000 for Critical-severity CVEs, 0.2136 for High-severity CVEs, 0.2167 for Medium-severity CVEs, and 0.0952 for Low-severity CVEs. Thus, similar or identical output volumes may represent substantially different vulnerability records.
For InfluxDB 2.7.11-alpine, Neo4j 5.12.0-alpine, and both .NET SDK variants, both scanners reported empty CVE sets across all four severity categories; these comparisons were therefore recorded as not applicable. For Redis 8.8.0-alpine, Trivy reported empty Medium- and Low-severity sets, while Grype reported one CVE in each category, resulting in Jaccard coefficients of 0.
The Jaccard coefficient treats CVEs reported exclusively by Trivy and exclusively by Grype symmetrically. To examine the direction of scanner disagreement, the analysis was extended using one symmetrical and two weighted directional Tversky variants. The results are presented in Table 9.
Table 9.
Symmetrical and weighted directional Tversky indices for the unique CVE sets reported by Trivy and Grype.
The Tversky results confirmed that scanner disagreement was frequently asymmetric. For the Medium-severity CVEs in InfluxDB 3.10.3-core, Trivy reported no exclusive CVEs, whereas Grype reported 53. The symmetrical Tversky index was 0.4421. The value increased to 0.6131 when greater weight was assigned to Trivy-only CVEs and decreased to 0.3457 when greater weight was assigned to Grype-only CVEs.
The opposite direction of asymmetry was observed for PHP-FPM 8.5-fpm. For Medium-severity CVEs, Trivy reported 344 exclusive identifiers and Grype reported 2. The symmetrical index was 0.0847, decreasing to 0.0583 when greater weight was assigned to Trivy-only CVEs and increasing to 0.1546 when greater weight was assigned to Grype-only CVEs.
A similar Trivy-dominant asymmetry occurred for the High-severity CVEs in Ruby 3.4.1. The scanners shared 173 CVEs, while 768 were reported exclusively by Trivy and 62 exclusively by Grype. The symmetrical Tversky index was 0.2942, the Trivy-weighted value was 0.2263, and the Grype-weighted value was 0.4204.
Both Caddy variants produced identical Tversky values for all four severity categories. This indicates that the standard and Alpine-based variants had the same cross-scanner agreement profile in the analysed dataset. However, the relatively low index values show that the outputs of Trivy and Grype remained substantially different from each other.
Taken together, the Jaccard and Tversky results demonstrate that differences between Trivy and Grype concerned not only the number of reported findings but also the identities and severity classifications of the reported CVEs. Neither scanner output consistently contained the findings of the other. The tools should therefore be treated as complementary rather than interchangeable for the vulnerability assessment of the analysed container images.
5. Discussion
The revised analysis provides three principal findings. First, image minimization produced substantial reductions in scanner-reported findings for selected technologies, but the effect was not uniform across the strictly matched sample. Second, Trivy and Grype produced non-equivalent vulnerability profiles, as demonstrated by differences in both aggregate findings and unique CVE sets. Third, reductions in total findings were not consistently proportional to changes in Critical-severity CVEs. These results require a differentiated evaluation of the three research hypotheses.
- Evaluation of H1
H1 assumed that minimized container-image variants would report fewer vulnerabilities for most of the analysed technologies, while the magnitude and direction of the change would depend on the technology and scanner.
The assessment of H1 was restricted to the five strictly matched image pairs: Redis, Caddy, HAProxy, Ruby, and .NET SDK. This restriction ensured that the standard and minimized variants represented the same principal application version and reduced the risk of attributing application-version differences to image minimization.
Three of the five strictly matched pairs—Redis, HAProxy, and Ruby—showed reductions in total scanner findings for both Trivy and Grype. For Redis, the reduction was 100.0% in Trivy and 94.9% in Grype. For HAProxy, the corresponding reductions were 80.6% and 70.5%, whereas for Ruby they were 99.3% and 92.7%. Caddy produced identical findings in its standard and Alpine-based variants, while both .NET SDK variants produced zero findings in both scanners.
The aggregate reduction was strongly affected by the standard Ruby image, which accounted for a substantial proportion of all findings in the matched sample. Consequently, aggregate totals should not be interpreted as evidence of an equivalent effect across all technologies.
The exact Wilcoxon signed-rank test produced for both scanners. The rank-biserial effect size was among the three non-zero paired differences, indicating that all informative differences were directed towards lower findings in the minimized variants. However, the wide confidence intervals and the small number of informative pairs limit the strength of the statistical conclusion.
H1 was therefore supported descriptively but not confirmed statistically. The results indicate that minimization can substantially reduce scanner-reported findings for selected technologies, while also demonstrating that this effect cannot be assumed for every container image.
- Evaluation of H2
H2 assumed that Trivy and Grype would produce non-equivalent vulnerability profiles for the same container images, reflected in different finding counts and incomplete overlap between the detected CVE sets.
The aggregate results support this hypothesis. Trivy and Grype produced different total findings for 18 of the 22 analysed images. Neither scanner consistently produced the higher result: Trivy reported more findings for nine images, Grype reported more findings for nine images, and equal totals were observed for four images.
The complete set-based comparison presented in Table 8 and Table 9 provides stronger evidence than aggregate counts alone. The Jaccard coefficients varied substantially across images and severity categories. Even comparatively high values represented partial rather than complete agreement. For example, the Critical-severity Jaccard coefficient was 0.6923 for Neo4j 5.21.0, 0.6667 for Redis 8.8.0, and 0.6538 for Ruby 3.4.1.
Low-severity CVEs generally showed considerably lower overlap. The Jaccard coefficient for Redis 8.8.0 decreased from 0.6667 for Critical-severity CVEs to 0.0625 for Low-severity CVEs. For Cassandra 4.1.20, the corresponding values were 0.5455 and 0.0921.
The Caddy results demonstrate that identical aggregate counts do not imply equivalent vulnerability profiles. The standard and Alpine-based Caddy variants produced identical scanner totals, but the Jaccard coefficients between Trivy and Grype were only 0.1000 for Critical, 0.2136 for High, 0.2167 for Medium, and 0.0952 for Low-severity CVEs.
The Tversky analysis further demonstrated that scanner disagreement was asymmetric. For InfluxDB 3.10.3-core, Grype reported substantially more Medium-severity CVEs that were absent from the Trivy output. The opposite pattern occurred for PHP-FPM 8.5-fpm and Ruby 3.4.1, for which Trivy reported substantially more exclusive Medium- or High-severity CVEs.
These differences may result from scanner-specific component identification, package metadata, vulnerability-database mappings, matching rules, or severity sources. Because the study did not use an independent ground-truth vulnerability dataset, it cannot determine which scanner produced the more complete result in every case.
H2 was therefore supported. Trivy and Grype should be treated as complementary rather than interchangeable tools. The use of both scanners broadens the available evidence, although it does not guarantee complete vulnerability detection.
- Evaluation of H3
H3 assumed that image minimization could substantially reduce the total number of scanner-reported findings without producing a proportional reduction in Critical-severity CVEs.
The Critical-severity results for the strictly matched pairs generally followed the direction of the total finding changes, but the magnitude of the reductions was not consistently proportional. For Redis, the Critical count decreased from 4 to 0 in Trivy and from 6 to 0 in Grype. For HAProxy, it decreased from 8 to 1 in Trivy and from 13 to 4 in Grype. For Ruby, it decreased from 41 to 3 in Trivy and from 45 to 2 in Grype.
For Ruby, Trivy reported a 99.3% reduction in total findings and a 92.7% reduction in Critical-severity CVEs. In the Grype results, total findings decreased by 92.7%, while Critical-severity CVEs decreased by 95.6%. For HAProxy, the total Grype result decreased by 70.5%, while the Critical count decreased by 69.2%. These examples demonstrate that reductions in aggregate findings and Critical-severity findings did not follow one constant relationship.
Caddy produced no change in either total or Critical-severity findings, while both .NET SDK variants produced zero findings. Therefore, the strictly matched results do not indicate that minimization invariably separates aggregate vulnerability reduction from Critical-severity reduction.
H3 was therefore partially supported at the descriptive level. The findings confirm that changes in total findings cannot be used to calculate or predict an equivalent change in Critical-severity exposure. At the same time, the available paired sample does not support a stronger claim that substantial reductions in total findings are generally accompanied by only limited reductions in Critical-severity CVEs.
The operational-prioritization results reinforce this interpretation. CVSS severity, EPSS, CISA KEV inclusion, and remediation availability represent different dimensions of vulnerability risk. Consequently, deployment decisions should consider the characteristics of individual CVEs rather than rely exclusively on aggregate scanner counts.
5.1. Interpretation of the Image-Minimization Paradox
The results indicate that image minimization should be interpreted as a potential attack-surface-reduction mechanism rather than as an independent confirmation of container security. Among the five strictly matched image pairs, Redis, HAProxy, and Ruby showed substantial reductions in total scanner findings in both Trivy and Grype. However, the Caddy variants produced identical results within each scanner, while both .NET SDK variants produced zero findings. The effect of minimization was therefore technology-dependent and was not uniformly observable across the matched sample.
The term image-minimization paradox describes the distinction between reducing the number of included components or scanner findings and establishing that the resulting image presents a lower operational security risk. A minimized image may contain fewer operating-system packages and produce fewer vulnerability records, while still retaining High- or Critical-severity CVEs, application-level dependencies, or components for which no corrected version is available. Conversely, a high total finding count may be dominated by repeated vulnerability-to-component mappings or lower-severity records.
The results obtained for Ruby illustrate the potential scale of the reduction. The number of Trivy findings decreased from 4827 in the standard image to 34 in the minimized variant, while the Grype result decreased from 606 to 44. However, these aggregate reductions did not establish that every important vulnerability was removed. The Critical-severity counts also decreased, but their relative changes were not identical to the changes in the total findings. Aggregate scanner output and Critical-severity exposure must therefore be evaluated as separate measures.
The Caddy results demonstrate a different aspect of the paradox. The standard and Alpine-based variants produced identical total results within each scanner: 128 findings in Trivy and 205 in Grype. Nevertheless, the Jaccard coefficients between the CVE sets reported by Trivy and Grype remained low, ranging from 0.0952 to 0.2167 across the four severity categories. Identical results between image variants and similar output volumes therefore did not imply agreement between the vulnerability records detected by the two tools.
The scanner comparison also shows that a low reported count may result from more than one mechanism. It may reflect a genuine reduction in packages and affected components, but it may also depend on package identification, vulnerability-database mappings, severity sources, and scanner coverage. The study did not use an independent ground-truth vulnerability dataset; consequently, a finding reported exclusively by one scanner could not automatically be classified as either a correct detection or a false positive.
Image size should therefore be treated as an implementation characteristic rather than as a direct security metric. The selection of an Alpine-, Slim-, or otherwise minimized image should be followed by verification of the immutable image digest, review of the Software Bill of Materials, analysis using more than one scanner, and assessment of unique CVE identifiers rather than total findings alone.
The operational importance of the remaining vulnerabilities should additionally be evaluated using severity, remediation availability, EPSS, and CISA KEV information. The results for the selected CouchDB, InfluxDB, and Redis variants demonstrated that High- and Critical-severity CVEs differed in their exploitation indicators and patch availability. A smaller vulnerability count therefore does not eliminate the need for image rebuilding, dependency updates, compensating controls, and repeated scanning after vulnerability-database updates.
The image-minimization paradox does not constitute an argument against minimized images. Instead, it indicates that minimization provides the greatest security value when it forms part of a broader verification process. In this process, component reduction, SBOM analysis, multi-tool vulnerability scanning, severity and exploitability assessment, and controlled image rebuilding operate as complementary security controls.
5.2. Implications for Sustainable Energy Systems
The technologies analysed in this study were assessed as transferable software components rather than as elements of a single deployed energy installation. Consequently, the implications for sustainable energy systems should be interpreted at the software-architecture and vulnerability-management levels. The study does not provide evidence concerning the direct operational consequences of exploitation in a specific power grid, renewable-energy installation, energy-storage system, or energy-management platform.
The reference architecture presented in Figure 1 illustrates the potential position of the analysed technologies within a containerized cloud–edge platform supporting energy monitoring and management. Databases may store metering, equipment-status, and operational data. Proxy and API services may provide communication between edge gateways, analytical services, and cloud platforms. Application runtimes may execute functions associated with forecasting, anomaly detection, demand response, data processing, and distributed-energy-resource management.
Within such an architecture, the security relevance of a vulnerability depends on the role and exposure of the affected component. A vulnerability affecting a database may influence the confidentiality, integrity, or availability of operational and metering records. A weakness in a reverse proxy, API service, or communication component may affect interfaces used to exchange information between edge and cloud layers. A vulnerable runtime environment may affect analytical or management services implemented using that environment. These consequences represent plausible architectural risk scenarios rather than effects demonstrated through runtime exploitation in the present experiment.
The results indicate that the security assessment of software components supporting energy-related services should not rely exclusively on the total number of scanner findings. Trivy and Grype frequently reported different findings and different unique CVE sets for the same immutable image artifact. Therefore, the choice of scanner may influence the vulnerability information available to teams responsible for maintaining digital energy platforms.
The findings concerning image minimization are also relevant to edge and gateway environments, where resource constraints may encourage the use of smaller container images. Redis, HAProxy, and Ruby demonstrated that minimized variants can substantially reduce scanner-reported findings. However, the unchanged Caddy results and the zero findings obtained for both .NET SDK variants demonstrate that the effect cannot be generalized to every software component. A minimized image should therefore be selected on the basis of its verified composition and vulnerability profile rather than image size alone.
The operational-prioritization analysis further shows that High- and Critical-severity vulnerabilities may differ in remediation availability, EPSS values, and CISA KEV inclusion. In an energy-related platform, these indicators can support the prioritization of components whose compromise could affect important monitoring, communication, or management functions. Their interpretation should nevertheless be combined with deployment-specific information, including service exposure, component reachability, privileges, network access, redundancy, and available compensating controls.
The energy sector is subject to cybersecurity risk-management and software supply-chain considerations discussed in the NIS2 framework, while the resilience of services supporting essential functions is consistent with the objectives of the Critical Entities Resilience Directive [14,15]. In this context, container-image governance can form part of a broader cybersecurity-management process covering the selection, verification, deployment, updating, and monitoring of software artifacts used in cloud–edge and IoT platforms.
The present results therefore support the integration of container-image assessment into sustainable-energy-system cybersecurity, but they do not establish the operational risk of any specific energy installation. Validation in an experimental or operational energy platform would be required to determine how individual vulnerabilities affect service availability, data integrity, control continuity, and the resilience of concrete energy-management functions.
5.3. Practical DevSecOps Implications
The results support a layered DevSecOps process in which container-image security is evaluated throughout the software lifecycle. Vulnerability assessment should begin during image selection and build, continue before deployment, and be repeated during operation because vulnerability databases, affected-version ranges, and available fixes evolve over time. Trivy and Grype support automated container-image assessment and can generate machine-readable reports suitable for integration into CI/CD workflows [20,21].
The present findings indicate that automated deployment decisions should use several complementary indicators. Total scanner findings provide information about the volume of reported vulnerability-to-component mappings, while unique CVE identifiers, severity levels, EPSS values, CISA KEV inclusion, and remediation availability provide additional information about operational priority. This approach supports focused remediation and reduces the effect of alert fatigue associated with extensive scanner reports [26].
The differences observed between Trivy and Grype also support the use of multi-tool verification for software components performing important monitoring, communication, storage, or management functions. The tools produced different total findings for most analysed images and frequently identified only partially overlapping CVE sets. Similar scanner totals could also represent different CVE identifiers, as demonstrated by the Jaccard and Tversky results. These findings are consistent with previous research showing that aggregate scanner counts provide an incomplete basis for comparing vulnerability-detection tools [27].
A practical CI/CD workflow should therefore retain the complete outputs of both scanners rather than automatically selecting the lower result. Differences between the reports should initiate verification of the affected package, installed version, available fixed version, scanner-specific severity classification, and component inventory. The combined results can then be deduplicated by CVE identifier and prioritised according to severity, exploitation evidence, remediation availability, and the operational role of the affected component.
Software Bills of Materials provide the component-level traceability required for this process. Linking scanner findings with an SBOM enables development and security teams to determine which packages and deployed services are affected by a newly disclosed vulnerability [19]. The SBOM should be generated for the immutable image artifact identified by its SHA-256 digest so that the component inventory, scanner reports, and deployment decision refer to the same container image.
Image tags alone provide limited reproducibility because a registry maintainer may associate an existing tag with a newer image artifact. Deployment and verification processes should therefore record both the complete repository tag and the immutable image digest. The approved digest can subsequently be used to verify that the image scanned during the security assessment corresponds to the image selected for deployment.
Image provenance and cryptographic signatures provide complementary evidence concerning artifact origin and integrity. SLSA provenance records can document the build process and the inputs used to produce the container artifact [33]. Cryptographic signing using mechanisms such as Sigstore and Cosign can support verification of image identity and detection of unauthorized artifact modification [34]. SBOM documents, provenance records, cryptographic signatures, and vulnerability scanning therefore address different dimensions of software supply-chain security and should be applied together [19,33,34].
Minimized images should be rebuilt regularly using maintained base images and updated dependencies. The results for Redis, HAProxy, and Ruby demonstrate that minimized variants can substantially reduce scanner findings. The unchanged Caddy results also show that replacement of the base distribution does not guarantee an improved vulnerability profile. Each rebuilt artifact should therefore undergo the same sequence of SBOM generation, multi-tool scanning, digest recording, provenance verification, and policy evaluation.
Automated security gates should reflect the operational role of the container. An image containing a large number of Low-severity findings may require a different response from an image containing a smaller number of High- or Critical-severity CVEs with elevated exploitation indicators. The assessment should therefore incorporate the function of the service, network exposure, privileges, component reachability, available fixes, and compensating controls.
For vulnerabilities with an available corrected version, the preferred response is to update the affected dependency, rebuild the image, repeat the scans, generate an updated SBOM, and deploy the verified artifact. Vulnerabilities without an available fix can be addressed through compensating controls, including component isolation, restricted network access, reduced container privileges, runtime monitoring, and replacement of the affected component where an appropriate alternative is available.
Static vulnerability scanning should also be complemented by controls addressing other stages and layers of the software lifecycle. Static and dynamic application-security testing can identify weaknesses in source code, input handling, authentication, exposed interfaces, and service configuration [39]. Runtime container security additionally requires verification of privileges, exposed ports, mounted resources, secrets, network policies, orchestration settings, and host-level isolation [40].
A practical deployment process derived from the study therefore comprises the following sequence: selection of an approved image or base image, recording of the complete tag and immutable digest, SBOM generation, scanning using Trivy and Grype, deduplication and prioritization of CVE records, verification of fixes and exploitation indicators, application of a security policy gate, provenance and signature verification, deployment, and continuous rescanning. This workflow uses image minimization as one component of a broader software supply-chain-security process rather than as an independent security guarantee.
5.4. Limitations
The study has several limitations. First, the vulnerability assessment was performed using the scanner databases available on 14 June 2026. Repeating the analysis at another time may produce different results because new CVEs are disclosed, affected-version ranges are updated, severity classifications are revised, and corrected package versions become available. The findings therefore represent a temporally defined vulnerability profile rather than a permanent characteristic of the analysed images.
Second, the sample comprised 13 purposively selected technologies represented by 22 distinct container images. The sample covered data-storage and processing technologies, communication, proxy, and API services, and application runtime environments. However, it was not intended to constitute a statistically representative sample of the complete container or energy-IoT ecosystem. MQTT brokers, stream-processing platforms, data agents, device-management services, orchestration components, and privately built images were outside the experimental scope.
Third, the inferential assessment of image minimization was restricted to five strictly matched pairs: Redis, Caddy, HAProxy, Ruby, and .NET SDK. CouchDB was treated as a partially matched pair, whereas InfluxDB, Neo4j, and PHP-FPM contained different principal application versions and were interpreted descriptively. Cassandra, Traefik, Kong, and Dart did not have corresponding minimized variants in the final sample. Conclusions concerning the effect of image minimization should therefore be based primarily on the five strictly matched pairs.
Fourth, the strictly matched sample was small. Only three of the five pairs produced non-zero differences between the standard and minimized variants. Although the non-zero differences were consistently directed towards lower findings in the minimized images, the exact Wilcoxon signed-rank test produced , and the confidence intervals were wide. The results provide descriptive evidence of technology-dependent reductions but do not establish a universal or statistically conclusive minimization effect.
Fifth, the experiment used two vulnerability scanners, Trivy and Grype, and each image was analysed once by each tool. The study therefore does not evaluate the repeatability of results across multiple scanning sessions, scanner versions, database update cycles, or additional vulnerability-scanning tools. The observed agreement and disagreement patterns apply to the tool versions, configurations, and database state used in the experiment.
Sixth, the experiment was limited to static analysis of container-image contents. The images were not deployed as operational services, and the study did not evaluate runtime exploitability, application-level reachability, exposed network interfaces, container privileges, secrets, service configuration, orchestration policies, kernel vulnerabilities, or compensating controls. A scanner-reported CVE therefore represents a known potential vulnerability associated with an identified component rather than evidence that exploitation is possible in every deployment context.
Seventh, no independent and complete ground-truth vulnerability dataset was available. Selected anomalous outputs and representative CVE records were examined using the scanner reports, CVE identifiers, affected-package information, installed versions, fixed versions, EPSS values, and CISA KEV status. However, this verification does not establish the complete accuracy of either scanner. A CVE reported exclusively by one tool cannot automatically be classified as a false positive, while a vulnerability omitted by one or both tools cannot be independently identified as a false negative.
Eighth, the operational-prioritization analysis using EPSS, CISA KEV inclusion, and remediation availability covered six selected image variants representing CouchDB, InfluxDB, and Redis. These results illustrate the value of complementing CVSS severity with exploitation and remediation indicators, but their numerical distribution should not be generalized to the complete 22-image sample.
Ninth, the study generated Software Bills of Materials to support component identification and pair-comparability assessment, but it did not perform application-level reachability analysis or produce deployment-specific VEX statements. The presence of a vulnerable package in an image therefore does not independently demonstrate that the vulnerable function is invoked by the deployed application.
Finally, the analysed technologies were assessed as transferable software components rather than as elements of an operational sustainable-energy installation. The energy-sector implications were derived from the functions that databases, APIs, proxy services, and runtime environments may perform in the reference cloud–edge architecture. The study did not measure the consequences of exploitation for a specific power grid, renewable-energy installation, energy-storage system, or energy-management platform. Further validation in an experimental or operational energy-IoT environment is required to evaluate effects on service availability, data integrity, control continuity, and system resilience.
6. Conclusions
This study assessed the software supply-chain security of containerized software components that may support data acquisition, communication, storage, processing, and management functions in cloud–edge and Internet of Things platforms. The analysis covered 13 technologies represented by 22 distinct container images. Each image was examined using Trivy and Grype, resulting in 44 vulnerability-scanning operations performed under the same temporal conditions.
The effect of image minimization was evaluated primarily using five strictly matched image pairs: Redis, Caddy, HAProxy, Ruby, and .NET SDK. Redis, HAProxy, and Ruby showed reductions in total scanner findings in both tools. The Caddy variants produced identical results within each scanner, while both .NET SDK variants produced zero findings.
For the strictly matched sample, the aggregate number of Trivy findings decreased from 5181 in the standard variants to 193 in the minimized variants, corresponding to a reduction of 96.3%. The corresponding Grype total decreased from 982 to 290, representing a reduction of 70.5%. However, these aggregate values were strongly influenced by the standard Ruby image and should not be interpreted as evidence of an equivalent effect across all technologies.
The exact Wilcoxon signed-rank test produced for both scanners. The rank-biserial effect size was among the three non-zero paired differences, indicating that all informative differences were directed towards lower findings in the minimized variants. Nevertheless, the small number of informative pairs and the wide confidence intervals prevented statistically conclusive confirmation of a general minimization effect. H1 was therefore supported descriptively but not confirmed statistically.
Across the complete 22-image sample, Trivy reported 7006 vulnerability findings and Grype reported 2299. The scanners produced different totals for 18 images. Trivy reported the higher value for nine images, Grype reported the higher value for nine images, and equal totals were obtained for four images. These results demonstrate that neither scanner systematically produced the larger output.
The Jaccard and Tversky analyses showed that differences between Trivy and Grype concerned not only the number of findings but also the unique CVE identifiers and severity classifications reported for the same images. The degree of agreement varied considerably across technologies and severity levels, while the directional Tversky variants revealed scanner-specific asymmetry. Identical or similar aggregate counts could therefore represent substantially different CVE sets. H2 was supported, and Trivy and Grype should be treated as complementary rather than interchangeable tools.
The comparison of the strictly matched pairs also showed that changes in total scanner findings did not follow one constant proportional relationship with changes in Critical-severity CVEs. Substantial aggregate reductions could be accompanied by different relative changes in the most severe findings, while some image pairs produced no change. H3 was therefore partially supported at the descriptive level. Total scanner findings should not be used as a substitute for the direct assessment of Critical- and High-severity vulnerabilities.
The operational-prioritization analysis conducted for six selected CouchDB, InfluxDB, and Redis image variants identified 100 High- and Critical-severity CVE records. Corrected versions were available for 89 records, while 11 records had no available fix. Seven CVEs exceeded the adopted EPSS threshold of 0.10, and one CVE was included in the CISA Known Exploited Vulnerabilities catalogue. These results demonstrate that severity, exploitation probability, confirmed exploitation, and remediation availability provide complementary information for vulnerability management.
The findings support a DevSecOps process in which image minimization constitutes one security control rather than an independent security guarantee. Container-image assessment should combine immutable digest verification, Software Bill of Materials generation, multi-tool vulnerability scanning, analysis of unique CVE identifiers, remediation availability, EPSS and CISA KEV information, regular image rebuilding, provenance verification, cryptographic signatures, and continuous rescanning.
A zero scanner result should be interpreted as the absence of vulnerabilities matched by the corresponding tool under the applied configuration and vulnerability-database snapshot. It does not demonstrate that the image is inherently free from security weaknesses. Similarly, a vulnerability reported exclusively by one scanner cannot be classified automatically as either a correct detection or a false positive without an independent ground-truth assessment.
The analysed technologies were treated as transferable software building blocks rather than as components of a single operational energy installation. The results are therefore relevant to the governance of software components that may support energy-monitoring and management platforms, but they do not establish the direct consequences of exploitation for a specific power grid, renewable-energy installation, storage system, or energy-management service.
Future research should extend the experimental sample to include MQTT brokers, stream-processing platforms, time-series data agents, device-management services, orchestration components, and privately built images. Repeated scans should be conducted using additional tools, scanner versions, and vulnerability-database snapshots to assess temporal stability and repeatability. Further studies should also incorporate independent ground-truth datasets, package-level manual validation, application-level reachability analysis, VEX information, runtime testing, and representative experimental energy-IoT deployments. Such extensions would enable the relationship between static image vulnerabilities, practical exploitability, and the operational resilience of digital energy services to be assessed more directly.
Author Contributions
Conceptualization, A.M. and M.H.; methodology, A.M. and M.H.; software, A.M. and M.H.; validation, A.M. and M.H.; formal analysis, A.M. and M.H.; investigation, A.M. and M.H.; resources, A.M. and M.H.; data curation, A.M. and M.H.; writing—original draft preparation, A.M. and M.H.; writing—review and editing, A.M. and M.H.; visualization, A.M. and M.H.; supervision, A.M.; project administration, A.M. and M.H.; funding acquisition, A.M. All authors have read and agreed to the published version of the manuscript.
Funding
The publication is supported by the Rector’s pro-quality grant. Silesian University of Technology, grant number 06/010/RGJ25/0065 and the statutory research BK 06/010/BK_26/0069.
Data Availability Statement
The original contributions presented in this study are included in the article. Further inquiries can be directed to the corresponding author.
Conflicts of Interest
The authors declare no conflicts of interest.
References
- United Nations Framework Convention on Climate Change. Paris Agreement. 2015. Available online: https://unfccc.int/process-and-meetings/the-paris-agreement (accessed on 8 July 2026).
- European Parliament and Council. Regulation (EU) 2021/1119 of the European Parliament and of the Council of 30 June 2021 Establishing the Framework for Achieving Climate Neutrality and Amending Regulations (EC) No 401/2009 and (EU) 2018/1999 (“European Climate Law”). Off. J. Eur. Union 2021, 243, 1–17. Available online: https://eur-lex.europa.eu/eli/reg/2021/1119/oj/eng?utm_source=chatgpt.com (accessed on 8 July 2026).
- European Parliament and Council. Directive (EU) 2023/2413 of the European Parliament and of the Council of 18 October 2023 Amending Directive (EU) 2018/2001, Regulation (EU) 2018/1999 and Directive 98/70/EC as Regards the Promotion of Energy from Renewable Sources, and Repealing Council Directive (EU) 2015/652. Off. J. Eur. Union 2023, 10, 2413. Available online: https://eur-lex.europa.eu/eli/dir/2023/2413/oj/eng (accessed on 8 July 2026).
- European Parliament and Council. Directive (EU) 2023/1791 of the European Parliament and of the Council of 13 September 2023 on Energy Efficiency and Amending Regulation (EU) 2023/955 (Recast). Off. J. Eur. Union 2023, 231, 1–111. Available online: https://eur-lex.europa.eu/eli/dir/2023/1791/oj/eng (accessed on 8 July 2026).
- European Commission. Communication from the Commission to the European Parliament, the European Council, the Council, the European Economic and Social Committee and the Committee of the Regions: REPowerEU Plan. COM(2022) 230 Final, 2022. Available online: https://eur-lex.europa.eu/legal-content/EN/TXT/?uri=CELEX:52022DC0230 (accessed on 8 July 2026).
- International Energy Agency. Unlocking the Potential of Distributed Energy Resources: Power System Opportunities and Best Practices; IEA: Paris, France, 2022. [Google Scholar]
- Impram, S.; Varbak Nese, S.; Oral, B. Challenges of Renewable Energy Penetration on Power System Flexibility: A Survey. Energy Strategy Rev. 2020, 31, 100539. [Google Scholar] [CrossRef] [Scilit]
- Notton, G.; Nivet, M.-L.; Voyant, C.; Paoli, C.; Darras, C.; Motte, F.; Fouilloy, A. Intermittent and Stochastic Character of Renewable Energy Sources: Consequences, Cost of Intermittence and Benefit of Forecasting. Renew. Sustain. Energy Rev. 2018, 87, 96–105. [Google Scholar] [CrossRef] [Scilit]
- European Commission. Communication from the Commission to the European Parliament, the Council, the European Economic and Social Committee and the Committee of the Regions: Digitalising the Energy System—EU Action Plan. COM(2022) 552 Final, 2022. Available online: https://eur-lex.europa.eu/legal-content/EN/TXT/?uri=CELEX:52022DC0552 (accessed on 8 July 2026).
- Saleem, Y.; Crespi, N.; Rehmani, M.H.; Copeland, R. Internet of Things-Aided Smart Grid: Technologies, Architectures, Applications, Prototypes, and Future Research Directions. IEEE Access 2019, 7, 62962–63003. [Google Scholar] [CrossRef] [Scilit]
- Feng, C.; Wang, Y.; Chen, Q.; Ding, Y.; Strbac, G.; Kang, C. Smart Grid Encounters Edge Computing: Opportunities and Applications. Adv. Appl. Energy 2021, 1, 100006. [Google Scholar] [CrossRef] [Scilit]
- Hussain, M.M.; Beg, M.M.S. Fog Computing for Internet of Things (IoT)-Aided Smart Grid Architectures. Big Data Cogn. Comput. 2019, 3, 8. [Google Scholar] [CrossRef] [Scilit]
- Okafor, K.C.; Okafor, W.O.; Longe, O.M.; Ayogu, I.I.; Anoh, K.; Adebisi, B. Scalable Container-Based Time Synchronization for Smart Grid Data Center Networks. Technologies 2025, 13, 105. [Google Scholar] [CrossRef] [Scilit]
- European Parliament and Council. Directive (EU) 2022/2555 of the European Parliament and of the Council of 14 December 2022 on Measures for a High Common Level of Cybersecurity across the Union, Amending Regulation (EU) No 910/2014 and Directive (EU) 2018/1972, and Repealing Directive (EU) 2016/1148 (NIS 2 Directive). Off. J. Eur. Union 2022, 333, 80–152. Available online: https://eur-lex.europa.eu/eli/dir/2022/2555/oj/eng (accessed on 8 July 2026).
- European Parliament and Council. Directive (EU) 2022/2557 of the European Parliament and of the Council of 14 December 2022 on the Resilience of Critical Entities and Repealing Council Directive 2008/114/EC. Off. J. Eur. Union 2022, 333, 164–198. Available online: https://eur-lex.europa.eu/eli/dir/2022/2557/oj/eng (accessed on 8 July 2026).
- Sultan, S.; Ahmad, I.; Dimitriou, T. Container Security: Issues, Challenges, and the Road Ahead. IEEE Access 2019, 7, 52976–52996. [Google Scholar] [CrossRef] [Scilit]
- Shu, R.; Gu, X.; Enck, W. A Study of Security Vulnerabilities on Docker Hub. In Proceedings of the Seventh ACM Conference on Data and Application Security and Privacy, Scottsdale, AZ, USA, 22–24 March 2017; pp. 269–280. [Google Scholar] [CrossRef] [Scilit]
- Wist, K.; Helsem, M.; Gligoroski, D. Vulnerability Analysis of 2500 Docker Hub Images. In Advances in Security, Networks, and Internet of Things; Springer: Cham, Switzerland, 2021; pp. 307–327. [Google Scholar] [CrossRef] [Scilit]
- Cybersecurity and Infrastructure Security Agency. Software Bill of Materials (SBOM). Available online: https://www.cisa.gov/topics/information-communications-technology-supply-chain-security/sbom (accessed on 8 July 2026).
- Aqua Security. Trivy Documentation: Container Image Scanning. Available online: https://trivy.dev/docs/latest/guide/target/container_image/ (accessed on 8 July 2026).
- Anchore. Grype Documentation: Vulnerability Scanning and Supported Scan Targets. Available online: https://oss.anchore.com/docs/guides/vulnerability/ (accessed on 8 July 2026).
- Zerouali, A.; Mens, T.; Decan, A.; Gonzalez-Barahona, J.M.; Robles, G. A Multi-Dimensional Analysis of Technical Lag in Debian-Based Docker Images. Empir. Softw. Eng. 2021, 26, 19. [Google Scholar] [CrossRef] [Scilit]
- Kaur, B.; Dugré, M.; Hanna, A.; Glatard, T. An Analysis of Security Vulnerabilities in Container Images for Scientific Data Analysis. GigaScience 2021, 10, giab025. [Google Scholar] [CrossRef] [Scilit] [PubMed]
- Javed, O.; Toor, S. An Evaluation of Container Security Vulnerability Detection Tools. In Proceedings of the 2021 5th International Conference on Cloud and Big Data Computing, Liverpool, UK, 13–15 August 2021; pp. 95–101. [Google Scholar] [CrossRef] [Scilit]
- O’Donoghue, E.; Reinhold, A.M.; Izurieta, C. Assessing Security Risks of Software Supply Chains Using Software Bill of Materials. In Proceedings of the 2024 IEEE International Conference on Software Analysis, Evolution and Reengineering—Companion, Rovaniemi, Finland, 12–15 March 2024; pp. 134–140. [Google Scholar] [CrossRef] [Scilit]
- Kim, T.; Park, S.; Kim, H. Why Johnny Can’t Use Secure Docker Images: Investigating the Usability Challenges in Using Docker Image Vulnerability Scanners through Heuristic Evaluation. In Proceedings of the 26th International Symposium on Research in Attacks, Intrusions and Defenses, Hong Kong, China, 16–18 October 2023; pp. 669–685. [Google Scholar] [CrossRef] [Scilit]
- Churakova, Y.; Ekstedt, M.; Schmid, L. Vexed by VEX Tools: Consistency Evaluation of Container Vulnerability Scanners. In Foundations and Practice of Security—FPS 2025; Lecture Notes in Computer Science; Springer: Cham, Switzerland, 2026; Volume 16402, pp. 139–156. [Google Scholar] [CrossRef] [Scilit]
- Bernstein, D. Containers and Cloud: From LXC to Docker to Kubernetes. IEEE Cloud Comput. 2014, 1, 81–84. [Google Scholar] [CrossRef] [Scilit]
- Sysdig. 2023 Cloud-Native Security and Usage Report: Vulnerability Prioritization—Combating Developer Fatigue. Available online: https://www.sysdig.com/blog/vulnerability-prioritization-fatigue-developers (accessed on 9 July 2026).
- Liu, G.; Wang, L.; Yin, S.; Li, Q.; Zhang, Y. Exploring the Unchartered Space of Container Registry Typosquatting. In Proceedings of the 31st USENIX Security Symposium, Boston, MA, USA, 10–12 August 2022; pp. 2099–2115. [Google Scholar]
- Dahlmanns, M.; Sander, C.; Decker, R.; Wehrle, K. Secrets Revealed in Container Images: An Internet-Wide Study on Occurrence and Impact. In Proceedings of the 2023 ACM Asia Conference on Computer and Communications Security, Melbourne, Australia, 10–14 July 2023; pp. 797–811. [Google Scholar] [CrossRef] [Scilit]
- Sonatype. 10th Annual State of the Software Supply Chain Report. 2024. Available online: https://www.sonatype.com/press-releases/sonatypes-10th-annual-state-of-the-software-supply-chain-report (accessed on 9 July 2026).
- OpenSSF. Supply-Chain Levels for Software Artifacts: SLSA Specification, Version 1.2. Available online: https://slsa.dev/spec/v1.2/ (accessed on 9 July 2026).
- Sigstore. Cosign Documentation: Identity-Based Signing and Container Image Verification. Available online: https://docs.sigstore.dev/cosign/verifying/verify/ (accessed on 9 July 2026).
- Sysdig Security. Global Container Security and Usage Report. 2023. Available online: https://sysdig.jp/2023-cloud-native-security-and-usage-report/ (accessed on 9 July 2026).
- Karn, R.R.; Kudva, P.; Huang, H.; Suneja, S.; Elfadel, I.M. Cryptomining Detection in Container Clouds Using System Calls and Explainable Machine Learning. IEEE Trans. Parallel Distrib. Syst. 2021, 32, 674–691. [Google Scholar] [CrossRef] [Scilit]
- Shi, H.; Ying, L.; Chen, L.; Duan, H.-X.; Liu, M.; Xue, Z. Dr. Docker: A Large-Scale Security Measurement of Docker Image Ecosystem. In Proceedings of the ACM Web Conference 2025, Sydney, Australia, 28 April–2 May 2025; pp. 2813–2823. [Google Scholar] [CrossRef] [Scilit]
- Snyk. How Snyk Container Works. Available online: https://docs.snyk.io/scan-fix-and-prevent/scan-with-snyk/snyk-container/how-snyk-container-works (accessed on 9 July 2026).
- OWASP Foundation. OWASP DevSecOps Guideline: Dynamic Application Security Testing (DAST), Version 0.2; OWASP Foundation: Wilmington, DE, USA, 2025. [Google Scholar]
- Jarkas, O.; Ko, R.; Dong, N.; Mahmud, R. A Container Security Survey: Exploits, Attacks, and Defenses. ACM Comput. Surv. 2025, 57, 1–36. [Google Scholar] [CrossRef] [Scilit]
- Zhou, L.; Dacier, M.; Konstantinou, C. A Reality Check on SBOM-based Vulnerability Management: An Empirical Study and A Path Forward. In Proceedings of the 2026 IEEE/ACM 48th International Conference on Software Engineering (ICSE); Association for Computing Machinery: New York, NY, USA, 2026. [Google Scholar] [CrossRef] [Scilit]
- Zhuravchak, D.; Hlushchenko, P.; Dudykevych, V. Honeypot-based Ransomware Detection as a Component of Security Posture Monitoring in Zero Trust Architecture. In Proceedings of the International Workshop on Cybersecurity Providing (CPITS 2025), Kyiv, Ukraine, 28 February 2025. [Google Scholar]
- Stalnaker, T.; Wintersgill, N.; Chaparro, O.; Di Penta, M.; German, D.M.; Poshyvanyk, D. BOMs Away! Inside the Minds of Stakeholders: A Comprehensive Study of Bills of Materials for Software Systems. In Proceedings of the IEEE/ACM 46th International Conference on Software Engineering (ICSE ‘24); Association for Computing Machinery: New York, NY, USA, 2024; pp. 1–13. [Google Scholar] [CrossRef] [Scilit]
- Lorenc, D. Introducing Wolfi: The First Linux (un)Distro Designed for Securing the Software Supply Chain. Chainguard. 2022. Available online: https://www.chainguard.dev/unchained/introducing-wolfi-the-first-linux-un-distro-designed-for-securing-the-software-supply-chain (accessed on 9 July 2026).
- Forum of Incident Response and Security Teams (FIRST). Common Vulnerability Scoring System Version 3.1: Specification Document, Revision 1. Available online: https://www.first.org/cvss/v3-1/cvss-v31-specification_r1.pdf (accessed on 10 July 2026).
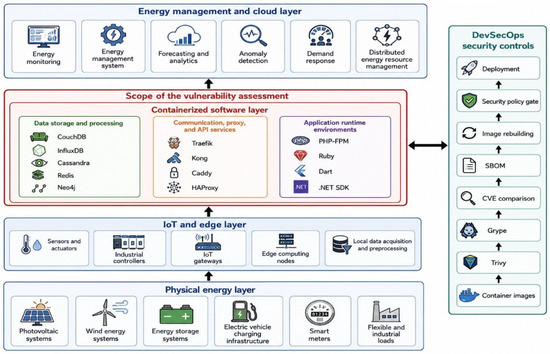
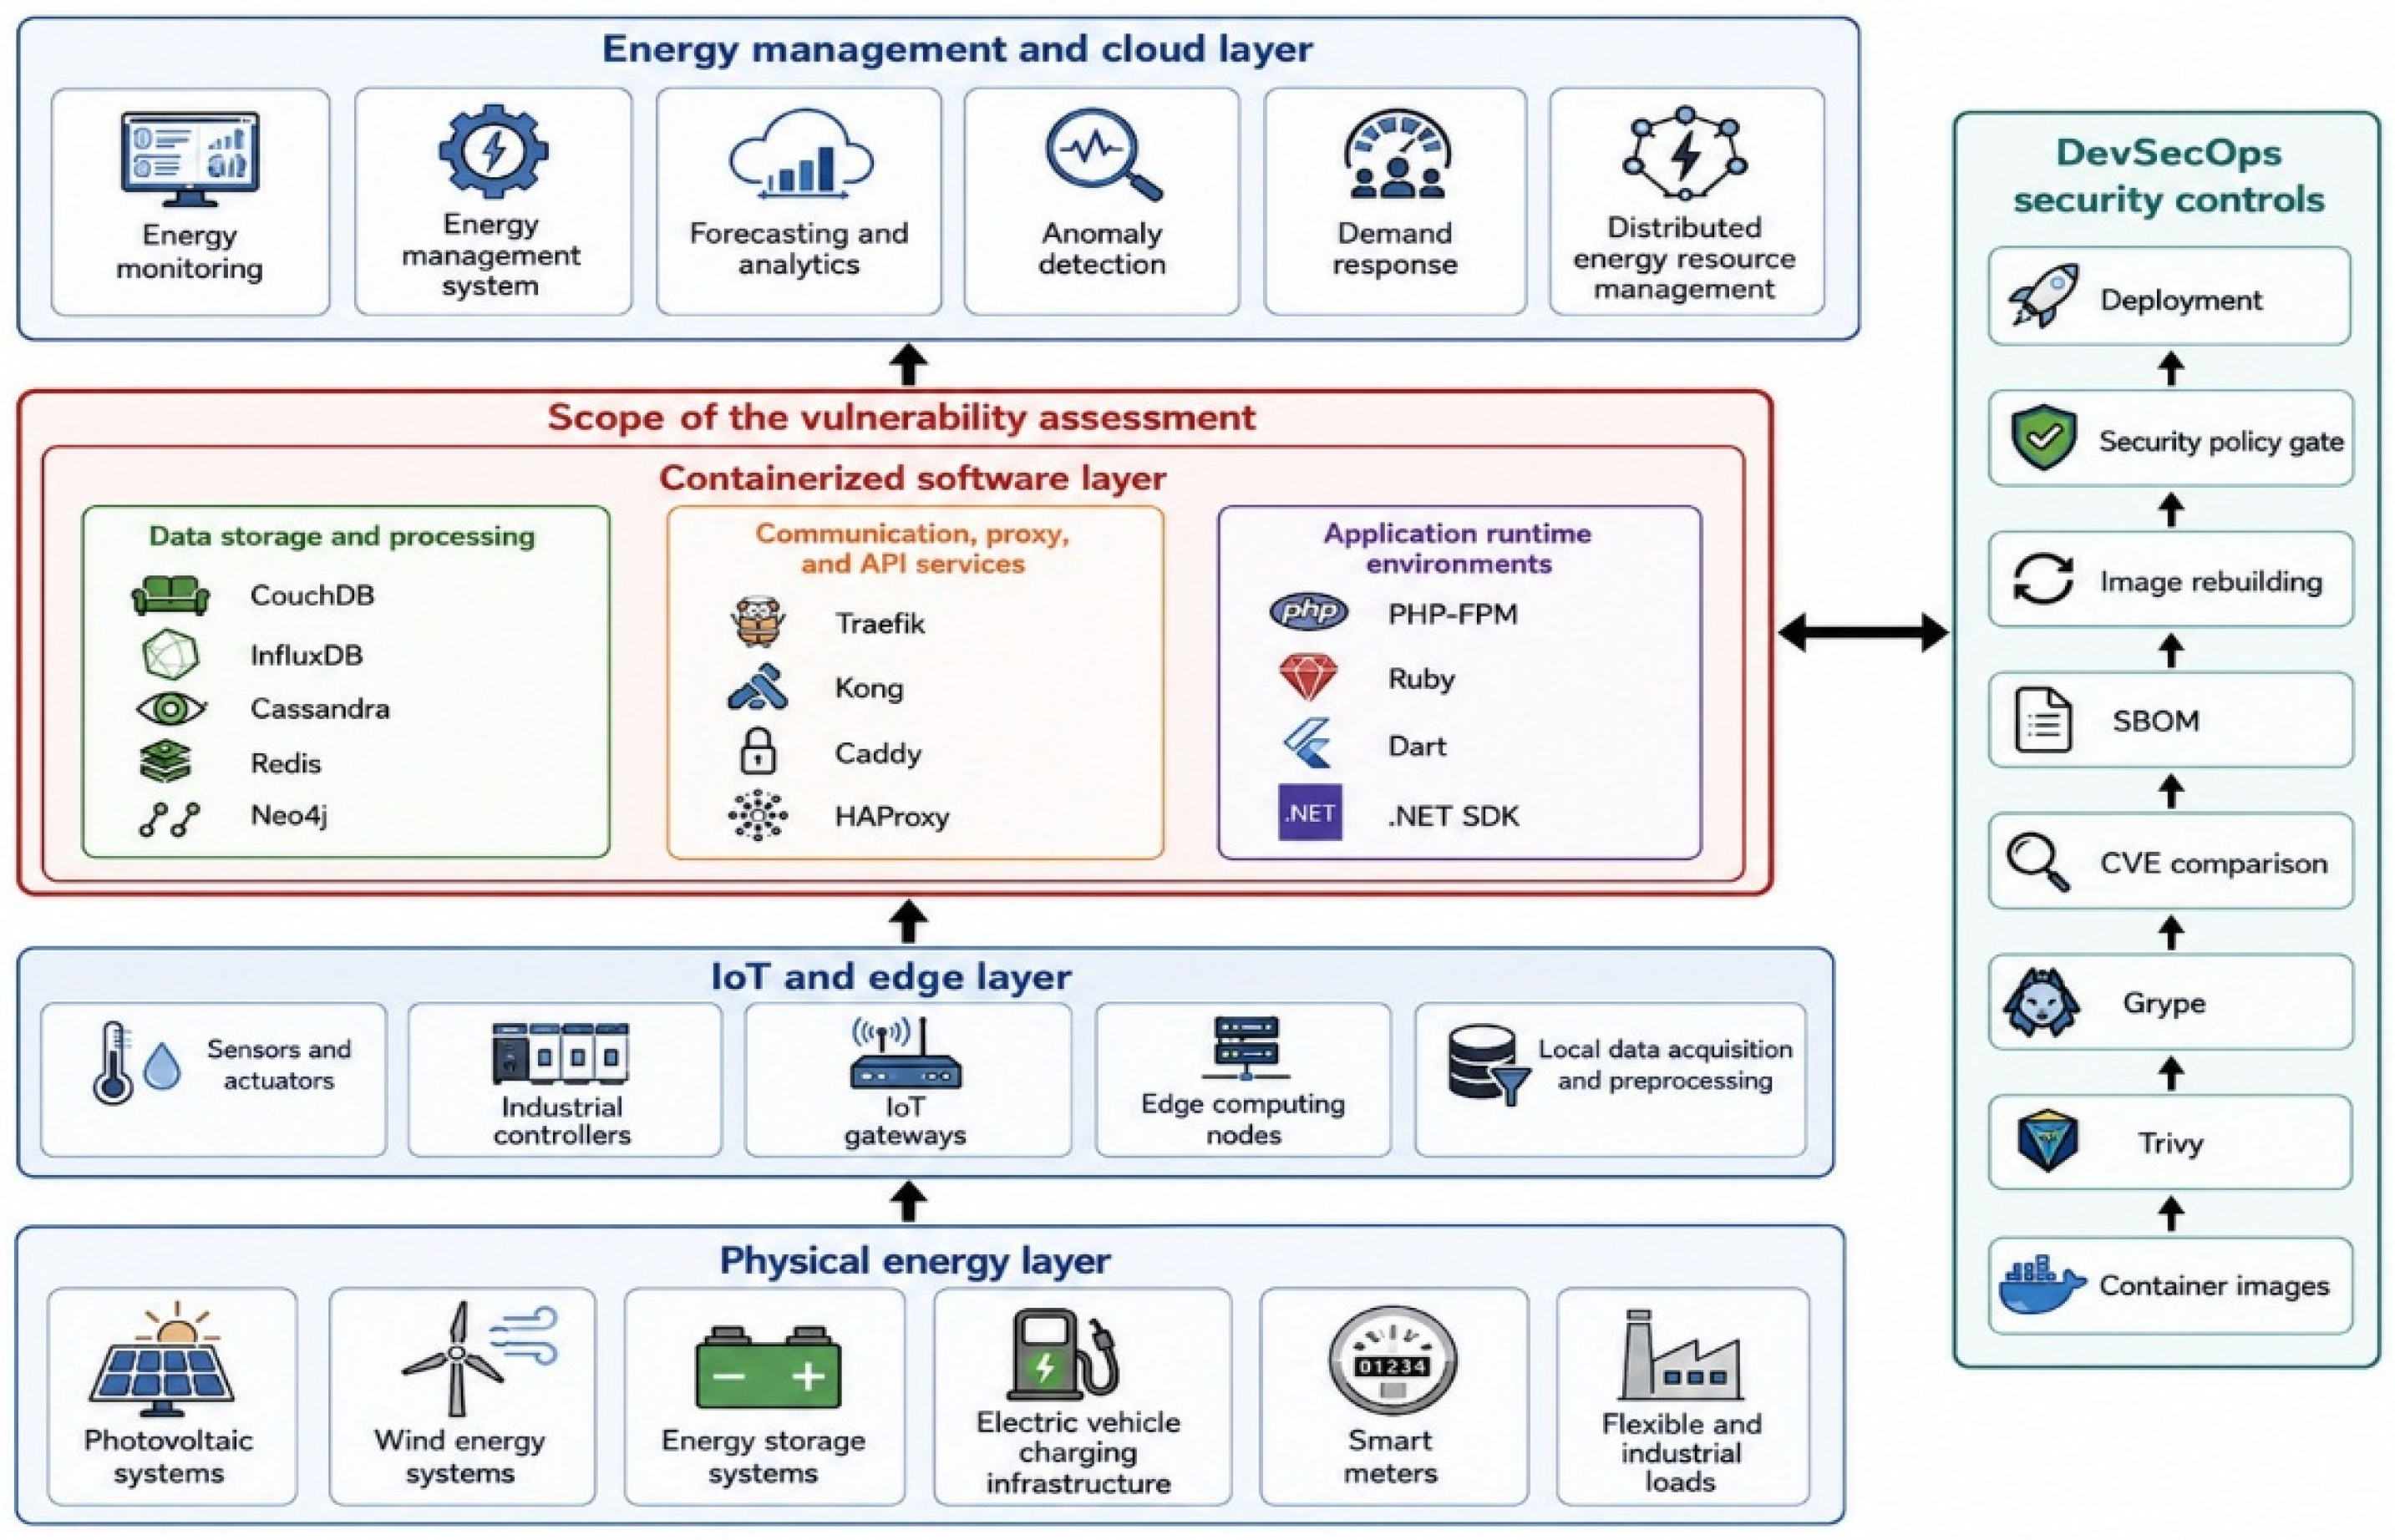
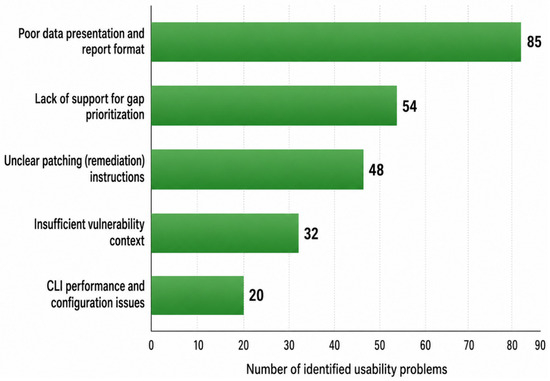
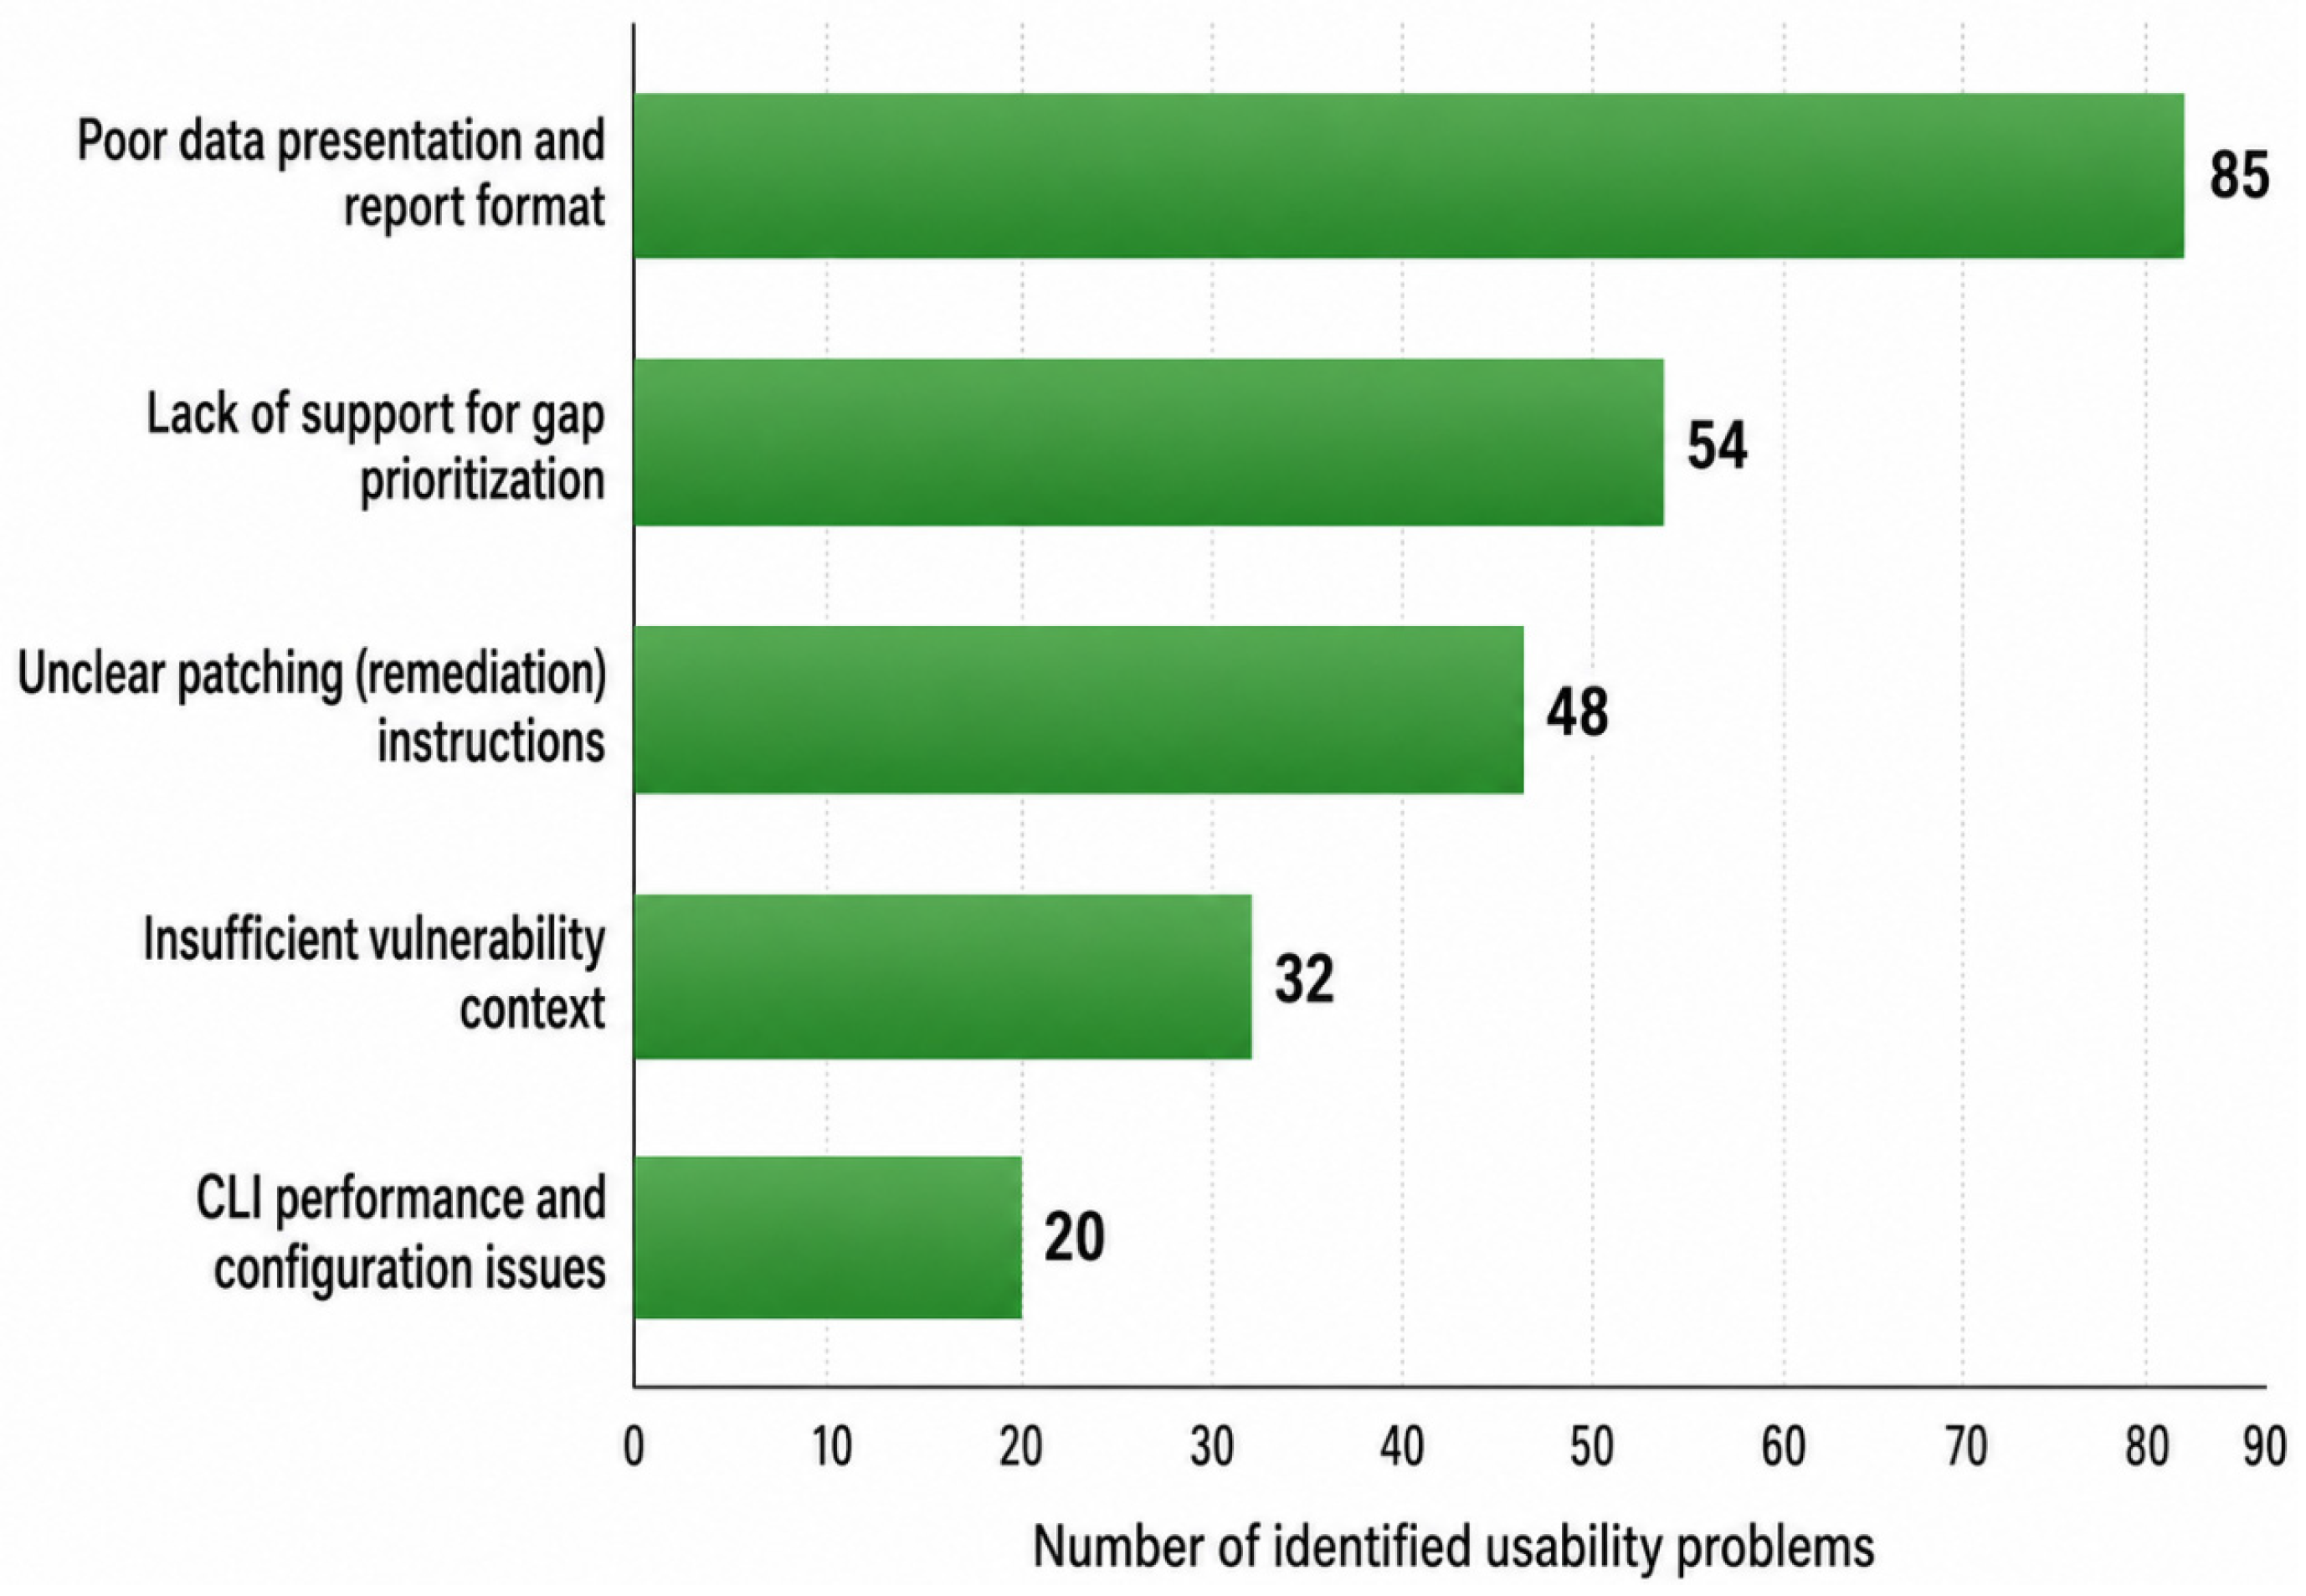
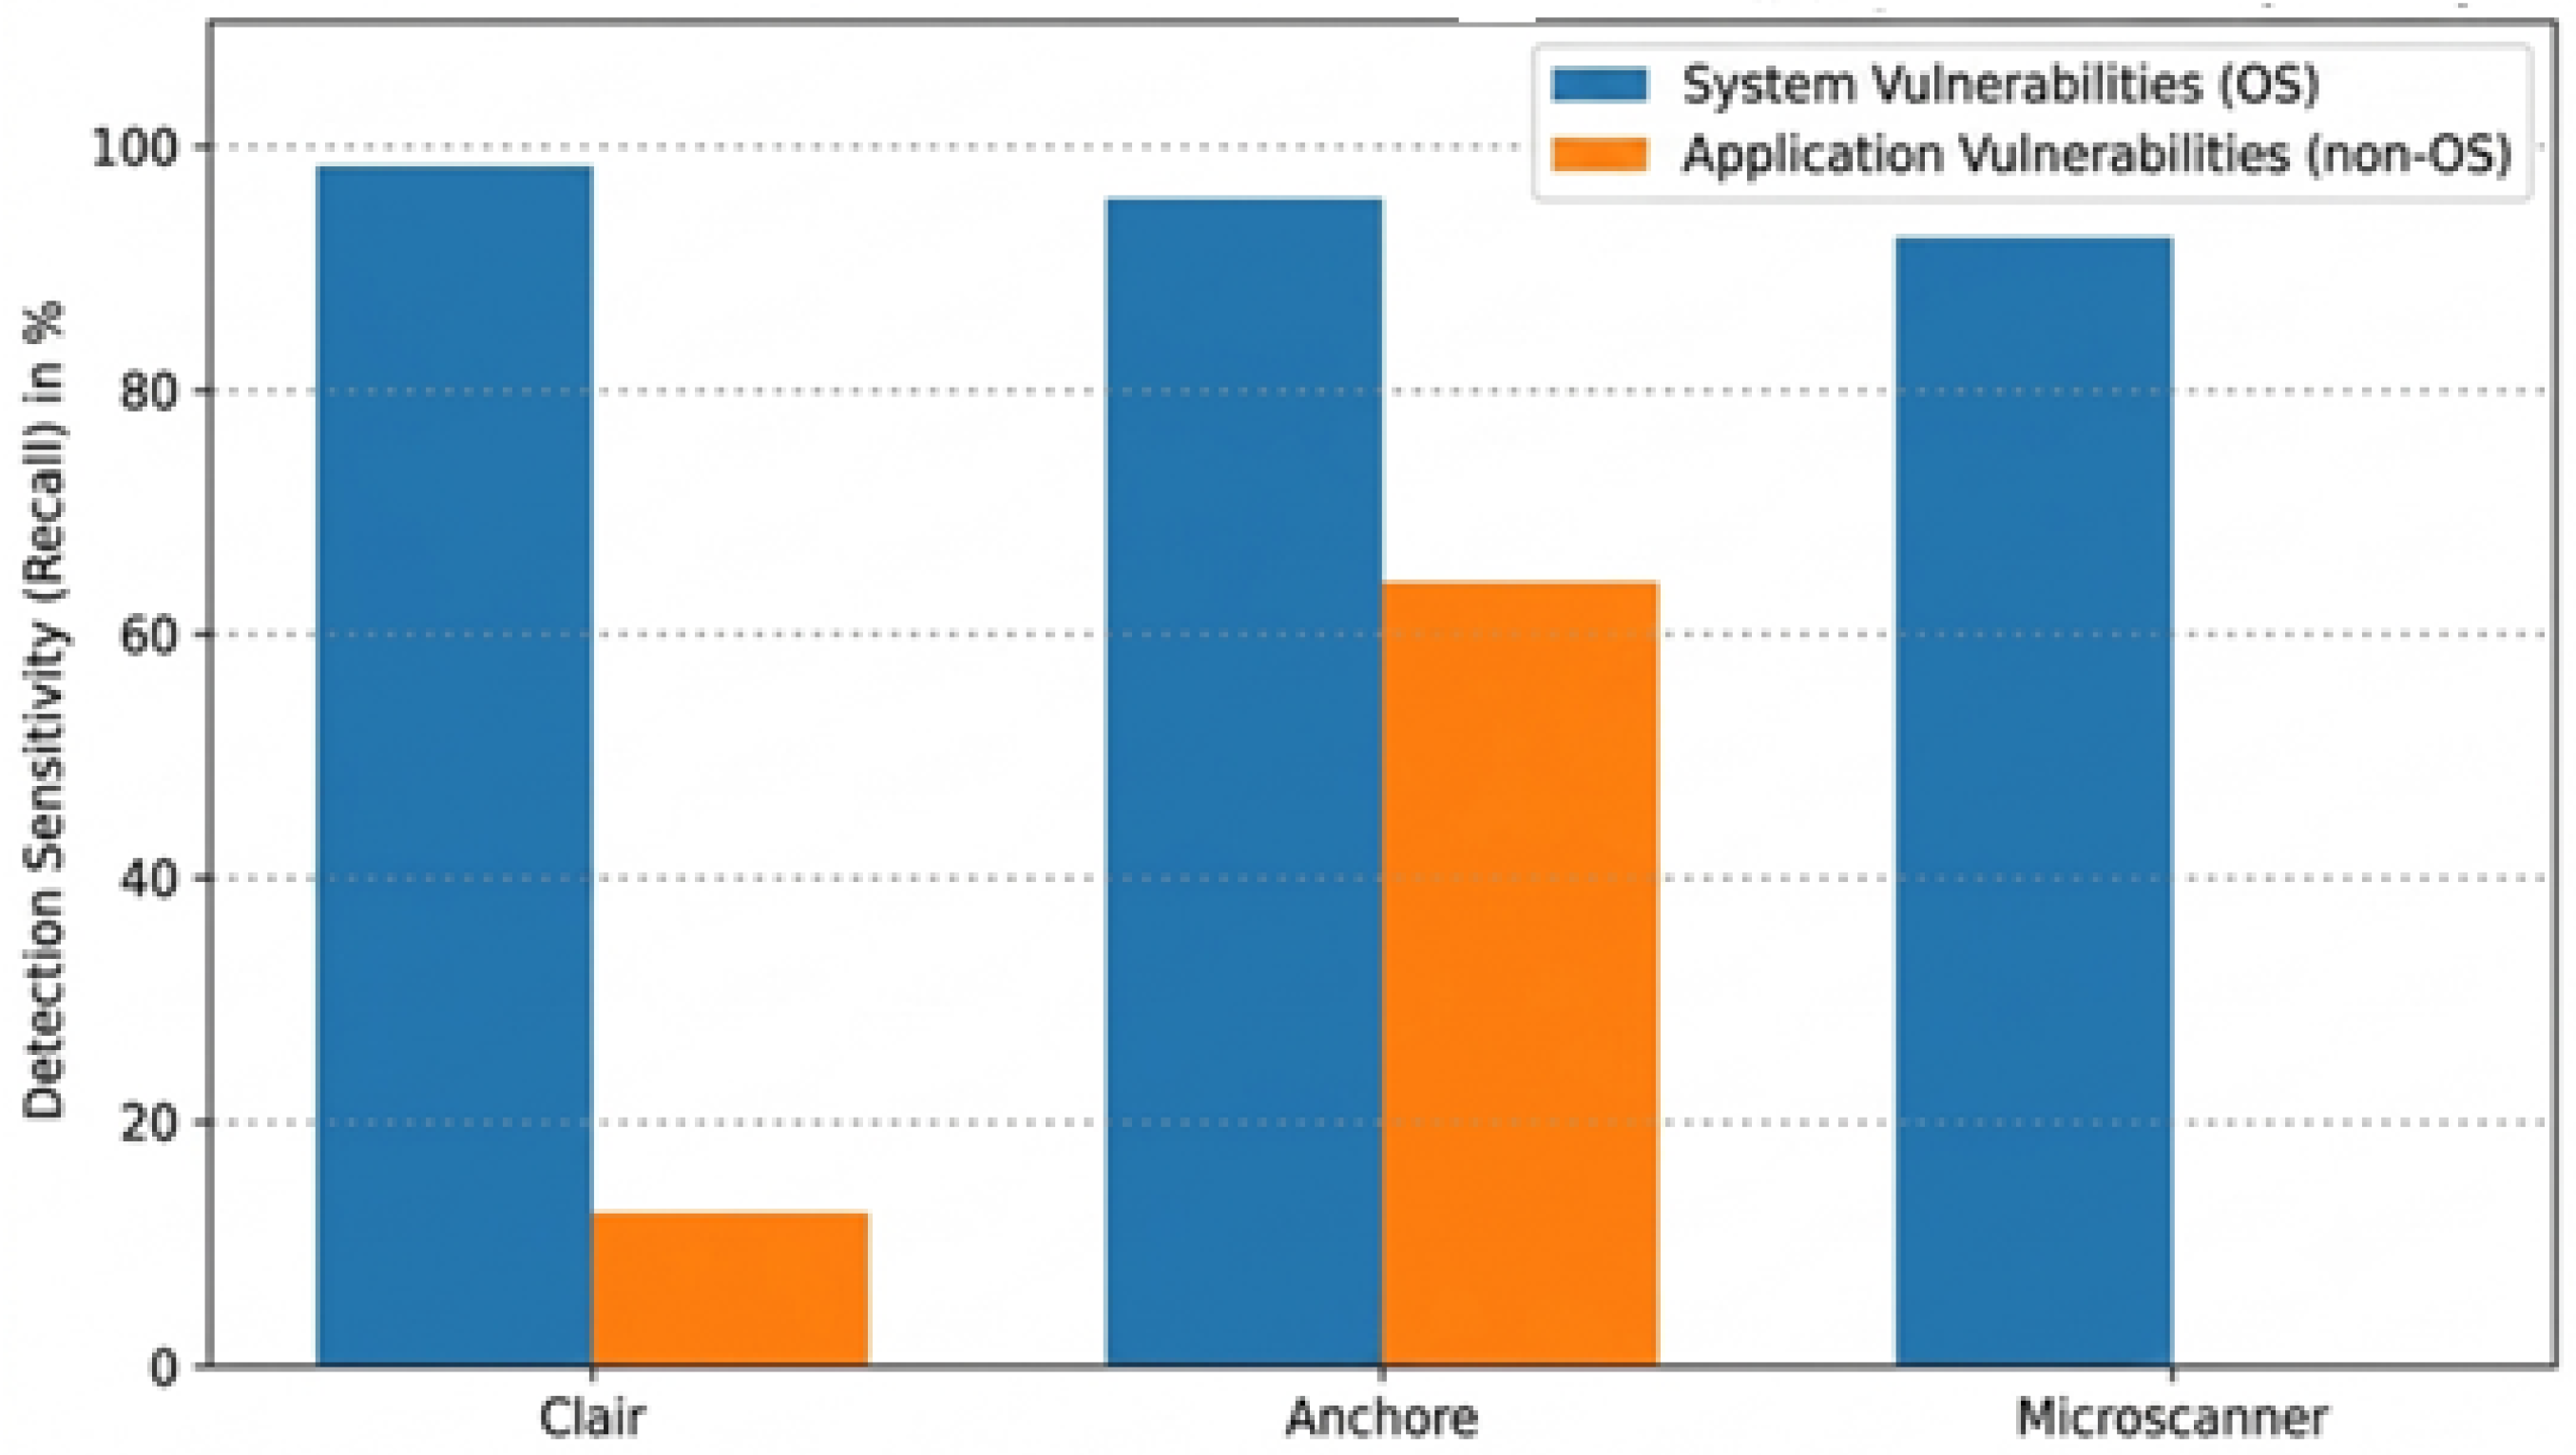

Disclaimer/Publisher’s Note: The statements, opinions and data contained in all publications are solely those of the individual author(s) and contributor(s) and not of MDPI and/or the editor(s). MDPI and/or the editor(s) disclaim responsibility for any injury to people or property resulting from any ideas, methods, instructions or products referred to in the content. |
© 2026 by the authors. Licensee MDPI, Basel, Switzerland. This article is an open access article distributed under the terms and conditions of the Creative Commons Attribution (CC BY) license.