


Abstract
Residential electricity tariff structures in emerging economies are often highly complex, dynamically combining regional climatic variables and multi-tiered price adjustments. In Mexico, despite a preferential scheme designed to mitigate seasonal expenditure fluctuations, baseline energy subsidies frequently fail to protect low-income households due to structural targeting inefficiencies based strictly on regional temperature thresholds rather than socioeconomic status. This study addresses this methodological and regulatory gap by developing the Energy-Economic Impact Index (EEII), a novel mathematical and heuristic framework that couples complex Increasing Block Tariffs (IBT) architecture with localized household income dynamics at the state level. The proposed methodology was comprehensively validated using synchronized biennial empirical datasets from all 32 Mexican states, combining Federal Electricity Commission (CFE) billing data and National Surveys of Household Income and Expenditures (ENIGH) spanning the 2018–2024 period. Quantitative results reveal a severe, non-linear escalation of the financial energy burden across the territory, demonstrating that rising residential electricity costs significantly outpaced domestic income growth trajectories. Notably, households situated within high-temperature geographic regimes (Tariffs 1D, 1E, and 1F) exhibited the most critical economic vulnerability, with the calculated energy cost impact absorbing up to 14.90% of the real monthly household income in 2024. Ultimately, the EEII framework proves to be a robust predictive and decision-support tool for energy policy planners aiming to optimize fiscal subsidy allocation, reduce energy poverty gaps, and mitigate socioeconomic risks in transition economies.
1. Introduction
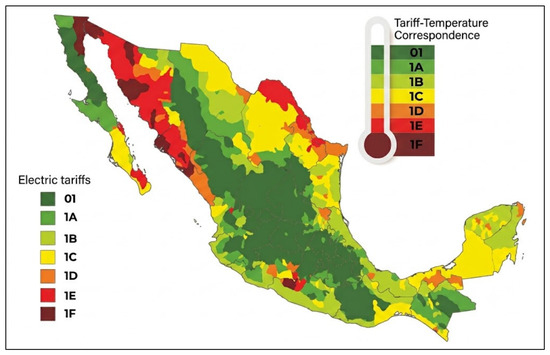
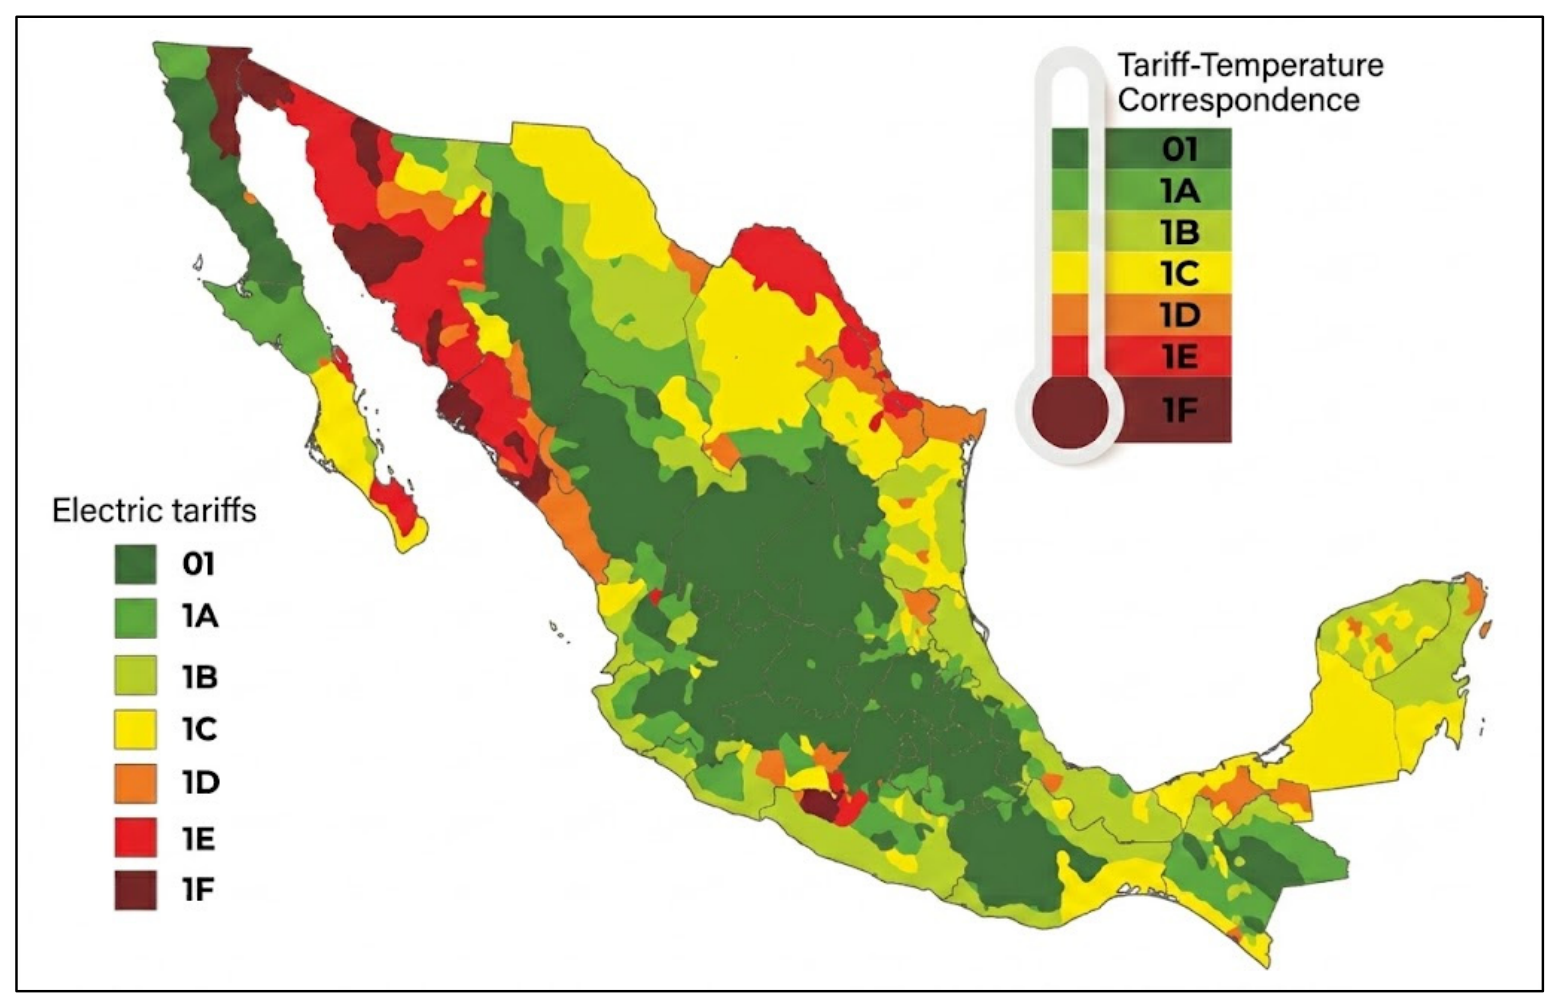
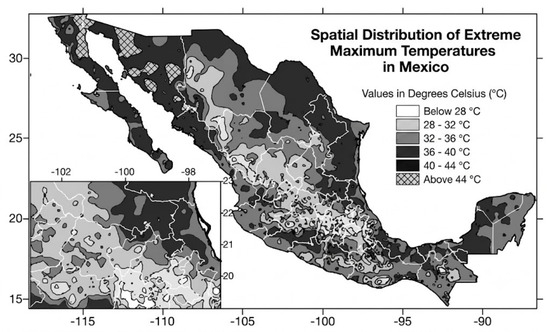
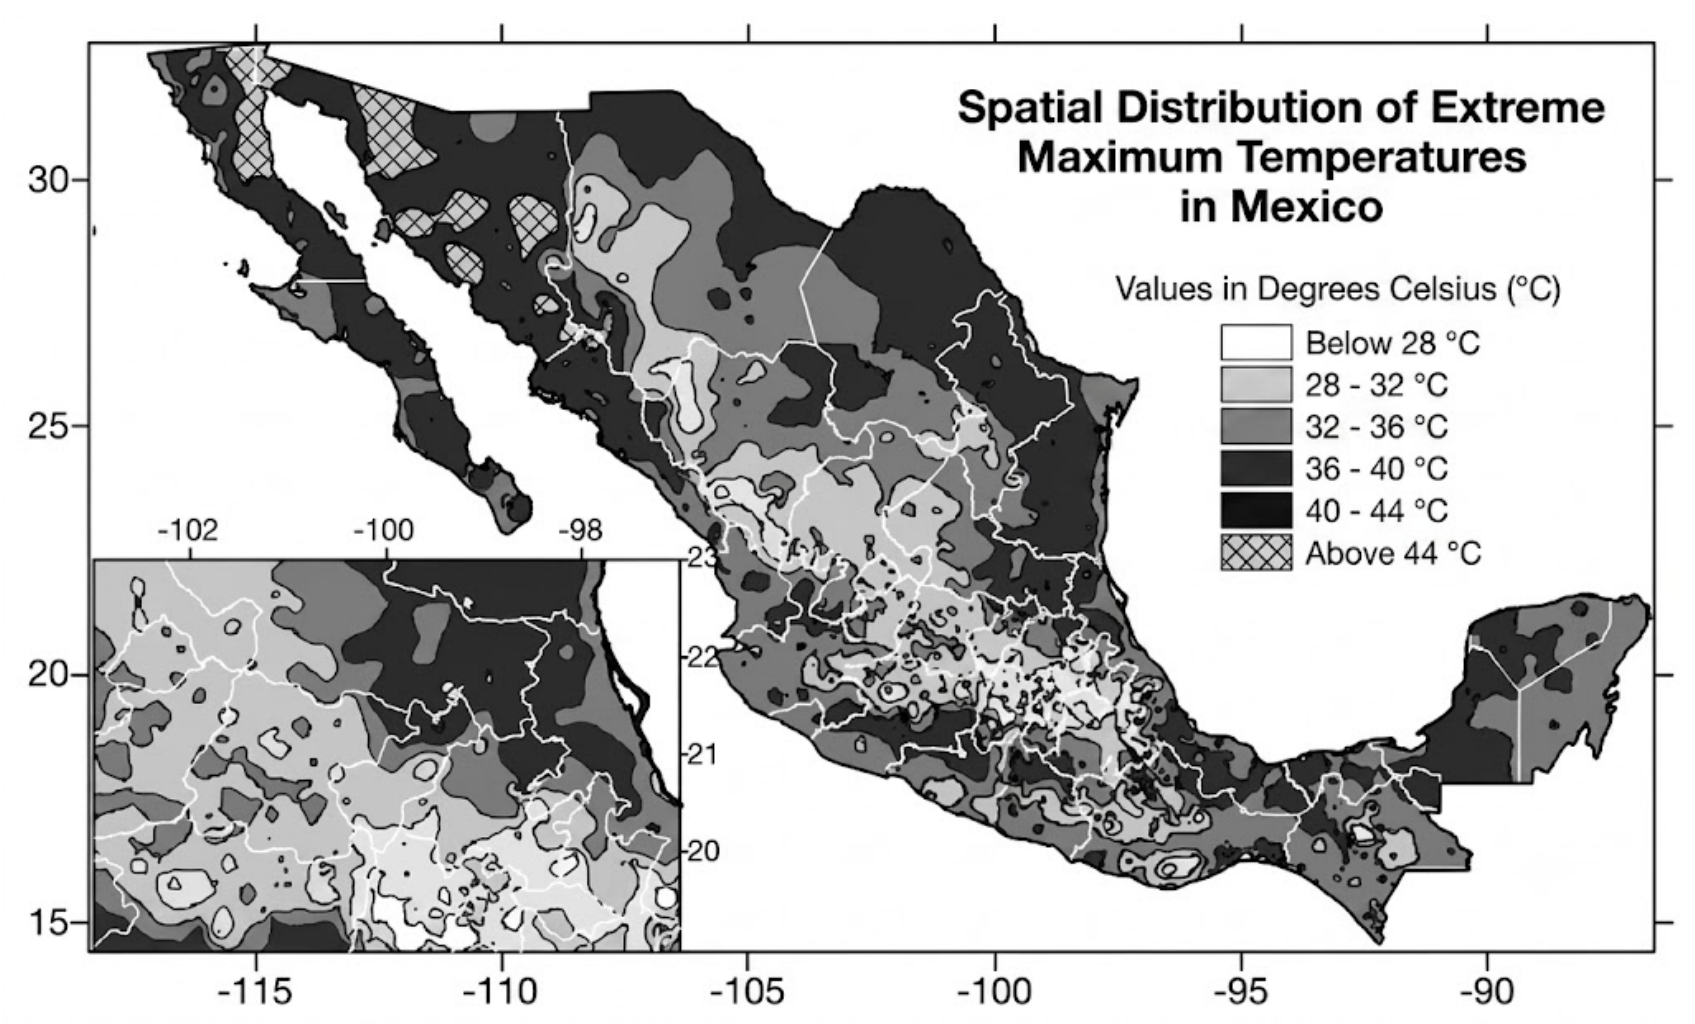
The literature frequently cites Mexico’s electricity tariff structure as one of the most complex in Latin America [1]. Residential tariffs are no exception to this complexity, as they dynamically combine regional climatic variables, increasing blocks of electricity consumption, and government subsidies based on geographical location [2,3]. Consequently, residential service is categorized into seven distinct tariff brackets across the Mexican territory: 1, 1A, 1B, 1C, 1D, 1E, and 1F (Figure 1) [4]. The threshold for each category is determined by the minimum average temperature recorded during the summer season within each specific region, resulting in the significant spatial diversity illustrated in Figure 1 [5]. Within this context, Mexico exhibits profound climatic diversity across its territory throughout the year due to its geographical configuration, which encompasses arid, tropical, temperate, and mountainous regions. This variation gives rise to a wide range of annual average temperatures, as depicted in Figure 2 [6]. This extensive thermal gradient directly influences household electricity consumption patterns, particularly in warm regions where the deployment of cooling systems significantly intensifies energy demand [7,8]. Empirical studies on residential demand have demonstrated that households located in high-temperature zones exhibit electricity consumption levels well above the national average, especially those utilizing air conditioning systems [9]. Consequently, substantial variability exists within the electricity consumption patterns of Mexican households. This variability is directly proportional to economic vulnerability, which impacts families asymmetrically depending on their income levels. For instance, during peak summer seasons in warmer regions, household electricity consumption escalates into higher consumption blocks established by the Federal Electricity Commission (Comisión Federal de Electricidad, CFE). In these upper blocks, the marginal cost per kilowatt-hour (kWh) increases substantially as government subsidies are progressively phased out [10]. To mitigate these fluctuations, the Mexican government implements a preferential tariff scheme based on seasonal summer adjustments and annual maximum average temperatures. Nevertheless, this increasing block tariff (IBT) architecture has generated intensive debate in the specialized literature regarding market incentives and budgetary inefficiencies [11,12]. While the baseline consumption blocks (basic and intermediate) receive substantial subsidies, the rapid loss of this benefit severely penalizes low-income families who lack access to energy-efficient technologies or optimal thermal insulation in their dwellings [13,14]. Furthermore, recent economic analyses indicate that the currently applied electricity pricing model suffers from significant targeting deficiencies, as subsidy allocation is fundamentally linked to regional temperatures rather than the socioeconomic status of the end-users. Consequently, higher-income segments of the population—who possess a greater capacity for electrical appliance acquisition—absorb a disproportionate share of the public resources allocated to alleviate electricity expenditures [15,16]. This structural imbalance not only constrains the state’s fiscal capacity due to the magnitude of the required public subsidies but also hinders the transition toward clean energy sources and residential photovoltaic microgeneration, while simultaneously widening structural equity gaps across the country’s diverse regions [17,18]. Therefore, accurately assessing the financial burden of electricity on Mexican households requires a comprehensive analytical framework that couples electricity expenditure realities with the localized dynamics of income inequality at the state level [19,20]. Recent literature addressing residential electricity sectors in emerging economies can be broadly categorized into three domain streams: (i) econometric evaluations of residential demand under Increasing Block Tariff (IBT) mechanisms [2,10]; (ii) energy poverty and affordability frameworks [21,22], and (iii) spatial analyses of climate-driven energy vulnerability [6,8]. Despite these contributions, significant methodological gaps remain. Most econometric models simplify tariff structures into average prices, failing to capture the non-linear cost jumps occurring when household consumption crosses volumetric block thresholds ( and ). Conversely, traditional energy poverty frameworks rely on static, cross-sectional income metrics that fail to track compound price escalations () over longitudinal horizons. Consequently, there is a critical lack of integrated models capable of coupling piecewise tariff algorithms with localized household income dynamics across shifting climatic regimes. Based on the aforementioned factors, a complex intersection emerges among geography, climate, electricity pricing regulations, and household economics, highlighting the critical need to develop robust metric tools. Conventional indicators frequently fail to capture the dynamic impact of electricity costs on household income, primarily because they neglect temporal variations and the specific socio-economic conditions of each Mexican state. The proposed Energy-Economic Impact Index (EEII), tailored specifically to residential tariffs, addresses this methodological gap [21]. This index establishes a heuristic framework that systematically quantifies the proportion of real monthly household income absorbed by electricity expenditures [23,24]. By integrating empirical data from consumption records and institutional income surveys, it becomes possible to precisely identify the population segments under the greatest economic distress [25,26] relative to their assigned tariff categories. Consequently, the EEII serves as an essential scientific instrument to evaluate current energy policies and to guide the design of a more equitable, efficient, and progressive tariff framework in Mexico. Conventional static indicators frequently fail to capture the dynamic impact of electricity costs on household income because they neglect temporal variations, compound price escalations, and the multi-tiered structure of Increasing Block Tariffs (IBT). To address these limitations, the proposed Energy-Economic Impact Index (EEII) incorporates a dynamic compound annual growth rate () that captures longitudinal socio-energetic divergence under shifting regional temperature regimes. Table 1 provides a comparative synthesis contrasting traditional energy burden metrics against the proposed EEII framework. To bridge these literature gaps, this study provides three key scientific contributions:
Figure 1.
Geographic distribution of residential electricity tariffs in Mexico and their correlation with regional temperature thresholds [3].
Figure 2.
Spatial distribution of extreme maximum temperatures across Mexico, illustrating regional thermal gradients [5].
Table 1.
Comparative Summary of Energy Burden Indicators and Methodological Scope.
Formulation of a Dynamic Metric: We develop the Energy-Economic Impact Index (EEII), coupling piecewise Increasing Block Tariff (IBT) functions with compound annual growth rate () metrics to eliminate static tracking biases.
Empirical Multi-Period Synchronization: We construct a synchronized 2018–2024 socio-energetic database integrating CFE billing parameters and ENIGH real income datasets across all 32 Mexican federal states.
Policy-Oriented Spatial Mapping: We introduce a multi-dimensional Socio-Energetic Space map and density matrix to locate regressive subsidy targeting and support adaptive tariff modernization in transition economies.
2. Theoretical Framework and Econometric-Energy Modeling
2.1. Mathematical Structure and Subsidies of the Increasing Block Tariff (IBT) System
Residential electricity pricing in emerging economies often utilizes structured regulatory frameworks to balance utility cost recovery with social welfare objectives [27]. In the Mexican power sector, the state utility operates under an Increasing Block Tariff (IBT) framework, where the unit price of energy increases stepwise as consumption crosses specific volumetric thresholds [28], where exceeding the designated baseline threshold (the High Consumption Limit, DAC) results in the complete removal of government subsidies. To formalize this structure, let ECT represent the total monthly electricity consumption of a household (expressed in kWh). Under the IBT architecture, this volume is non-linearly segmented into three distinct operational blocks: basic consumption (ECB), intermediate consumption (ECI), and surplus consumption (ECS). The segment volumes are mathematically constrained by the upper limits of the basic block (LB) and the intermediate block (LI) as follows:
Consequently, the total monthly cost of electricity consumption (, expressed in MXN) is determined by mapping each consumption block to its corresponding heavily subsidized or non-subsidized unit price rate (, , and ), defined by:
where
: Total monthly household electricity consumption ().
: Electricity volume allocated to the baseline basic block ().
: Electricity volume allocated to the intermediate block ().
: Electricity volume designated as surplus or high-demand consumption ().
: Volumetric upper limit parameter for the basic consumption tier ().
: Volumetric upper limit parameter for the intermediate consumption tier ().
: Total calculated monthly cost of electricity billing ().
: Unit pricing rate assigned to the basic block ().
: Unit pricing rate assigned to the intermediate block ().
: Unit pricing rate assigned to the surplus block ().
The structural variability of these operational parameters (, , , , and ) across the different regions of the country is comprehensively detailed in Table 2. As observed, the volumetric thresholds for subsidy eligibility dynamically expand as a function of the minimum average summer temperature recorded in each specific Mexican state, moving from the restrictive thresholds of Tariff 1 to the extended baselines of Tariff 1F.
Table 2.
Residential Electricity Tariff Classification in Mexico.
The spatial unit for tariff allocation is defined at the municipal level based on local thermal records from CONAGUA/SMN stations [29] rather than uniform state boundaries, explaining why states like Coahuila exhibit multiple coexisting tariffs (see Table 3). Governed by DOF agreements, allocation follows an ascending rule: Tariff 1 acts as the baseline (), while Tariffs 1A to 1F are progressively assigned as the local 3-year average minimum summer temperature reaches , and , respectively.
Table 3.
Real Annual Household Income Baseline by State in Mexico (2018–2024) [24] and its Percentage Variance.
2.2. Mathematical Formulation and Non-Linear Compound Growth of the EEII
To evaluate how these multi-tiered tariff structures stress household finances, it is necessary to establish a static socio-energetic baseline metric. The Economic Impact Percentage () for a specific federal state during a designated month is defined as the ratio between the household electricity expenditure () and the monthly household income (), formalized as follows:
where
: Static Economic Impact Percentage representing the immediate energy budget burden ().
: Average household electricity expenditure within state during month ().
: Average Monthly Household Income compiled for state during month ().
While the captures localized, cross-sectional financial stress, it fails to account for longitudinal macroeconomic variances, shifting regional climate regimes, and compound annual tariff escalations [22]. To overcome this linear bias, the temporal trajectory of the annual average impacts () must be analyzed dynamically.
Let and represent the annualized socioeconomic energy burden baseline at the initial period () and the final period (), respectively. The Compound Annual Growth Rate of the energy burden () over an analytical horizon of years (where ) is mathematically defined as:
where:
: Compound Annual Growth Rate of the household energy financial burden ( as a decimal).
: Annual average baseline economic impact at the starting multi-period checkpoint ().
: Annual average final economic impact at the terminal longitudinal checkpoint ().
: Total chronological duration of the evaluated timeframe ( years for the 2018–2024 scope).
The calculated represents a non-linear compounding structural factor that reflects the systemic divergence between state utility price indexes and national household income trajectories. Ultimately, the dynamic Energy-Economic Impact Index () for any intermediate or prospective year (where ) is formulated as a function of the compounding expansion of historical socio-energetic baselines:
Alternatively, the index can be generalized directly from the absolute historical baseline () utilizing the following multi-tiered exponential expression:
where:
: The dynamic Energy-Economic Impact Index projected for period (Dimensionless/Index unit).
: The calculated socioeconomic energy burden from the immediate preceding year ().
: The empirical baseline economic impact percentage calculated at the initial year ().
This integrated econometric-energy formulation eliminates tracking anomalies caused by flat linear projections, ensuring that the dynamic pressure exerted by climate fluctuations and block tariff structures on residential economics is rigorously captured for policy design [30].
3. Results and Empirical Validation
3.1. Data Synchronization and Socio-Energetic Baselines
The experimental verification of the econometric-energy modeling framework required a rigorous multi-period data synchronization. Given that the residential electricity parameters published by the CFE operate under annualized timelines, the socioeconomic datasets derived from the National Survey of Household Income and Expenditures () were structured under its specific biennial execution frequency. Consequently, the comparative horizon was consolidated into a longitudinal framework incorporating tracking checkpoints for the years 2018, 2020, 2022, and 2024. In this framework, household parameters represent state-level average representative domestic units without explicitly stratifying by individual occupancy counts.
Table 3 presents the calibrated real annual household income (adjusted for inflation using the Consumer Price Index [INPC] and expressed in constant MXN) across the 32 Mexican states, establishing the baseline macroeconomic diversity under the assumption of stable intra-annual distribution behaviors. The synchronized empirical datasets demonstrate high cross-sectional inequality; for instance, the terminal year 2024 exhibits a severe structural gap between the lowest regional income capacity recorded in Chiapas ($ MXN/month) and the highest baseline observed in Nuevo León ($ MXN/month).
Concurrently, the absolute annual electricity consumption aggregates were mapped across their corresponding territorial jurisdictions to extract the real household energy inputs (, expressed in ), as consolidated in Table 4. The intersection of these variables confirms that macro-climatic regimes act as a primary forcing parameter, yielding a distinct consumption expansion in high-temperature zones where space cooling is mandatory.
Table 4.
Total Annual Residential Electricity Consumption by Mexican State (kWh/year).
3.2. Piecewise Cost Disaggregation and Cross-Sectional EIP Trajectories
Utilizing the pricing matrices established for the increasing block tariff tiers (Table 5), the monthly household electricity expenditure () was calculated by validating the multi-tiered piecewise limits defined in Section 2.1. The electricity rates compiled in Table 4 correspond to integrated final prices regulated by the Energy Regulatory Commission (CRE), which incorporate generation, transmission, distribution costs, and VAT, with baseline tiers receiving direct fiscal subsidies from the Federal Government via CFE Suministrador de Servicios Básicos.
Table 5.
Electricity prices for residential tariffs by consumption block tier.
To demonstrate the mathematical sequencing, a validation case was executed for the baseline period of January 2018 in the state of Aguascalientes. With a synchronized annual demand profile yielding an monthly energy input of , the volumetric basic boundary () and intermediate constraint () defined for Tariff 1 coexisted as follows:
Mapping these block allocations to the historical rate metrics ( MXN/kWh and MXN/kWh) yields the absolute financial transaction value via Equation (4):
Replicating this computational optimization across all 32 federal entities enabled the cross-sectional evaluation of the static immediate energy budget burden (), as shown in Table 6 for the initial multi-period checkpoint.
Table 6.
Electricity costs by Mexican state under Tariff 1 for January 2018.
By contrasting these calculated expenditure tracking points against the socioeconomic baseline (), the multi-period evolutionary paths of the localized financial stress were obtained. Table 7 provides the explicit comparison of the calculated for the structural boundary constraints of Tariff 1 regimes between January 2018 and December 2024. The empirical evidence confirms an alarming, asymmetrical growth trend; the average national energy budget burden for Tariff 1 increased from to , driven by localized cost increases that severely outpaced household compensation capacities.
Table 7.
Comparison of the for Tariff 1 between January 2018 and December 2024.
3.3. Econometric Consolidated Metrics and CAGR Calculation
To verify the non-linear behavior asserted at the beginning of this research, Table 8 presents the consolidated average metrics (Cost, Demand volume, and Percentage Impact) across the entire residential tariff spectrum (Tariffs 1 to 1F). Table 8 compiles the consolidated state-level averages categorized by residential tariff, where ‘Cost’ indicates monthly expenditure (MXN/month), ‘kWh’ reflects monthly consumption volume (, kWh/month), and ‘%’ represents the calculated Economic Impact Percentage ().
Table 8.
Compound Annual Growth Rate (CAGR_EB) and Annual Escalation Index (1+CAGR_EB) across Residential Tariff Categories in Mexico.
The quantitative discrepancies observed among the different structural averages validate that traditional linear index systems introduce significant tracking distortions, confirming that the localized socio-energetic percentage average () constitutes the only unbiased input capable of anchoring the dynamic indicator architecture. By substituting these unweighted multi-period tracking points ( and ) into the exponential mathematical formulation defined in Equation (6), the Compound Annual Growth Rate of the household energy burden () was calculated for each tariff system over the years longitudinal duration. The normalized results are compiled in Table 9, proving that high-temperature regimes experience the most severe compound annual growth rates ( for Tariff 1F).
Table 9.
Annual Index for residential tariff structures in Mexico.
3.4. Dynamic Projections of the Energy-Economic Impact Index (EEII)
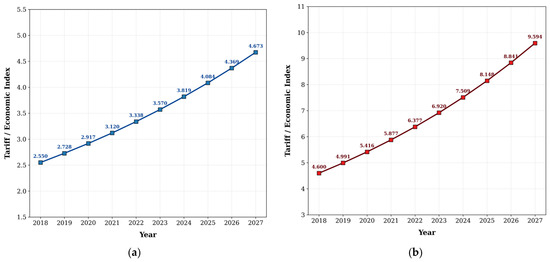
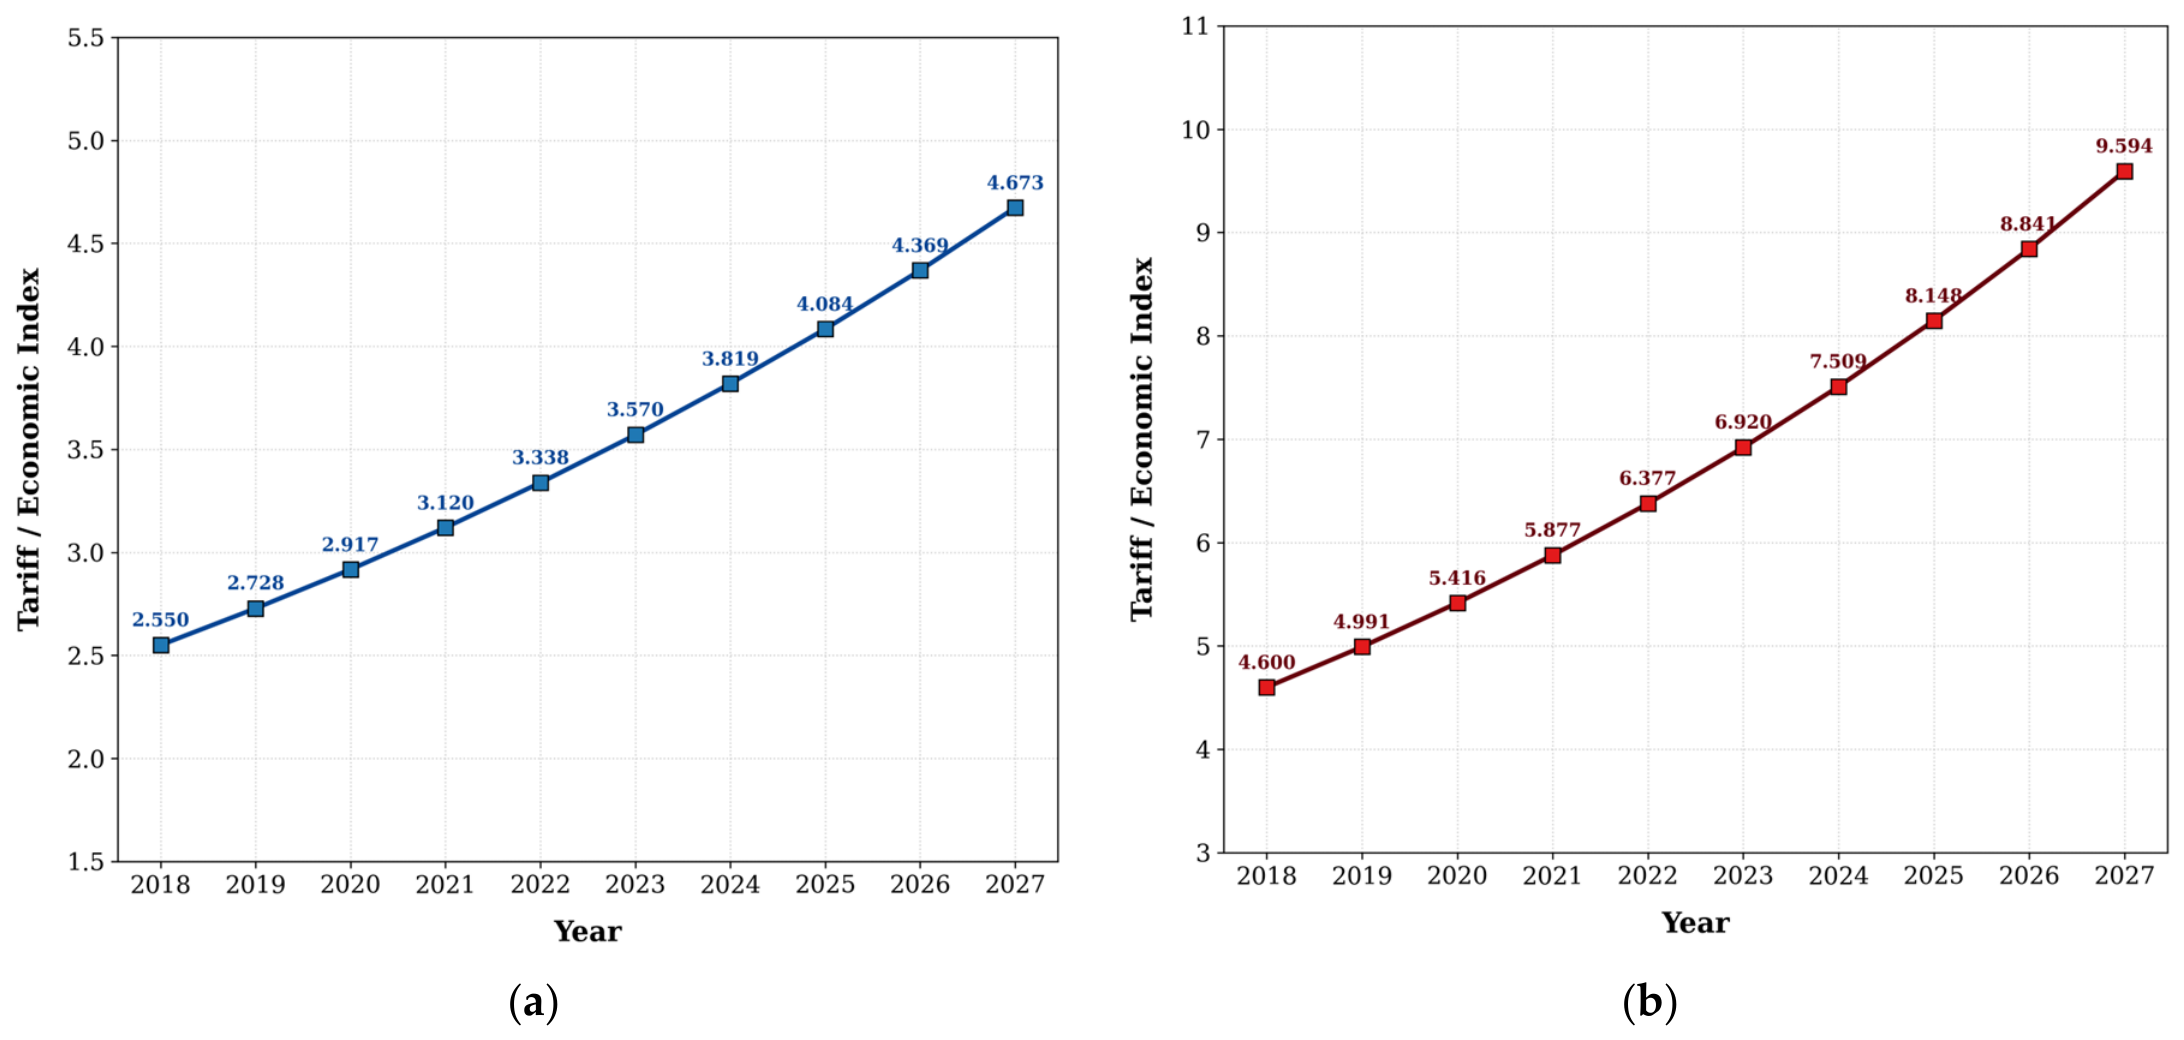
The determination of the enabled the deployment of the dynamic Energy-Economic Impact Index () as an evolutionary forecasting instrument via Equation (8). To illustrate its prospective utility, Figure 3 demonstrates the dynamic tracking and projection paths of the computed across a ten-year continuous horizon (2018–2027). Specifically, Figure 3a illustrates the continuous evaluation for temperate areas operating under the baseline bounds of Tariff 1, whereas Figure 3b outlines the compounding trajectory for regions subject to severe thermal gradients under the structural limits of Tariff 1D. The longitudinal trends illustrated in these subfigures visually demonstrate a critical, climate-induced socioeconomic vulnerability. As observed in Figure 3a, households categorized under Tariff 1 experience a managed escalation of their energy burden, with the projected index reaching an . Conversely, Figure 3b reveals an aggressive compounding path where the domestic index climbs rapidly to , absorbing a disproportionate share of the household budget. This explicit divergence between the two projection paths confirms that current IBT subsidy mechanisms are structurally insufficient to isolate vulnerable residential economics from rising seasonal energy demands, highlighting the predictive robustness of the developed framework for strategic energy planning.
Figure 3.
Application of the Annual Index to calculate the EEII for Tariff 1 (a) and Tariff 1D (b) from 2018 to 2027.
3.5. Methodological Guide for the Interpretation of the Socio-Energetic Space
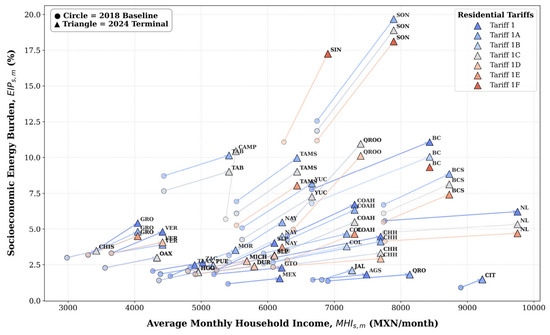
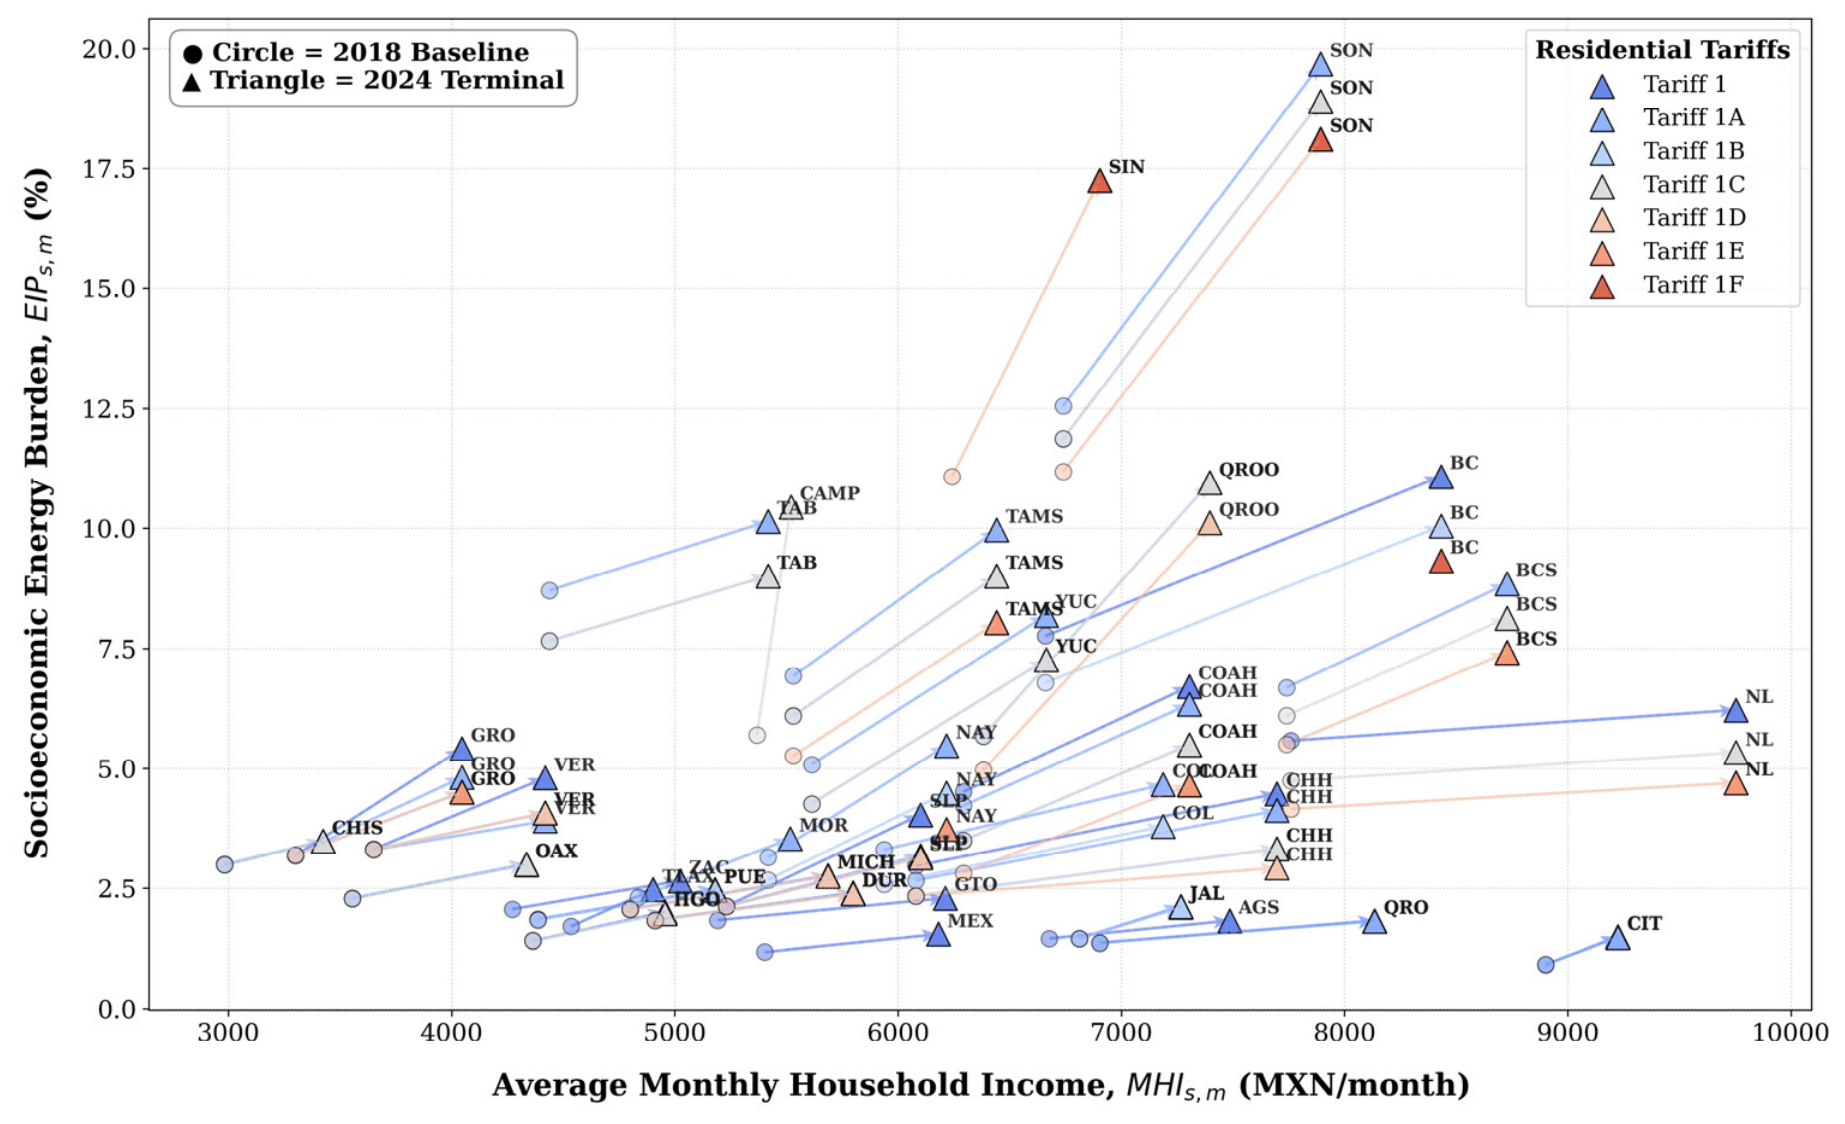
This section provides a structured, step-by-step framework to correctly interpret the multi-dimensional mapping illustrated in Figure 4. The graphical space avoids traditional flat tabular constraints by simultaneously coupling macroeconomic capacities, regulatory tariff design, and compound temporal trajectories.
Figure 4.
Socio-Energetic Space Map: Structural Burden Trajectories and Regional Polarization.
Step 1: Establishing the Coordinate Boundaries (Axes Alignment)
- (1)
- The Horizontal Axis (Economic Baseline): The reader should first observe the horizontal displacement, which evaluates the Average Monthly Household Income ( expressed in MXN). Movement toward the right quadrant indicates states with higher purchasing power and robust macroeconomic dynamics (e.g., Nuevo León), whereas clustering toward the left quadrant isolates lower-income regional contexts (e.g., Chiapas).
- (2)
- The Vertical Axis (Financial Stress): The vertical displacement tracks the Socioeconomic Energy Burden ( expressed in %). A higher position on this axis indicates that residential electricity costs absorb a critical, disproportionate percentage of the household budget, directly signaling vulnerability and energy poverty risks.
Step 2: Decoding Symmetries via Marker Shapes and Colors
- (3)
- Temporal Horizon Markers: The temporal dimension is operationalized through geometric variations. The circular markers (●) act as the definitive baseline anchor representing the country’s socio-energetic state in 2018. Conversely, the triangular markers (▲) denote the terminal status of the entities during 2024.
- (4)
- Climatic and Tariff Severity: The color spectrum serves as a proxy for regional thermal gradients. The visualization transits from cold blue and green tones—which represent temperate geographic zones under Tariff 1—toward aggressive yellow, orange, and red indicators that isolate extreme high-temperature jurisdictions governed by Tariffs 1E and 1F.
Step 3: Vector Trajectory and Polarization Analysis
- (5)
- Horizontal Vectors (Balanced Development): States experiencing balanced growth display horizontal vector arrows that move smoothly to the right with minimal vertical slope. This indicates that local household income increases successfully neutralized electricity price adjustments. As observed, Tariff 1 regions remain stable within the lower boundaries of the map ().
- (6)
- Vertical Vectors (The Regressive Trap): The most critical phenomena are identified by steep, near-vertical upward vector arrows, prominently displayed by orange and red markers (Tariffs 1E and 1F). These lines prove that even when a state achieved macroeconomic progress (horizontal shifting to the right), the climate-induced demand spikes and the aggressive steps of the Increasing Block Tariff (IBT) system forced households into high-stress economic coordinates.
Ultimately, this step-by-step reading confirms that the developed Energy-Economic Impact Index framework successfully captures regional polarization, proving that current electricity pricing structures exert a highly regressive financial pressure on the warmest and most vulnerable sectors of the population.
3.6. Cross-Tariff Density Analysis via Subscribed Thermal Gradient Maps
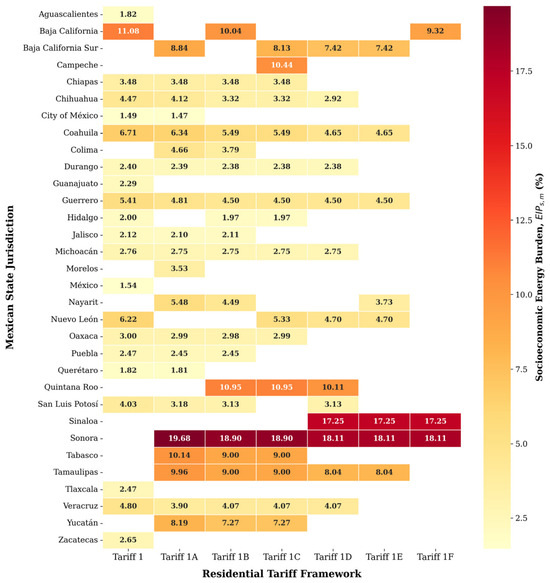
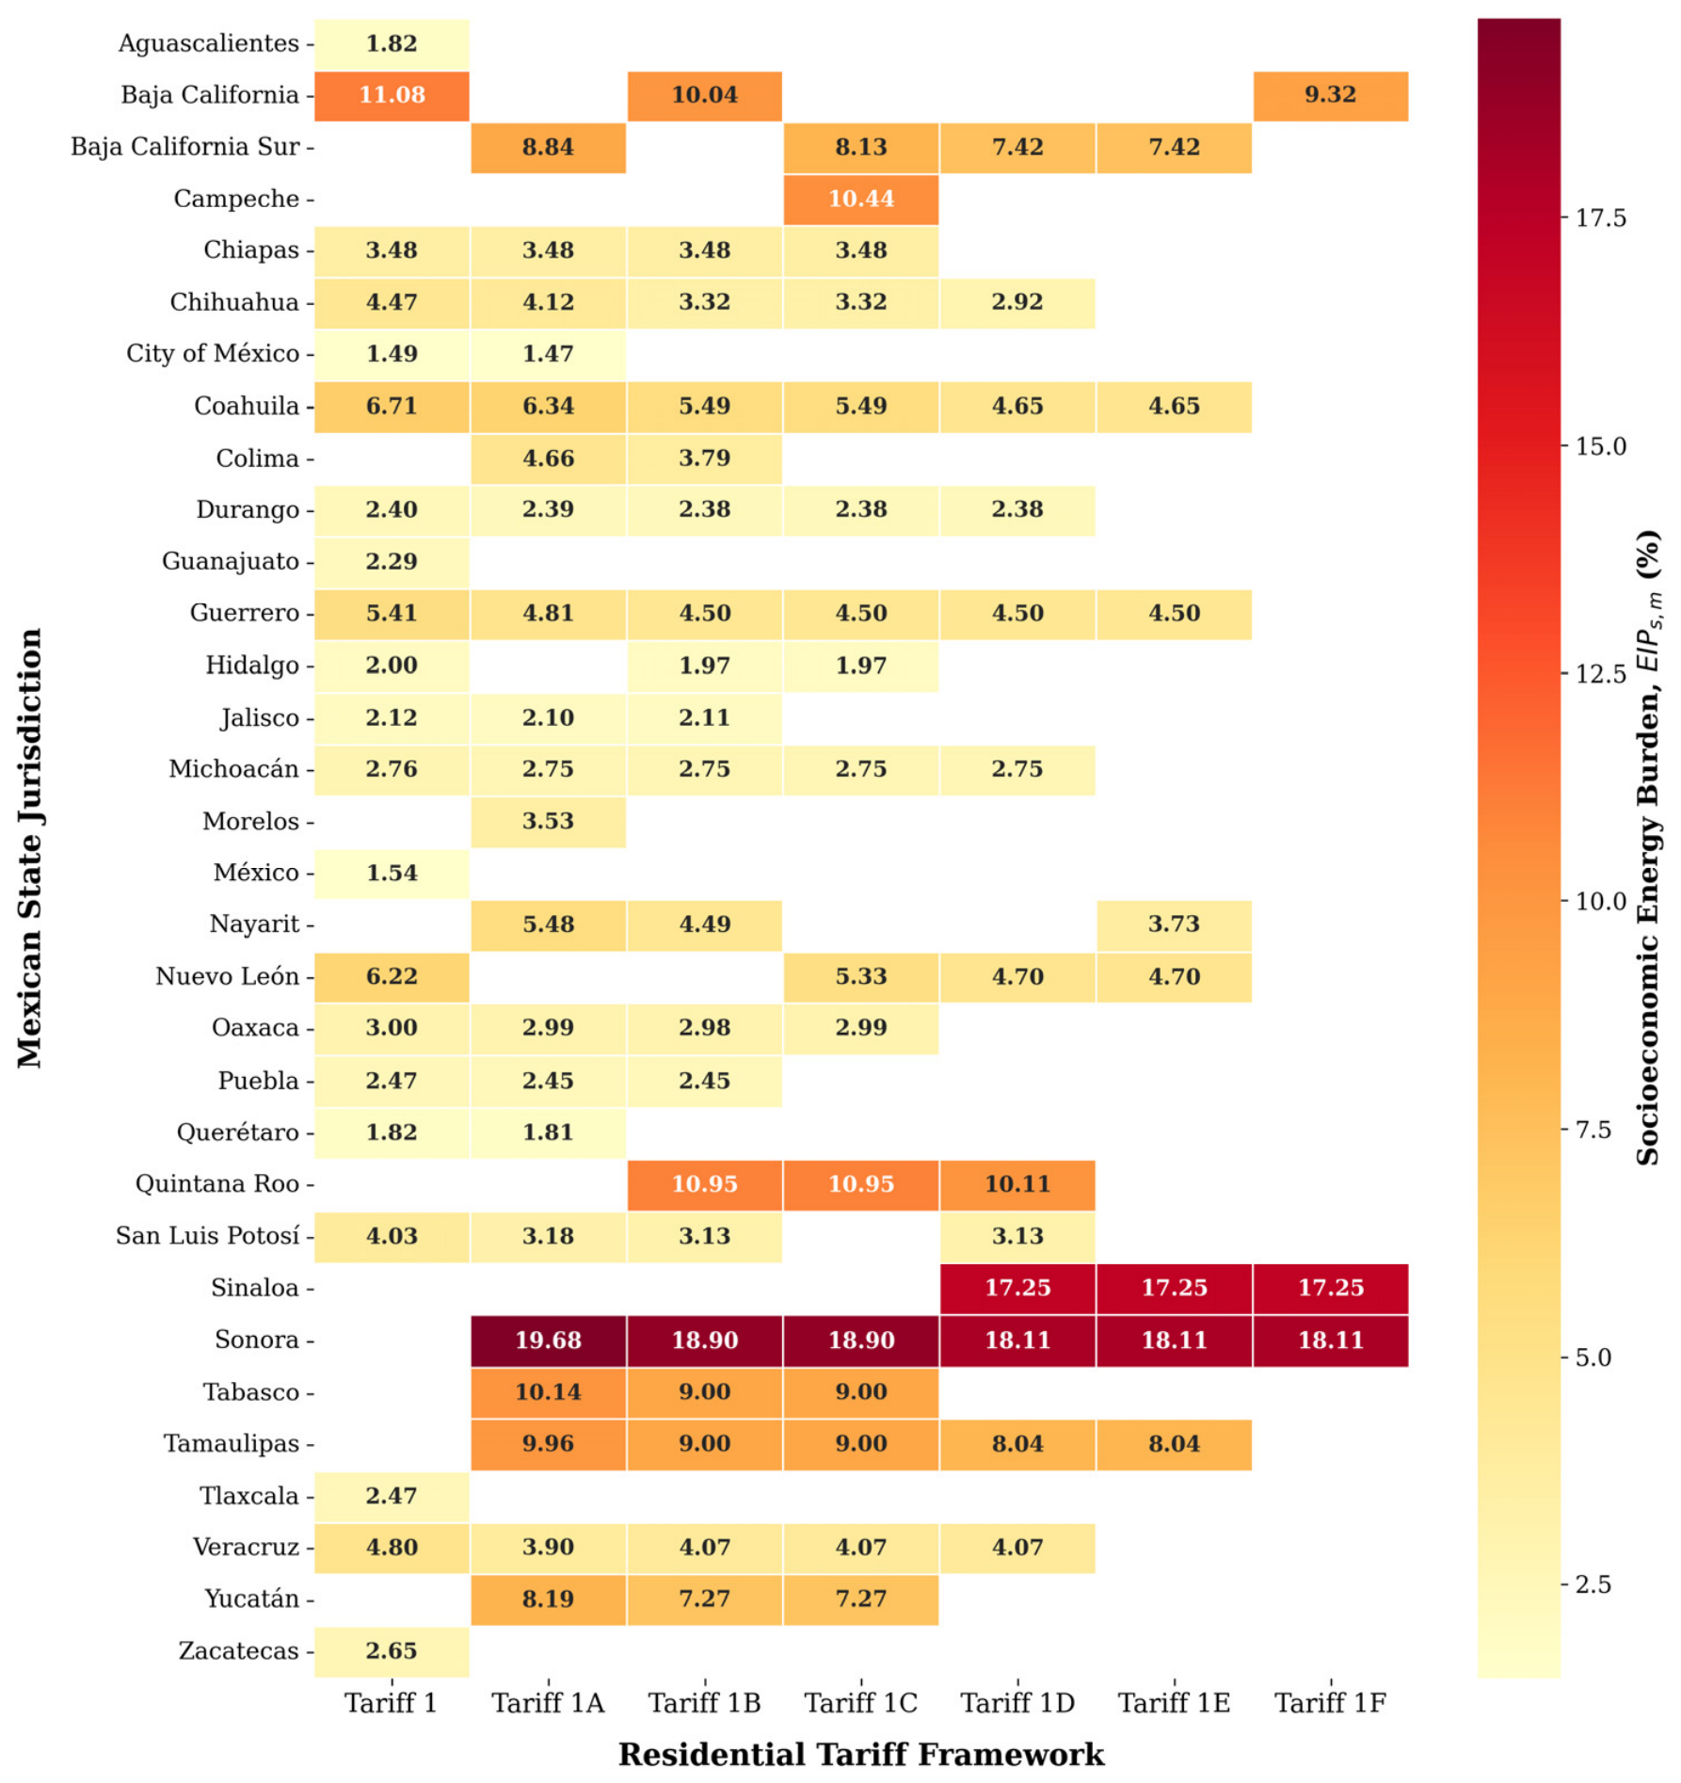
To comprehensively synthesize the extensive state-by-state micro-data configurations, a standardized socio-energetic density matrix was deployed. Figure 5 illustrates the consolidated cross-sectional intensity of the Socioeconomic Energy Burden () stratified simultaneously by state jurisdiction and regulatory climate brackets.
Figure 5.
Spatiotemporal evolution of the Socioeconomic Energy Burden (EIPs,m) across Mexican states (2018–2024).
The heat distribution confirms that geographic positioning acts as an unequal forcing driver. While temperate territories maintain stable, low-intensity configurations across basic brackets (), the socio-energetic intersection within extreme thermal zones triggers an acute regional critical cluster. This graphical matrix validates that isolating state aggregates into visual density clusters provides higher diagnostic performance for policy target identification than flat multi-page tabular records.
3.7. Macroeconomic Asymmetry and Divergence Indicators
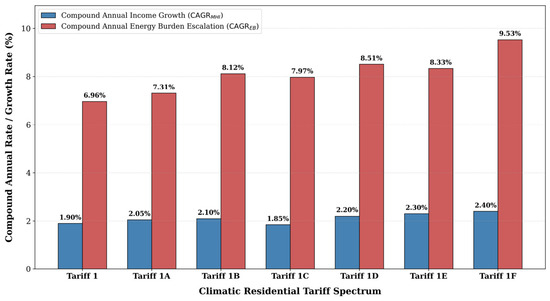
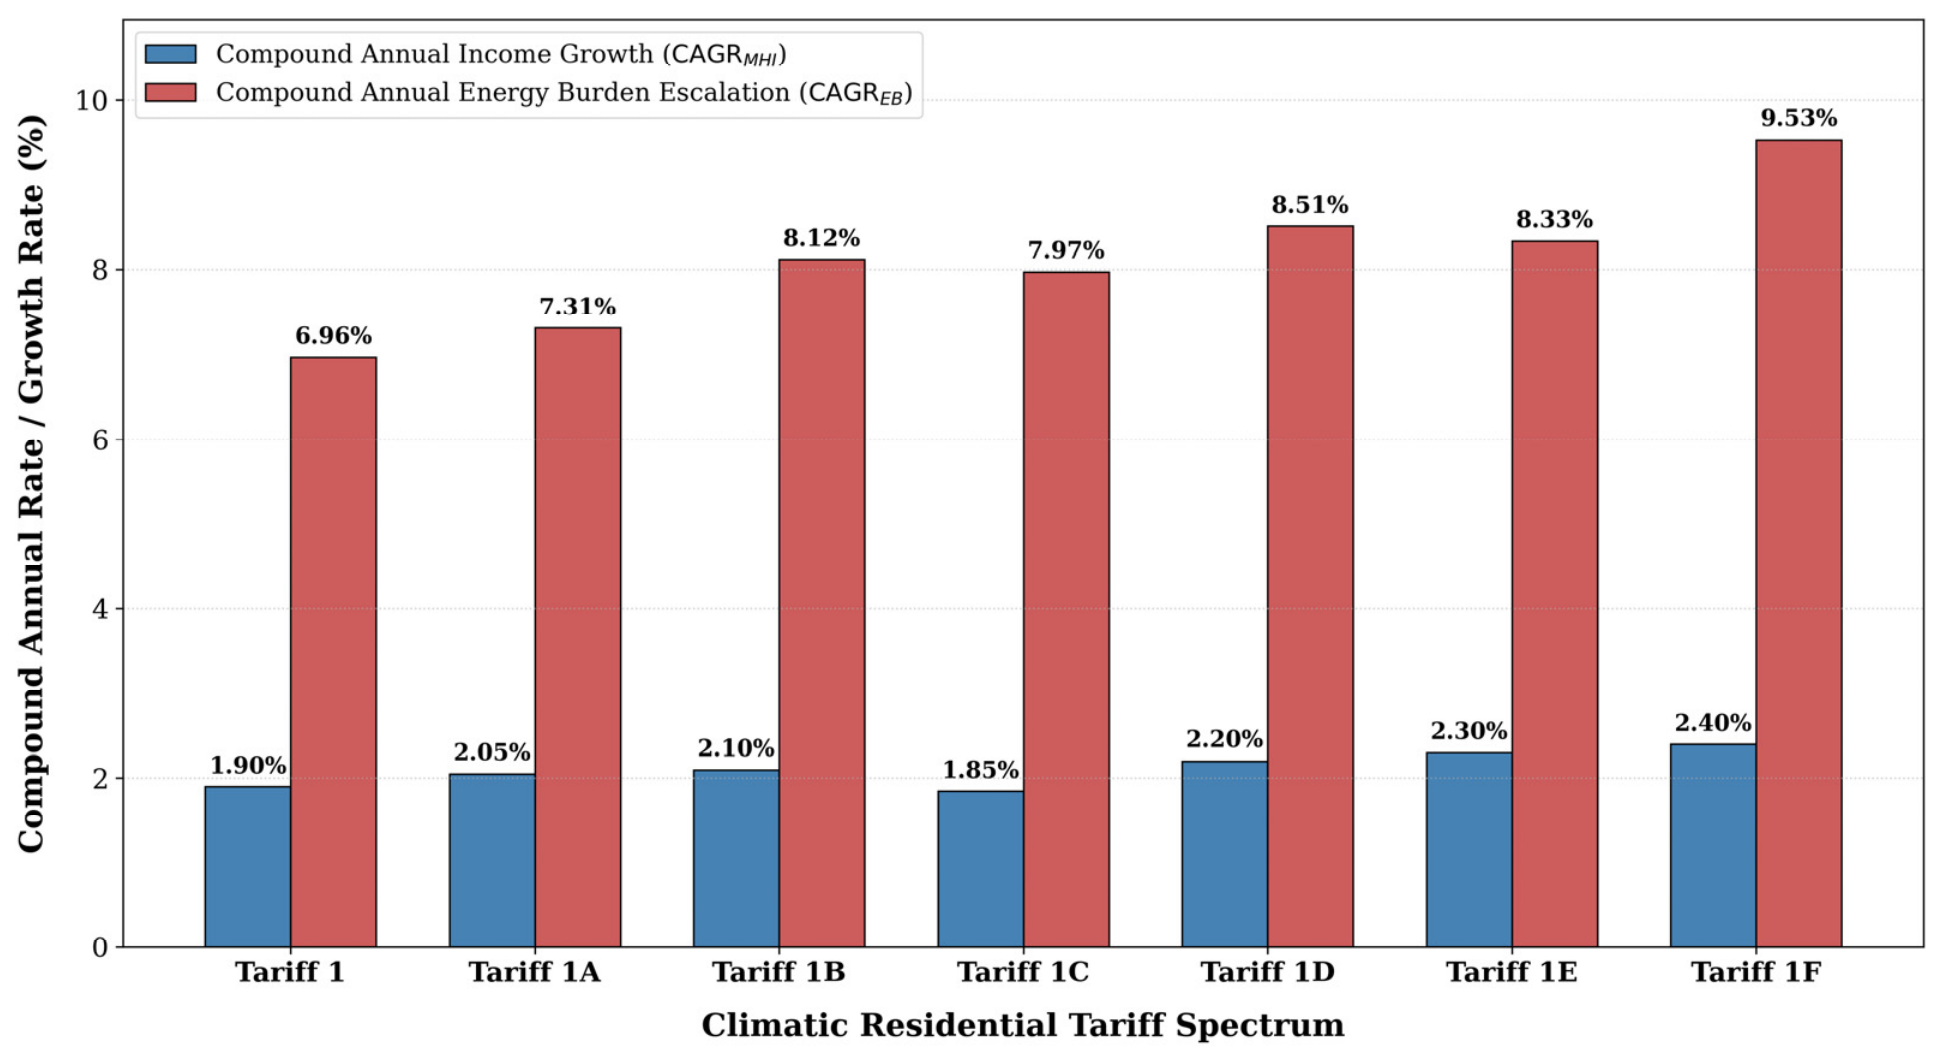
The structural polarization identified throughout the multi-period tracking horizon is ultimately driven by a severe growth trajectory mismatch. Figure 6 introduces a dynamic comparative framework confronting the Compound Annual Growth Rate of localized household incomes () against the parallel compound escalation rate of the financial energy burden () across the entire residential tariff spectrum.
Figure 6.
Macroeconomic Growth Mismatch: Income Trajectories vs. Energy Burden Escalation.
The empirical divergence illustrated in Figure 6 clarifies the asymmetric nature of the system. Within Tariff 1 environments, income trajectories closely matched pricing updates, preserving household affordability boundaries. However, as the regulatory framework shifts toward warmer regimes (Tariffs 1E and 1F), the energy budget burden parameters exhibit an exponential expansion that dramatically outpaces real domestic income growth. This diagnostic layout confirms that increasing block tariff architectures systematically dilute macroeconomic regional progress under severe climate stress.
4. Discussion
4.1. Tariff Asymmetry and the Regressive Subsidy Paradox
The cross-sectional tracking and dynamic spatial indicators compiled throughout this study expose a fundamental paradox within the Mexican residential electricity subsidy framework. Theoretically, the volumetric adjustments embedded within the Increasing Block Tariff (IBT) system are designed to protect domestic economies by expanding subsidized thresholds as a function of regional summer temperatures. However, the empirical synchronization of econometric data proves that this mechanism introduces a highly regressive financial pressure. When confronting these findings against classical economic theory, such as the non-linear redistributive models established by Borenstein [27], it becomes evident that pricing mechanisms based strictly on physical climate boundaries fail to isolate socioeconomic vulnerabilities. As demonstrated by the vertical trajectories in the socio-energetic map (Figure 4) and the thermal density matrix (Figure 5), low-income states subject to high thermal regimes (e.g., Sinaloa and Sonora) undergo an accelerated financial stress that absorbs up to 14.90% of their monthly income, effectively trapping vulnerable populations in high-vulnerability coordinates. Empirical evidence of this regressivity is reflected in how public fiscal resources are distributed under high-temperature regimes (e.g., Tariffs 1E and 1F). Because volumetric subsidy limits ( and ) expand automatically with regional temperature thresholds regardless of household socioeconomic status, wealthier income deciles absorb a disproportionate share of the absolute subsidy budget. Higher-income households typically reside in larger dwellings and possess greater purchasing power to deploy multiple high-capacity air conditioning units, thereby consuming large volumes of energy within expanded subsidized tiers. Conversely, lower-income households in the same warm regions absorb high financial stress ( reaching up to 14.90%) because their limited income capacity cannot offset energy costs even within subsidized blocks, highlighting a structural misallocation of public funds.
4.2. Climate-Driven Energy Vulnerability in Transition Economies
The non-linear growth trajectories modeled via the Compound Annual Growth Rate () demonstrate that tariff escalation systematically outpaces baseline household income growth across residential tiers, compounding the structural energy burden over time. The structural mismatch illustrated in Figure 6 clarifies that regional income variations are completely insufficient to absorb the dynamic escalation of electricity prices under severe climate stress. This phenomenon expands the conventional definition of energy poverty described in transition economies by authors like Faiella and Lavecchia [22] and Heindl [30]. Beyond statistical correlation, the relationship between regional thermal regimes, tariff structures, and household energy burdens exhibits a clear structural causality. Exogenous increases in regional maximum temperatures directly drive the physical requirement for indoor space cooling, accelerating monthly electricity consumption (). As households deploy cooling systems, their consumption volume exceeds the basic () and intermediate () volumetric thresholds, causally forcing energy demand into surplus tiers () where government subsidies are phased out and marginal unit prices () scale non-linearly. Consequently, climate operates not merely as a descriptive baseline parameter, but as an active physical driver that interacts with the piecewise pricing architecture to generate asymmetric financial stress. In the Mexican context, energy vulnerability is not merely a restriction of access to the electrical grid, but a dynamic financial risk forced by the interaction of rising seasonal temperatures and multi-tiered price adjustments. The progressive degradation of affordability boundaries in the warmest states confirms that climate change operates as an active macroeconomic forcing parameter that amplifies regional polarization.
4.3. Policy Implications for Adaptive Subsidy Modernization
The empirical constraints mapped by the framework provide vital decision-support benchmarks for energy policy planners aiming to optimize fiscal allocation and mitigate energy poverty risks. Currently, the Mexican residential subsidy model operates under a static, climate-centric allocation paradigm that overlooks localized socioeconomic gradients. The evidence compiled in this research demonstrates that this decoupling produces severe targeting inefficiencies. High-income segments with greater appliance acquisition capacities absorb a disproportionate share of public resources, while vulnerable household economics in extreme thermal zones face regressive financial traps.
To resolve these targeting deficiencies and transition toward an adaptive subsidy modernization strategy, regulatory authorities should pivot from allocation mechanisms based strictly on regional temperature thresholds to dynamic socio-energetic frameworks. Specifically, policy planners should implement three core structural updates:
Hybrid Socio-Energetic Subsidies: Replace pure temperature-dependent rules with a hybrid targeting index that cross-references regional thermal gradients with state-level household income deciles, ensuring that expanded baseline volumetric thresholds ( and ) are restricted exclusively to lower-income deciles in hyper-warm regions.
EEII Affordability Caps: Establish normative affordability boundaries by capping the maximum allowable household energy burden at a critical threshold (e.g., or ), triggering targeted fiscal relief when extreme seasonal heat forces vulnerable domestic economies past sustainable financial boundaries.
Capital Investment Reallocation: Transition away from deploying permanent, passive price-transfer subsidies for higher-income segments—which structurally constraint the state’s fiscal capacity—and dynamically reallocate public funds toward direct capital investments. Geographical coordinates identified under severe economic distress should be prioritized for targeted public programs, such as the direct deployment of residential photovoltaic (PV) microgeneration and energy-efficient thermal insulation retrofits for low-income dwellings.
Ultimately, shifting from a passive temperature-dependent pricing model to a dynamic socio-energetic indicator architecture establishes a progressive, efficient, and equitable framework capable of insulating vulnerable populations from climate-induced financial risks.
5. Conclusions
This study developed a robust mathematical and heuristic framework to systematically construct the Energy-Economic Impact Index (EEIIt), providing a multi-dimensional metric that quantifies the real financial pressure exerted by residential electricity billing on household socio-economic configurations. By integrating increasing block tariff structures, localized energy expenditures, and biennial household income datasets, the proposed indicator successfully bypasses the diagnostic limitations of traditional flat linear indices. The methodology established herein constitutes a highly replicable decision-support tool capable of managing the structural complexities of transition power sectors characterized by high climatic gradients and multi-tiered price adjustments. The longitudinal empirical validation spanning the 2018–2024 period yields three critical regulatory findings:
Asymmetric Financial Polarization: Residential electricity cost escalations systematically outpaced localized household income growth trajectories across the entire national territory. This structural mismatch caused a severe, non-linear polarization of the financial energy burden parameters.
The Climate Stress Regressive Trap: While temperate zones under Tariff 1 maintained stable affordability boundaries (EIPs,m < 4%), populations restricted by hyper-warm regimes (Tariffs 1D, 1E, and 1F) experienced severe vertical vulnerabilities. The intersection of climate-induced demand spikes and rigid block thresholds forced lower-income states into high-stress economic coordinates, capturing a peak energy budget burden of up to 14.90% in 2024.
Subsidies Targeting Inefficiencies: The current allocation framework based strictly on temperature boundaries generates regressive targeting issues. The preferential schemes are insufficient to isolate vulnerable household economics from rising seasonal demands, frequently subsidizing higher-income segments with larger cooling capabilities while penalizing lower-income deciles who lack thermal insulation or energy-efficient technologies.
Finally, the incorporation of the Annual Index introduces a flexible, predictive instrument to project EEIIt pathways under diverse prospective pricing scenarios or demographic shifts. The dynamic indicators developed in this work demonstrate that a transition toward an adaptive subsidy modernization paradigm—shifting from passive temperature-dependent rules to hybrid socio-energetic indicator metrics—is vital to optimize fiscal resource allocation, successfully reduce localized energy poverty gaps, and protect vulnerable households from climate-induced macroeconomic risks.
Furthermore, while this study demonstrates the necessity of capturing extreme consumption phenomena, formulating a closed-form dynamic optimization model to explicitly integrate the Extreme Energy Intensity Indicator () into regulatory tariff threshold adjustments remains an essential avenue for future research.
Author Contributions
Conceptualisation, methodology, validation, formal analysis, investigation, writing—original draft preparation, visualization and supervision, J.M.-P.; Conceptualisation, formal analysis, resources, writing—original draft preparation, review and editing, visualization and project administration, I.A.H.-R.; Conceptualisation, formal analysis, resources, writing—original draft preparation, review and editing, visualization and project administration, X.G.-R.; Conceptualisation, methodology, validation, formal analysis, investigation, writing—original draft preparation, visualization and supervision, J.M.L.-G.; Conceptualisation, methodology, validation, formal analysis, investigation, writing—original draft preparation, visualization and supervision, C.R.-M.; Validation, investigation, review and editing, A.P.-M. All authors have read and agreed to the published version of the manuscript.
Funding
This work was carried out during the author’s sabbatical leave, which was financially supported by the Secretariat of Science, Humanities, Technology and Innovation (SECIHTI), Mexico, under Grant No. BP-BSNAC-20250505164854579-10928743. The authors gratefully acknowledge this support.
Data Availability Statement
The synchronized macroeconomic datasets, electrical billing metrics, and structural validation tables utilized in this research are subject to information security protocols and institutional non-disclosure constraints. Consequently, the raw datasets are not publicly available in open repositories. However, the consolidated data models, heuristic indices (EEIIt), and primary calculation tables generated during this study are available from the corresponding author upon reasonable academic request, subject to compliance with the data clearance policies of the originating providers.
Acknowledgments
The authors are grateful for the data provided by Comision Federal de Electricidad.
Conflicts of Interest
The authors declare no conflicts of interest.
References
- Muñoz Sánchez, R.; Velasco, J.A.; Estrada Porrúa, F.; Calderón Bustamante, O. Impacts of climate change on electrical subsidies’ public policies: The case of Mexico. Mitig. Adapt. Strateg. Glob. Change 2026, 31, 20. [Google Scholar] [CrossRef] [Scilit]
- Jesús, M.P.; Merced, L.G.J.; Alejandro, P.M.; José, M.M.R.; Elizabeth, R.A.M. Complexity of the Unit Price of Household Electricity in México. In Proceedings of the 2025 IEEE CHILEAN Conference on Electrical, Electronics Engineering, Information and Communication Technologies (CHILECON); IEEE: Piscataway, NJ, USA, 2025; pp. 1–5. [Google Scholar] [CrossRef] [Scilit]
- Ruiz, M.M. Evolución y Perspectivas de las Tarifas Eléctricas de la Comisión Federal de Electricidad. Ph.D. Thesis, Universidad Nacional Autónoma de México, Mexico City, Mexico, 2022. Available online: https://ru.dgb.unam.mx/items/c6e84d4d-44b4-4221-8257-689060a5acb1 (accessed on 29 July 2026).
- Comisión Federal de Electricidad. Panorama Nacional de Distribución de las Tarifas Domésticas; PowerPoint Slides/Presentation Slides; CFE Press Conference, National Palace. Government of Mexico. 31 August 2023. Available online: https://www.gob.mx/amlo/articulos/version-estenografica-conferencia-de-la-comision-federal-de-electricidad (accessed on 29 July 2026).
- Giddings, L.E.; Soto-Esparza, M. Plant heat zones of Mexico. Rev. Chapingo Ser. Hortic. 2005, 11, 365–369. [Google Scholar]
- Aguilar Jiménez, J.A.; Ríos-Arriola, J.; Islas-Pereda, S.; Suástegui-Macías, J.A.; Zamora-Machado, M. Energy affordability and thermal comfort in Mexico: Analysis across 13 climatic zones. Renew. Energ. 2026, 4, 27533735261421342. [Google Scholar] [CrossRef] [Scilit]
- CONUEE. 2022. Available online: https://www.biee-conuee.net/datamapper/electridad-por-hogar.html (accessed on 29 July 2026).
- Molar-Cruz, A.; Huezo Rodríguez, S.A.; Hamacher, T. Characterizing the energy burden of urban households in Mexico: The impact of socioeconomic and temperature conditions across Metropolitan Areas. Front. Sustain. Cities 2022, 3, 662968. [Google Scholar] [CrossRef] [Scilit]
- Cárdenas Ovalle, R.A. Demanda de electricidad residencial: Una perspectiva de regresión cuantílica. Ens. Rev. Econ. 2020, 39, 87–114. [Google Scholar] [CrossRef] [Scilit]
- Garza, M.G.G.; Rodríguez, J.O.; Palencia, E.P. The Effect of Energy Prices on Mexican Households’ Consumption. In Digital Era and Fuzzy Applications in Management and Economy. XX SIGEF 2021; Rodríguez García, M.d.P., Cortez Alejandro, K.A., Merigó, J.M., Terceño-Gómez, A., Sorrosal Forradellas, M.T., Kacprzyk, J., Eds.; Lecture Notes in Networks and Systems; Springer: Cham, Switzerland, 2022; Volume 384. [Google Scholar] [CrossRef] [Scilit]
- Jiménez, M.C. Tarifas Eléctricas de la Comisión Federal de Electricidad, 2018–2023. Ph.D. Thesis, Tecnológico de Monterrey, Monterrey, Mexico, 2023. Available online: https://www.economia.unam.mx/assets/pdfs/econinfo/446/02%20Miguel.pdf (accessed on 29 July 2026).
- Cruz, E.I.F. Análisis de Componentes Principales de la Tarifa de Electricidad en México-Caso de Estudio. Cienc. Lat. Rev. Científica Multidiscip. 2024, 8, 10352–10366. [Google Scholar] [CrossRef] [Scilit]
- Gobernación. Acuerdo por el que la Comisión Reguladora de Energía Expide la Metodología para Determinar el Cálculo y Ajuste de las Tarifas Finales que Aplicarán a la Empresa Productiva Subsidiaria CFE Suministrador de Servicios Básicos. Ciudad de México. 2021. Available online: https://www.dof.gob.mx/nota_detalle.php?codigo=5622415&fecha=29/06/2021#gsc.tab=0:DiarioOficialdelaFederación (accessed on 29 July 2026).
- Comisión Federal de Electricidad. 2026. Available online: https://www.cfe.gob.mx/Pages/default.aspx (accessed on 29 July 2026).
- Hernandez, M.; Patino-Echeverri, D. Electricity consumption, subsidies, and policy inequalities in Mexico: Data from 100,000 households. Energy Sustain. Dev. 2022, 71, 186–199. [Google Scholar] [CrossRef] [Scilit]
- Hancevic, P.; Núñez, H.; Rosellón, J. Tariff Schemes and Regulations: What Changes Are Needed in the Mexican Residential Electricity Sector to Support Efficient Adoption of Green Technologies? (No. IDB-WP-1020), IDB Working Paper Series; Inter-American Development Bank (IDB): Washington, DC, USA, 2019. [Google Scholar] [CrossRef] [Scilit]
- Sandoval, H.; Hancevic, P.; Bejarano, H. The hidden costs of tariff misclassification: Structural winners and losers. Energy Econ. 2025, 144, 108322. [Google Scholar] [CrossRef] [Scilit]
- Hancevic, P.I.; Lopez-Aguilar, J.A. Energy efficiency programs in the context of increasing block tariffs: The case of residential electricity in Mexico. Energy Policy 2019, 131, 320–331. [Google Scholar] [CrossRef] [Scilit]
- Rendón-Morquecho, J.; Marroquín-Arreola, J. Desigualdad del ingreso y su impacto en el crecimiento económico por entidad federativa en México. Rev. Cienc. Soc. (Cr) 2020, 2, 168. [Google Scholar]
- Moshiri, S.; Santillan, M.A.M. The welfare effects of energy price changes due to energy market reform in Mexico. Energy Policy 2018, 113, 663–672. [Google Scholar] [CrossRef] [Scilit]
- Soriano-Hernández, P.; Mejía-Montero, A.; van der Horst, D. Characterisation of energy poverty in Mexico using energy justice and econophysics. Energy Sustain. Dev. 2022, 71, 200–211. [Google Scholar] [CrossRef] [Scilit]
- Faiella, I.; Lavecchia, L. Energy poverty. How can you measure it if you cannot see it? Energy Policy 2021, 158, 112552. [Google Scholar] [CrossRef] [Scilit]
- Macías, J.S.; Valenzuela, A.L.; Ramírez, A.A.; Escobedo, P.R.; Puente, A.R. Reduction of energy poverty in Mexico by applying an optimization model to residential energy tariffs. Energy Rep. 2023, 9, 3431–3439. [Google Scholar] [CrossRef] [Scilit]
- Instituto Nacional de Estadística Geografía e Informática (México). Encuesta Nacional de Income y Gastos de los Hogares: ENIGH 2024; INEGI: Aguascalientes, Mexico, 2024. Available online: https://www.inegi.org.mx/programas/enigh/nc/2024/ (accessed on 29 July 2026).
- Rosas Flores, J.A.; Morillón Gálvez, D.; Silva, R. Effects of Removing Energy Subsidies and Implementing Carbon Taxes on Urban, Rural and Gender Welfare: Evidence from Mexico. Energies 2024, 17, 2237. [Google Scholar] [CrossRef] [Scilit]
- Labeaga, J.M.; Labandeira, X.; López-Otero, X. Energy taxation, subsidy removal and poverty in Mexico. Environ. Dev. Econ. 2021, 26, 239–260. [Google Scholar] [CrossRef] [Scilit]
- Borenstein, S. The redistributional impact of non-linear electricity pricing. Am. Econ. J. Econ. Policy 2012, 4, 56–90. [Google Scholar] [CrossRef] [Scilit]
- CFE (Comisión Federal de Electricidad). Esquema Tarifario Vigente para el Sector Residencial en México; Diario Oficial de la Federación (DOF): Mexico City, Mexico, 2024.
- Comisión Nacional del Agua (CONAGUA); Servicio Meteorológico Nacional (SMN). Información Estadística Climatológica y Reportes de Estaciones Meteorológicas Automáticas en México; Gobierno de México: Mexico City, Mexico. Available online: https://smn.conagua.gob.mx/ (accessed on 1 January 2026).
- Heindl, P. Measuring fuel poverty: General concepts and application to German data. Energy Policy 2015, 71, 178–215. Available online: https://www.jstor.org/stable/24807488 (accessed on 1 January 2026). [CrossRef] [Scilit]

Disclaimer/Publisher’s Note: The statements, opinions and data contained in all publications are solely those of the individual author(s) and contributor(s) and not of MDPI and/or the editor(s). MDPI and/or the editor(s) disclaim responsibility for any injury to people or property resulting from any ideas, methods, instructions or products referred to in the content. |
© 2026 by the authors. Licensee MDPI, Basel, Switzerland. This article is an open access article distributed under the terms and conditions of the Creative Commons Attribution (CC BY) license.