


Abstract
Hydrogen energy systems—proton exchange membrane fuel cells (PEMFCs), water electrolyzers, and high-pressure hydrogen storage vessels—are increasingly deployed in transportation, maritime, aerospace, and stationary applications where mechanical vibration is unavoidable. Yet vibration research remains fragmented into single-technology studies whose findings often appear inconclusive or contradictory. This review provides a cross-technology assessment of vibration phenomena in hydrogen energy systems, covering PEMFC performance and degradation, structural dynamics of stacks and storage vessels, water management and two-phase flow, diagnostics and modeling, and application-specific challenges for road, marine, aircraft, and space systems. By organizing the evidence around a small set of shared mechanisms—loss of mechanical preload (bolt loosening), two-phase flow disruption, and fatigue-driven crack growth—we establish a unified framework that reconciles the seemingly case-dependent results of earlier, single-technology reviews. Whether vibration acts as friend or foe is governed by a consistent parameter set: amplitude, frequency, direction, and cumulative exposure time. Short, low-frequency excitation can aid water removal in fuel cells, improve cold-start behavior, and raise electrolyzer hydrogen yield by up to 128%, whereas sustained exposure roughly doubles PEMFC voltage degradation rates, loosens clamping bolts, and drives fatigue in storage-vessel supports. The evidence base is currently dominated by PEMFC studies, and this review accordingly treats fuel cells in the greatest depth. Priority research needs are identified: standardized vibration test protocols, long-duration durability data, vibration characterization of electrolyzers prior to offshore deployment, and coupled multiphysics models supporting vibration-aware design.
Keywords:
hydrogen; vibration; PEM fuel cell; electrolysis; hydrogen storage; mechanical degradation 1. Introduction
The hydrogen economy rests on three pillars: proton exchange membrane fuel cells (PEMFCs) that convert hydrogen to electricity, PEM electrolyzers that produce green hydrogen from renewable energy, and high-pressure composite vessels that store hydrogen compactly for mobile use. What these technologies share, beyond their electrochemistry, is an operating environment dominated by mechanical vibration. Whether mounted on a truck chassis, a ship deck, or a launch vehicle, hydrogen components must function reliably under dynamic loads that the laboratory bench conveniently ignores [1,2,3].
The vibration landscape is remarkably diverse. A fuel cell logistics vehicle subjects its stack to broadband excitation below 50 Hz at a modest 0.04–1 g [4,5]. A ship imposes low-frequency harmonic motions at amplitudes up to 214 [6]. A rocket demands survival at 10–40 [7]. These are not merely different intensities of the same problem—the failure modes, the dominant frequencies, and even the direction dependence change fundamentally from one domain to another.
What makes vibration particularly difficult to design against is its dual nature. A gentle shake can actually help a fuel cell by sweeping water out of gas channels [8,9], and it can boost electrolyzer efficiency by dislodging bubbles from electrode surfaces [10,11]. Yet the same mechanism, sustained over hundreds of hours, may loosen the bolts, raise the contact resistance, fatigue the gaskets, and can double the voltage degradation rate [12,13]. In membraneless microfluidic fuel cells, even mild vibration destroys the laminar co-flow interface on which the entire device depends [14]. Whether vibration is advantageous or harmful depends on parameters that are rarely controlled in practice.
Several earlier reviews have touched on parts of this problem. Haji Hosseinloo and Mousavi Ehteshami [15] surveyed shock and vibration effects on PEMFCs but concluded—perhaps unsurprisingly, given the state of the field—that results remain “inconclusive and case-dependent.” Dafalla and Jiang [1] cast a wider net over mechanical stresses in PEMFCs, while Khetabi et al. [16] focused on compression effects. None of these works attempted to integrate fuel cells, electrolyzers, storage vessels, and microfluidic devices into a single vibration-centric framework. We believe this cross-technology perspective is overdue, because many of the underlying mechanisms—bolt relaxation, two-phase flow disruption, fatigue crack growth—are shared across hydrogen systems even when the specific manifestations differ.
This review aims to fill that gap by providing a comprehensive, cross-technology assessment of vibration phenomena in hydrogen energy systems. The scope encompasses the following:
- The effects of vibration on PEMFC electrochemical performance, including polarization behavior, degradation kinetics, cold-start characteristics, and safety-critical parameters (Section 2);
- Structural mechanics and dynamic response, covering modal analysis of fuel cell stacks, clamping force degradation, and the behavior of hydrogen storage vessels under impact and blast loading (Section 3);
- Water management and two-phase flow under vibration, spanning droplet transport in fuel cell channels, vibro-acoustic water removal methods, bubble dynamics in electrolyzers, and microfluidic fuel cell performance (Section 4);
- Diagnostic and monitoring techniques, including acoustic emission, impedance spectroscopy, neural network models, and computational simulation approaches (Section 5);
- Application-specific vibration challenges for road vehicles, marine vessels, aircraft, and space systems (Section 6).
Figure 1.
Structure of this review as a hierarchical roadmap: application environments (Section 6) impose dynamic loads on the three hydrogen technologies (Section 2, Section 3 and Section 4); vibration acts through a small set of shared mechanisms (Section 7); these are detected and predicted by the methods of Section 5 and synthesized across technologies in Section 7 and Section 8.
The novelty of this review is threefold. First, to the best of our knowledge, it is the first to integrate PEM fuel cells, water electrolyzers, and hydrogen storage vessels within a single vibration-centric framework: previous reviews addressed shock and vibration in PEMFCs alone [15], mechanical stresses in PEMFCs [1], compression effects [16], or marine PEMFC systems [17], but none crossed technology boundaries. Second, rather than cataloguing effects technology by technology, we organize the evidence around three shared physical mechanisms—loss of mechanical preload, two-phase flow disruption, and fatigue-driven crack growth—which is what allows seemingly contradictory single-technology findings to be reconciled (Section 7). Third, we compile the vibration parameters (frequency, intensity, direction, duration) and outcomes of the reviewed experimental and numerical studies into a single comparative table (Table 1), providing the quantitative cross-technology basis that has so far been missing.
Table 1.
Comprehensive summary of vibration parameters and reported effects across hydrogen energy systems. Intensities are given as reported by the authors; where displacement amplitude X and frequency f are specified for harmonic excitation, the harmonized peak acceleration is added in parentheses. Effect symbols: + beneficial, − detrimental, ± mixed, 0 no measurable effect.
Scope, Terminology and Literature Selection
Throughout this review, vibration denotes sustained oscillatory excitation—deterministic (sinusoidal or swept-sine) or random (broadband spectra)—characterized by its frequency content, intensity, and duration. Shock denotes a transient, high-amplitude event of short duration, typically described by its peak acceleration and pulse width (e.g., /15 ms), and impact denotes shock delivered through mechanical contact, such as drops, collisions, or fragment strikes. These terms are used consistently in this sense in what follows.
Studies quantify vibration intensity using acceleration, velocity, or displacement. For harmonic excitation at frequency f with displacement amplitude X, the three are related by and , so any one descriptor determines the others; for random excitation, root-mean-square (RMS) values and power spectral densities are used instead. Acceleration (in units of g) is the natural measure for inertial loading and fatigue, velocity is customary in marine standards, and displacement is the most direct descriptor of two-phase flow interaction. Where the original studies permit, Table 1 reports harmonized peak accelerations alongside the authors’ original units.
The literature base was assembled from Scopus, the Web of Science Core Collection, and Google Scholar, complemented by the NASA Technical Reports Server for space-qualification data, using combinations of the keywords (“vibration” OR “shock” OR “dynamic loading” OR “mechanical excitation”) AND (“PEM fuel cell” OR “PEMFC” OR “fuel cell stack” OR “water electrolysis” OR “electrolyzer” OR “hydrogen storage” OR “hydrogen cylinder” OR “hydrogen vessel”), covering publications from 2006 to January 2026. We included peer-reviewed experimental and numerical studies in which the vibration parameters are quantified and linked to a performance, structural, or safety outcome of a hydrogen technology; conference publications were admitted only where they provide otherwise unavailable primary data, notably the NASA launch-qualification testing [7]. We excluded studies of acoustic noise without mechanical coupling to the device, pure hygrothermal or electrical load cycling, and flow pulsation without structural excitation. This is a narrative review, and no formal systematic-review completeness claim (e.g., PRISMA) is made. The resulting corpus is dominated by PEMFC studies—roughly two thirds of the works reviewed—reflecting the current state of the field. Electrolyzers and storage vessels are covered comprehensively relative to their smaller literatures, and this disparity is itself identified as a research gap in Section 8.2.
2. Vibration Effects on PEM Fuel Cell Performance
The effect of mechanical vibration on PEMFC performance is strongly case-dependent: reported outcomes range from modest performance gains to severe degradation, governed by the operating conditions and the cumulative exposure time. This section traces the evidence from early single-cell bench tests through multi-hundred-hour durability campaigns on commercial stacks, revealing a picture that is more nuanced than either “vibration is harmless” or “vibration is destructive”. Table 2 collects the key experimental parameters and findings.
Table 2.
Summary of experimental studies on vibration effects on PEMFC performance. The near-absence of recognized test standards in the penultimate column illustrates the standardization gap discussed in Section 8.2.
2.1. Impact on Polarization Behavior and Output Voltage
The polarization curve, relating cell voltage to current density, is the most fundamental performance descriptor of a fuel cell. The general form of the polarization equation used by Hou et al. [18] to characterize vibration-induced changes is
where is the open-circuit voltage, b is the Tafel slope characterizing activation losses, R is the total ohmic resistance, and the exponential term captures mass transport losses at high current densities. Several studies have demonstrated that mechanical vibrations modify all three loss regions.
Although the absolute degradation rates vary due to differences in test platforms and conditions, the data for all vibration conditions are significantly higher than those of the static control group, generally supporting the conclusion that vibration accelerates degradation, Figure 2.
Figure 2.
Comparison of voltage degradation rates under vibration from key studies [12,13,18]. Chen et al. [12] provide a direct comparison between vibrating (103 ) and static (53 ) conditions on the same cell design.
Hou et al. [18] conducted a 150 h strengthened road vibration test on a 45 kW commercial stack (560 cells, 280 each) using a six-channel Multi-Axial Simulation Table (MAST) reproducing real road load spectra. The polarization curves fluctuated—initial improvement at 26 h, marked deterioration at 62 h, then partial recovery—while over the full test the open-circuit voltage decreased by approximately 3%, the ohmic resistance increased by 55.8% (from 0.260 to 0.405 ), and the Tafel slope fell to 72% of its initial value. These changes were attributed to bolt-loosening-induced contact resistance growth and altered catalyst layer morphology.
In a subsequent study on a 9 kW stack (90 cells, 250 ), Hou et al. [13] performed 250 h of road vibration testing with peak accelerations up to in the vertical direction. The rated voltage at 0.6 decreased by 3.58% with a decay rate of 77.6 . The limiting current density declined from 2.35 to 1.73 (a 26% reduction), and mass transfer losses at maximum current density increased by 22.78%. Notably, cells at the front of the stack degraded faster than those at the rear, where a rubber cushion provided partial vibration damping.
Wang et al. [8] studied the dynamic response of a single cell (25 , Nafion 211) at 10–20 Hz and 3–4 mm amplitude. The cell voltage was slightly higher under vibration than without, attributed to improved water removal from the gas diffusion layer (GDL), but voltage fluctuations increased substantially—particularly at 20 Hz—and the settling time after a load step lengthened from approximately 20 s to 50–80 s: short-term gains from better water management thus come at the cost of output variability.
Nan et al. [23] investigated short-term vibration effects in an actual fuel cell vehicle (Toyota Mirai), identifying the hydrogen recirculating pump as the dominant vibration source through operational transfer path analysis. In situ tests on a six-cell stack (1200 W) showed that vibration typically reduces output power by approximately 2%, with worst-case reductions of 9% depending on excitation type and stack orientation.
2.2. Short-Term and Long-Term Performance Degradation
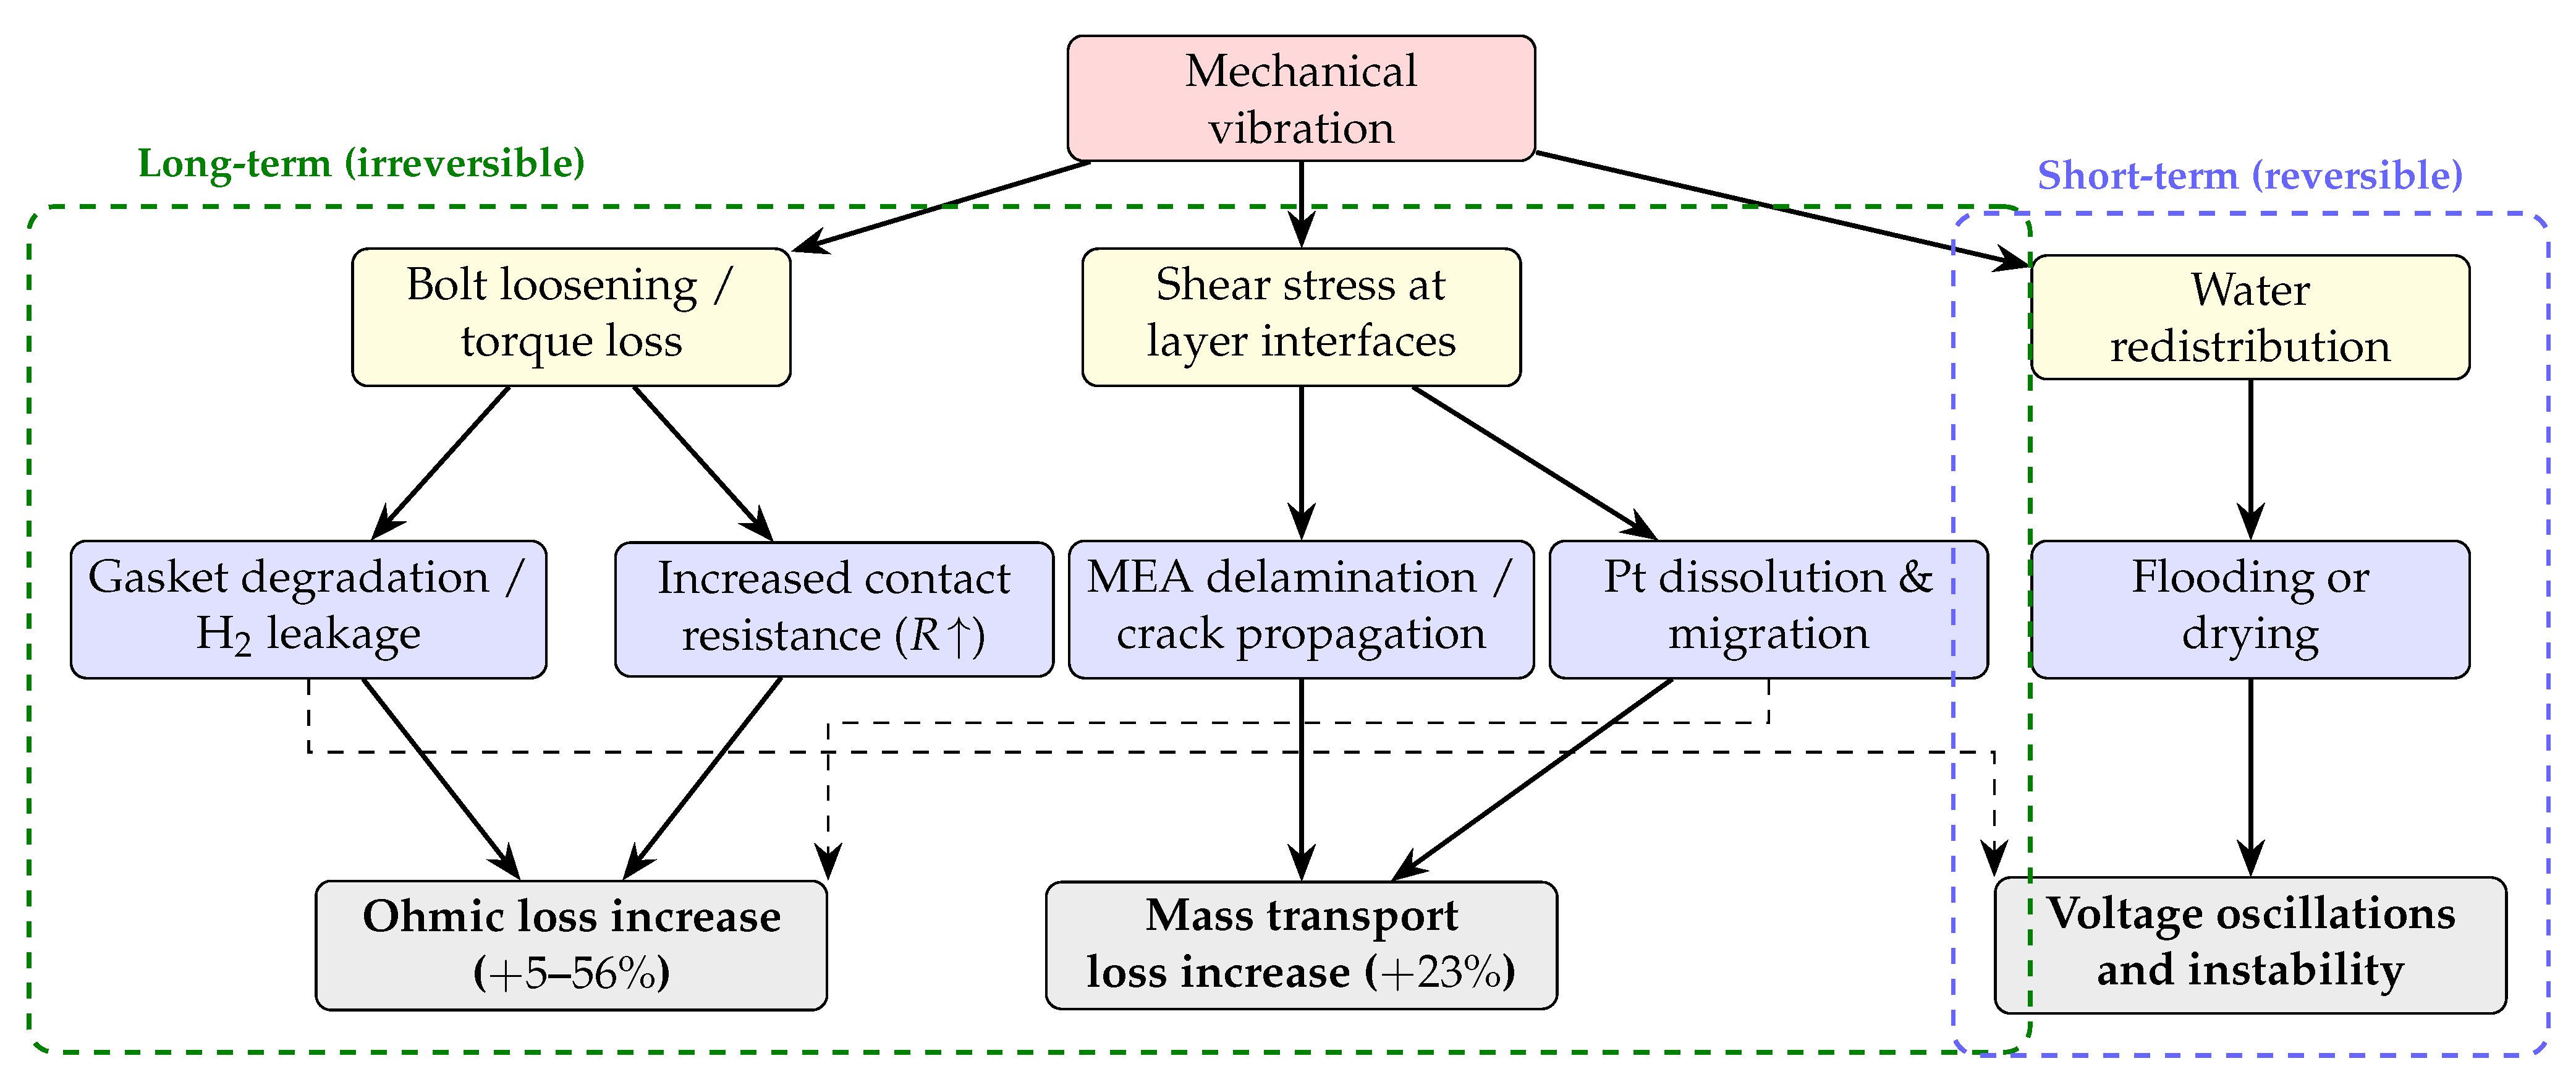
The distinction between short-term and long-term vibration effects is critical for understanding the underlying degradation mechanisms. Short-term effects are largely reversible and related to water redistribution and transient contact variations, whereas long-term effects involve irreversible structural and electrochemical damage. Figure 3 illustrates the principal degradation pathways linking mechanical vibration to electrochemical performance loss, and Table 3 classifies the individual mechanisms by characteristic timescale, reversibility, and available recovery action.
Table 3.
Classification of vibration-induced mechanisms by characteristic timescale and reversibility.
Figure 3.
Degradation pathways linking mechanical vibration to PEMFC performance loss. Dashed arrows indicate secondary coupling effects. Percentage ranges are representative envelopes across the studies reviewed in this section, not universal values: the ohmic-loss increase spans (5 kW stack, 200 h [41]) to (45 kW stack, 150 h [18]), and the mass-transport-loss increase of is from the 250 h test of Hou et al. [13].
Chen et al. [12] provided the most direct comparison through a 300 h accelerated stress test on single cells (25 ) operated at 400 under vibration (20 Hz, in alternating horizontal and vertical directions) and static conditions. The voltage degradation rate under vibration was 103 , nearly double compared with the static rate of 53 . Based on the DOE 90% voltage retention criterion, the projected MEA lifetime was approximately 700 h under vibration versus 1500 h under static conditions. Post-mortem TEM/EDX analysis revealed markedly more platinum redeposited inside the membrane under vibration, indicating enhanced Pt dissolution and migration. The electrochemically active surface area (ECSA) decreased by 17.5% under vibration compared to 13.0% without, while the ohmic resistance grew by 26.7% versus 13.3%.
While the above studies focus on vibration per se, the synergistic role of dynamic electrical loading deserves mention. Wang et al. [42] showed that high-amplitude load cycling (0.1–0.9 ) on a 5 cell caused Pt particle growth from 4.05 to 6.66 nm and a 66.35% increase in mass transfer resistance after 11,520 cycles, with degradation rates scaling strongly with cycling amplitude. Han et al. [43] confirmed that 300 h of NEDC load cycling at 75 °C produced degradation rates exceeding 700 at high current densities, with recovery procedures becoming progressively less effective. These electrical load cycling effects compound vibration-induced mechanical degradation in real vehicular operation.
Diloyan et al. [20] subjected single cells to 300 h of combined potential cycling and vibration (20 and 40 Hz; and ). Counterintuitively, Pt particles under vibration were approximately 10% smaller (5.55–5.89 nm) than under static conditions (6.14 nm), despite more severe overall degradation—explained by increased hydrogen crossover from shear-induced MEA thinning, which reduced the Pt ion supply for Ostwald ripening on the cathode side. Statistical analysis confirmed vibration frequency as the dominant factor, with particles tending to be smaller below 28 Hz.
Imen and Shakeri [21] distinguished between operating and non-operating vibration effects on a 500 W open-cathode stack (36 cells). During operation, shock (, 11 ms), swept sine, and random vibration ( RMS) produced negligible electrochemical effects, although hydrogen leakage gradually increased. In contrast, 44 h of random vibration on the non-operating stack caused a 6.6% power decrease and measurable bolt torque reduction. Crucially, performance was almost fully recoverable (within 0.8% of initial at 10 A) by simply restoring bolt torque to its original value, confirming that contact resistance increase due to bolt loosening—rather than electrochemical degradation—dominated the short-to-medium-term vibration response.
El-Emam et al. [9] demonstrated that the relationship between vibration and performance is non-monotonic and depends on operating conditions: at low cathode air flow rates (220 ), weak vibration (1.33 Hz, 3 cm) improved performance by facilitating water removal from the GDL, whereas at higher flow rates (660 ) all tested vibration conditions degraded performance—water films formed on the cathode GDL impeded air access—with losses growing with both amplitude and frequency.
Banan et al. [27] used finite element modeling with cohesive zone methods to study vibration-induced delamination at the membrane/catalyst layer interface. At amplitudes below , no crack propagation occurred within 300 h. At the most severe conditions tested (, 40 Hz), delamination grew from 0.025 mm to approximately 1.4 mm—a length expected to cause cell failure. Frequency had a dominant effect at larger amplitudes, with doubling the frequency from 5 to 40 Hz at also doubling the final delamination length. This is consistent with Dafalla and Jiang [1], who place typical transportation loads at 0.9–40 Hz and generally below , and note that vibration exaggerates pre-existing defects such as pinholes, cracks, and delaminations.
Taken together, the literature paints a picture that is—as Haji Hosseinloo and Mousavi Ehteshami [15] pointedly summarized—“inconclusive and case-dependent.” We would add that this is partly a consequence of the field’s youth: with no standard test protocol, every group measures something slightly different, making it difficult to build a coherent body of evidence. What does seem clear is that the transition from beneficial to harmful vibration is governed by a combination of amplitude, frequency, direction, and—crucially—cumulative exposure time, none of which can be considered in isolation. The same four parameters will reappear for electrolyzers and storage vessels; their cross-technology role is drawn together in Section 7, and the reasons why nominally similar studies reach different conclusions are analyzed in Section 7.2.
2.3. Cold Start Under Vibration Conditions
Cold start is a critical challenge for PEMFCs in transportation applications, as ice formation in the catalyst layer and GDL can block reactant access and cause irreversible damage. The interaction between vibration and subzero startup behavior was investigated by Xie et al. [24] using a three-axis vibration platform with a single cell (25 , Nafion 212).
Modal testing identified the first natural frequency of the cell assembly at approximately 10.9 Hz. At °C, vibration at the natural frequency (10 Hz) with 3 mm amplitude led to the best cold-start performance, increasing the produced water capacity from 2.21 to 3.12 before ice-induced failure. The mechanism was attributed to vibration-enhanced water dispersion within the porous layers, which delayed ice lens formation by distributing water over a larger volume. The optimal vibration amplitude was 2 mm, beyond which the freezing rate reduction plateaued.
Vibration orientation proved critical: excitation along the gravity direction was most beneficial, yielding successful cold starts at °C (where the static case failed at 225 s) and °C (186 s cold-start duration). Three-axis vibration was also effective at °C (283 s). However, at °C, the cold-start duration was drastically shortened (∼150 s) regardless of vibration, indicating that the ice formation rate at very low temperatures overwhelms any vibration-induced water redistribution effect.
2.4. Gas Tightness and Electrical Insulation
Gas tightness and electrical insulation are safety-critical parameters for fuel cell systems, particularly in vehicular applications where hydrogen leakage poses explosion risks and insulation failure compromises electrical safety.
Hou et al. [19] performed a 150 h strengthened road vibration test on a 50 kW stack (560 cells, 280 active area). The hydrogen leak rate increased by 50% over the test duration, with the gas-tightness pressure decline rate rising from 0.611 to 0.914 . The degradation occurred in two distinct phases: no significant change during the first 70 h, followed by accelerating deterioration. More critically, the anode-side electrical insulation resistance decreased to 17.55% of its original value (from 621 to 109 ), falling below the SAE J2578 safety standard threshold of 125 . The insulation degradation also exhibited two phases: a rapid initial decline at 17.85 during the first 26 h, followed by a slower but sustained decline at 0.70 —the initial rate being 25 times higher than the subsequent rate.
These gas-tightness findings were corroborated by the longer 250 h test of Hou et al. [13], where the gas leakage rate increased to 1.73 times the initial value (pressure drop rate from 0.572 to 0.990 ), and by Imen and Shakeri [21], who observed a gradual hydrogen leakage increase that inversely correlated with bolt torque reduction.
Deshpande et al. [44] complemented these experimental findings with a finite element analysis predicting that harmonic vibrations at the first natural frequency (474.71 Hz) with acceleration would cause 20–25% bolt torque loss within one hour, 30% reduction in maximum MEA contact pressure, and 35% decrease in maximum gasket pressure. These gasket pressure reductions were predicted to create voids at the gasket–membrane interface, with an estimated hydrogen leakage rate of approximately 215 . While the simulation conditions are more severe than typical transportation environments, the results highlight the direct mechanical pathway from vibration to bolt loosening, gasket degradation, and ultimately gas leakage.
The cumulative evidence from these studies indicates that gas tightness and electrical insulation degrade progressively under sustained vibration, with bolt loosening and gasket fatigue as the primary mechanisms. The two-phase degradation behavior—rapid initial change followed by slower sustained decline—suggests an initial settling period during which the most vulnerable interfaces adjust, followed by gradual fatigue-driven deterioration.
3. Structural Mechanics and Dynamic Response of Hydrogen Systems
Before one can predict whether a fuel cell stack will survive a given vibration environment, one needs to know its natural frequencies, how its clamping force evolves under cyclic loading, and how its hydrogen storage vessels respond to dynamic and impact loads. This section assembles these structural fundamentals—beginning with modal analysis, moving through the insidious phenomenon of vibro-creep, and ending with blast and impact resistance of storage vessels. Table 4 collects the natural frequency data reported across studies to date.
Table 4.
Summary of natural frequencies of PEMFC stacks and single cells from modal analysis studies.
3.1. Modal Analysis and Natural Frequencies of Fuel Cell Stacks
The natural frequencies and mode shapes of PEMFC stacks determine their susceptibility to resonance under external excitation. A fuel cell stack is a layered composite structure with markedly different stiffness and density properties across its constituent layers, leading to complex vibration behavior that deviates substantially from monolithic structures.
Ahmed et al. [45] developed the first free vibration model of a PEMFC, treating the cell as a symmetrically laminated composite plate () using Mindlin’s plate theory. With clamped boundary conditions on all edges, the first three natural frequencies were 2.3, 4.5, and 6 kHz—well above the 1–25 Hz range typical of transportation excitation. Parametric analysis revealed that the bipolar plate dominates the dynamic response: a 25% increase in bipolar plate thickness raised the first natural frequency by approximately 17%, while equivalent changes to GDE or membrane thickness had negligible effect (<1%). Vengatesan et al. [46] confirmed the dominant role of bipolar plate properties: replacing graphite bipolar plates with stainless steel raised the first natural frequency by a factor of 1.6, to ∼4 kHz.
While single-cell models predict natural frequencies in the kilohertz range, full stack assemblies exhibit significantly lower frequencies due to the compliant interfaces between cells. Liu et al. [47] performed a detailed 3D modal analysis of a 10-cell, 1 kW stack using ABAQUS with approximately one million elements. The first global mode appeared at 1.01 kHz for a four-bolt configuration (12 torque), involving coupled Z-translation and Y-rotation. Increasing the bolt number from four to six while maintaining the same total clamping force raised the first mode frequency by 26.73% to 1.28 kHz. Bolt torque had a comparatively modest effect: increasing torque from 8 to 16 raised the first global mode by only 1.40%. The study also identified distinct families of local modes, bolt bending modes clustered at 1.33–1.34 kHz, gasket modes that decreased in frequency with increasing torque, and bipolar plate/MEA local modes above 6.7 kHz that are unlikely to be excited in service.
Experimental validation by Mohammadi et al. [48] on a 500 W stack identified ten modes between 242 and 724 Hz by shaker-based modal testing, the first (242 Hz) being torsional, followed by bending modes at 434 and 466 Hz. Finite element predictions agreed within 15%, with the largest discrepancies for the lowest torsional mode. Changing the membrane thickness or Young’s modulus by up to 45% left the natural frequencies essentially unaffected, confirming that bipolar plates and end plates dominate the global dynamic response.
Ahn et al. [49] investigated the connection between stack structure and vibration characteristics using both vehicle measurements and simplified beam specimens. On an actual fuel cell vehicle at 40 , the dominant vibration mode appeared at 348 Hz (torsional). Using aluminum beam analogues, they demonstrated that the layered stack structure dramatically reduces effective stiffness: the membrane-inserted beam had an effective Young’s modulus of only ∼10 GPa compared to ∼70 GPa for the solid beam—a reduction exceeding 85%. The shear modulus was similarly reduced by a factor of 3.6. However, the torsional loss factor was comparatively small, meaning that torsional resonances, once excited, produce large amplitudes with poor natural damping—a critical concern for durability.
Imen and Shakeri [50] adopted a data-driven approach, testing five stack configurations (3, 5, 7, 8, and 10 cells) under MIL-STD-810 [22] vibration protocols (shock, swept sine, random). They demonstrated that fuel cell stacks do not behave as rigid bodies: individual bipolar plates exhibited distinct responses, and cross-axis coupling was observed. A neural network model (NNARXM) trained on the 3-, 5-, and 8-cell data successfully predicted the 7- and 10-cell response, providing a practical tool for extrapolating vibration behavior to arbitrary stack sizes.
3.2. Vibro-Creep and Clamping Force Variations
Clamping force is one of the most critical mechanical parameters in PEMFC operation, as it determines the contact resistance between bipolar plates and GDLs, the sealing integrity of gaskets, and the mechanical stress distribution within the MEA. Vibration-induced clamping force reduction has been identified as the single most important mechanism linking mechanical vibration to electrochemical performance degradation.
Kim et al. [26] performed a systematic experimental study using instrumented stack structures (8- and 16-layer configurations) with piezoelectric force washers to directly measure clamping force under random vibration (1–100 Hz, Gaussian). At the highest excitation level ( RMS), the 16-layer stack without gaskets lost 28.6% of its initial clamping force within 30 min, compared to 13.6% for the 8-layer stack. The inclusion of rubber gaskets reduced the losses moderately (26.0% and 11.0%, respectively). The clamping force reduction was shown to follow a Basquin power-law fatigue relationship ( for all configurations):
where is the shear force RMS amplitude at failure, a is the fatigue strength coefficient, b is the dimensionless fatigue strength exponent, and is the number of reversal cycles to failure (defined as a 5% reduction in clamping force). The coefficient a carries the units of the loading variable used in the fit—here newtons, since is expressed as a shear force—and both a and b are empirical constants specific to the joint configuration: the number of layers, the bolt pattern and preload, and the presence of gaskets all affect their values. For a different stack design they must therefore be re-identified by fitting the measured clamping-force decay against the number of cycles under controlled excitation, exactly as done for the four configurations tested by Kim et al. [26]. The representative values for the 16-layer stack without gasket, N and , should not be transferred to other designs. This relationship enables prediction of bolt loosening for arbitrary excitation levels. The mechanism was attributed to vibration-induced shear forces acting on the bolt interfaces, with maximum shear forces reaching 500 N for the 16-layer stack at .
The vibro-creep phenomenon adds a time-dependent dimension to clamping force degradation. Slawinski et al. [39] developed numerical models combining Norton–Bailey creep theory with Stobyriev’s reduced stress formulation to study the long-term behavior of 310S steel anode/cathode flow collectors at 80 °C under combined static clamping and vibration. The creep strain rate is expressed as:
where A is the Norton–Bailey creep constant (with units , such that is expressed in ), n is the dimensionless stress exponent, m is the dimensionless time-hardening exponent, and are the reduced and static clamping stresses (in MPa), and is the vibration stress amplitude coefficient (in MPa). For 310S steel, and ; the complete parameter set, including m and the values for the weld and heat-affected-zone materials, is tabulated in the source study [39]. Low-frequency vibrations (0.003 Hz) produced the most severe vibro-creep effects, with deformations reaching 0.14 at moderate stress amplitudes—a result attributed to creep-fatigue interaction. At frequencies typical of mobile applications (∼40 Hz), the vibro-creep effect was much smaller (∼0.04 ). Material brittleness was a key factor: for the most brittle heat-affected zone material (), vibrations reduced the time to failure from 70,000 to 50,000 h. These findings suggest that while high-frequency vibrations from road or engine excitation may have limited creep impact, low-frequency oscillations from ship motion or thermal cycling could significantly accelerate clamping force relaxation.
3.3. Dynamic Response of Hydrogen Storage Vessels
Hydrogen storage vessels, particularly high-pressure composite cylinders, are subjected to dynamic loads during transportation and in the event of accidental impacts or explosions. Their structural response under these conditions determines both operational safety and survivability.
Liu et al. [51] investigated the dynamic response of multi-layer wound cylindrical shells for hydrogen storage under external blast loading using fluid-structure interaction simulations in LS-DYNA (Ansys/LST, Livermore, CA, USA). The vessel consisted of a 316L stainless steel inner shell (diameter 150 mm, thickness 4.5 mm) wound with 14 layers of Q235 carbon steel belts. Under TNT charges of 200–500 g, the inner shell midpoint displacement ranged from 0.6 to 2.05 cm. Four distinct vibration mode types were identified in the outer steel belt layers, spanning frequencies from 499 Hz to 14,464 Hz. The Type IV mode (1496–2992 Hz) exhibited the highest strain growth factor (), indicating significant dynamic amplification. Theoretical predictions based on a rigid-plastic model agreed with numerical results within 5–14%, with the discrepancy increasing at higher blast intensities due to the neglect of elastic deformation and strain hardening in the analytical solution.
Yao et al. [36] studied the impact resistance of multifunctional layered hydrogen storage vessels (50 L, inner diameter 253 mm, internal pressure 50 MPa) subjected to fragment impacts simulating accidental explosion scenarios. Using Johnson–Cook constitutive models validated against experimental perforation data (velocity error 0.24%), they systematically varied the number of winding layers, impact velocity (900–1200 ), fragment mass (123–213 g), and fragment shape. Vessels with fewer than four winding layers were punctured by a 25 mm cubic fragment at 1200 , while four or more layers prevented perforation. Conical fragments caused the strongest damage due to stress concentration, while spherical fragments produced the greatest deformation owing to their larger contact area. The results provide practical design guidelines for the minimum number of protective layers required for hydrogen storage vessels in environments where fragment impact is a credible threat.
Zhang et al. [33] performed a comprehensive investigation of failure mechanisms in onboard hydrogen storage systems under real-world road-induced vibrations. Using modal analysis and random vibration theory with road spectrum data from 12 representative road conditions, they examined both commercial vehicle (8-cylinder) and passenger vehicle (2-cylinder) systems. Critical stress concentration zones appeared at road conditions 6 and 4 for commercial and passenger vehicles, respectively, with maximum equivalent stresses reaching 134.77 MPa and 344.45 MPa. Structural deformations and fractures were observed primarily in cylinder saddles and brackets, with resonance and high-frequency vibrations identified as the primary failure mechanisms. Notably, passenger vehicles exhibited significantly greater vibrational response amplitudes than commercial vehicles under identical road conditions, attributable to differences in chassis design and tire configuration.
Du et al. [34] addressed the random vibration fatigue of large-aspect-ratio Type IV hydrogen cylinders used in tube trailers for compressed hydrogen transport. These cylinders (total length 5550 mm, outer diameter 738 mm, 52 MPa working pressure) are particularly susceptible to vibration fatigue due to their low structural bending stiffness and significant self-weight. Under Grade D road conditions (gravel surfaces), maximum RMS stresses of 873.3 MPa under conventional constraint conditions (CCA/CCB) exceeded the material yield strength, indicating inevitable fatigue failure within the 15-year design service life. An optimized constraint configuration (CCC)—featuring axial sliding constraints at the cylinder mid-section—reduced the maximum stress to 84.01 MPa (a reduction of 80–93%) and the cumulative fatigue damage to 0.46, well below the failure threshold of 1.0. The results demonstrate that constraint optimization is essential for ensuring the structural safety of large-volume hydrogen cylinders during road transport.
Complementing these vehicle- and trailer-level analyses, Xiong et al. [35] combined experimental modal testing with finite element simulation for a composite hydrogen storage vessel of a fuel cell vehicle, validating the free and constrained mode predictions to within 8.9% and 8.0%, respectively. Random vibration simulation located the maximum stresses near the head section—469.4 MPa in the composite winding layer and 173.0 MPa in the liner—and the fatigue lives estimated with Steinberg’s and Dirlik’s spectral methods agreed closely. Optimizing the ply parameters of the winding layer reduced these maximum stresses by 66% and 85%, respectively, and raised the predicted life of both layers above the -cycle high-cycle fatigue threshold. Together with the constraint optimization of Du et al. [34], this demonstrates that vibration fatigue of storage vessels is a tractable design problem once it is explicitly analyzed.
At the nanoscale, the interaction between vibrational modes and hydrogen confinement has been explored through ab initio molecular dynamics. Gebac and Bercu [52] investigated six hydrogen atoms encapsulated within a C20H20 dodecahedrane (fullerane) cage, demonstrating that the symmetric radial vibration mode of the cage induces transient pressures exceeding 300 GPa and temperatures up to 2500 K on the confined hydrogen. The compression drives the H6 system through thermodynamic states analogous to known high-pressure hydrogen phases, including molecular liquid, metallic liquid, and solid phases I through VI. The cage breathing mode effectively converts vibrational energy into extreme pressure–temperature conditions, with the HOMO–LUMO band gap narrowing from 10.9 to 6.57 eV during compression. While this study addresses a fundamentally different length scale than macroscopic storage vessels, it reveals that vibrational dynamics can profoundly alter hydrogen phase behavior even in nanoscale confinement, with potential implications for advanced hydrogen storage concepts based on molecular encapsulation.
3.4. Impact Loading and Mechanical Integrity
Impact events—such as vehicle collisions, drops, or sudden decelerations—subject fuel cell stacks to transient accelerations that can cause internal slippage between cell components, damage to sealing interfaces, and loss of structural integrity.
Wu et al. [53] performed the first detailed numerical analysis of impact response for a large (100-cell) PEMFC stack using Abaqus/Explicit (Dassault Systèmes Simulia Corp., Providence, RI, USA). Under 15 ms rectangular acceleration pulses up to , the stack exhibited a characteristic downward bowing deformation, with maximum displacement at the mid-stack and maximum relative slippage at the cells nearest the endplates. A critical finding was the identification of a threshold impact acceleration below which no inter-cell slippage occurs. At a clamping force of 10 kN, was approximately regardless of the friction coefficient. Increasing the clamping force to 35 kN extended the slippage resistance but could not prevent failure above . Cells near the endplates consistently showed worse anti-impact performance than those in the center of the stack.
Building on this work, Liu et al. [54] developed an equivalent stiffness-mass analytical model for rapid assessment of clamping force design under impact conditions. They established multiple safety criteria—gas tightness, sealing pressure, PEM yield stress (2.29 MPa), and belt yield stress—and showed that the allowable clamping force range narrows with increasing longitudinal impact acceleration. The impact direction proved critical: longitudinal impacts were most likely to cause structural material failure, while impacts at approximately 120° and 240° were most likely to induce inter-component slippage. This directional dependence underscores the need for multi-axis impact analysis in fuel cell system design, rather than the single-axis tests commonly employed.
Ma et al. [55] complemented these physics-based approaches with a data-driven NARX neural network model trained on 300 h of road vibration data collected on a six-channel MAST. The model achieved prediction errors below 3% for most eigenvalues in the Y-direction and below 12.5% in the Z-direction, demonstrating the feasibility of real-time vibration response prediction for structural health monitoring of fuel cell stacks in service.
4. Water Management and Two-Phase Flow Under Vibration
Water is both essential and troublesome in hydrogen electrochemistry. Too little and the membrane dries out; too much and it floods the gas channels. In electrolyzers, the problem inverts: gas bubbles cling to electrodes and block the active surface. Vibration interacts with both of these two-phase systems, sometimes helpfully, sometimes not. This section follows the water—from droplets in fuel cell channels, through deliberately applied vibro-acoustic removal, to bubble dynamics in electrolyzers—and closes with the special case of microfluidic devices, where the vibration sensitivity is extreme.
4.1. Droplet Transport in Fuel Cell Flow Channels
Water management is a central challenge in PEMFC operation: insufficient hydration degrades membrane conductivity, while excess liquid water floods the gas diffusion layer and flow channels, blocking reactant access. Mechanical vibrations alter the forces governing droplet formation, growth, coalescence, and removal.
Figure 4 schematically illustrates the effect of vibration direction on droplet behavior in a fuel cell gas channel.
Figure 4.
Schematic illustration of vibration direction effects on water droplet behavior in a PEMFC gas channel (based on data from Zhou et al. [28]): (a) longitudinal vibration accelerates droplet transport along the channel; (b) vertical vibration promotes droplet detachment from the GDL; (c) horizontal vibration drives droplets onto sidewalls, forming obstructing liquid films.
Zhou et al. [28] performed 3D transient VOF simulations of droplet transport in a straight gas channel () under high-intensity vibration (, 50–200 Hz) in three orthogonal directions. The vibration direction proved critical: longitudinal vibration (along the gas flow) reduced discharge time by up to 26.9% at 50 Hz and increased peak power density by 3.56%, while horizontal vibration (perpendicular to flow, in-plane) increased discharge time by 24–27% across all frequencies, as droplets were driven onto the channel sidewalls where they formed obstructing liquid films. Vertical vibration had an intermediate beneficial effect (discharge time reduced by 3.97–8.29%). In all cases, lower frequencies were more effective at promoting water removal.
Chen et al. [56] imaged droplet detachment from the GDL surface at 9000 fps. Under vertical vibration at 20 Hz and 2.5 mm amplitude, the droplet height reached 3.0 times its initial value before complete separation, corresponding to a Wenzel–Cassie to Cassie wetting transition; under horizontal vibration, the contact-angle hysteresis grew to approximately 92°, promoting droplet fracture at 2.5 mm amplitude. Combining vibration (20 Hz, 1.5 mm) with modest gas flow (2 ) achieved droplet removal where neither mechanism alone sufficed, demonstrating a synergistic effect.
However, Sellman and Santamaria [57] reported a contrasting perspective from ex-situ measurements on GDL surfaces. At 100 Hz, the contact angle fell to less than half of the static value (from ∼130° to ∼50°) and the wetting diameter more than doubled. Although adhesion force per unit length remained approximately constant, the net removal force increased by up to 15% due to the larger wetting perimeter. The flow velocity required for droplet detachment was higher under vibration than without. These results suggest that while vibration can detach droplets through inertial forces, it also promotes wetting, which can make flow-driven removal more difficult, a dual effect that may explain the contradictory findings across studies.
At the mesoscopic scale, Zhai and Chen [58] used lattice Boltzmann simulations to study droplet coalescence in a flow channel under vibration. Larger amplitudes and lower frequencies promoted coalescence between adjacent droplets: at 30 Hz and 18 mm amplitude, the merged droplet velocity dropped to 33% of the non-vibrating case. This coalescence-induced velocity reduction suggests that mid-range vibration frequencies (20–50 Hz), typical of vehicle operation, may represent the worst case for water removal by creating large, slow-moving coalesced droplets. Within the GDL itself, VOF simulations on reconstructed carbon paper structures [59] show that vibration raises water saturation in all layers; vertical excitation creates additional breakthrough paths but also increases the overall water content that impedes oxygen transport.
4.2. Water Removal via Vibrational and Acoustic Methods
Rather than treating vibration solely as an environmental disturbance, several researchers have explored its deliberate use as a water management tool. Palan and Shepard [60] established the theoretical foundation for vibration-assisted water removal through droplet atomization. The energy balance for droplet atomization requires that the vibrational energy input exceeds the sum of viscous dissipation and surface energy creation:
where is the vibrational kinetic energy (U is the amplitude of the oscillatory vibrational velocity of the droplet—not the mean gas flow velocity in the channel—and the droplet cap volume), is the water viscosity, R is the droplet radius, f is the excitation frequency, is the surface tension, and is the droplet cap surface area. Using this framework and the VIDA analysis, they estimated that accelerations of approximately at the first natural frequency of the bipolar plate (∼1.8 kHz) are sufficient for atomizing 2 mm radius water droplets. Finite element modeling of a two-cell stack confirmed that such acceleration levels are achievable with commercially available shakers, while the resulting mechanical stresses (approximately 3 MPa) remain well below the yield stress of steel bipolar plates.
In a companion study, Palan et al. [61] compared three vibro-acoustic water removal strategies for a 1.2 kW stack producing approximately 14.5 of cathode water. Flexural plate waves at 10 kHz required vibration amplitudes of ∼150 and consumed approximately 230 mW. Modulated ultrasound (3 MHz carrier with 200 Hz modulation) required only ∼0.03 amplitude and 21 mW. Surface acoustic waves offered the lowest power requirement at 0.063 mW. All three methods consume negligible power relative to the stack output, while the estimated performance loss from cathode flooding (628 droplets covering ∼6.3% of the active area) suggests a meaningful potential benefit. These early analytical studies demonstrated the theoretical viability of active vibro-acoustic water management, though experimental validation on operating fuel cell stacks remains limited.
4.3. Water Electrolysis: Vibration Effects on Bubble Dynamics and Hydrogen Yield
Water electrolysis is the key route to green hydrogen, but its cost remains the main barrier to large-scale deployment, motivating strategies that range from system-level cost optimization [62] to the development of Pt-free electrocatalysts for the hydrogen evolution reaction [63,64]. Bubble management through mechanical excitation is complementary to these material-level advances: gas bubbles generated at the electrode surfaces obstruct the active area and increase ohmic losses regardless of the electrode chemistry, so any measure that accelerates their removal raises efficiency. Vibration can enhance bubble detachment and thus improve electrolysis efficiency, representing a largely beneficial application of mechanical excitation.
Zhu et al. [10] conducted a systematic experimental study on a transparent PEM electrolysis cell using a vibrostand providing vertical sinusoidal vibration (amplitudes 0–1.5 mm, frequencies 40–150 Hz). At 0.5 , increasing the vibration amplitude from 0 to 1.5 mm at 40 Hz increased the annular flow area ratio by 22.7% and decreased the bubble flow fraction by 15.5%, indicating accelerated bubble transport. The overall polarization decreased by 7.2% at the optimal conditions (80 , 1.5 mm amplitude, 150 Hz). Higher frequencies were more effective, with the polarization reduction increasing from 2.7% at 40 Hz to 6.9% at 150 Hz, consistent with enhanced bubble detachment at higher vibrational accelerations.
Purnami et al. [11] investigated mechanical vibration in alkaline water electrolysis using a simpler approach—striking the cell wall with a rubber hammer at controlled frequencies (1–3 hits/s) and forces. The hydrogen evolution reaction current density increased by up to 128% compared to static conditions, with the highest hydrogen yield (6557 ppm) achieved at the maximum frequency and force. Frequency was found to be more influential than force magnitude, consistent with the observation that the rate of bubble detachment scales with the frequency of mechanical perturbation rather than its amplitude alone.
At the fundamental level, Su et al. [29] analyzed the temperature-dependent growth of hydrogen bubbles under ultrasonic vibration during PEM electrolysis. Ultrasonic excitation increased hydrogen production efficiency by up to 7.34% at 60 °C. The mechanism was attributed to acoustic cavitation effects that reduce the critical bubble nucleus radius and increase nucleation frequency, combined with acoustic streaming that promotes bubble detachment. Higher electrolyte temperatures further enhanced these effects by reducing surface tension and Gibbs free energy barriers for nucleation.
Subsequent work has reinforced and refined these findings across both PEM and alkaline systems. In a companion study, Su et al. [65] imaged the full life cycle of hydrogen bubbles in a PEM electrolysis cell under ultrasound, showing that the acoustic field acts differently at each stage: cavitation-generated radicals and mechanically activated sites densify nucleation, fluctuating acoustic pressure accelerates growth, and the oscillating bubble radius promotes detachment, while a flowing electrolyte further reduces bubble size relative to static operation. For alkaline electrolysis, Araújo et al. [30] quantified the effect of a 40 kHz ultrasonic field in KOH solutions of commercial-like concentration (15–35% w/w, 30–60 °C): the cell potential decreased under all test conditions—by up to 52 mV at 30 °C—and the critical bubble diameter fell from 0.404 to 0.293 mm as the concentration increased. Gravelle et al. [31] compared planar and porous nickel electrodes under perpendicular 20 and 580 kHz fields: the porous electrode lowered the HER overpotential by 97 mV relative to the planar one, ultrasonication contributed up to a further 132 mV and altered the reaction mechanism (Tafel slope change from to ), but short electrode–sonotrode distances (3.5 cm) degraded the electrode surface. A recent metrological review by Zeng et al. [66] consolidates this literature: 20–40 kHz fields at delivered acoustic intensities of 0.2–1.0 reproducibly yield current-density gains of 15–30% and net specific-energy improvements of up to ∼12%, but the benefits saturate or even reverse at higher acoustic doses. Notably for the present review, the same work concludes that cross-study comparison suffers from non-standardized excitation reporting—precisely the problem familiar from the PEMFC vibration literature.
What remains almost entirely uncharacterized is durability. All of the above studies measure short-term performance; none reports the long-term effect of sustained vibration or ultrasound on the membranes, catalyst layers, or porous transport layers of electrolyzers. The failure-mode analysis of Wismer et al. [67] lists vibration-induced component dislodging as a recognized PEM electrolyzer failure mode, yet no published campaign quantifies it. Given the momentum of offshore and floating hydrogen production, this asymmetry—beneficial short-term effects documented, long-term risks untested—mirrors the early PEMFC literature and is flagged as a priority gap in Section 8.2.
Complementary to these experimental studies, Lyubimova et al. [68] investigated thermo-vibrational effects on gaseous hydrogen in confined geometries relevant to hydrogen transport and storage. Through numerical simulation of vibrogravitational convection, they demonstrated that vibrational body forces can be tuned to suppress gravity-driven convective flows, achieving near-zero kinetic energy states when
where Gr is the gravitational Grashof number, is the vibrational Grashof number, is the gravity inclination angle, is the vibration direction angle, X and are the vibration displacement amplitude and angular frequency, is the thermal expansion coefficient, is the temperature difference, d is the cavity size, and is the kinematic viscosity. This finding has implications for controlling hydrogen stratification in storage vessels and pipeline transport.
4.4. Microfluidic Fuel Cells Under Vibration
Microfluidic fuel cells (MFCs) rely on laminar co-flow to maintain the fuel-oxidant interface without a physical membrane, making them inherently sensitive to any perturbation that disrupts the flow field. This sensitivity makes MFCs useful model systems for studying vibration effects on electrochemical devices, while also posing practical challenges for their deployment in mobile applications.
Ouyang et al. [14] developed a comprehensive 3D model coupling hydrodynamics, electrochemistry, mass transport, and vibration for both flow-over and flow-through air-breathing MFCs fed with formic acid. Increasing the vibration frequency from 12.89 to 93.11 Hz reduced the maximum current density by 49.97% (flow-over) and 25.40% (flow-through), with peak power density losses reaching 73.01% for flow-through devices. Fuel utilization decreased by 70% and crossover increased by 80% at the highest acceleration (1.2 ). The flow-through architecture demonstrated approximately twice the vibration resistance of the flow-over configuration, attributed to the stabilizing effect of flow through the porous anode.
Chen et al. [37] extended this analysis using a two-phase model incorporating CO2 bubble generation at the anode. They identified a critical acceleration threshold of approximately 0.1 , above which complete fuel crossover caused cell failure. Below this threshold, micro-vibrations (∼0.05 ) actually reduced the CO2 gas fraction slightly by accelerating bubble discharge. Vibration frequency exhibited a similar threshold behavior: performance improved up to ∼12.89 Hz before declining sharply at higher frequencies. These results were confirmed by Ouyang et al. [69] through energy and exergy analysis, which showed that increasing feed flow rate is the most effective countermeasure against vibration, though at the expense of fuel utilization and exergy efficiency.
An important exception to the generally detrimental effects was reported by Ouyang et al. [38] for vapor-feed MFCs (VF-MFCs). Unlike liquid-feed devices, VF-MFCs showed consistent performance improvement with vibration: peak power density increased by 10.95 for in-plane vibration and 7.12 for through-plane vibration as the acceleration increased from 0 to 3.28 . Through-plane vibration was particularly effective, with a 33.49% growth rate in peak power density up to 29.5 Hz. The beneficial mechanism was attributed to enhanced vapor transport and reduced concentration polarization, without the fuel crossover problem that plagues liquid-feed devices.
For microfluidic microbial fuel cells (MMFCs), Hu et al. [70] showed that vibration inhibits the growth of electricigenic microorganisms on the anode, reducing electrical output. At accelerations above 0.5 , the anolyte mixed entirely with the electrolyte, destroying the laminar co-flow pattern essential for membraneless operation. Higher feed flow rates (∼5 ) provided some resistance to vibration-induced mixing, though at the cost of reduced substrate removal efficiency due to shorter hydraulic residence times.
5. Diagnostics, Monitoring and Modeling
If vibration cannot always be avoided, it must at least be detected and predicted. This section surveys the diagnostic and modeling tools available for that purpose—from acoustic sensors that “listen” to water sloshing inside a stack, through impedance methods that track mechanical degradation in real time, to neural networks that learn the vibration transfer function of an entire fuel cell system.
5.1. Acoustic Emission Techniques
Acoustic emission (AE) monitoring detects stress waves generated by internal processes such as crack formation, bubble dynamics, and liquid water movement, offering a non-invasive, real-time diagnostic capability.
Legros et al. [71] pioneered the application of AE to PEMFC diagnostics using a piezoelectric sensor (resonant frequency 175 kHz, threshold 30 ) on a 25 single cell. Through principal component analysis and supervised pattern recognition, they classified AE signals into three distinct classes: Class A events (mean duration ) associated with hydrodynamic phenomena in the gas channel, Class B events linked to water transport from the GDL to the channel, and Class C events (3.4–21% of total signals, depending on conditions) attributed to electrochemical reactions and water uptake in the catalyst layer and membrane. No AE activity was detected below a gas flow rate of 0.75 (), establishing a clear threshold for biphasic flow detection.
Bethapudi et al. [72] advanced this approach by correlating AE with electrochemical impedance spectroscopy during polarization sweeps. The cumulative absolute AE energy (CAEE) increased from ∼1500 aJ at 10 s potentiostatic hold times to ∼14,500 aJ at 120 s holds, directly quantifying water accumulation. During galvanostatic operation at 1.0–1.2 , periodic CAEE peaks correlated with voltage recovery events, corresponding to water flushing from the channels. The reverse-scan CAEE was consistently 18–25% lower than the forward scan, reflecting membrane water re-absorption during voltage recovery.
Beyond fuel cell operation, AE has been applied to manufacturing quality control and hydrogen damage detection. Geiger et al. [73] demonstrated that an optical microphone (frequency range 10 Hz–1 MHz) can monitor ultrashort-pulse laser structuring of fuel cell diffusion media, detecting the MPL-to-GDL material transition within 25–40 pulses and identifying surface cracks through amplitude anomalies. Qiu et al. [74] applied AE combined with deep learning to hydrogen-induced damage in 4130X steel, achieving 98.37% classification accuracy for distinguishing bubble rupture (40–45 ), dislocation propagation (44–58 ), and crack propagation (50–68 ) using a CNN trained on STFT spectrograms.
For the practitioner, the diagnostic value of AE lies in mapping signal characteristics to specific faults. Table 5 compiles this mapping from the studies reviewed above. Where a fault type has no established AE signature yet—bolt loosening being the most prominent example—the table states so explicitly; such faults are currently detected mechanically or electrochemically rather than acoustically.
Table 5.
Mapping of acoustic emission (AE) signal characteristics to process and fault signatures in hydrogen systems, compiled from the studies reviewed in this section.
5.2. Optical and Camera-Based Vibration Imaging
Where acoustic emission is sensitive but provides only integrated, point-like information, camera-based methods can deliver full-field displacement maps of an entire structure without any physical contact. Miao et al. [76] developed a marker-free phase-based vibration imaging technique in which multi-scale, multi-direction complex Gabor filters extract local image phase, which is then converted to sub-pixel displacement through a constant spatial phase gradient model. Two confidence measures—phase nonlinearity and filter response—reject unreliable pixels, while the combined intersection-of-constraints and vector-average operators integrate the remaining displacement components into reliable full-field maps. Importantly for hydrogen systems, the technique was validated on an in-service hydrogen charging station, producing vibration amplitude maps of the dispenser enclosure at operating frequencies without requiring any markers, paints, or surface preparation. This capability is particularly attractive for retrofit monitoring of refuelling infrastructure and for periodic structural health inspections of hydrogen storage vessels, where the surfaces often cannot be modified for instrumentation.
5.3. Vibration Sensing Hardware and Placement
The diagnostic techniques above rely on an underlying sensing layer whose selection and placement determine what can be observed. Piezoelectric accelerometers remain the workhorse for stack and balance-of-plant vibration monitoring, offering wide bandwidth and dynamic range; MEMS accelerometers trade some of both for cost and size, which makes distributed measurements practical, though sensor mass loading must be considered on small single-cell fixtures. Strain gauges bonded to tie rods or bolts provide a direct proxy for clamping force, while piezoelectric force washers—as used by Kim et al. [26]—measure it directly and continuously. AE sensors (Section 5.1) capture high-frequency internal events, and the camera-based methods of Section 5.2 provide non-contact, full-field displacement maps where surfaces cannot be instrumented.
Placement guidance follows from the failure modes reviewed in Section 2 and Section 3: end plates and tie rods for preload monitoring; the stack–mount interface for the vibration actually transmitted into the stack; manifolds and piping for excitation generated by balance-of-plant machinery such as blowers and compressors [77,78]; and vessel saddles and brackets for storage systems, where the highest vibratory stresses concentrate [33]. For continuous health monitoring, a practical minimum configuration combines a sparse accelerometer set at the mounts, strain or force-washer sensing on a subset of tie rods, and periodic impedance tracking at characteristic frequencies [75].
5.4. Electrochemical Impedance Spectroscopy Under Vibration
Electrochemical impedance spectroscopy (EIS) provides frequency-resolved information about the internal losses of fuel cells and has been employed to track vibration-induced degradation in real time.
Hou et al. [41] performed EIS measurements on a 5 kW, 57-cell stack during 200 h of strengthened road vibration, using an extended Randles circuit with a constant phase element. The ohmic resistance increased approximately linearly at a rate of 0.0022 (0.036%/h), reaching a 5.36% total increase. The charge transfer resistance exhibited more complex behavior—initially decreasing after vibration onset, then ascending, and finally stabilizing at 4.4% below its original value. The spatial distribution of single-cell ohmic resistances (0.08–0.12 ) revealed that central cells had lower resistance due to higher local temperatures, highlighting the coupling between thermal and mechanical effects.
Yuan et al. [75] developed a more sophisticated approach using a transmission line model (TLM) equivalent circuit combined with fixed-frequency impedance tracking. They identified characteristic frequencies separating different loss mechanisms: 2500 Hz for proton transfer losses and 10 Hz for charge transfer and mass transport losses. During step-current transients, the 2500 Hz impedance tracked ohmic variations with fast time constants, while the 10 Hz impedance captured slower mass-transport dynamics. At low air stoichiometry (1.5), the 10 Hz impedance reached 245.5 , indicating severe local starvation—a condition that vibration can exacerbate through water redistribution. This dual-frequency monitoring approach offers a practical framework for real-time diagnostics of vibration effects during dynamic operation.
5.5. Neural Networks and Predictive Models
The complex, nonlinear nature of fuel cell vibration response has motivated the development of data-driven models, particularly neural networks, for prediction and monitoring.
Rouss and Charon [79] developed a MIMO multi-layer perceptron with a nonlinear autoregressive exogenous (NNARXM) structure for predicting the 3D mechanical vibration response of an operating PEMFC system. The network comprised 2 inputs, 9 outputs (3 accelerometers × 3 axes), and 909 trainable weights, with time regressors determined by the Lipschitz method. After pruning, the network maintained accurate predictions for both random vibration (road profile, RMS) and swept-sine excitation (6–1250 Hz, up to ) across all output channels.
Before modeling, Rouss et al. [80] characterized the mechanical nonlinearities present in fuel cell stacks using coherence functions, return plots, and recurrence plots. The analysis identified second-order nonlinearities in both individual bipolar plates and assembled stacks (1–20 g, 6–2000 Hz), with signatures matching a Stribeck dry friction model—indicating that inter-component friction (primarily between bipolar plates and tie rods) is the dominant source of nonlinear vibration behavior.
For real-time applications, Paclisan and Charon [81] compared two neural network architectures derived from physical mass-spring-damper models for a 13 kW, 120-cell stack. The Euler integration scheme required impractically high sampling rates (∼100 kHz) to achieve acceptable accuracy. The transition matrix scheme achieved prediction errors of ∼10−6 for simulated signals and for measured vibration data at a practical 10 kHz sampling rate. The key innovation was initializing network weights from physical model parameters rather than random values, ensuring faster convergence and physical consistency.
Complementary to these vibration-specific models, Calik et al. [82] demonstrated that a compact 4-5-1 feedforward ANN could predict delamination propagation under vibration with and MAPE of 6.74%, using the numerical results of Banan et al. [27] as training data. Such surrogate models enable rapid parametric studies that would be computationally prohibitive with full finite element simulations. More broadly, Owji et al. [83] provided a systematic review of AI applications across hydrogen vehicle technologies, documenting that machine learning methods can achieve up to 8% efficiency improvement and 32% reduction in hydrogen consumption. Their analysis highlights AI-driven noise, vibration, and harshness (NVH) control as a growing area, with deep reinforcement learning and predictive maintenance algorithms increasingly applied to fuel cell and hydrogen powertrain systems. In a related application domain, Hwang et al. [84] demonstrated an LSTM-based energy management system for PEMFC-battery hybrids in off-road construction equipment, where the neural network forecaster reduced fuel cell degradation from over 100% per year (simple on/off control) to near-negligible levels by smoothing the dynamic load fluctuations characteristic of heavy equipment operation.
5.6. Computational Fluid Dynamics and Finite Element Modeling
Computational methods—including finite element analysis (FEA), computational fluid dynamics (CFD), and coupled multiphysics simulations—have been essential for understanding vibration phenomena that are difficult to access experimentally.
Modal analysis using FEA has been the primary tool for determining natural frequencies and mode shapes, as discussed in Section 3.1. Beyond modal analysis, Banan et al. [27,40] developed cohesive zone models in ABAQUS to simulate delamination propagation at the membrane/catalyst layer interface under combined vibration and hygrothermal cycling. Their model incorporated Paris’ law for cyclic crack growth, plasticity for the Nafion membrane, and mixed-mode damage criteria. The combined loading analysis [40] revealed that vibrations accelerated delamination growth by up to 80.4% compared to hygrothermal cycling alone, and that a channel offset of only 0.1 mm caused damage propagation to begin 51% earlier. These coupled simulations demonstrated that vibration and hygrothermal effects are synergistic rather than simply additive.
For fluid-related phenomena, the VOF method has been widely used for droplet transport simulations (Section 4.1), while the lattice Boltzmann method has provided mesoscopic insight into coalescence dynamics [58]. The multiphysics PEMEC model of Yang et al. [32] coupled Butler–Volmer kinetics, capillary pressure via the Leverett function, and six-degree-of-freedom marine motions in ANSYS Fluent (Ansys, Inc., Canonsburg, PA, USA), representing the current state of the art in coupled vibration-electrochemistry simulation. Such comprehensive models are computationally expensive but provide insights into vibration-performance coupling that cannot be obtained from purely mechanical or purely electrochemical analyses alone.
6. Application-Specific Vibration Challenges
A fuel cell on a delivery truck and a fuel cell on a spacecraft share the same electrochemistry but exist in entirely different mechanical environments. During operation, the truck is subjected to low-band vibration (up to 50 Hz). In contrast, the spacecraft endures several minutes of extreme broadband excitation during launch and then operates in microgravity. Between these extremes, ships and aircraft each impose their own characteristic vibration signatures. This section reviews the four major application domains, highlighting the vibration profiles, failure modes, and design responses specific to each. Figure 5 provides a visual comparison of the frequency–acceleration amplitude envelopes for each application domain.
Figure 5.
Characteristic vibration environments for hydrogen system applications. Shaded regions indicate the typical frequency–acceleration envelope for each domain. The launch environment is represented as a two-part band: low-frequency quasi-static and sinusoidal loads, plus broadband random vibration whose upper bound reflects the fixture-amplified qualification levels measured by NASA [7]. Data points represent specific measurements from the literature: road vehicle stack testing [4,13], ship PEMFC critical frequencies [6,85], and NASA space qualification amplified loads [7]. Marker shape denotes the domain: circles, road vehicles; squares, marine; triangles, space qualification.
Table 6 condenses the comparison. Reading it row by row makes two practical points. First, the domains differ not only in severity but in kind: road vehicles impose broadband random excitation with vertical dominance, ships impose low-frequency harmonic motion where displacement and velocity (rather than acceleration) are the natural measures, aircraft qualification demands swept-sine coverage up to 3 kHz, and launch combines quasi-static, sine, and severe random loading for minutes rather than years. Second, the test standards listed are domain-specific and not interchangeable—they differ in excitation type, frequency range, severity, and acceptance criteria, and none contains hydrogen-specific pass/fail metrics. A stack qualified for one domain therefore cannot be assumed qualified for another, and each domain brings its own design concerns, summarized in the last column of the table.
Table 6.
Comparison of vibration environments across application domains for hydrogen systems.
6.1. Road Vehicles
Road vehicles represent the most extensively studied application domain for fuel cell vibration. The excitation is characterized by broadband random vibration, dominated by frequencies below 50 Hz with the highest damage potential around 10 Hz in the vertical direction [4].
Guo et al. [4] developed a comprehensive vibration test methodology for fuel cell stacks by collecting road load spectra from a fuel cell logistics vehicle across 12 road surface types. The overall RMS accelerations were (X), (Y), and (Z), confirming vertical dominance. Through rain-flow counting and fatigue damage spectrum analysis, a 21 h bench vibration scheme was formulated that reproduces the equivalent damage of an 800,000 km vehicle lifetime. For hydrogen storage systems on fuel cell buses, Guo et al. [5] measured maximum excitations of (Z), (Y), and (X) on a 35 MPa hydrogen bottle, establishing equivalent bench test profiles for a 300,000 km lifecycle.
Early experimental validation was provided by Rajalakshmi et al. [25], who tested a 500 W stack (30 cells) using sine, random, and shock excitation per standard protocols. The resonance frequency was identified at 179 Hz. After vibration sweeps at (30–150 Hz), bolt torque decreased from 14 to as low as 6 at the most vulnerable positions, while stack output dropped by 3.5% (from 425 to 410 W). Shock testing (, 15 ms) caused further bolt relaxation but no structural failure.
Beyond the fuel cell stack itself, auxiliary components contribute significantly to the vibration environment. Kim et al. [77] analyzed vibration transmission from a centrifugal turbo blower operating up to 30 kRPM. Vibration isolators at the mounting points provided approximately 20 dB attenuation, and a 30% reduction in mount stiffness yielded a 22% further decrease in transmitted vibration. Chen et al. [78] characterized the vibro-acoustic behavior of a high-speed two-stage centrifugal compressor, showing that surge events produce pressure pulsations up to 16.3 kPa and sound pressure levels reaching 97 at 85 kRPM. They demonstrated that rotating stall can be predicted 1.5–3 s in advance using acoustic signal monitoring. Fan noise presents another challenge: Hu et al. [86] optimized the radiator fan system of a 110 kW fuel cell vehicle, reducing noise by 4.2 while improving heat dissipation by 8% through thermal–fluid–acoustic synergy optimization.
Electromagnetic vibration from the electric drivetrain is an additional concern. Babitsky and Toporkov [87] analyzed radial electromagnetic forces in permanent magnet synchronous machines with fractional-slot concentrated windings, identifying that machines with six phase zones generate predominant second-order radial forces causing elliptical stator deformation, while three-phase-zone machines produce first-order forces causing one-sided rotor-stator attraction.
From a system-level perspective, a recent systematic review by Owji et al. [83] examined both hydrogen internal combustion engines (H2-ICE) and fuel cell hydrogen vehicles within the broader context of energy system integration. Their analysis identified high-pressure hydrogen storage (350–700 bar composite tanks) and the associated vibration-induced structural concerns as key technical challenges for both vehicle types. The review also highlighted the role of vehicle-to-grid (V2G) integration and the need for standardized safety protocols addressing crashworthiness and dynamic loading of on-board hydrogen systems, providing a strategic roadmap for hydrogen mobility deployment.
An alternative hydrogen powertrain concept in which vibration is inherent to the operating principle is the vibration hydrogen combustor (VHC). Pu and Yuan [88] investigated a novel crankshaftless VHC that uses an electromagnetic drive for free-piston reciprocation with a variable compression ratio. Using a multi-physics coupling model integrating piston dynamics, combustion, fuel injection, and gas exchange processes, they demonstrated that pilot diesel injection position (0–6 mm from TDC) critically governs hydrogen–air mixing uniformity and scavenging efficiency. The middle injection position achieved the widest mixing area with enhanced turbulence and prolonged mixing time, while optimized injection advance (3 mm) maximized equivalent speed and compression ratio. This work illustrates how vibration-based combustor designs introduce new coupling mechanisms between piston dynamics and hydrogen utilization that differ fundamentally from the vibration challenges faced by conventional PEMFC powertrains.
For off-road applications, Hwang et al. [84] developed an AI-driven energy management system (EMS) for PEMFC-battery hybrid powertrains in construction heavy equipment, where dynamic load cycles are more severe than in on-road vehicles. Using a five-layer LSTM network trained on 1000 h of real equipment load profiles, their online EMS controlled fuel cell output power at 1-min intervals, maintaining stable battery SOC while reducing hydrogen consumption. The MPC-optimized strategy (Model 4) achieved nearly negligible fuel cell degradation (∼0.03% per year) compared to 135–157% per year for simple on/off control, demonstrating the critical importance of load smoothing for PEMFC lifespan in high-vibration environments.
6.2. Marine Applications
Marine environments subject hydrogen systems to distinctive vibration patterns: low-frequency harmonic motions from ship engine vibration and wave-induced body motions, with allowable vibration loads reaching 214 —substantially higher than the 4.6–144 typical for road vehicles [6].
Wen et al. [6] performed 3D CFD simulations of a PEMFC single cell under ship vibration (2–20 Hz, 0.2–1.6 ) in three directions. Vertical vibration caused a 3.2% voltage decline at 1.5 by disrupting reactant gas distribution, while transverse and longitudinal vibrations had a negligible effect. A critical frequency of approximately 6.9 Hz produced the minimum output voltage, suggesting a resonance-like interaction between the vibration period and the gas channel residence time. Chen et al. [85] confirmed the dominance of vertical vibration through similar simulations at 10 Hz and 0.2 mm amplitude, observing output voltage oscillations between 0 and 0.65 V under vertical excitation compared to stable operation at ∼0.52 V under lateral or longitudinal vibration.
For marine electrolysis, Yang et al. [32] developed a comprehensive multiphysics model of a planar PEMEC (10 cm × 10 cm, 50 channels) under six-degree-of-freedom marine motions. Pitch motion was identified as the most detrimental, reducing the electrolysis current density by 13.3% and causing wide variations in oxygen concentration (0.012–0.035 ). Heave motion was beneficial in some respects, improving oxygen diffusion along the thickness direction and increasing current density by 7.39%. These findings suggest that the orientation and mounting of PEM electrolyzers on marine vessels should be designed to minimize pitch-induced disturbances.
A recent comprehensive review by Xie et al. [17] systematically examined the multifaceted impact of ship vibration on PEMFC systems. Their analysis categorized ship vibration sources into mechanical (engine, propeller), flow-induced (hydrodynamic forces, sea waves), and structural vibrations, noting that marine PEMFCs experience a “equipment–hull–seaway” coupling problem fundamentally different from road vehicle vibration. The review identified several critical mechanisms: (i) vibration-accelerated hydrogen embrittlement in metallic components, where cyclic straining can accelerate both hydrogen permeation and crack initiation; (ii) material selection challenges requiring a balance between corrosion resistance, vibration damping capacity, and hydrogen compatibility for steel, aluminum, and polymeric materials; and (iii) vibration-induced mechanical failures including seal degradation, bolt loosening, resonance at natural frequencies, and microcrack initiation. At the electrochemical level, the review documented how ship vibration simultaneously suppresses catalyst agglomeration (beneficial) while promoting carbon corrosion and platinum dissolution (detrimental), with the net effect being an overall decrease in PEMFC performance. The work provides the most comprehensive framework to date for understanding vibration effects on maritime PEMFC systems and highlights the need for vibration-resistant electrode designs and adaptive control algorithms.
6.3. Aerospace
Aircraft applications impose particularly demanding vibration requirements, combining high-frequency structural excitation with extreme hygrothermal environments at altitude.
Rouss et al. [89] performed the first experimental study specifically targeting aircraft vibration conditions, testing a five-cell stack (156 active area) per DO-160D Category R requirements with swept-sine excitation from 6 to 3000 Hz in three axes, starting at 1 g and incrementing by 1 g steps. The work was part of the European CELINA project (fuel cells in new configured aircraft). The companion modeling study [90] used a pruned neural network (seven hidden neurons, 36 weights after optimization) to predict the 3D vibration response from three-axis excitation, demonstrating strong cross-axis coupling (Y-excitation correlated with X-measurement on the bipolar plate).
The structural vibration of hydrogen–electric aircraft components has received growing attention. Song et al. [91] developed analytical models for composite laminated wing-box structures using improved orthogonal polynomials with the Rayleigh–Ritz method. Under hygrothermal conditions relevant to flight (20–125 °C, 0–1.5% moisture), the first natural frequency exhibited non-monotonic temperature dependence—first increasing (to 213 Hz at 90 °C) then decreasing (to 88 Hz at 125 °C) for clamped-free boundaries. Zhao et al. [92] extended this to rigid-flexible coupling vibration of composite box structures with attached fuel cell mass, identifying four novel vibration patterns and showing that temperature has a more pronounced effect on natural frequencies than humidity. Song et al. [93] analyzed open cylindrical shell fuselage structures with rectangular cutouts, finding that natural frequencies increase with both temperature and moisture concentration under clamped-free boundaries. Addressing the specific problem of supporting cryogenic hydrogen tanks, Zhang et al. [94] developed an analytical framework for composite beam-plate coupled structures (CBPCSs) that integrates Kirchhoff thin-plate theory with the Euler–Bernoulli beam assumption within a Rayleigh–Ritz formulation. Interfacial flexibility at the laminate beam-to-plate junctions was captured by an equivalent spring system, enabling realistic treatment of partial rigidity at connection interfaces. Validation against laboratory hammer tests and high-fidelity FEM showed good agreement, and parametric analyses revealed that boundary stiffness and coupling interfaces shift natural frequencies nonlinearly under hygrothermal loading. This work fills a previous gap in which prior models of hydrogen–electric aircraft structures considered plates in isolation; the beam-plate coupling formulation is directly applicable to the box-frames and reinforced panels used to mount cryogenic hydrogen cylinders, and should improve the accuracy of vibration predictions for this increasingly important class of airframe components.
The prospect of hydrogen–electric aircraft has recently moved stack vibration qualification from a research topic toward a certification requirement. Within the EU-funded NEWBORN project, Fasulo et al. [95] combined detailed finite element modeling—an orthotropic, two-zone representation of the cell package with reduced-order models of plates, compression bands, disc springs, and the mounting cage—with shaker testing of a PowerCell prototype aviation stack. Pseudo-random and swept-sine excitation between 10 and 300 Hz at up to yielded 54 frequency response functions, against which the tuned model reproduced the first global modes with good, though not perfect, agreement. The combined numerical–experimental methodology offers a template for refining test campaigns and delivering early, simulation-supported evidence of vibration immunity within the RTCA/DO-160 certification framework. Beyond the stack itself, hydrogen–electric aircraft face vibration questions that conventional airframes do not: cryogenic liquid-hydrogen tanks couple structural excitation to sloshing and ullage-pressure dynamics, and their support structures must carry inertial loads while accommodating thermal contraction [94]. The certification frameworks themselves lag behind: DO-160 vibration categories were not written with hydrogen systems in mind and contain no hydrogen-specific acceptance criteria such as post-test leak rate—an issue taken up in Section 8.3.
The combined effects of vibration and hygrothermal cycling on MEA damage were quantified by Banan et al. [40]. Under the most severe combined loading (4 g, 40 Hz vibration with ΔRH = 65%), delamination at the CL/membrane interface reached 0.1 mm after hygrothermal cycles—13% faster than without vibration. The delamination growth rate increased five-fold under combined loading at ΔRH = 65%, reaching 80.4% of the projected lifetime for the fuel cell ( start-up/shutdown cycles). Song et al. [2] reviewed the additional challenges of high-altitude operation, noting that fuel cell net power drops by approximately 15 W per 100 m altitude increase, and that reduced air density exacerbates both cathode starvation and vibration effects.
6.4. Space Applications
Space applications impose the most extreme vibration qualification requirements but also offer a controlled post-launch environment. Gilligan et al. [7] performed comprehensive structural dynamic testing of two air-independent PEM fuel cell stacks (Infinity: 12 cells, 50 ; Teledyne: 10 cells, 77 ) for Launch Vehicle Upper Stage applications at NASA Glenn Research Center.
The qualification protocol included random vibration at 10.4 for 5 min per axis and sinusoidal sweeps at 0.25 g peak (5–2000 Hz). Due to fixture resonances, actual loads were amplified significantly: the Infinity stack experienced up to 41.2 in the Y-axis, while the Teledyne stack reached 21.5 . Resonant frequency shifts remained within the 5% acceptance criterion for most axes (1.5–4.1%), with one exception at 7.5% for the Teledyne Y-axis that was deemed acceptable.
Critically, both stacks demonstrated no measurable change in either electrochemical or mechanical performance after testing. Pressure decay rates remained consistent (±10%) before, during, and after vibration, and average cell voltage deviations were below 1.5% across all current densities. The Teledyne stack’s integrated vibration-dampening mount contributed to its robust performance. These results confirm that properly designed PEM fuel cells can survive launch-level vibration environments, although microgravity effects on water management remain to be validated.
7. Cross-Technology Synthesis
Up to this point each technology has been treated more or less on its own terms. Setting the three side by side (Table 7) brings out something the individual sections leave implicit: how a hydrogen device reacts to vibration depends less on the numbers that describe the excitation—frequency, amplitude—than on what the vibration happens to do once it is inside. In a fuel cell the same shaking that clears water from a flooded channel will, given enough hours, work a clamping bolt loose, so vibration is at once useful and corrosive. An electrolyzer has less to lose: here vibration mostly helps, stripping gas bubbles off the electrodes faster than buoyancy manages on its own. A storage cylinder gains nothing at all, and simply has to survive vibration as a fatigue and impact load.
Table 7.
Cross-technology comparison of vibration characteristics, dominant mechanisms, and typical consequences across the three principal hydrogen energy technologies. Quantitative ranges are representative values drawn from the studies reviewed in Section 2, Section 3, Section 4, Section 5 and Section 6.
The common ground lies in the mechanisms rather than the symptoms. Two-phase flow disturbance is the same physics whether the fluid is liquid water leaving a fuel cell channel or hydrogen gas leaving an electrolyzer electrode; only the sign of the result differs. Loss of mechanical preload is a second recurring thread, appearing as clamping-force relaxation in a stack and as fastener fatigue in the saddle mounts of a cylinder. The literature is also consistent on one practical matter across all three technologies: direction is decisive. Vertical excitation does most of the damage to fuel cells, pitch is the worst case for marine electrolyzers, and axial loading drives cylinder failure —which is reason enough to be wary of the single-axis testing that remains routine. The cross-technology framework, then, is really a statement about shared causes rather than shared behaviour: the quantitative envelopes are worlds apart, but loss of preload, disrupted two-phase flow, and resonance-driven fatigue turn up again and again.
We have deliberately placed this synthesis after the evidence: each of the statements above and below is an induction from the results of Section 2, Section 3, Section 4, Section 5 and Section 6, not an assumption imposed upon them. To make the synthesis quantitative, Table 1 compiles the excitation parameters and outcomes of the principal studies across all three technologies, Figure 6 maps the three shared mechanisms onto the technologies, and the two subsections that follow address the questions a designer asks first: when is vibration beneficial rather than harmful (Section 7.1), and why do nominally similar studies disagree (Section 7.2)?
Figure 6.
Manifestation of the three shared vibration mechanisms across the three hydrogen technologies, with representative quantitative consequences from the studies reviewed in Section 2, Section 3, Section 4, Section 5 and Section 6. Sources cited in the figure: Imen and Shakeri [21], Kim et al. [26], Wismer et al. [67], Zhang et al. [33], Zhou et al. [28], Zhu et al. [10], Purnami et al. [11], Chen et al. [12], Banan et al. [27], Du et al. [34], Xiong et al. [35].
7.1. Conditions Governing Beneficial Versus Harmful Vibration
Distilling Table 1, vibration tends to be beneficial when four conditions coincide: (i) a two-phase transport bottleneck exists—channel flooding in fuel cells, bubble coverage in electrolyzers, water dispersion during cold start; (ii) the excitation is applied at low-to-moderate frequency and amplitude, away from structural resonances; (iii) the exposure is short or intermittent; and (iv) the direction is favorable—longitudinal to the channel for droplet transport, along gravity for cold start, vertical for bubble detachment. Conversely, vibration tends to be detrimental when the cumulative exposure is long, because bolt loosening, gasket fatigue, Pt migration, and delamination all scale with cycle count; when the excitation coincides with resonant or lightly damped torsional modes; when horizontal excitation drives water onto channel sidewalls; and, for storage vessels, essentially always at the component scale.
Figure 7 visualizes this parameter space by plotting the operating points of the reviewed studies in the frequency–acceleration plane, color-coded by reported outcome. Two caveats apply. First, the map is assembled from heterogeneous protocols (Section 7.2), so the shaded guide regions are indicative rather than sharp boundaries. Second, the third decisive axis—cumulative exposure time—cannot be fully represented in a plane: several of the “detrimental” points would plot as harmless in a short test and only reveal their damage after tens to hundreds of hours. The absence of a well-populated, standardized version of this map is itself one of the field’s most consequential gaps (Section 8.2).
Figure 7.
Indicative “friend-or-foe” map of the vibration parameter space, assembled from the studies in Table 1: color encodes the reported outcome, marker shape the technology. Where studies report displacement amplitude, peak acceleration is computed as . Storage-vessel studies report stresses rather than input accelerations and are omitted. The shaded guide regions are indicative only: outcomes depend additionally on exposure duration (most detrimental PEMFC points correspond to sustained campaigns of 30 min–300 h), direction, and operating state, and the underlying protocols are not standardized.
7.2. Why Studies Disagree
The apparent contradictions in the vibration literature largely dissolve once five confounding factors are made explicit.
- 1.
- Protocol heterogeneity. No two campaigns share excitation spectra, duration, or acceptance metrics: single-frequency sine at 2 g for 300 h [12] probes different physics than six-channel road spectra for 150 h [18], yet both are reported simply as “vibration testing”.
- 2.
- Scale effects. Single cells in stiff fixtures have structural modes in the kilohertz range [45], while multi-cell stacks respond at 242–350 Hz [48,49]; nominally identical excitation therefore probes entirely different dynamic regimes depending on the test article.
- 3.
- Uncontrolled hygrothermal state. Water content determines whether shaking helps (removing excess water) or harms (spreading films): the flow-rate-dependent sign reversal observed by El-Emam et al. [9] and the opposing droplet observations of Chen et al. [56] and Sellman and Santamaria [57] are most plausibly explained this way.
- 4.
- Clamping design differences. Bolt count, preload, and gasket compliance set both the dynamic response and the dominant loosening pathway [26,47], so the same excitation produces different degradation rates on different stack designs.
- 5.
- Metric differences. Studies report voltage decay, impedance growth, ECSA loss, leak rate, or clamping force—quantities that degrade on different timescales and cannot be converted into one another, which makes cross-study comparison of “degradation” inherently ambiguous.
Most disagreements between studies are therefore attributable to these factors rather than to genuinely inconsistent physics—which is the central argument for the standardization priority of Section 8.3.
8. Summary, Challenges and Future Perspectives
Having examined vibration phenomena across fuel cells, electrolyzers, storage vessels, and their diverse application environments, we now summarize the principal findings, highlight what we consider to be the most pressing open questions, and suggest where future effort is likely to be most productive.
8.1. Key Findings
Six themes emerge consistently from the literature:
- 1.
- Vibration is not simply harmful—it is dual-natured. This is perhaps the most important takeaway. Short bursts of low-frequency vibration can improve PEMFC output by shaking water out of the GDL [8,9], help a frozen cell start at °C [24], or boost electrolyzer hydrogen yield by over 100% [10,11]. But the same mechanisms, operating over hundreds of hours, loosen bolts, initiate gas leaks, and accelerate catalyst degradation [12,13,19]. We note that no study has yet mapped the boundary between “helpful” and “harmful” vibration in a way that would be useful for system designers.
- 2.
- Bolt loosening dominates the short-to-medium term. This conclusion is robust: Imen and Shakeri [21] recovered nearly all lost performance simply by retorquing bolts; Kim et al. [26] showed clamping force decay follows a Basquin law; and the systematic campaign by Hou and co-workers [13,18,19,96] tracked the cascade from bolt relaxation through increased contact resistance to measurable electrochemical loss. In our assessment, this makes bolt loosening the single most actionable target for vibration mitigation.
- 3.
- Irreversible electrochemical damage sets in over longer timescales. Chen et al. [12] found that 300 h of vibration roughly halved the projected MEA lifetime, with post-mortem TEM revealing enhanced Pt migration into the membrane. Banan et al. [27,40] showed delamination at the CL/membrane interface growing to failure-critical lengths under combined vibration and hygrothermal cycling. Interestingly, Diloyan et al. [20] observed smaller Pt particles under vibration—a counterintuitive result they attributed to MEA thinning that reduced the Pt ion reservoir available for Ostwald ripening.
- 4.
- Direction matters as much as amplitude. Vertical vibration is consistently the most damaging to fuel cells [6,28,85], while horizontal vibration drives water onto channel sidewalls and worsens flooding [28]. For marine electrolyzers, pitch is the critical degree of freedom [32]. These findings argue strongly against the single-axis testing that remains common practice.
- 5.
- Stack natural frequencies are generally above road excitation—but not by a comfortable margin. Single-cell models predict first modes above 2 kHz [45], but real multi-cell stacks drop to 242–350 Hz [48,49] because the layered structure reduces effective stiffness by up to 85% [49]. Torsional modes are particularly concerning: they are lightly damped, so once excited, they ring for a long time.
- 6.
- Ruggedized fuel cells can survive extreme environments. NASA testing at 10.4 (with fixture amplification reaching 41 ) produced no measurable degradation [7]. This is encouraging—it shows that the problem is solvable with proper mechanical design, even if most commercial stacks are not yet designed to this standard.
8.2. Identified Knowledge Gaps
Despite the volume of work reviewed here, several gaps stand out—some of which, in our view, represent genuine barriers to engineering deployment. We rank them by a combination of urgency and impact, with a brief justification for each rank.
- There is no standard vibration test for hydrogen components. Every research group chooses its own frequencies, amplitudes, durations, and stack sizes, which makes quantitative comparison across studies nearly impossible. The community would benefit greatly from a consensus protocol analogous to the IEC 61373 [97] standard used for railway equipment or the DO-160 [98] environmental categories for avionics. Ranked first because it blocks progress on every other gap: without comparable results, neither design rules nor lifetime models can be built.
- The longest tests are still far too short. At 250–300 h [12,13], the available durability data cover less than 5% of the expected lifetime for an automotive fuel cell (5000–8000 h) and less than 1% of the target for a stationary system (40,000 h). Whether the degradation rates measured in these short campaigns can be extrapolated linearly—or whether they accelerate, saturate, or exhibit threshold behavior—is simply unknown. Ranked second because lifetime prediction is impossible without these data.
- Electrolysis under vibration is a near-blank slate. Compared to the dozens of PEMFC studies reviewed in Section 2 and Section 3, only a handful of studies address electrolyzers (Section 4.3) and none examines long-term durability; Wismer et al. [67] identify vibration-induced component dislodging as a recognized failure mode, yet systematic test data are absent. Ranked third for urgency: offshore and floating electrolysis is being planned and deployed on essentially zero vibration-durability data.
- Multiphysics coupling is poorly understood. Most studies treat vibration as either a mechanical or an electrochemical problem, rarely both at once; only Banan et al. [40] and Yang et al. [32] have attempted truly coupled analyses. As argued in Section 7.2, uncontrolled thermal and hydration states are the most plausible explanation for contradictory findings, and only coupled models can capture them. Ranked fourth: it underpins the interpretation of every experiment.
- Engineers lack vibration-aware design rules. Individual papers offer parameter-specific insights, but there is no handbook-level guidance on how to select clamping torque, choose mounting isolators, or orient a stack as a function of the target vibration spectrum. This is arguably the most consequential gap for industry adoption. Ranked fifth only because it cannot be closed before gaps 1–2 are.
- Microgravity water management is unvalidated. Launch-qualified stacks survived vibration without degradation [7], but the behavior of product water in sustained microgravity—and whether deliberately applied vibration could substitute for buoyancy-driven transport—remains untested in orbit. Ranked sixth: important, but confined to a single application domain.
- Microfluidic fuel cells remain impractical in mobile settings. The extreme sensitivity of membraneless devices to vibration [14,37]—where accelerations as low as 0.1 can cause complete fuel crossover—is a fundamental physics limitation, not merely an engineering challenge. Ranked last: a real limitation, but with a narrow application scope.
8.3. Recommendations for Future Research
We consolidate our recommendations into four clearly defined priorities, ordered by urgency.
- Standardized vibration testing. This is the single most impactful step the community could take, and the fastest realistic route is adaptation rather than invention: suitable excitation spectra already exist in mature domain standards (IEC 61373 [97] for road and rail, ISO 20283-5 [99] for marine, DO-160 [98] and MIL-STD-810 [100] for air and defense). What is missing are hydrogen-specific acceptance criteria—post-test hydrogen leak rate, electrical insulation resistance (cf. SAE J2578 [101]), clamping-force retention, and electrochemical health metrics such as ECSA and high-frequency resistance—together with agreed test articles and operating states (operating vs. non-operating, humidified vs. dry). We propose that a working group under the existing fuel-cell standardization umbrella (IEC TC 105, alongside the IEC 62282 [102] series) define a tiered protocol reusing the domain spectra, with mandatory reporting of the parameter set this review identifies as decisive (amplitude, frequency content, direction, cumulative exposure), validated through an inter-laboratory round-robin campaign on a common commercial short stack. A standard produced this way need not be perfect to be transformative; its main value is making results comparable.
- Long-term durability evaluation. We recognize that 1000+ h vibration campaigns on commercial stacks are expensive and unglamorous, but without them lifetime predictions will remain speculative. Periodic ex situ characterization (TEM, XRD, pressure decay) during such tests would reveal whether degradation is linear, accelerating, or saturating—a distinction with major design implications—and the fatigue framework established for clamping-force decay [26], reinforced by parallels with battery cycling damage [103], provides a quantitative basis for replacing the ad hoc extrapolations currently used in the field. The same priority extends to electrolyzers: wave-induced motions are unavoidable on floating platforms, and both short-term performance fluctuations and long-term membrane electrode assembly durability must be quantified before gigawatt-scale offshore electrolysis becomes a reality.
- Coupled multiphysics modeling. Resolving structural dynamics, two-phase flow, heat transfer, and electrochemistry simultaneously is now computationally feasible with modern reduced-order techniques. Such models would explain the state-dependence behind contradictory experimental findings (Section 7.2), enable virtual vibration qualification, and reduce the need for costly physical testing.
- Vibration-resistant and vibration-aware design. Three engineering directions follow directly from the reviewed evidence. First, fix the bolt loosening problem: self-locking fasteners, shape-memory alloy washers, and active clamping-force control should be evaluated systematically, with the Basquin framework of Kim et al. [26] providing quantitative design targets. Second, embed vibration monitoring in fuel cell control systems: impedance tracking at characteristic frequencies [75] and acoustic emission sensing [71,72] are mature enough to detect bolt loosening and seal degradation in real time (Section 5.3), and integrating these signals into the balance-of-plant controller could prevent failures before they become safety incidents. Third, explore active vibration as a feature rather than a bug: vibro-acoustic water removal [60,61] consumes negligible power relative to stack output and deserves a revisit with modern piezoelectric actuators and real-time control, deliberately applying vibration at beneficial frequencies while staying below damage thresholds.
If we must single out the most urgent step, it is the combination of the first two priorities: a standardized test protocol executed in long-duration campaigns. Every other advance—design rules, model validation, lifetime prediction, even a well-populated version of the friend-or-foe map of Figure 7—is bottlenecked by the current inability to compare results across laboratories and to know whether short-test degradation rates extrapolate. Among the technologies, electrolyzers deserve the most immediate attention, because offshore deployment is proceeding ahead of the vibration-durability data that should underpin it.
Author Contributions
Conceptualization, D.S. and I.T. (Ivan Tolj); methodology, D.S., I.T. (Ivan Tomac) and I.T. (Ivan Tolj); validation, D.S., I.T. (Ivan Tomac), C.S. and I.T. (Ivan Tolj); formal analysis, D.S. and I.T. (Ivan Tolj); investigation, D.S. and I.T. (Ivan Tolj); resources, D.S. and I.T. (Ivan Tolj); writing—original draft preparation, D.S., I.T. (Ivan Tomac), C.S. and I.T. (Ivan Tolj); writing—review and editing, D.S., I.T. (Ivan Tomac), C.S. and I.T. (Ivan Tolj); visualization, D.S. and I.T. (Ivan Tolj); supervision, D.S. and I.T. (Ivan Tolj). All authors have read and agreed to the published version of the manuscript.
Funding
This work was fully supported by the Croatian Science Foundation (HRZZ) under Project IP-2025-02-1981, “Design and fabrication of a metal hydride hydrogen compressor incorporating a heat storage unit for hydrogen refueling stations- HyRefuelStat”.
Data Availability Statement
All data can be used on request.
Acknowledgments
During the preparation of this manuscript the authors used Claude (Anthropic) in order to improve the readability and language of the manuscript and to assist in drafting and refining text. The authors have reviewed and edited the output and take full responsibility for the content of this publication.
Conflicts of Interest
The authors declare no conflicts of interest.
Nomenclature and Abbreviations
The following nomenclature and abbreviations are used throughout this manuscript:
| Roman symbols | Greek symbols | ||
| a | Basquin fatigue strength coefficient (N)/acceleration | Gravity inclination angle | |
| A | Norton–Bailey creep constant | Vibration direction angle | |
| Vibration stress amplitude coefficient | Thermal expansion coefficient | ||
| b | Tafel slope/fatigue strength exponent | Creep strain rate () | |
| d | Cavity characteristic length | Strain | |
| E | Young’s modulus | Temperature difference | |
| F | Clamping force | Dynamic viscosity | |
| f | Excitation frequency | Water dynamic viscosity | |
| g | Standard gravitational acceleration (9.81 m/s2); unit of vibration amplitude | Kinematic viscosity/ Poisson’s ratio | |
| Root-mean-square acceleration, in units of g | , | Density/water density | |
| G | Shear modulus | , | Stress/shear force RMS amplitude |
| I | Current density | Water surface tension | |
| m | Mass transport parameter/creep time exponent | Angular frequency | |
| n | Creep exponent/mass transport exponent | Dimensionless numbers | |
| N, | Number of vibration/reversal cycles | Gr | Grashof number |
| R | Ohmic resistance/droplet radius | Vibrational Grashof number | |
| Droplet cap surface area | Re | Reynolds number | |
| t | Time | ||
| U | Cell voltage/oscillatory velocity amplitude | ||
| Open-circuit voltage | |||
| Droplet cap volume | |||
| X | Vibration displacement amplitude | ||
| Abbreviations | |||
| AE | Acoustic emission | HFR | High-frequency resistance |
| ANN | Artificial neural network | MAST | Multi-Axial Simulation Table |
| BPP | Bipolar plate | MEA | Membrane electrode assembly |
| CFD | Computational fluid dynamics | MFC | Microfluidic fuel cell |
| CL | Catalyst layer | OCV | Open-circuit voltage |
| ECSA | Electrochemically active surface area | PEM | Proton exchange membrane |
| EIS | Electrochemical impedance spectroscopy | PEMEC | PEM electrolysis cell |
| FEA | Finite element analysis | PEMFC | PEM fuel cell |
| GDL | Gas diffusion layer | VOF | Volume of fluid |
References
- Dafalla, A.M.; Jiang, F. Stresses and their impacts on proton exchange membrane fuel cells: A review. Int. J. Hydrogen Energy 2018, 43, 2327–2348. [Google Scholar] [CrossRef] [Scilit]
- Song, W.J.; Chen, H.; Guo, H.; Ye, F.; Li, J.R. Research progress of proton exchange membrane fuel cells utilizing in high altitude environments. Int. J. Hydrogen Energy 2022, 47, 24945–24962. [Google Scholar] [CrossRef] [Scilit]
- Qiu, D.; Peng, L.; Yi, P.; Lehnert, W.; Lai, X. Review on proton exchange membrane fuel cell stack assembly: Quality evaluation, assembly method, contact behavior and process design. Renew. Sustain. Energy Rev. 2021, 152, 111660. [Google Scholar] [CrossRef] [Scilit]
- Guo, T.; Zhou, M.; Wang, G.; Wu, S.; Wang, F. Based on the fuel cell stack vibration test and evaluation method under the actual operation scenario of vehicles. Proc. J. Phys. Conf. Ser. 2024, 2860, 012054. [Google Scholar] [CrossRef] [Scilit]
- Guo, T.; Xu, Y.; Wang, G.; Wu, S.; Wu, Z.; Wang, Z.; Liang, R.; Zhou, M.; Wang, F. Research on vibration test method of hydrogen system in fuel cell bus. Proc. J. Phys. Conf. Ser. 2023, 2610, 012027. [Google Scholar] [CrossRef] [Scilit]
- Wen, X.; Qiu, Y.; Zhan, Z.; Xiao, L. Investigation of ship vibration effects on the gas distribution and output voltage of a proton exchange membrane fuel cell. ACS Omega 2022, 7, 20569–20583. [Google Scholar] [CrossRef] [Scilit] [PubMed]
- Gilligan, R.P.; Jakupca, I.J.; Smith, P.J.; Bennett, W.R.; Guzik, M.C.; Kacher, H. Structural dynamic testing results for air-independent proton exchange membrane (PEM) fuel cell technologies for space applications. In Proceedings of the ASME 2019 International Mechanical Engineering Congress and Exposition (IMECE), Salt Lake City, UT, USA, 11–14 November 2019. Paper IMECE2019-11691, V001T03A038. [Google Scholar] [CrossRef] [Scilit]
- Wang, X.; Wang, S.; Chen, S.; Zhu, T.; Xie, X.; Mao, Z. Dynamic response of proton exchange membrane fuel cell under mechanical vibration. Int. J. Hydrogen Energy 2016, 41, 16287–16295. [Google Scholar] [CrossRef] [Scilit]
- El-Emam, S.H.; Mousa, A.A.; Awad, M.M. Effects of stack orientation and vibration on the performance of PEM fuel cell. Int. J. Energy Res. 2015, 39, 75–83. [Google Scholar] [CrossRef] [Scilit]
- Zhu, D.; Xu, L.; Su, X.; Hu, B.; Jia, T.; Mi, L. Experimental study of the effect of mechanical vibration and water velocity on bubble management in PEM electrolysis cell. Int. J. Hydrogen Energy 2024, 49, 390–403. [Google Scholar] [CrossRef] [Scilit]
- Purnami, P.; Satrio, N.W.; Sofi’i, Y.K.; Wardana, I.N.G. The impact of mechanical vibration at cathode on hydrogen yields in water electrolysis. J. Power Sources 2024, 615, 235075. [Google Scholar] [CrossRef] [Scilit]
- Chen, S.; Wang, X.; Zhu, T. Effect of mechanical vibration on the durability of proton exchange membrane fuel cells. Nanomaterials 2023, 13, 2191. [Google Scholar] [CrossRef] [Scilit] [PubMed]
- Hou, Y.; Hao, D.; Shen, J.; Li, P.; Zhang, T.; Wang, H. Effect of strengthened road vibration on performance degradation of PEM fuel cell stack. Int. J. Hydrogen Energy 2016, 41, 5123–5134. [Google Scholar] [CrossRef] [Scilit]
- Ouyang, T.; Zhou, F.; Chen, J.; Lu, J.; Chen, N. A novel approach for modelling microfluidic fuel cell coupling vibration. J. Power Sources 2020, 450, 227728. [Google Scholar] [CrossRef] [Scilit]
- Haji Hosseinloo, A.; Mousavi Ehteshami, M. Shock and vibration effects on performance reliability and mechanical integrity of proton exchange membrane fuel cells: A critical review and discussion. J. Power Sources 2017, 364, 367–373. [Google Scholar] [CrossRef] [Scilit]
- Khetabi, E.M.; Bouziane, K.; Zamel, N.; Francois, X.; Meyer, Y.; Candusso, D. Effects of mechanical compression on the performance of polymer electrolyte fuel cells and analysis through in-situ characterisation techniques—A review. J. Power Sources 2019, 424, 8–26. [Google Scholar] [CrossRef] [Scilit]
- Xie, Y.; Li, X.; Liu, J.; Cheng, Z.; Zhu, J.; Chen, D.L. Vibration impact on PEMFC system security and performance in ships: A review. Int. J. Hydrogen Energy 2026, 210, 153693. [Google Scholar] [CrossRef] [Scilit]
- Hou, Y.; Zhou, B.; Zhou, W.; Shen, C.; He, Y. An investigation of characteristic parameter variations of the polarization curve of a proton exchange membrane fuel cell stack under strengthened road vibrating conditions. Int. J. Hydrogen Energy 2012, 37, 11887–11893. [Google Scholar] [CrossRef] [Scilit]
- Hou, Y.; Zhou, W.; Shen, C. Experimental investigation of gas-tightness and electrical insulation of fuel cell stack under strengthened road vibrating conditions. Int. J. Hydrogen Energy 2011, 36, 13763–13768. [Google Scholar] [CrossRef] [Scilit]
- Diloyan, G.; Sobel, M.; Das, K.; Hutapea, P. Effect of mechanical vibration on platinum particle agglomeration and growth in polymer electrolyte membrane fuel cell catalyst layers. J. Power Sources 2012, 214, 59–67. [Google Scholar] [CrossRef] [Scilit]
- Imen, S.J.; Shakeri, M. Reliability evaluation of an open-cathode PEMFC at operating state and longtime vibration by mechanical loads. Fuel Cells 2016, 16, 126–134. [Google Scholar] [CrossRef] [Scilit]
- MIL-STD-810G; Environmental Engineering Considerations and Laboratory Tests. U.S. Department of Defense: Washington, DC, USA, 2008.
- Nan, Z.; Behrendt, M.; Bause, K.; Albers, A.; Wei, X.; Ma, T.; Lin, W.; Zuo, S. Method to investigate the short-term effects of vibration on the output performance of the proton exchange membrane fuel cell in fuel cell vehicles. Energy Convers. Manag. 2022, 269, 116109. [Google Scholar] [CrossRef] [Scilit]
- Xie, X.; Zhu, M.; Wu, S.; Tongsh, C.; Sun, X.; Wang, B.; Park, J.W.; Jiao, K. Investigation of mechanical vibration effect on proton exchange membrane fuel cell cold start. Int. J. Hydrogen Energy 2020, 45, 14528–14538. [Google Scholar] [CrossRef] [Scilit]
- Rajalakshmi, N.; Pandian, S.; Dhathathreyan, K.S. Vibration tests on a PEM fuel cell stack usable in transportation application. Int. J. Hydrogen Energy 2009, 34, 3833–3837. [Google Scholar] [CrossRef] [Scilit]
- Kim, D.; Sim, K.; Park, J. Experimental study on vibration-induced clamping force reduction in fuel cell structures. Int. J. Hydrogen Energy 2022, 47, 37609–37616. [Google Scholar] [CrossRef] [Scilit]
- Banan, R.; Bazylak, A.; Zu, J. Effect of mechanical vibrations on damage propagation in polymer electrolyte membrane fuel cells. Int. J. Hydrogen Energy 2013, 38, 14764–14772. [Google Scholar] [CrossRef] [Scilit]
- Zhou, S.H.; Ye, F.; Du, W.; Chen, H.; Deng, C.W.; Guo, H. Effect of high-intensity vibration parameter on droplet transport characteristics in gas channel of proton exchange membrane fuel cell. Int. Commun. Heat Mass Transf. 2024, 157, 107785. [Google Scholar] [CrossRef] [Scilit]
- Su, H.; Sun, J.; Wang, C.; Wang, H. Temperature impacts on the growth of hydrogen bubbles during ultrasonic vibration-enhanced hydrogen generation. Ultrason. Sonochemistry 2024, 102, 106734. [Google Scholar] [CrossRef] [Scilit] [PubMed]
- Araújo, F.; Costa Neto, R.; Moita, A.S. Alkaline water electrolysis: Ultrasonic field and hydrogen bubble formation. Int. J. Hydrogen Energy 2024, 78, 594–603. [Google Scholar] [CrossRef] [Scilit]
- Gravelle, J.; Avramovic, V.; Hallez, L.; Hihn, J.Y.; Pollet, B.G. Effects of a perpendicular ultrasonic field on planar and porous electrodes for hydrogen production in alkaline conditions. Ultrason. Sonochem. 2025, 120, 107481. [Google Scholar] [CrossRef] [Scilit] [PubMed]
- Yang, C.; Li, Y.; Jin, Y.; Kan, A.; Wang, Y.; Wu, Y.; Wang, J. Modelling and analysis of multiphysics transport processes in proton exchange membrane electrolysis cell under marine motions. Renew. Energy 2025, 240, 122188. [Google Scholar] [CrossRef] [Scilit]
- Zhang, T.; Duan, Z.; Liu, F.; Yang, W. Failure mechanisms of onboard hydrogen storage systems under real-world road-induced vibrations. Int. J. Hydrogen Energy 2025, 193, 152367. [Google Scholar] [CrossRef] [Scilit]
- Du, Y.; Fan, Z.; Chen, X.; Xu, S.; Zhang, Y.; Li, F.; Wang, X. Random vibration fatigue characteristics of large-aspect-ratio Type IV hydrogen cylinders for tube trailers. Int. J. Hydrogen Energy 2025, 179, 151749. [Google Scholar] [CrossRef] [Scilit]
- Xiong, X.; Wang, W.; Li, X.; Fan, F.; Zhou, J.; Chen, M. Prediction and optimization of the long-term fatigue life of a composite hydrogen storage vessel under random vibration. Materials 2025, 18, 712. [Google Scholar] [CrossRef] [Scilit] [PubMed]
- Yao, J.; Chen, X.; Lu, H.; Xu, Z.; Zhang, Z.; Liu, B. Dynamic response characteristics and damage modes of multifunctional layered hydrogen storage vessels under impact loads. Int. J. Hydrogen Energy 2024, 54, 526–539. [Google Scholar] [CrossRef] [Scilit]
- Chen, J.; Xu, P.; Lu, J.; Ouyang, T.; Mo, C. A prospective study of anti-vibration mechanism of microfluidic fuel cell via novel two-phase flow model. Energy 2021, 218, 119543. [Google Scholar] [CrossRef] [Scilit]
- Ouyang, T.; Lu, J.; Zhao, Z.; Chen, J.; Xu, P. New insight on the mechanism of vibration effects in vapor-feed microfluidic fuel cell. Energy 2021, 225, 120207. [Google Scholar] [CrossRef] [Scilit]
- Slawinski, D.; Bykuc, S.; Glinski, M.; Chaja, P. Numerical studies on vibro-creep of PEM fuel cell elements used in mobile applications. Int. J. Hydrogen Energy 2023, 48, 30570–30584. [Google Scholar] [CrossRef] [Scilit]
- Banan, R.; Bazylak, A.; Zu, J. Combined effects of environmental vibrations and hygrothermal fatigue on mechanical damage in PEM fuel cells. Int. J. Hydrogen Energy 2015, 40, 1911–1922. [Google Scholar] [CrossRef] [Scilit]
- Hou, Y.; Zhang, X.; Lu, X.; Hao, D.; Ma, L.; Li, P. AC impedance characteristics of a vehicle PEM fuel cell stack under strengthened road vibrating conditions. Int. J. Hydrogen Energy 2014, 39, 18362–18368. [Google Scholar] [CrossRef] [Scilit]
- Wang, K.; Li, N.; Yang, Y.; Ke, S.; Zhang, Z.; Dou, M.; Wang, F. Effect of load-cycling amplitude on performance degradation for proton exchange membrane fuel cell. Chin. Chem. Lett. 2021, 32, 3159–3163. [Google Scholar] [CrossRef] [Scilit]
- Han, J.; Han, J.; Yu, S. Experimental analysis of performance degradation of 3-cell PEMFC stack under dynamic load cycle. Int. J. Hydrogen Energy 2020, 45, 13045–13054. [Google Scholar] [CrossRef] [Scilit]
- Deshpande, J.; Dey, T.; Ghosh, P.C. Effect of vibrations on performance of polymer electrolyte membrane fuel cells. Energy Procedia 2014, 54, 756–762. [Google Scholar] [CrossRef] [Scilit]
- Ahmed, H.E.U.; Banan, R.; Zu, J.W.; Bazylak, A. Free vibration analysis of a polymer electrolyte membrane fuel cell. J. Power Sources 2011, 196, 5520–5525. [Google Scholar] [CrossRef] [Scilit]
- Vengatesan, S.; Venkadesh, R.; AVR, S.; Khan, M.W. Parametric study on geometric and material properties of polymer electrolyte membrane fuel cell with free vibration analysis. Int. J. Hydrogen Energy 2023, 48, 18022–18031. [Google Scholar] [CrossRef] [Scilit]
- Liu, B.; Liu, L.F.; Wei, M.Y.; Wu, C.W. Vibration mode analysis of the proton exchange membrane fuel cell stack. J. Power Sources 2016, 331, 299–307. [Google Scholar] [CrossRef] [Scilit]
- Mohammadi, M.M.; Barzegari, M.M.; Moosazadeh, H. Experimental study and numerical modeling of vibrational characteristics of a 500 W PEM fuel cell stack. Hydrog. Fuel Cell Energy Storage 2022, 9, 39–52. [Google Scholar] [CrossRef]
- Ahn, S.; Koh, H.; Lee, J.; Park, J. Dependence between the vibration characteristics of the proton exchange membrane fuel cell and the stack structural feature. Environ. Res. 2019, 173, 48–53. [Google Scholar] [CrossRef] [Scilit] [PubMed]
- Imen, S.J.; Shakeri, M. Vibration modeling of PEM fuel cell for prediction of cell number effects by experimental data. Fuel Cells 2016, 16, 193–204. [Google Scholar] [CrossRef] [Scilit]
- Liu, Y.; Du, Y.; Zhang, Z.; Zhou, F.; Ma, L.; Liu, B. Dynamic response and vibration modes of multi-layer wound cylindrical shell for hydrogen storage under external blast loading. Int. J. Hydrogen Energy 2024, 54, 1242–1250. [Google Scholar] [CrossRef] [Scilit]
- Gebac, L.C.; Bercu, V. New pathways to high-pressure hydrogen enabled by fullerane vibrational modes: An ab initio study. RSC Adv. 2025, 15, 23302–23310. [Google Scholar] [CrossRef] [Scilit] [PubMed]
- Wu, C.W.; Liu, B.; Wei, M.Y.; Zhang, W. Mechanical response of a large fuel cell stack to impact: A numerical analysis. Fuel Cells 2015, 15, 344–351. [Google Scholar] [CrossRef] [Scilit]
- Liu, B.; Wei, M.Y.; Zhang, W.; Wu, C.W. Effect of impact acceleration on clamping force design of fuel cell stack. J. Power Sources 2016, 303, 118–125. [Google Scholar] [CrossRef] [Scilit]
- Ma, L.; Lv, B.; Hou, Y.; Pan, X. Prediction model of the mechanical behavior of a fuel cell stack under strengthened road vibrating conditions. Model. Simul. Eng. 2021, 2021, 6671547. [Google Scholar] [CrossRef] [Scilit]
- Chen, S.; Wang, X.; Zhu, T.; Xie, X. Interaction of vibration and air flow—Accelerating droplet emission from the gas diffusion layer of proton exchange membrane fuel cell. Int. J. Photoenergy 2019, 2019, 1674134. [Google Scholar] [CrossRef] [Scilit]
- Sellman, J.T.; Santamaria, A.D. Ex-situ probing of PEFC liquid droplet dynamics in the presence of vibration. Int. J. Hydrogen Energy 2017, 42, 12551–12558. [Google Scholar] [CrossRef] [Scilit]
- Zhai, S.; Chen, S. Lattice Boltzmann simulation of droplet coalescence in fuel cell flow channel with mechanical vibration. Int. Commun. Heat Mass Transf. 2023, 145, 106856. [Google Scholar] [CrossRef] [Scilit]
- Jiao, D.; Jiao, K.; Niu, Z.; Zhong, S.; Du, Q. Water transport in the gas diffusion layer of PEMFC under vibration conditions. Int. J. Energy Res. 2020, 44, 4438–4448. [Google Scholar] [CrossRef] [Scilit]
- Palan, V.; Shepard, W.S., Jr. Enhanced water removal in a fuel cell stack by droplet atomization using structural and acoustic excitation. J. Power Sources 2006, 159, 1061–1070. [Google Scholar] [CrossRef] [Scilit]
- Palan, V.; Shepard, W.S., Jr.; Williams, K.A. Removal of excess product water in a PEM fuel cell stack by vibrational and acoustical methods. J. Power Sources 2006, 161, 1116–1125. [Google Scholar] [CrossRef] [Scilit]
- Serik, A.; Kuspanov, Z.; Daulbayev, C. Cost-effective strategies and technologies for green hydrogen production. Renew. Sustain. Energy Rev. 2026, 226, 116242. [Google Scholar] [CrossRef] [Scilit]
- Mahmood, S.A.; Abdu, H.I.; Almohannadi, E.K.; Usmonov, B.; Khudayberdieva, A.; Shibl, M.F.; Soliman, K.A.; Mobarak, N.N.; Eid, K. Facile one-pot synthesis of hierarchical porous carbon nanofibers encapsulated metal nanocrystals as efficient Pt-free electrocatalysts for green hydrogen production. Int. J. Hydrogen Energy 2026, 227, 154556. [Google Scholar] [CrossRef] [Scilit]
- Hubaish, S.M.; Saad, M.; Eljack, F.; Chitt, M.; Mahkamova, L.; Eid, K. Porous carbon nanoflakes doped with boron derived from carbon fabric containing polyester as efficient electrocatalysts for green hydrogen production. Polymers 2026, 18, 1107. [Google Scholar] [CrossRef] [Scilit] [PubMed]
- Su, H.; Sun, J.; Wang, C.; Wang, H. Study on the influence of ultrasound on the kinetic behaviour of hydrogen bubbles produced by proton exchange membrane electrolysis with water. Ultrason. Sonochem. 2024, 108, 106968. [Google Scholar] [CrossRef] [Scilit] [PubMed]
- Zeng, C.; Teoh, Y.H.; How, H.G.; Idroas, M.Y.; Le, T.D. Ultrasound-enhanced water electrolysis for hydrogen production: Mechanisms, metrology and energy metrics. J. Electrochem. Sci. Eng. 2026, 16, 3045. [Google Scholar] [CrossRef] [Scilit]
- Wismer, S.E.; Jimenez, A.; Al-Douri, A.; Grabovetska, V.; Groth, K.M. PEM electrolyzer failure scenarios identified by failure modes and effects analysis (FMEA). Int. J. Hydrogen Energy 2024, 89, 1280–1289. [Google Scholar] [CrossRef] [Scilit]
- Lyubimova, T.P.; Plotnikov, S.A.; Sharifulin, A.N.; Modorskii, V.Y.; Neshev, S.S.; Kalyulin, S.L. A method based on thermo-vibrational effects for hydrogen transportation and storage. Fluid Dyn. Mater. Process. 2024, 20, 2775–2787. [Google Scholar] [CrossRef] [Scilit]
- Ouyang, T.; Chen, J.; Lu, J.; Xu, P.; Mo, C. Energy, exergy and anti-vibration assessment of microfluidic fuel cell with a novel two-phase flow model. J. Clean. Prod. 2021, 291, 125211. [Google Scholar] [CrossRef] [Scilit]
- Hu, X.; Tan, X.; Shi, X.; Liu, W.; Ouyang, T. An integrated assessment of microfluidic microbial fuel cell subjected to vibration excitation. Appl. Energy 2023, 336, 120852. [Google Scholar] [CrossRef] [Scilit]
- Legros, B.; Thivel, P.X.; Bultel, Y.; Boinet, M.; Nogueira, R.P. Acoustic emission: Towards a real-time diagnosis technique for proton exchange membrane fuel cell operation. J. Power Sources 2010, 195, 8124–8133. [Google Scholar] [CrossRef] [Scilit]
- Bethapudi, V.S.; Hinds, G.; Sherring, P.R.; Brett, D.J.L.; Coppens, M.O. Dynamic acoustic emission analysis of polymer electrolyte membrane fuel cells. Energy Adv. 2022, 1, 258–268. [Google Scholar] [CrossRef] [Scilit]
- Geiger, C.; Garkusha, P.; Bernauer, C.; Mehrl, S.; Schirmer, P.A.; Zaeh, M.F. Acoustic process monitoring during the structuring of the diffusion media for fuel cells with ultrashort laser pulses. Procedia CIRP 2024, 124, 51–56. [Google Scholar] [CrossRef] [Scilit]
- Qiu, F.; Shen, Z.; Bai, Y.; Shan, G.; Qu, D.; Chen, W. Hydrogen defect acoustic emission recognition by deep learning neural network. Int. J. Hydrogen Energy 2024, 54, 878–893. [Google Scholar] [CrossRef] [Scilit]
- Yuan, H.; Dai, H.; Ming, P.; Zhao, L.; Tang, W.; Wei, X. Understanding dynamic behavior of proton exchange membrane fuel cell in the view of internal dynamics based on impedance. Chem. Eng. J. 2022, 431, 134035. [Google Scholar] [CrossRef] [Scilit]
- Miao, Y.; Kong, Y.; Nam, H.; Lee, S.; Park, G. Phase-based vibration imaging for structural dynamics applications: Marker-free full-field displacement measurements with confidence measures. Mech. Syst. Signal Process. 2023, 198, 110418. [Google Scholar] [CrossRef] [Scilit]
- Kim, Y.S.; Kim, E.Y.; Shin, Y.W.; Lee, S.K. Vibration transmission reduction from a centrifugal turbo blower in a fuel cell electric vehicle. Int. J. Automot. Technol. 2010, 11, 759–765. [Google Scholar] [CrossRef] [Scilit]
- Chen, S.; Zuo, S.; Wu, Z.; Liu, C. Comprehensive vibro-acoustic characteristics and mathematical modeling of electric high-speed centrifugal compressor surge for fuel cell vehicles at various compressor speeds. Mech. Syst. Signal Process. 2022, 178, 109311. [Google Scholar] [CrossRef] [Scilit]
- Rouss, V.; Charon, W. Multi-input and multi-output neural model of the mechanical nonlinear behaviour of a PEM fuel cell system. J. Power Sources 2008, 175, 1–17. [Google Scholar] [CrossRef] [Scilit]
- Rouss, V.; Charon, W.; Desflots, A. Characterisation of mechanical non-linearities in a proton exchange membrane fuel cell using raw data. Int. J. Hydrogen Energy 2009, 34, 2377–2386. [Google Scholar] [CrossRef] [Scilit]
- Paclisan, D.; Charon, W. Real time modelling of the dynamic mechanical behaviour of PEMFC thanks to neural networks. Eng. Appl. Artif. Intell. 2013, 26, 706–713. [Google Scholar] [CrossRef] [Scilit]
- Calik, A.; Yildirim, S.; Tosun, E. Estimation of crack propagation in polymer electrolyte membrane fuel cell under vibration conditions. Int. J. Hydrogen Energy 2017, 42, 23347–23351. [Google Scholar] [CrossRef] [Scilit]
- Owji, A.; Niknam, T.; Taghavi, A.; Pourbehzadi, M. Hydrogen vehicles in the green energy transition: A systematic review of internal combustion engine and fuel cell technologies, energy system integration, and AI application. Energy Strategy Rev. 2026, 64, 102183. [Google Scholar] [CrossRef] [Scilit]
- Hwang, J.; Park, K.; Ryu, H.Y.; Park, J.; Yoon, W.; Son, B.; Lee, S.; Kim, H.S. AI-driven hydrogen fuel cell and battery energy management system for off-road construction heavy equipment. Int. J. Hydrogen Energy 2026, 223, 154326. [Google Scholar] [CrossRef] [Scilit]
- Chen, Z.; Liu, Q.; Nie, Y.; Zhu, D.; Wen, X. Influence of different ship harmonic vibration directions on dynamic response of PEMFC. Proc. J. Phys. Conf. Ser. 2023, 2418, 012020. [Google Scholar] [CrossRef] [Scilit]
- Hu, D.; Dong, W.; Gao, P.; Lu, D.; Shen, Y.; Li, J.; Yang, Q.; Wang, J. Noise reduction optimization for numerous radiator fans for fuel cell vehicle considering thermal-fluid-acoustic synergy. Int. J. Heat Mass Transf. 2024, 223, 125231. [Google Scholar] [CrossRef] [Scilit]
- Babitsky, D.Y.; Toporkov, D.M. Study of magnetic vibrations in hydrogen electric vehicles. Int. J. Hydrogen Energy 2024, 95, 642–647. [Google Scholar] [CrossRef] [Scilit]
- Pu, Y.; Yuan, C. The effect of pilot fuel injection on hydrogen-air mixing and gas exchange of a vibration hydrogen combustor with variable compression. Int. J. Hydrogen Energy 2026, 222, 154268. [Google Scholar] [CrossRef] [Scilit]
- Rouss, V.; Lesage, P.; Begot, S.; Candusso, D.; Charon, W.; Harel, F.; Francois, X.; Selinger, V.; Schilo, C.; Yde-Andersen, S. Mechanical behaviour of a fuel cell stack under vibrating conditions linked to aircraft applications part I: Experimental. Int. J. Hydrogen Energy 2008, 33, 6755–6765. [Google Scholar] [CrossRef] [Scilit]
- Rouss, V.; Candusso, D.; Charon, W. Mechanical behaviour of a fuel cell stack under vibrating conditions linked to aircraft applications part II: Three-dimensional modelling. Int. J. Hydrogen Energy 2008, 33, 6281–6288. [Google Scholar] [CrossRef] [Scilit]
- Song, X.Y.; Zhao, W.R.; Zang, J.; Zhang, Z.; Zhang, Y.W. Theoretical modeling and vibration analysis of composite laminated wing-box structures of hydrogen-electric aircraft under hygrothermal environment. Thin-Walled Struct. 2024, 199, 111854. [Google Scholar] [CrossRef] [Scilit]
- Zhao, W.R.; Song, X.Y.; Han, J.T.; Yang, X.D.; Zhang, Y.W. The rigid-flexible coupling vibration of composite box structure in new energy hydrogen-electricity aircraft with complex circumstance: Theoretical formulation and experiment. Mech. Syst. Signal Process. 2025, 224, 112044. [Google Scholar] [CrossRef] [Scilit]
- Song, X.Y.; Li, H.R.; Zhang, Z.; Zang, J.; Zhang, Y.W.; Chen, L.Q. Vibration of composite open shell of hydrogen-electric fuselage with rectangular cutout in hygrothermal circumstances: Theoretical and experimental research. Thin-Walled Struct. 2024, 205, 112473. [Google Scholar] [CrossRef] [Scilit]
- Zhang, Y.W.; Zhang, J.; Zang, J.; Chen, L.Q. Dynamic characteristics of composite beam-plate coupled structures under hygrothermal conditions for hydrogen-electric aircraft: Analytical and experimental investigation. Mech. Syst. Signal Process. 2026, 247, 113929. [Google Scholar] [CrossRef] [Scilit]
- Fasulo, G.; Gallas, S.; Denayer, H.; Ekblad, O.; Kosova, G.; Barbarino, M. A modeling approach for assessing vibration immunity in hydrogen fuel cell stack for aeronautical applications. Appl. Sci. 2026, 16, 69. [Google Scholar] [CrossRef] [Scilit]
- Hou, Y.; Hao, D.; Shen, C.; Shao, Z. Experimental investigation of the steady-state efficiency of fuel cell stack under strengthened road vibrating condition. Int. J. Hydrogen Energy 2013, 38, 3767–3772. [Google Scholar] [CrossRef] [Scilit]
- IEC 61373:2010; Railway Applications—Rolling Stock Equipment—Shock and Vibration Tests. International Electrotechnical Commission (IEC): Geneva, Switzerland, 2010.
- RTCA/DO-160G; Environmental Conditions and Test Procedures for Airborne Equipment. RTCA, Inc.: Washington, DC, USA, 2010.
- ISO 20283-5:2016; Mechanical Vibration—Measurement of Vibration on Ships—Part 5: Guidelines for Measurement, Evaluation and Reporting of Vibration with Regard to Habitability on Passenger and Merchant Ships. International Organization for Standardization (ISO): Geneva, Switzerland, 2016.
- MIL-STD-810H; Environmental Engineering Considerations and Laboratory Tests. U.S. Department of Defense: Washington, DC, USA, 2019.
- SAE J2578; Recommended Practice for General Fuel Cell Vehicle Safety. SAE International: Warrendale, PA, USA, 2014.
- International Electrotechnical Commission. Fuel Cell Technologies; IEC 62282 Series; IEC: Geneva, Switzerland, 2023. [Google Scholar]
- Liu, J.; Chang, Z.; Chen, C.; Wen, J.; Chen, X.; Duan, C.; Wei, Y. A fatigue perspective on damage accumulating in lithium-ion batteries under dynamic cycling. Int. J. Fatigue 2025, 193, 108773. [Google Scholar] [CrossRef] [Scilit]
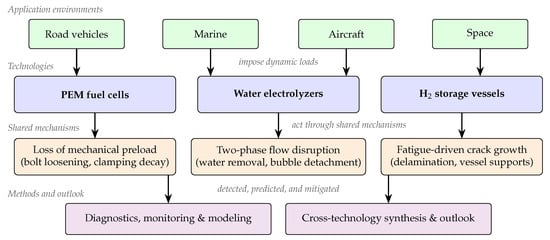
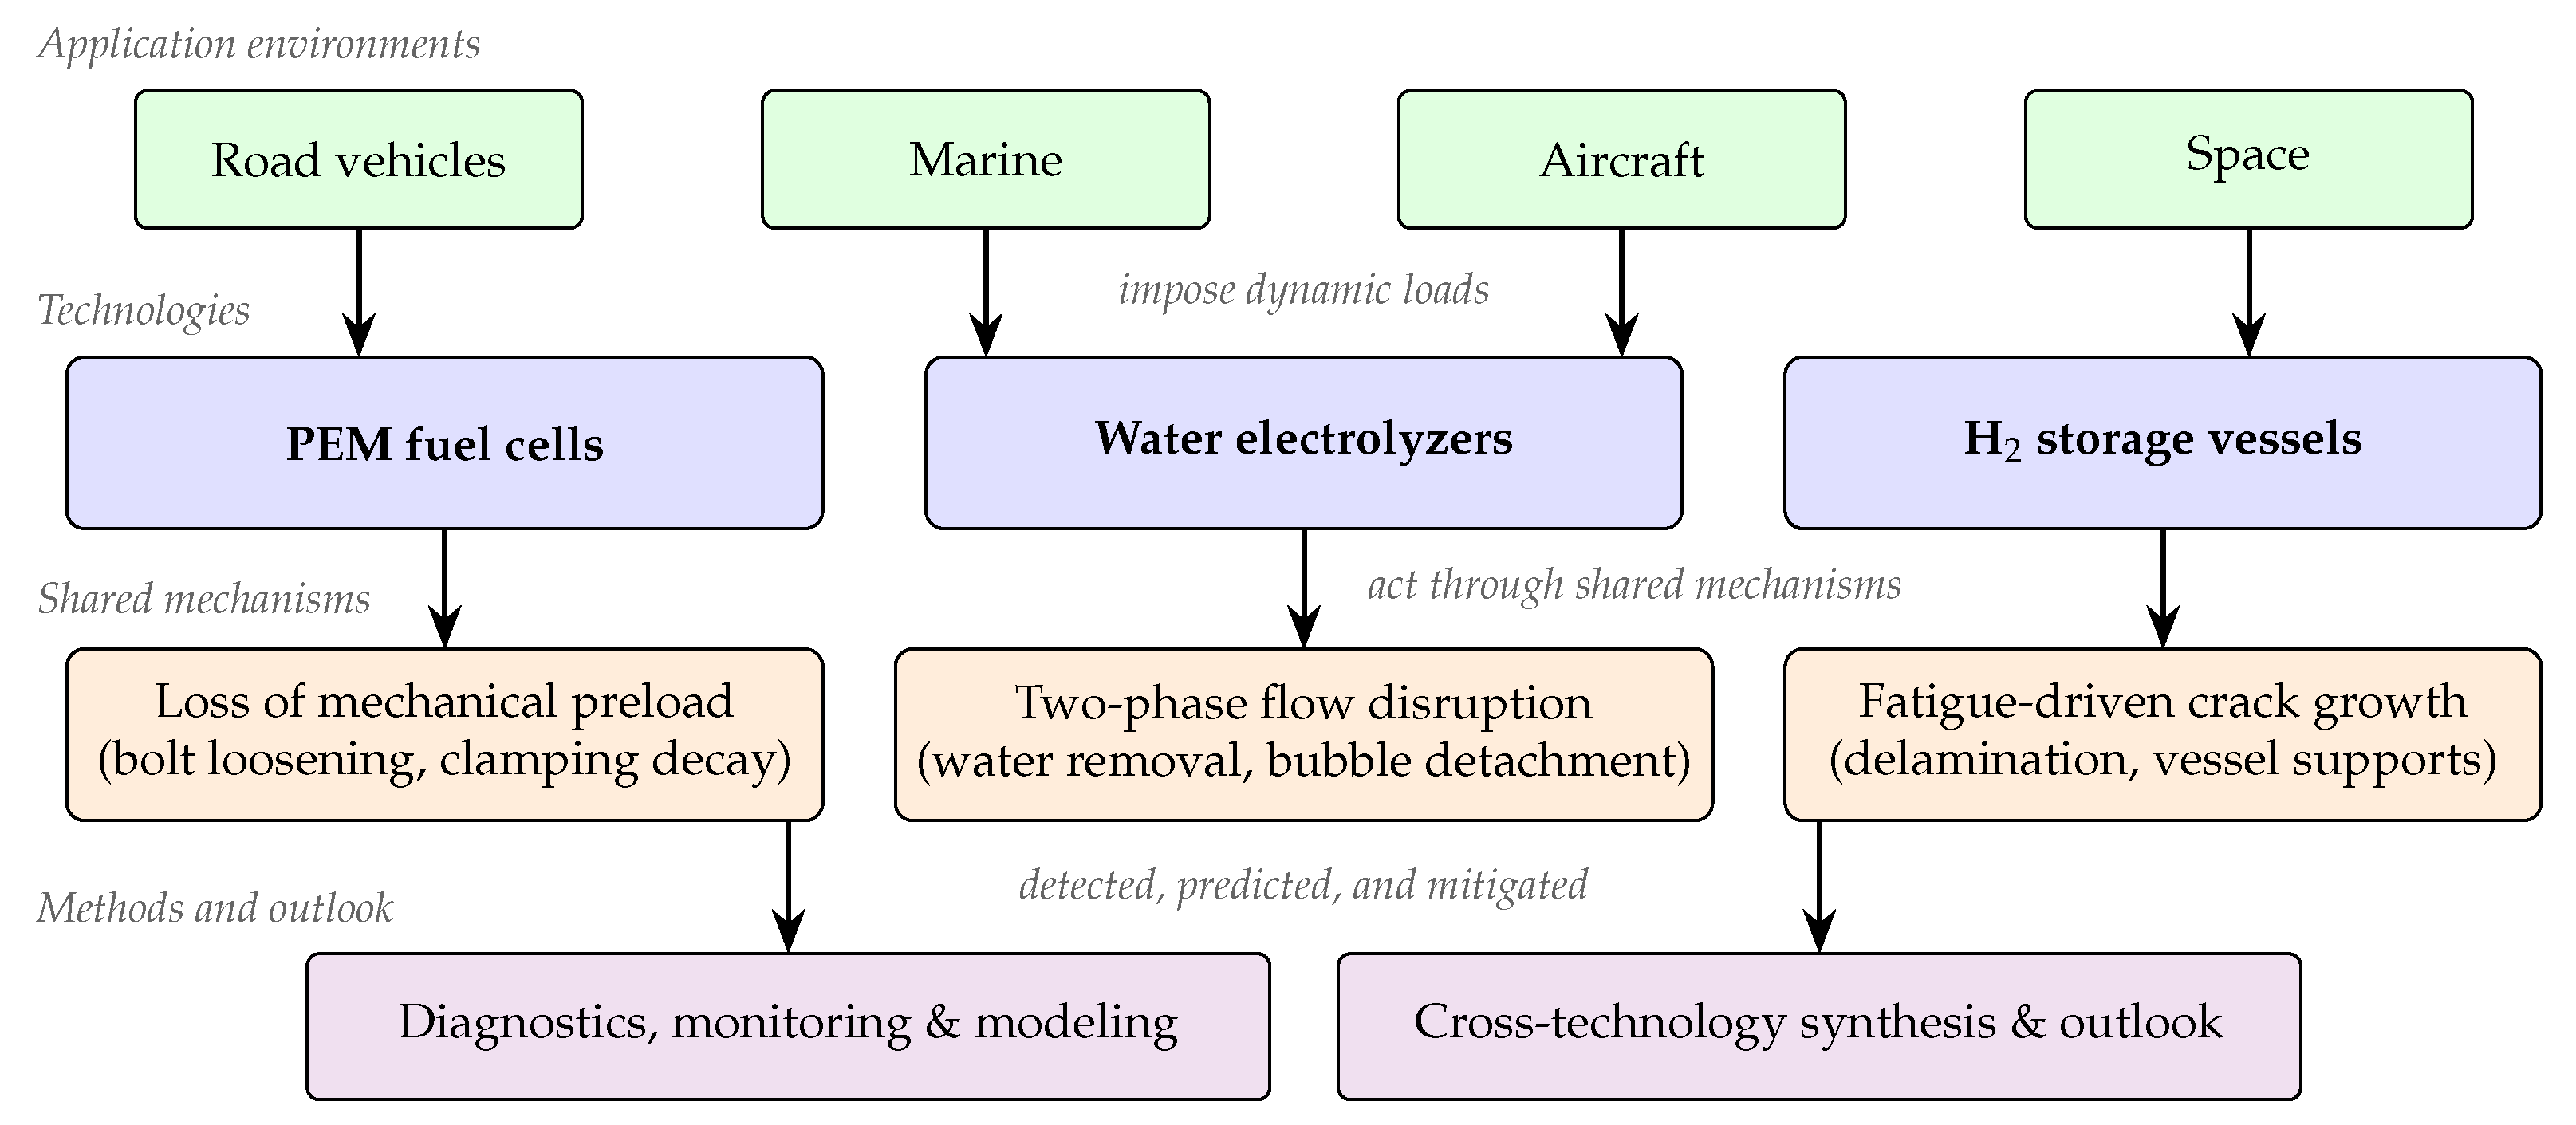
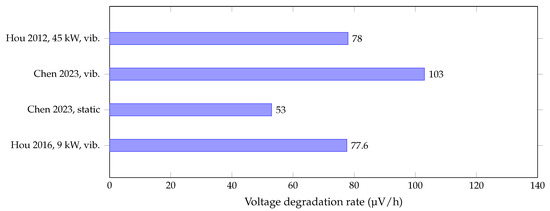
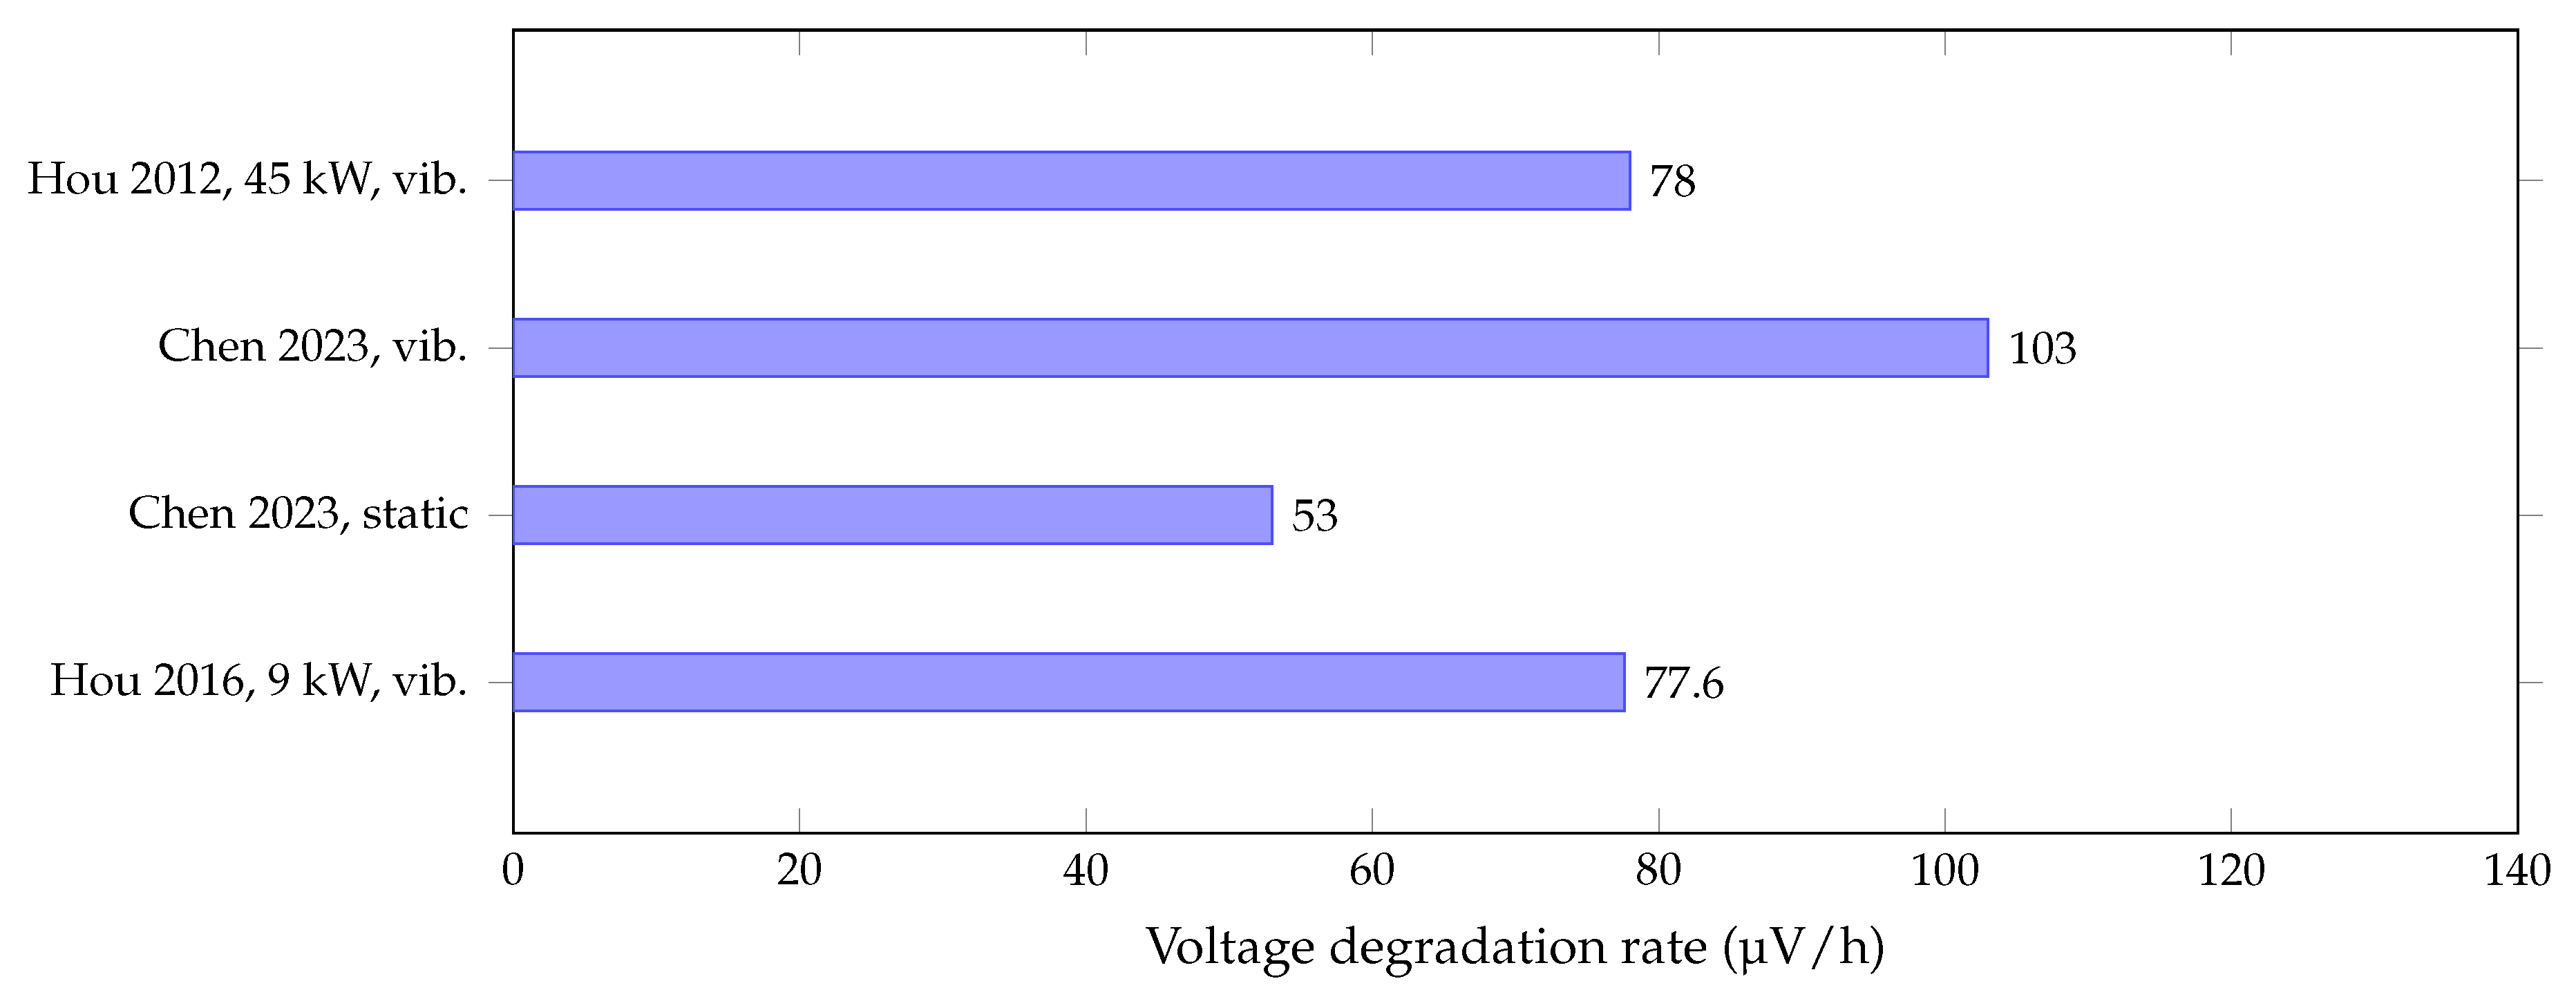
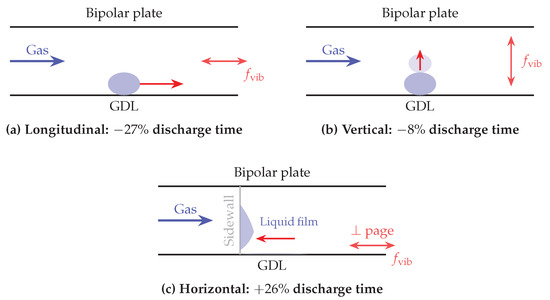
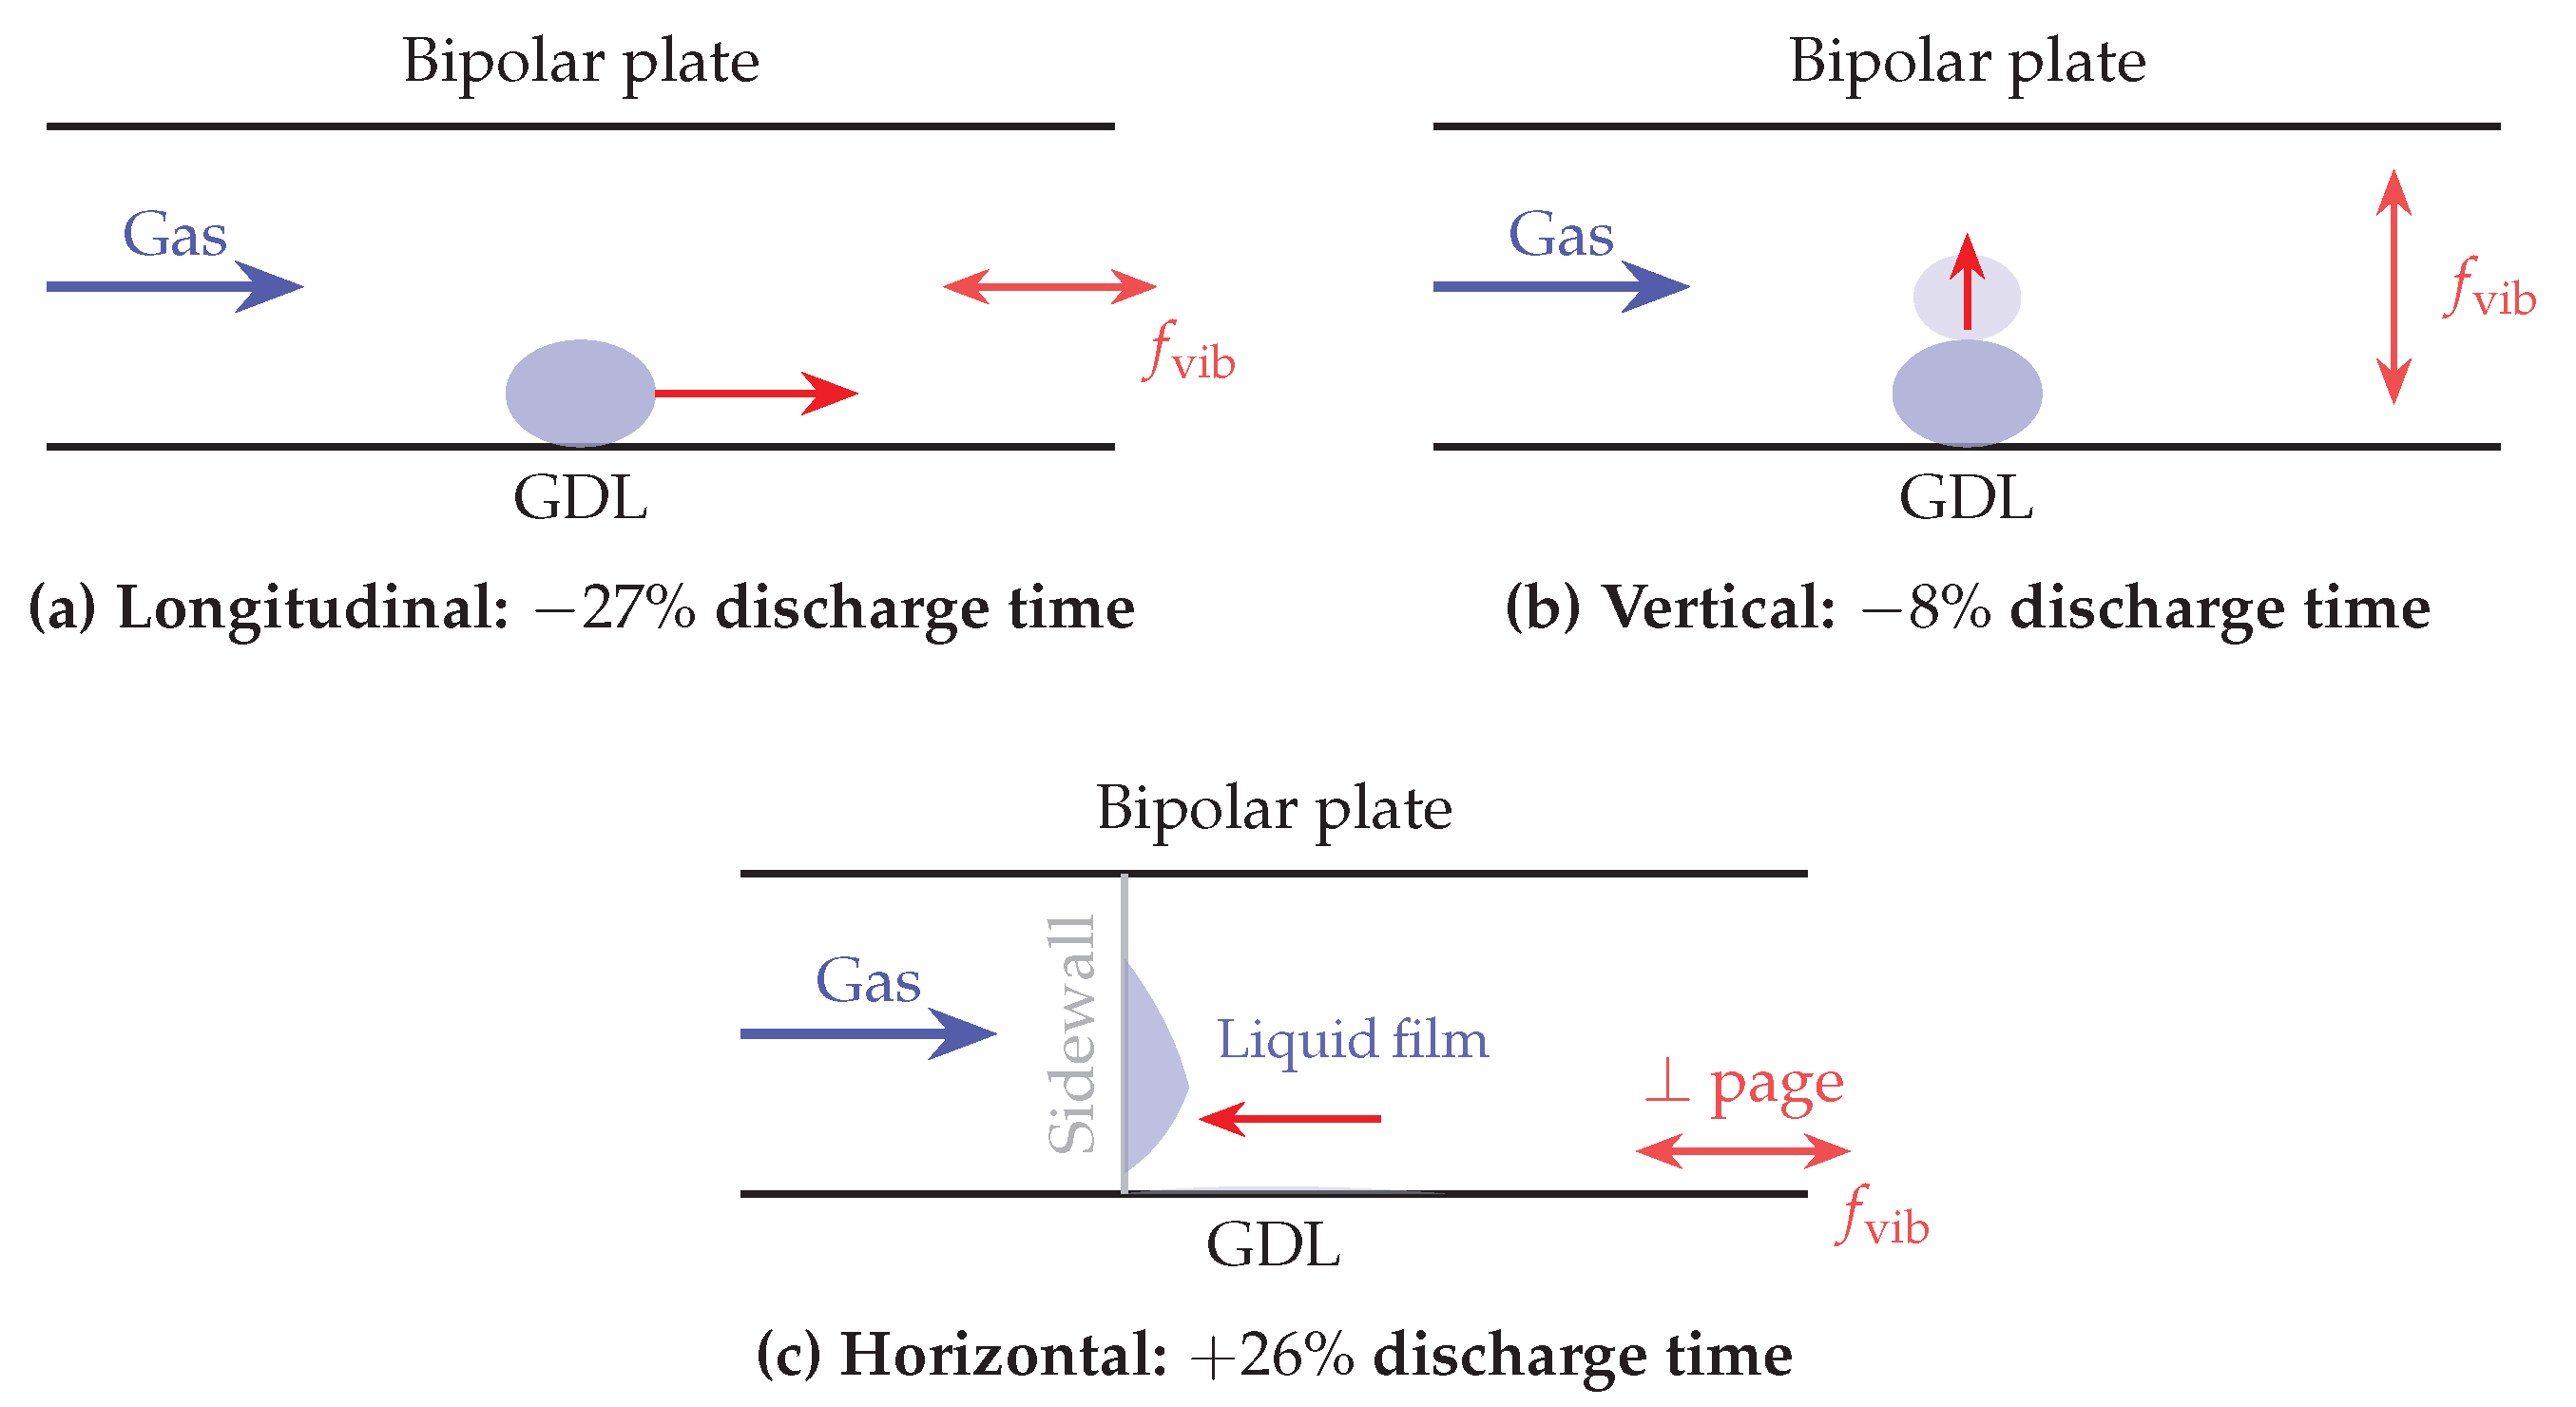
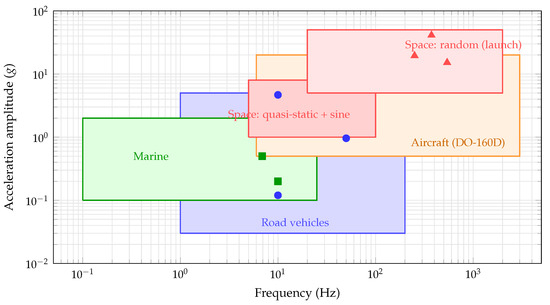
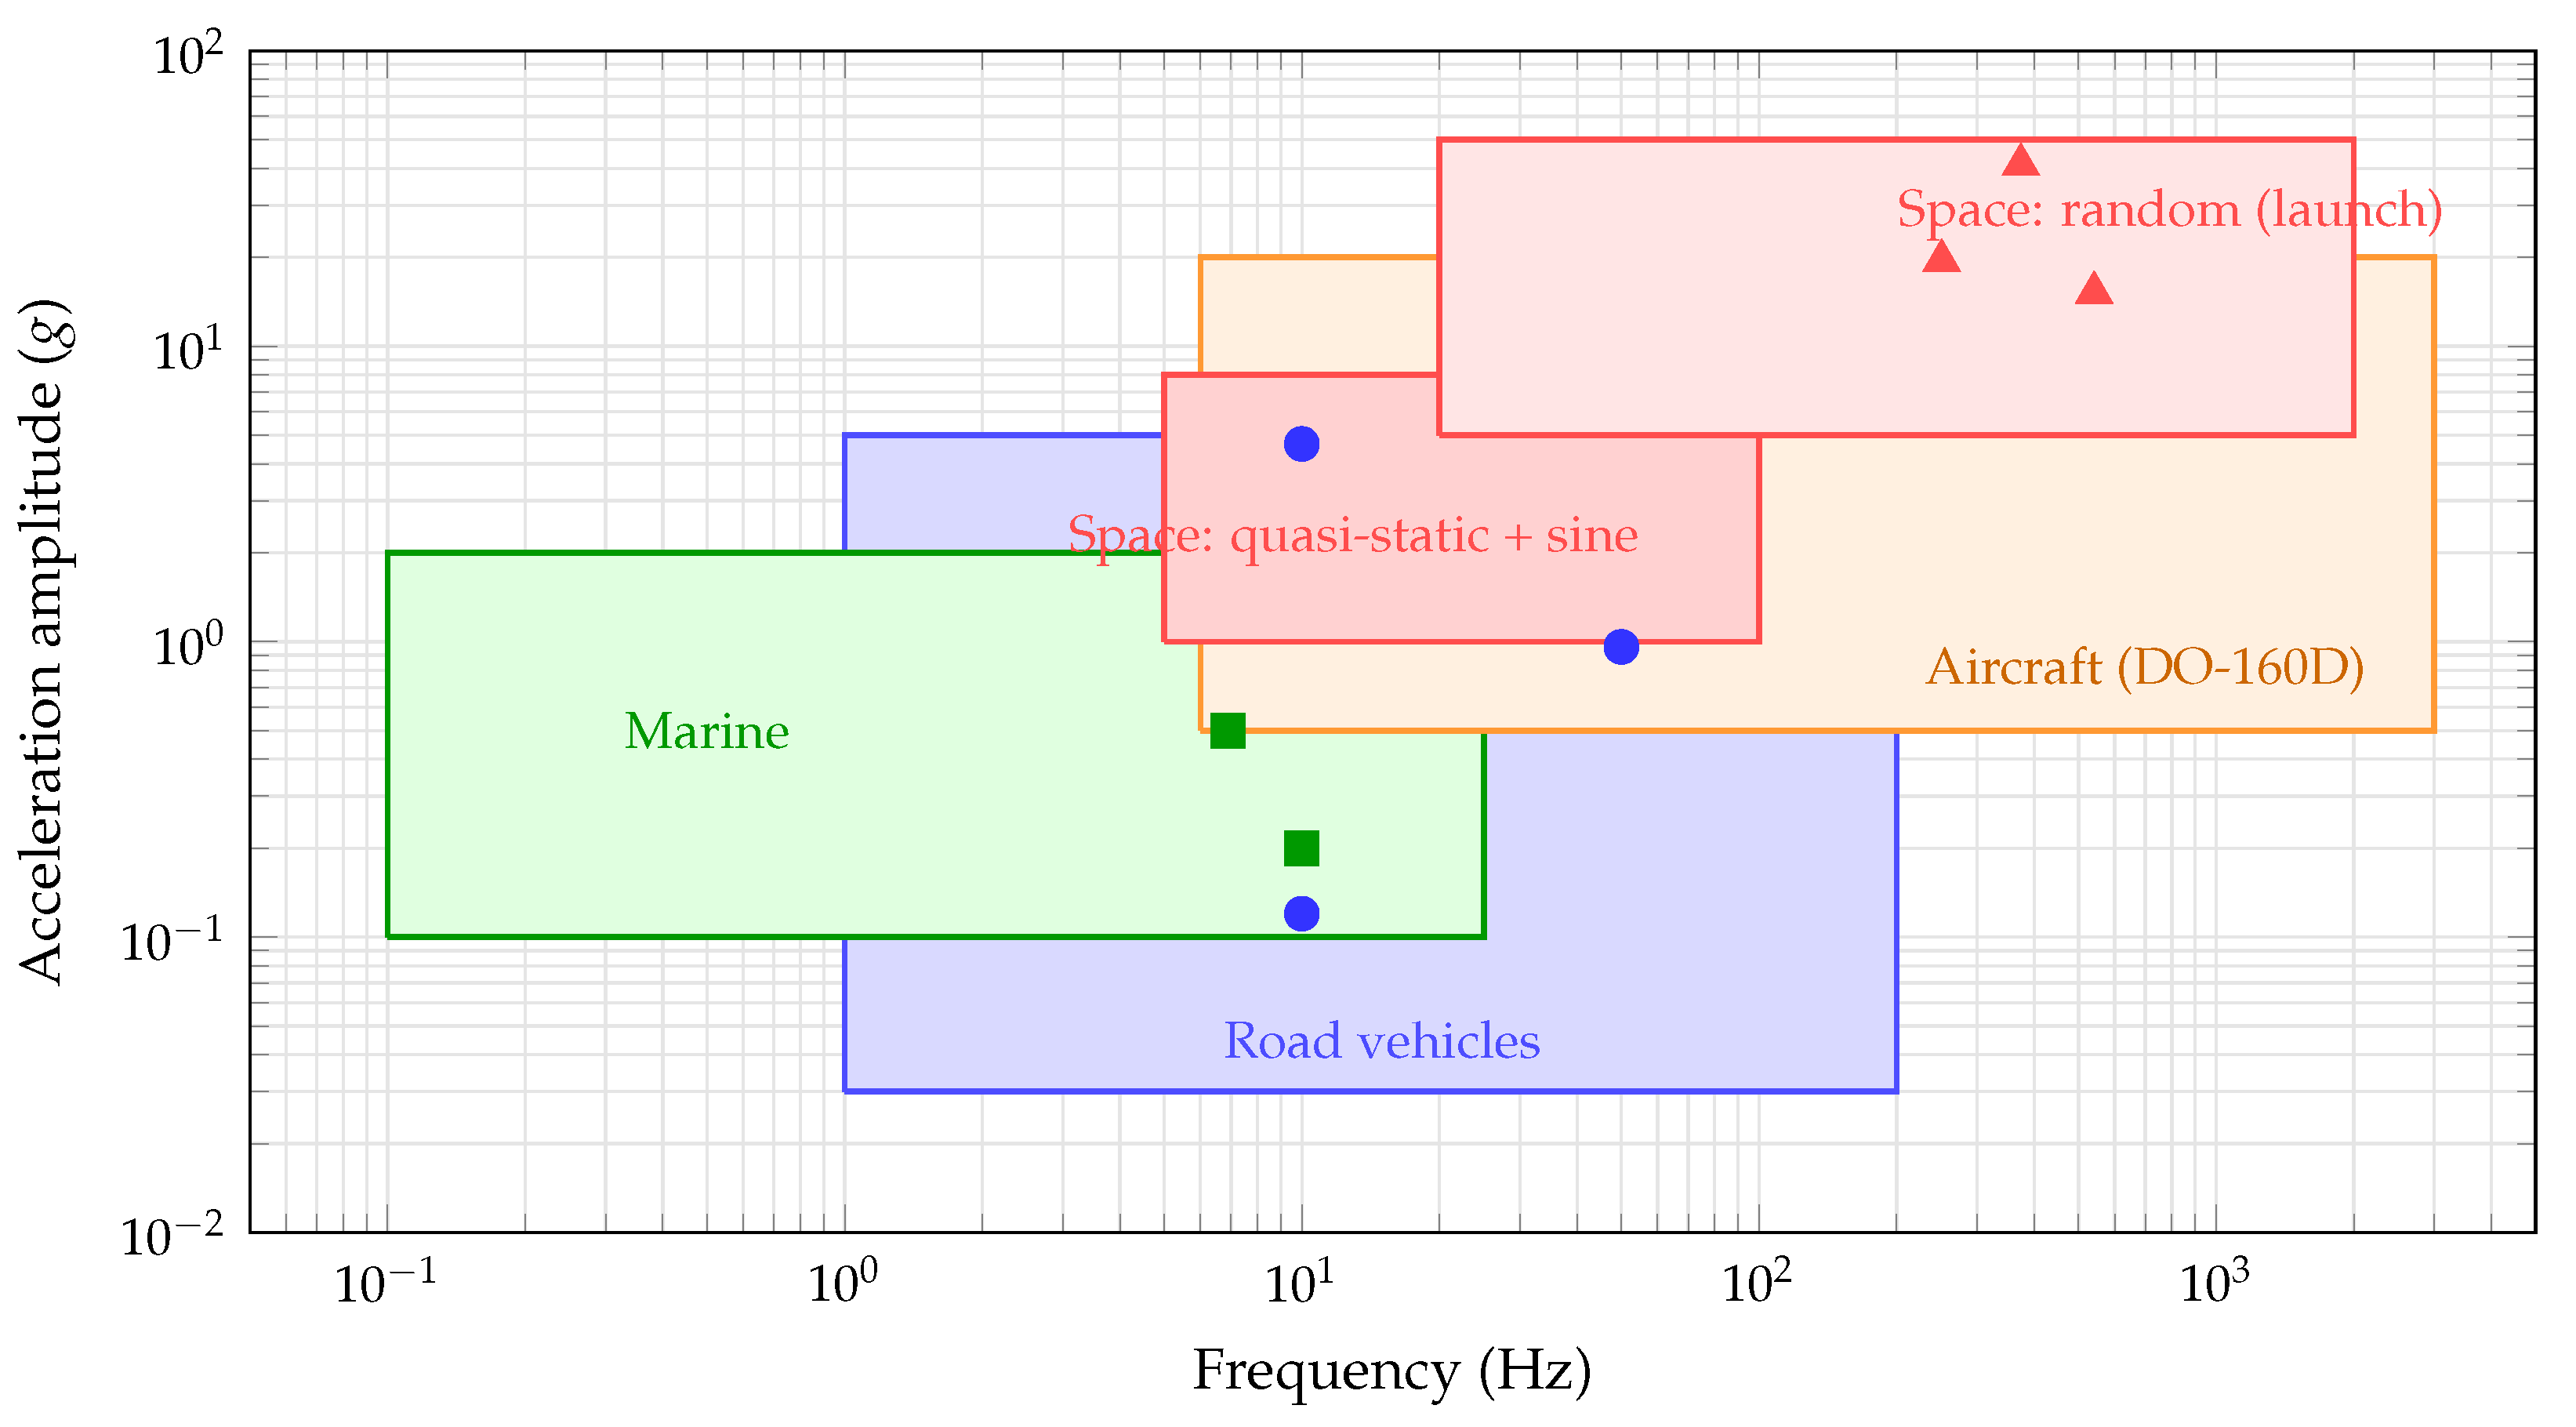
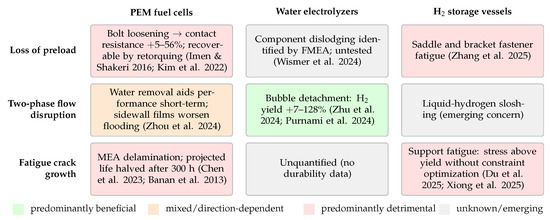
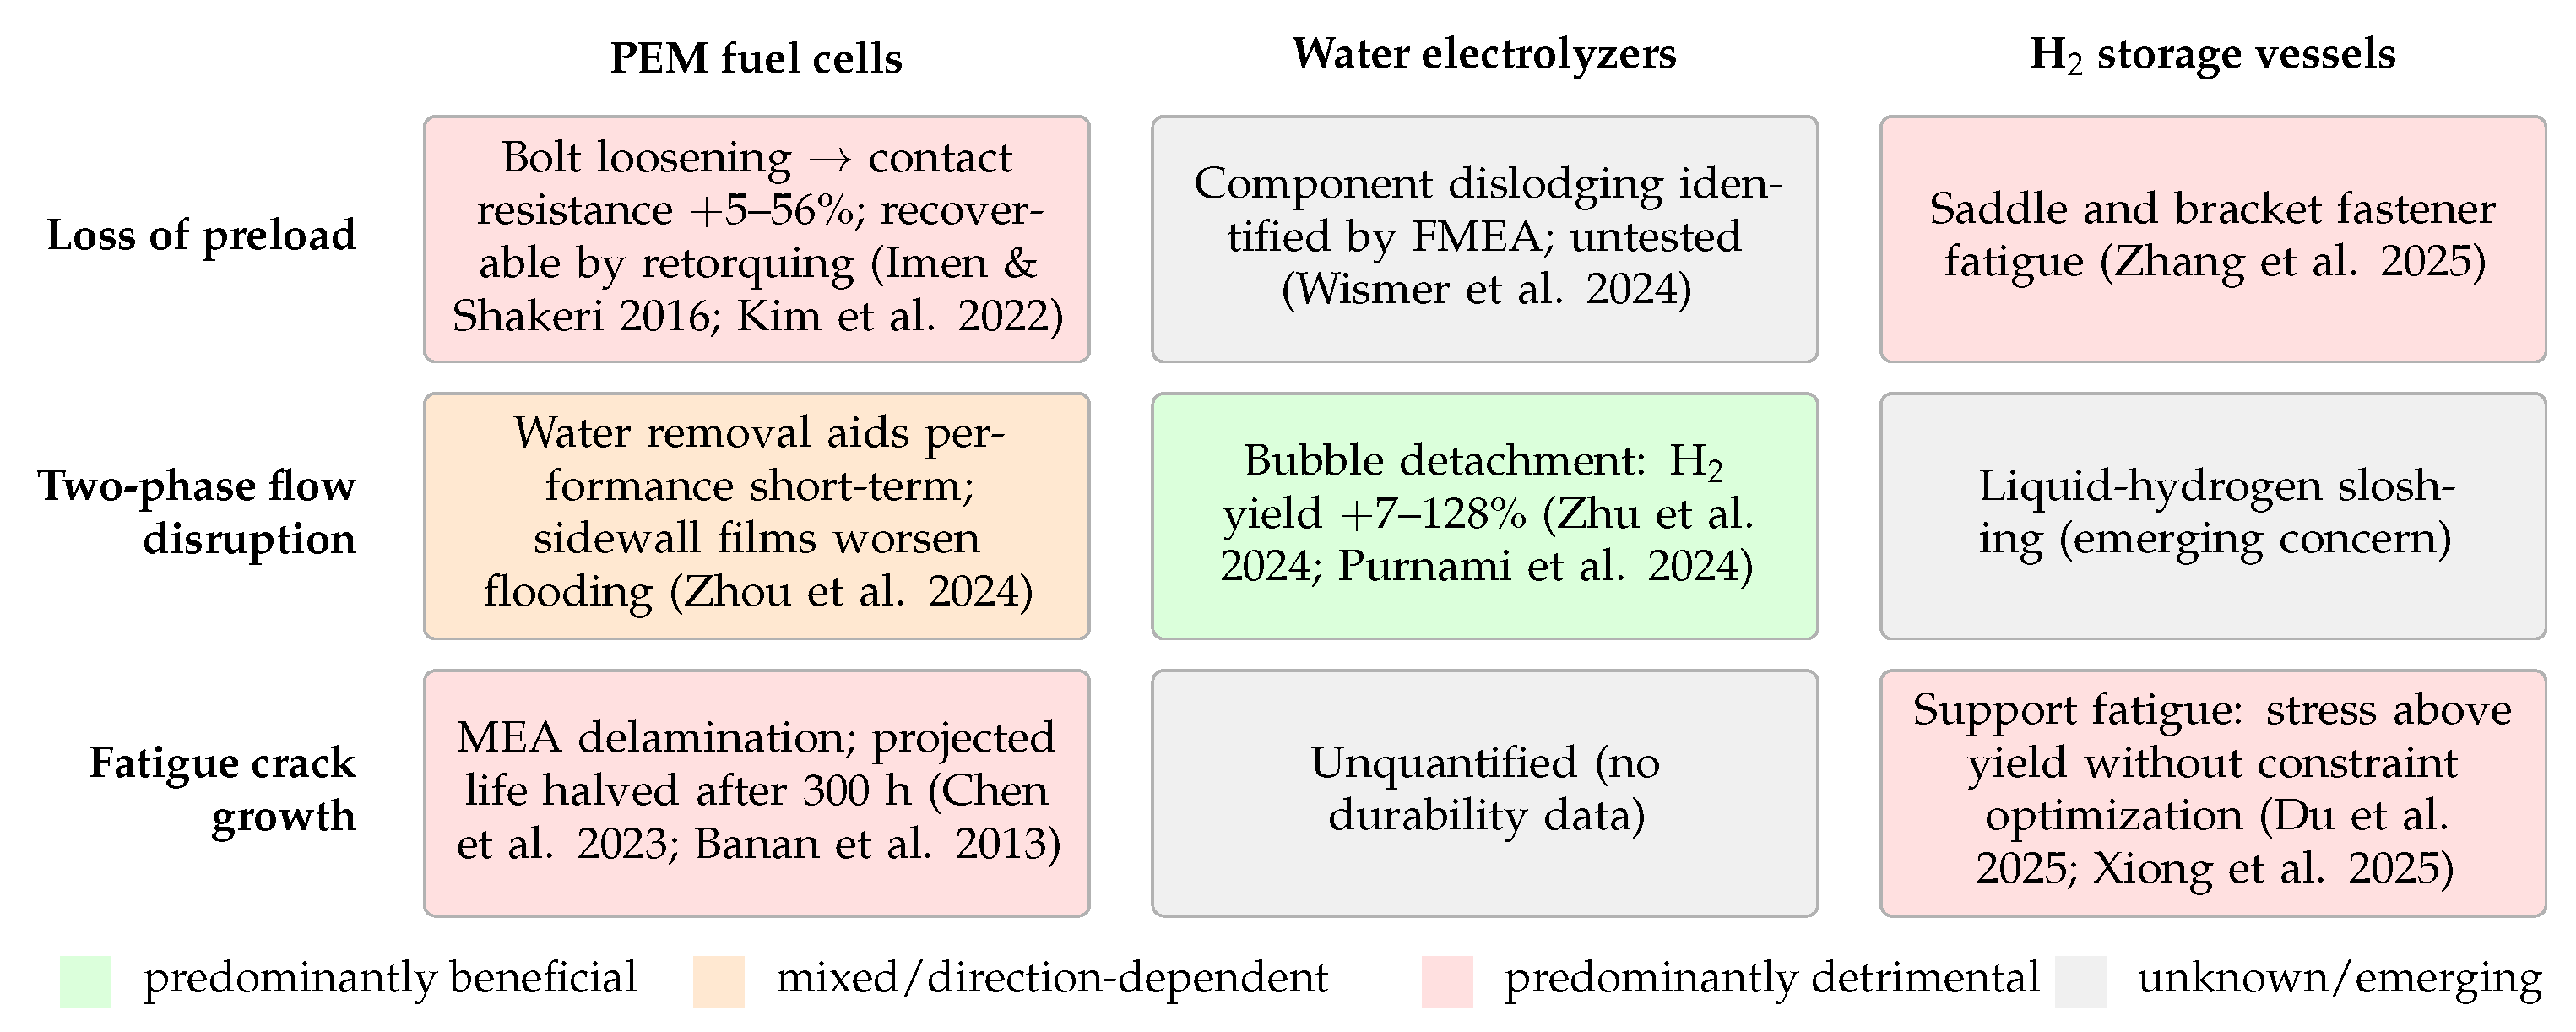
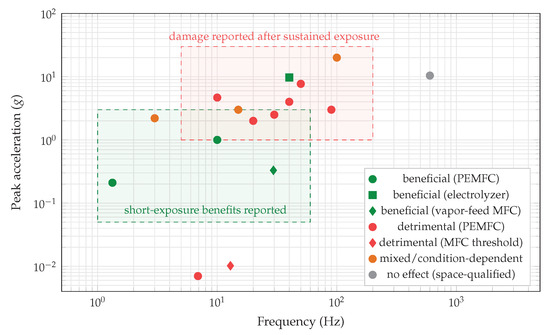
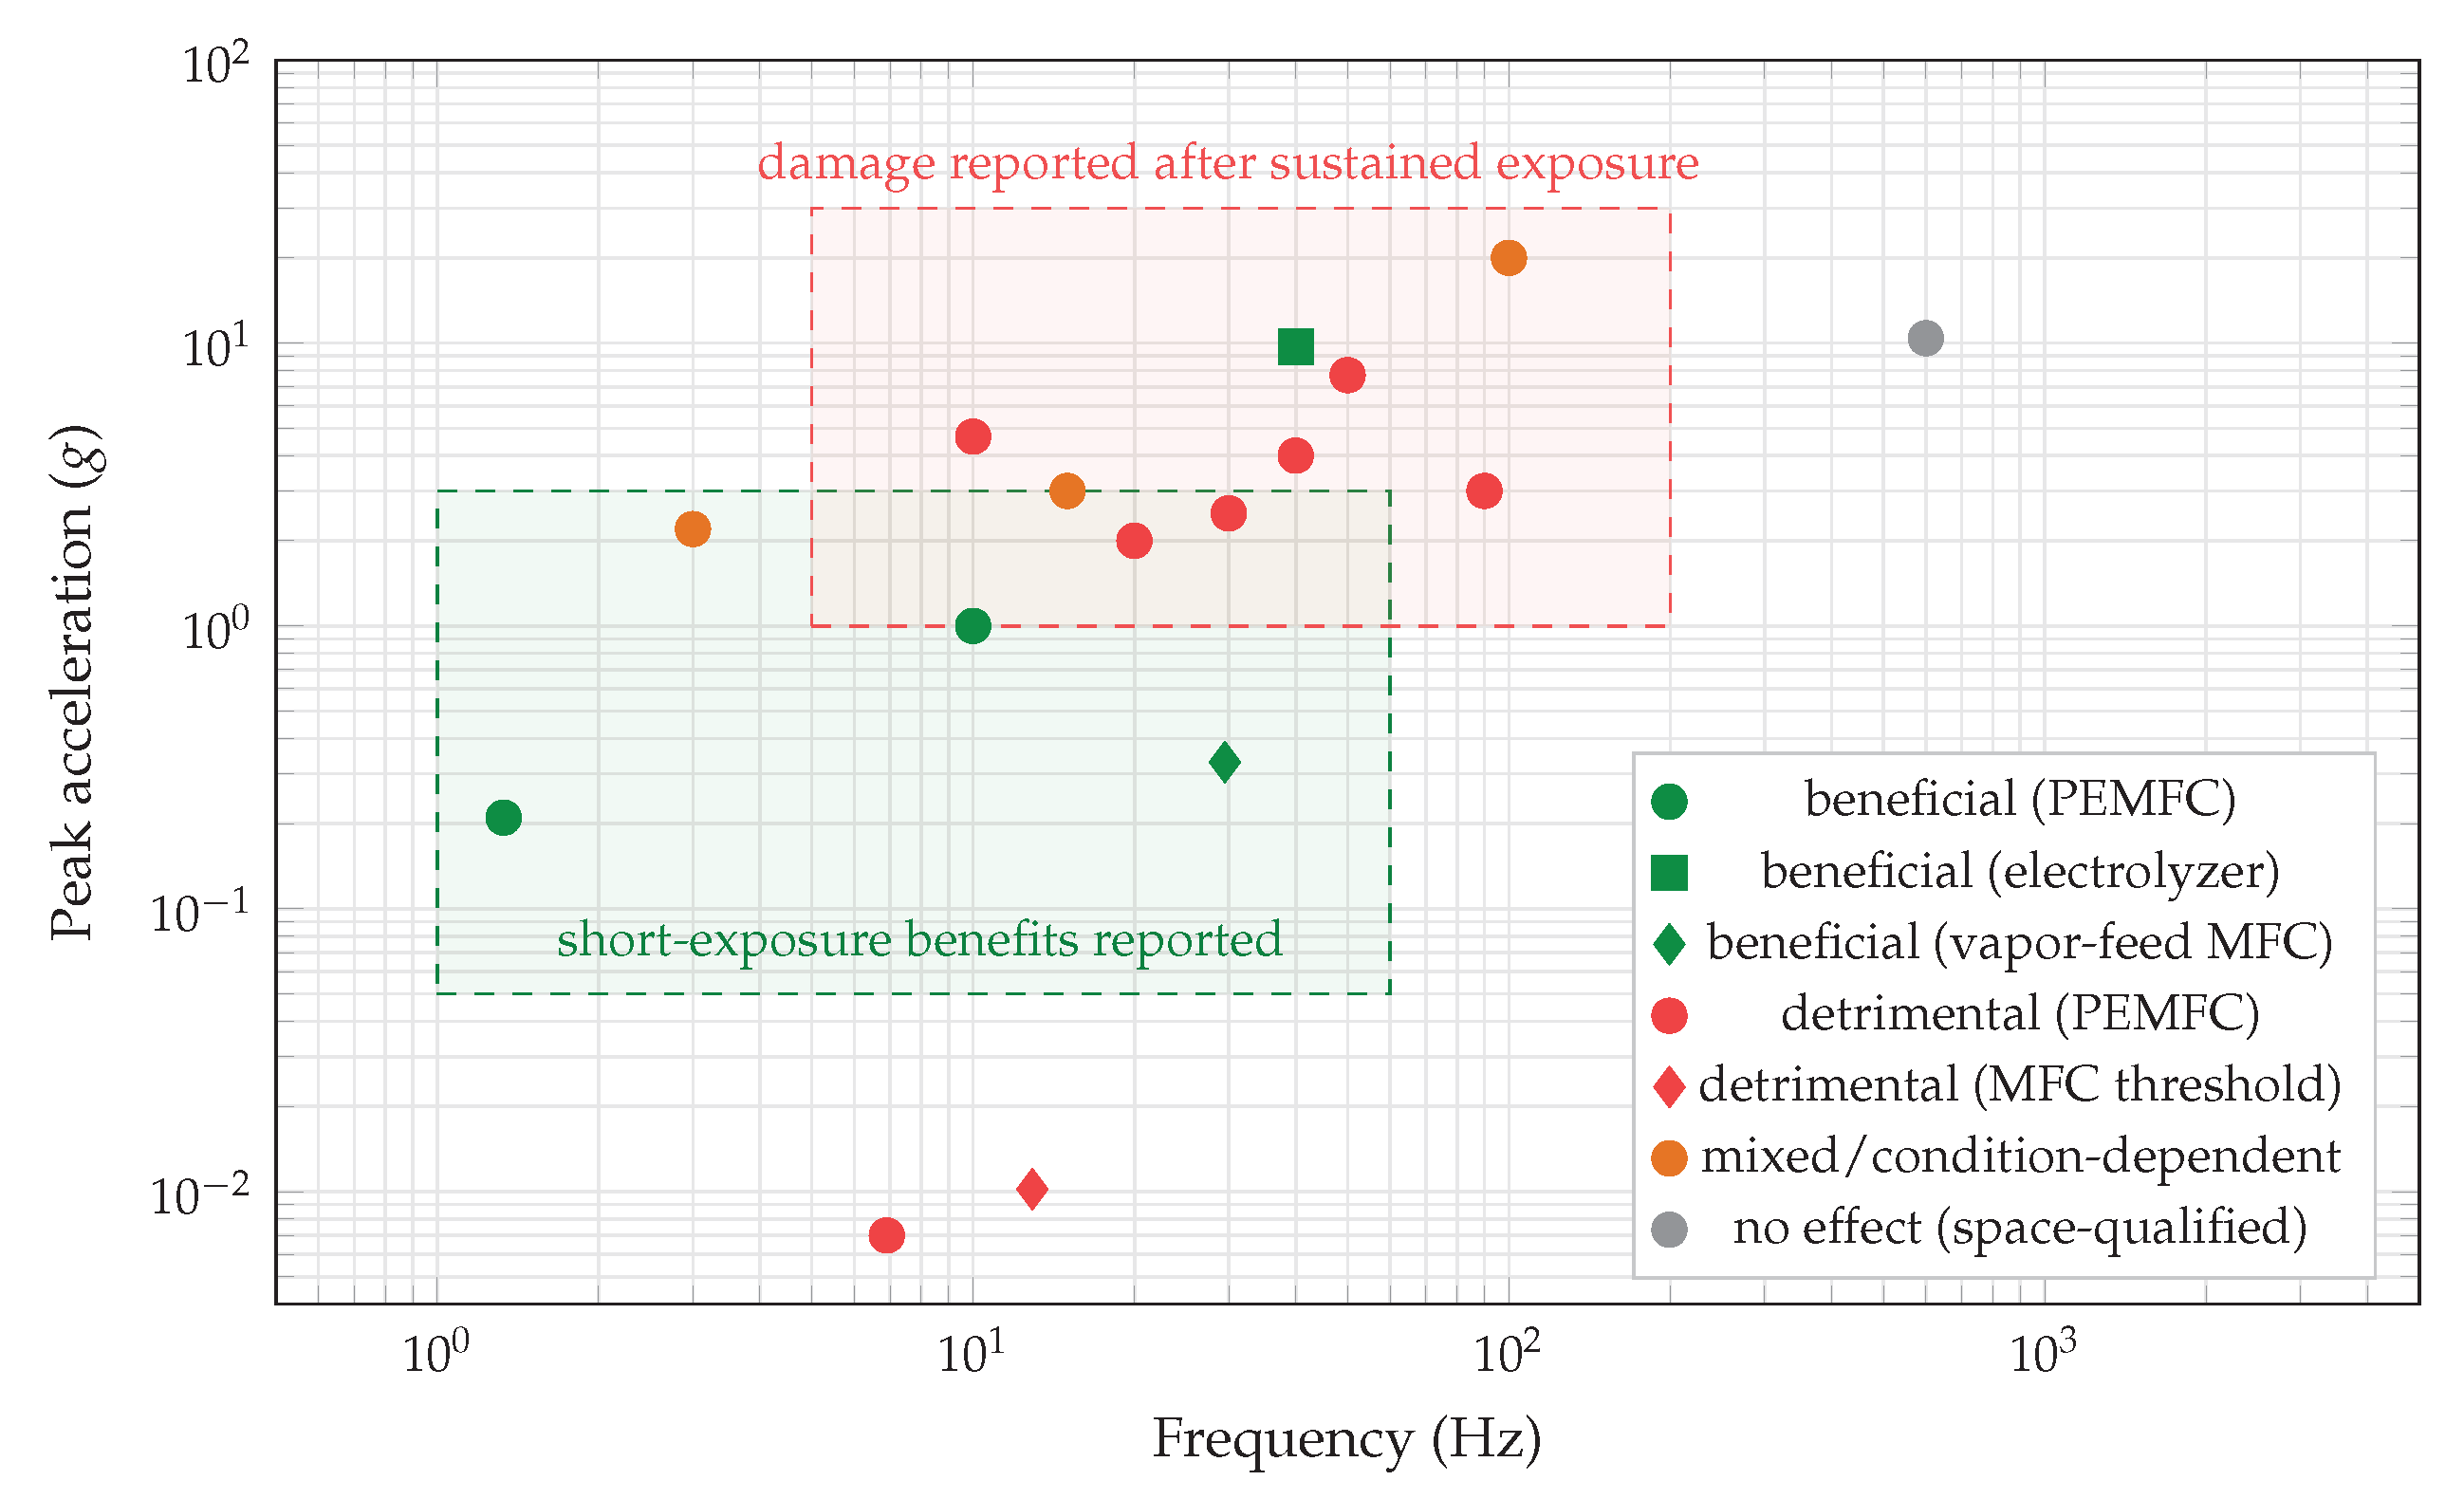

Disclaimer/Publisher’s Note: The statements, opinions and data contained in all publications are solely those of the individual author(s) and contributor(s) and not of MDPI and/or the editor(s). MDPI and/or the editor(s) disclaim responsibility for any injury to people or property resulting from any ideas, methods, instructions or products referred to in the content. |
© 2026 by the authors. Licensee MDPI, Basel, Switzerland. This article is an open access article distributed under the terms and conditions of the Creative Commons Attribution (CC BY) license.