


Abstract
Liquid metals are enabling working fluids for several advanced nuclear systems, including fast reactors, accelerator-driven systems, and fusion blankets. System thermal-hydraulic (STH) codes require thermodynamically consistent property tables over pressure-temperature domains, whereas most liquid-metal correlations are available only as functions of temperature at a reference pressure. This paper presents the formulation and the code verification of four liquid-metal working fluids in RELAP5/Mod3.3: lead (Pb), lead-bismuth eutectic (LBE, denoted PbBi), lead-lithium alloy (PbLi, here Pb-17Li at.%), and sodium (Na). The liquid branch is reconstructed from reference correlations for specific volume, sound speed, and isobaric specific heat through a linearized pressure model, whose correction remains below 0.2% for the heavy liquid metals and below 1% for sodium over the whole tabulated pressure range. The reference pressure is set to the saturation pressure at the maximum tabulated temperature, which maximizes the admissible liquid domain, and a van der Waals equation of state closes the vapor branch. Liquid transport properties and selectable low-Prandtl-number heat-transfer correlations are implemented in the Fortran source code. Verification comprises property comparisons and two non-regression tests, a U-tube manometer, and a natural-circulation loop. The vapor model is a table-completion closure and must not be used for boiling-dominated transients.
1. Introduction
Liquid metals play a central role in several advanced nuclear-energy technologies. Sodium remains a reference coolant for fast-reactor concepts; lead and lead-bismuth eutectic (LBE, denoted PbBi in this paper) are widely investigated for lead-cooled fast reactor applications, while PbLi (here Pb-17Li at.%) is considered for nuclear fusion. In particular, lead is adopted as the main coolant for the ALFRED demonstrator and other lead-cooled designs currently pursued by industry, LBE is considered for accelerator-driven systems such as MYRRHA, while PbLi is investigated for fusion breeding-blanket applications as a breeder, neutron multiplier, and heat-transfer medium within the framework of the ITER and DEMO designs. The design and safety demonstration of these systems rely on best-estimate STH codes, for which a reliable description of the coolant thermophysical properties over the entire operating range is an essential prerequisite. Extensive property assessments are available for these fluids, including the sodium recommendations by Fink and Leibowitz, the OECD/NEA handbook for lead and LBE, the SCK-CEN database by Sobolev for GEN-IV liquid-metal coolants, and dedicated assessments for PbLi [1,2,3,4].
Although these databases provide the best available state-of-the-art correlations, they are not directly sufficient for best-estimate STH codes. RELAP5 [5] and similar codes require thermodynamic properties as functions of both pressure and temperature, whereas density, isobaric specific heat, sound speed, and transport properties of liquid metals are commonly correlated only with temperature at atmospheric or nominal reference pressure. A consistent assessment is therefore required before these fluids can be introduced as working fluids in a system code.
Beyond such reference-pressure correlations, closed-form equations of state valid up to and beyond the critical point were also developed for liquid metals, mainly within severe-accident and two-phase analyses for fast-reactor safety codes. Morita and Fischer proposed an analytic, van der Waals-type equation of state [6,7] for the core materials of sodium-cooled fast reactors, including sodium, for use in the SIMMER code [8]. The same modeling approach was subsequently extended to heavy liquid metals, providing a consistent description of the liquid and vapor branches of lead-bismuth eutectic up to the critical region [9]. Such formulations are tailored to boiling and expansion phenomena under accident conditions and to the estimation of critical parameters, rather than to the generation of the thermodynamically consistent pressure-temperature property tables required by STH codes over the normal operating range.
Previous code-development efforts have addressed specific parts of this issue. Updated lead and LBE property files were generated for RELAP5-3D after discrepancies were identified between default code properties and updated liquid-metal data [10]. In parallel, heat-transfer models for low-Prandtl-number liquid-metal flows have been developed and reviewed for circular tubes and rod bundles [11,12,13].
At the University of Pisa, a modified version of RELAP5/Mod3.3, including liquid-metal working fluids, has been developed and progressively assessed over several years. For lead-lithium, Barone et al. [14] proposed a dedicated RELAP5/Mod3.3 implementation, whose properties were subsequently used for HCLL in-box LOCA analyses of fusion breeding-blanket components [15]. The same modified code has also been applied, often in coupling with CFD codes, to heavy-liquid-metal experiments, such as the natural- and gas-enhanced circulation tests in the NACIE loop and the integral transients in the CIRCE pool facility [16,17]. Since the methodology relies only on widely available reference correlations and on standard thermodynamic relations, it is not specific to RELAP5 and can be extended to other STH codes.
The present work extends this state of the art by proposing a compact, unified implementation of Pb, PbBi, PbLi, and Na in RELAP5/Mod3.3. Two contributions of the existing literature are taken as a starting point, and it is useful to state explicitly how the present work differs from them. Balestra et al. [10] updated the lead and LBE property files of RELAP5-3D by replacing the tabulated values with more recent correlations, but retained the existing table-generation architecture and addressed only the two heavy metals. Kolev [18] provided the general thermodynamic strategy by which reference-pressure correlations can be converted into pressure-dependent property tables, without addressing its implementation in a specific system code. With respect to these works, the contributions of the present paper are the following:
- (i)
- a single, self-consistent formulation is applied to four fluids of interest for both fission and fusion applications, so that the same table-generation procedure, the same thermodynamic assumptions, and the same source-code modifications serve Pb, PbBi, PbLi, and Na;
- (ii)
- the liquid branch is not tabulated directly from reference data, but reconstructed from the reference-pressure specific volume, sound speed, and isobaric specific heat by means of exact thermodynamic identities, so that specific volume, enthalpy, and entropy remain mutually consistent at every point of the pressure-temperature grid;
- (iii)
- the liquid reference pressure is redefined as the saturation pressure at the maximum tabulated temperature instead of the usual atmospheric value, which keeps the reference liquid state above saturation over the entire tabulated temperature range and maximizes the admissible liquid region;
- (iv)
- a van der Waals vapor branch and the associated saturation line are generated consistently with the liquid branch, so that the table structure required by RELAP5 is completed without discontinuities at the saturation boundary;
- (v)
- liquid-metal transport properties and a set of selectable low-Prandtl-number convective heat-transfer correlations are inserted directly into the RELAP5 Fortran source, rather than being supplied through user-defined input tables;
- (vi)
- the resulting code version is exercised through repeatable verification and non-regression tests that can be re-executed at every subsequent code modification.
For these fluids, two modeling aspects are particularly important. First, their low Prandtl numbers require heat-transfer correlations outside the range of standard water/steam correlations. Second, their weak pressure dependence permits a linearized pressure correction for the liquid-specific volume, but the correction must remain thermodynamically compatible with the enthalpy and entropy used by the code. A complete RELAP5 fluid package also requires saturation properties and a vapor branch, even for applications in which boiling is not expected during normal operation.
The objective of this paper is to develop and verify a consistent RELAP5/Mod3.3 implementation of Pb, PbBi, PbLi, and Na. The work combines four elements: (i) a liquid-phase reconstruction based on reference correlations and thermodynamic identities; (ii) a vapor-phase closure based on a van der Waals equation of state; (iii) direct implementation of liquid-metal transport properties and convective heat-transfer correlations in the RELAP5 Fortran source code; and (iv) verification through property-comparison calculations and simplified hydraulic test cases. The approach is deliberately pragmatic: it targets robust, internally consistent system-code calculations over a broad admissible liquid domain rather than high-fidelity vapor thermodynamics in boiling-dominated regimes.
The scope of the paper is deliberately restricted, and it is worth stating it explicitly. The subject of the work is the equation of state and the property package. What is demonstrated here is that the property tables are thermodynamically consistent, that RELAP5 retrieves from them the values that were used to generate them, and that the modified code remains stable when these fluids are employed in simple hydraulic transients. This is code verification in the usual sense of the term, that is, evidence that the mathematical model has been implemented correctly; throughout the paper, it is kept distinct from validation, that is, evidence that the model reproduces the physical behavior of the real fluid. Two related activities are therefore outside the present scope and are not repeated here. The first is the assessment of the convective heat-transfer correlations listed in Section 4: these correlations are made available and selectable by the user, and their predictive capability is a property of the correlations themselves, which have been assessed by their respective authors and in dedicated reviews [11,12,13], rather than of the present implementation. The second is the validation of the modified code against liquid-metal experiments, which has been carried out and published by the authors in dedicated papers: in-box LOCA transients for HCLL breeding-blanket components [15], natural- and gas-enhanced circulation tests in the NACIE loop [16], and integral transients in the CIRCE pool facility [17]. The present paper documents, in a consolidated form that was not previously available, the property formulation on which those applications rely.
2. Fluid-Property Database and Validity Domain
The implemented fluids and the thermodynamic constants adopted for table generation are summarized in Table 1. PbBi and PbLi are modeled as pseudo-pure fluids. This approximation neglects possible differences between the vapor composition and the liquid-alloy composition, but it is acceptable for the intended RELAP5 applications because the vapor contribution is generally negligible for Pb, PbBi, and PbLi and is included mainly to complete the code property package and improve numerical robustness. The critical temperatures listed in Table 1 are the effective values used to define the van der Waals constants of the vapor branch; given the large experimental uncertainties in the critical properties of these metals, they should be regarded as model parameters of the table-generation procedure rather than as recommended critical-point data.
Table 1.
Main constants adopted for the implemented fluids.
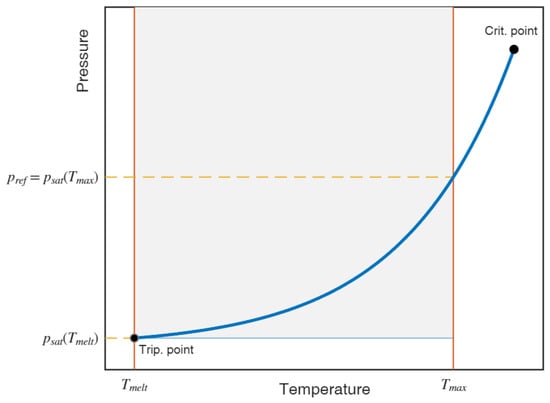
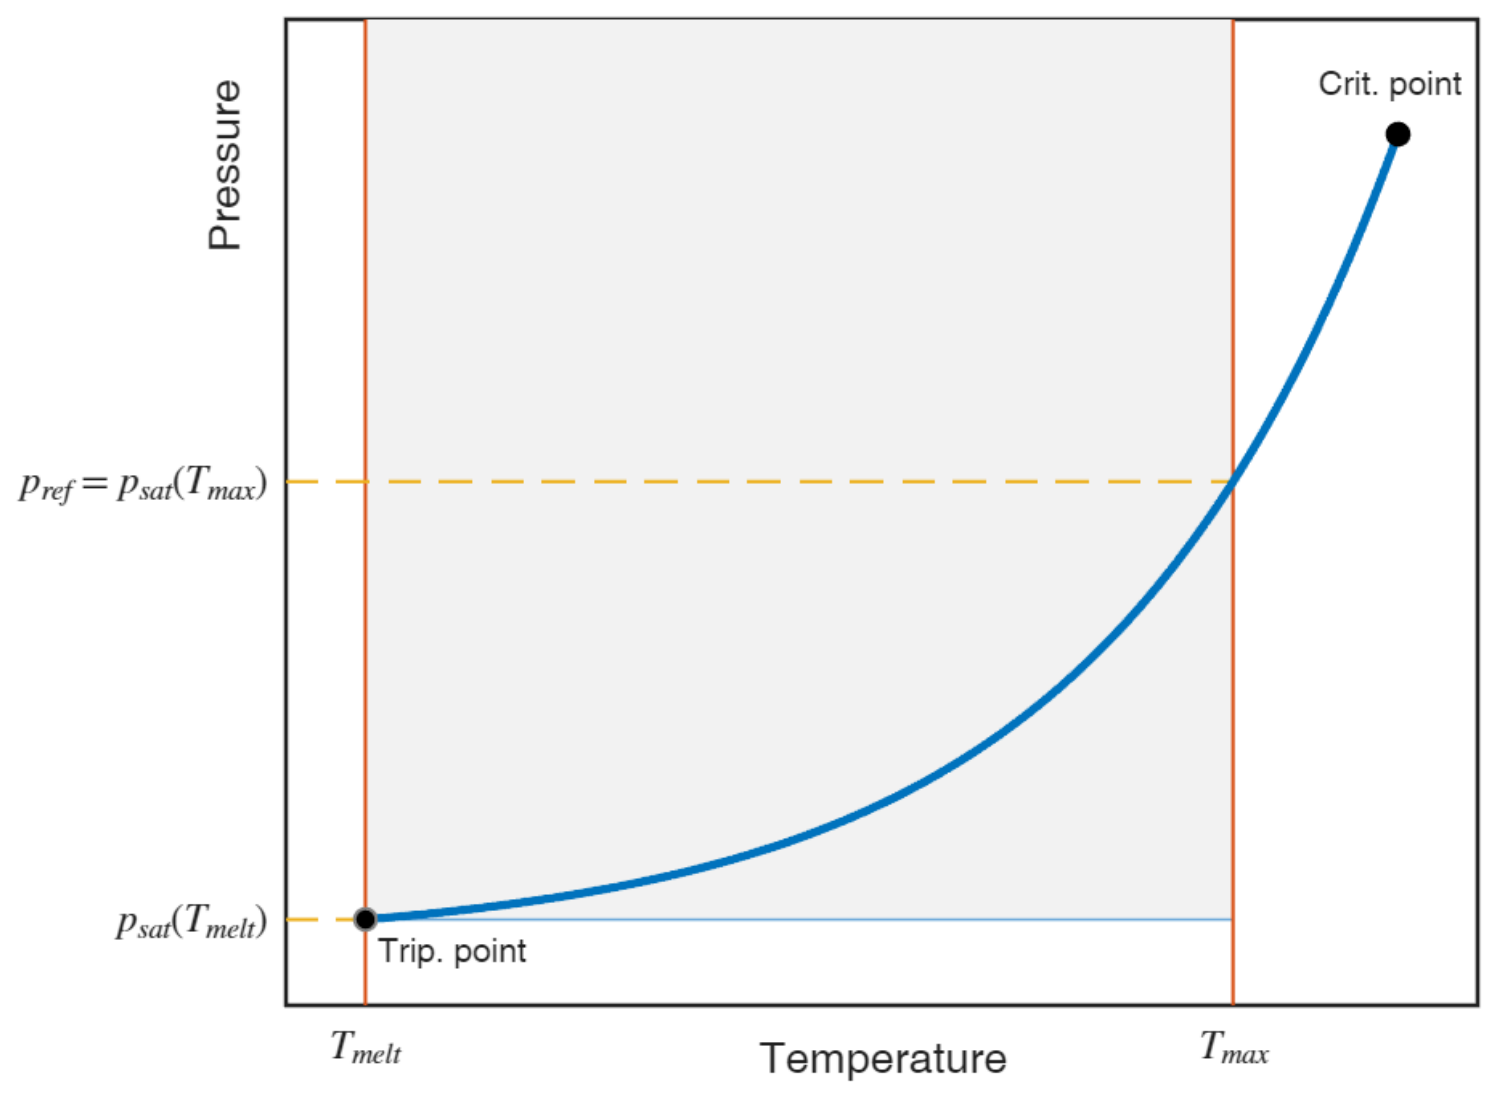
The validity domain of the property tables is illustrated in Figure 1. The temperature range extends from the melting temperature to a maximum tabulated value , which must remain below the critical temperature used in the model. The pressure range is selected so that both liquid and vapor states required by the RELAP5 table structure are included in the validity range.
Figure 1.
Thermodynamic validity domain adopted for the proposed property-table construction. The shaded area denotes the pressure–temperature domain covered by the property tables, bounded by Tmelt and Tmax and by the saturation pressure at the melting temperature; the saturation curve divides it into the liquid region, above the curve, and the vapor region, below it.
The reference pressure selected for the liquid branch is a central modeling choice. Literature correlations are usually reported at atmospheric pressure or at a nominal reference pressure. In the present table-generation procedure, the liquid reference pressure is instead set to pref = psat(Tmax).
With this definition, the saturation curve intersects the reference isobar at the upper boundary of the tabulated temperature range. The reference liquid state, therefore, remains above saturation over the entire liquid table.
The numerical values involved are the following. The maximum tabulated temperature and the corresponding reference pressure are 2800 K and 21.3 bar for Pb, 2400 K and 102.4 bar for PbBi, 3000 K and 199.3 bar for PbLi, and 2000 K and 80.8 bar for Na; the saturation pressures are evaluated with the saturation-pressure correlation presented in Section 3.2, that is, with the same correlation used to build the tables, not with the van der Waals model, which is used only to close the vapor branch. The reference pressure is therefore not close to the atmospheric value: depending on the fluid, it lies between about 20 and about 200 bar. As shown in Section 3.1, the associated pressure correction on the liquid-specific volume remains below 0.2% for the three heavy liquid metals and below 1% for sodium, so that applying at this reference pressure correlations that were originally determined at atmospheric pressure introduces a deviation well within the experimental uncertainty of the underlying reference data.
3. Thermodynamic Model
3.1. Liquid Phase
At the reference pressure, liquid-metal density is commonly available as a linear function of temperature:
For RELAP5 table generation, it is convenient to express the reference specific volume as a polynomial:
The coefficients of Equation (2) for the four working fluids are listed in Table 2.
Table 2.
Coefficients of the reference specific volume polynomial in Equation (2). The temperature is expressed in K and the specific volume in m3/kg; the units of each coefficient are reported in the column headings.
The sound speed and reference isobaric specific heat are represented as
The coefficients of the sound-speed correlation, Equation (3), and of the isobaric specific-heat correlation, Equation (4), are reported in Table 3 and Table 4, respectively.
Table 3.
Coefficients of the reference sound-speed correlation in Equation (3). The temperature is expressed in K and the sound speed in m/s; the units of each coefficient are reported in the column headings.
Table 4.
Coefficients of the reference isobaric specific-heat correlation in Equation (4). The temperature is expressed in K and the specific heat in J/(kg K); the units of each coefficient are reported in the column headings.
The pressure dependence of the liquid specific volume is assumed to be linear:
where
Using the thermodynamic relation between sound speed, compressibility, and thermal expansion, F is written as
with
Once is known, the liquid thermal expansion coefficient and the isothermal compressibility are obtained from their definitions:
It is worth noting that the linear form of Equation (5) does not conflict with the symmetry of the second-order mixed derivatives. Since F depends on temperature only, differentiating Equation (5) with respect to pressure and then to temperature gives F′(T), and differentiating first with respect to temperature and then to pressure gives the same result, so that the two mixed derivatives coincide identically for any function F(T). The linearization is thus a truncation of the pressure dependence of the specific volume, exact at the reference pressure, and with an error growing quadratically with the pressure difference, not a violation of thermodynamic consistency. Consistency between specific volume, enthalpy, and entropy is preserved because Equations (11) and (14) are obtained by integrating the corresponding exact differentials, Equations (10) and (13), with the same F(T) that appears in Equation (5), instead of assigning an independent correlation to each property.
The magnitude of the pressure correction, and therefore the accuracy of the linearization, can be estimated directly from Equations (7)–(9). Using the reference correlations of Table 2, Table 3 and Table 4, the isothermal compressibility ranges from about 3.5 × 10⁻¹¹ to about 8.4 × 10⁻¹¹ Pa−1 for Pb, PbBi, and PbLi between the melting temperature and the upper end of the tabulated range and from about 2.0 × 10⁻¹⁰ to about 4.5 × 10⁻¹⁰ Pa−1 for sodium, whose compressibility is roughly one order of magnitude larger. Over the full tabulated pressure span of 200 bar, the liquid specific volume therefore changes by 0.07% to 0.17% for the three heavy metals and by 0.39% to 0.90% for sodium. Since the exact pressure dependence is recovered to first order by construction, the neglected higher-order pressure terms are of second order in the product of the isothermal compressibility and the pressure difference, that is, of the order of 10−4% for the heavy liquid metals and of 10−3% for sodium at the extreme of the tabulated pressure range. This expected magnitude is orders of magnitude smaller than the experimental uncertainty of the reference density correlations, which justifies the linear model over the domain of interest, sodium included. A systematic sensitivity study of the generated tables against a higher-order pressure model is left to future work.
The enthalpy differential is written in terms of and as
Integrating the enthalpy differential, expressed through the Bridgman relations [19], first along the reference isobar and then along an isotherm gives
The liquid internal energy is then calculated as
Similarly, the entropy differential is
which leads to
The arbitrary reference constants are fixed by imposing zero internal energy and zero entropy for the saturated liquid at the melting temperature. This choice only defines the property datum and does not affect the property differences that drive the thermal-hydraulic solution.
3.2. Vapor Phase and Saturation Curve
The saturation pressure is represented by the exponential form:
from which
The coefficients adopted in the implementation are reported in Table 5.
Table 5.
Saturation-pressure coefficients adopted in Equation (15).
The vapor branch is described by the van der Waals equation of state [20]:
where
For a given pressure and temperature, Equation (17) is solved as a cubic equation in :
The vapor solution is selected as the largest real root satisfying , i.e., the maximum specific volume. The thermal expansion coefficient and the isothermal compressibility are then evaluated from the analytical derivatives of Equation (17), and the vapor isobaric specific heat is obtained from
The latent heat of vaporization is calculated from the Clausius–Clapeyron relation:
The vapor internal energy is obtained from the saturated vapor reference state and the van der Waals residual-energy contribution:
The vapor enthalpy follows from
and the vapor entropy is calculated as
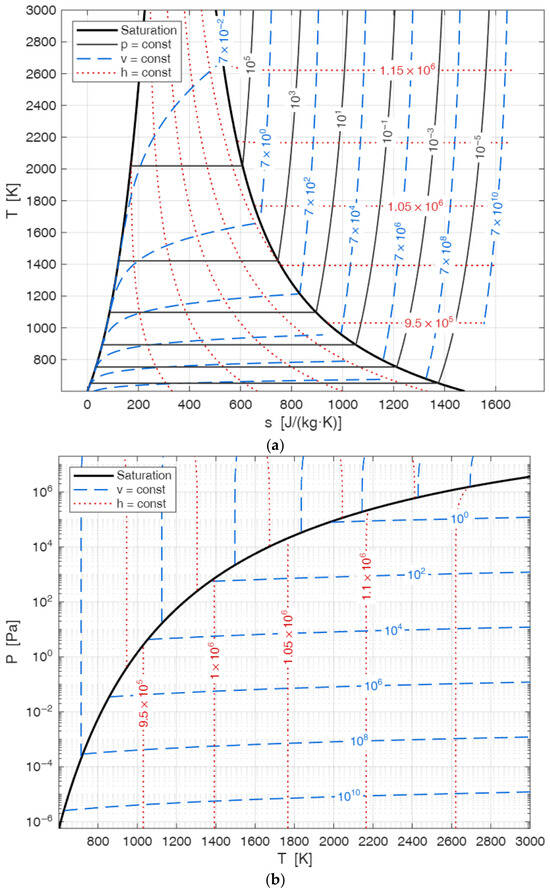
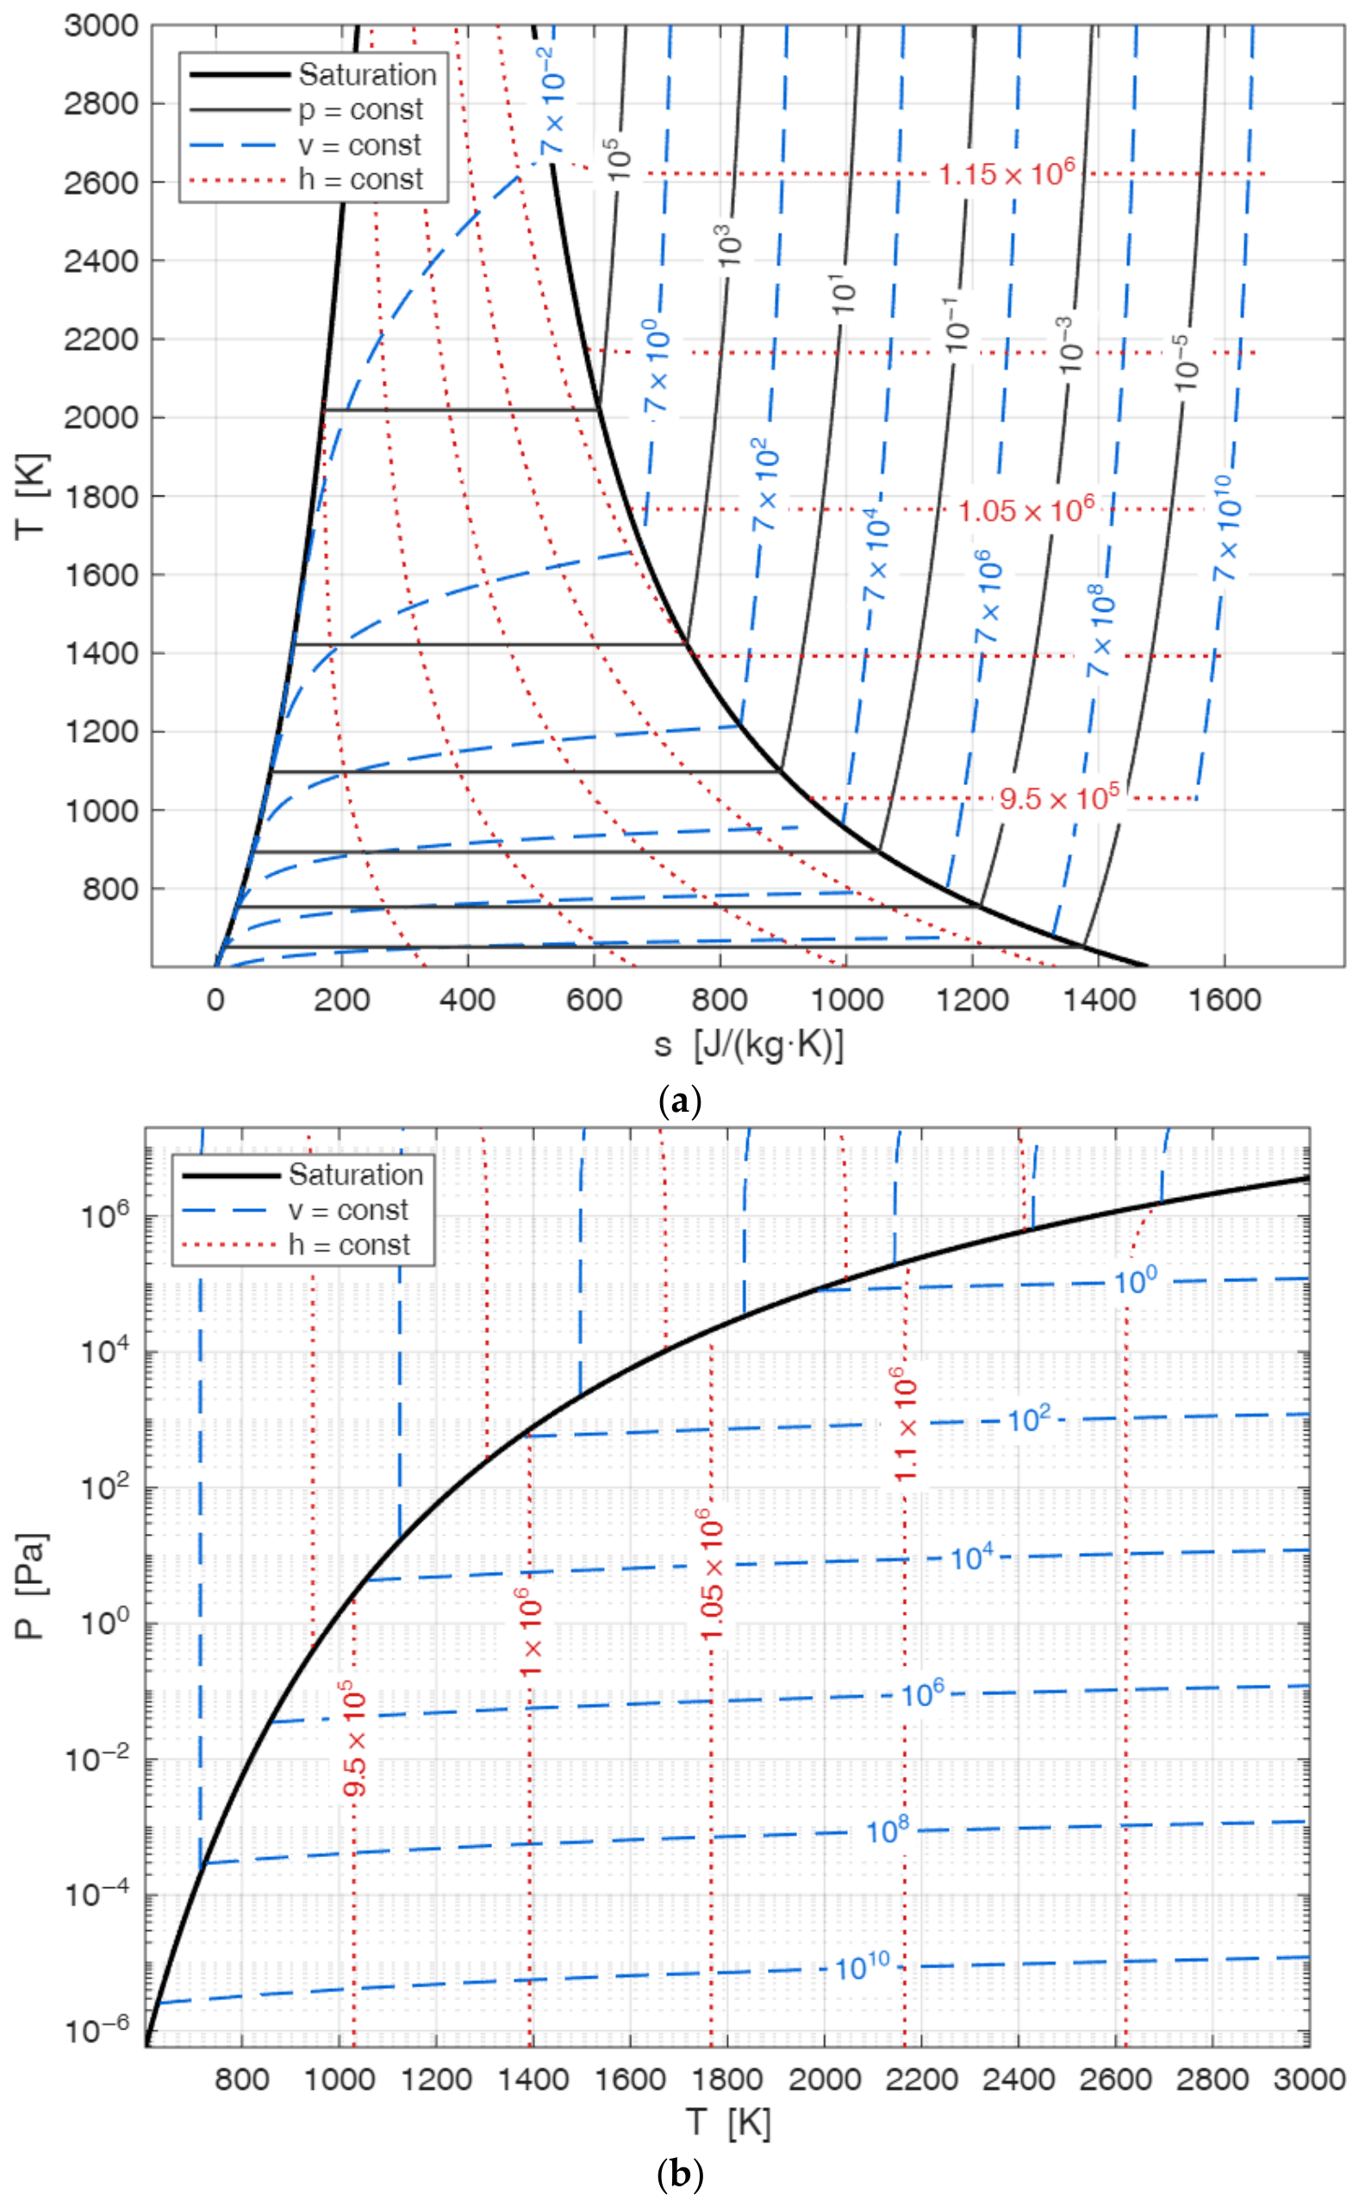
Figure 2 illustrates representative state diagrams generated for lead. These diagrams are used only to show the thermodynamic topology produced by the property model and table-generation procedure; they are not intended as validation data.
Figure 2.
Representative state diagrams generated for lead (SI units): (a) temperature-specific entropy diagram and (b) pressure-temperature diagram.
The temperature range covered by these diagrams extends well above the operating range of any liquid-metal system, and the reason is numerical rather than physical. The state routines of RELAP5 must be able to evaluate the property tables at any state that the iterative pressure-temperature search may probe during a transient, and the tabulated domain must therefore extend beyond the physically meaningful region in order to avoid out-of-table extrapolation; for lead, in particular, the tables must reach about 2800 K for the state routines to operate reliably. The upper portion of the diagrams, above roughly 2000 K, is generated by the van der Waals closure with the effective critical temperature listed in Table 1 and is not supported by experimental data. It must be regarded as a numerical continuation of the tables, obtained under the assumptions of a pseudo-pure fluid and of a cubic equation of state, and not as a prediction of the behavior of lead under such extreme conditions. The same remark applies to the near-critical region of the pressure-temperature diagram of Figure 2b.
4. Transport Properties and Heat-Transfer Correlations
The dynamic viscosity, thermal conductivity, and surface tension of the liquid phase are implemented directly in the RELAP5 source code as temperature-dependent correlations. The expressions are listed below; temperature is expressed in kelvin, and all properties are in SI units. Vapor thermal conductivity and dynamic viscosity are treated as constant implementation parameters because vapor transport has only a minor role in the intended Pb, PbBi, and PbLi applications. For Na, the adopted vapor values are 0.05 W/(m K) and 1.5 × 10⁻⁵ Pa s for thermal conductivity and dynamic viscosity, respectively. For Pb, PbBi, and PbLi, the corresponding values are 0.01 W/(m K) and 5.0 × 10⁻⁵ Pa s. These constants should not be interpreted as detailed vapor-transport correlations.
The liquid dynamic–viscosity correlations are
- Pb [1]: ;
- PbBi [1]: ;
- PbLi [4]: ;
- Na [2]: .
The liquid thermal–conductivity correlations are
- Pb [1]: ;
- PbBi [1]: ;
- PbLi [14]: ;
- Na [2]: .
The liquid surface–tension correlations are
- Pb [1]: ;
- PbBi [1]: ;
- PbLi [4]: ;
- Na [2]: .
For the dynamic viscosity of PbLi, the exponential argument is written in the form used by Schulz [4], in which 11,640 J/mol is the activation energy of viscous flow and 8.314 J/(mol K) is the universal gas constant, so that the argument reduces to about 1400/T with T in kelvin, and the resulting viscosity is expressed in Pa s.
Additional convective heat-transfer correlations for liquid metals were made selectable through RELAP5 input options. The implemented options include Seban and Shimazaki [21] for uniform wall temperature in circular tubes; Cheng and Tak [11] for uniform heat flux in circular tubes; Ushakov [12], Mikityuk [13], and Kazimi-Carelli [22] for rod-bundle geometries; and Hsu [23] for cross-flow configurations. For rod-bundle correlations, the pitch-to-diameter ratio P/D is read from the RELAP5 input cards already used by the code infrastructure. This implementation extends the modified code to both simple pipe-flow and fuel-bundle-like liquid-metal configurations. These correlations are made available to the user as selectable options: the present implementation guarantees that the option requested through the input flag is actually activated and that the required geometrical parameters are correctly retrieved from the input deck, whereas the assessment of the predictive capability of the correlations themselves is outside the scope of this paper, as stated in Section 1, and the reader is referred to the original references and to the reviews cited therein.
5. Code Implementation and Verification Strategy
Property tables are generated by MATLAB R2025b scripts that write the binary thermodynamic-property files required by RELAP5. For each fluid, the files include saturation properties and the complete pressure-temperature grid used by the code. During table generation, the liquid branch is selected for p ≥ psat(T) and the vapor branch for p < psat(T).
The resolution of the generated tables is as follows: 54 temperatures and 56 pressures for Pb, 79 temperatures and 54 pressures for PbBi, 71 temperatures and 53 pressures for PbLi, and 83 temperatures and 52 pressures for Na. The temperature grid adopts a 10 K step from the melting temperature up to 1000 K, that is, over the range of practical interest for system applications, and is progressively coarsened above it, where the tables serve mainly to guarantee that the state routines always find an admissible solution. The pressure grid is logarithmically spaced over the very low pressures required by the vapor branch; uses a 0.5 bar step between 1 and 10 bar, where most system applications are located; and is then coarsened up to the maximum tabulated pressure, equal to 200 bar for Pb, PbLi, and Na and to 300 bar for PbBi. This resolution was selected so as to refine the grid where the properties are actually used, while keeping the table size compatible with the memory allocation of the code.
The main changes in the Fortran source code are the insertion of molar masses and specific gas constants for the new fluids; the addition of liquid-metal transport correlations in viscosity, thermal-conductivity, and surface-tension routines; the implementation of selectable liquid-metal heat-transfer correlations; the definition of minimum pressure limits for the new fluids; and minor robustness updates in mixture-property calculations. The modified version, therefore, preserves the original RELAP5 architecture while extending the set of available working fluids.
The verification campaign was designed to check both the property package and the behavior of the modified code in simple transients. First, property-table outputs and Fortran transport-property routines were compared with the correlations from which they were generated. Second, the code was run on two analytically interpretable hydraulic problems involving single-phase liquid motion and natural circulation.
5.1. Property Verification
A simple RELAP5 input model was used to impose a prescribed mass flow rate through a single pipe while ramping the inlet temperature over the relevant liquid validity range. The outlet pressure was fixed at 2 bar. Figure 3 shows the adopted nodalization.
Figure 3.
RELAP5 nodalization used for thermophysical-property verification.
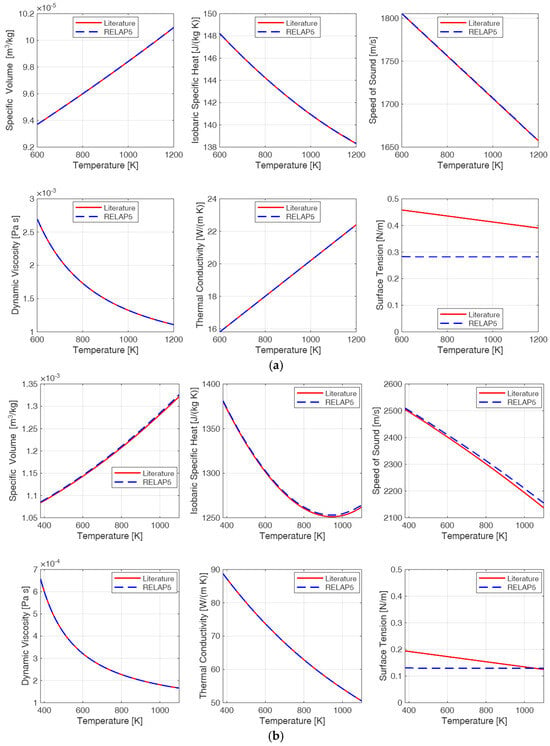
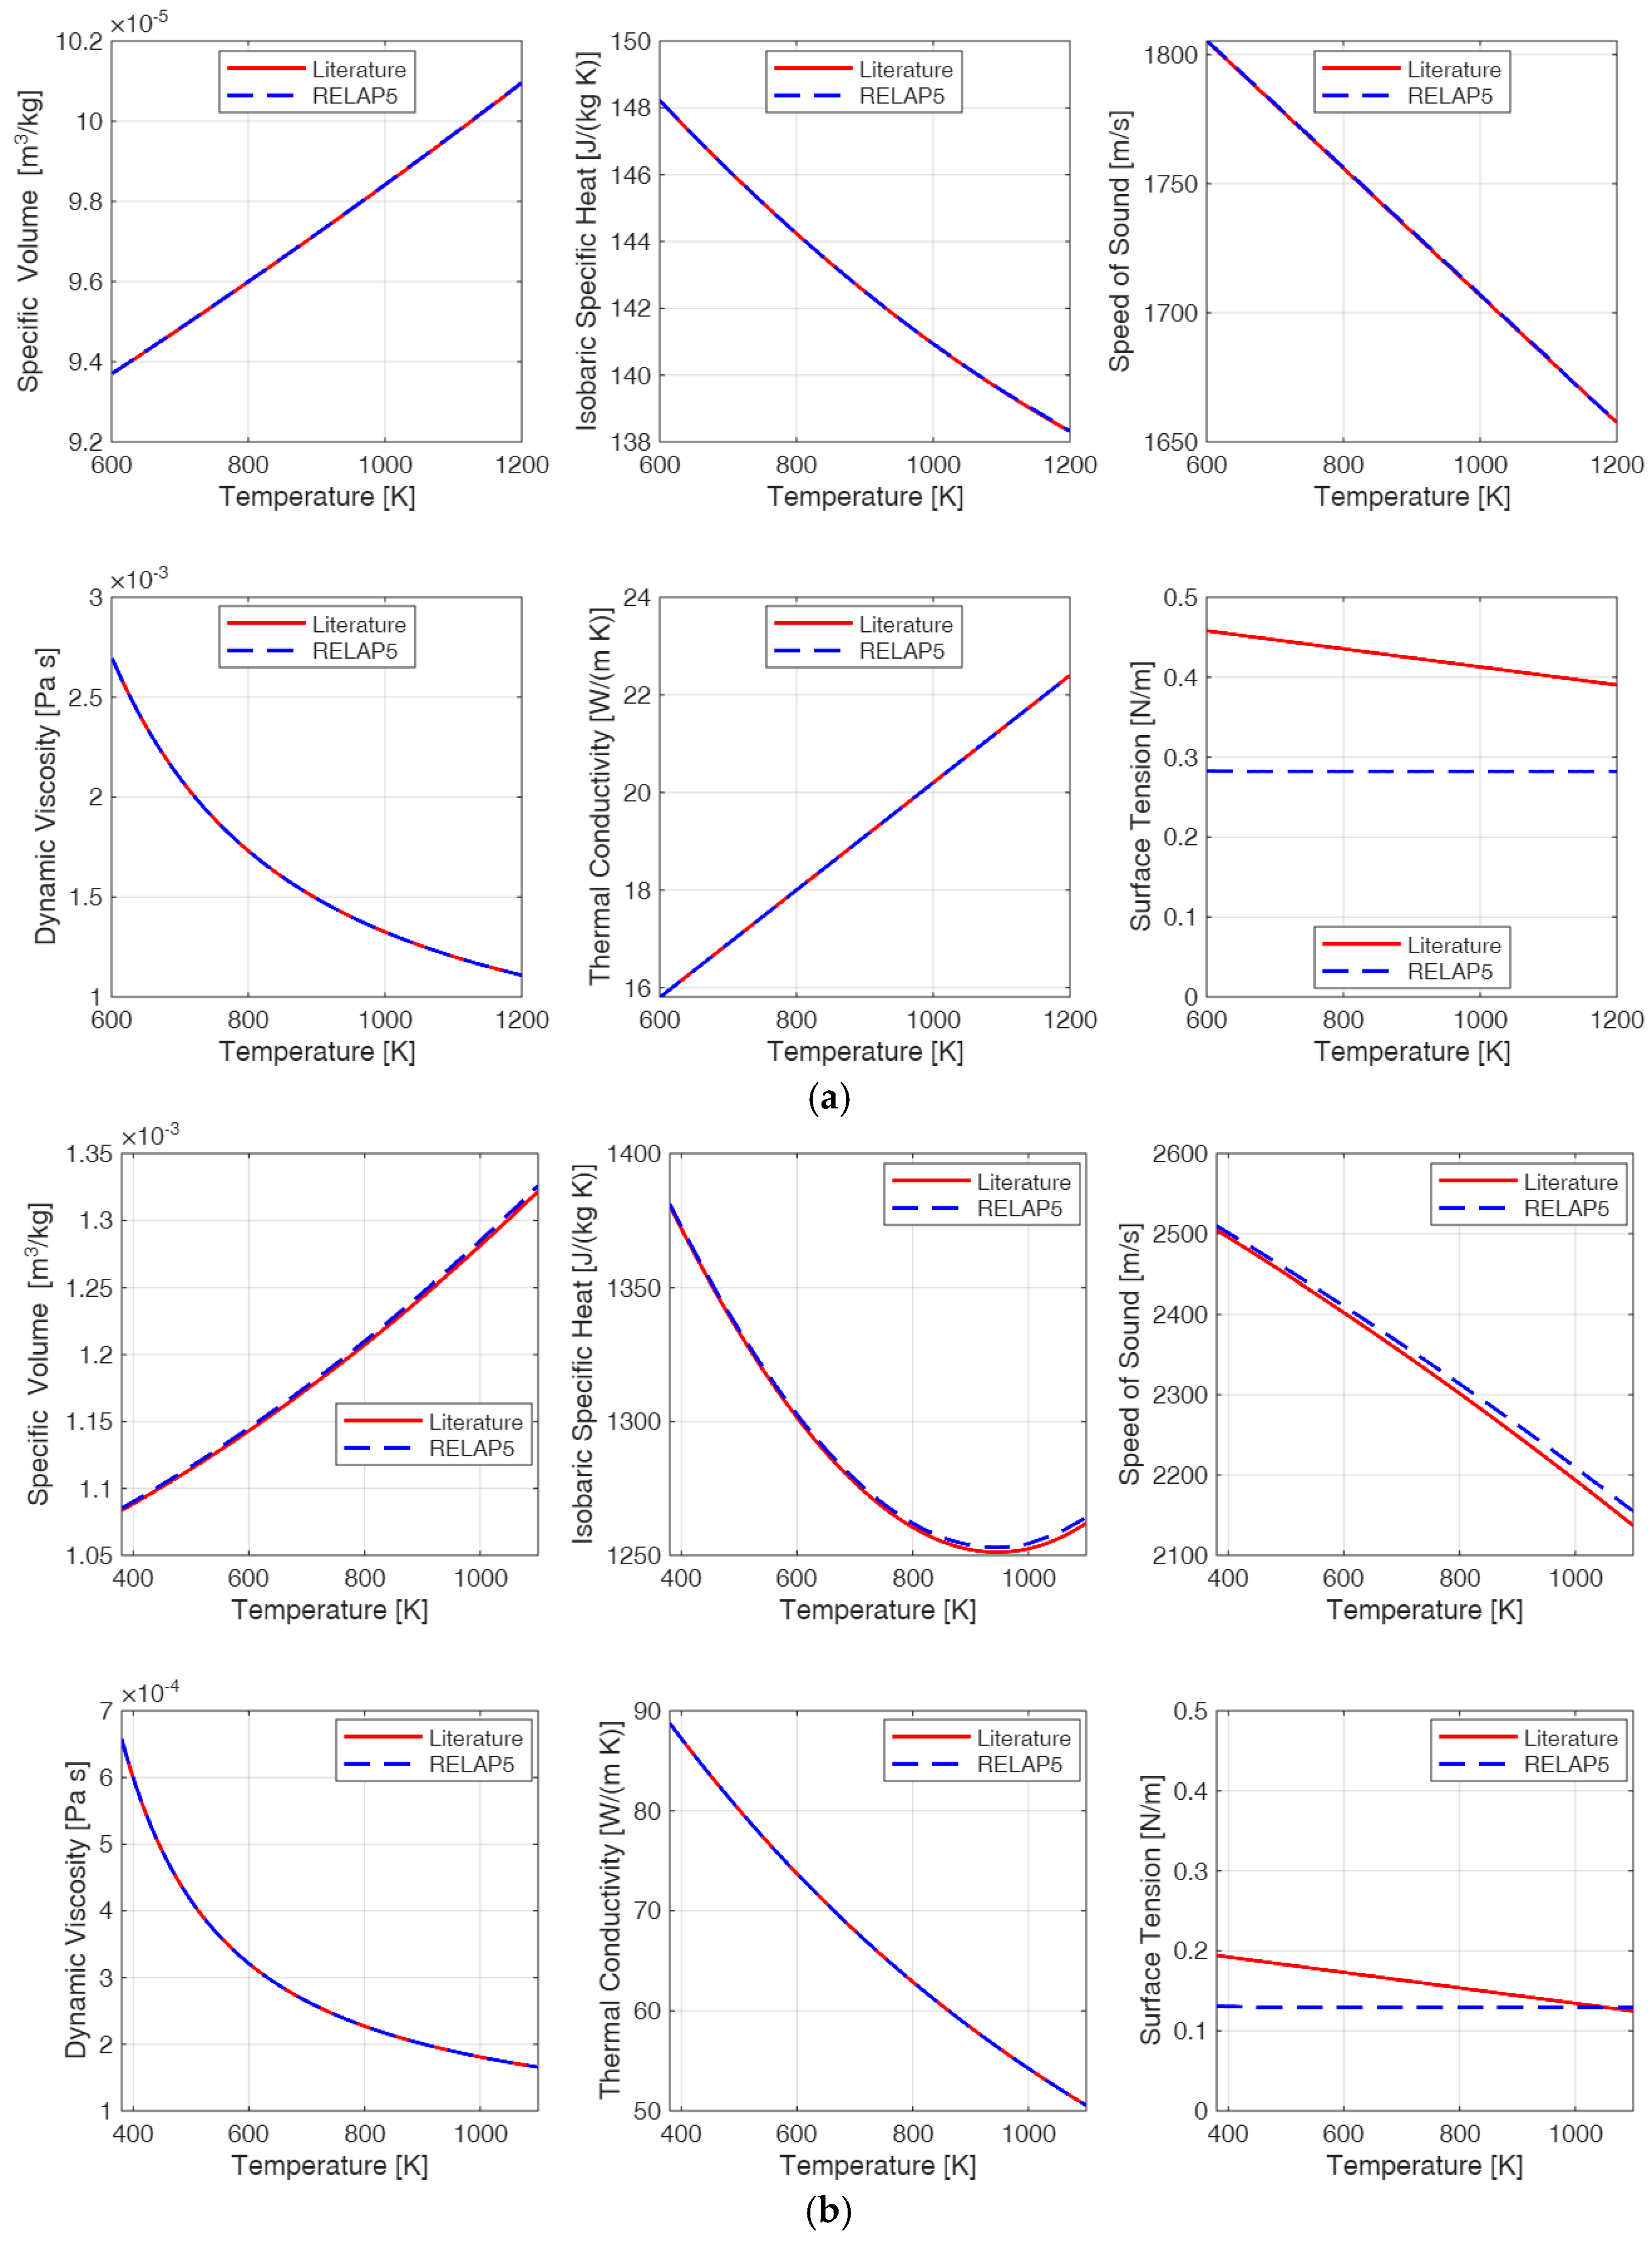
For Pb, PbBi, and PbLi, the inlet temperature was ramped from the corresponding melting temperature up to 1200 K, except for Na, whose maximum temperature was set to 1100 K in this verification, in order to keep a sufficient margin from the boiling point. A mass flow rate of 1 kg/s was imposed. RELAP5 results were compared with the analytical correlations used for the implementation, namely Equations (2)–(4) with the coefficients of Table 2, Table 3 and Table 4 and the transport correlations of Section 4; the sources of the underlying reference data are given in the caption of Figure 4. Figure 4 reports representative comparisons for Pb and Na; the same checks were performed for PbBi and PbLi with similar results (not reported here).
Figure 4.
Representative comparison between RELAP5 outputs and the adopted correlations for the main thermophysical properties of (a) Pb and (b) Na. Specific volume, sound speed, and isobaric specific heat are reproduced from Equations (2)–(4) with the coefficients of Table 2, Table 3 and Table 4; dynamic viscosity, thermal conductivity, and surface tension are reproduced from the correlations of Section 4. The underlying reference data are taken from the OECD/NEA handbook [1] for Pb and from the assessment of Fink and Leibowitz [2] for Na.
As a general statement, it can be observed that specific volume, isobaric specific heat, sound speed, viscosity, and thermal conductivity values calculated by RELAP5 closely match the selected correlations from the literature. The only appreciable difference concerns the surface tension, and it deserves a specific explanation because surface tension is a function of temperature alone. In RELAP5, the surface tension is treated as a saturation property: it is retrieved from the saturation-property table as a function of the saturation temperature associated with the local pressure, not of the local liquid temperature. In the verification runs, the pressure is held at 2 bar while the liquid temperature is ramped, so that the code returns an essentially constant value, whereas the input correlation, evaluated at the local liquid temperature, decreases with temperature. The two curves can be reconciled quantitatively: for lead, the saturation temperature at 2 bar obtained from Equation (15) is about 2155 K, and the surface-tension correlation of Section 4 evaluated at that temperature gives 0.282 N/m, which is the constant value returned by the code in Figure 4a. The deviation is, therefore, a consequence of the state at which RELAP5 evaluates this particular property, not of an error in the correlation or in the interpolation of the property tables. It has no practical consequence for the applications considered here, in which the liquid is subcooled and surface tension does not enter the solution, but it must be kept in mind whenever interfacial phenomena become relevant.
5.2. U-Tube Manometer
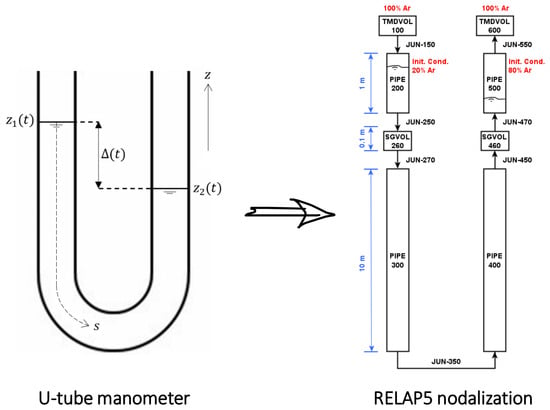
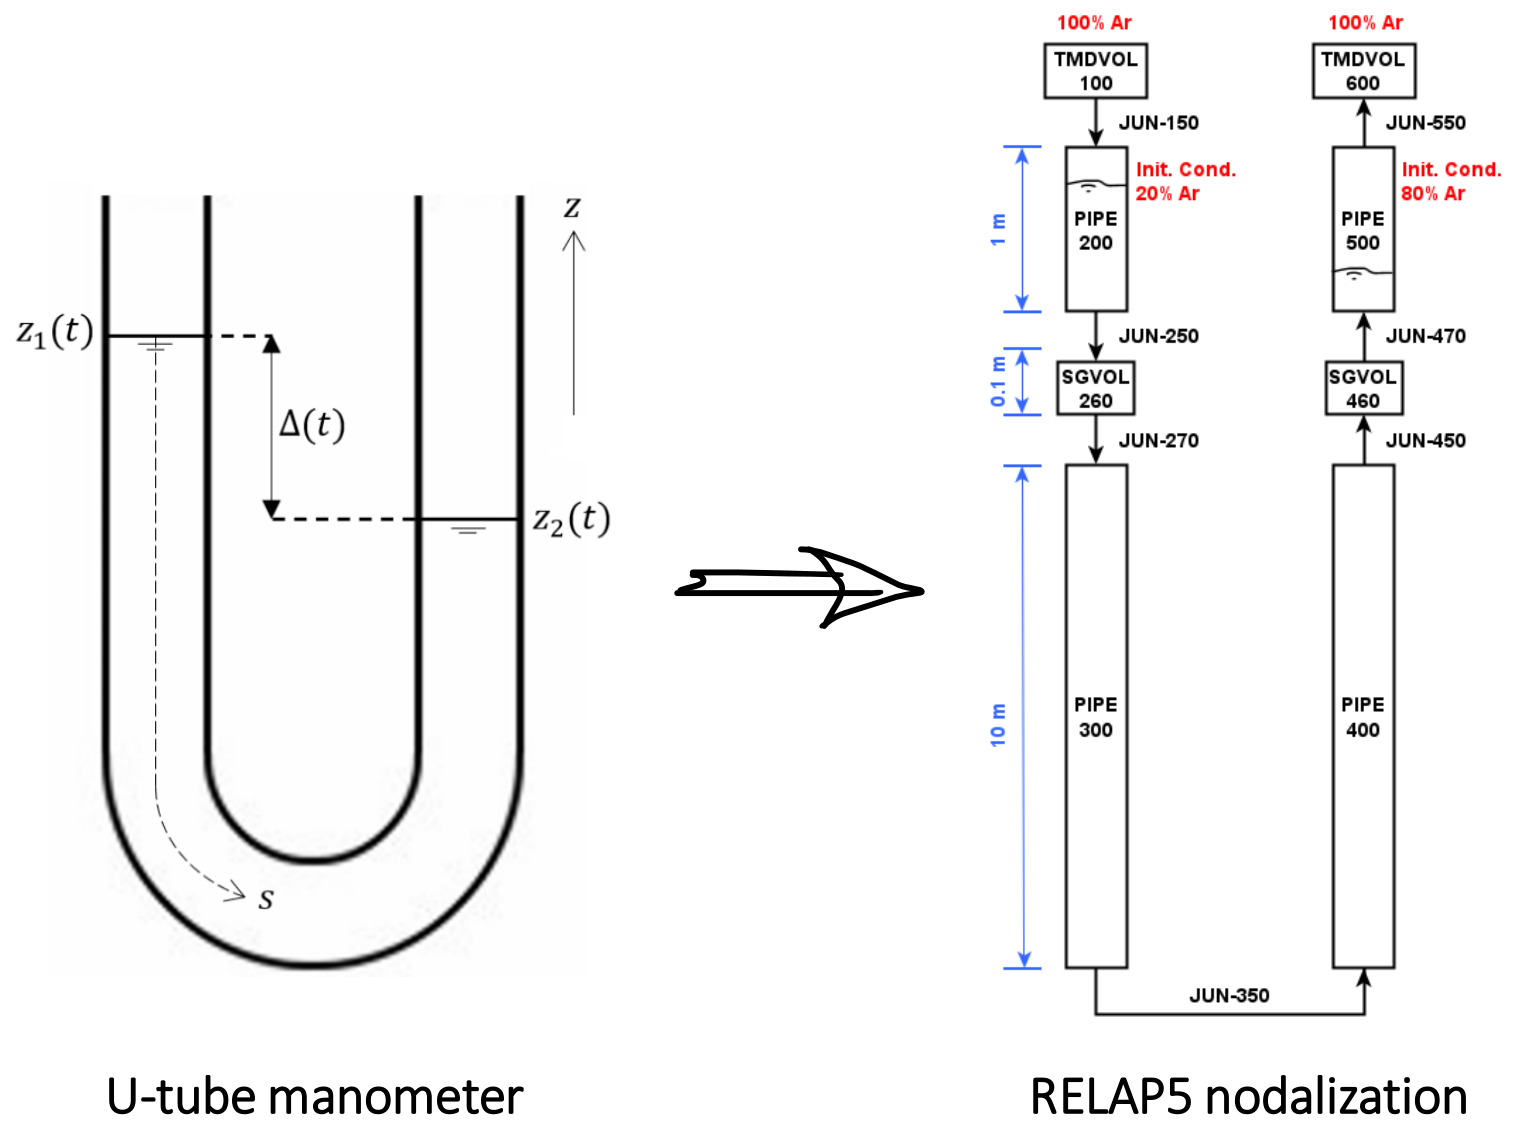
The first hydraulic non-regression test is an isothermal U-tube manometer initially at rest, with the two liquid–gas interfaces located at different elevations (see e.g., the leftmost part of Figure 5). After the initial imbalance is released, the liquid undergoes damped gravity-driven oscillations under the effect of wall friction. The RELAP5 nodalization is shown in Figure 5, while the main geometrical data of the components are summarized in Table 6.
Figure 5.
U-tube manometer geometry and RELAP5 nodalization.
Table 6.
Main component data of the RELAP5 model of the U-tube manometer.
To assess the capability of the RELAP5 implementation, the numerical results are compared with an analytical solution of the problem. For a constant cross-section U-tube with liquid-column length , pipe diameter , and elevation difference , the analytical model used for comparison is
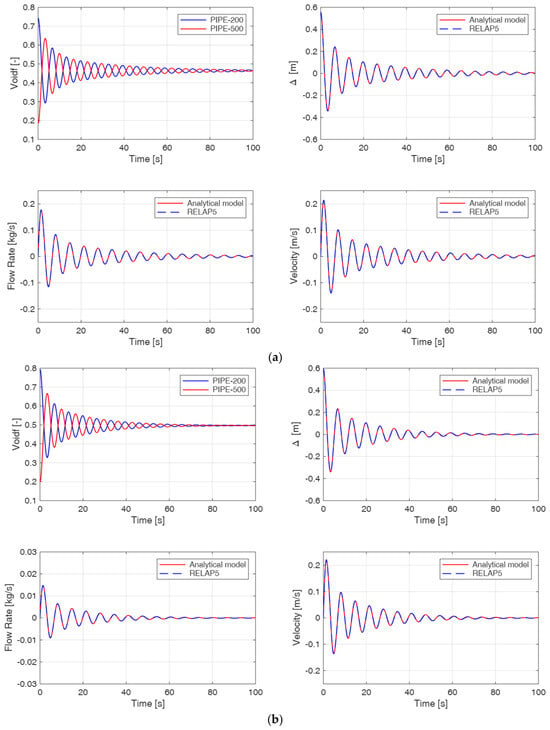
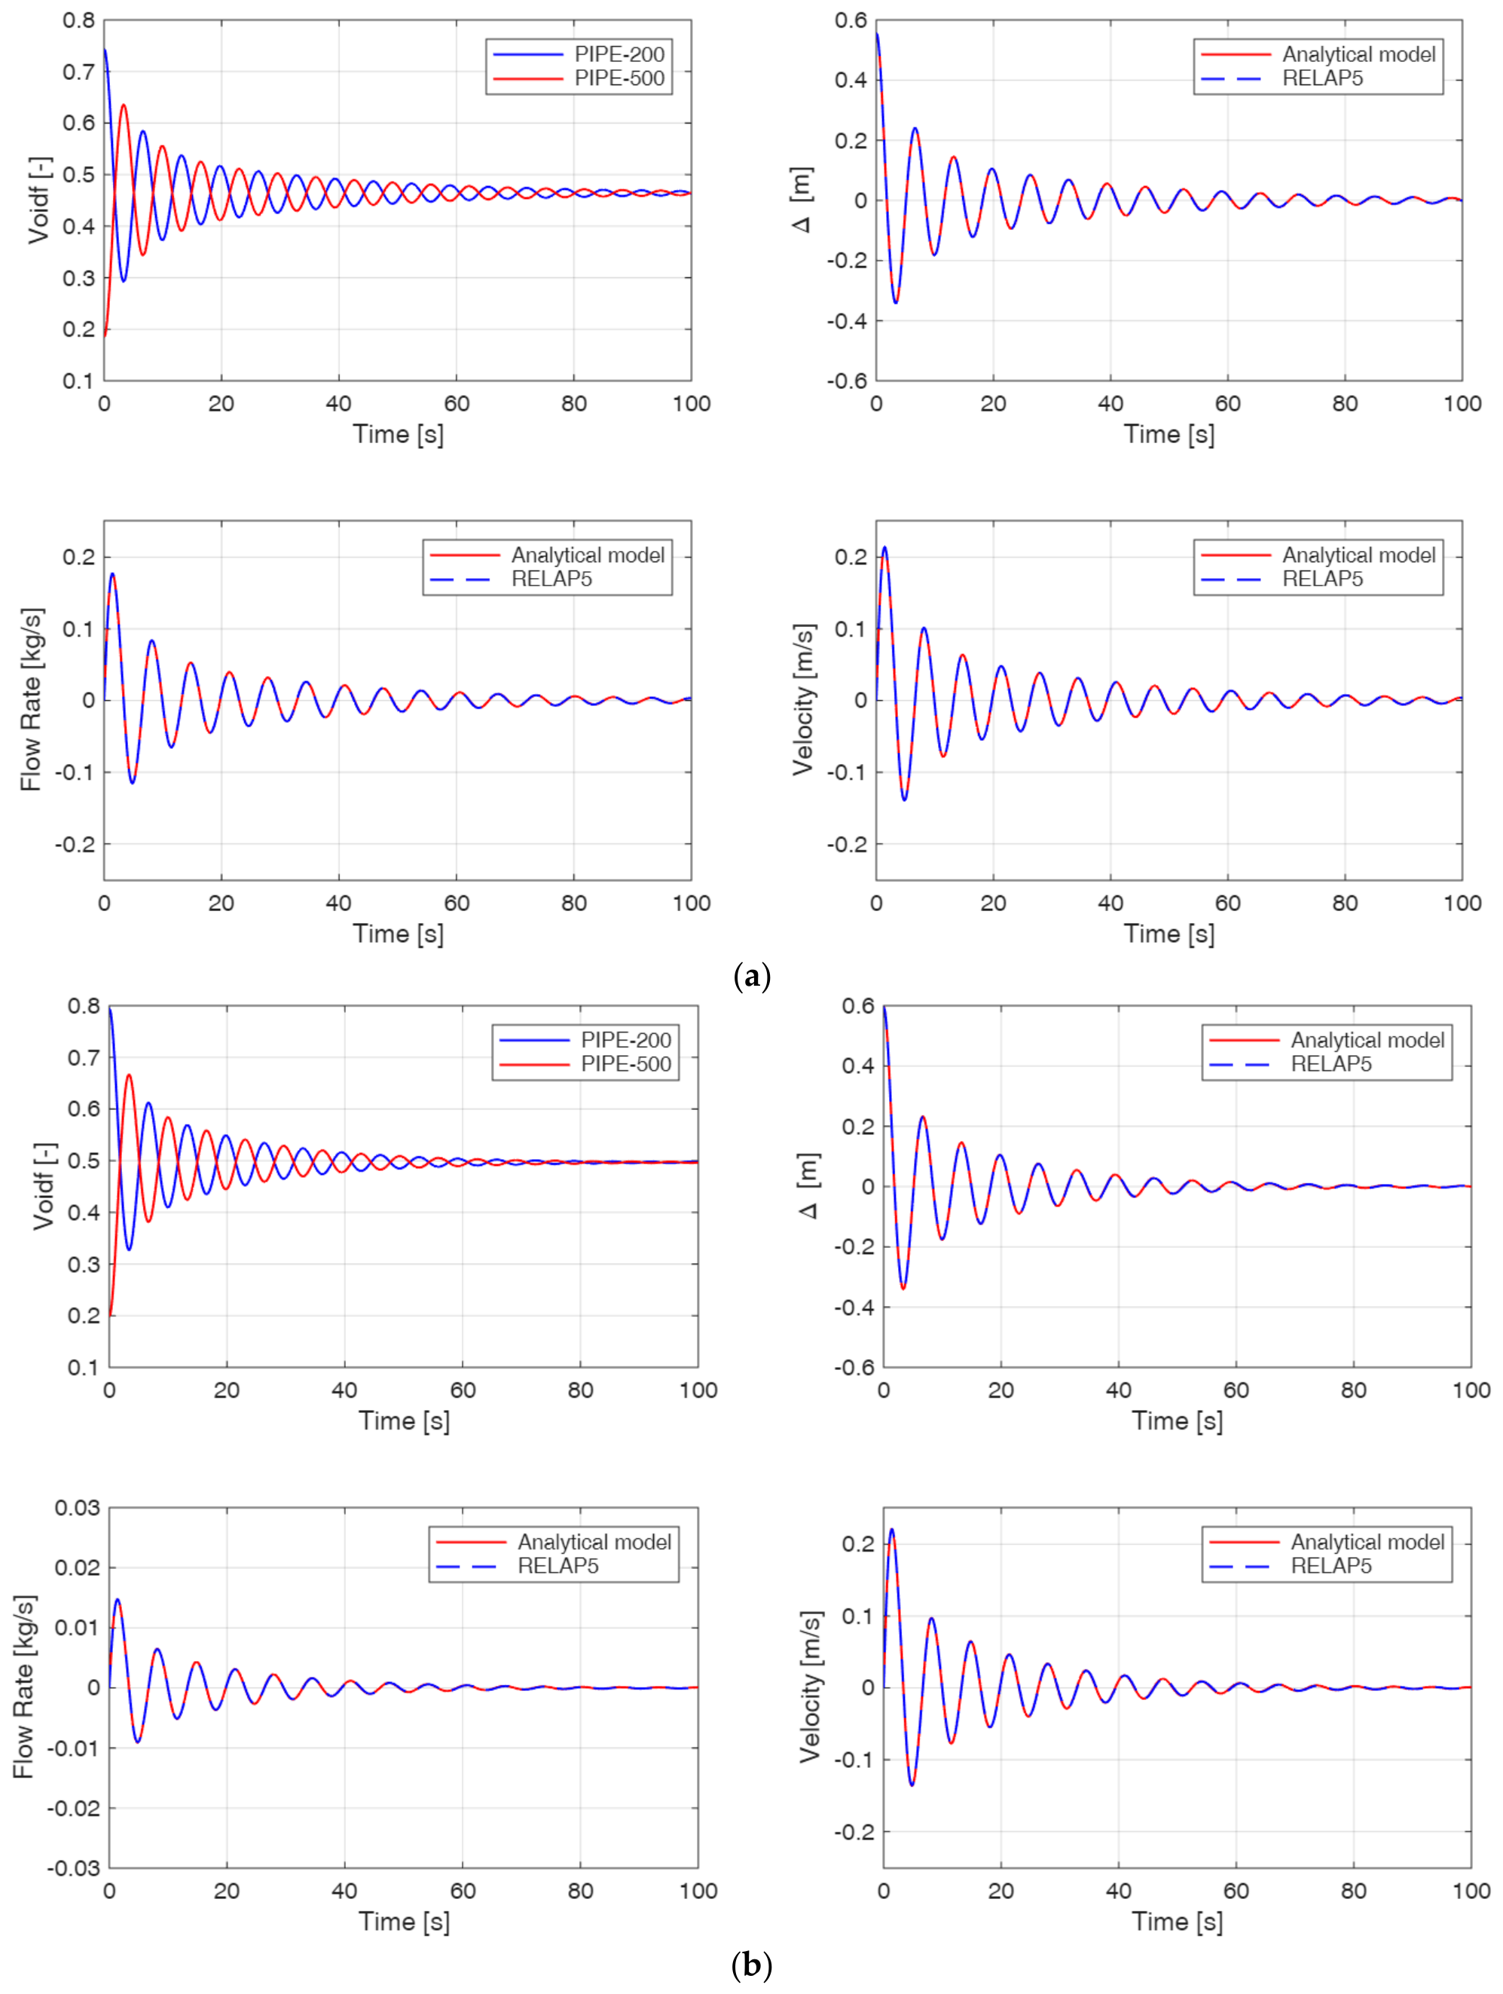
The comparison was performed at 700 K for all four fluids. Figure 6 shows representative results for Pb and Na. RELAP5 closely reproduces the analytical oscillation period, damping, and asymptotic equilibrium for both the mass flow rates and the liquid–gas interface positions. The same behavior was obtained for PbBi and PbLi.
Figure 6.
U-tube manometer results for representative fluids: (a) Pb and (b) Na. Each panel reports liquid fractions in the two vertical branches, elevation difference, mass flow rate, and liquid velocity.
5.3. Natural-Circulation Loop
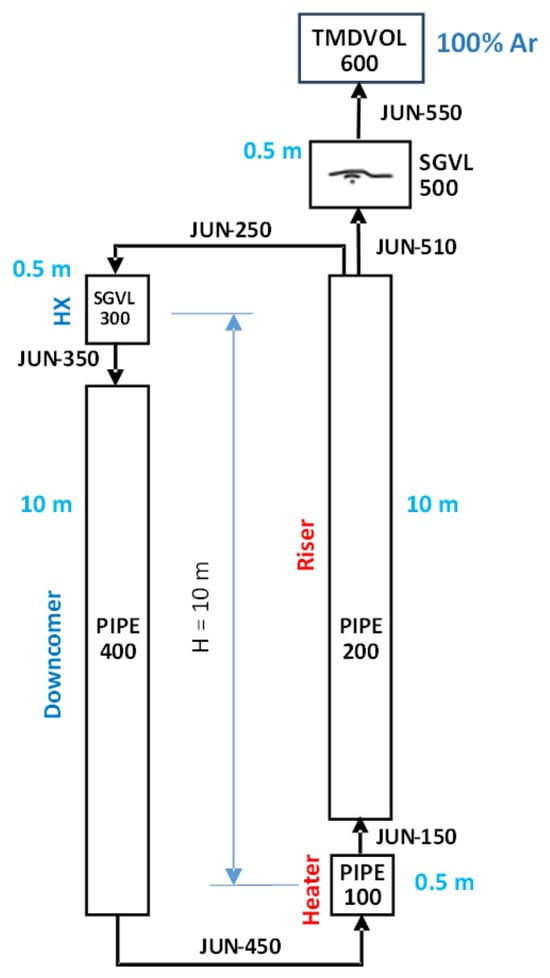
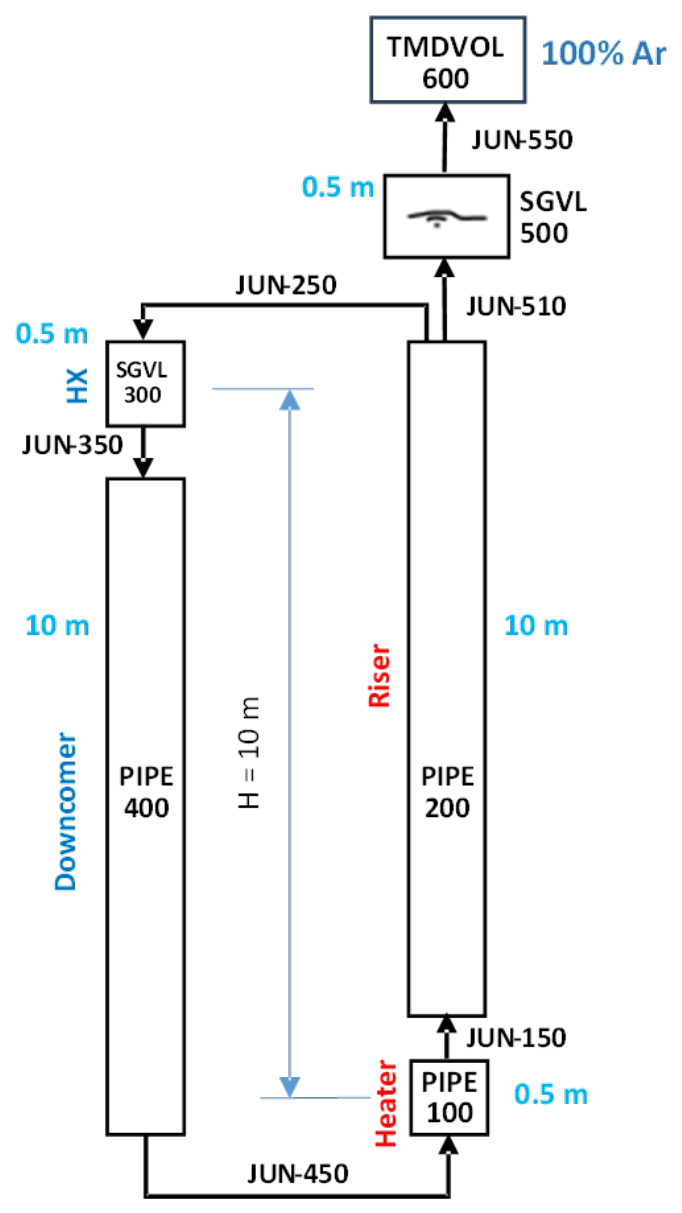
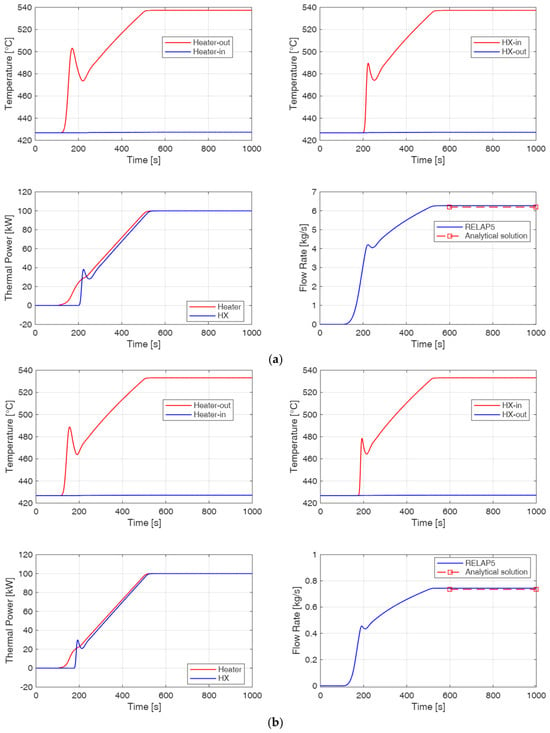
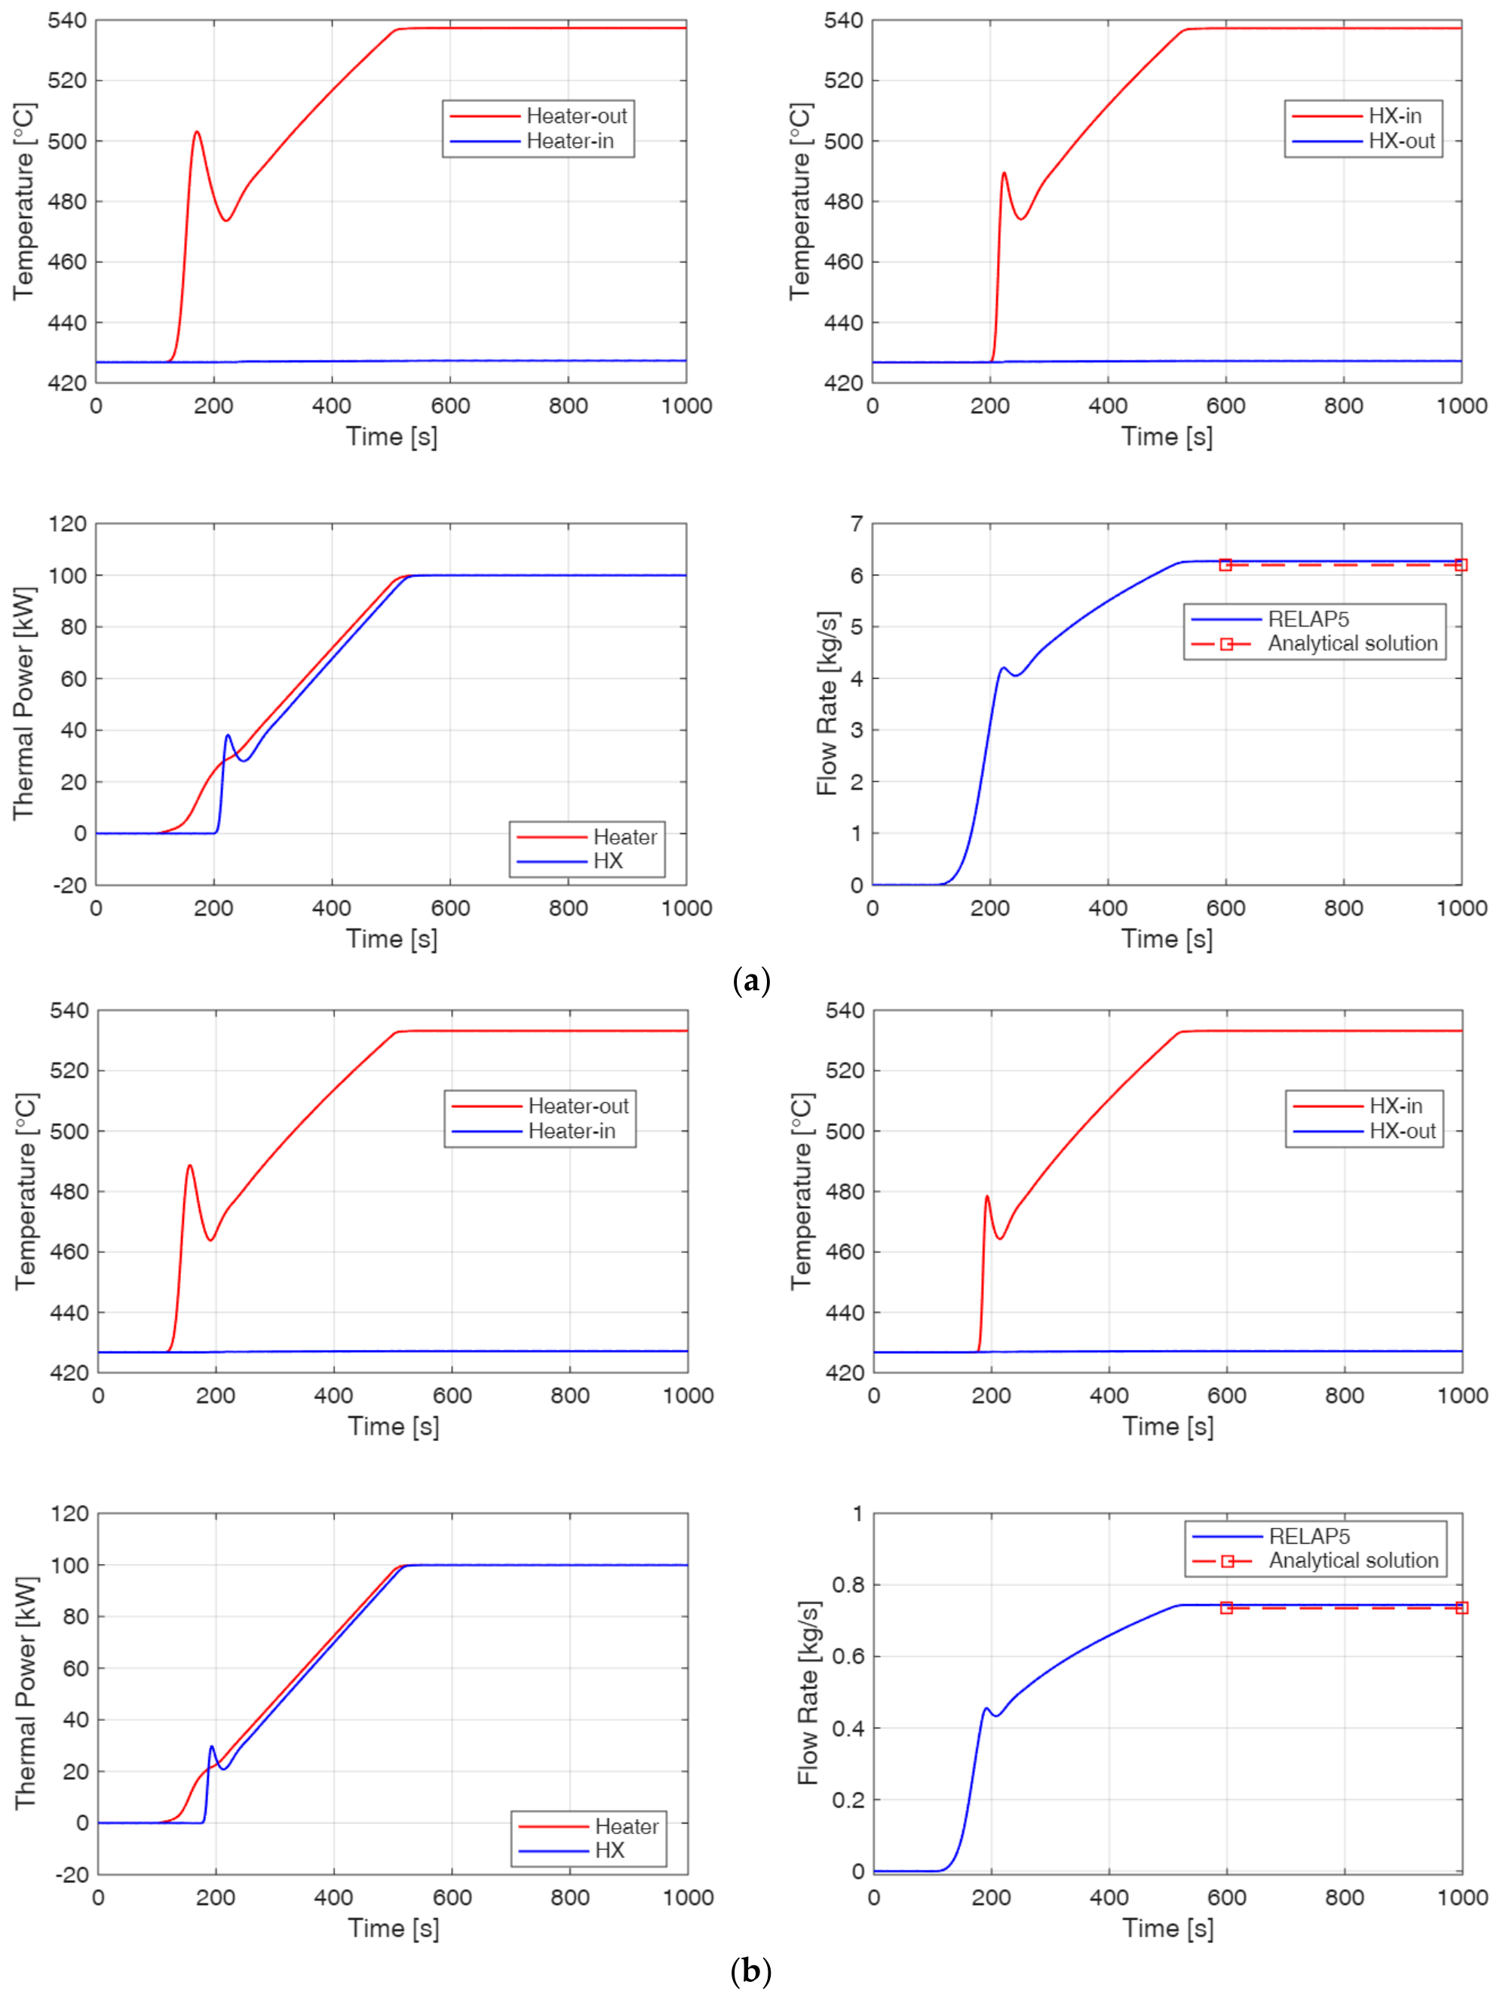
The second test case is a closed natural-circulation loop with a heater section at the bottom of a vertical side and an ideal heat sink at the top of the other. An expansion vessel with argon cover gas maintains the reference pressure. The heat sink is represented by a large heat-transfer area and a secondary-side temperature of 700 K, so that the primary-fluid temperature at the heat-sink outlet remains approximately constant. The RELAP5 nodalization is shown in Figure 7, while the main geometrical data of the components are summarized in Table 7.
Figure 7.
RELAP5 nodalization of the natural-circulation test case.
Table 7.
Main component data of the RELAP5 model of the natural-circulation loop.
Heater power is applied starting from 100 s and increases linearly to 100 kW at 500 s. The steady-state mass flow rate is estimated analytically as
where H is the elevation difference between the heat sink and the heat source, A is the cross-sectional area, is the imposed thermal power, and K is the sum of local pressure-loss coefficients. The thermophysical properties in Equation (26) are evaluated at the average loop temperature. Representative results for Pb and Na are shown in Figure 8.
Figure 8.
Natural-circulation results for representative fluids: (a) Pb and (b) Na. The figures show heater and heat-sink temperatures, exchanged power, and mass flow rate compared with the analytical steady-state value.
As can be observed, the RELAP5 flow rate approaches the analytical steady-state value for all four fluids. The transient response reflects the different density, heat capacity, and thermal-expansion properties of each liquid metal, while the final asymptotic state is consistent with the simplified momentum-energy balance in Equation (26). The agreement with Equation (26) is not fortuitous, nor does it hide compensating errors. The temperature rise established around the loop at the final power level is moderate, and over such an interval, the density and the isobaric specific heat of these fluids are close to linear functions of temperature; evaluating them at the mean loop temperature therefore introduces an error that is of second order in the temperature rise, and the comparison remains meaningful. It should nevertheless be understood for what it is, namely a consistency check between the code solution and a simplified momentum-energy balance derived under the same assumptions, not an assessment of the accuracy of the code in predicting natural circulation, which requires comparison with experimental data and has been addressed separately [16,17].
6. Discussion
The proposed implementation provides a consistent and practical route for introducing liquid-metal working fluids in RELAP5/Mod3.3. The liquid-phase reconstruction is based on thermodynamic identities and requires only reference correlations for density or specific volume, sound speed, and isobaric specific heat. This is important because these are the most reliable and widely available thermodynamic data for liquid metals.
The selection of pref = psat(Tmax) is particularly useful for system-code table generation. It prevents the reference liquid state from falling below saturation at high temperature and maximizes the admissible liquid region. Because pressure corrections are small for liquid metals, this choice has negligible impact on normal liquid-metal calculations while improving table consistency and robustness.
The vapor-phase model must be interpreted with caution. The van der Waals equation provides a mathematically consistent vapor branch and completes the RELAP5 property tables, but it is a cubic equation of state with known and large errors in the critical region, and the critical temperatures adopted here are effective parameters of the table-generation procedure rather than measured values. The saturation properties, the latent heat, and the vapor densities produced by the tables in the upper part of the temperature range, therefore, carry an uncertainty that is not quantified and may be comparable with the quantities themselves. The vapor branch must be used only for the purpose for which it was introduced, namely to complete the table structure required by RELAP5 and to guarantee that the state routines always find an admissible solution. Any application in which the vapor phase carries a significant fraction of the mass or of the energy of the system, and boiling-dominated transients in particular, falls outside the validity of the present tables.
The pseudo-pure-fluid assumption adopted for PbBi and PbLi deserves an explicit comment. In a binary alloy, the vapor in equilibrium with the liquid is enriched in the more volatile component, bismuth for PbBi, and lithium for PbLi, so that the true saturation pressure of the mixture differs from that of a pure substance with the same average molar mass and the composition of the liquid drifts as evaporation proceeds. The present implementation ignores this effect: a single saturation curve, Equation (15), is fitted to the mixture data, and the same composition is assumed for both phases. The consequences are confined to the saturation line and to the vapor branch. In the liquid region, which is the region of interest for the target applications, the properties are those of the alloy, and the assumption plays no role. Near the saturation boundary, the two-phase mixture properties returned by the code, such as density, enthalpy, and viscosity, are those of a pure fluid: they are obtained by weighting the liquid and vapor branches with the void fraction, with no account of composition differences between the phases. Quantifying the resulting error on the saturation pressure and on the latent heat would require vapor–liquid equilibrium data for these alloys over the whole temperature range, which to the authors’ knowledge are not available with the accuracy required; a binary phase diagram would be a necessary ingredient of such an analysis. This is the main reason why the vapor branch is presented as a table-completion closure and why boiling applications are explicitly excluded from the validity domain of the present tables.
The methodology described in Section 3 is not specific to RELAP5: from three reference-pressure correlations, it produces a set of thermodynamically consistent properties on an arbitrary pressure-temperature grid. What is specific to RELAP5 is only the last step, that is, the binary format of the property files, the ordering of the properties stored at each grid point, and the internal interpolation scheme of the state routines. Porting the approach to another system thermal-hydraulic code such as TRACE or ATHLET would therefore require rewriting the output section of the table-generation scripts according to the property-file format of the target code, together with the corresponding source-code insertions for the transport and heat-transfer correlations, while the thermodynamic reconstruction would remain unchanged. Two assumptions of the present implementation should be verified against the target code: that the reference pressure of the liquid branch can be chosen freely, since some codes assume an atmospheric reference, and that the code tolerates a vapor branch of limited accuracy, since codes with a more elaborate two-phase treatment may exercise the vapor properties more heavily than RELAP5 does in the applications considered here.
The distinction between the two levels of assessment should be kept in mind when reading the results of Section 5. The calculations reported there constitute code verification: they demonstrate that the property tables are internally consistent, that the code retrieves from them the values that were used to generate them, and that the modified code remains numerically robust in transients that admit an analytical interpretation. They say nothing about the ability of the underlying models to describe the physical behavior of real liquid metals, which is a matter of validation and requires experimental data. As recalled in Section 1, the validation of this code version has been the subject of separate publications [15,16,17], in which the same property package was applied to in-box LOCA transients for breeding-blanket components and to the NACIE and CIRCE facilities. The non-regression tests presented here are intentionally simple and analytically interpretable, a feature that makes them suitable for routine re-execution whenever the code is modified. Future work will extend the assessment to liquid-metal heat-transfer experiments, in particular for rod-bundle geometries and mixed-convection regimes.
7. Conclusions
A unified implementation of Pb, PbBi, PbLi, and Na as working fluids in RELAP5/Mod3.3 has been developed and verified. The main conclusions are as follows:
- A thermodynamically consistent liquid-property reconstruction was formulated from reference correlations for specific volume, sound speed, and isobaric specific heat.
- Pressure-dependent liquid properties were generated by applying a linear pressure correction to the specific volume and integrating the corresponding thermodynamic differentials for enthalpy and entropy.
- A van der Waals vapor-phase branch was coupled to the liquid branch to complete the RELAP5 thermodynamic-property tables.
- Temperature-dependent liquid-metal transport properties and a set of selectable convective heat-transfer correlations for low-Prandtl-number fluids were implemented directly in the RELAP5 Fortran source code and made available through the code input; the assessment of the predictive capability of these correlations is outside the scope of the present work.
- Property-verification calculations confirmed that RELAP5 reproduces the implemented correlations; the only appreciable difference concerns surface tension, which the code evaluates at saturation conditions rather than at the local liquid temperature.
- Non-regression tests based on a U-tube manometer and a natural-circulation loop confirmed the stability and consistency of the modified code for representative liquid-metal applications.
- The assessment reported in this paper is code verification and not validation: it provides evidence that the models have been implemented correctly, whereas the ability of those models to reproduce the behavior of real liquid-metal systems has been addressed by the authors in separate studies based on experimental comparisons with the same code version.
The resulting RELAP5/Mod3.3 version is suitable for preliminary system-level thermal-hydraulic analyses of innovative liquid-metal-cooled nuclear systems, provided that the model assumptions and the property validity ranges are respected. The implementation targets single-phase or weakly two-phase system-code calculations within the specified property-table domain. In particular, the van der Waals vapor branch is a table-completion closure introduced for numerical robustness only: it must not be used for boiling-dominated transient analyses, for applications in which the vapor phase carries a significant fraction of the mass or of the energy of the system, or for the prediction of the saturation and critical-point properties of these fluids.
Author Contributions
Conceptualization, N.F., A.P., C.R. (Carmine Risi), C.R. (Chiara Robazza), and M.V.; methodology, N.F., A.P., C.R. (Carmine Risi), C.R. (Chiara Robazza), and M.V.; software, N.F., A.P., C.R. (Chiara Robazza), and M.V.; validation, N.F., A.P., C.R. (Carmine Risi), C.R. (Chiara Robazza), and M.V.; formal analysis, N.F., A.P., C.R. (Carmine Risi), C.R. (Chiara Robazza), and M.V.; investigation, N.F., A.P., C.R. (Carmine Risi), C.R. (Chiara Robazza), and M.V.; resources, N.F. and A.P.; data curation, N.F., A.P., C.R. (Chiara Robazza), and M.V.; writing—original draft, N.F., A.P., C.R. (Carmine Risi), C.R. (Chiara Robazza), and M.V.; writing—review and editing, N.F., A.P., C.R. (Carmine Risi), C.R. (Chiara Robazza), and M.V.; visualization, N.F. and A.P.; supervision, N.F. All authors have read and agreed to the published version of the manuscript.
Funding
This research received no external funding.
Data Availability Statement
The data presented in this study are not publicly available due to privacy restrictions.
Acknowledgments
The authors gratefully acknowledge the U.S. Nuclear Regulatory Commission (U.S. NRC) for making the RELAP5/Mod3.3 code available within the framework of the International Code Application and Maintenance Program (CAMP).
Conflicts of Interest
The authors declare no conflicts of interest.
Nomenclature
| Symbol | Meaning | Units |
| A | Cross-sectional area | m2 |
| a, b | van der Waals attraction and co-volume parameters, Equation (18) | Pa m6/kg2; m3/kg |
| a1, a2 | Coefficients of the saturation-pressure correlation, Equation (15) | Pa; K |
| b0–b3 c0–c2 d0–d3 r0, r1 | Coefficients of the reference-pressure property correlations, Equations (1)–(4) (see Table 2, Table 3 and Table 4) | see Table 2, Table 3 and Table 4 |
| cp, cv | Specific heat at constant pressure/volume | J/(kg K) |
| D | Pipe (inner) diameter | m |
| Dhyd | Hydraulic diameter | m |
| F | Pressure coefficient in the liquid specific-volume model, Equation (6) | m3/(kg Pa) |
| ffric | Friction factor | – |
| g | Gravitational acceleration | m/s2 |
| H | Elevation difference between the heat source and the heat sink | m |
| h | Specific enthalpy | J/kg |
| hfg | Latent heat of vaporization | J/kg |
| K | Sum of local pressure-loss coefficients | – |
| k | Thermal conductivity | W/(m K) |
| L | Liquid-column length/loop length | m |
| ṁ | Mass flow rate | kg/s |
| P/D | Pitch-to-diameter ratio | – |
| p | Pressure | Pa |
| Thermal power | W | |
| Rg | Specific gas constant | J/(kg K) |
| s | Specific entropy | J/(kg K) |
| T | Temperature | K |
| t | Time | s |
| u | Specific internal energy | J/kg |
| v | Specific volume | m3/kg |
| ws | Speed of sound | m/s |
| z | Vertical coordinate (elevation) | m |
| β | Thermal expansion coefficient | 1/K |
| Δ | Elevation difference between the two free liquid levels | m |
| κT | Isothermal compressibility | 1/Pa |
| μ | Dynamic viscosity | Pa s |
| ρ | Density | kg/m3 |
| σ | Surface tension | N/m |
| Subscripts and denote liquid and vapor, respectively; ref denotes reference-pressure quantities; sat denotes saturation conditions; trip denotes triple point and c denotes the critical point. Subscripts melt, max, and fg denote the melting temperature, the maximum tabulated temperature, and vaporization (liquid-to-vapor) quantities, respectively. | ||
References
- OECD/NEA. Handbook on Lead-Bismuth Eutectic Alloy and Lead Properties, Materials Compatibility, Thermal-Hydraulics and Technologies; Handbook NEA No. 7268; OECD Publishing: Paris, France, 2015. [Google Scholar]
- Fink, J.K.; Leibowitz, L. Thermodynamic and Transport Properties of Sodium Liquid and Vapor; Technical Report ANL/RE-95/2; Argonne National Laboratory: Lemont, IL, USA, 1995. [Google Scholar]
- Sobolev, V. Database of Thermophysical Properties of Liquid Metal Coolants for GEN-IV—Sodium, Lead, Lead-Bismuth Eutectic (and Bismuth); SCK-CEN Report SCK-CEN-BLG-1069; SCK-CEN: Mol, Belgium, 2011; Rev. 1. [Google Scholar]
- Schulz, B. Thermophysical properties of the Li(17)Pb(83) alloy. Fusion Eng. Des. 1991, 14, 199–205. [Google Scholar] [CrossRef] [Scilit]
- Information Systems Laboratories. RELAP5/MOD3.3 Code Manual; NUREG/CR-5535/Rev. 1; U.S. Nuclear Regulatory Commission: Rockville, MD, USA, 2001.
- Morita, K.; Fischer, E.A. Thermodynamic properties and equations of state for fast reactor safety analysis, Part I: Analytic equation-of-state model. Nucl. Eng. Des. 1998, 183, 177–191. [Google Scholar] [CrossRef] [Scilit]
- Morita, K.; Fischer, E.A.; Thurnay, K. Thermodynamic properties and equations of state for fast reactor safety analysis, Part II: Properties of fast reactor materials. Nucl. Eng. Des. 1998, 183, 193–211. [Google Scholar] [CrossRef] [Scilit]
- Yamano, H.; Fujita, S.; Tobita, Y.; Kamiyama, K.; Kondo, S.; Morita, K.; Fischer, E.A.; Brear, D.J.; Shirakawa, N.; Cao, X.; et al. SIMMER-III: A Computer Program for LMFR Core Disruptive Accident Analysis, Version 3.A, Model Summary and Program Description; JNC TN9400 2003-071; Japan Nuclear Cycle Development Institute: Tokai, Japan, 2003. [Google Scholar]
- Morita, K.; Maschek, W.; Flad, M.; Yamano, H.; Tobita, Y. Thermophysical properties of lead-bismuth eutectic alloy in reactor safety analyses. J. Nucl. Sci. Technol. 2006, 43, 526–536. [Google Scholar] [CrossRef] [Scilit]
- Balestra, P.; Giannetti, F.; Caruso, G.; Alfonsi, A. New RELAP5-3D lead and LBE thermophysical properties implementation for safety analysis of Gen IV reactors. Sci. Technol. Nucl. Install. 2016, 2016, 1687946. [Google Scholar] [CrossRef] [Scilit]
- Cheng, X.; Tak, N.I. Investigation on turbulent heat transfer to lead-bismuth eutectic flows in circular tubes for nuclear applications. Nucl. Eng. Des. 2006, 236, 385–393. [Google Scholar] [CrossRef] [Scilit]
- Ushakov, P.A.; Zhukov, A.V.; Matyukhin, N.M. Heat transfer to liquid metals in regular arrays of fuel elements. High Temp. 1977, 15, 868–873. [Google Scholar]
- Mikityuk, K. Heat transfer to liquid metal: Review of data and correlations for tube bundles. Nucl. Eng. Des. 2009, 239, 680–687. [Google Scholar]
- Barone, G.; Martelli, D.; Forgione, N. Implementation of lead-lithium as working fluid in RELAP5/Mod3.3. Fusion Eng. Des. 2019, 146, 1308–1312. [Google Scholar]
- Venturini, A.; Utili, M.; Forgione, N. Numerical simulations with RELAP5-3D and RELAP5/mod3.3 of the second experimental campaign on in-box LOCA transients for HCLL TBS. Energies 2021, 14, 4544. [Google Scholar] [CrossRef] [Scilit]
- Martelli, D.; Forgione, N.; Barone, G.; Di Piazza, I. Coupled simulations of the NACIE facility using RELAP5 and ANSYS Fluent codes. Ann. Nucl. Energy 2017, 101, 408–418. [Google Scholar] [CrossRef] [Scilit]
- Angelucci, M.; Martelli, D.; Barone, G.; Di Piazza, I.; Forgione, N. STH-CFD codes coupled calculations applied to HLM loop and pool systems. Sci. Technol. Nucl. Install. 2017, 2017, 1936894. [Google Scholar] [CrossRef] [Scilit]
- Kolev, N.I. Multiphase Flow Dynamics 4; Springer: Berlin/Heidelberg, Germany, 2012. [Google Scholar]
- Thorade, M.; Saadat, A. Partial derivatives of thermodynamic state properties for dynamic simulation. Environ. Earth Sci. 2013, 70, 3497–3503. [Google Scholar] [CrossRef] [Scilit]
- Prodanov, M. Mathematical analysis of the van der Waals equation. Phys. B Condens. Matter 2022, 640, 414077. [Google Scholar] [CrossRef] [Scilit]
- Seban, R.A.; Shimazaki, T.T. Heat transfer to a fluid flowing turbulently in a smooth pipe with walls at constant temperature. Trans. ASME 1951, 73, 803–809. [Google Scholar] [CrossRef] [Scilit]
- Kazimi, M.S.; Carelli, M.D. Heat Transfer Correlation for Analysis of CRBRP Assemblies; Westinghouse Report CRBRP-ARD-0034; Westinghouse Electric Corporation, Advanced Reactors Division: Madison, PA, USA, 1976. [Google Scholar]
- Hsu, C. Analytical study of heat transfer to liquid metals in cross-flow through rod bundles. Int. J. Heat Mass Transf. 1964, 7, 431–446. [Google Scholar] [CrossRef] [Scilit]



Disclaimer/Publisher’s Note: The statements, opinions and data contained in all publications are solely those of the individual author(s) and contributor(s) and not of MDPI and/or the editor(s). MDPI and/or the editor(s) disclaim responsibility for any injury to people or property resulting from any ideas, methods, instructions or products referred to in the content. |
© 2026 by the authors. Licensee MDPI, Basel, Switzerland. This article is an open access article distributed under the terms and conditions of the Creative Commons Attribution (CC BY) license.