


Abstract
Biochar (BC) is widely utilised to enhance methane production from the anaerobic digestion (AD) process due to its physicochemical properties. This study investigates the influence of biochar pretreatment on its behaviour and performance in AD systems. Pre-treated biochar derived from different feedstocks via slow pyrolysis was applied in Biochemical Methane Potential (BMP) tests at a dosage of 0.25% (w/v), and its impact on both the methane yield and digestion kinetics during cellulose degradation was evaluated. Pre-treatment was performed via steam autoclaving, serving as both a sterilisation and surface-modification step aimed at improving the physicochemical characteristics of biochar, particularly its capacity for microbial immobilisation. The results demonstrated that the effect of autoclave pretreatment on methane production was strongly feedstock-dependent. Autoclaved rice husk biochar (AC-RH550) markedly inhibited methane production, whereas autoclaved softwood biochar (AC-SW550) exhibited the best performance among all biochars tested, achieving the highest methane yield of 382.2 (mL CH4 g−1 VS), corresponding to an increase of 18.3% compared to non-pretreated SW550 and 9.2% relative to the control. This improvement is attributed to the modifications in biochar surface properties, promoting improved microbial activity and biofilm formation potentially improving direct interspecies electron transfer (DIET). Additionally, biochar may act as a buffering agent and provide adsorption sites for inhibitory intermediates such as VFA. Cell immobilisation experiments further confirmed that autoclaving enhanced biochar porosity and hydrophilicity, encouraging better colonisation and biofilm formation. Scanning electron microscopy (SEM) and microbial analyses verified increased cell attachment on pretreated biochars. Overall, these findings highlight the critical role of pretreatment in optimising biochar functionality for anaerobic digestion applications and cell immobilisation.
1. Introduction
Anaerobic digestion (AD) is a biological process that utilises microorganisms to convert biomass into biogas [1], primarily composed of methane (CH4) and carbon dioxide (CO2). It represents a promising approach to sustainable energy recovery, as the biogas produced can be used directly or upgraded to biomethane for heat and electricity generation, or used as a platform chemical in C1 chemistry, e.g., in the production of biofuels, bioplastics, and green fertilisers. However, AD performance is often hindered by factors such as prolonged lag phases, process instability, and inhibitory effects. The addition of biochar to anaerobic digesters, commonly referred to as ‘biochar augmentation’, has been widely reported to mitigate these limitations [2]. Biochar, a carbon-rich material derived from the pyrolysis of biomass, is characterised by a high specific surface area, a porous structure, and the presence of surface functional groups [3]. These properties enable biochar to enhance AD performance by providing microbial attachment sites, improving buffering capacities [4], and facilitating direct interspecies electron transfer (DIET) between syntrophic bacteria and methanogens [5], thereby improving methane yield and process stability. However, methane yield enhancement is highly dependent on biochar characteristics, including feedstock origin, pyrolysis conditions, physicochemical properties, and dosage.
A key challenge with biochar augmentation is the potential presence of residual inhibitory hydrocarbons adsorbed onto the biochar surface, which may confound experimental outcomes.
Residual compounds retained on biochar after pyrolysis, such as volatile organic compounds (VOCs) and polycyclic aromatic hydrocarbons (PAHs), may persist depending on pyrolysis temperature and feedstock, and are known to inhibit microbial activity [6]. Native microbiotas are not expected to survive the pyrolysis process itself, which has been reported to yield a sterile product free of pre-existing microbial populations [7]; any organisms detected on raw biochar would therefore reflect post-production environmental contamination rather than a native population. This is consistent with the absence of culturable colonies observed for raw biochar prior to immobilisation in this study (Section 3.8). Autoclaving was applied here primarily as a standardisation and sterilisation step, removing this source of experimental variability, while also imparting the physicochemical surface changes discussed in Section 3.2, Section 3.3 and Section 3.4. To address this, biochar pretreatment strategies have been proposed to standardise biochar properties and enhance their functionality. Thermal and steam treatment methods have been widely reported to enhance the physicochemical properties of biochar, including increases in surface area, pore development, and surface reactivity, as well as the removal of residual compounds formed during pyrolysis [8,9]. However, these approaches are typically conducted at elevated temperatures (generally > 300 °C), which can significantly alter the intrinsic structure of biochar. In contrast, mild steam-based treatments, such as autoclaving, operate at comparatively lower temperatures and pressures (typically < 160 °C and 4 bar). Such modifications may improve adsorption performance by increasing pore accessibility and facilitating interactions with microbial communities. Nevertheless, the influence of biochar autoclaving pretreatment on methane production during AD remains relatively underexplored.
Although autoclaving is not a conventional biochar activation method, it involves exposure to pressurised saturated steam at elevated temperatures within a sealed system and is primarily used for media sterilization purposes in microbiology [10]. In this study, autoclave treatment was primarily applied to eliminate microorganisms and standardise the biochar prior to application, enabling a more controlled assessment of its physicochemical effects on AD performance.
This study addresses a critical gap in the application of biochar for AD by evaluating autoclaving as a pretreatment strategy. Although biochar augmentation has been widely investigated, the specific effects of autoclave-induced modifications on biochar physicochemical properties and their influence on microbial interactions and methane production remain insufficiently understood.
The novelty of this work lies in several key contributions: (i) it establishes a direct link between autoclaving-induced changes in surface chemistry, pore structure, and functionality to biochar performance in biochemical methane potential (BMP) tests using cellulose as a model substrate; (ii) it provides a time-resolved assessment of microbial immobilisation on pretreated biochar, offering new insights into colonisation dynamics; and (iii) it experimentally distinguishes the dual role of biochar by decoupling its function as a physicochemical additive from its role as a microbial carrier through the use of immobilised biochar in inoculum-free systems.
2. Materials and Methods
2.1. Biochar and Inoculum
Biochars tested were sourced from the UK Biochar Research Centre (UKBRC) and produced using a slow pyrolysis reactor at various temperatures (softwood at 550 °C, SW550; rice husk at 550 °C, RH550; and two commercial biochars obtained from oakwood at 450 °C, OW450, and oakwood at 650 °C, OW650) produced by Proiniso, Malaga, Spain. The inoculum used for biochemical methane potential (BMP) tests and cell immobilisation was sourced from an anaerobic digester processing municipal sludge at the wastewater treatment plant (WWTP) in Esholt, Bradford, UK, and stored at 4 °C until use. The inoculum was sieved using a 1 mm sieve tray to thoroughly homogenise the particle size, then acclimated at 37 ± 1 °C in a water bath overnight before use.
A known mass of each biochar (1 g) was placed in a quartz tube and steam-sterilised in an autoclave (CertoClav, A-4050, Leonding, Austria) at 121 °C for 20 min. It was then left in the autoclave to cool, to prevent further contamination, before being added directly to the BMP reactors or inoculum in its post-autoclave state, without an intermediate drying step. Handling time was kept to a minimum to reduce the risk of recontamination. Biochar dosing for both BMP and immobilisation experiments was calculated on a dry-weight basis, so the retained moisture did not affect the biochar dose applied. The volume of the BMP reactor increased to 400 mL after the biochar was added. A known volume of inoculum was added to each biochar during immobilisation experiments. The level of moisture retained by the biochar after autoclaving, however, was not quantified in this study.
2.2. Inoculum-to-Substrate Ratio
The inoculum-to-substrate ratio (ISR) was maintained at 2:1 on a volatile solids (VS) basis by diluting samples to 5 g VS L−1 and the inoculum to 10 g VS L−1 with distilled water. A 200 mL aliquot of both the sample and the inoculum was added to each reactor. This ISR is to ensure stable anaerobic digestion conditions and minimise the risk of acidification [11]. Pure cellulose was used as a substrate across all experimental setups due to its well-defined composition and high biodegradability, enabling consistent comparison of results. Pretreated (autoclaved) biochar was added separately at specific dosages and was excluded from the ISR calculation, as it does not contribute biodegradable organic matter but instead functions as a support material for microbial immobilisation and enhances process performance.
2.3. Biochar Immobilisation
Biochar-cell immobilisation was performed via an adsorption strategy, whereby 10 g of biochar was mixed with 100 mL of activated inoculum at a biochar-to-inoculum ratio (BIR) of 1:10 (w/v), following the immobilisation approach described by Schommer et al. (2024) with slight modifications [12]. The mixture was incubated in a water bath at 37 °C and shaken at 120 rpm for 72 h to allow adsorption and microbial attachment onto the biochar surface and promote colonisation [13,14]. Following incubation, the supernatant was discarded, and the biochar was recovered by sieving through a 0.5 mm mesh and subsequent filtration to remove excess water. The biochar with immobilised cells (BIC) was then used directly in BMP assays to minimise oxygen exposure and preserve anaerobic microbial activity.
Microbial analysis was performed to evaluate the impact of pretreatment on cell density, quantified as colony-forming units per gram of biochar (CFU g−1). A 10% (w/v) sterile solution was prepared by adding 10 g of biochar samples to 100 mL, shaking for 30 min to detach loosely associated microorganisms. The resulting suspension was subjected to serial dilution, and 0.1 mL aliquots from appropriate dilutions were spread onto tryptone soya agar (TSA) plates, after which visible colonies were counted. It should be noted that TSA plate counts under the incubation conditions used here detect only culturable, TSA-compatible microorganisms and are not expected to capture strict anaerobes or methanogenic archaea, which generally require specialised anaerobic cultivation media and conditions. CFU g−1 values reported in this study should therefore be interpreted as an index of culturable heterotrophic colonisation rather than a measure of total or methanogenic microbial community size [15].
2.4. Biochemical Methane Potential (BMP) Tests
The Biochemical Methane Potential (BMP) test was carried out using the Automated Methane Potential Testing System (AMPTS II, Bioprocess Control, Lund, Sweden). The reactors were flushed with high-purity nitrogen gas to establish anaerobic conditions. All experiments were performed in duplicate under mesophilic conditions (37 ± 1 °C) in a temperature-controlled incubator.
2.4.1. Inoculum-Free BMP Assay Using Biochar-Immobilised Cells
To evaluate the effectiveness of biochar as a microbial carrier, a parallel inoculum-free BMP assay was conducted. In this condition, the activated inoculum was omitted entirely from the BMP reactors; instead, only the pre-immobilised BIC, prepared as described in Section 2.3, was added directly to the substrate with no additional inoculum supplied. Any biomethane production observed under these conditions would therefore be attributable solely to the microbial community retained on the biochar surface during the immobilization period, confirming biochar’s capacity to carry and deliver a functionally active anaerobic community.
2.4.2. Pretreated Autoclaved Biochar Addition in Inoculated BMP Assay
Pretreated OW650, RH550, and SW550 biochar were added at a concentration of 0.25% (w/v), corresponding to 1 g of biochar per 400 mL working volume in a 500 mL reactor (with 100 mL headspace). Blank reactors containing only inoculum (no substrate) were included to account for background methane production, while control reactors containing inoculum and substrate (0% biochar) were used to evaluate the effect of biochar addition. Distilled water was added as required to maintain a constant working volume in all reactors. Agitation was performed by an automated motor that mixed samples every 10 min, and the assays were conducted over 30 days. The cumulative methane yields measured by the AMPTS system were corrected by subtracting methane production from the blanks and expressed as millilitres of CH4 per gram of volatile solids added (mL CH4 g−1 VS).
2.5. Analytical Methods
Total solids (TS) and volatile solids (VS) were measured for both the inoculum and substrate, following the Standard Methods for the Examination of Water and Wastewater [16]. TS was determined by drying the samples in an oven at 105 °C overnight, while VS was obtained by ashing the samples at 550 °C for 2 h in a muffle furnace. pH was measured according to the literature by Singh et al. (2017) [17], where a 1:10 ratio (biochar to distilled water) was used to take the pH measurement, and the pH was recorded from the suspension using a pH meter (Hach, HQ40d, Loveland, CO, USA). Additionally, the pH of the BMP reactor mixture was measured before and after the experiment to assess the process stability and buffering effects of the biochar. Proximate analysis was determined by evaluating the thermal behaviour of biochar by gradually increasing the temperature in the absence of air using a thermogravimetric analyser (TGA) (Mettler Toledo, TGA/DSC, Greifensee, Switzerland). Quantification of elemental abundance in a biochar sample was achieved through compositional ultimate analysis using an elemental analyser (Thermo Scientific, Flash 2000, Waltham, MA, USA). The O content was determined by the difference, following Equation (1).
Fourier-transform infrared spectroscopy (FTIR) (Bruker Vertex V80, Ettlingen, Germany) was conducted using the Attenuated Total Reflectance (ATR) method (in the range 800–4000 cm−1) to identify functional groups on the biochar surface before and after the autoclaving treatment. The specific surface area of the biochar was determined using the Brunauer–Emmett–Teller (BET), while pore size distribution and pore volume were analysed using the Density Functional Theory (DFT) method, based on gas adsorption measurements obtained with the Anton Paar Nova 800 analyser (Boynton Beach, FA, USA). X-ray Photoelectron Spectroscopy (XPS) (Enviro ESCA™, Berlin, Germany) was used to elucidate the elemental composition and chemical bonding states of biochar before and after pretreatment by providing the XPS survey spectra. Scanning electron microscopy (SEM) (Carl Zeiss EVO MA15 SEM, Oberkochen, Germany and Hitachi SU8230 FESEM, Tokyo, Japan) was used to examine the surface morphology of biochar using multiple magnifications following vacuum sputter-coating with gold and chromium.
2.6. Kinetic Modelling
The theoretical biochemical methane potential (BMPth) of the substrate was calculated based on stoichiometric conversion using Buswell and Mueller’s equation, combined with Boyle’s equation (Equation (2)), assuming complete conversion of biodegradable organic matter into CH4 and CO2 [18,19]. Under standard conditions (0 °C, 1 atm), 1 mol of gas occupies 22,400 mL.
where n, a, b, and c represent the molar fractions of carbon, hydrogen, oxygen and nitrogen in the substrate, respectively. BMPth for cellulose is calculated to be 411.2 mL g−1 VS and utilised in the calculations.
The anaerobic biodegradability index (BI), which reflects the extent of substrate conversion relative to the theoretical yield, was calculated using Equation (3) to quantify methane conversion efficiency [20]:
where BMPexp is the experimentally measured methane yield.
To evaluate the methane production kinetics, cumulative methane production data were fitted to the Modified Gompertz model (Equation (4)), which accounts for lag phase and methane production rate [21]:
where BMP(t) is the cumulative methane production at time t (mL CH4 g−1 VS), BMPmax is the maximum methane potential (mL CH4 g−1 VS), Rmax is the maximum methane production rate (mL CH4 g−1 VS d−1), λ is the lag phase duration, t is the digestion time, (d) and e is the Euler’s number (2.718). Model parameters BMPmax, Rmax, and λ were estimated using nonlinear regression via the least-squares method implemented in Microsoft Excel Solver.
The peak time (Tm), corresponding to the maximum methane production rate, was calculated using Equation (5) [22]:
The technical digestion time (T80) is the time required to achieve 80% of the maximum methane potential. This parameter was determined from cumulative methane production data. Where the exact value was not directly observed, T80 was estimated by linear interpolation between adjacent data points. This parameter provides a practical indicator of substrate conversion rate and process performance.
Model performance and goodness of fit were evaluated using the coefficient of determination (R2). The derived kinetic parameters provide insight into substrate biodegradability, microbial adaptation time, and methane production dynamics during anaerobic digestion.
2.7. Statistical Analysis
To assess the effects of feedstock and pretreatment on BMPmax, Rmax, and T80, a two-way ANOVA (Feedstock × Pretreatment) was performed for each parameter using duplicate measurements per condition (OriginPro 2025 SR1, OriginLab Corporation, Northampton, MA, USA). Where a significant main effect or interaction was identified (p < 0.05), Tukey’s HSD test was applied as a post-hoc comparison. Given the limited replication (n = 2 per condition), these results should be interpreted alongside the effect sizes reported rather than significance alone.
3. Results and Discussion
3.1. Characterisation of Biochar
Characterisation of the inoculum, substrate, and different biochar types is presented in Table 1 and includes the ultimate and proximate analyses, total solids (TS), volatile solids (VS), and pH. VS and TS analyses were conducted to quantify organic and total matter in both the inoculum and the substrate, thereby facilitating the calculation of the ISR. The full set of analysis was only performed for the different biochar samples, and the substrate and inoculum were not completely analysed. The essential information, such as TS and VS, required to set up BMP tests was analysed for both the inoculum and the substrate.
Table 1.
Characteristics of inoculum, substrate, and biochar. Data presented on a dry basis (db).
These analyses provided essential baseline data for evaluating material properties prior to BMP experiments.
Biochar samples were further characterised before and after steam autoclaving to assess physicochemical changes. Fourier-transform infrared spectroscopy (FTIR) and X-ray photoelectron spectroscopy (XPS) were used to investigate changes in surface functionality, while CO2 adsorption and desorption measurements were performed to evaluate micropore structure and pore volume. Microbial analysis was conducted to quantify microbial density. Detailed results of these analyses are discussed in the following sections.
3.2. Fourier-Transform Infrared Spectroscopy (FTIR)
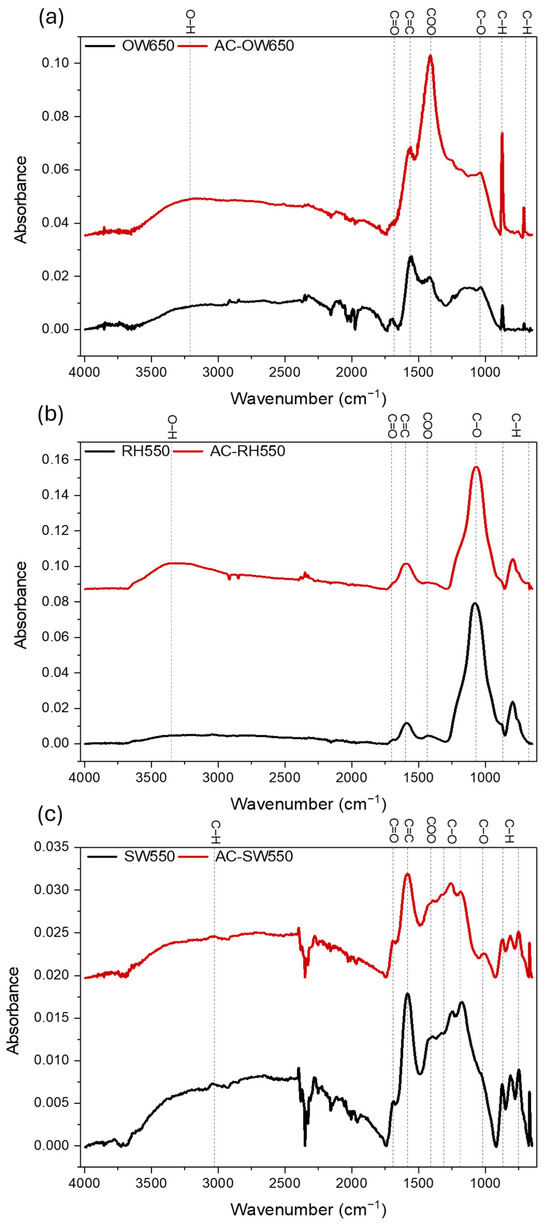
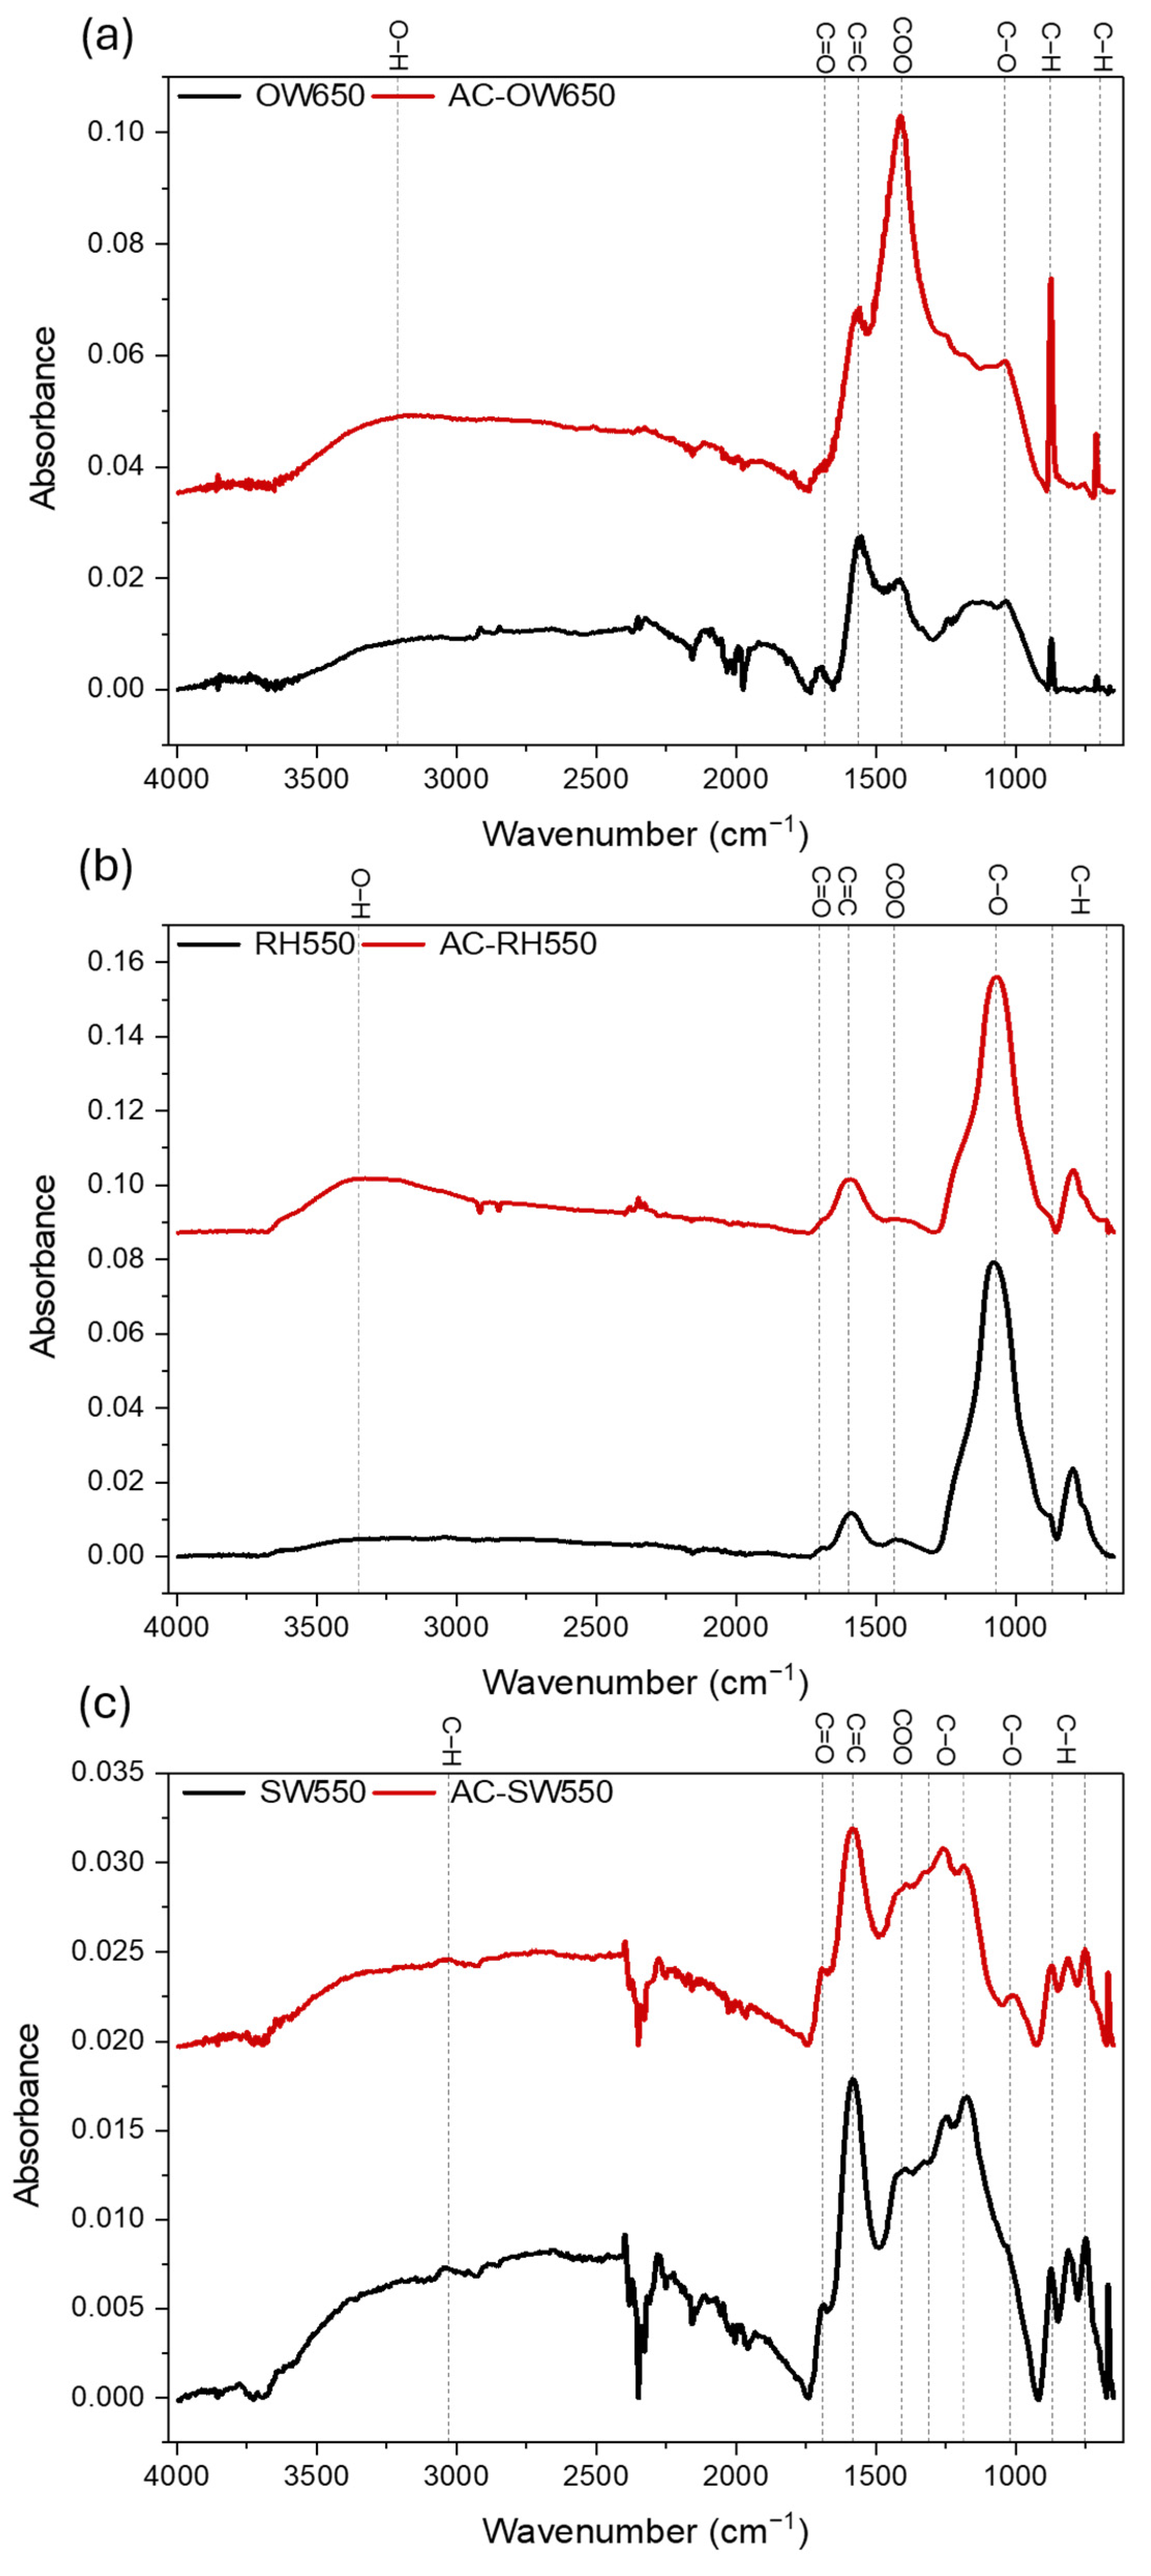
FTIR spectra of the biochar samples before and after autoclaving pretreatment are presented in Figure 1 for oakwood, softwood, and rice husk biochars. Overall, the spectra exhibit similar profiles before and after treatment, indicating that autoclaving did not substantially alter the fundamental chemical structure of the biochars. However, slight variations in peak intensity were observed, suggesting minor modifications in surface functional groups.
Figure 1.
Fourier transform infrared spectroscopy (FTIR) spectra of non-autoclaved and autoclaved biochar. (a) Oakwood biochar produced at 650 °C, (b) rice husk biochar produced at 550 °C, and (c) softwood biochar produced at 550 °C.
In the oakwood biochar (Figure 1a), the spectra are dominated by a prominent band in the region of 1580–1600 cm−1, which is primarily attributed to the aromatic C=C vibrations, or in some cases, C=O vibrations, confirming the presence of aromatic structures [23]. Following pretreatment, a slight reduction in the intensity of this range can be observed, suggesting a minor modification in the surface chemistry, likely associated with interactions between steam and surface functional groups rather than degradation of aromatic carbon framework. In addition, an increase in peak intensity in the region of 1400 cm−1 may indicate a modest contribution from oxygenated functional groups (OFGs) such as carboxylate (COO−) species, potentially formed or enhanced during steam autoclaving.
In the case of rice husk biochar (Figure 1b), a more pronounced O-H stretching peak (3400 cm−1) was observed after autoclaving, indicating the possible adsorption of moisture resulting from steam exposure [10]. The prominent peak at 1070 cm−1 corresponding to Si-O and Si-O-Si vibrations remained largely unchanged after treatment, reflecting the stability of silica-rich structures in rice husk [24,25].
In the softwood biochar spectra (Figure 1c), weak features appearing in the region of 1150 and 1260 cm−1 after autoclaving may be attributed to C-O-C stretching and C-O asymmetric stretching vibrations, which are commonly associated with OFGs such as ethers, phenols, and esters [26]. A strong peak observed at approximately 1580–1600 cm−1 is attributed to aromatic C=C skeletal vibration, characteristic of a highly carbonised structure. A slight reduction in the absorbance of this band after autoclaving suggests a minor alteration in surface chemistry, potentially due to hydration effects or interactions between steam and surface functional groups, rather than degradation of the aromatic carbon framework [27]. Consistent with the other biochars, a slight decrease in the intensity of the aromatic band around 1600 cm−1 was observed after autoclaving, indicating a common trend across all samples. Additionally, the band near 3049 cm−1 indicates aromatic C-H stretching vibrations, further confirming the existence of stable aromatic structures in the biochar matrix.
Overall, the results indicate that steam autoclaving induced minor surface-level modifications, particularly in OFGs and adsorbed moisture, while preserving the stable aromatic carbon structure. Such changes may increase the surface polarity and could favour microbial immobilisation of biochar in anaerobic digestion systems.
3.3. X-Ray Photoelectron Spectroscopy (XPS)
XPS analysis was conducted using the EnviroESCA™ system to characterise the surface chemistry of the biochars under near-ambient pressure conditions. XPS was used to determine the elemental composition of the outermost surface (5–10 nm) by analysing the integrated peak areas. The XPS spectra of C 1s and O 1s were analysed using CasaXPS (Version 2.3.25PR1.0).
Table 2 presents the surface atomic percentage and O/C ratios of the biochar samples before and after autoclave pretreatment. Following autoclaving pretreatment, an increase in oxygen content was observed for RH550 and SW550, but not for OW650. The results indicate that carbon was the dominant surface element in all biochars, with atomic concentrations ranging from 82.6 to 94.6%, while oxygen was the second most abundant element. Minor quantities of calcium were also detected in some samples, likely originating from mineral components present in the original biomass feedstocks. Such mineral constituents are frequently observed in lignocellulosic biochar and may contribute to surface alkalinity and catalytic activity in anaerobic digestion systems, as well as microbial growth [4].
Table 2.
Atomic ratio of surface elements (expressed as %) for biochar samples derived from XPS survey.
Variations in the surface oxygen content were observed in non-autoclaved and autoclaved biochars. For instance, the O/C ratio increased from 0.08 to 0.15 in RH550, suggesting partial surface oxidation or exposure of previously inaccessible OFGs. In contrast, OW650 showed a small decrease in the O/C ratio from 0.18 to 0.14, indicating that the effect of pretreatment on surface chemistry may depend on the original feedstock characteristics and mineral composition. Similar behaviour has been reported in previous studies, in which mild steam exposure resulted in a minor redistribution of oxygenated surface groups rather than substantial chemical transformation [24]. This behaviour can be attributed to the interaction of saturated steam with reactive carbon sites on the biochar surface during autoclaving, whereby steam selectively interacts with disordered surface regions, partially oxidising them and redistributing oxygen-containing functional groups [28]. Through this mechanism, loosely bound hydrocarbons or mineral residues may be removed, thereby exposing reactive surface sites that can interact with oxygen [29]. It is noted that the survey-level oxygen increase reported here reflects the total surface O content, whereas the C 1s deconvolution (Table 3) shows a decrease in specific oxygen-containing carbon functionalities (C-O, C=O) for the same samples. These are not necessarily contradictory: the survey scan captures all oxygen species present at the surface, including mineral-bound oxygen and adsorbed moisture, while the C 1s fit isolates oxygen bonded specifically to carbon. A decline in carbon-bound oxygen functionalities can therefore coincide with an increase in total surface oxygen if the additional oxygen is associated with non-carbon surface species, such as adsorbed moisture, rather than organic functional groups [30].
Table 3.
Relative distribution of carbon surface functional groups (%) obtained from deconvolution of high-resolution C 1s spectra of selected biochars.
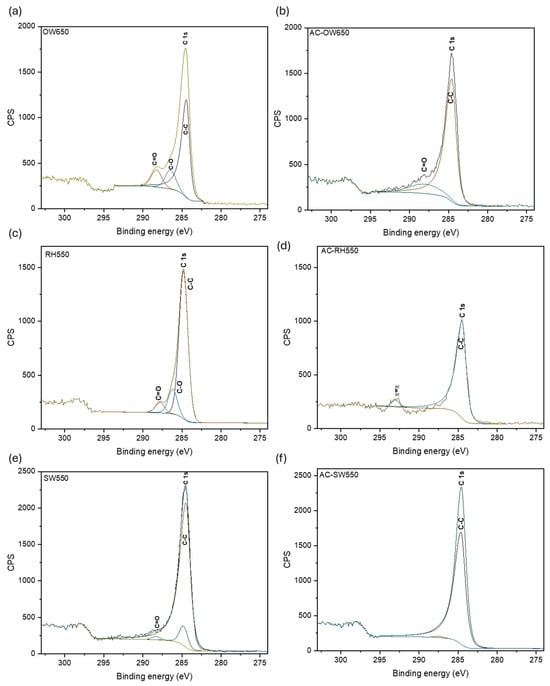
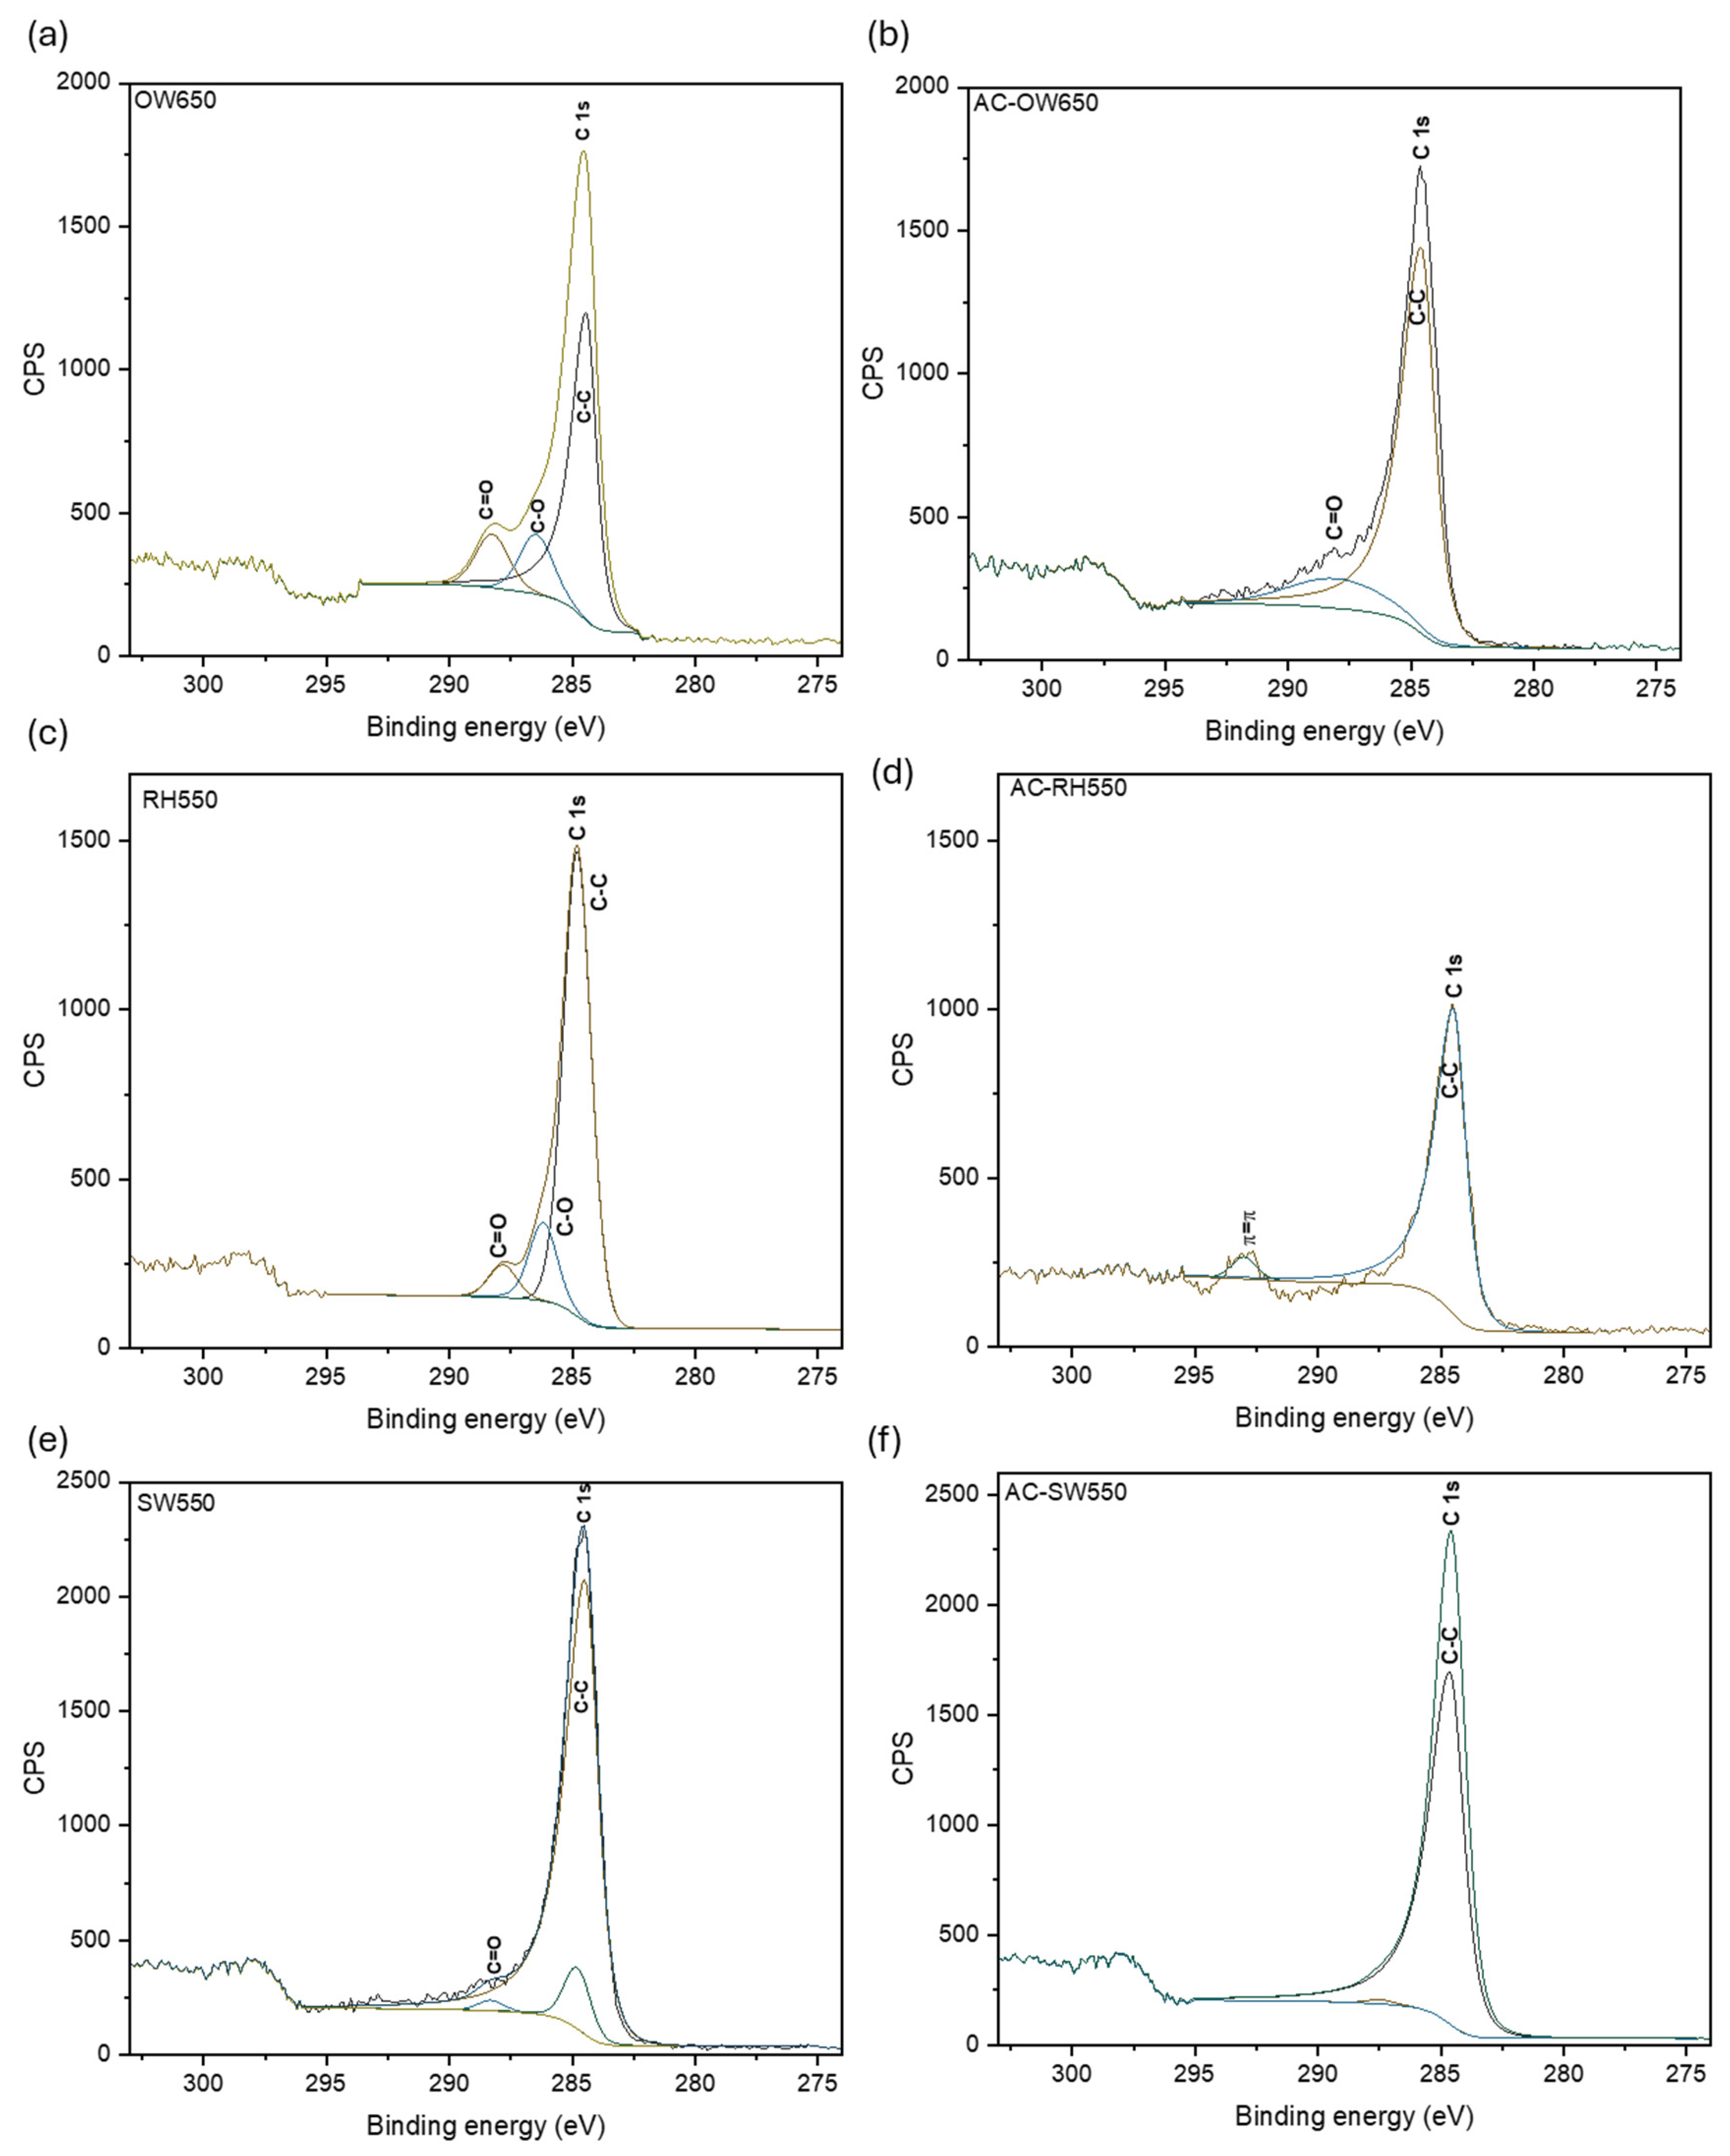
The high-resolution C 1s spectra of the selected biochars before and after pretreatment are presented in Figure 2, while the relative distribution of carbon surface functional groups obtained from spectral deconvolution is presented in Table 3. All spectra exhibited a dominant peak centred at approximately 284.6–284.8 eV, corresponding to C-C/C=C bonds associated with aromatic carbon structures [31]. The persistence of this peak across the samples, both before and after autoclaving, indicates that the aromatic carbon framework remained unchanged. Minor components at higher binding energies were assigned to OFGs, including C-O (286 eV) and C=O (287–288 eV) groups [32]. For OW650, the relative contribution of the C-C/C=C component increased from 88.74% to 91.34% after pretreatment, while the C=O component was no longer detected.
Figure 2.
High-resolution C 1s XPS spectra of selected biochar samples before and after autoclave pretreatment: (a) OW650, (b) AC-OW650, (c) RH550, (d) AC-RH550, (e) SW550, and (f) AC-SW550.
SW550 showed a reduction in oxygen-containing peaks in the C 1s region. The C-O contribution decreased from 0.54% to undetectable levels, resulting in a spectrum dominated almost entirely by aromatic carbon. A similar trend was observed for RH550. The untreated sample contained oxygen-related components (C-O: 13.93% and C=O: 5.42%). However, following autoclave treatment (Figure 2d), these components were no longer present in the fitted spectrum. Instead, a π–π* satellite peak appears at a higher binding energy (291–292 eV), characteristic of conjugated aromatic systems and indicating a relatively high degree of carbonisation of the biochar surfaces, consistent with the polyaromatic nature of biochar [28,33,34].
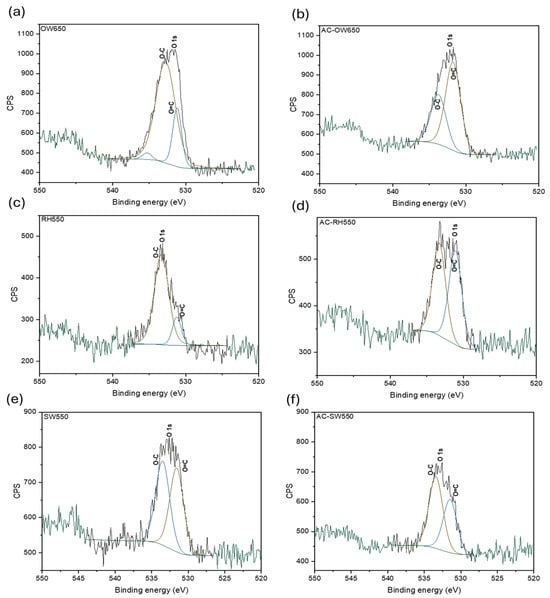
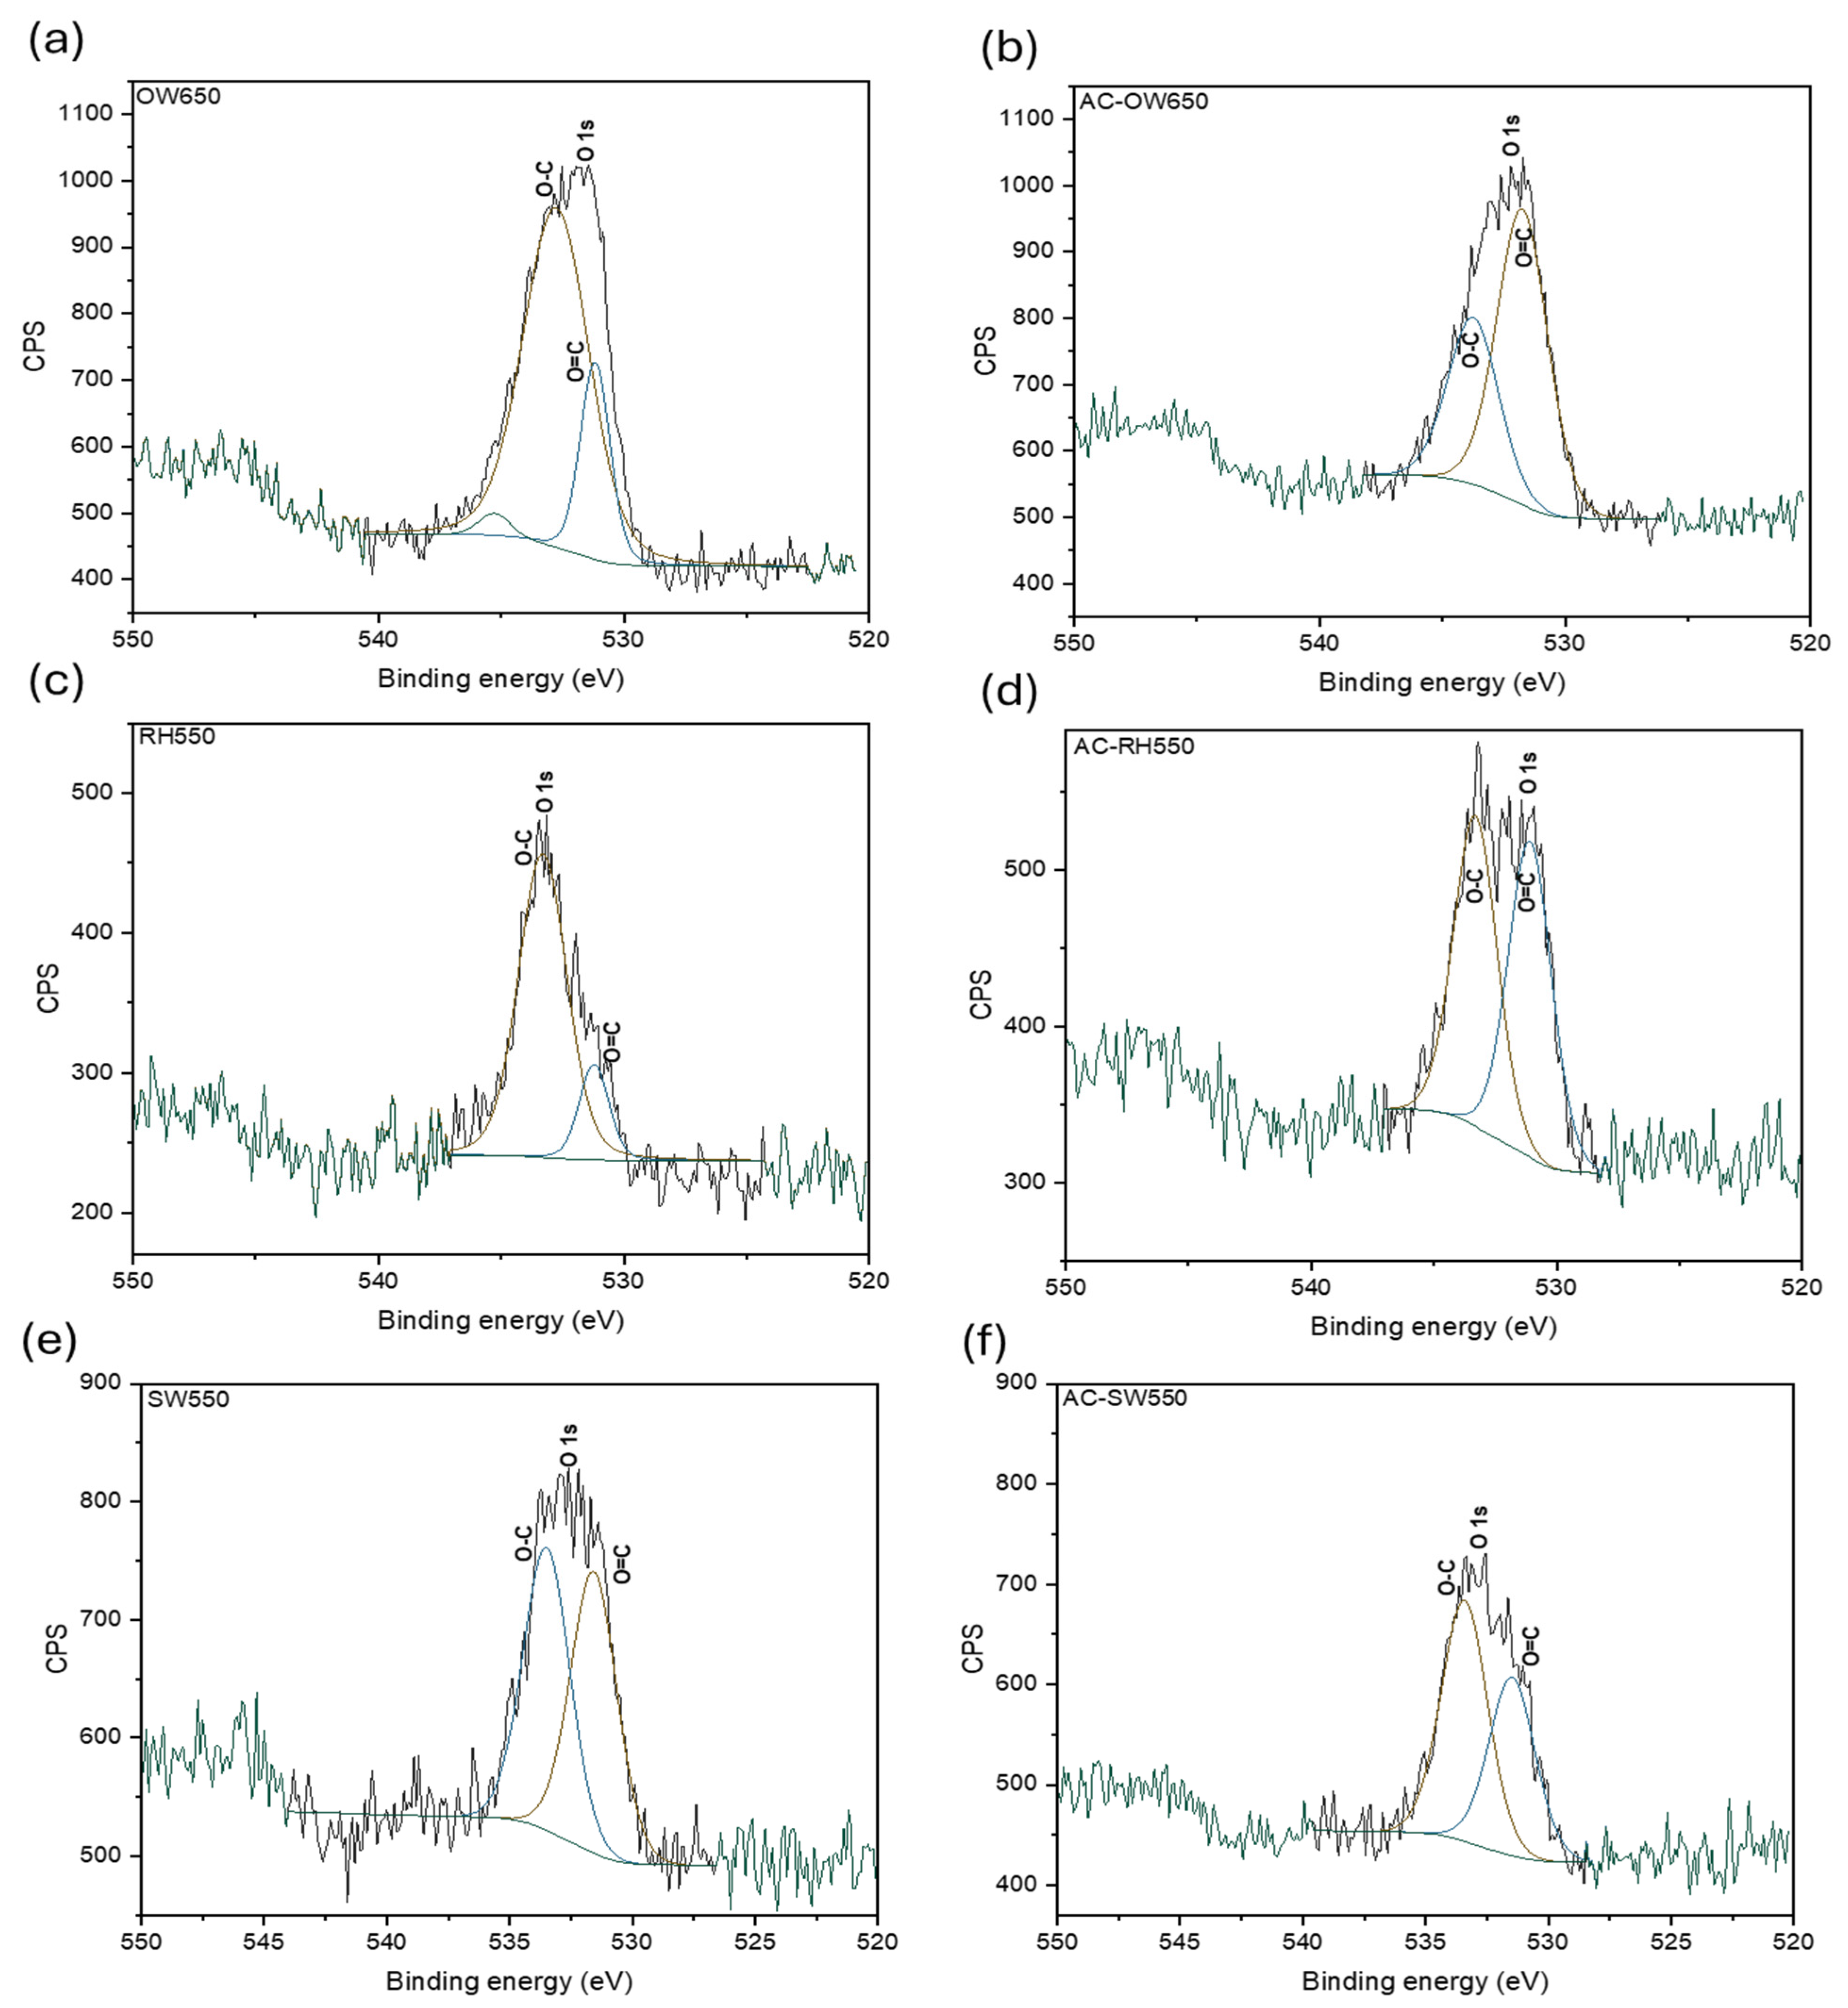
The high-resolution O 1s spectra of the biochar samples are presented in Figure 3 and provide further insight into surface oxygen species. The spectra exhibited broad envelopes that were deconvoluted into multiple components. Peaks at approximately 531.0–531.8 eV were assigned to carbonyl groups (O=C). Those at 532.2–533.0 eV were attributed to a single-bonded oxygen species (O-C), such as hydroxyl, phenolic, and ether groups. A higher binding energy of 533.0–534.0 eV may be associated with carboxyl or ester groups (O-C=O) and may also include adsorbed oxygenated species or moisture on the biochar surface [24,35].
Figure 3.
High-resolution O 1s XPS spectra for biochar samples: (a) OW650, (b) AC-OW650, (c) RH550, (d) AC-RH550, (e) SW550, and (f) AC-SW550.
Following pretreatment, notable changes in the relative abundance of OFGs were observed. For OW650, the contribution of O=C increased substantially from 20.95% to 64.00%, accompanied by a corresponding decrease in O-C species. A similar trend was observed for RH550, indicating a shift towards more oxidised surface functionalities post-treatment. It is noted that the O 1s spectrum for untreated RH550 was charge-referenced approximately 0.7 eV differently from the other spectra in this comparison set (Calib. reference 286.34 eV, versus 285.62–285.67 eV for the remaining C 1s and O 1s spectra), which limits direct quantitative comparison between the C 1s and O 1s datasets for this specific sample. Independent of this calibration difference, the relative proportion of the higher-binding-energy O 1s component (O=C) increased substantially following autoclaving, from 20.6% to 50.5% of the fitted O 1s area (Table 4), indicating a genuine shift in surface oxygen speciation accompanies pretreatment for this feedstock. The same calibration check was performed for SW550 and AC-SW550, which showed no comparable discrepancy (calibration references within 0.14–0.37 eV of each other), consistent with the smaller, directionally opposite change in O=C content observed for this feedstock (Table 4). In contrast, SW550 exhibited different behaviour, with a decrease in O=C content and a relative increase in O-C. However, the change in SW550 was relatively small compared to the other biochars. The relative distribution of the fitted O 1s components is summarised in Table 4.
Table 4.
Relative distribution of oxygen surface functional groups (%) obtained from deconvolution of high-resolution O 1s spectra of selected biochar.
Overall, the results indicate that steam exposure modifies the surface chemistry of biochars and alters the relative abundances of oxygen-containing functional groups detected by XPS, rather than removing them entirely [36,37].
3.4. Surface Area and Pore Volume
The surface area and pore characteristics of the biochar samples were analysed using the Brunauer–Emmett–Teller (BET) method and density functional theory (DFT) modelling.
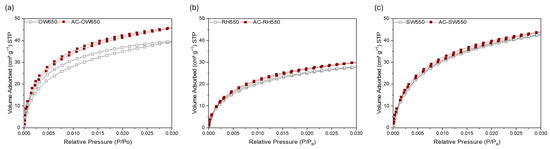
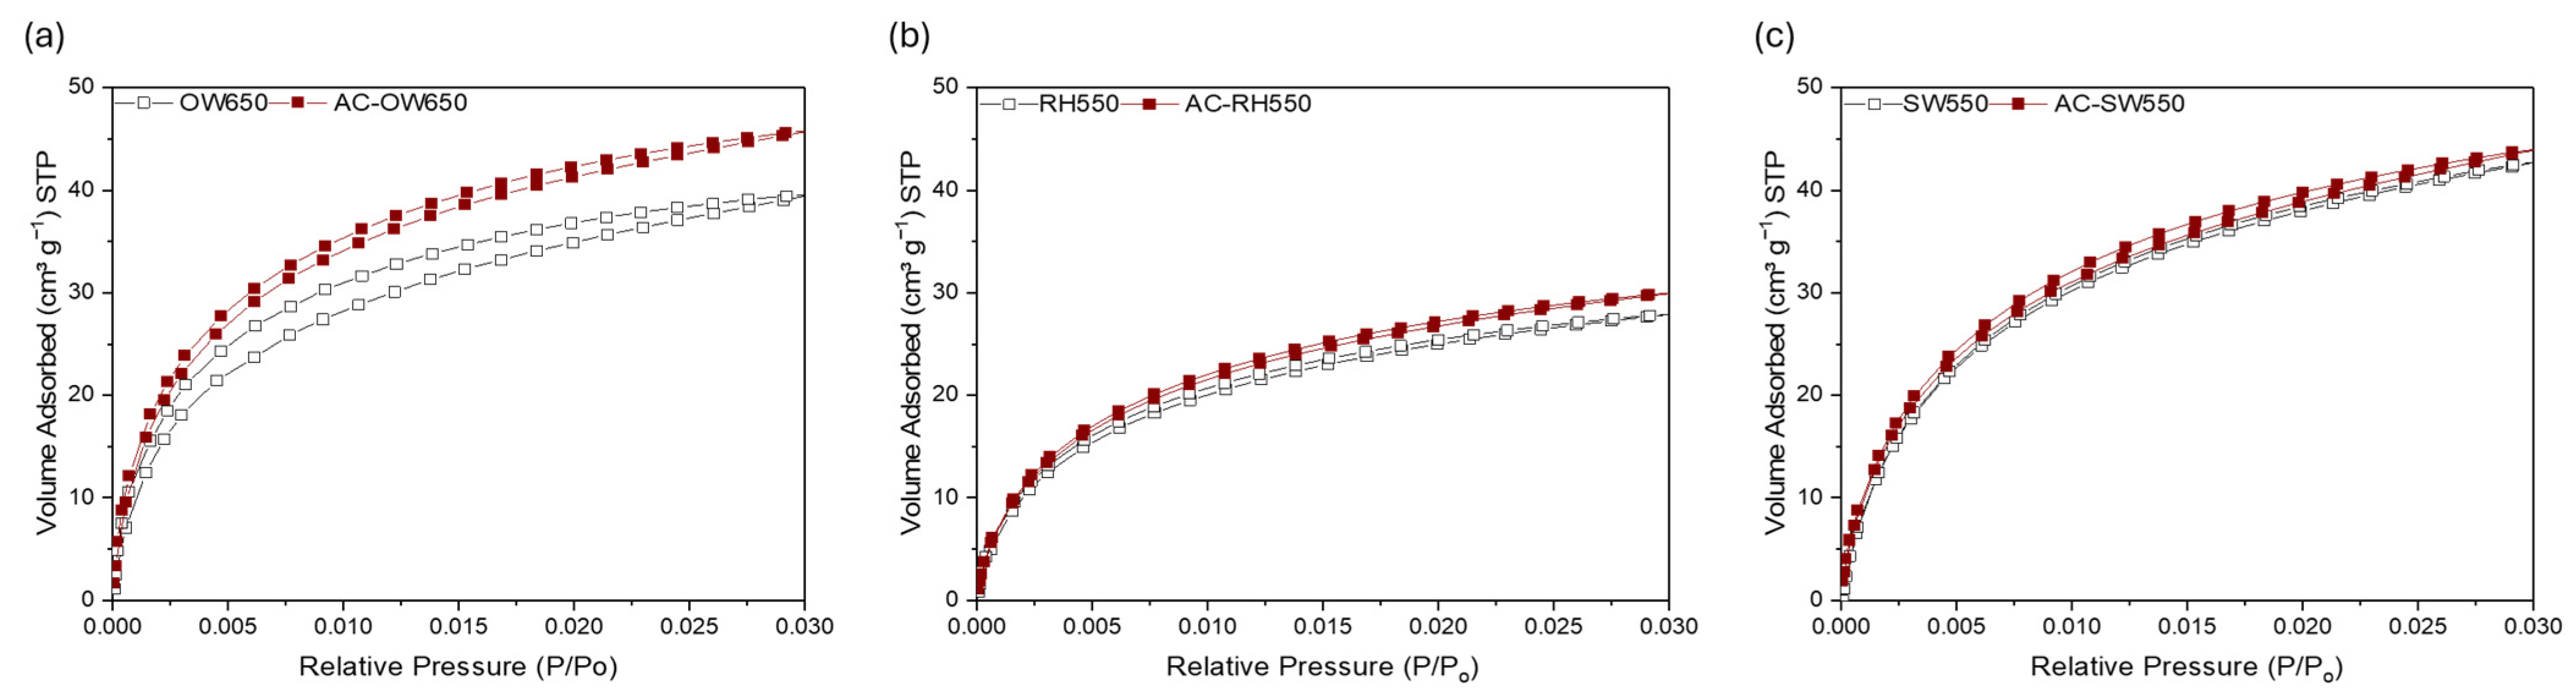
Figure 4 presents the isotherms of CO2 adsorption–desorption of the biochar samples. Adsorption isotherms describe the relationship between the amount of CO2 adsorbed and the equilibrium pressure. The samples were initially degassed under vacuum at 120 °C for 16 h before CO2 was introduced at 273 K. The pressure was gradually increased to measure the amount of CO2 adsorbed at each relative pressure (P/P0). The pressure is gradually reduced to obtain the desorption curve, and the isotherm curves are obtained.
Figure 4.
Carbon dioxide (CO2) gas adsorption isotherms for the biochar samples before and after autoclave pretreatment: (a) oakwood (OW650), (b) rice husk (RH550), and (c) softwood (SW550).
Figure 4 shows that the adsorption isotherm for autoclaved biochars consistently lies above that of raw biochar, indicating a higher CO2 adsorption capacity and increased pore volume and surface area.
The pore characteristics of the biochar were determined using the DFT method (Table 5). All tested biochars exhibited increases in both micropore volume and specific surface area following pretreatment. This behaviour suggests that exposure to saturated steam during autoclaving may enhance pore accessibility. Similar observations have been reported in previous studies, where the steam modification method was shown to enhance the surface area of biochars without significantly altering their overall pore structure [38].
Table 5.
Pore volume and surface area of biochars from the DFT analysis of CO2 at 273K adsorption/desorption isotherms.
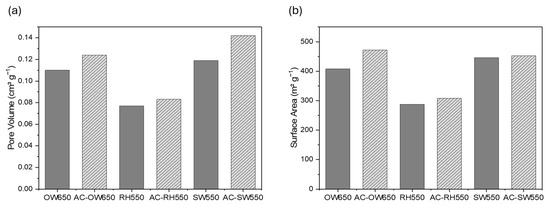
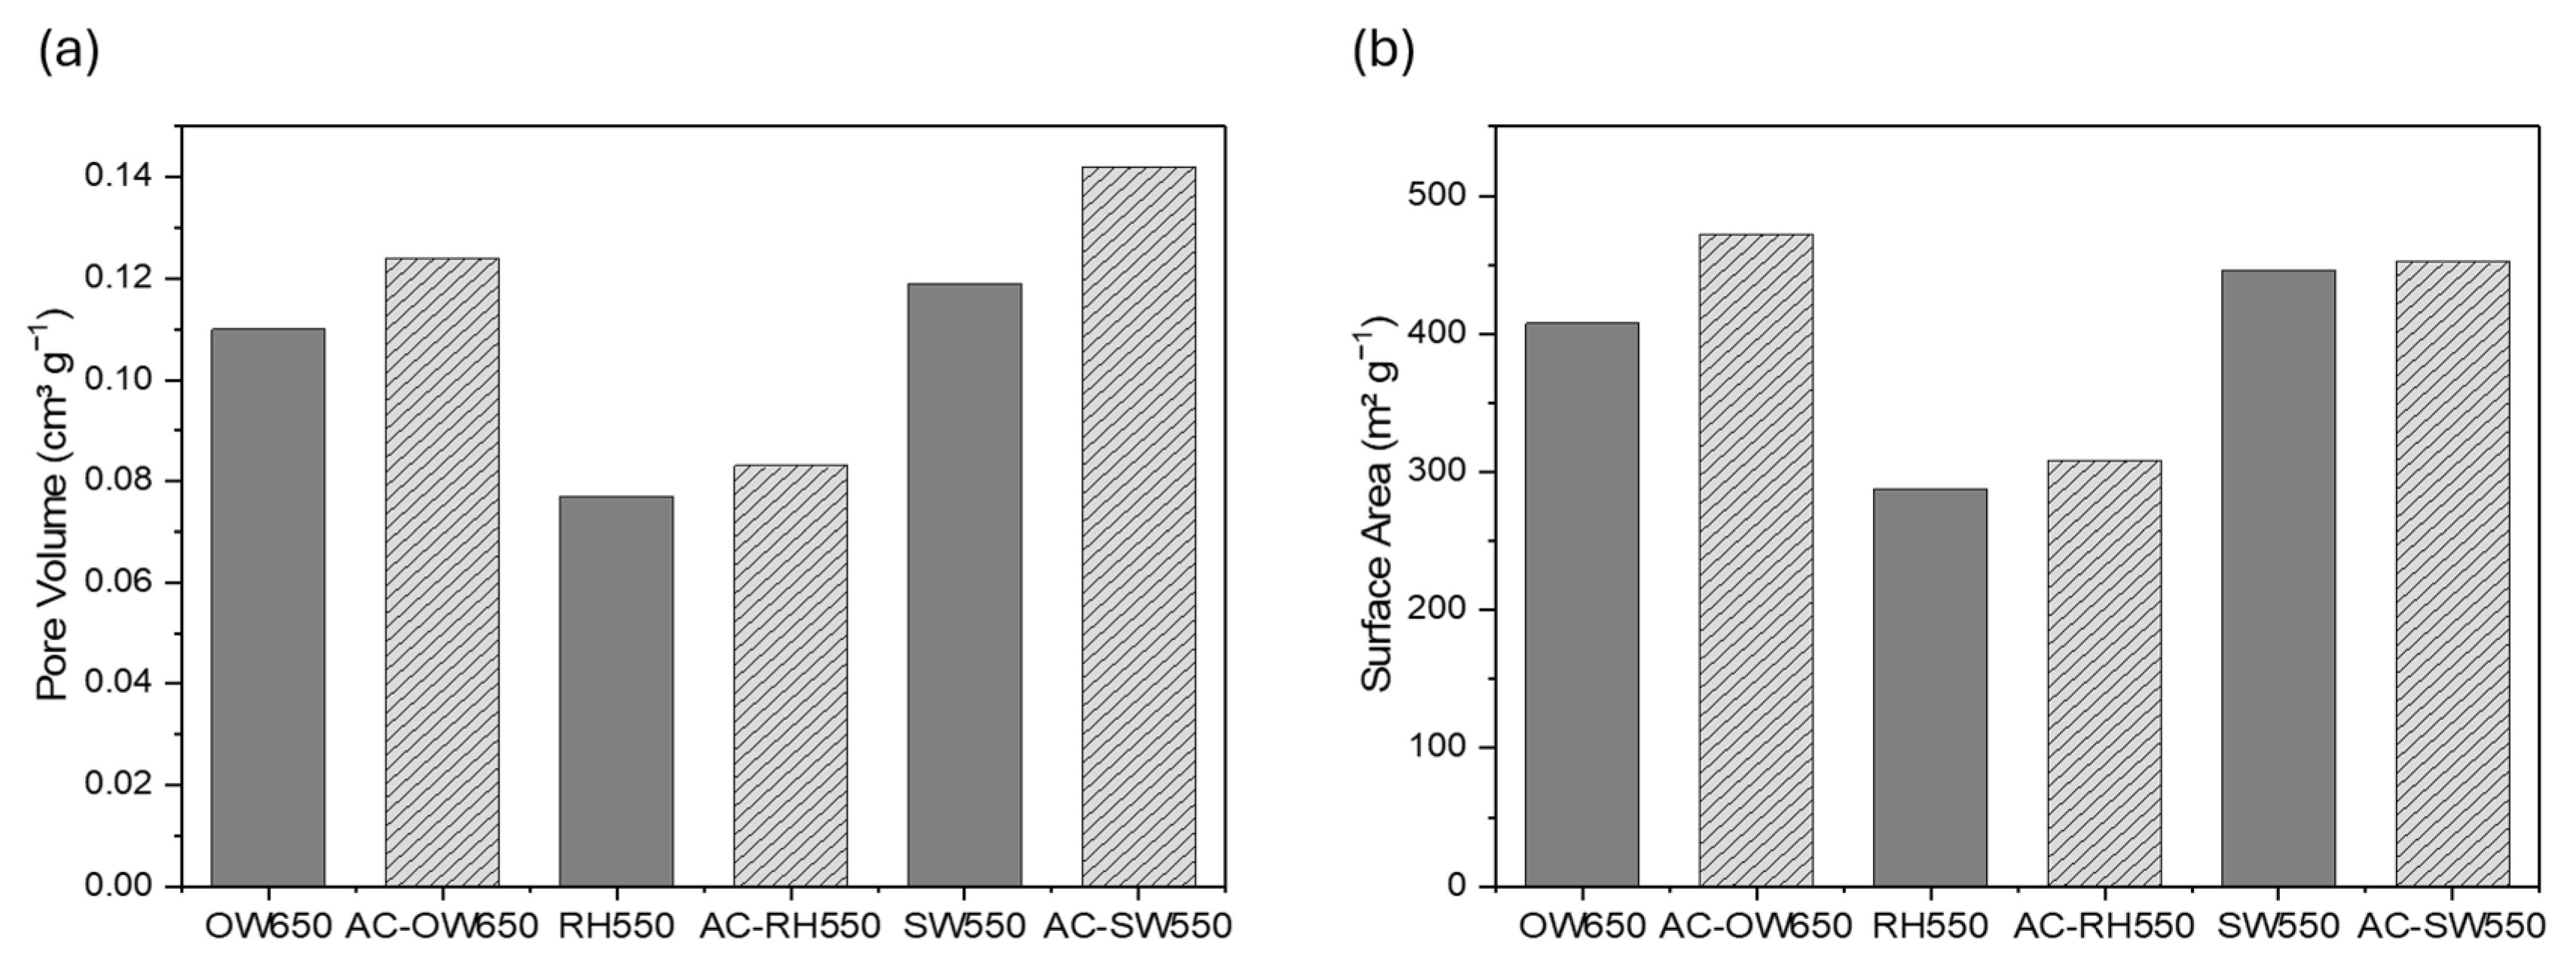
Among the analysed samples, OW650 showed the most pronounced increase in pore development, with the surface area increasing from 405.58 to 472.37 m2 g−1 and the pore volume increasing from 0.110 to 0.124 cm3 g−1. This indicates that autoclaving may have enhanced pore accessibility by removing pore-blocking residues [39]. Given that the pore widths identified here are predominantly ultramicropores (below 0.7 nm), with only a minor contribution from wider (supermicropore) widths near 0.8 nm, and typical dimensions of methanogens being higher than 1 µm, these pores are not likely to be accessible for direct microbial penetration. Instead, increased pore volume and surface area more plausibly enhance biochar’s capacity for gas and nutrient adsorption and increase the availability of external surface sites for microbial attachment, rather than enabling cells to penetrate the pore network itself [40]. SW550 exhibited a minimal increase in surface area (446.21 to 449.69 m2 g−1), but a more noticeable increase in pore volume (0.119 to 0.132 cm3 g−1), indicating that autoclaving primarily affected micropore accessibility rather than overall surface area. The relatively high values for SW550 suggest that its porous structure was already well developed, making it a favourable candidate as a carrier material for the following experiments. A similar but less pronounced trend was observed for RH550, where both surface area and pore volume increased after pretreatment. The trends in Table 5 are illustrated in Figure 5, where the differences between untreated and autoclaved samples are more clearly visualised.
Figure 5.
Comparison of (a) pore volume and (b) surface area derived from biochar samples before and after autoclave pretreatment.
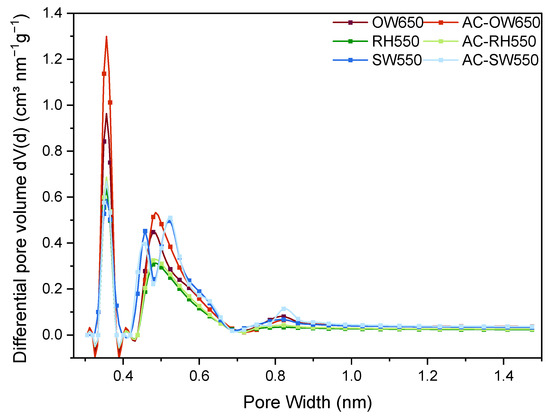
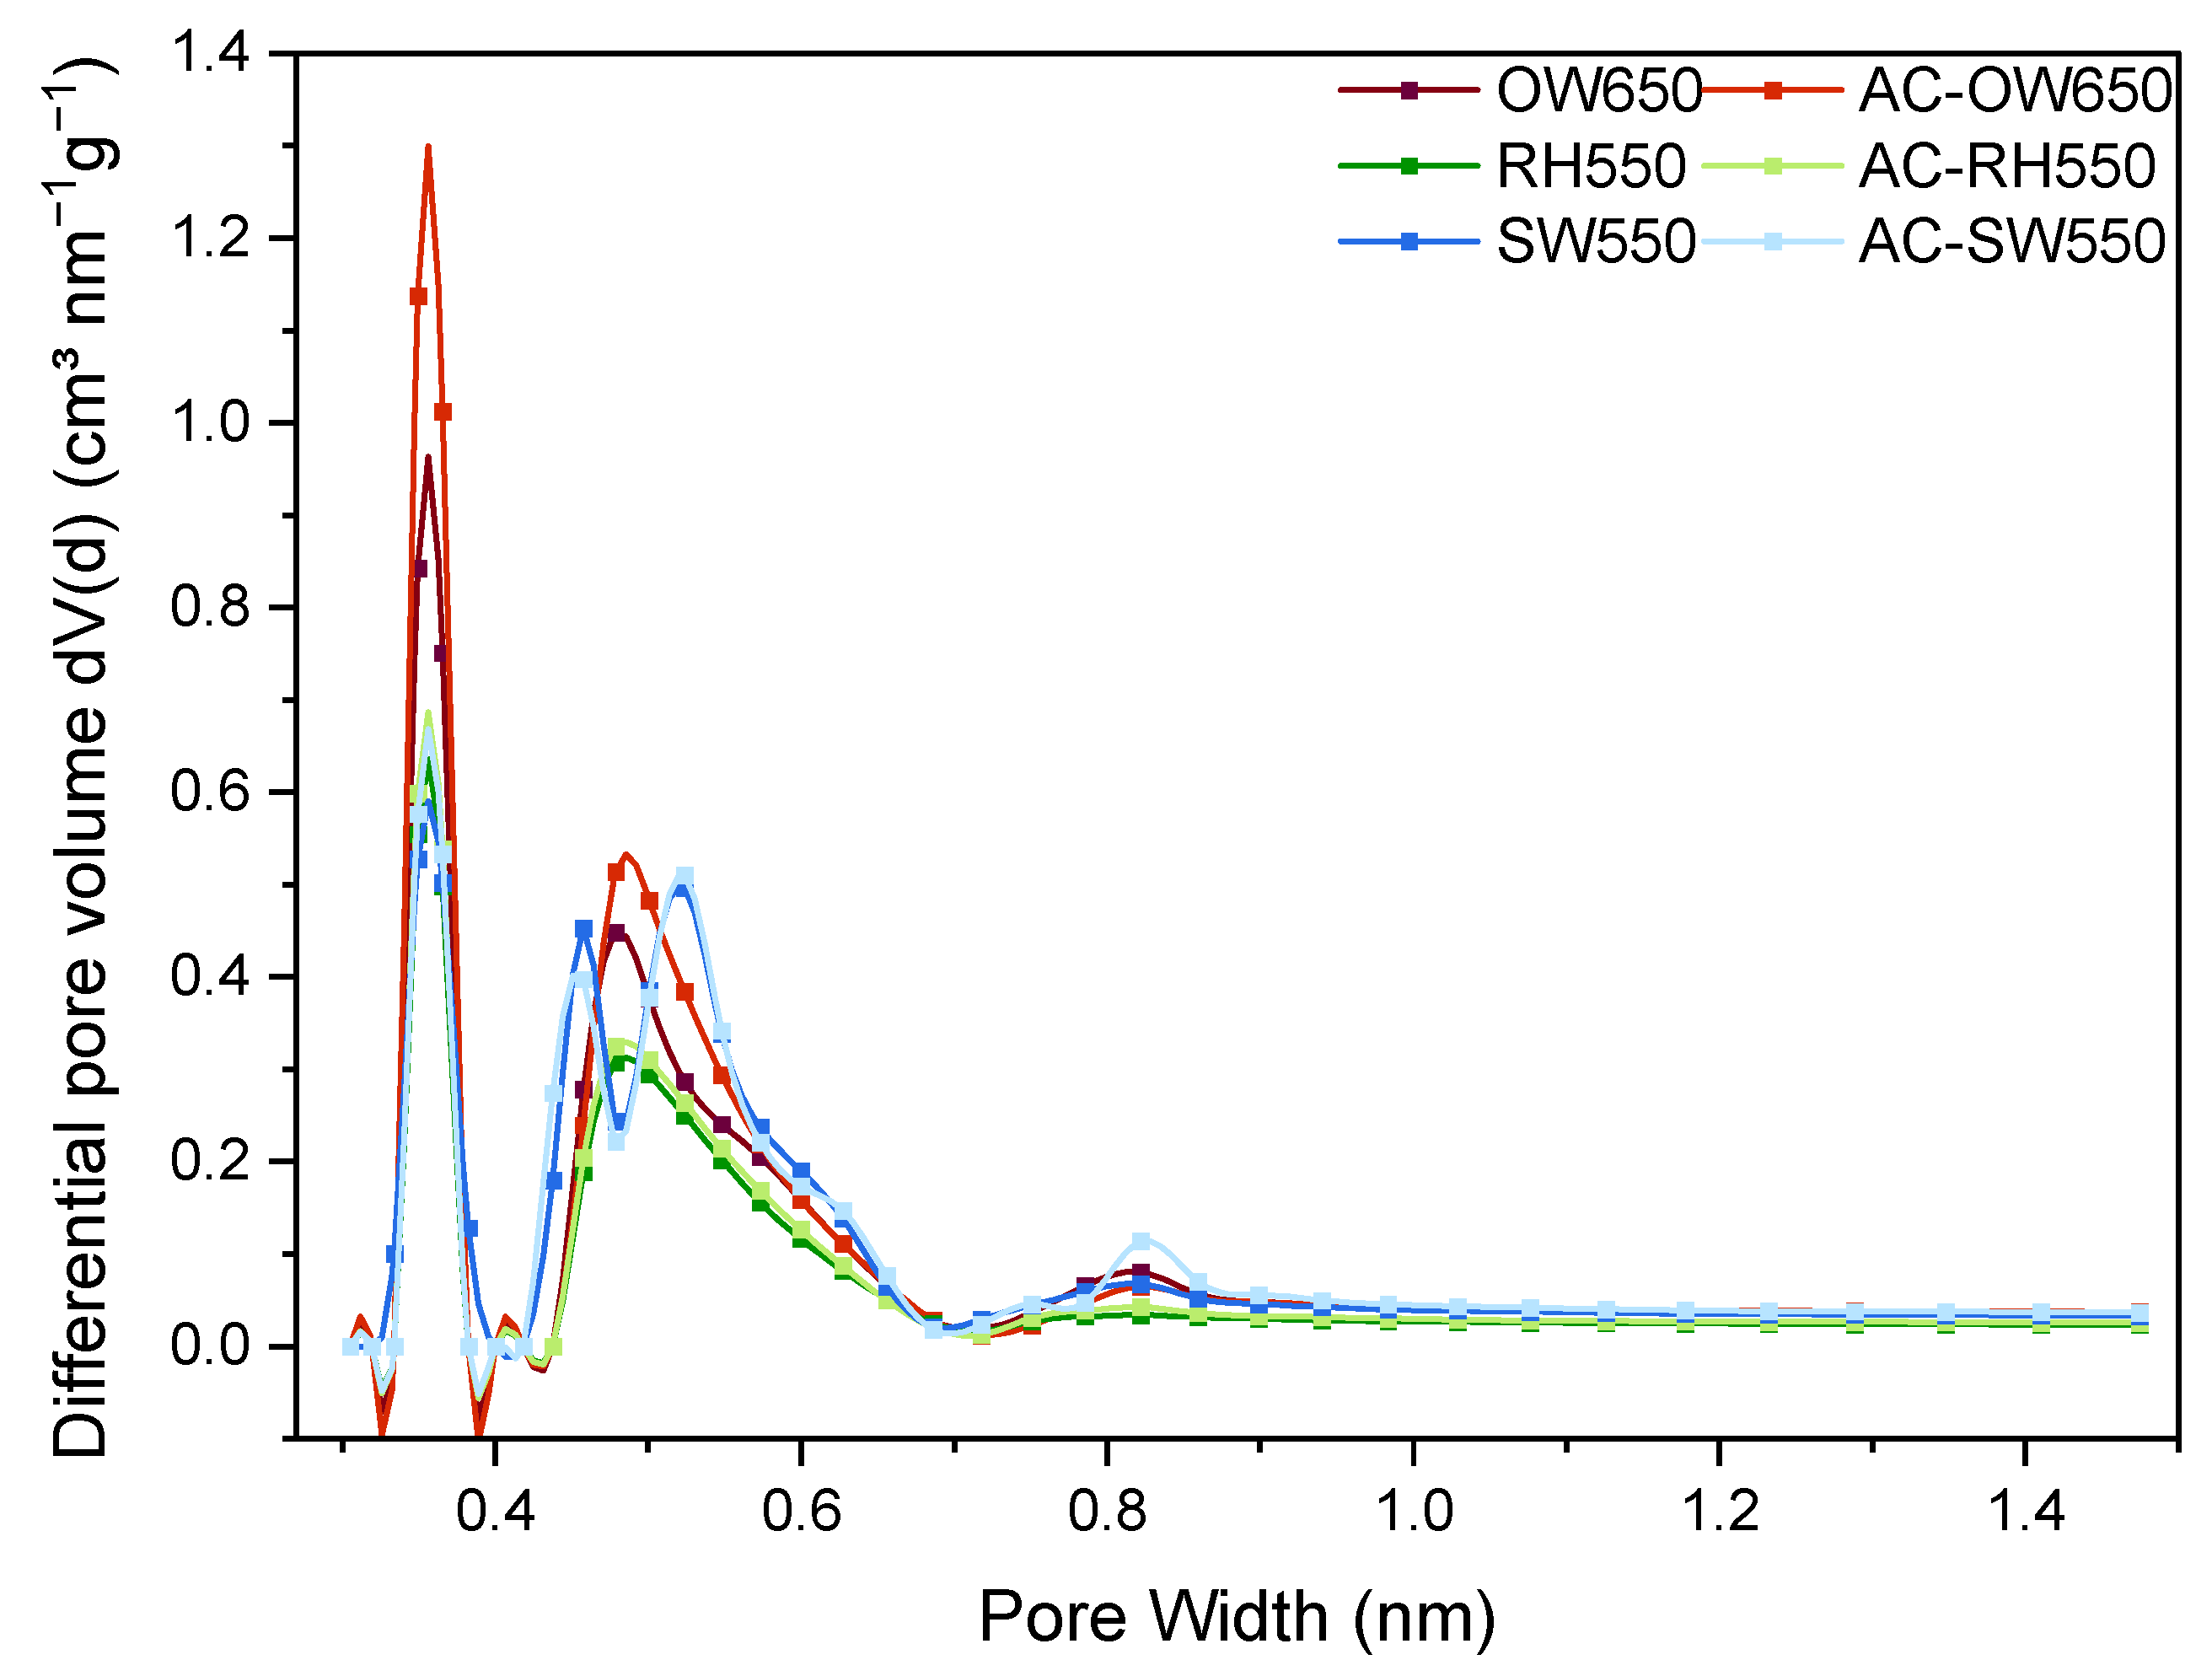
Further insight into the pore structure is provided by the DFT-derived pore size distribution (Figure 6). The differential pore volume profiles, dV(d), indicate that all biochars are predominantly ultramicroporous with pore widths mainly centered below 1 nm [41]. Among the samples, OW650 exhibited the highest overall differential pore volume and a relatively broad distribution at approximately 0.35 nm, indicating a high concentration of pores within a narrow ultramicropore size range. SW550 displayed a relatively broad distribution spanning approximately 0.25–0.60 nm, with a prominent secondary peak at approximately 0.45–0.50 nm, suggesting greater diversity of accessible ultramicropore sizes within its carbon matrix.
Figure 6.
Differential pore volume distributions (dV(d)) as a function of pore width, derived from CO2 adsorption isotherms at 273 K using Density Functional Theory (DFT), for oak wood biochar pyrolysed at 650 °C (OW650), rice husk biochar at 550 °C (RH550), and softwood biochar at 550 °C (SW550) before and after autoclaving (AC).
RH550 showed a similar bimodal distribution pattern to SW550 but with lower peak intensities, indicating a more moderate development of microporosity.
The similarity in the distribution profiles before and after autoclaving indicates that the fundamental pore structure remained largely unchanged. However, a slight increase in peak intensity was observed for the autoclaved samples.
These differences reflect the combined influence of feedstock composition and pyrolysis conditions on pore development.
3.5. Biomethane Production with Autoclaved and Non-Autoclaved Biochar
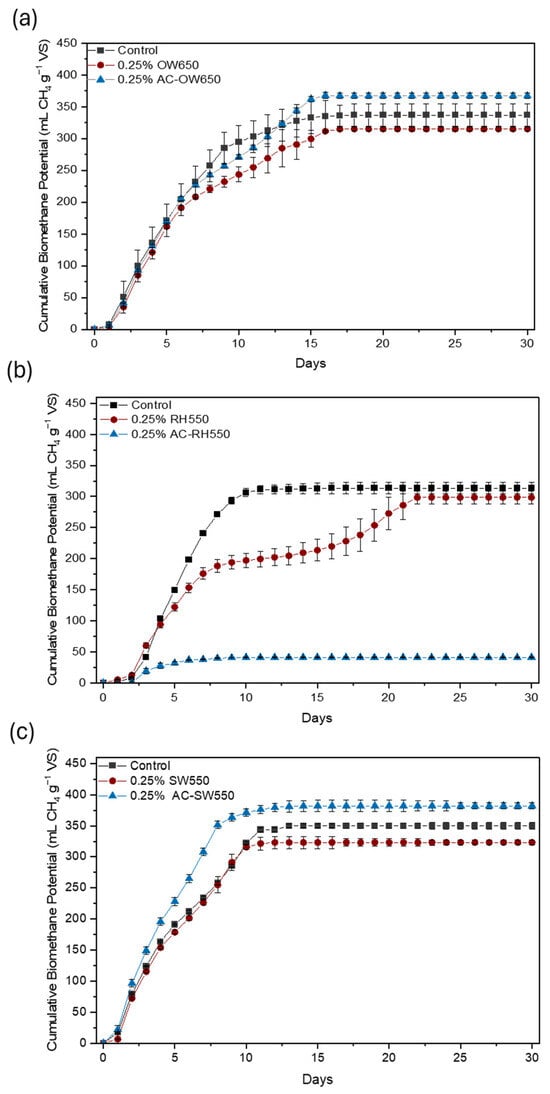
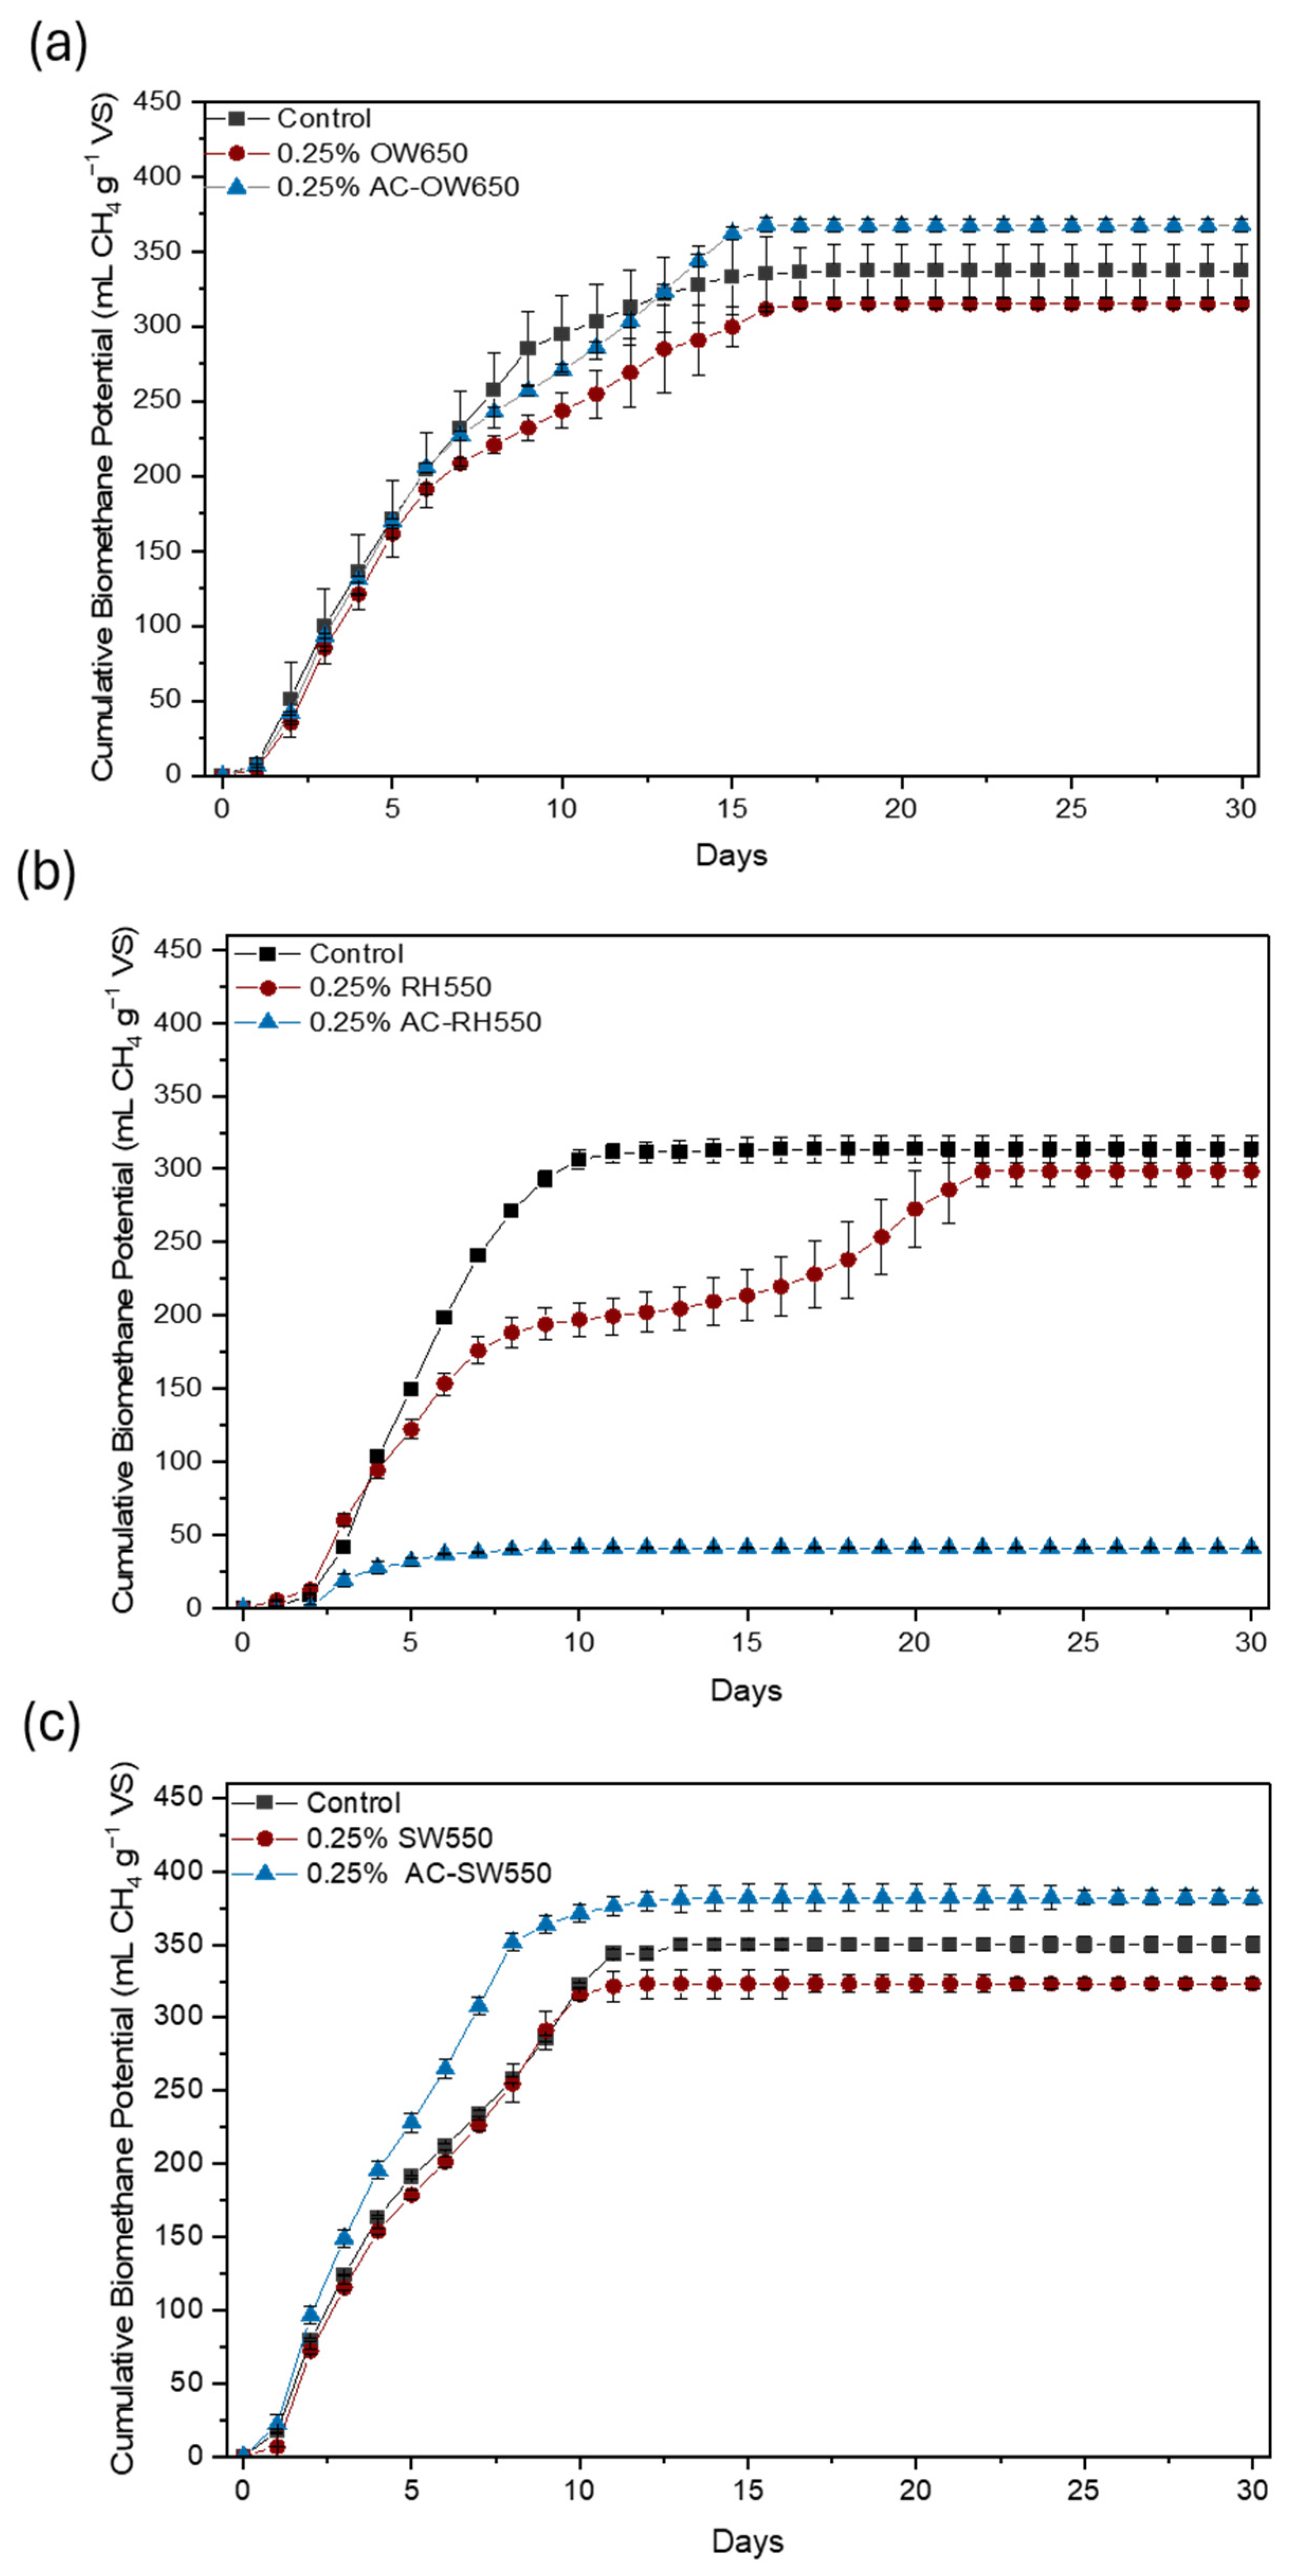
Biochemical methane tests (BMP) were performed on a standard cellulose substrate with and without the addition of biochar. For each experiment and biochar, a comparison is made between the addition of raw biochar and pretreated biochar to compare the impact of pretreatment by autoclaving on BMP behaviour during biochar augmentation. In each case the biochar was added at a constant level of 0.25% (w/v). Figure 7 illustrates the methane yield before and after the pretreatment of oakwood and softwood biochars.
Figure 7.
Cumulative biomethane production (mL CH4 g−1 VS) during the anaerobic digestion of cellulose and with the addition of: (a) oakwood biochar produced at 650 °C (OW650), (b) rice husk biochar produced at 550 °C (RH550), and (c) softwood biochar produced at 550 °C (SW550).
Pretreated biochars exhibited better performance, achieving methane yields of 382.2 and 367.1 mL CH4 g−1 VS for softwood and oakwood, respectively, corresponding to increases of 18.3% and 16.6% compared to their non-pretreated counterparts. Autoclaving not only sterilises the biochar but also modifies its surface functionality, likely through the removal of residual compounds and improved pore accessibility. These changes facilitate microbial colonisation, thereby enhancing mass transfer. The steeper biomethane production profiles observed for autoclaved biochar indicate enhanced hydrolysis and acidogenesis, leading to improved overall digestion performance [42]. This is aligned with the CO2 DFT results, which indicated enhanced pore accessibility.
Furthermore, autoclaved biochar may increase moisture content within the pores [10], promoting microbial attachment of methanogens. Non-autoclaved biochar at the same dose (0.25% w/v) results in reduced methane production. While the specific inhibitory compounds were not directly measured in this study, this may plausibly be attributed to the presence of residual pyrolysis by-products such as volatile organic compounds (VOCs) or polycyclic aromatic hydrocarbons (PAHs) on the biochar surface [6], consistent with mechanisms reported in the literature.
Wei et al. (2020) identified pore volume as a crucial factor influencing biochar’s adsorption capacity for H/C ratios below 0.5, suggesting that the influence of surface morphology may outweigh that of surface functionality [43]. This interpretation aligns with the findings of the present study, in which autoclave pretreatment resulted in enhanced methane production. The improvement appears to be primarily associated with enhanced pore accessibility and microbial colonisation, while only moderate changes in surface chemistry were observed, as indicated by XPS and FTIR analyses. These results suggest that structural modifications play a dominant role, although the contribution of surface functional groups cannot be entirely excluded.
As shown in Table 6, the high BI (92.9%) observed with pretreated biochar (AC-SW550) indicates near-complete cellulose digestion, supporting the role of autoclaved biochar as an effective augmentation additive that facilitates improved mass transfer and process stability (The specific role of biochar as a microbial carrier, via pre-immobilised cells, is evaluated separately in Section 3.6).
Table 6.
Kinetic analysis of cellulose digestion following various biochar pretreatments.
The addition of autoclaved biochar at 0.25% (w/v) substantially increased both methane yield and digestion kinetics, although the extent of improvement was feedstock-dependent.
It should be noted that the 0% biochar control values reported in Table 6 (336.8, 313.6, and 350.1 mL CH4 g−1 VS for OW650, RH550, and SW550, respectively) correspond to separate batch matched control runs performed alongside each feedstock series, rather than a single shared control. Comparisons of biochar-loaded reactors should therefore be made within their own batch matched control, not across feedstocks.
In the case of SW550, autoclaving led to substantial increase in methane production rate (Rmax = 58.2 mL CH4 g−1 VS d−1), representing an increase of approximately 34% compared to the non-autoclaved counterpart (43.3 mL CH4 g−1 VS d−1) and about 40% relative to the control. This was accompanied by a reduction in T80 (6.8 days), indicating accelerated substrate conversion and improved process efficiency. The shorter Tm (3.09 days) further confirms faster attainment of peak methane production, demonstrating that autoclaved SW550 enhances both the rate and timing of methanogenesis, thereby promoting overall process acceleration rather than just higher yield, which increases process stability [44].
In contrast, for OW650, although autoclaving increased methane yield (BMPexp = 367.1 mL CH4 g−1 VS), the kinetic response was less pronounced. The methane production rate (Rmax = 35.0 mL CH4 g−1 VS d−1) remained lower than the control, while T80 increased to 10.4 days compared to both the control (8.4 days) and non-autoclaved OW650 (9.5 days). Additionally, Tm increased to 4.51 days, indicating a slower progression to peak methane production. These results suggest that while autoclaving enhances the ultimate biodegradability of OW650, it may introduce diffusional limitations or alter surface chemistry in a way that slightly delays microbial activity.
The addition of non-autoclaved biochar at 0.25% (w/v) resulted in reduced methane yields and, in some cases, slower kinetics, particularly for OW650, likely due to the presence of residual inhibitory compounds or pore blockage limiting microbial accessibility. However, lag phases (λ = 0.4–0.9 days) remained consistently short across all reactors, indicating rapid microbial acclimation and overall process stability [45].
In contrast, RH550 exhibited markedly different behaviour. The addition of biochar led to a decline in both methane yield and kinetics, particularly after autoclaving, with drastic reductions in BMPexp (41.2 mL CH4 g−1 VS) and BI (10.0%). This was accompanied by a relatively low methane production rate (Rmax = 12.6 mL CH4 g−1 VS d−1). Although T80 (4.8 days) and Tm (2.90 days) appear shorter, this reflects the low ultimate methane potential rather than improved kinetics.
These results highlight the strong influence of feedstock composition on biochar performance. The excellent agreement between experimental and modelled methane potentials (R2 = 0.94–0.99) confirms that the Modified Gompertz model provides a good statistical fit to the observed digestion kinetics, though this does not by itself establish the biological repeatability of the underlying BMP measurements.
Two-way ANOVA (Table 7) showed that feedstock type had a strong and significant effect on all three parameters measured: final methane yield (BMPmax; F(2,6) = 848.0, p < 0.0001), production rate (Rmax; F(2,6) = 124.2, p < 0.0001), and time to reach 80% of final yield (T80; F (2,6) = 11.7, p = 0.0084). This indicates that the type of biochar used had a major influence on digestion performance. Pretreatment (autoclaved vs. non-autoclaved) also significantly affected BMPmax (F(1,6) = 147.5, p < 0.0001) and T80 (F(1,6) = 42.4, p < 0.001) but did not significantly affect Rmax (F(1,6) = 3.92, p = 0.095), suggesting that autoclaving changed the total amount of methane produced and how quickly that yield was reached, without significantly affecting the peak rate of production. A significant feedstock × pretreatment interaction was found for all three parameters (BMPmax: F(2,6) = 658.7, p < 0.0001; Rmax: F(2,6) = 12.8, p = 0.0068; and T80: F(2,6) = 34.7, p < 0.001), showing that the effect of autoclaving was not the same across all feedstocks; instead, autoclaving improved performance more for some biochar types than others.
Table 7.
Two-way ANOVA (Feedstock × Pretreatment) results for BMPmax, Rmax, and T80. Significance threshold set at p < 0.05.
The conductive nature of biochar has been reported to facilitate direct interspecies electron transfer (DIET) between syntrophic methanogens [4]; although DIET was not directly measured in this work, it remains a plausible contributing mechanism. Biochar may also have mitigated process inhibition, such as volatile fatty acid (VFA) accumulation and localised pH imbalances, through adsorption and buffering effects reported by Qiu et al. (2019) [46]. Although VFAs were not quantified in this study, it would be a useful addition in future work.
3.6. Cell Immobilisation with Pretreated (Autoclaved) Biochar in an Inoculum-Free System
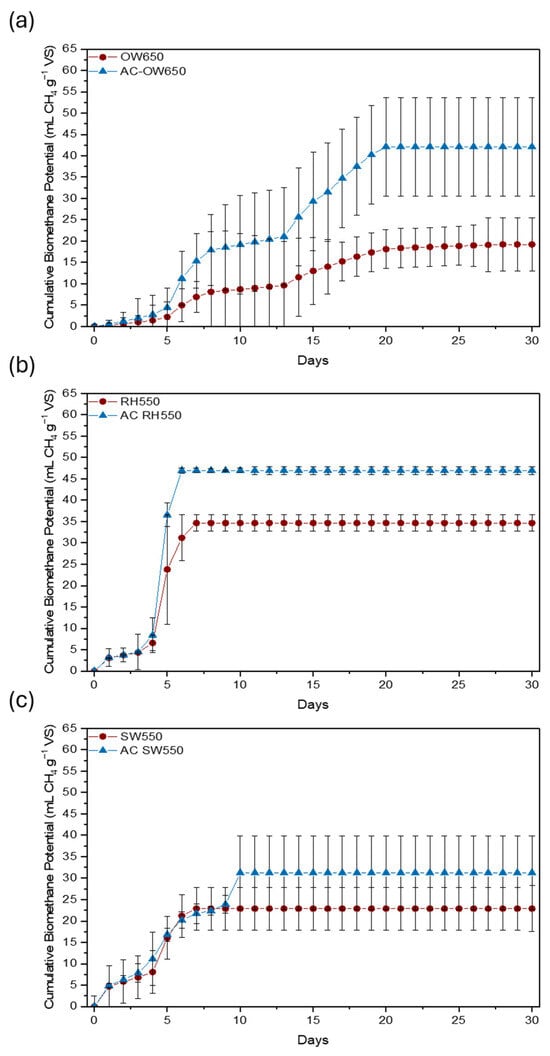
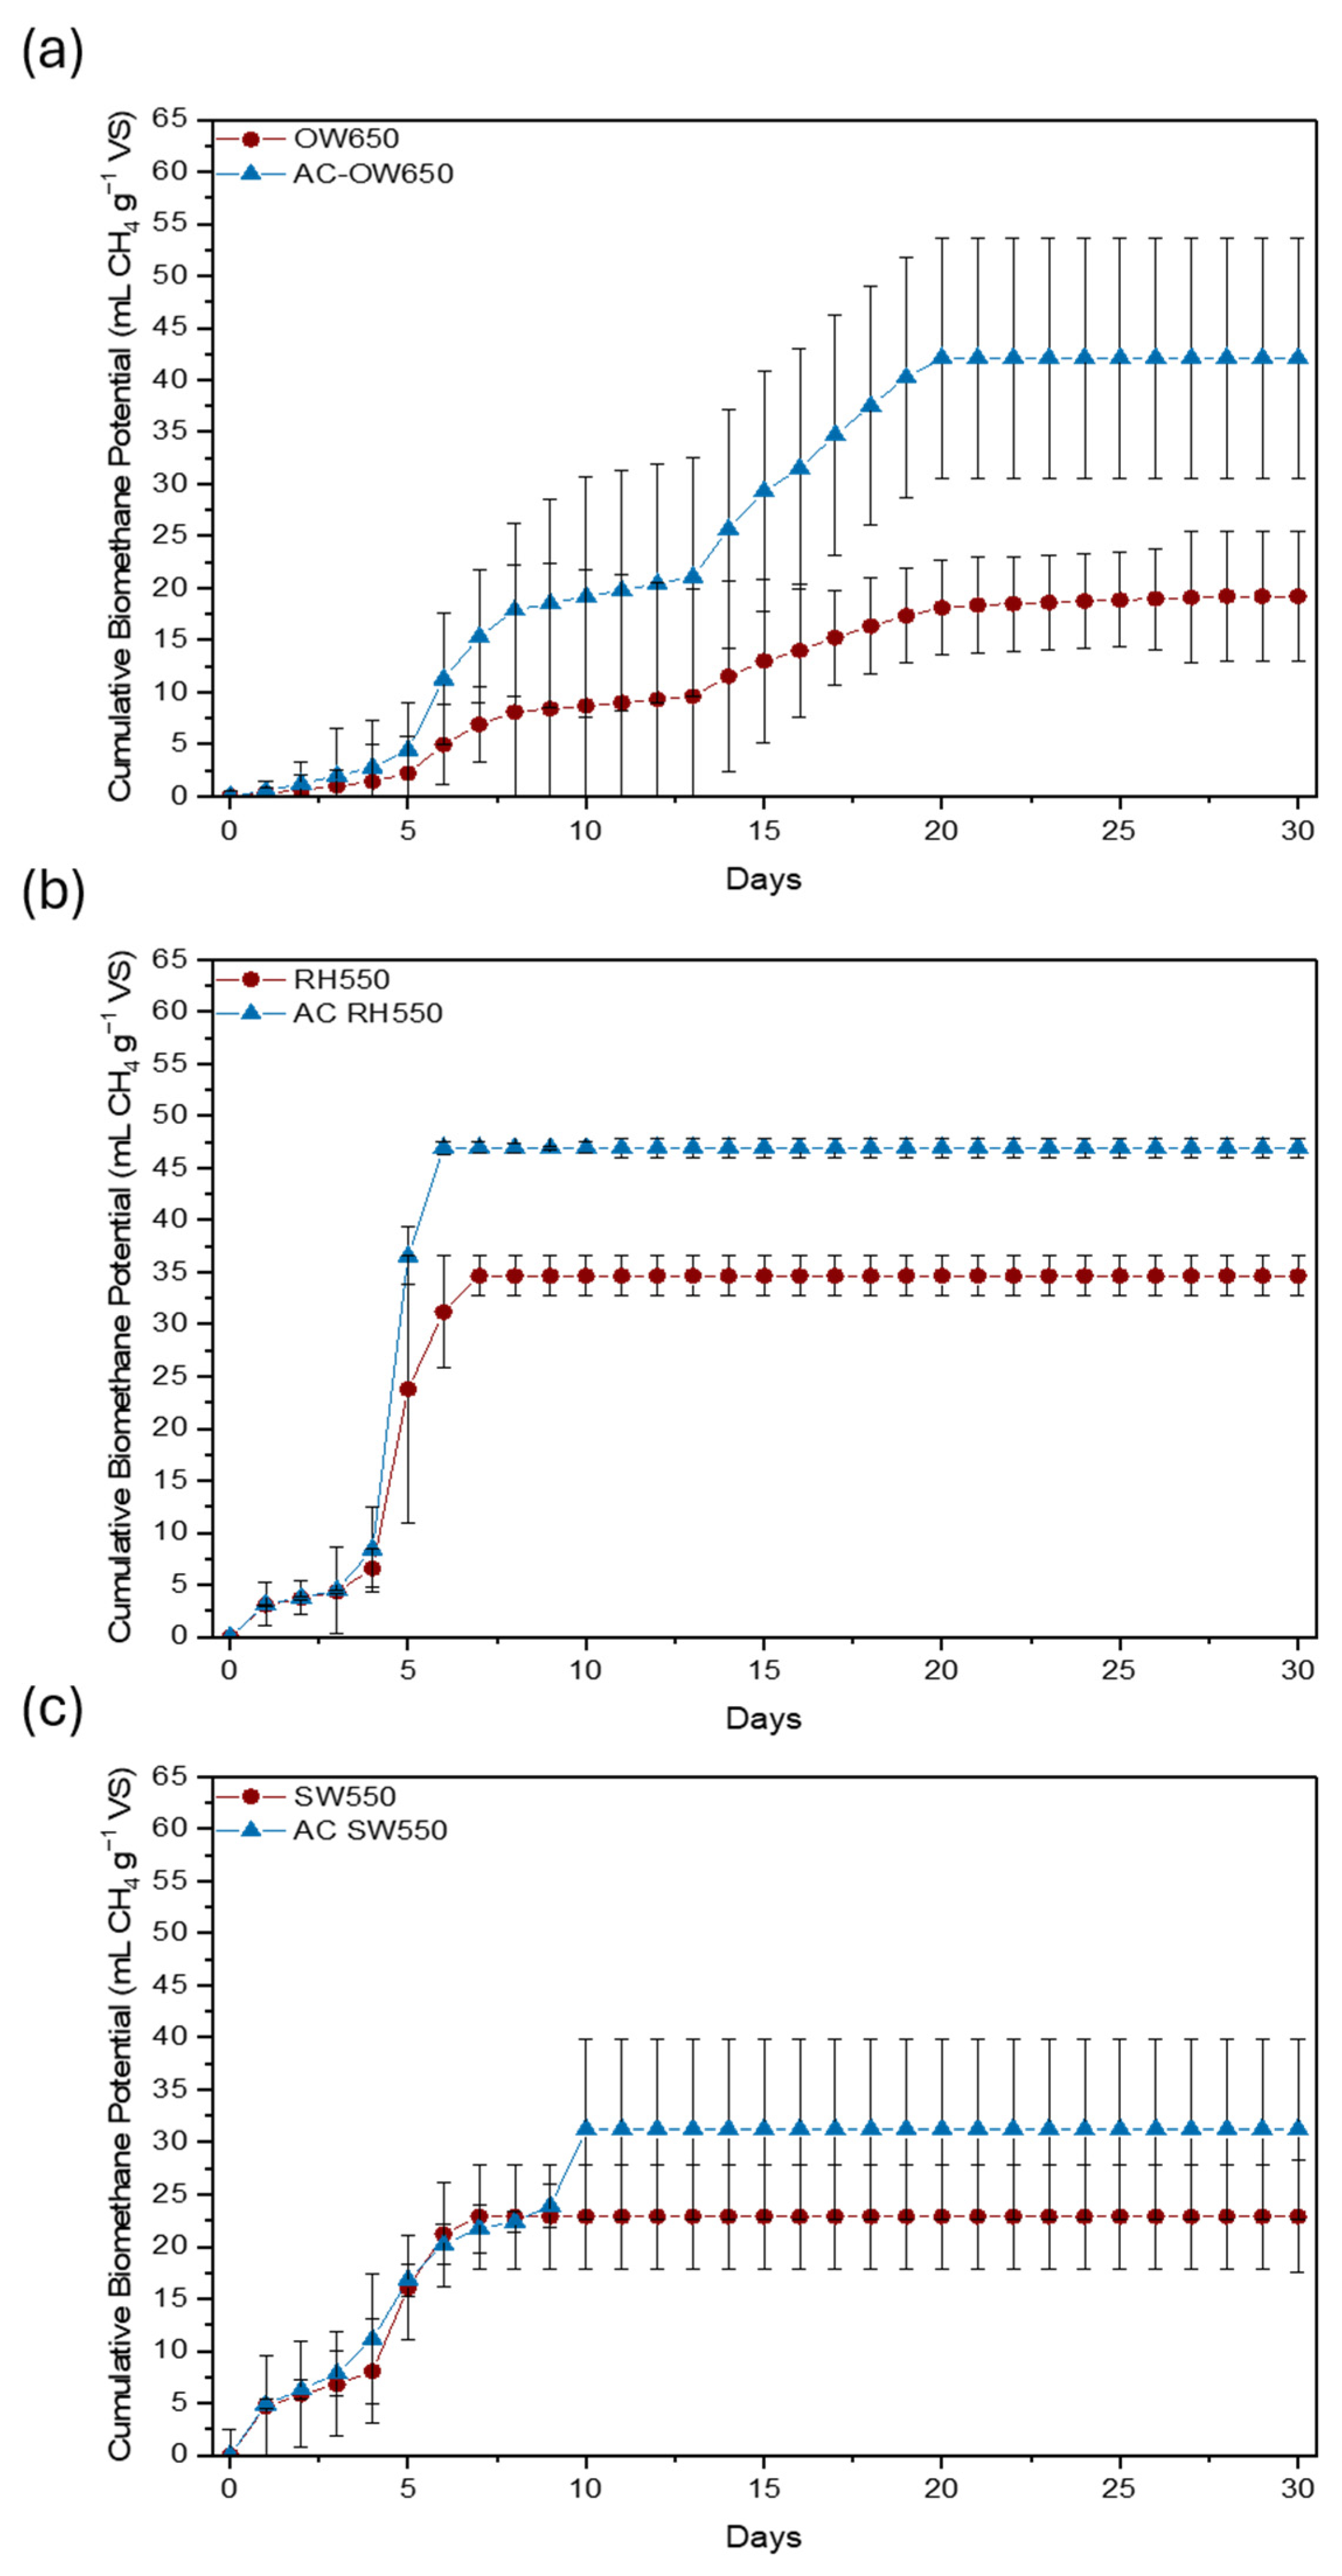
As shown in Figure 8, pretreated biochars prior to cell immobilisation yielded higher methane production than non-autoclaved biochars. In Figure 8a, both oakwood biochars (OW650) were immobilised with cells before the digestion process. The steeper slope observed in the autoclaved biochar during the exponential phase (5–15 days) indicates an increased methane production rate. Unlike the other systems, methane production continues to increase progressively without an early plateau, suggesting sustained microbial activity and continued substrate utilisation.
Figure 8.
Cumulative biomethane production (mL CH4 g−1 VS) during the anaerobic digestion of cellulose for 30 days in inoculum-free systems: (a) Oakwood biochar produced at 650 °C (OW650), (b) rice husk biochar produced at 550 °C (RH550), and (c) softwood biochar produced at 550 °C (SW550).
In Figure 8b and c (RH550 and SW550, respectively), different trends were observed. Methane production increases rapidly during the initial phase but reaches an early plateau. Likely due to rapid metabolic activity and the possibility of accumulation of inhibitory intermediates, particularly volatile fatty acids (VFAs), which can alter system conditions and be accompanied by a drop in the pH, which could inhibit microbial activity [47].
Figure 8b further illustrates this behaviour for rice husk (RH550), where a sharp initial increase in methane production is followed by an early plateau. Among all systems, RH550 achieved the highest methane yield, reaching approximately 47 mL CH4 g−1 VS within approximately 6–7 days, indicating rapid microbial activity. However, the subsequent plateau suggests that methane production becomes limited, likely due to process instability. This interpretation is supported by pH measurements (Table 8), which show a decrease to values below 6 across all reactors, a range known to inhibit methanogenic activity [48].
Table 8.
pH before and after the BMP assay for inoculum-free systems loaded with biochar-immobilised cells (BIC).
Particularly during the early phase, rapid acidogenesis could explain this pH decline, since acidogenic bacteria typically tolerate a broader and more acidic pH range (approximately 5.5–6.5) than methanogens, which require near-neutral conditions (approximately 6.5–7.5) and are inhibited outside this range [49]. In inoculum-free systems, the buffering capacity is limited. The observed pH decline is consistent with, but does not directly confirm, the accumulation of volatile fatty acids (VFAs) such as acetic, propionic, and butyric acids, which are known to inhibit methanogenesis when not efficiently converted to methane [50]. VFA concentrations were not quantified in this study; therefore, this interpretation should be regarded as a plausible explanation rather than a confirmed mechanism.
Augmentation with autoclaved biochar promotes higher levels of biomethane production than the corresponding non-autoclaved biochar, highlighting how surface modification can enhance biochar activity. In inoculum-free systems, where no external inoculum was supplied, and biomethane production relied solely on the microbial community retained on the biochar surface following the immobilisation period, autoclaved biochars supported higher levels of microbial colonisation, as evidenced by higher BMP levels and more pronounced cell immobilisation observed by SEM (Section 3.9).
3.7. Cell Immobilisation with Pretreated (Autoclaved) Biochar in an Inoculated System
A BMP assay was conducted using an inoculated system to evaluate the effect of biochar-immobilised cells on methane production under anaerobic digestion conditions. The presence of inoculum served as a nutrient medium, provided buffering capacity, maintained pH within the optimal range (6.8–7.5) (Table 9), and enabled continuous VFA consumption, thereby supporting stable microbial activity.
Table 9.
pH before and after the BMP assay for inoculated systems loaded with biochar-immobilised cells (BIC).
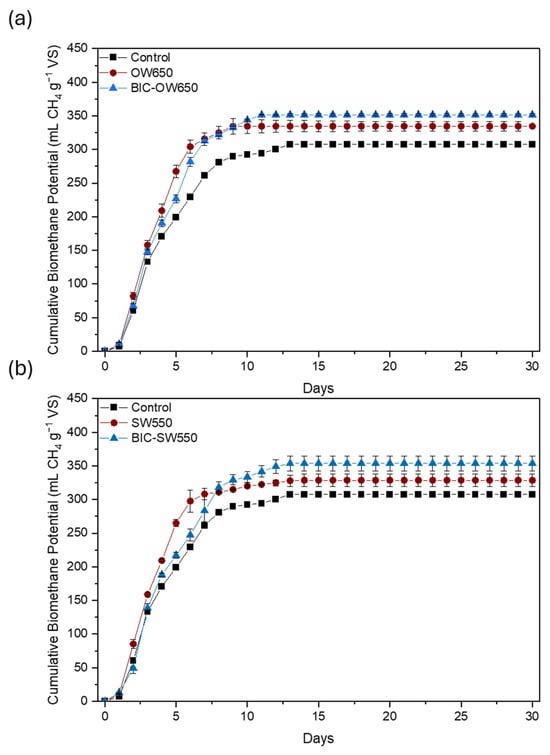
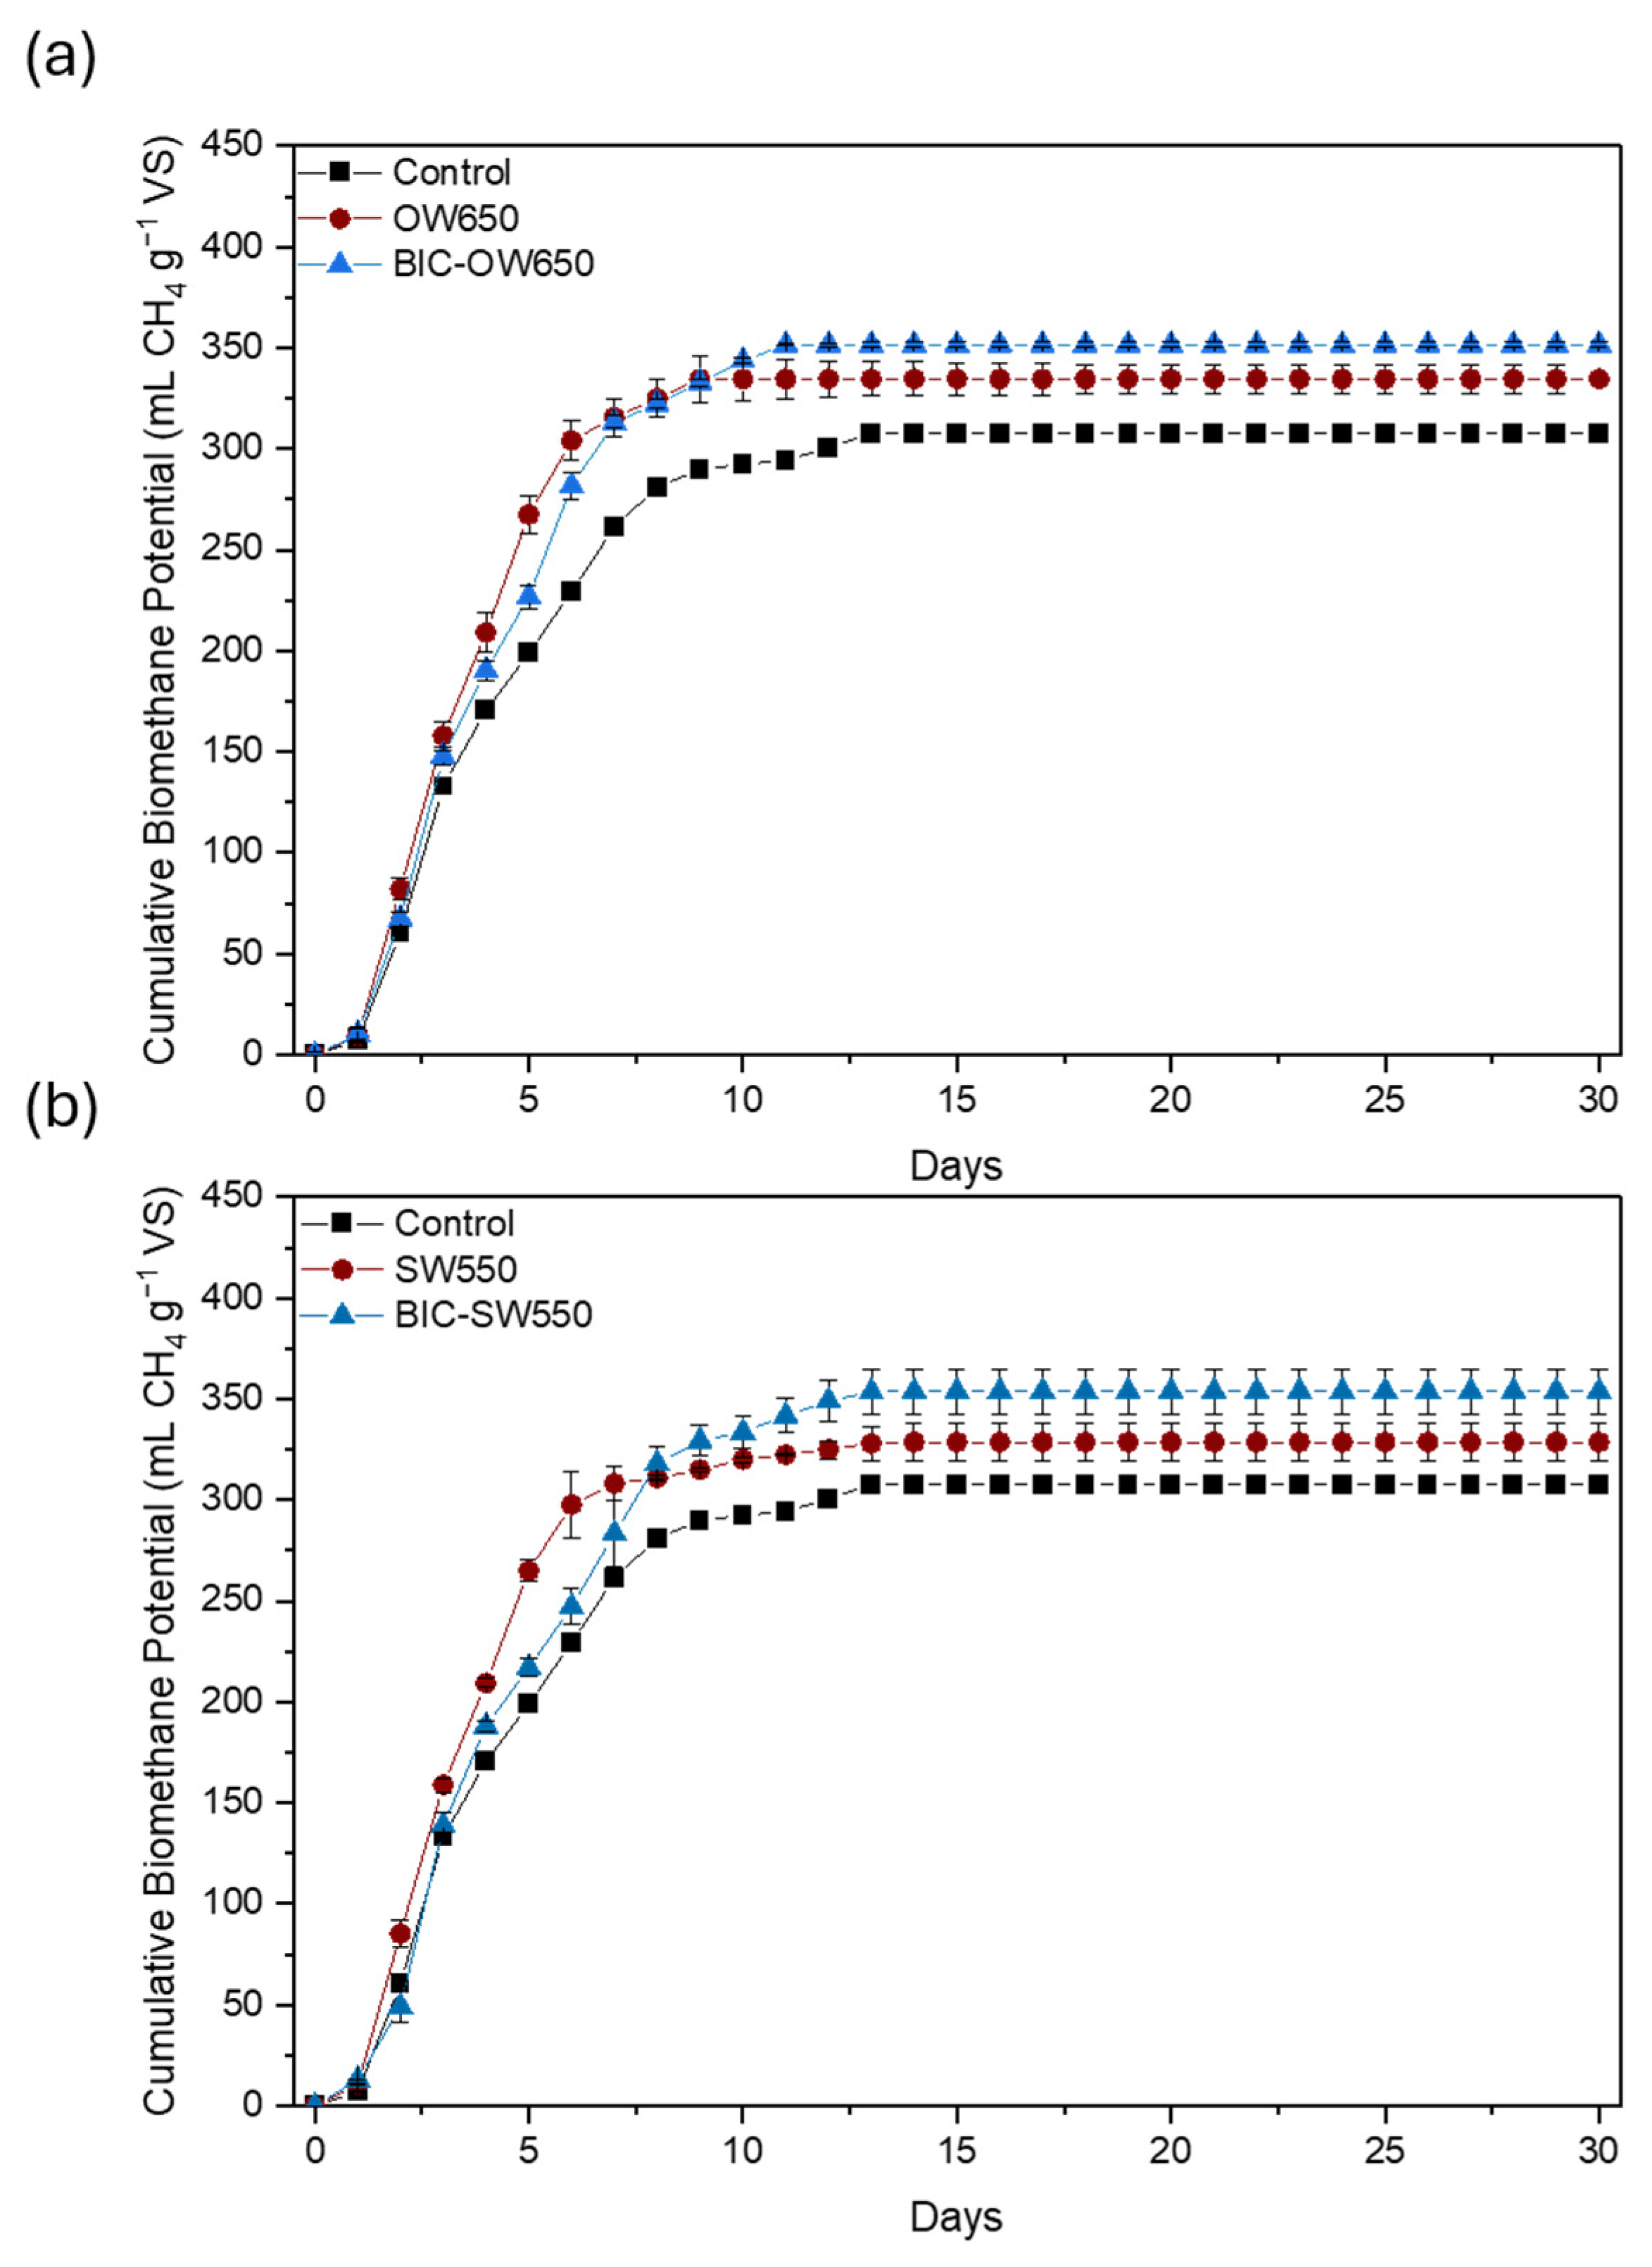
As shown in Figure 9, reactors loaded with biochar, both with and without immobilised cells (BIC), exhibited higher cumulative biomethane potential compared to the control (0% biochar). The control reactor showed the lowest BMP (307.5 mL CH4 g−1 VS) and biodegradability (BI) (74%), confirming the beneficial role of biochar addition in enhancing digestion performance. Reactors containing biochar alone (without prior immobilisation) are pretreated and have already demonstrated improved methane yields, indicating that the addition of pretreated biochar enhanced both the observed and kinetic parameters of methane production, with differences depending on biochar type and preparation strategy.
Figure 9.
Cumulative biomethane production (mL CH4 g−1 VS) during the anaerobic digestion of cellulose with the addition of: (a) oakwood biochar produced at 450 °C (OW450), (b) softwood biochar produced at 550 °C (SW550). BIC = biochar immobilised cells.
The results in Table 10 are kinetic parameters of the modified Gompertz model, confirming the enhancement of methane yield, with the highest BMP values of 351.5 mL CH4 g−1 VS (BIC-OW650) and 353.8 mL CH4 g−1 VS (BIC-SW550). This demonstrates that microbial immobilisation on biochar provides an additional benefit beyond the intrinsic properties of biochar alone. The modified Gompertz model showed that while BIC systems exhibited lower maximum methane production rates (Rmax), they achieved slightly higher ultimate methane yields (BMPmax), indicating a shift towards a more controlled, sustained digestion process rather than a rapid initial conversion. This is consistent with reports that immobilisation can restrict the diffusion of substrate and gases to cells within the carrier, which may reduce the rate of substrate conversion relative to free-living cells, while conferring greater catalytic stability and tolerance to inhibitory conditions [51,52].
Table 10.
Kinetic parameters of the modified Gompertz model of the anaerobic digestion of cellulose under two types of biochar-immobilised cells.
Lag phases (λ) were comparable across all systems, suggesting that the timing of initial microbial response to substrate was largely unaffected by pre-immobilisation. The time required to reach 80% of methane production (T80) was longer for BIC systems, indicating slower methane generation, consistent with the diffusion-related rate limitation discussed above. The excellent agreement between experimental and modelled data (R2 = 0.99) confirms the suitability of the modified Gompertz model for describing methane production kinetics; however, as noted above, this reflects the goodness of statistical fit rather than the biological repeatability of the underlying BMP measurements.
Two-way ANOVA (Feedstock × Condition) was performed on BMPmax, Rmax, and T80 for the inoculated (BIC) system (Table 11). Neither feedstock nor condition (BIC vs. Non-BIC) significantly affected final methane yield (BMPmax; F(1,4) = 0.45, p = 0.541), indicating that pre-immobilisation of cells onto biochar did not increase the ultimate extent of digestion relative to biochar augmentation alone. In contrast, condition had a significant effect on both Rmax (F(1,4) = 37.55, p = 0.0036) and T80 (F(1,4) = 90.35, p = 0.0007), with BIC reactors exhibiting consistently lower production rates and longer times to reach 80% of final yield than their non-BIC counterparts across both feedstocks. A significant feedstock × condition interaction was also observed for T80 (F(1,4) = 16.32, p = 0.0156), indicating that this delay was more pronounced for SW550 than for OW650. Together, these results indicate that pre-immobilisation of cells does not show a significant yield advantage under these conditions.
Table 11.
Two-way ANOVA (Feedstock × Condition) results for BMPmax, Rmax, and T80 inoculated (BIC) system.
3.8. Biochar Microbial Analysis
The total viable count was expressed as colony-forming units (CFU) per gram of biochar (wet weight basis), accounting for dilution factors and plated volume. No colonies were detected in any of the plates (0 CFU g−1 ww). Indicating the absence of culturable microorganisms. This is consistent with the high pyrolysis temperature used during biochar production, which would eliminate indigenous microbial populations. For the pretreated biochar, the absence of growth was expected due to the sterilisation step. The impact of pretreatment on the propensity of the biochar for immobilisation of cells was investigated by immobilising inoculum collected from an industrial AD plant. Immobilisation was performed for 72 h.
Following cell immobilisation under anaerobic conditions, higher culturable cell counts (CFU g−1 ww) were recovered from both autoclaved and non-autoclaved biochars compared with the pre-immobilisation baseline (Table 12). The culturable count was higher on the pretreated biochars, suggesting that pretreatment promotes attachment of the culturable heterotrophic fraction of the inoculum, possibly due to enhanced surface accessibility or removal of inhibitory residues. In contrast, the non-pretreated samples exhibited lower, but still measurable, culturable counts. As TSA plating selects only for culturable heterotrophs, these results should be interpreted as evidence of culturable cell attachment rather than a direct measure of total microbial colonisation or methanogenic activity on the biochar surface.
Table 12.
Total viable cell counts (CFU g−1 ww) immobilised on OW650 and SW550 biochars before pretreatment and after. Values are expressed as colony-forming units per gram biochar (ww).
3.9. Scanning Electron Microscopy (SEM)
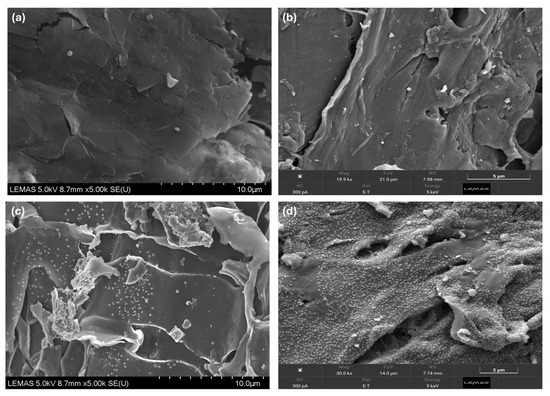
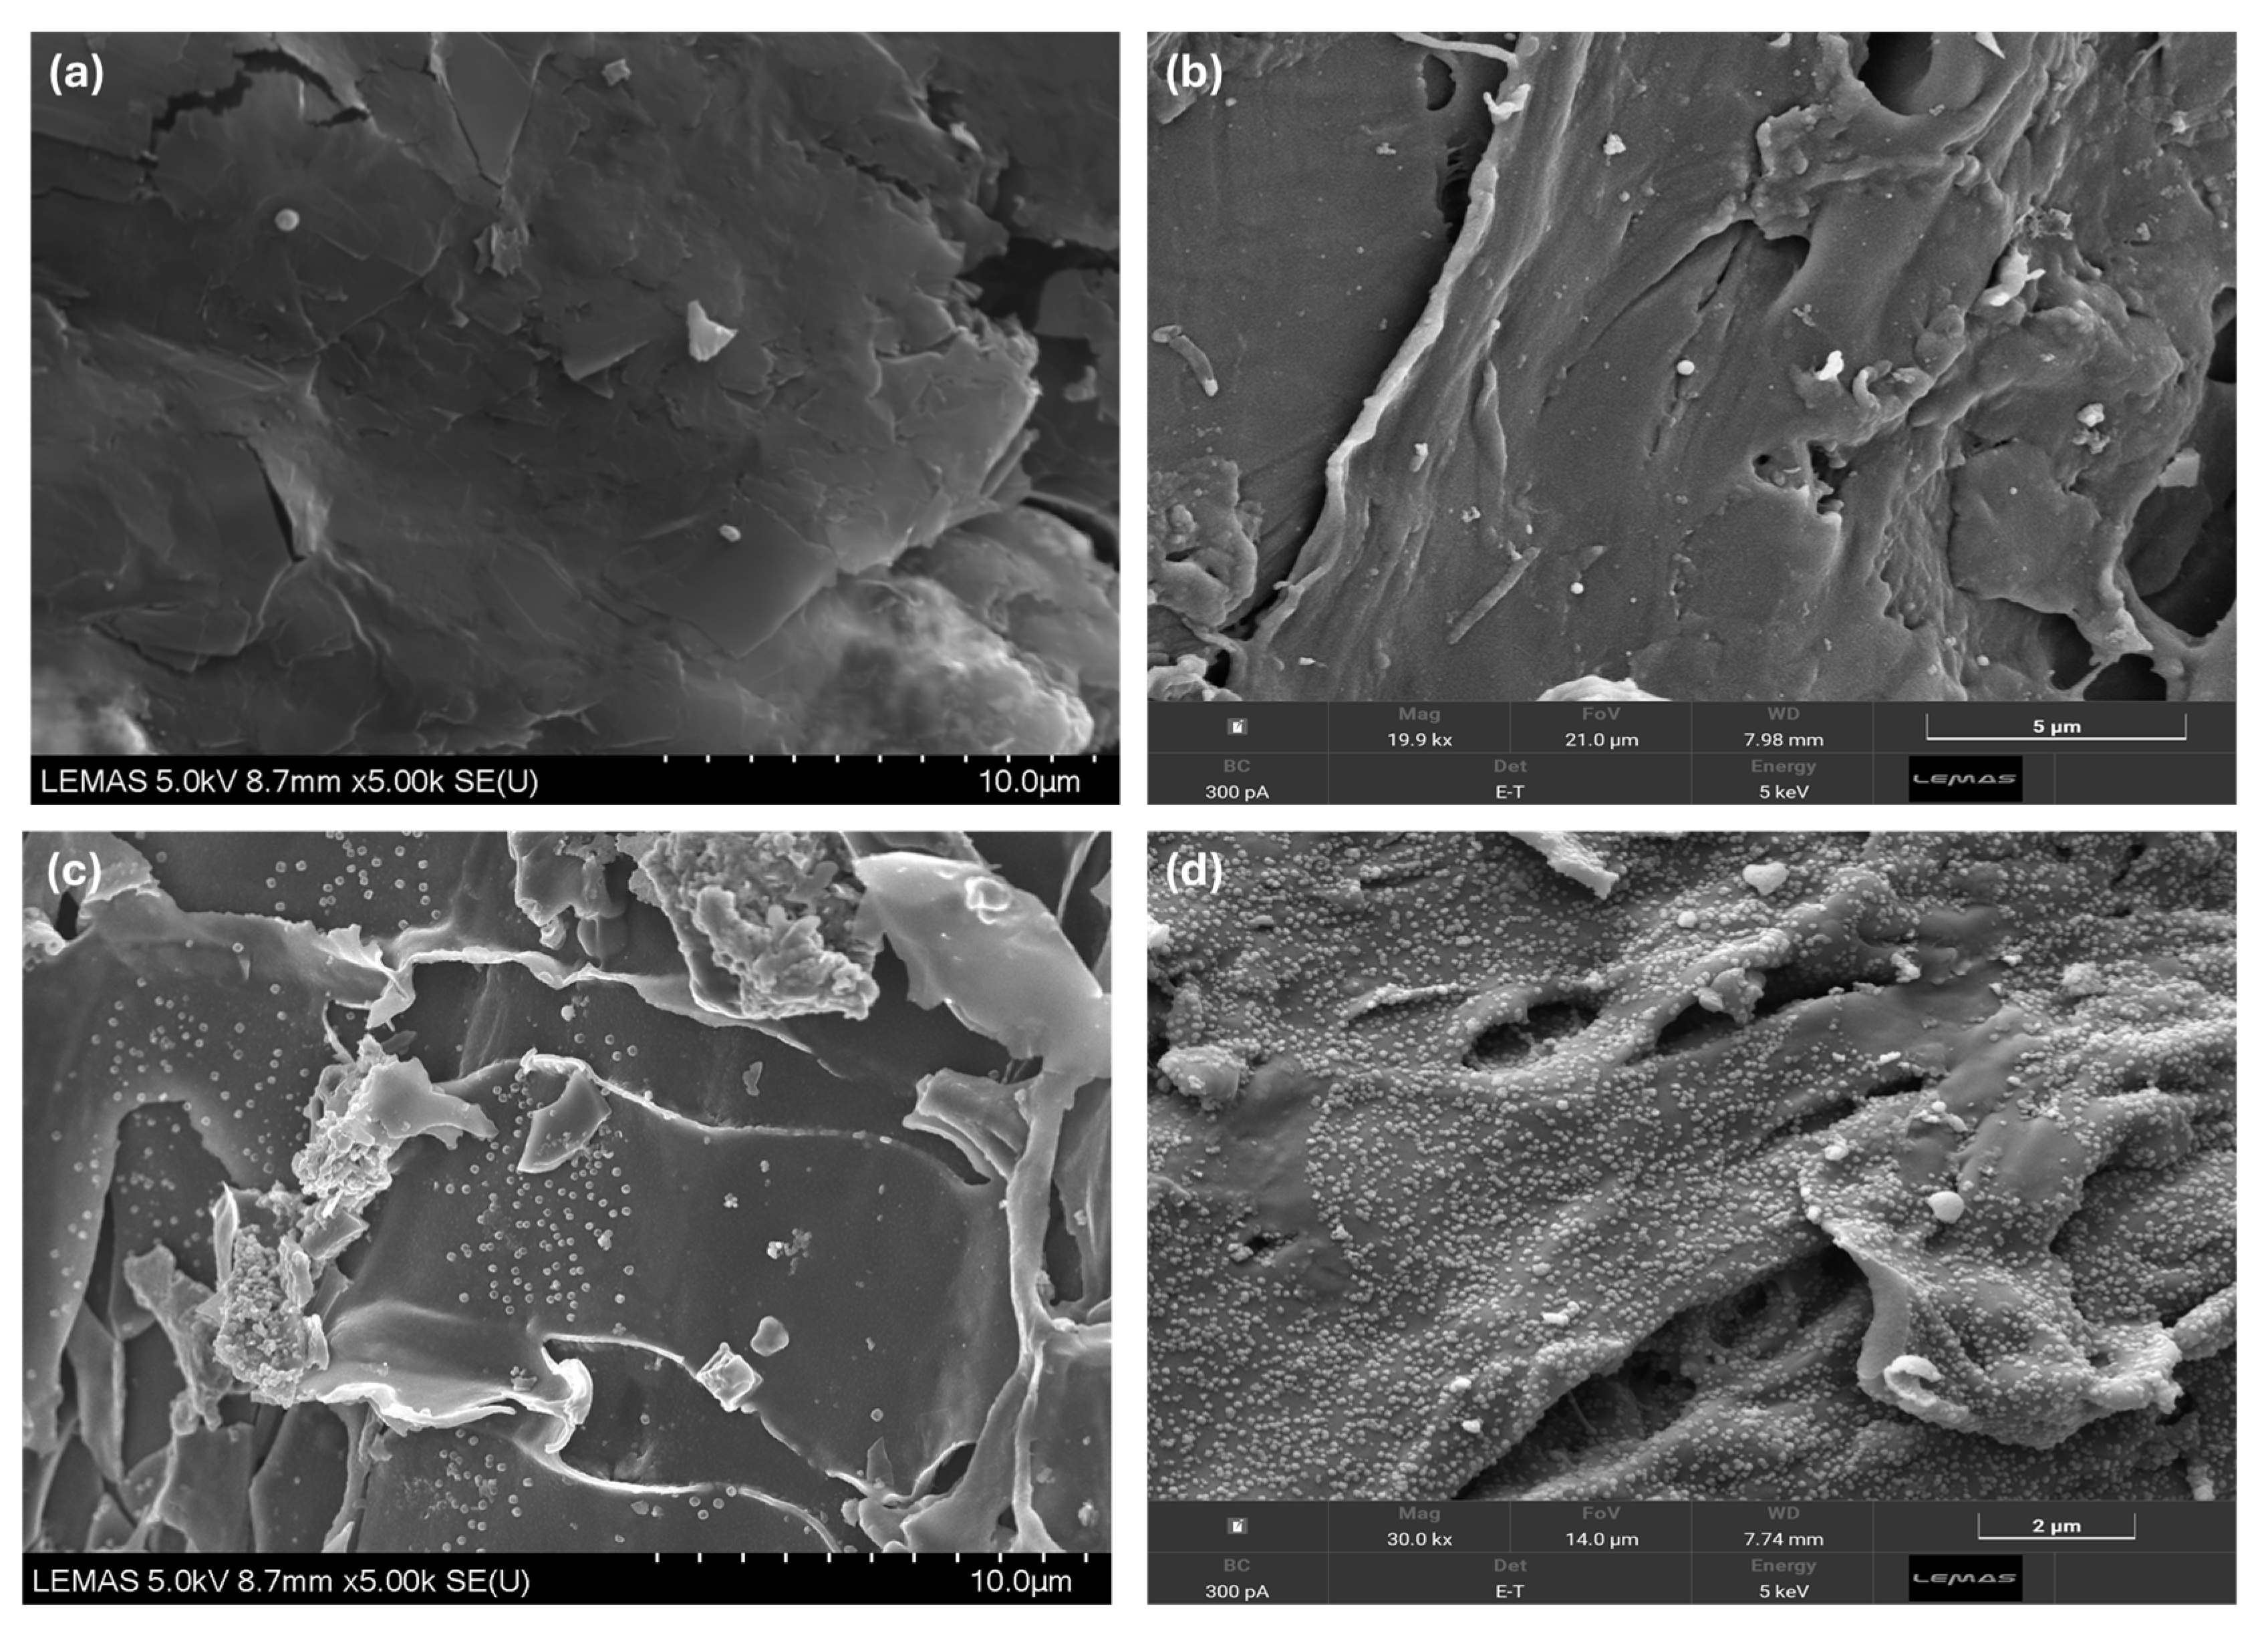
Microscopic observations were conducted using SEM to examine biochar samples before and after autoclave pretreatment, following incubation at 37 °C using a biochar-to-inoculum ratio (BIR) of 1:10 (w/v). The SEM micrographs provide direct visual evidence of surface morphology and the presence of microbial colonisation, as illustrated in Figure 10.
Figure 10.
SEM micrographs of RH550 and SW550 biochar surfaces before and after autoclave pretreatment, following incubation: (a) non-autoclaved RH550 (5.00k×) and (b) non-autoclaved SW550 (19.9k×); (c) AC-RH550 (5.00k×) and (d) AC-SW550 (30.0k×). All images were acquired at an accelerating voltage of 5 kV.
Figure 10a,b present the non-autoclaved surfaces of rice husk (RH550) and softwood (SW550) biochar, respectively, prior to microbial colonisation. Both surfaces show minimal evidence of microbial attachment, consistent with the absence of a pretreatment step to enhance colonisation potential.
Figure 10c,d show the autoclaved counterparts of these two biochars, AC-RH550 and AC-SW550, respectively, and both demonstrate visible microbial cell attachment relative to their non-autoclaved counterparts in Figure 10a,b, indicating that autoclave pretreatment promoted colonisation in both feedstocks. This is further supported by BET analysis, which showed that autoclaving increased both surface area and pore volume in RH550 (287.47 to 308.58 m2 g−1; 0.077 to 0.083 cm3 g−1) and SW550 (446.21 to 449.69 m2 g−1; 0.119 to 0.132 cm3 g−1), consistent with a more favourable surface for microbial attachment following pretreatment.
However, this improvement in surface colonisation was not reflected in the BMP performance of AC-RH550, which did not show the enhancement observed for AC-SW550. This discrepancy between visible colonisation and methane yield suggests that factors beyond surface attachment and porosity may be influencing digestion performance in RH550, potentially related to mineral composition changes induced by autoclaving. Further investigation is needed to clarify the underlying cause of this feedstock-specific inhibitory effect on BMP.
These observations demonstrate that autoclaving not only serves as a sterilisation step but may also modify the physicochemical properties of biochar, thereby promoting improved colonisation. However, better colonisation did not always lead to better BMP performance, as evidenced by the different outcomes for AC-SW550 and AC-RH550. This suggests that surface attachment alone cannot predict methane production, and that other feedstock-specific factors still need to be investigated.
4. Conclusions
The study offers an advanced evaluation of the influence of autoclave pretreatment on biochar performance during mesophilic anaerobic digestion of cellulose. The observations indicated that the influence of biochar was strongly dependent on feedstock type and that biochar pretreatment outperformed untreated biochar in wood-derived systems, as evidenced by BMP tests of cellulose digestion.
Autoclaving some biochar as a pretreatment can lead to increased ultramicropore volume and surface area, resulting in biochars that enhance methane production through greater mass transfer and higher adsorption capacity, consistent with increased microbial attachment inferred from SEM and CFU data. Among the tested samples, autoclaved softwood biochar (AC-SW550) showed the best overall performance, achieving the highest methane yield and biodegradability, together with improved kinetic behaviour. While rice husk biochar (RH550) exhibited reduced methane production after autoclaving, showing severe inhibition, the specific cause of this inhibition was not identified in this study and remains an important limitation and priority for follow-up investigation, since it demonstrates that the beneficial effect of autoclave pretreatment observed for other feedstocks does not generalise across all biochar types. XPS and FTIR indicated only moderate changes in surface functional chemistry, suggesting that pore structure and surface area, rather than surface chemical bonding, are the dominant factors supporting microbial attachment and methane enhancement, consistent with the findings of Wei et al. (2020) [43]. Furthermore, microbial analysis confirmed that raw biochars were initially free of culturable microorganisms, or that cell numbers were too low to be detected by the method used, and that pretreatment improved the subsequent efficiency of culturable cell attachment. These results provide important guidance for selecting and modifying biochar as a support medium for methane enhancement and microbial immobilisation in anaerobic digestion systems and support the role of biochar as an effective carrier for subsequent applications. Additional analysis is required to identify the causes of the inhibition observed with RH550 and to clarify its role in limiting activity. These findings are based on cellulose as a model substrate and should not be over-generalised to anaerobic digestion systems treating complex, real-world feedstocks. Furthermore, microbial characterisation in this study relied on CFU counting and SEM imaging, which demonstrate cell attachment but do not identify the specific microbial groups involved or confirm methanogen enrichment; molecular approaches such as 16S rRNA sequencing or qPCR targeting methanogenic archaea are recommended in future work to confirm the identity and activity of the microorganisms colonising the biochar surface.
Author Contributions
Conceptualization, M.A., V.D. and A.B.R.; Methodology, M.A., O.P., L.F. and A.B.R.; Validation, M.A., V.D., O.P., R.S.D. and A.B.R.; Formal Analysis, M.A. and L.F.; Investigation, M.A.; Resources, M.A., A.B.R. and V.D.; Data Curation, M.A.; Writing—Original Draft Preparation, M.A.; Writing—Review and Editing, M.A., O.P., G.N., L.F., V.D. and A.B.R.; Visualization, M.A.; Supervision, V.D., O.P. and A.B.R.; Project Administration, V.D. and A.B.R.; Funding Acquisition, M.A., V.D. and A.B.R. All authors have read and agreed to the published version of the manuscript.
Funding
This research was funded by the Kuwait Institute for Scientific Research (KISR), Kuwait.
Data Availability Statement
The original contributions presented in this study are included in the article. Further inquiries can be directed to the corresponding author.
Acknowledgments
This research was supported by the Kuwait Institute for Scientific Research—KISR (Kuwait), whose support is gratefully acknowledged. The authors sincerely thank Andrew Britton, Adrian Cunliffe, and Ben Douglas for their valuable assistance with this research and associated analysis. The authors also acknowledge Macauley Hough of LEMAS for providing technical support and assistance in this work. In addition, the authors gratefully acknowledge Esholt Wastewater Treatment Plant (WWTP) for providing inoculum digestate samples used in this study.
Conflicts of Interest
Author Gaurav Nahar is the director of Defiant Renewables Private Limited. The remaining authors declare that the research was conducted in the absence of any commercial or financial relationships that could be construed as a potential conflict of interest.
Abbreviations
The following abbreviations are used in this manuscript:
| AD | Anaerobic Digestion |
| BC | Biochar |
| BET | Brunauer–Emmett–Teller |
| BI | Biodegradability Index |
| BMP | Biochemical Methane Potential |
| CFU | Colony-Forming Units |
| DFT | Density Functional Theory |
| DIET | Direct Interspecies Electron Transfer |
| FTIR | Fourier-Transform Infrared Spectroscopy |
| ISR | Inoculum-to-Substrate Ratio |
| ND | No Data |
| OFG | Oxygenated Functional Groups |
| OW | Oakwood |
| PAH | Polycyclic Aromatic Hydrocarbons |
| RH | Rice husk |
| SEM | Scanning Electron Microscopy |
| SW | Softwood |
| TS | Total Solids |
| VFA | Volatile Fatty Acids |
| VOC | Volatile Organic Compounds |
| VS | Volatile Solids |
| XPS | X-ray Photoelectron Spectroscopy |
References
- Zhang, H.; Banaszak, J.E.; Parameswaran, P.; Alder, J.; Krajmalnik-Brown, R.; Rittmann, B.E. Focused-Pulsed sludge pre-treatment increases the bacterial diversity and relative abundance of acetoclastic methanogens in a full-scale anaerobic digester. Water Res. 2009, 43, 4517–4526. [Google Scholar] [CrossRef] [Scilit] [PubMed]
- Quintana-Najera, J.; Blacker, A.J.; Fletcher, L.A.; Ross, A.B. Understanding the Influence of Biochar Augmentation in Anaerobic Digestion by Principal Component Analysis. Energies 2023, 16, 2523. [Google Scholar] [CrossRef] [Scilit]
- Wang, B.; Gao, B.; Fang, J. Recent advances in engineered biochar productions and applications. Crit. Rev. Environ. Sci. Technol. 2017, 47, 2158–2207. [Google Scholar] [CrossRef] [Scilit]
- Zhang, J.; Zhao, W.; Zhang, H.; Wang, Z.; Fan, C.; Zang, L. Recent achievements in enhancing anaerobic digestion with carbon-based functional materials. Bioresour. Technol. 2018, 266, 555–567. [Google Scholar] [CrossRef] [Scilit] [PubMed]
- Zhao, W.; Yang, H.; He, S.; Zhao, Q.; Wei, L. A review of biochar in anaerobic digestion to improve biogas production: Performances, mechanisms and economic assessments. Bioresour. Technol. 2021, 341, 125797. [Google Scholar] [CrossRef] [Scilit] [PubMed]
- Dutta, T.; Kwon, E.; Bhattacharya, S.S.; Jeon, B.H.; Deep, A.; Uchimiya, M.; Kim, K. Polycyclic aromatic hydrocarbons and volatile organic compounds in biochar and biochar-amended soil: A review. GCB Bioenergy 2017, 9, 990–1004. [Google Scholar] [CrossRef] [Scilit]
- Bolan, S.; Hou, D.; Wang, L.; Hale, L.; Egamberdieva, D.; Tammeorg, P.; Li, R.; Wang, B.; Xu, J.; Wang, T.; et al. The potential of biochar as a microbial carrier for agricultural and environmental applications. Sci. Total Environ. 2023, 886, 163968. [Google Scholar] [CrossRef] [Scilit] [PubMed]
- Fu, J.; Zhang, J.; Jin, C.; Wang, Z.; Wang, T.; Cheng, X.; Ma, C. Effects of temperature, oxygen and steam on pore structure characteristics of coconut husk activated carbon powders prepared by one-step rapid pyrolysis activation process. Bioresour. Technol. 2020, 310, 123413. [Google Scholar] [CrossRef] [Scilit] [PubMed]
- Li, W.; He, L.; Cheng, C.; Cao, G.; Ren, N. Effects of biochar on ethanol-type and butyrate-type fermentative hydrogen productions. Bioresour. Technol. 2020, 306, 123088. [Google Scholar] [CrossRef] [Scilit] [PubMed]
- Hung, Z.S.; Chang, C.C.; Chang, C.F.H.; Lin, Y.S.; Ji, D.R.; Chang, C.Y.; Tseng, J.Y.; Chiang, S.W.; Shie, J.L.; Chen, Y.-H.; et al. Autoclaving treatment of wasted disposable bamboo chopsticks. J. Taiwan Inst. Chem. Eng. 2013, 44, 1010–1015. [Google Scholar] [CrossRef] [Scilit]
- Strömberg, S.; Nistor, M.; Liu, J. Towards eliminating systematic errors caused by the experimental conditions in Biochemical Methane Potential (BMP) tests. Waste Manag. 2014, 34, 1939–1948. [Google Scholar] [CrossRef] [Scilit] [PubMed]
- Schommer, V.A.; Nazari, M.T.; Melara, F.; Braun, J.C.A.; Rempel, A.; dos Santos, L.F.; Ferrari, V.; Colla, L.M.; Dettmer, A.; Piccin, J.S. Techniques and mechanisms of bacteria immobilization on biochar for further environmental and agricultural applications. Microbiol. Res. 2024, 278, 127534. [Google Scholar] [CrossRef] [Scilit] [PubMed]
- Qi, X.; Gou, J.; Chen, X.; Xiao, S.; Ali, I.; Shang, R.; Wang, D.; Wu, Y.; Han, M.; Luo, X. Application of mixed bacteria-loaded biochar to enhance uranium and cadmium immobilization in a co-contaminated soil. J. Hazard Mater. 2021, 401, 123823. [Google Scholar] [CrossRef] [Scilit] [PubMed]
- Wei, T.; Li, X.; Li, H.; Gao, H.; Guo, J.; Li, Y.; Ren, X.; Hua, L.; Jia, H. The potential effectiveness of mixed bacteria-loaded biochar/activated carbon to remediate Cd, Pb co-contaminated soil and improve the performance of pakchoi plants. J. Hazard Mater. 2022, 435, 129006. [Google Scholar] [CrossRef] [Scilit] [PubMed]
- Nieddu, M.; Garau, M.; Vasileiadis, S.; Mangia, N.; Sanna, A.; Roggero, P.P.; Castaldi, P.; Garau, G. Softwood biochar improves soil (bio)chemistry, microbial community structure and function, and Sulla coronaria growth in mediterranean acidic soils. Ital. J. Agron. 2026, 21, 100096. [Google Scholar] [CrossRef] [Scilit]
- American Public Health Association (APHA). Standard Methods for the Examination of Water and Wastewater, 22nd ed.; American Public Health Association: Washington, DC, USA; American Water Works Association (AWWA): Washington, DC, USA; Water Environment Federation (WEF): Washington, DC, USA, 2012. [Google Scholar]
- Singh, B.; Dolk, M.M.; Shen, Q.; Camps-Arbestain, M. Biochar pH, electrical conductivity and liming potential. In Biochar: A Guide to Analytical Methods; CSIRO Publishing: Clayton, Australia, 2017; p. 23. [Google Scholar]
- Buswell, A.M.; Mueller, H.F. Mechanism of methane fermentation. Ind. Eng. Chem. 1952, 44, 550–552. [Google Scholar] [CrossRef] [Scilit]
- Boyle, W.C. Energy Recovery from Sanitary Landfills—A Review; Schlegel, H.G., Barnea, S., Eds.; Microbial Energy Conversion; Pergamon Press: Oxford, UK, 1977; pp. 119–138. [Google Scholar]
- Wall, D.M.; O’Kiely, P.; Murphy, J.D. The potential for biomethane from grass and slurry to satisfy renewable energy targets. Bioresour. Technol. 2013, 149, 425–431. [Google Scholar] [CrossRef] [Scilit] [PubMed]
- Yu, L.; Bian, C.; Zhu, N.; Shen, Y.; Yuan, H. Enhancement of methane production from anaerobic digestion of waste activated sludge with choline supplement. Energy 2019, 173, 1021–1029. [Google Scholar] [CrossRef] [Scilit]
- Deng, C.; Lin, R.; Kang, X.; Wu, B.; O’Shea, R.; Murphy, J.D. Improving gaseous biofuel yield from seaweed through a cascading circular bioenergy system integrating anaerobic digestion and pyrolysis. Renew. Sustain. Energy Rev. 2020, 128, 109895. [Google Scholar] [CrossRef] [Scilit]
- Pasieczna-Patkowska, S.; Madej, J. Comparison of photoacoustic, diffuse reflectance, attenuated total reflectance and transmission infrared spectroscopy for the study of biochars. Pol. J. Chem. Technol. 2018, 20, 75–83. [Google Scholar] [CrossRef] [Scilit]
- Li, M.; Wu, S.C.; Peng, Y.-H.; Shih, Y. Adsorption of volatile organic vapors by activated carbon derived from rice husk under various humidity conditions and its statistical evaluation by linear solvation energy relationships. Sep. Purif. Technol. 2016, 170, 102–108. [Google Scholar] [CrossRef] [Scilit]
- Villota-Enríquez, M.D.; Rodríguez-Páez, J.E. Bio-silica production from rice husk for environmental remediation: Removal of methylene blue from aqueous solutions. Mater. Chem. Phys. 2023, 301, 127671. [Google Scholar] [CrossRef] [Scilit]
- Labbé, N.; Harper, D.; Rials, T.; Elder, T. Chemical structure of wood charcoal by infrared spectroscopy and multivariate analysis. J. Agric. Food Chem. 2006, 54, 3492–3497. [Google Scholar] [CrossRef] [Scilit] [PubMed]
- Song, M.; Yu, L.; Song, B.; Meng, F.; Tang, X. Alkali promoted the adsorption of toluene by adjusting the surface properties of lignin-derived carbon fibers. Environ. Sci. Pollut. Res. 2019, 26, 22284–22294. [Google Scholar] [CrossRef] [Scilit]
- Bardestani, R.; Kaliaguine, S. Steam activation and mild air oxidation of vacuum pyrolysis biochar. Biomass Bioenergy 2018, 108, 101–112. [Google Scholar] [CrossRef] [Scilit]
- Ahmed, M.B.; Zhou, J.L.; Ngo, H.H.; Guo, W.; Chen, M. Progress in the preparation and application of modified biochar for improved contaminant removal from water and wastewater. Bioresour. Technol. 2016, 214, 836–851. [Google Scholar] [CrossRef] [Scilit] [PubMed]
- Ilić, M.; Haegel, F.-H.; Lolić, A.; Nedić, Z.; Tosti, T.; Ignjatović, I.S.; Linden, A.; Jablonowski, N.D.; Hartmann, H. Surface functional groups and degree of carbonization of selected chars from different processes and feedstock. PLoS ONE 2022, 17, e0277365. [Google Scholar] [CrossRef] [Scilit] [PubMed]
- Merel, P.; Tabbal, M.; Chaker, M.; Moisa, S.; Margot, J. Direct evaluation of the sp3 content in diamond-like-carbon films by XPS. Appl. Surf. Sci. 1998, 136, 105–110. [Google Scholar]
- Sitko, R.; Turek, E.; Zawisza, B.; Malicka, E.; Talik, E.; Heimann, J.; Gagor, A.; Feist, B.; Wrzalik, R. Adsorption of divalent metal ions from aqueous solutions using graphene oxide. Dalton Trans. 2013, 42, 5682–5689. [Google Scholar] [CrossRef] [Scilit] [PubMed]
- Gengenbach, T.R.; Major, G.H.; Linford, M.R.; Easton, C.D. Practical guides for x-ray photoelectron spectroscopy (XPS): Interpreting the carbon 1s spectrum. J. Vac. Sci. Technol. A 2021, 39, 013204. [Google Scholar] [CrossRef] [Scilit]
- Terzyk, A.P. The influence of activated carbon surface chemical composition on the adsorption of acetaminophen (paracetamol) in vitro: Part II. TG, FTIR, and XPS analysis of carbons and the temperature dependence of adsorption kinetics at the neutral pH. Colloids Surf. A Physicochem. Eng. Asp. 2001, 177, 23–45. [Google Scholar] [CrossRef] [Scilit]
- Zhang, W.; Nefedov, A.; Naboka, M.; Cao, L.; Wöll, C. Molecular orientation of terephthalic acid assembly on epitaxial graphene: NEXAFS and XPS study. Phys. Chem. Chem. Phys. 2012, 14, 10125–10131. [Google Scholar] [CrossRef] [Scilit] [PubMed]
- Smith, M.; Scudiero, L.; Espinal, J.; McEwen, J.-S.; Garcia-Perez, M. Improving the deconvolution and interpretation of XPS spectra from chars by ab initio calculations. Carbon 2016, 110, 155–171. [Google Scholar] [CrossRef] [Scilit]
- Murugan, N.; Thangarasu, S.; Bhosale, M.K.; Kang, M.; Youn, S.H.; Noh, S.Y.; Han, J.H.; Oh, T.H.; Kim, Y.A. Bio-derived steam-activated porous carbon with a high specific surface area as a sustainable metal-free electrocatalyst for hydrogen evolution applications. New J. Chem. 2026, 50, 3457–3468. [Google Scholar] [CrossRef] [Scilit]
- Wang, W.; Huang, J.; Wu, T.; Ren, X.; Zhao, X. Research on the preparation of biochar from waste and its application in environmental remediation. Water 2023, 15, 3387. [Google Scholar] [CrossRef] [Scilit]
- Lam, S.S.; Su, M.H.; Nam, W.L.; Thoo, D.S.; Ng, C.M.; Liew, R.K.; Yuh Yek, P.N.; Ma, N.L.; Nguyen Vo, D.V. Microwave pyrolysis with steam activation in producing activated carbon for removal of herbicides in agricultural surface water. Ind. Eng. Chem. Res. 2018, 58, 695–703. [Google Scholar] [CrossRef] [Scilit]
- Hill, R.A.; Hunt, J.; Sanders, E.; Tran, M.; Burk, G.A.; Mlsna, T.E.; Fitzkee, N.C. Effect of Biochar on Microbial Growth: A Metabolomics and Bacteriological Investigation in E. coli. Environ. Sci. Technol. 2019, 53, 2635–2646. [Google Scholar] [CrossRef] [Scilit] [PubMed]
- Thommes, M.; Kaneko, K.; Neimark, A.V.; Olivier, J.P.; Rodriguez-Reinoso, F.; Rouquerol, J.; Sing, K.S.W. Physisorption of gases, with special reference to the evaluation of surface area and pore size distribution (IUPAC Technical Report). Pure Appl. Chem. 2015, 87, 1051–1069. [Google Scholar] [CrossRef] [Scilit]
- Carril, P.; Becagli, M.; Celletti, S.; Fedeli, R.; Loppi, S.; Cardelli, R. Biofertilization with Liquid Vermicompost-Activated Biochar Enhances Microbial Activity and Soil Properties. Soil Syst. 2024, 8, 54. [Google Scholar] [CrossRef] [Scilit]
- Wei, L.; Huang, Y.; Huang, L.; Li, Y.; Huang, Q.; Xu, G.; Müller, K.; Wang, H.; Ok, Y.S.; Liu, Z. The ratio of H/C is a useful parameter to predict adsorption of the herbicide metolachlor to biochars. Environ. Res. 2020, 184, 109324. [Google Scholar] [CrossRef] [Scilit] [PubMed]
- Luo, L.; Chu, P.; Liang, J.; Johnravindar, D.; Zhao, J.; Wong, J.W.C. Enhanced stability of food waste anaerobic digestion under low inoculum to substrate ratio by using biochar. Environ. Technol. 2022, 47, 1163–1172. [Google Scholar] [CrossRef] [Scilit] [PubMed]
- Lou, T.; Yin, Y.; Wang, J. Recent advances in effect of biochar on fermentative hydrogen production: Performance and mechanisms. Int. J. Hydrogen Energy 2024, 57, 315–327. [Google Scholar] [CrossRef] [Scilit]
- Qiu, L.; Deng, Y.F.; Wang, F.; Davaritouchaee, M.; Yao, Y.Q. A review on biochar-mediated anaerobic digestion with enhanced methane recovery. Renew. Sustain. Energy Rev. 2019, 115, 109373. [Google Scholar] [CrossRef] [Scilit]
- Drosg, B. Process Monitoring in Biogas Plants; IEA bioenergy: Paris, France, 2013. [Google Scholar]
- Weiland, P. Biogas production: Current state and perspectives. Appl. Microbiol. Biotechnol. 2010, 85, 849–860. [Google Scholar] [PubMed]
- Patel, V.; Pandit, S.; Chandrasekhar, K. Basics of Methanogenesis in Anaerobic Digester; Microbial Applications Volume 2; Springer International Publishing: Cham, Switzerland, 2017; pp. 291–314. [Google Scholar] [CrossRef] [Scilit]
- Franke-Whittle, I.H.; Walter, A.; Ebner, C.; Insam, H. Investigation into the effect of high concentrations of volatile fatty acids in anaerobic digestion on methanogenic communities. Waste Manag. 2014, 34, 2080–2089. [Google Scholar] [CrossRef] [Scilit] [PubMed]
- Cassidy, M.B.; Lee, H.; Trevors, J.T. Environmental applications of immobilized microbial cells: A review. J. Ind. Microbiol. Biotechnol. 1996, 16, 79–101. [Google Scholar] [CrossRef] [Scilit]
- Zur, J.; Wojcieszyńska, D.; Guzik, U. Metabolic responses of bacterial cells to immobilization. Molecules 2016, 21, 958. [Google Scholar] [CrossRef] [Scilit] [PubMed]

Disclaimer/Publisher’s Note: The statements, opinions and data contained in all publications are solely those of the individual author(s) and contributor(s) and not of MDPI and/or the editor(s). MDPI and/or the editor(s) disclaim responsibility for any injury to people or property resulting from any ideas, methods, instructions or products referred to in the content. |
© 2026 by the authors. Licensee MDPI, Basel, Switzerland. This article is an open access article distributed under the terms and conditions of the Creative Commons Attribution (CC BY) license.