


Abstract
This study develops a management-driven and interpretable framework for identifying the formation of scenario-derived accounting increments in coal-fired power plants. Based on real monthly operational and accounting data from a coal-fired power plant in Guangdong Province in 2024, key management activities, including on-site metering, sampling standardization, coal testing timeliness, and net calorific value testing compliance, were represented as structured management-state variables. A baseline accounting scenario and a management-corrected accounting scenario were constructed, and their difference was defined as a scenario-derived accounting increment. Bootstrap resampling, Monte Carlo simulation, ensemble learning, and CatBoost-based SHAP analysis were integrated to characterize how management states affect parameter admissibility, trigger correction rules, and alter accounting results. Under the random split setting, the Best Stacking model achieved an RMSE of 70.76, an MAE of 39.99, and an R2 of 0.999987, and was therefore retained as the primary predictive benchmark. Source-month grouped validation provided an additional internal robustness check, with CatBoost achieving an R2 of 0.990007 under the stricter grouped validation setting. CatBoost-based SHAP analysis showed that net calorific value testing compliance was the dominant management-state contributor, with a contribution share of 73.1%, while coal consumption and purchased electricity ranked second and third, indicating that activity-data magnitude amplified the scenario-derived accounting increments once correction rules were triggered. The proposed framework supports whole-process data-quality control and risk-oriented verification governance in carbon accounting.
1. Introduction
Against the background of China’s carbon peaking and carbon neutrality goals and the continuous advancement of the national carbon emissions trading market, greenhouse gas emission accounting has become an important institutional basis for corporate compliance management, allowance allocation, and carbon asset decision-making [1]. With the continuous expansion of global carbon pricing mechanisms, the accuracy, completeness, and verifiability of emission data have become key prerequisites for the effective operation of carbon markets [2]. Recent studies on China’s carbon emission trading mechanism and ETS-related cost effects further suggest that carbon-pricing and allowance-compliance mechanisms may create management and cost implications for regulated enterprises [3,4]. From the perspective of carbon management practice, emission accounting is not merely an environmental statistical activity, but a fundamental governance tool that connects monitoring, reporting, verification, and compliance decision-making [5]. Therefore, research on carbon accounting in coal-fired power plants needs to extend beyond the calculation of emission results to the reliability, traceability, and interpretability of the formation process of accounting results.
International greenhouse gas accounting systems provide a fundamental framework for emission calculation and data quality control. The IPCC inventory guidelines specify the basic methods for accounting fossil fuel combustion emissions in terms of activity data, emission factors, and uncertainty assessment [6]. The GHG Protocol and ISO 14064-1 establish normative requirements for corporate accounting boundaries, organization-level emission quantification, reporting, and verification [7,8]. The monitoring and reporting regulations of the European Union Emissions Trading System further incorporate monitoring plans, data flow control, calculation factors, and the retention of supporting materials into an institutionalized management process [9]. China’s greenhouse gas accounting methods for power generation enterprises define the rules for determining key parameters, such as coal consumption, net calorific value, carbon content on an as-received basis, and purchased electricity [10]. The technical guidelines for accounting and verification of power generation facilities further strengthen the requirements for key parameter testing, record retention, and data quality control [11]. The general rules for greenhouse gas emission accounting of industrial enterprises emphasize that activity data and emission factors should maintain consistency, completeness, and traceability [12]. It can therefore be seen that the carbon accounting results of coal-fired power plants are not generated by formulas alone, but are jointly determined by accounting boundaries, parameter sources, data quality, and management rules.
Existing studies have mainly explained differences in carbon emission estimates from the perspectives of emission factors, energy statistics, inventory boundaries, and data uncertainty. Marland pointed out that both activity data and fuel parameters introduce uncertainty into the accounting of fossil fuel CO2 emissions [13]. Macknick further analyzed the major sources of discrepancies between energy statistics and CO2 emission data [14]. Studies by Guan et al. and Liu et al. showed that discrepancies in China’s carbon emission estimates are closely related to energy statistical definitions, coal-quality parameters, and emission factor selection [15,16]. The city-level CO2 emission accounts for China constructed by Shan et al. further demonstrated that emission results are highly sensitive to data sources and accounting scales [17]. Andrew compared global fossil carbon emission databases and indicated that inter-database differences are closely associated with activity data, boundary setting, and methodological treatment [18]. These studies have deepened the understanding of uncertainty in carbon accounting. Recent studies on carbon-market integrity also show that accounting reliability is closely associated with verification transparency, baseline credibility, and the completeness of MRV systems [19,20]. In addition, studies on MRV protocols and digital registry systems indicate that traceable data flows and standardized reporting processes are essential for improving the credibility of carbon-market information [21,22]. However, insufficient attention has been paid to the enterprise-level management processes through which parameter records are generated, verified, and admitted into accounting. In particular, the way in which management deficiencies affect parameter admissibility, trigger correction rules, and generate scenario-derived accounting increments remains insufficiently quantified.
For coal-fired power plants, coal consumption depends on records from belt scales, coal feeders, and production systems, whereas carbon content on an as-received basis and the net calorific value depend on sampling, sample preparation, testing timeliness, and laboratory analysis. Coal sampling and calorific value determination are governed by explicit technical standards, indicating that coal-quality parameters are constrained by sample representativeness and testing-method compliance before they enter the accounting process [23,24]. When metering calibration is absent, sampling is non-standardized, testing is delayed, or net calorific value testing is non-compliant, measured parameters may not be directly admissible as compliant parameters for accounting, thereby triggering conservative correction, default-value substitution, or alternative calculation methods. The accounting deviation thus formed is not equivalent to a change in the actual CO2 emission flux at the flue-gas end. Rather, it is a result shift formed through a process in which management practices affect parameter admissibility status, trigger parameter correction rules, and lead to adjustments in the accounting pathway. Therefore, carbon accounting deviation in coal-fired power plants should be understood as a management-induced accounting-result shift formed through parameter admissibility assessment, correction-rule triggering, and accounting-pathway switching, rather than as a simple parameter error or a directly measured physical emission change.
The above deviation formation process is characterized by nonlinearity, rule-triggered responses, and chain transmission, making it difficult for traditional linear analysis to fully reveal the relative contributions of different management measures. Tree-based ensemble models are suitable for capturing nonlinear structures in tabular data [25,26,27]. LightGBM and CatBoost further improve the efficiency and stability of gradient boosting models for complex tabular learning tasks [28,29]. In this study, Stacking is introduced to improve predictive generalization through model complementarity, whereas CatBoost-based SHAP analysis is used to provide tree-model-based feature attribution for the scenario-derived accounting-increment structure [29,30,31].
Recent governance studies further suggest that environmental reporting quality is affected by governance capacity and institutional risk-control mechanisms [32,33]. Climate-policy assessment research also indicates that reliable monitoring and cross-index evaluation are important for linking emission data quality with policy-performance assessment [34]. Although previous studies have provided important insights into carbon accounting uncertainty from the perspectives of emission factors, activity data, accounting boundaries, and statistical uncertainty, three gaps remain in the context of coal-fired power plants. First, existing studies have paid insufficient attention to the enterprise-level management processes through which parameter records are generated, reviewed, and admitted into accounting. Second, the pathway by which management deficiencies trigger conservative correction, default-value substitution, or alternative calculation methods has not been quantitatively represented. Third, the distinction between real operational observations and scenario-derived accounting increments has rarely been explicitly clarified, which may lead to overinterpretation of model-based prediction results.
To address these gaps, this study develops a management-driven and interpretable modeling framework for carbon accounting-deviation formation in coal-fired power plants. The main contributions are as follows. First, key management activities, including metering calibration, as-fired coal metering records, sampling standardization, coal testing timeliness, and net calorific value testing compliance, are represented as structured management-state variables to characterize their influence on parameter admissibility. Second, a dual-scenario accounting framework is constructed to distinguish the baseline accounting scenario from the management-corrected accounting scenario, and their difference is defined as a scenario-derived accounting increment. Third, Bootstrap resampling, Monte Carlo simulation, machine learning, source-month grouped validation, and CatBoost-based SHAP analysis are integrated to identify the nonlinear rule-triggered structure and tree-model-based attribution pattern of scenario-derived accounting-increment formation. Fourth, the contribution of individual management measures and management chains is interpreted to identify key management pathways and priority directions for whole-process data-quality control and risk-oriented verification governance.
2. Formation Mechanism and Interpretable Modeling of Carbon Accounting Deviations
2.1. Management-Driven Formation Mechanism of Carbon Accounting Deviations
Carbon accounting in coal-fired power plants is a result-generation process jointly constrained by accounting boundaries, key parameter admissibility rules, and data compliance status. The general rules for greenhouse gas accounting of industrial enterprises in China emphasize that accounting boundaries, activity data, and emission factors should maintain consistency, completeness, and traceability [12]. In this study, the accounting boundary is defined as the power generation facility, mainly including the combustion system, power system, steam–water system, and related units, while excluding other auxiliary production systems and ancillary production systems within the plant area. The accounting scope covers direct CO2 emissions from fossil fuel combustion and indirect CO2 emissions from purchased electricity consumption. The total accounted emissions are expressed as follows:
where denotes the total carbon emissions within the accounting boundary, denotes emissions from fossil fuel combustion, and denotes indirect emissions from purchased electricity consumption. Fossil fuel combustion emissions constitute the main component of carbon accounting in coal-fired power plants and are primarily determined by parameters such as coal consumption, carbon content on an as-received basis, net calorific value, and carbon oxidation rate. Emissions from purchased electricity consumption are mainly determined by purchased electricity and the grid emission factor.
From the perspective of parameter formation, coal consumption, carbon content on an as-received basis, and net calorific value do not exist independently of the management process. Coal consumption mainly depends on on-site metering devices such as belt scales, and its credibility is affected by equipment calibration, routine inspection, and zero-point checks. Carbon content on an as-received basis and net calorific value mainly rely on coal sampling, testing timeliness, laboratory analysis, and third-party testing reports, and their admissibility depends on sampling representativeness, testing timeliness, and laboratory standardization. When deficiencies exist in the management process, the original measured data may not be directly admissible as compliant parameters for accounting, thereby triggering conservative correction, default-value substitution, or alternative calculation methods, which further leads to adjustments in the accounting pathway. The greenhouse gas emission accounting methods for power generation enterprises specify parameter selection rules when key parameters are missing or fail to meet the required conditions, providing an institutional basis for parameter correction under management-deficiency scenarios [10].
To measure the influence of management practices on parameter admissibility and accounting-pathway switching, this study abstracts the management practices related to carbon accounting in coal-fired power plants into five structured management-state variables, corresponding to key processes such as on-site metering, sample collection and preparation, testing timeliness, and laboratory analysis. Among them, , , and are encoded as binary compliance variables, whereas and are encoded as conditional state variables because their validity depends on upstream management links. Specifically, the interpretation of depends on the calibration status represented by , while the interpretation of depends on the sampling compliance represented by . This coding strategy enables the framework to represent both individual compliance status and chain-dependent transmission of management deficiencies. The specific definitions are presented in Table 1.
Table 1.
Definitions of Structured Management-State Variables.
The five management-state variables were selected through a rule-based mapping between key accounting parameters, parameter-admissibility conditions, and correction-rule triggering pathways, rather than through statistical feature screening. Specifically, and correspond to the admissibility of coal consumption data, and correspond to the admissibility of carbon content on an as-received basis, and corresponds to the admissibility of net calorific value. Therefore, these variables represent management links that can directly trigger conservative correction, default-value substitution, or alternative accounting pathways in the management-corrected accounting scenario. They should not be interpreted as a comprehensive representation of all possible management-related factors.
The above variables are not general statistical features, but structured management-state variables with explicit accounting implications. Their function is to indicate whether key parameters satisfy the conditions for direct adoption and, further, to determine whether correction rules are triggered. According to their objects of influence, the five variables can be divided into the on-site metering management chain and the coal-quality testing management chain.
The conditional states of and were introduced to reflect the sequential dependency of management processes. In the on-site metering chain, valid calibration of the belt scale or coal feeder is a prerequisite for judging whether production-system metering and inspection records can support direct adoption of coal consumption data, and, therefore, when = 0, is assigned a conditional state, rather than being interpreted as a regular compliant or non-compliant record status. Similarly, in the coal-quality testing chain, compliant sampling is a prerequisite for judging the timeliness of carbon-content testing. When = 0, the testing-timeliness status represented by cannot independently ensure the admissibility of the measured carbon-content parameter.
The on-site metering management chain consists of and , which jointly affect the metering credibility of coal consumption. represents the prerequisite calibration status of the belt scale or coal feeder, whereas represents the availability of production-system metering and inspection records under the condition that the upstream calibration requirement is satisfied. When calibration records are missing, production-system metering or inspection records are unavailable or incomplete, or the metering status cannot be effectively verified, the credibility of coal consumption data decreases, and correction based on the conservative principle is required. This correction relationship can be expressed as
where denotes the coal consumption parameter incorporated into the accounting model, denotes the original metered coal consumption, and denotes the conservative correction coefficient. In this study, was set to 0.005, according to the maximum allowable deviation of coal metering equipment adopted in the verification rule, corresponding to a 0.5% conservative correction of coal consumption when metering credibility cannot be verified. When the metering data satisfy the compliance requirements, ; when deficiencies in metering management reduce data credibility, .
The coal-quality testing management chain consists of , , and , which mainly determine the value-selection pathways of carbon content on an as-received basis and net calorific value . represents the prerequisite sampling-compliance condition and determines coal-sample representativeness. represents the timeliness of carbon-content testing under valid sampling conditions; therefore, its interpretation depends on whether the upstream sampling requirement represented by has been satisfied. indicates whether net calorific value testing complies with the prescribed standards and determines whether the measured net calorific value can be directly adopted. These three management variables jointly constitute a quality control chain through which coal-quality parameters are generated from sampling, obtained through testing, and finally admitted into accounting. Non-compliance in any link may weaken the representativeness, timeliness, or admissibility of coal-quality parameters.
When the coal-quality testing chain satisfies the required standards, the measured-value pathway can be preferentially adopted for both carbon content on an as-received basis and net calorific value. In contrast, when sampling is non-standardized, testing is delayed, or net calorific value testing is non-compliant, the measured parameters may not be directly admissible, and default values or alternative calculation methods are required. According to the accounting rules, the prescribed default value may be used when no valid measured value of net calorific value is available or when the testing method fails to meet the requirements. When the measured elemental carbon content does not satisfy the required conditions, the carbon content on an as-received basis can be calculated based on net calorific value and carbon content per unit calorific value. The parameter substitution relationship can be summarized as follows:
where denotes the carbon content on an as-received basis incorporated into the accounting model, denotes the net calorific value determined after management-state assessment, and denotes the carbon content per unit calorific value. Equation (3) indicates that the coal-quality testing chain affects not only whether an individual parameter can be adopted as a measured value, but also whether the value-selection pathway for carbon content on an as-received basis shifts from the measured carbon-content method to the calorific-value-based method, thereby inducing changes at the accounting-pathway level. In particular, testing timeliness and compliance of net calorific value testing are directly related to the adoption mode of key coal-quality parameters, and thus constitute important management nodes affecting the formation of scenario-derived accounting increments. Accordingly, the parameter-admissibility conditions, triggering management states, correction rules, and corresponding regulatory or methodological bases used in the management-corrected scenario are summarized in Table 2.
Table 2.
Correction rules for the management-corrected scenario.
Based on the above analysis, the influence of management practices on carbon accounting results can be interpreted as a continuous management-state transmission process, as shown in Figure 1. First, deficiencies in management practices weaken the reliability and compliance of key parameter data. Second, the decline in parameter credibility triggers conservative correction, default-value substitution, or alternative calculation methods specified in the accounting rules. Moreover, parameter correction alters the original measured-value accounting pathway, causing the accounting process to shift from the baseline scenario to the corrected scenario. Finally, the corrected parameters interact with high-base activity data, such as coal consumption, resulting in a deviation from the baseline accounting results. This mechanism indicates that scenario-derived accounting increments in coal-fired power plants are not the direct result of a single parameter error, but rather arise from the combined effects of management practices, parameter compliance, correction rules, and accounting pathways. The on-site metering management chain mainly affects the accounting results by altering the adoption status of coal consumption, whereas the coal-quality testing management chain affects the accounting results by changing the value-selection pathways of carbon content on an as-received basis and net calorific value. Within the coal-quality testing chain, sampling standardization, testing timeliness, and compliance of net calorific value testing exhibit a continuous operational dependency. Non-compliance in a local link may be amplified into systematic scenario-derived accounting increments through parameter substitution and pathway switching.
Figure 1.
Framework for management-state-driven parameter correction and accounting-increment formation.
The accounting deviation defined in this study reflects the result shift caused by parameter correction, default-value substitution, and accounting-pathway switching under the accounting framework, rather than a synchronous change in the actual CO2 emission flux at the flue-gas end. Therefore, the role of improving management measures is mainly reflected in enhancing parameter admissibility, reducing the probability of triggering conservative correction and alternative accounting pathways, and enabling the accounting results to approach the baseline accounting level under conditions of complete data and compliant parameters. This analytical structure provides the methodological basis for constructing the baseline accounting scenario, management-corrected accounting scenario, and accounting deviation indicator in subsequent analysis, and also establishes the methodological premise for further identifying key management nodes and their chain effects.
2.2. Quantification and Interpretive Analysis of Scenario-Derived Accounting Increments
After clarifying the management-driven parameter correction mechanism, it is necessary to further establish a quantifiable, predictable, and interpretable methodological framework to characterize the effects of different combinations of management states on carbon accounting results.
To avoid ambiguity between real operational observations and simulation-derived samples, the data used in this study were organized into three analytical layers. The first layer consists of real monthly operational and accounting data from the studied coal-fired power plant in 2024, which provide the empirical basis for activity data, coal-quality parameters, and annual correction outcomes. The second layer consists of management-scenario samples generated through Bootstrap resampling and Monte Carlo simulation, which are used to expand the management-state combination space and construct scenario-derived accounting-increment labels. The third layer consists of model outputs generated from candidate machine-learning models and CatBoost-based SHAP analysis, which are used to identify the nonlinear rule-triggered structure and key management nodes within the CatBoost-reproduced accounting-increment structure. The data hierarchy and analytical roles are summarized in Table 3.
Table 3.
Data hierarchy and analytical role in this study.
Therefore, the 5000 samples used for model training and interpretation should not be regarded as 5000 independent real operational observations. Instead, they are scenario-derived samples parameterized by real operational and accounting data and generated under explicit management-state and correction-rule settings.
Based on this data hierarchy, management-state variables, activity data, and coal-quality testing parameters were used as model inputs. The difference between the baseline accounting scenario and the management-corrected accounting scenario was used as the supervised learning label. The Best Stacking model was used for predictive performance benchmarking, whereas CatBoost-based SHAP analysis was used to interpret individual management measures and management chains. The overall analytical workflow is shown in Figure 2.
Figure 2.
Analytical workflow for scenario-derived accounting-increment prediction and interpretation.
To distinguish the baseline accounting results under complete data conditions from the corrected accounting results under management-deficiency conditions, this study constructs a dual-scenario accounting framework. The baseline accounting scenario represents the accounting state in which key activity data and testing parameters satisfy the compliance requirements and no parameter correction rules are triggered. The management-corrected accounting scenario represents the accounting state obtained under specific combinations of management practice states according to parameter correction rules, default-value substitution, or alternative calculation methods. The two scenarios can be expressed as follows:
where denotes the accounted carbon emissions under the baseline accounting scenario, and denotes the accounted carbon emissions under the management-corrected scenario. denotes the set of original activity data, mainly including coal consumption, fuel oil consumption, and purchased electricity consumption. denotes the set of original testing parameters, mainly including carbon content on an as-received basis, net calorific value, and carbon content per unit calorific value. denotes the set of management variables, namely . and denote the activity data and testing parameters after management-state assessment and parameter correction rules are applied, respectively. The accounting deviation is defined as the difference between the management-corrected accounting result and the baseline accounting result:
where denotes the shift in accounting results caused by management deficiencies, conservative parameter correction, default-value substitution, or accounting-pathway switching. When , the accounting result under the management-corrected scenario is higher than that under the baseline scenario; when , the management state does not induce any change in the accounting result; and when , the corrected pathway results in a lower accounting value than the baseline scenario. reflects the accounting deviation under the accounting framework, and does not represent a real physical change in emissions during coal combustion.
Since real operational data from power plants cannot cover all possible combinations of management states, Monte Carlo simulation is employed to generate samples under different management scenarios, thereby expanding the management-state combination space and characterizing the uncertainty of key parameters. The continuous accounting parameters include coal consumption, fuel oil consumption, purchased electricity consumption, carbon content on an as-received basis, net calorific value, and carbon content per unit calorific value. The structured management-state variables include to , comprising three binary compliance variables, namely , , and , and two conditional state variables, namely and . During sample generation, continuous parameters are generated using Bootstrap resampling. By repeatedly resampling with replacement, the Bootstrap method characterizes the uncertainty of statistical estimation under limited samples and improves the robustness of sample expansion [35]. This further enhances the robustness and statistical reliability of kernel density estimation. Management-state variables were generated according to the structured coding logic defined in Table 1. To improve reproducibility, the simulation settings used for generating the 5000 management-scenario samples are summarized in Table 4. Continuous accounting parameters were generated through source-month Bootstrap resampling, so that coal consumption, carbon content on an as-received basis, net calorific value, purchased electricity, and carbon content per unit calorific value were sampled as observed source-month parameter vectors, rather than as mutually independent variables. This strategy preserves the empirical coupling structure observed in the original monthly data. Management-state variables were then assigned according to the structured state logic in Table 1, and conditional states were used to represent upstream management invalidity in and . , , and were generated as binary compliance states, whereas and were generated as conditional states dependent on and , respectively. The relevant accounting parameters were then dynamically adjusted based on the correction rules. Subsequently, the accounting results of the same sample were calculated under both the baseline accounting scenario and the management-corrected accounting scenario, and their difference was used to construct the supervised learning label, namely the scenario-derived accounting increment .
Table 4.
Simulation settings for Bootstrap and Monte Carlo scenario generation.
For scenario expansion rather than empirical frequency estimation, binary compliance states were assigned with equal probability unless constrained by upstream conditional-state rules.
In addition to –, an auxiliary intermediate variable, , was introduced in the data-generation procedure to represent whether the belt-scale or coal-feeder calibration verification passed when a calibration record was available. was not treated as an independent management measure, but as an internal rule variable used to determine whether coal-consumption correction should be triggered. When , was coded as a conditionally invalid state because no valid calibration record was available. When , indicated that the calibration verification passed, whereas indicated that the verification failed. Coal-consumption correction was triggered when , or when , , and . In contrast, when and , the original coal-consumption value was retained; when , , and , the coal-consumption value was also retained because the inspection record provided supporting evidence for data admissibility. In the predictive modeling stage, was not included as an independent input feature because it served only as an auxiliary rule variable within the correction-rule implementation.
The formation of scenario-derived accounting increments exhibits pronounced nonlinearity and rule-triggered characteristics. Continuous parameters affect accounting results through accounting formulas, whereas structured management-state variables alter accounting results by triggering parameter correction and accounting-pathway switching. To compare the predictive performance of different models for scenario-derived accounting increments, this study constructed linear models, conventional nonlinear models, gradient boosting models, and fusion ensemble models, and evaluated model performance using RMSE, MAE, and R2:
where denotes the scenario-derived reference accounting increment of the i-th sample, denotes the model-predicted accounting increment, denotes the mean of the scenario-derived reference labels, and n denotes the number of samples. Five-fold cross-validation was used within the training set to reduce model-selection uncertainty and evaluate model robustness [36]. Hyperparameter optimization was further conducted using Bayesian optimization. For most tunable single models, Bayesian optimization was conducted using the TPE sampler with 50 optimization trials. For the Stacking ensemble model, 30 TPE trials were conducted to optimize the base-learner combination, the Ridge meta-learner regularization strength, and the passthrough setting. Linear Regression was used as a non-tuned benchmark model. The objective function was the five-fold cross-validation RMSE within the training set. The hyperparameter search spaces, optimization settings, and final selected hyperparameters are summarized in Table 5. The TPE algorithm was used to improve the efficiency of hyperparameter search in the predefined parameter space [37]. The independent test set was reserved for final performance reporting, and the source-month grouped validation was used as an additional robustness check to examine the influence of potential source-record overlap among Bootstrap-derived samples.
Table 5.
Hyperparameter search and optimization settings.
All computations were implemented in Python. Data processing was performed using pandas and NumPy; machine-learning models were implemented using scikit-learn, XGBoost, LightGBM, and CatBoost; hyperparameter optimization was conducted using Optuna; and SHAP values were calculated using the SHAP package. The main software and library versions used for reproducible implementation are reported in Table 6.
Table 6.
Software and library versions used for reproducible implementation.
The independent test set was not used during hyperparameter optimization, and was reserved only for final model evaluation. In the modeling framework, the Best Stacking model and the optimized CatBoost model were assigned different methodological roles. The Best Stacking model was used as the primary predictive benchmark because it achieved the lowest prediction error under the random split setting. However, because the Stacking architecture integrates multiple heterogeneous base learners through a Ridge meta-learner, it cannot be treated as a single tree-based model for direct TreeSHAP interpretation. Therefore, the optimized CatBoost model was selected as the SHAP-interpretable tree-based explanatory model for subsequent feature-attribution analysis.
Specifically, TreeSHAP was applied to the trained CatBoost model to decompose the CatBoost-predicted scenario-derived accounting increment into feature-level contributions. The training samples were used as the background reference, and SHAP values were computed for the independent test samples to maintain consistency with the final model-evaluation procedure. The SHAP values were not used to infer physical CO2 emission-causality mechanisms, but to identify how activity data, coal-quality parameters, and structured management-state variables contributed to the model-reproduced accounting-increment structure under the constructed management-scenario framework. Accordingly, all SHAP-based global importance, sample-level contribution, main-effect, and interaction-effect results reported in this study refer to the optimized CatBoost model, rather than the Best Stacking model. SHAP interaction values were further calculated using the native CatBoost SHAP interaction implementation to characterize pairwise interaction structures among management-state variables, activity-data variables, and coal-quality parameters.
According to Shapley value theory, the contribution of each feature can be evaluated by comparing the marginal change in model output before and after the feature is added to different feature coalitions [38]. For tree-based ensemble models, TreeSHAP improves the computational efficiency of SHAP value estimation and supports both local and global interpretation of model outputs [39]. For the i-th feature, its SHAP value can be expressed as
where denotes the full set of features, denotes a feature subset that does not contain feature i, denotes the model prediction based on feature subset S, and denotes the average marginal contribution of feature i to the model prediction.
In addition to CatBoost-based SHAP attribution, this study further conducted a rule-based counterfactual reduction analysis to quantify the accounting-increment reduction potential of individual management measures and management chains. This analysis was independent of SHAP values. SHAP values were used to explain the CatBoost-reproduced accounting-increment structure, whereas reduction potentials and non-additive effect were obtained by directly recalculating the accounting results under explicit management-state interventions.
For the j-th management-scenario sample, let denote the continuous accounting-parameter vector, including activity data and coal-quality parameters, and let = (, , , , ) denote the original management-state vector generated according to Table 1. The reference scenario for the counterfactual analysis was defined as the original management-corrected scenario of each sample. Its scenario-derived accounting increment is expressed as
where denotes the accounting increment before management-state intervention. For a given management intervention set , the counterfactual management-state vector was constructed by setting the management variables included in to their compliant states, while keeping the continuous accounting parameters unchanged. The conditional-state rules were then re-applied to maintain logical consistency: can be interpreted as a valid compliant record state only when , and can be interpreted as a valid timely-testing state only when . The counterfactual accounting increment after intervention is therefore
The reduction effect of intervention is defined as the average decrease in scenario-derived accounting increments across all management-scenario samples:
where represents the net reduction effect obtained through direct counterfactual recalculation of the accounting rules. When , denotes the individual reduction effect of management measure :
For a management chain , the joint chain-level reduction effect is
The additive sum of individual effects within the same chain is
The non-additive effect of the management chain is then defined as the difference between the additive sum of individual effects and the joint chain-level reduction effect:
A positive indicates that the individual reduction effects contain overlapping accounting pathways, and should not be linearly added. In this case, the joint chain-level intervention produces a smaller net reduction than the simple sum of isolated interventions, reflecting pathway overlap and marginal diminishing effects. By contrast, a negative indicates that the joint chain-level intervention produces a larger net reduction than the additive sum of isolated interventions, reflecting synergistic amplification under joint implementation. Therefore, in this study, is interpreted as a non-additive effect of management-chain intervention. When it is positive, it represents an overlap effect caused by shared correction pathways and marginal diminishing effects; when it is negative, it represents a synergy effect caused by joint chain-level amplification. It is obtained from rule-based counterfactual recalculation, and should not be confused with CatBoost-based SHAP interaction values.
Based on the accounting process, the analyzed management chains were defined as follows:
where denotes the on-site metering management chain, denotes the sampling-and-testing chain, denotes the testing-and-calorific-value chain, denotes the coal-quality testing chain, and denotes the full-process management chain.
3. Parameter Coupling and Deviation Characteristics
3.1. Coupling-Relationship Analysis of Key Parameters
To further reveal the influence relationships between key parameters and carbon accounting results in real operational data, this study conducted a Spearman correlation analysis based on 24 sets of monthly operational data from two generating units in 2024. The analyzed variables included bituminous coal consumption, carbon content on an as-received basis (BCC), lower calorific value (LCV), purchased electricity, diesel consumption, and baseline accounting emissions. The results are shown in Figure 3 and Table 7.
Figure 3.
A Spearman correlation heatmap of key parameters.
Table 7.
Results of Correlation Analysis among Key Parameters.
The results show that bituminous coal consumption had the highest observed correlation with baseline accounting emissions, with a Spearman coefficient of 0.914, indicating that the activity database was most closely associated with the variation in baseline accounting results for the studied coal-fired power plant. The correlation between BCC and LCV was 0.837, suggesting an apparent co-variation tendency between the two coal-quality parameters in the observed unit-month records. In contrast, purchased electricity showed a relatively weak correlation with baseline accounting emissions, indicating that baseline accounting results in the studied plant were mainly associated with coal-combustion-related activity data, whereas the purchased-electricity component showed a weaker association with total accounted emissions. No statistical significance claim was made based on the Spearman coefficients, and the subsequent modeling and interpretation did not rely on these coefficients for feature selection or causal inference.
Given the limited sample size of 24 unit-month observations, the Spearman correlation results should be interpreted as exploratory evidence for parameter coupling, rather than as stable population-level correlation estimates. Therefore, the correlation analysis was used only to support the empirical plausibility of parameter coupling among coal consumption, coal-quality parameters, and baseline accounting results, and was not used as a direct basis for causal inference. From the perspective of the accounting mechanism, coal consumption defines the activity database in the accounting formula, whereas BCC and LCV affect the parameter-adoption pathway of coal-quality indicators and the level of emission factors. When coal-quality parameters fluctuate, non-standardized management practices in sampling, testing, and calorific-value verification may prevent measured parameters from being directly adopted, thereby triggering default-value substitution or alternative calculation methods. Therefore, the coupling relationships among parameters observed in real operational data provide an empirical basis for subsequently identifying the management sensitivity of the coal-quality testing chain.
3.2. Fluctuation Characteristics of Coal-Quality Parameters
Coal-quality parameters are the most critical testing parameters in carbon accounting for coal-fired power plants. To characterize the empirical fluctuation basis of coal-quality parameters involved in accounting-increment formation, this study further examined the monthly variation characteristics of carbon content on an as-received basis and lower calorific value for two generating units in 2024. The results are presented in Figure 4 and Table 8.
Figure 4.
Monthly fluctuations in coal-quality parameters.
Table 8.
Statistical Results for Fluctuations in Coal-Quality Parameters.
As shown in Table 8, BCC ranges from 0.4342 to 0.5127, with a coefficient of variation of 3.69%, whereas LCV ranges from 15.9200 to 19.4880 GJ/t, with a coefficient of variation of 4.01%. This indicates that the coal-quality parameters of the studied plant exhibit evident monthly variations, with the fluctuation magnitude of LCV being slightly higher than that of BCC.
Figure 4 further shows that coal-quality parameters remain not constant throughout the year, but vary in a stage-dependent manner across months. Since both BCC and LCV directly participate in the calculation of coal-combustion accounting results and may be involved in default-value substitution or calorific-value-based calculation under management-deficiency conditions, coal-quality fluctuations provide an empirical basis for the sensitivity of accounting results to coal-quality management states. In other words, the subsequent identification of sampling standardization, testing timeliness, and compliance of net calorific value testing as key management-state variables is not merely a model-derived outcome, but is supported by the observed monthly fluctuations of real coal-quality parameters.
3.3. High-Sensitivity Scenario Identification for Accounting-Increment Formation
Based on the fluctuations observed in real operational data, the 5000 management-scenario samples were further used to identify high-sensitivity scenarios associated with scenario-derived accounting increments. In this study, the upper quartile of bituminous coal consumption, 46,516.91 t, was used as the threshold for high coal consumption, while the upper quartile of accounting increment, 41,744.31 tCO2, was used as the threshold for high deviation. Grouped analysis was then conducted in combination with the compliance variable for net calorific value testing, . The results are shown in Figure 5 and Table 9.
Figure 5.
High-sensitivity operating condition identification.
Table 9.
Distribution of Accounting Increments under Different Operating Conditions.
The results show that under the scenario of high coal consumption combined with the non-compliant , the mean accounting increment reaches 39,117.97 tCO2, the median reaches 48,796.98 tCO2, and 74.54% of the samples exceed the upper-quartile threshold of accounting increments. In contrast, under the scenario of high coal consumption with compliant , the mean accounting increment is only 4412.68 tCO2, and no sample exceeds the high-deviation threshold.
This indicates that high scenario-derived accounting increments are not associated with high coal consumption alone, but with the joint occurrence of a high activity database and deficiencies in key coal-quality testing management. In particular, when net calorific value testing is non-compliant, the accounting process may shift from the measured calorific-value pathway to default-value substitution or alternative calculation pathways, thereby further amplifying the parameter correction effect under high coal-consumption conditions. Therefore, the combination of high coal consumption and non-compliance in net calorific value testing can be identified as a high-sensitivity scenario for scenario-derived accounting-increment formation in coal-fired power plants. In practical carbon accounting management, priority should be given to strengthening net calorific value testing and coal testing timeliness during high coal-consumption months, while maintaining sampling-standardization audits as a prerequisite condition for the admissibility of coal-quality testing results. This can reduce the risk of triggering correction rules and help control abnormal increases in scenario-derived accounting results.
3.4. Comparative Analysis of Annual Scenarios
To further examine the annual accounting-result shift caused by parameter correction, this study constructed a monthly comparison between the baseline scenario and the management-corrected scenario, based on the original verification calculation sheet. The results are presented in Figure 6 and Table 10. The baseline scenario represents the accounted emissions obtained when no management correction rules are triggered, whereas the management-corrected scenario represents the accounted emissions after parameter correction, default-value substitution, or alternative calculation methods are implemented according to the verification rules.
Figure 6.
Monthly comparison of baseline and management-corrected scenarios.
Table 10.
Comparison between Annual Baseline and Management-Corrected Scenarios.
The annual baseline accounted emissions were 1,631,282 tCO2, whereas the management-corrected accounted emissions were 1,642,596 tCO2. The difference between the two scenarios was 11,314 tCO2, corresponding to an increase of 0.69%, relative to the baseline scenario. This annual difference represents an accounting-result shift caused by the application of correction rules and alternative parameter-adoption pathways, rather than a directly measured increase in physical CO2 emissions. From the monthly distribution, the annual accounting increment is mainly concentrated in November, indicating that parameter correction in specific months can exert a considerable influence on the annual accounting results during the actual verification process.
This result further confirms that the influence of management practices on carbon accounting results does not necessarily manifest as a persistent annual deviation, but may instead be concentrated in critical months or specific parameter correction links. When the admissibility of coal-quality parameters is problematic in any given month, the correction or substitution pathway specified in the accounting rules directly changes the accounting result for that month and further affects the annual cumulative emissions. Therefore, carbon accounting management in coal-fired power plants should not rely solely on year-end aggregated verification. Instead, a monthly-level mechanism for parameter admissibility review and abnormal-month early warning should be established, with particular attention given to the completeness of coal-quality testing records, the compliance of net calorific value testing, and the basis for determining carbon content on an as-received basis.
3.5. Uncertainty and Sensitivity Checks
To address the uncertainty associated with the limited number of real monthly observations and the scenario-derived nature of the expanded samples, additional uncertainty and sensitivity checks are summarized in Table 11. First, because the Spearman correlation analysis was based on 24 unit-month observations, the correlation results were interpreted as exploratory evidence for parameter coupling, rather than as stable population-level correlation estimates. Second, the observed fluctuation ranges of coal-quality parameters were used to examine the empirical basis for accounting-result sensitivity to coal-quality management states. Third, high-sensitivity scenario grouping was used to evaluate whether large accounting increments were concentrated under specific combinations of high-activity data and management deficiencies. Fourth, source-month grouped validation was used to examine whether model performance was sensitive to potential source-record overlap among Bootstrap-derived samples. It should be noted that these analyses are intended as scenario-based uncertainty and sensitivity checks within the available data framework, rather than a full probabilistic uncertainty-propagation analysis for all accounting parameters.
Table 11.
Summary of uncertainty and sensitivity checks.
As shown in Table 11, the main conclusions were supported by multiple sources of evidence. The coal-quality parameters showed observable monthly fluctuations, with BCC and LCV coefficients of variation of 3.69% and 4.01%, respectively. In addition, the high coal-consumption scenario with non-compliant net calorific value testing showed a mean accounting increment of 39,117.97 tCO2, and 74.54% of samples exceeded the upper-quartile threshold. Under source-month grouped validation, nonlinear ensemble models still retained relatively strong predictive performance within the constructed scenario framework, with CatBoost achieving an R2 of 0.990007. These results indicate that the identified accounting-increment formation pattern was not solely dependent on a single random split or on source-record overlap, although the limited number of real source-month observations remains an important limitation.
4. Accounting Deviation Quantification and Management Mechanism Analysis
4.1. Model Performance Evaluation and Robustness Validation
To ensure the reliability of the subsequent identification of management-measure contributions, the performance of the accounting-deviation prediction models was first evaluated. It should be noted that the “accounting increment” used as the prediction label is a scenario-derived label calculated from the difference between the baseline accounting scenario and the management-corrected accounting scenario, rather than an independently measured physical CO2 emission variable. The input features included bituminous coal consumption, carbon content on an as-received basis (BCC), lower calorific value (LCV), carbon content per unit calorific value (CC), purchased electricity (PE), diesel consumption (DC), and the five structured management-state variables. Among these variables, , , and were treated as binary compliance variables, whereas and were treated as conditional state variables. In addition, was used as an auxiliary intermediate calibration-status variable in the data-generation procedure to implement the metering-chain correction logic, but it was not included as an independent model input feature. The dataset was divided into a training set and an independent test set at a ratio of 8:2, with the random seed set to 42. For reproducibility, the random seeds were fixed throughout the analysis. The source-month Bootstrap resampling seed, Monte Carlo management-state generation seed, random train-test split seed, Optuna-TPE sampler seed, model fitting seed, and source-month grouped partition seed were all set to 42. This setting was used to ensure that the scenario-derived sample generation, model optimization, model fitting, and grouped validation procedures could be reproduced consistently. The training set was used for model fitting, five-fold cross-validation, hyperparameter optimization, and model-selection procedures, whereas the independent test set was reserved only for final-generalization performance evaluation.
Different preprocessing procedures were adopted according to model characteristics. For scale-sensitive models, including Linear Regression, Ridge, Lasso, SVR, and KNN, missing-value imputation and standardization were applied to continuous variables. For tree-based models, missing-value imputation was applied without standardization. The structured management-state variables were treated as categorical variables, rather than ordinal numerical variables. In particular, the state “2” of and represents conditional invalidity caused by upstream management failure, rather than a higher or lower compliance level; therefore, categorical encoding was applied to avoid imposing artificial numerical ordering among management states. Linear Regression, Ridge, Lasso, SVR, and KNN were retained as benchmark models to evaluate whether nonlinear ensemble models could better reproduce the scenario-derived accounting-increment structure.
For tree-based models, including Random Forest, XGBoost, LightGBM, and CatBoost, only missing-value imputation was performed. Hyperparameters of all models were optimized using the Optuna-TPE method. Optuna provides an automated hyperparameter optimization framework that supports efficient tuning of complex machine-learning models [40], and the five-fold cross-validation RMSE on the training set was used as the optimization objective.
Considering that individual models may differ in adaptability across deviation intervals, nonlinear responses, and local rule-triggered scenarios, this study further introduced the Stacking ensemble strategy. Stacking improves overall generalization performance by feeding the predictions of multiple base learners into a meta-learner on the basis of model complementarity [30]. Based on the trained individual models, Random Forest, XGBoost, LightGBM, and CatBoost were used as candidate base learners to construct the Stacking model, with Ridge regression used as the meta-learner. Different combinations of base learners were enumerated to construct Stacking models, with Ridge regression used as the meta-learner. The base-learner combination was selected according to the cross-validation performance within the training set, and the independent test set was used only once to report the final generalization performance of the selected Stacking model.
Table 12 shows that different types of models exhibited substantial performance differences in the accounting-deviation prediction task under the random split setting. Linear models produced relatively large errors, indicating that the accounting increment cannot be adequately represented as a simple linear additive effect of activity data, coal-quality parameters, and management-state variables. Conventional nonlinear models achieved clear improvements over linear models, but their errors remained higher than those of gradient boosting models. CatBoost was the best-performing individual model, with an RMSE of 76.17, an MAE of 44.73, and an R2 of 0.999985 on the test set. On this basis, the Best Stacking model further reduced the RMSE to 70.76 and the MAE to 39.99, while increasing the R2 to 0.999987, indicating that multi-model fusion can further improve the fitting stability of rule-triggered accounting-increment structures.
Table 12.
Predictive Performance Comparison of Candidate Models on the Independent Test Set.
The extremely high R2 should be interpreted with caution. In this study, the accounting increment was not an independently measured physical emission variable, but a scenario-derived label calculated from the difference between the baseline accounting scenario and the management-corrected accounting scenario under explicit correction rules. Therefore, the high predictive performance mainly indicates that the model successfully reproduced the nonlinear and rule-triggered accounting-increment structure embedded in the management-scenario framework, rather than independently discovering a physical CO2 emission-causality mechanism. Considering that Bootstrap-derived samples may share the same original source-month records, an additional grouped validation was further introduced to examine whether the high random-split performance was sensitive to potential dependence among samples derived from the same source records. The results are shown in Table 13.
Table 13.
Robustness validation results under the source-month grouped split.
To further examine whether the high predictive performance was affected by potential source-record overlap among Bootstrap-derived samples, a source-month grouped validation strategy was conducted as a robustness check. In this validation, all simulated samples generated from the same original unit-month record were assigned to the same data partition. The training partition contained 19 source-month groups and 4002 samples, whereas the test partition contained 5 source-month groups and 998 samples.
Under this stricter validation setting, the predictive performance decreased compared with the random split, as expected. Nevertheless, nonlinear ensemble models still retained relatively strong predictive performance within the constructed scenario framework. CatBoost achieved the best grouped-validation performance, with an RMSE of 2258.61, an MAE of 966.22, and an R2 of 0.990007, followed by Stacking, XGBoost, and LightGBM, all of which achieved R2 values close to 0.99. In contrast, linear models showed substantially larger errors. These results suggest that the high random-split performance was not solely attributable to source-record dependence. However, given the limited number of source-month records, broader external validity still requires further validation using multi-plant and multi-year datasets.
Figure 7 further compares the prediction diagnostics of the worst-performing single model and the best ensemble model under the random split setting. The Lasso model exhibits evident systematic deviations, especially in the high accounting-increment range, indicating that a linear additive structure is insufficient to represent the rule-triggered response of accounting increments. In contrast, the Best Stacking model shows a close agreement between the predicted values and the scenario-derived reference labels, with residuals concentrated around zero. This result indicates that the ensemble model can effectively reproduce the nonlinear accounting-increment structure generated under the management-scenario framework.
Figure 7.
Random-split prediction diagnostics for the worst single model and the best ensemble model in scenario-derived accounting-increment prediction.
From the marginal distribution of scenario-derived reference labels, accounting increments exhibit an imbalanced distribution and multi-interval clustering. Low-increment samples mainly correspond to scenarios in which management states are relatively complete or key correction rules are not triggered, whereas high-increment samples usually correspond to scenarios in which critical management links are deficient and conservative correction, default-value substitution, or calorific-value-based calculation is triggered. Therefore, the accounting increment should be interpreted as a systematic scenario-derived outcome shaped by management-state combinations and parameter correction rules, rather than as random noise or a directly measured physical emission change. Based on these results, the Best Stacking model was retained as the primary predictive benchmark, whereas the subsequent SHAP interpretation was performed using the optimized CatBoost model, as specified in Section 2.2.
4.2. Distribution Characteristics of Scenario-Derived Accounting Increments
To reveal the distribution characteristics of scenario-derived accounting increments under different management-state combinations, statistical analysis was conducted on 5000 management-scenario samples generated by Bootstrap resampling and Monte Carlo simulation. The results are shown in Figure 8.
Figure 8.
Distribution of scenario-derived accounting increments under management-scenario samples.
As shown in Figure 8, the scenario-derived accounting increments exhibit a distinct bimodal distribution. The first peak is mainly concentrated in the low-increment range, whereas the second peak is primarily located within the range of 40,000–50,000 tCO2, indicating significant stratification of accounting increments under different management-state combinations. The mean accounting increment is 18,138.33 tCO2, the median is 6157.34 tCO2, and the standard deviation reaches 20,018.38 tCO2, suggesting substantial differences in accounting-result shifts among management scenarios.
Further analysis shows that the first quartile (Q1) is only 402.63 tCO2, whereas the third quartile (Q3) reaches 41,744.31 tCO2. This indicates that approximately 25% of the samples generate only minor accounting increments, while certain management-deficiency scenarios lead to marked increases in scenario-derived accounting increments. The skewness is 0.642, indicating a moderately right-skewed distribution. The kurtosis is 1.360, suggesting that the sample distribution is flatter than a normal distribution and reflecting the pronounced stratification effect of management-state changes on accounting results.
These results indicate that scenario-derived accounting increments are not randomly distributed, but are systematically shaped by specific management-deficiency conditions and correction-rule triggering. When net calorific value testing is non-compliant, coal testing is delayed, or sampling standardization is insufficient, measured parameters may not be directly admissible for accounting, thereby triggering default-value substitution or accounting-pathway adjustment mechanisms. As a result, accounting-result shifts can increase substantially under these management-deficiency scenarios.
4.3. Management-Measure Contributions and Chain Effects
Based on the methodological distinction between predictive modeling and model explanation, CatBoost-based SHAP analysis was further conducted to identify how different features contributed to the CatBoost-predicted scenario-derived accounting increments. The optimized CatBoost model was used as the explained model, and TreeSHAP was applied to the independent test samples. The resulting SHAP values therefore represent feature-level contributions within the CatBoost-reproduced accounting-increment structure, rather than direct explanations of the Best Stacking model or measured changes in actual CO2 emission flux at the flue-gas end. TreeSHAP was adopted because it provides an efficient and theoretically consistent attribution method for tree-based ensemble models [39].
As shown in Figure 9, the CatBoost-based SHAP results demonstrate a highly concentrated contribution structure. was the dominant contributor to the CatBoost-predicted scenario-derived accounting increment, with a mean absolute SHAP value of 18,509.72 and a contribution share of 73.1%, substantially exceeding all other variables. FC and PE ranked second and third, with mean absolute SHAP values of 2718.20 and 1176.03, accounting for 10.7% and 4.6% of the total contribution, respectively. LCV, , BCC, CC, and constituted a secondary contribution group, with mean absolute SHAP values of 607.18, 602.49, 582.10, 479.91, and 473.08, respectively, and each variable contributed approximately 1.9% to 2.4%. In contrast, and showed only marginal contributions, with mean absolute SHAP values of 86.67 and 74.96, respectively, whereas DC showed no contribution under the present CatBoost output structure. The sample-level SHAP distribution further indicates that had the broadest contribution range and the strongest attribution intensity. These results suggest that net calorific value testing compliance was the most influential management-state variable in the CatBoost-reproduced accounting-increment structure, while coal consumption and purchased electricity provided important activity databases that amplified the magnitude of scenario-derived accounting increments.
Figure 9.
CatBoost-based SHAP global importance and sample-level contribution distribution for scenario-derived accounting-increment prediction.
From the perspective of sample-level contribution distributions, exhibited the widest SHAP spread and the strongest attribution intensity, indicating that the compliance state of net calorific value testing strongly affected the CatBoost-predicted accounting-increment output. FC and PE also showed evident contribution ranges, suggesting that activity-data variables determine the magnitude of the accounting result once correction rules or pathway switching are triggered. By contrast, and showed lower global SHAP contributions in the updated CatBoost-based attribution results, but they remain important chain-related management states because they affect whether coal-quality parameters can be directly admitted into the accounting process. Therefore, the SHAP results should be interpreted together with the subsequent accounting-increment reduction analysis and management-chain analysis, rather than as a direct standalone ranking of management-improvement priorities.
The above results indicate that the contribution of management-state variables should not be interpreted only as isolated-feature importance. In the accounting process, management measures are embedded in sequential business chains. Upstream management deficiencies may affect the admissibility of downstream parameters, and further trigger correction-rule pathways. Therefore, it is necessary to further examine whether the combined contribution of a management chain exceeds the contribution of individual management measures.
Based on the counterfactual reduction definitions in Equations (13)–(18), Figure 10 reports the joint chain-level reduction effect, the additive sum of individual reduction effects, and the non-additive effect of each management chain. These quantities were obtained by directly recalculating the scenario-derived accounting increments under conservative counterfactual management-state interventions, rather than from SHAP values. Under this setting, the full-process management chain showed the largest joint-reduction effect, with reaching 22,835.49 tCO2. The coal-quality testing chain also produced a high joint-reduction effect of 22,624.38 tCO2, indicating that the combined improvement of sampling standardization, coal testing timeliness, and net calorific value testing compliance can substantially reduce scenario-derived accounting increments.
Figure 10.
Counterfactual chain-level reduction effects and non-additive effects of management chains.
The sign and magnitude of further reveal the non-additive nature of management-chain intervention. For the coal-quality testing chain, was 19,403.43 tCO2, while was 22,624.38 tCO2, resulting in tCO2. For the full-process management chain, was 19,737.39 tCO2 and was 22,835.49 tCO2, giving tCO2. These negative values indicate synergistic amplification under joint intervention, rather than pathway overlap. By contrast, the on-site metering chain showed a small positive of 53.13 tCO2, indicating weak overlap between the individual effects of metering calibration and metering-record improvement. Overall, Figure 10 demonstrates that the coal-quality testing chain and the full-process management chain have strong joint-reduction potential, and that chain-level management effects should not be inferred by simply adding isolated individual effects.
To distinguish counterfactual chain-level reduction effects from model-attribution interactions, CatBoost-based SHAP main effects and SHAP interaction effects were further examined, as shown in Figure 11. Figure 10 quantifies the reduction potential obtained by recalculating accounting increments under management-state interventions, whereas Figure 11 describes the attribution and interaction structure learned by the optimized CatBoost model. Therefore, the two figures provide complementary, but methodologically distinct, evidence: Figure 10 reflects rule-based counterfactual reduction effects, while Figure 11 reflects CatBoost-based model-attribution effects.
Figure 11.
CatBoost-based SHAP main-effect and interaction-effect network for scenario-derived accounting-increment interpretation.
Figure 11 provides a complementary model-attribution perspective by presenting the CatBoost-based SHAP main-effect and interaction-effect network. In this network, node size represents the absolute SHAP main effect of each variable derived from the optimized CatBoost model, whereas edge thickness represents the absolute SHAP interaction effect between two variables. showed the highest main effect, reaching 18,556.02, indicating that net calorific value testing compliance was the dominant management-state variable in the CatBoost-reproduced accounting-increment structure. FC, BCC, and PE also showed relatively high main effects, with values of 3008.20, 1267.43, and 1192.86, respectively, suggesting that activity data and coal-quality parameters contributed to the magnitude of model-predicted accounting increments. By contrast, the main effects of and were 420.57 and 387.50, respectively, indicating that their global main effects were lower than that of but still relevant within the coal-quality testing management chain. The strongest interaction edges were mainly concentrated between and PE, BCC and , and , and CC, and , and and LCV, indicating that interacted with both activity-data variables and coal-quality parameters in shaping the CatBoost-reproduced accounting-increment structure. Therefore, the network should be interpreted as a CatBoost-based model-attribution result for accounting-pathway switching, rather than as evidence of direct physical emission interactions or as the source of the counterfactual reduction effects shown in Figure 10.
4.4. Accounting-Increment Reduction Analysis of Management Measures
CatBoost-based SHAP attribution identifies how features contribute to the CatBoost-predicted accounting-increment structure, but it does not directly quantify how much the accounting increment would decrease after a specific management measure is improved. Therefore, a rule-based counterfactual reduction analysis was conducted according to Equation (14). For each individual management measure, only the corresponding management state was set to the compliant state, while the other management states and continuous accounting-parameter vector were kept unchanged. Conditional downstream states were re-evaluated only to maintain logical consistency, and were not automatically improved unless they were included in the intervention set. The scenario-derived accounting increment was then recalculated, and the average reduction across all management-scenario samples was used to quantify the individual reduction effect, . The results are shown in Figure 12.
Figure 12.
Counterfactual accounting-increment reduction potential of individual management measures.
As shown in Figure 12, the individual counterfactual reduction effects exhibited a highly concentrated distribution. Net calorific value testing compliance, showed the dominant individual reduction effect, reaching 18,721.13 tCO2 and accounting for 94.85% of the total individual counterfactual reduction potential. To avoid masking the weaker effects of the remaining measures, Figure 12 presents on a large measurement scale and , , , and on a smaller measurement scale. Among the secondary measures, testing timeliness produced the largest reduction effect of 682.30 tCO2, accounting for 3.46%, followed by calibration compliance , with a reduction effect of 280.83 tCO2 and a contribution share of 1.42%. Metering records showed only a marginal reduction effect of 53.13 tCO2, accounting for 0.27%. The individual reduction effect of sampling standardization was 0.00 tCO2 under the conservative counterfactual intervention setting.
The zero individual reduction effect of does not imply that sampling standardization is irrelevant to accounting-increment formation. Rather, it reflects the conditional logic embedded in the accounting rules and the conservative counterfactual intervention setting. Improving alone only restores the sampling state, but does not automatically improve coal testing timeliness or net calorific value testing compliance . Therefore, the accounting pathway cannot be switched from the heat-value-based correction method to the measured carbon-content method unless , , and are jointly compliant. In this sense, plays a chain-dependent prerequisite role, rather than an independently effective reduction role. This result further demonstrates the necessity of distinguishing individual counterfactual reduction effects from chain-level joint effects.
4.5. Data-Quality Management Resource-Allocation Strategy
Based on CatBoost-based SHAP attribution, counterfactual individual reduction effects, and chain-level non-additive effects, Figure 13 summarizes an integrated management-priority pathway for carbon-accounting data-quality improvement. This pathway should not be interpreted as a simple ranking derived from a single indicator. Instead, it integrates the dominant individual reduction effect of , the secondary individual effects of and , the limited but non-negligible role of , and the chain-dependent prerequisite role of within the coal-quality testing process.
Figure 13.
Integrated management-priority pathway for carbon-accounting data-quality improvement.
As shown in Figure 13, net calorific value testing compliance should be treated as the primary management priority, because it produced the dominant individual counterfactual reduction effect and occupied the core position in the CatBoost-based attribution results. Coal testing timeliness represents the most important secondary measure within the coal-quality testing chain, and should be improved, together with , to reduce the triggering probability of default-value substitution and heat-value-based calculation. Metering equipment calibration and as-fired coal metering records showed smaller individual reduction effects, and therefore belong to the secondary improvement tier under the current correction-rule setting. Although sampling standardization showed no independent reduction effect under the conservative counterfactual intervention setting, it should still be maintained as a prerequisite management condition within the coal-quality testing chain because the measured carbon-content pathway can be restored only when , , and are jointly compliant.
Therefore, the revised priority pathway emphasizes both independent reduction potential and chain-dependent validity. and constitute the core intervention focus within the coal-quality testing chain, whereas provides the prerequisite condition for restoring the measured carbon-content accounting pathway. The on-site metering chain, represented by and , has smaller individual reduction effects, but remains relevant for improving the traceability and admissibility of coal-consumption data. This integrated interpretation avoids treating individual counterfactual effects, SHAP attribution results, and chain-level effects as interchangeable quantities.
5. Discussion
5.1. Interpretation of Model Performance and Accounting-Increment Structure
The model comparison results indicate that the rule-triggered accounting-increment structure is better represented by nonlinear ensemble models than by linear benchmark models. This is consistent with the mechanism defined in this study: management states do not affect accounting results through a single continuous linear pathway, but through conditional parameter admissibility, conservative correction, default-value substitution, and accounting-pathway switching. Therefore, the superior performance of Stacking, CatBoost, XGBoost, and LightGBM should be interpreted as evidence that these models are more suitable for reproducing threshold-like and pathway-switching responses embedded in the constructed accounting rules.
The source-month grouped validation provides a useful robustness check, but its evidential scope should be carefully bounded. Because the analysis was based on one coal-fired power plant, one accounting year, 24 source-month records, and one grouped split, the grouped validation results should be interpreted as supporting robustness within the present scenario-generation framework, rather than establishing broad external validity. In this sense, the grouped validation reduces the possibility that the random-split performance is entirely driven by source-record overlap, but further multi-plant and multi-year validation is still required before the model can be generalized to other power plants or accounting contexts.
5.2. Management Implications of CatBoost-Based SHAP Interpretation
The CatBoost-based SHAP results provide an attribution perspective for understanding how management states and activity databases jointly shape the model-reproduced accounting-increment structure. The dominant attribution of indicates that net calorific value testing compliance is a critical trigger for accounting-pathway switching, whereas the high attribution of FC and PE indicates that activity databases determine the scale of accounting-result shifts once correction rules are activated. This finding extends previous carbon-accounting studies that mainly emphasized activity-data quality, emission-factor uncertainty, inventory boundaries, and MRV completeness [18,19,22], by showing that enterprise-level parameter admissibility and correction-rule triggering can also be important sources of accounting-result variation.
From the perspective of data-quality governance, the results suggest that management priorities should not be determined from SHAP ranking alone. SHAP attribution identifies the variables that most strongly shape the CatBoost-predicted accounting-increment structure, whereas the counterfactual reduction analysis identifies how accounting increments change under explicit management-state interventions. Therefore, the practical implication is not a simple feature-importance ranking, but a combined governance logic: coal-quality testing compliance controls whether measured parameters can be admitted into accounting, activity databases amplify the magnitude of accounting-result shifts, and chain-dependent variables determine whether measured-value pathways can be restored under joint compliant conditions.
5.3. Methodological Boundaries and Practical Applicability
The proposed framework is sensitive to several modeling assumptions. First, the management-state variables were represented as discrete compliance or conditional states, which improves interpretability but simplifies the diversity of actual management practices. In practice, calibration accuracy, testing frequency, sampling representativeness, record completeness, and third-party verification quality may vary continuously or semi-quantitatively. Second, the Monte Carlo state-generation process assumes equal probabilities for binary compliance states unless constrained by upstream conditional rules. This setting is appropriate for scenario-space expansion, but it should not be interpreted as an empirical frequency distribution of management deficiencies. Third, the counterfactual reduction analysis depends on the specified accounting rules and conservative intervention setting; different regulatory rules, default values, or parameter-adoption criteria may lead to different reduction-effect patterns.
The transferability of the framework should therefore be understood at the methodological, rather than numerical, level. The general logic of representing management practices as structured state variables, linking them to parameter admissibility, and recalculating accounting results under explicit correction rules can be applied to other coal-fired power plants or regulated industrial facilities. However, the specific parameter distributions, model coefficients, SHAP attribution patterns, and reduction potentials obtained in this study are plant-specific because they were derived from one plant, one accounting year, and 24 source-month records. Future applications should recalibrate the correction rules, parameter distributions, and management-state probabilities using multi-plant and multi-year datasets before drawing broader conclusions.
From a practical perspective, the framework can support risk-oriented verification and whole-process data-quality control. For verification agencies, it provides a way to identify management links that are more likely to trigger parameter correction or alternative accounting pathways. For power-plant compliance departments, it can guide a monthly review of coal-quality testing records, calibration evidence, and parameter-adoption documentation before annual verification. For regulators, the framework suggests that digital MRV systems should record not only final accounting values, but also the management evidence supporting parameter admissibility and correction-rule decisions.
5.4. Accounting and Compliance Implications of Scenario-Derived Increments
Beyond model interpretation, the scenario-derived accounting increment may also have practical implications for allowance management and compliance reporting. The annual scenario comparison showed that the management-corrected accounting result was 11,314 tCO2 higher than the baseline accounting result, corresponding to an increase of 0.69%. Under a carbon-pricing or allowance-compliance framework, such an accounting-result shift may translate into additional allowance demand or increased compliance-management pressure [3,4]. The potential financial exposure can be expressed as
where denotes the scenario-derived accounting increment and denotes the applicable carbon allowance price. To illustrate the potential magnitude of compliance-related financial exposure, Table 14 presents a simple scenario calculation under hypothetical carbon-price assumptions. These values should not be interpreted as actual market costs, but as an illustrative conversion of accounting-result shifts into potential allowance-management exposure.
Table 14.
Illustrative financial exposure scenarios.
The illustrative results in Table 14 indicate that even a relatively small accounting-result shift may correspond to non-negligible allowance-management exposure under carbon-price scenarios. This potential exposure also reflects the need for risk-oriented compliance management in carbon-market governance [33]. Therefore, improving data admissibility and reducing the triggering probability of correction rules can help enterprises control not only accounting-result deviations but also potential compliance-related financial uncertainty.
6. Conclusions
This study developed a management-driven and interpretable modeling framework for identifying the formation mechanism of scenario-derived accounting increments in coal-fired power plants. Based on real monthly operational and accounting data from a coal-fired power plant in Guangdong Province in 2024, five key management measures were represented as structured management-state variables, including three binary compliance variables and two conditional state variables. A dual-scenario accounting framework was then constructed, consisting of a baseline accounting scenario and a management-corrected accounting scenario. The difference between the two scenarios was defined as a scenario-derived accounting increment, which was used to quantify carbon accounting deviation under the constructed management scenarios. This definition indicates that the deviation analyzed in this study is a scenario-derived accounting result formed through parameter correction, default-value substitution, and accounting-pathway switching, rather than a directly measured change in physical CO2 emissions at the flue-gas end. The annual comparison showed that the management-corrected accounting result was 11,314 tCO2 higher than the baseline accounting result, corresponding to an increase of 0.69%, indicating that management deficiencies can lead to measurable shifts in accounting results under the constructed accounting scenarios.
The model comparison results showed that nonlinear ensemble models were more suitable than linear models for reproducing the rule-triggered structure of scenario-derived accounting increments. Under the random split setting, the Best Stacking model achieved the best overall performance, with an RMSE of 70.76, an MAE of 39.99, and an R2 of 0.999987. This high predictive performance should be interpreted as the model’s ability to reproduce the nonlinear and rule-triggered accounting-increment structure embedded in the management-scenario framework, rather than as evidence of independently identified physical CO2 emission causality. To further address the potential influence of source-record overlap among Bootstrap-derived samples, a source-month grouped validation strategy was conducted as a robustness check. Under this stricter setting, the predictive performance decreased compared with the random split, as expected, while nonlinear ensemble models still retained a relatively strong performance within the constructed scenario framework. CatBoost achieved an RMSE of 2258.61, an MAE of 966.22, and an R2 of 0.990007, while Stacking, XGBoost, and LightGBM also achieved R2 values close to 0.99. These results indicate that the model performance was not solely attributable to source-record overlap, and further support the nonlinear and rule-triggered characteristics of accounting-increment formation.
The CatBoost-based SHAP interpretation further showed that was the dominant management-state contributor to the CatBoost-reproduced scenario-derived accounting-increment structure, with a contribution share of 73.1%. FC and PE ranked second and third, indicating that activity databases also played important roles in determining the magnitude of accounting increments once correction rules or pathway switching were triggered. The counterfactual reduction analysis further showed that net calorific value testing compliance dominated the individual reduction potential, with an average reduction effect of 18,721.13 tCO2 and a contribution share of 94.85%. Testing timeliness , calibration compliance , and metering records produced smaller individual reduction effects, whereas sampling standardization showed no independent reduction effect under the conservative intervention setting. However, should not be regarded as irrelevant, because it functions as a prerequisite state within the coal-quality testing chain and becomes effective mainly through joint chain-level intervention. These findings suggest that management priorities should be determined by jointly considering CatBoost-based SHAP attribution, counterfactual individual reduction effects, and chain-level non-additive effects. Accordingly, coal-fired power plants should prioritize net calorific value testing compliance and coal testing timeliness, while maintaining sampling standardization as a prerequisite condition for restoring the measured carbon-content accounting pathway and improving calibration compliance and metering records as secondary measures for enhancing coal-consumption data traceability. These conclusions should be interpreted as management implications within the constructed scenario framework, rather than as direct evidence of physical CO2 emission reduction. This study still has several limitations: the empirical basis was derived from one coal-fired power plant and one accounting year; the 5000 samples were scenario-derived samples, rather than independent real operational observations; and the structured management-state variables still simplify complex management practices into discrete states. Future research should incorporate multi-plant and multi-year datasets, introduce more refined management indicators such as testing frequency, calibration accuracy, sampling representativeness, record completeness, and third-party verification quality, and integrate continuous emission monitoring data or digital MRV systems to further distinguish accounting-result deviations from actual physical emission variations.
Author Contributions
Conceptualization, P.C. and Y.D.; methodology, Y.D.; software, Y.D. and F.H.; validation, Y.D. and F.H.; formal analysis, Y.D.; investigation, F.H.; resources, P.C.; data curation, Y.D. and F.H.; writing—original draft preparation, Y.D.; writing—review and editing, P.C. and F.H.; visualization, Y.D.; supervision, P.C.; project administration, P.C.; funding acquisition, P.C. All authors have read and agreed to the published version of the manuscript.
Funding
This research was funded by the Shaanxi Provincial Key R&D Project for Tackling Core Technologies, grant number (2024SF2-GJHX-10).
Data Availability Statement
The raw monthly operational and accounting data used in this study are not publicly available because they contain plant-specific production records, verification calculation sheets, and enterprise carbon-accounting information. The anonymized and derived datasets used for model training, source-month grouped validation, and CatBoost-based SHAP analysis, together with the main Python scripts for data preprocessing, model training, robustness validation, and visualization, are available from the corresponding author upon reasonable request and with permission from the data provider. The simulation procedure, variable definitions, correction rules, and summary statistics required to reproduce the main analytical results are described in Section 2, Section 3 and Section 4.
Conflicts of Interest
The authors declare no conflicts of interest.
References
- United Nations. Paris Agreement; United Nations: Paris, France, 2015. [Google Scholar]
- World Bank. State and Trends of Carbon Pricing 2024; World Bank: Washington, DC, USA, 2024. [Google Scholar]
- Chen, N.; Zhao, Y.; He, H.; Ma, X.; Xu, X.; Li, L.; Gang, S.; Xue, B. Stability analysis of carbon emission trading mechanism in China based on a tripartite evolutionary game. Sci. Rep. 2025, 15, 7304. [Google Scholar] [CrossRef] [Scilit] [PubMed]
- Li, J.; Sun, Q.; Yang, F.; Wang, C.; Feng, K.; Xin, Y.; Wang, W.; Li, D. Expanding the emissions trading system coverage can increase the cost competitiveness of low-carbon ammonia in China. Commun. Earth Environ. 2025, 6, 231. [Google Scholar] [CrossRef] [Scilit]
- Bellassen, V.; Stephan, N. Accounting for Carbon: Monitoring, Reporting and Verifying Emissions in the Climate Economy; Cambridge University Press: Cambridge, UK, 2015. [Google Scholar]
- Eggleston, H.S.; Buendia, L.; Miwa, K.; Ngara, T.; Tanabe, K. 2006 IPCC Guidelines for National Greenhouse Gas Inventories; Institute for Global Environmental Strategies: Hayama, Japan, 2006. [Google Scholar]
- World Resources Institute; World Business Council for Sustainable Development. The Greenhouse Gas Protocol: A Corporate Accounting and Reporting Standard, Revised ed.; WRI/WBCSD: Washington, DC, USA, 2004. [Google Scholar]
- ISO 14064-1:2018; Greenhouse Gases, Part 1: Specification with Guidance at the Organization Level for Quantification and Reporting of Greenhouse Gas Emissions and Removals. International Organization for Standardization (ISO): Geneva, Switzerland, 2018.
- European Commission. Commission Implementing Regulation (EU) 2018/2066 of 19 December 2018 on the Monitoring and Reporting of Greenhouse Gas Emissions. Off. J. Eur. Union 2018, L334, 1–93. [Google Scholar]
- General Office of the National Development and Reform Commission of China. Guidelines for Greenhouse Gas Emission Accounting Methods and Reporting for Chinese Power Generation Enterprises (Trial); NDRC Climate Office [2013] No. 2526; General Office of the National Development and Reform Commission of China: Beijing, China, 2013.
- General Office of the Ministry of Ecology and Environment. Guidelines for Enterprise Greenhouse Gas Emission Accounting and Reporting: Power Generation Facilities; MEE General Office Climate Letter [2022] No. 485; General Office of the Ministry of Ecology and Environment: Beijing, China, 2022.
- GB/T 32150-2015; General Guideline of the Greenhouse Gas Emissions Accounting and Reporting for Industrial Enterprises. Standards Press of China: Beijing, China, 2015.
- Marland, G. Uncertainties in accounting for CO2 from fossil fuels. J. Ind. Ecol. 2008, 12, 136–139. [Google Scholar] [CrossRef] [Scilit]
- Macknick, J. Energy and CO2 emission data uncertainties. Carbon Manag. 2011, 2, 189–205. [Google Scholar] [CrossRef] [Scilit]
- Guan, D.; Liu, Z.; Geng, Y.; Lindner, S.; Hubacek, K. The gigatonne gap in China’s carbon dioxide inventories. Nat. Clim. Change 2012, 2, 672–675. [Google Scholar] [CrossRef] [Scilit]
- Liu, Z.; Guan, D.; Wei, W.; Davis, S.J.; Ciais, P.; Bai, J.; Peng, S.; Zhang, Q.; Hubacek, K.; Marland, G.; et al. Reduced carbon emission estimates from fossil fuel combustion and cement production in China. Nature 2015, 524, 335–338. [Google Scholar] [CrossRef] [Scilit] [PubMed]
- Shan, Y.; Guan, D.; Zheng, H.; Ou, J.; Li, Y.; Meng, J.; Mi, Z.; Liu, Z.; Zhang, Q. China CO2 emission accounts 1997–2015. Sci. Data 2018, 5, 170201. [Google Scholar] [CrossRef] [Scilit] [PubMed]
- Andrew, R.M. A comparison of estimates of global carbon dioxide emissions from fossil carbon sources. Earth Syst. Sci. Data 2020, 12, 1437–1465. [Google Scholar] [CrossRef] [Scilit]
- Sasaki, N. Addressing scandals and greenwashing in carbon offset markets: A framework for reform. Glob. Transit. 2025, 7, 375–382. [Google Scholar] [CrossRef] [Scilit]
- Yang, D.; Park, H.M. Integrity challenges in carbon markets: Comparing UNFCCC and voluntary REDD+ verification in the Amazon Biome. Environ. Sci. Policy 2025, 169, 104080. [Google Scholar] [CrossRef] [Scilit]
- Thornbush, M.; Govind, A. Monitoring, Reporting, and Verification (MRV) Protocols Used in Carbon Trading Applied to Dryland Nations in the Global South for Climate Change Mitigation. Sustainability 2025, 17, 11001. [Google Scholar] [CrossRef] [Scilit]
- Liu, X.; Bagchi, T.; Sy, C.L.; Gao, H.O. A blockchain-based carbon registry platform for credible climate action in transportation. npj Clim. Action 2026, 5, 23. [Google Scholar] [CrossRef] [Scilit]
- GB/T 475-2008; Method for Manual Sampling of Commercial Coal. Standards Press of China: Beijing, China, 2008.
- GB/T 213-2008; Method for Determination of Calorific Value of Coal. Standards Press of China: Beijing, China, 2008.
- Breiman, L. Random forests. Mach. Learn. 2001, 45, 5–32. [Google Scholar] [CrossRef] [Scilit]
- Friedman, J.H. Greedy function approximation: A gradient boosting machine. Ann. Stat. 2001, 29, 1189–1232. [Google Scholar] [CrossRef] [Scilit]
- Chen, T.; Guestrin, C. XGBoost: A scalable tree boosting system. In Proceedings of the 22nd ACM SIGKDD International Conference on Knowledge Discovery and Data Mining; ACM: New York, NY, USA, 2016; pp. 785–794. [Google Scholar]
- Ke, G.; Meng, Q.; Finley, T.; Wang, T.; Chen, W.; Ma, W.; Ye, Q.; Liu, T.Y. LightGBM: A highly efficient gradient boosting decision tree. In Advances in Neural Information Processing Systems 30; Curran Associates: Long Beach, CA, USA, 2017. [Google Scholar]
- Prokhorenkova, L.; Gusev, G.; Vorobev, A.; Dorogush, A.V.; Gulin, A. CatBoost: Unbiased boosting with categorical features. In Advances in Neural Information Processing Systems 31; Curran Associates: Montreal, QC, Canada, 2018. [Google Scholar]
- Wolpert, D.H. Stacked generalization. Neural Netw. 1992, 5, 241–259. [Google Scholar] [CrossRef] [Scilit]
- Lundberg, S.M.; Lee, S.I. A unified approach to interpreting model predictions. In Advances in Neural Information Processing Systems 30; Curran Associates: Long Beach, CA, USA, 2017; pp. 4765–4774. [Google Scholar]
- Durczak, K.; Sala, D.; Liashenko, O.; Pyzalski, M.; Pavlov, K.; Pavlova, O.; Romaniuk, R.; Sujak, A. Governance Matters: Evidence from Global Analysis on Environmental Sustainable Development Goals. Sustainability 2026, 18, 1140. [Google Scholar] [CrossRef] [Scilit]
- Sala, D.; Liashenko, O.; Pavlov, K.; Pavlova, O.; Romaniuk, R.; Kotsan, I.; Pyzalski, M. From Shocks to Structure: Climate-Related Losses, Fiscal Sustainability, and Risk Governance in Europe. Sustainability 2026, 18, 3164. [Google Scholar] [CrossRef] [Scilit]
- Matukhno, O.; Stanytsina, V.; Dobrovolska, O.; Artemchuk, V. An Exploratory Protocol for Sustainability-Oriented Cross-Index Assessment of National Climate Policy Effectiveness. Sustainability 2026, 18, 3444. [Google Scholar] [CrossRef] [Scilit]
- Efron, B. Bootstrap methods: Another look at the jackknife. Ann. Stat. 1979, 7, 1–26. [Google Scholar] [CrossRef] [Scilit]
- Kohavi, R. A study of cross-validation and bootstrap for accuracy estimation and model selection. In Proceedings of the 14th International Joint Conference on Artificial Intelligence; Morgan Kaufmann: Montreal, QC, Canada, 1995; pp. 1137–1143. [Google Scholar]
- Bergstra, J.; Bardenet, R.; Bengio, Y.; Kégl, B. Algorithms for hyper-parameter optimization. In Advances in Neural Information Processing Systems 24; Curran Associates: Granada, Spain, 2011; pp. 2546–2554. [Google Scholar]
- Shapley, L.S. A value for n-person games. In Contributions to the Theory of Games II; Kuhn, H.W., Tucker, A.W., Eds.; Princeton University Press: Princeton, NJ, USA, 1953; pp. 307–317. [Google Scholar]
- Lundberg, S.M.; Erion, G.; Chen, H.; DeGrave, A.; Prutkin, J.M.; Nair, B.; Katz, R.; Himmelfarb, J.; Bansal, N.; Lee, S.I. From local explanations to global understanding with explainable AI for trees. Nat. Mach. Intell. 2020, 2, 56–67. [Google Scholar] [CrossRef] [Scilit] [PubMed]
- Akiba, T.; Sano, S.; Yanase, T.; Ohta, T.; Koyama, M. Optuna: A next-generation hyperparameter optimization framework. In Proceedings of the 25th ACM SIGKDD International Conference on Knowledge Discovery and Data Mining; ACM: New York, NY, USA, 2019; pp. 623–2631. [Google Scholar]
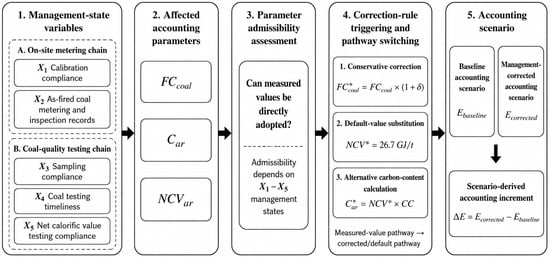
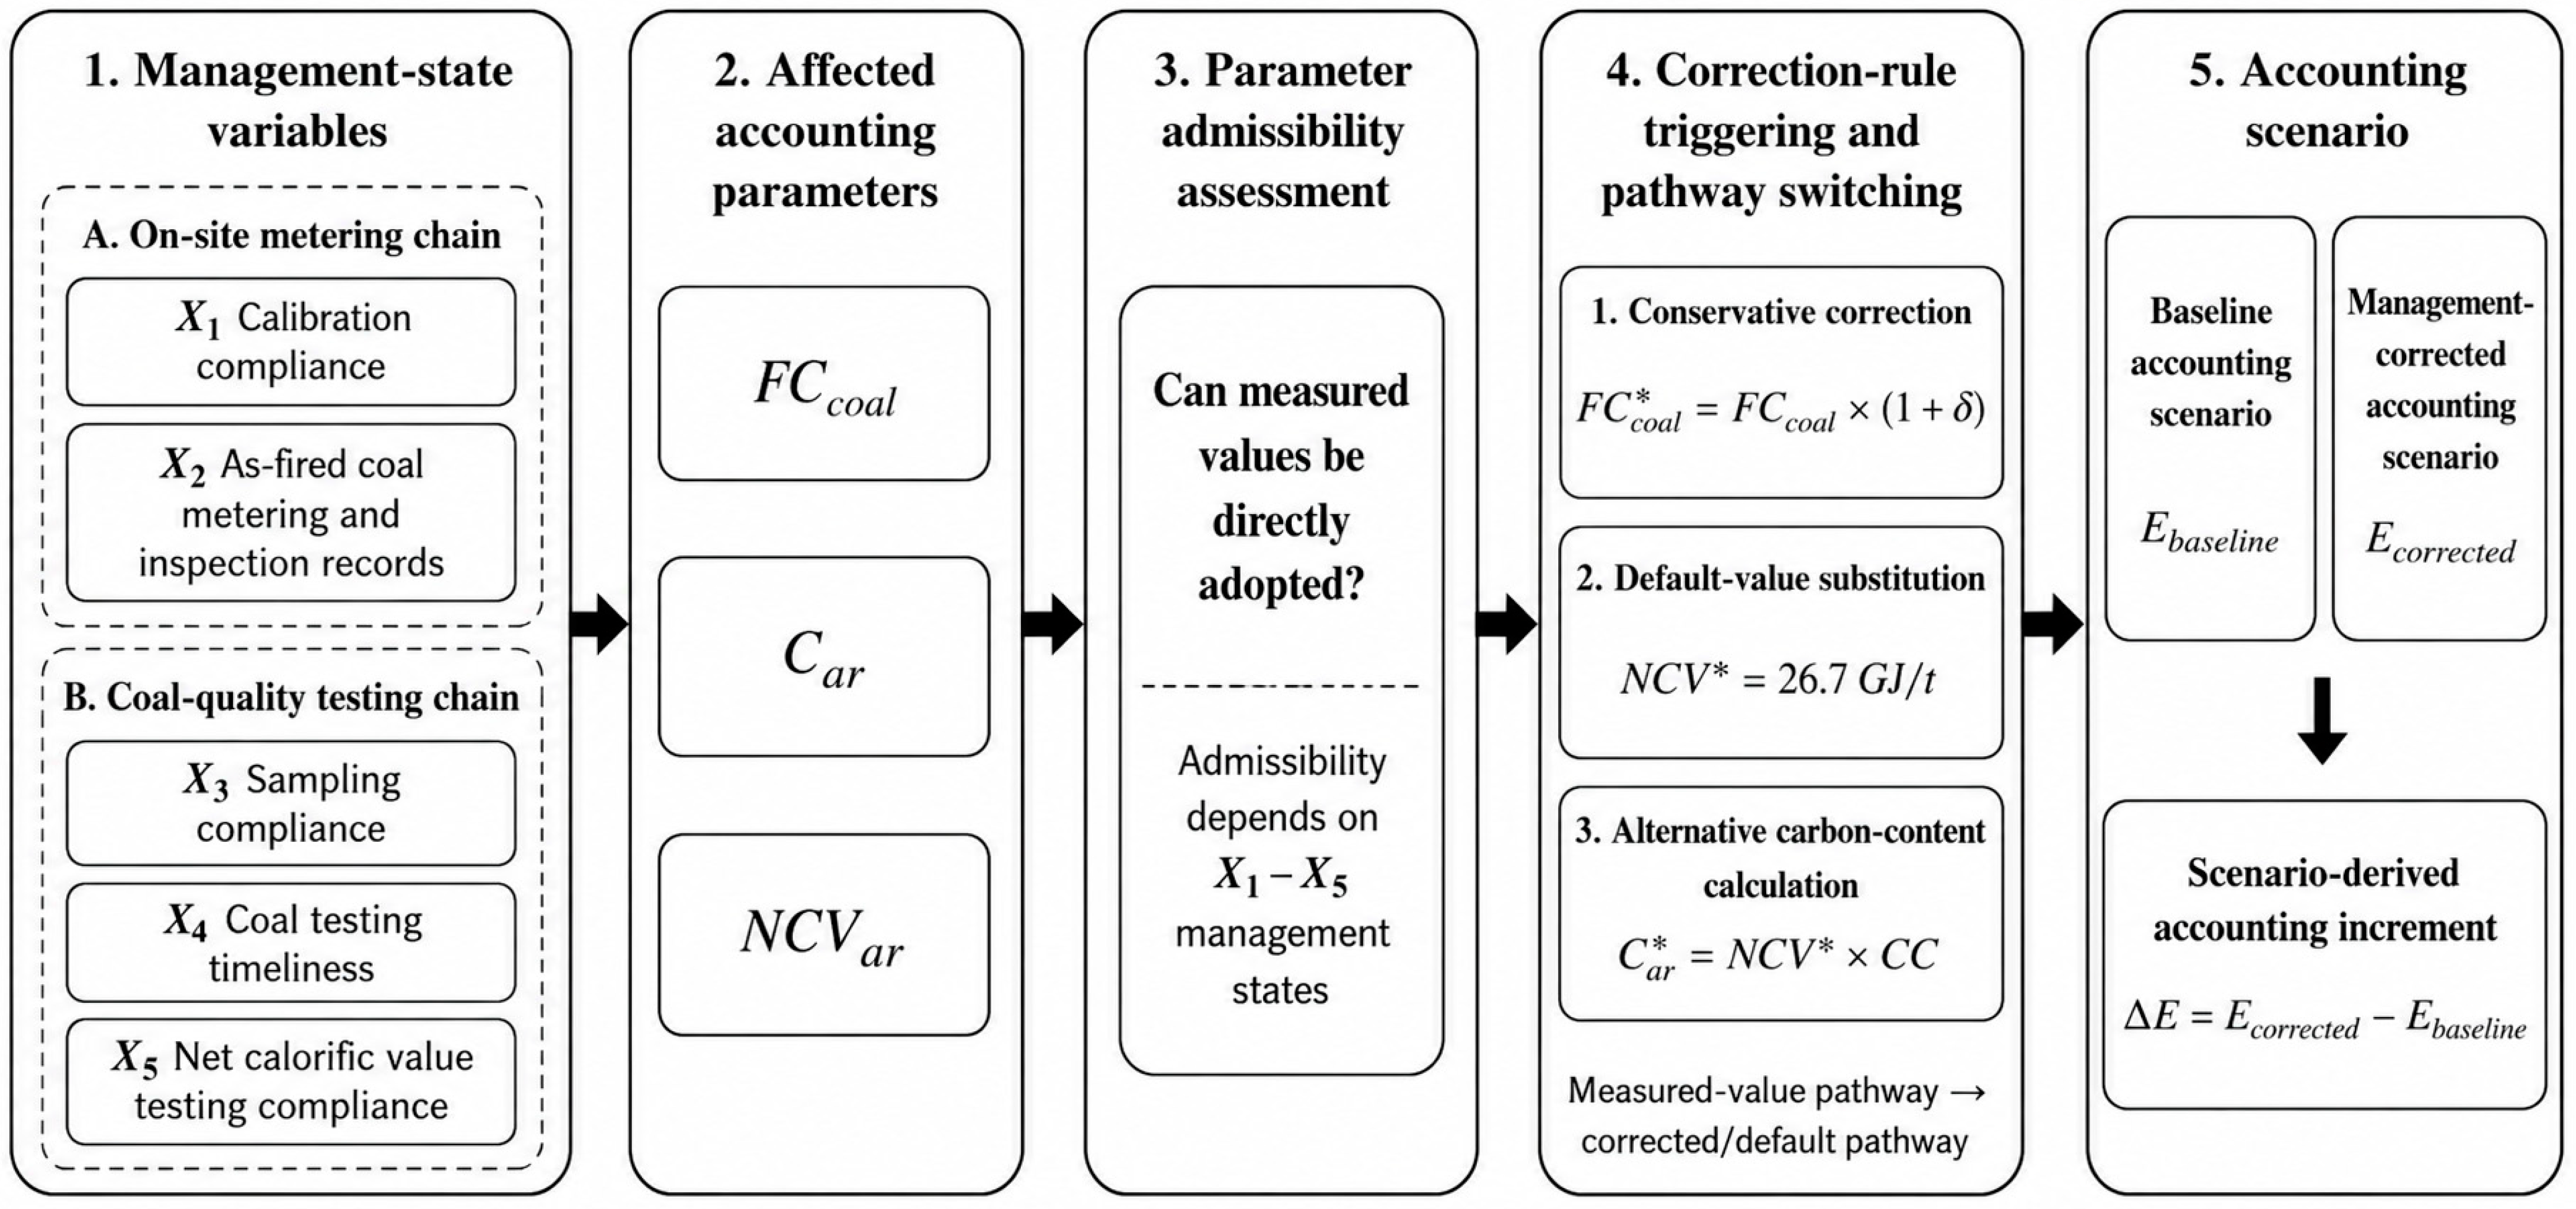
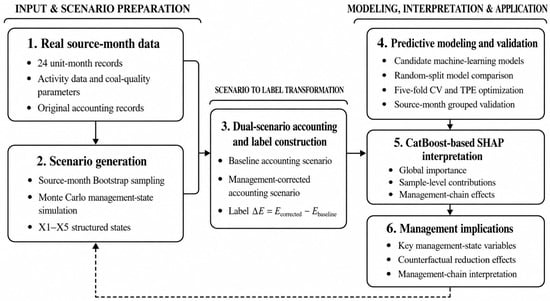
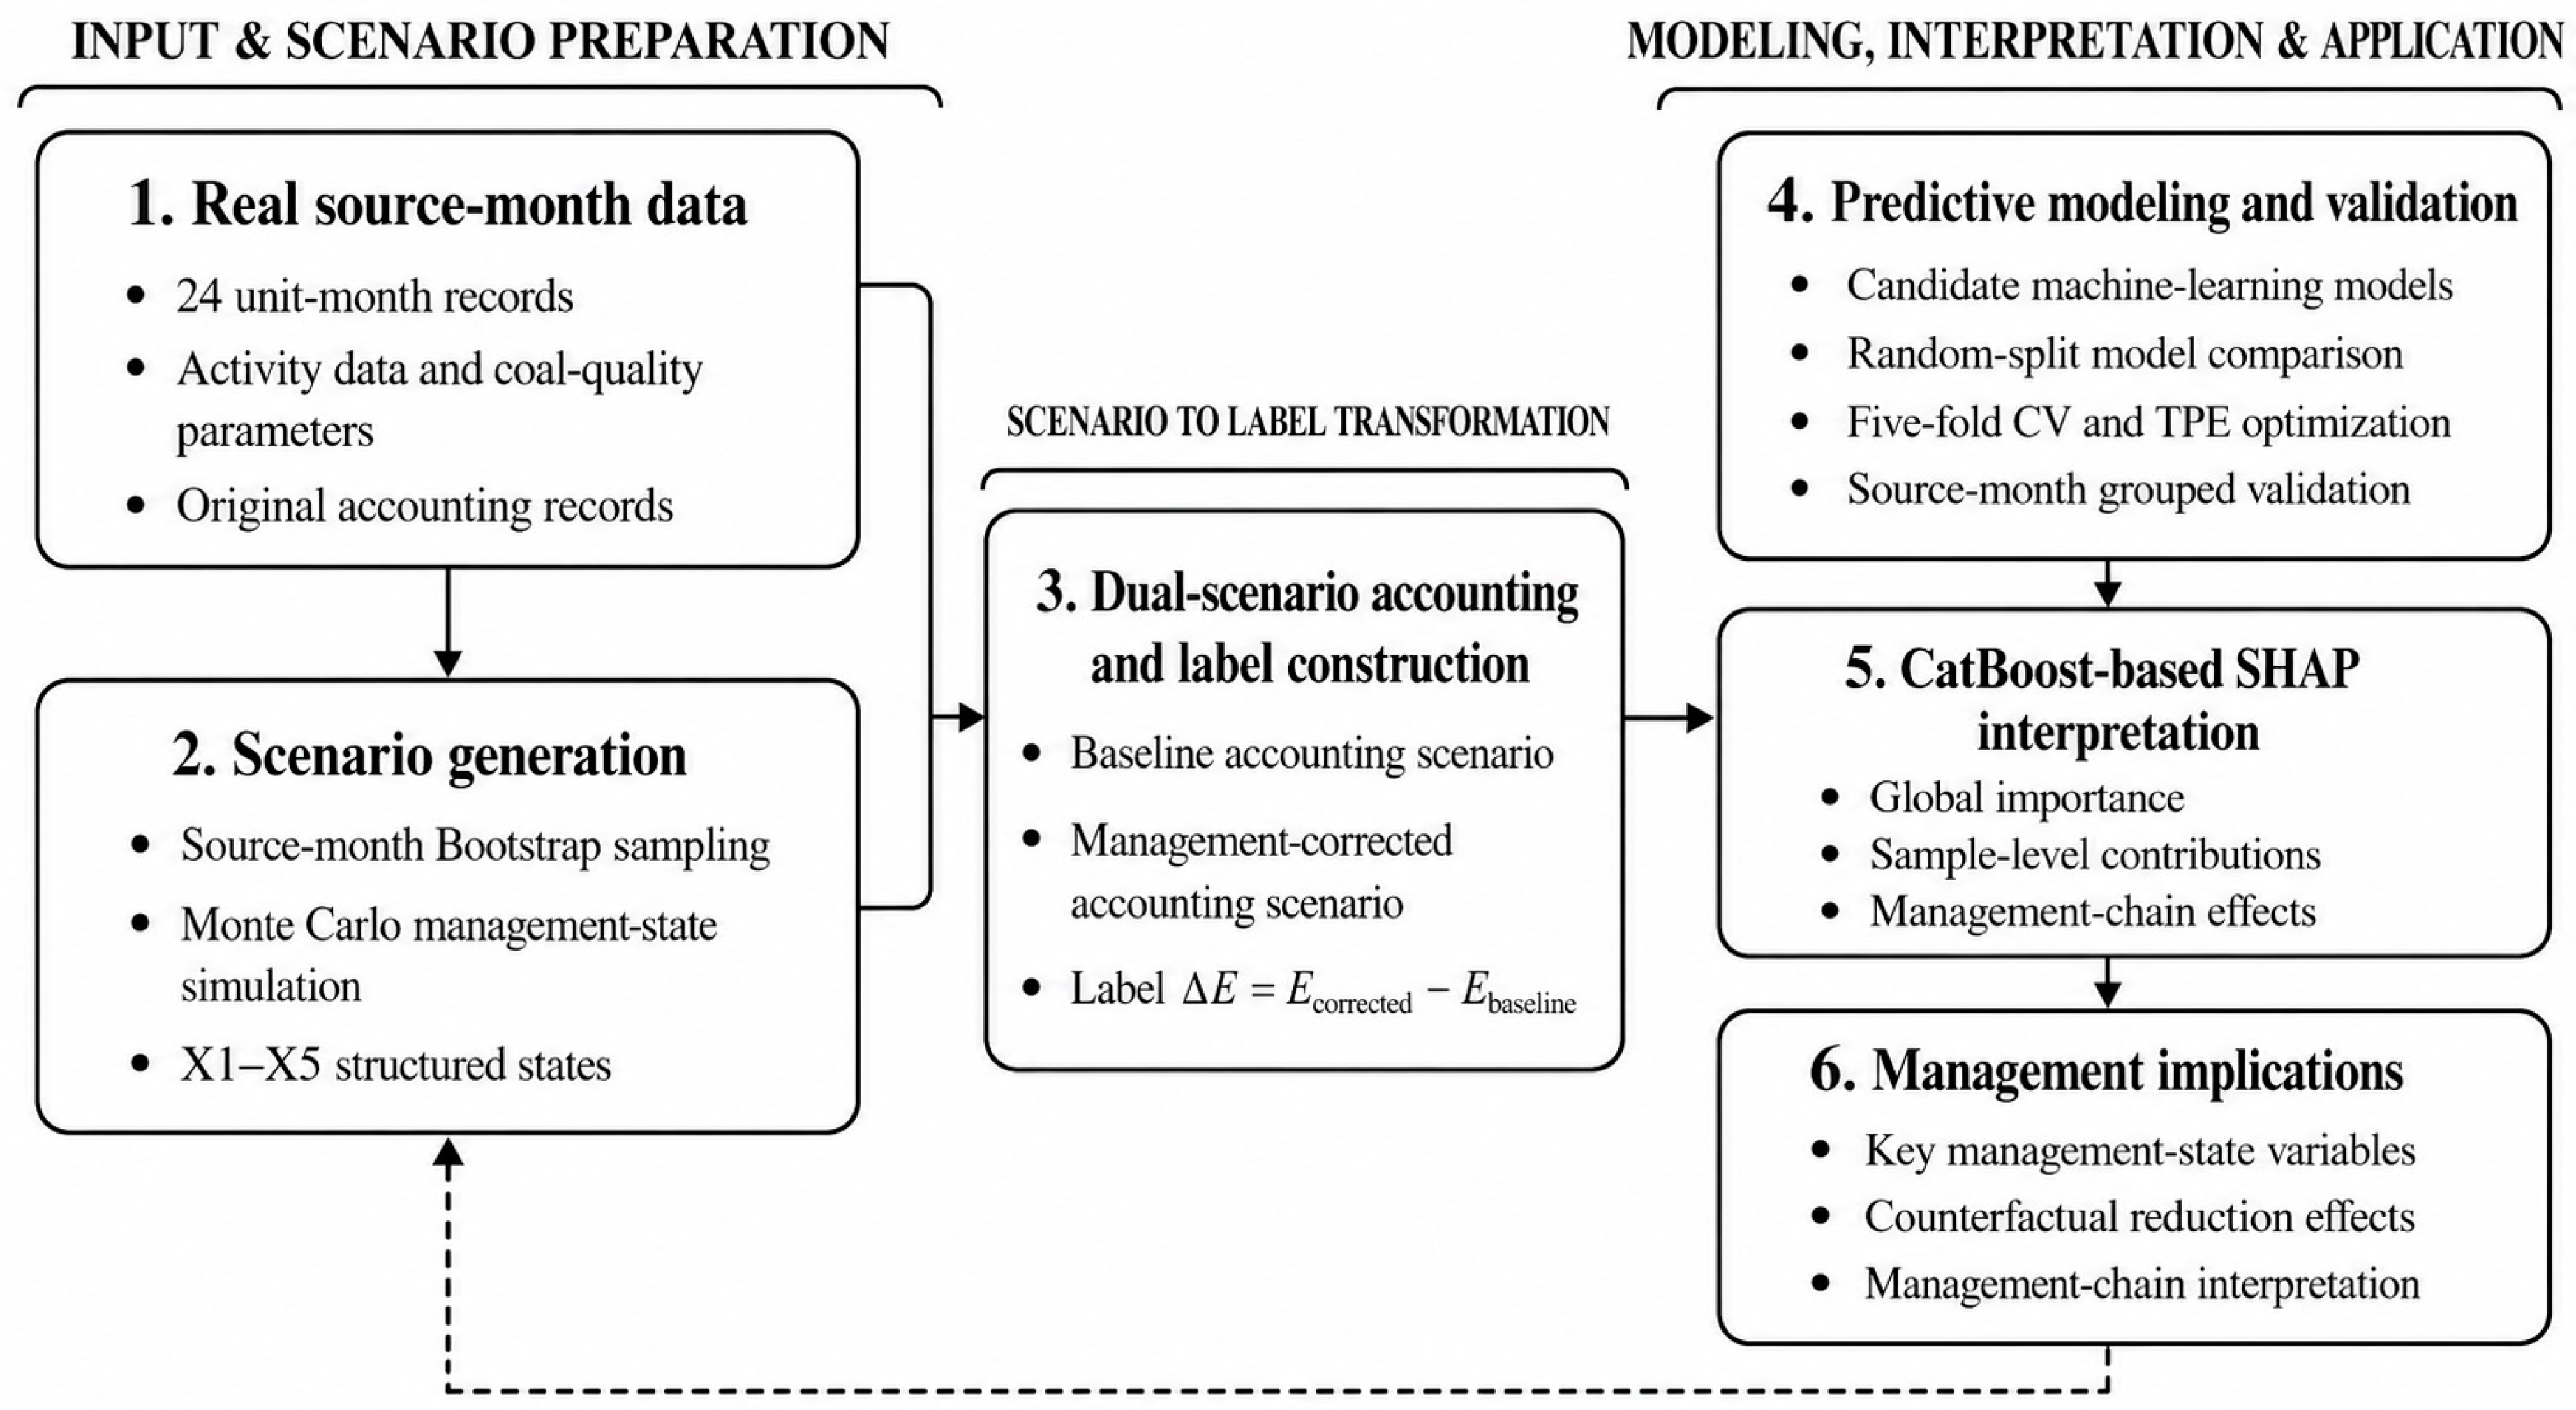
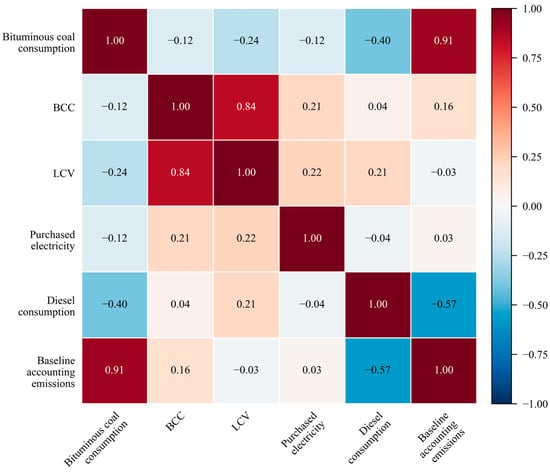
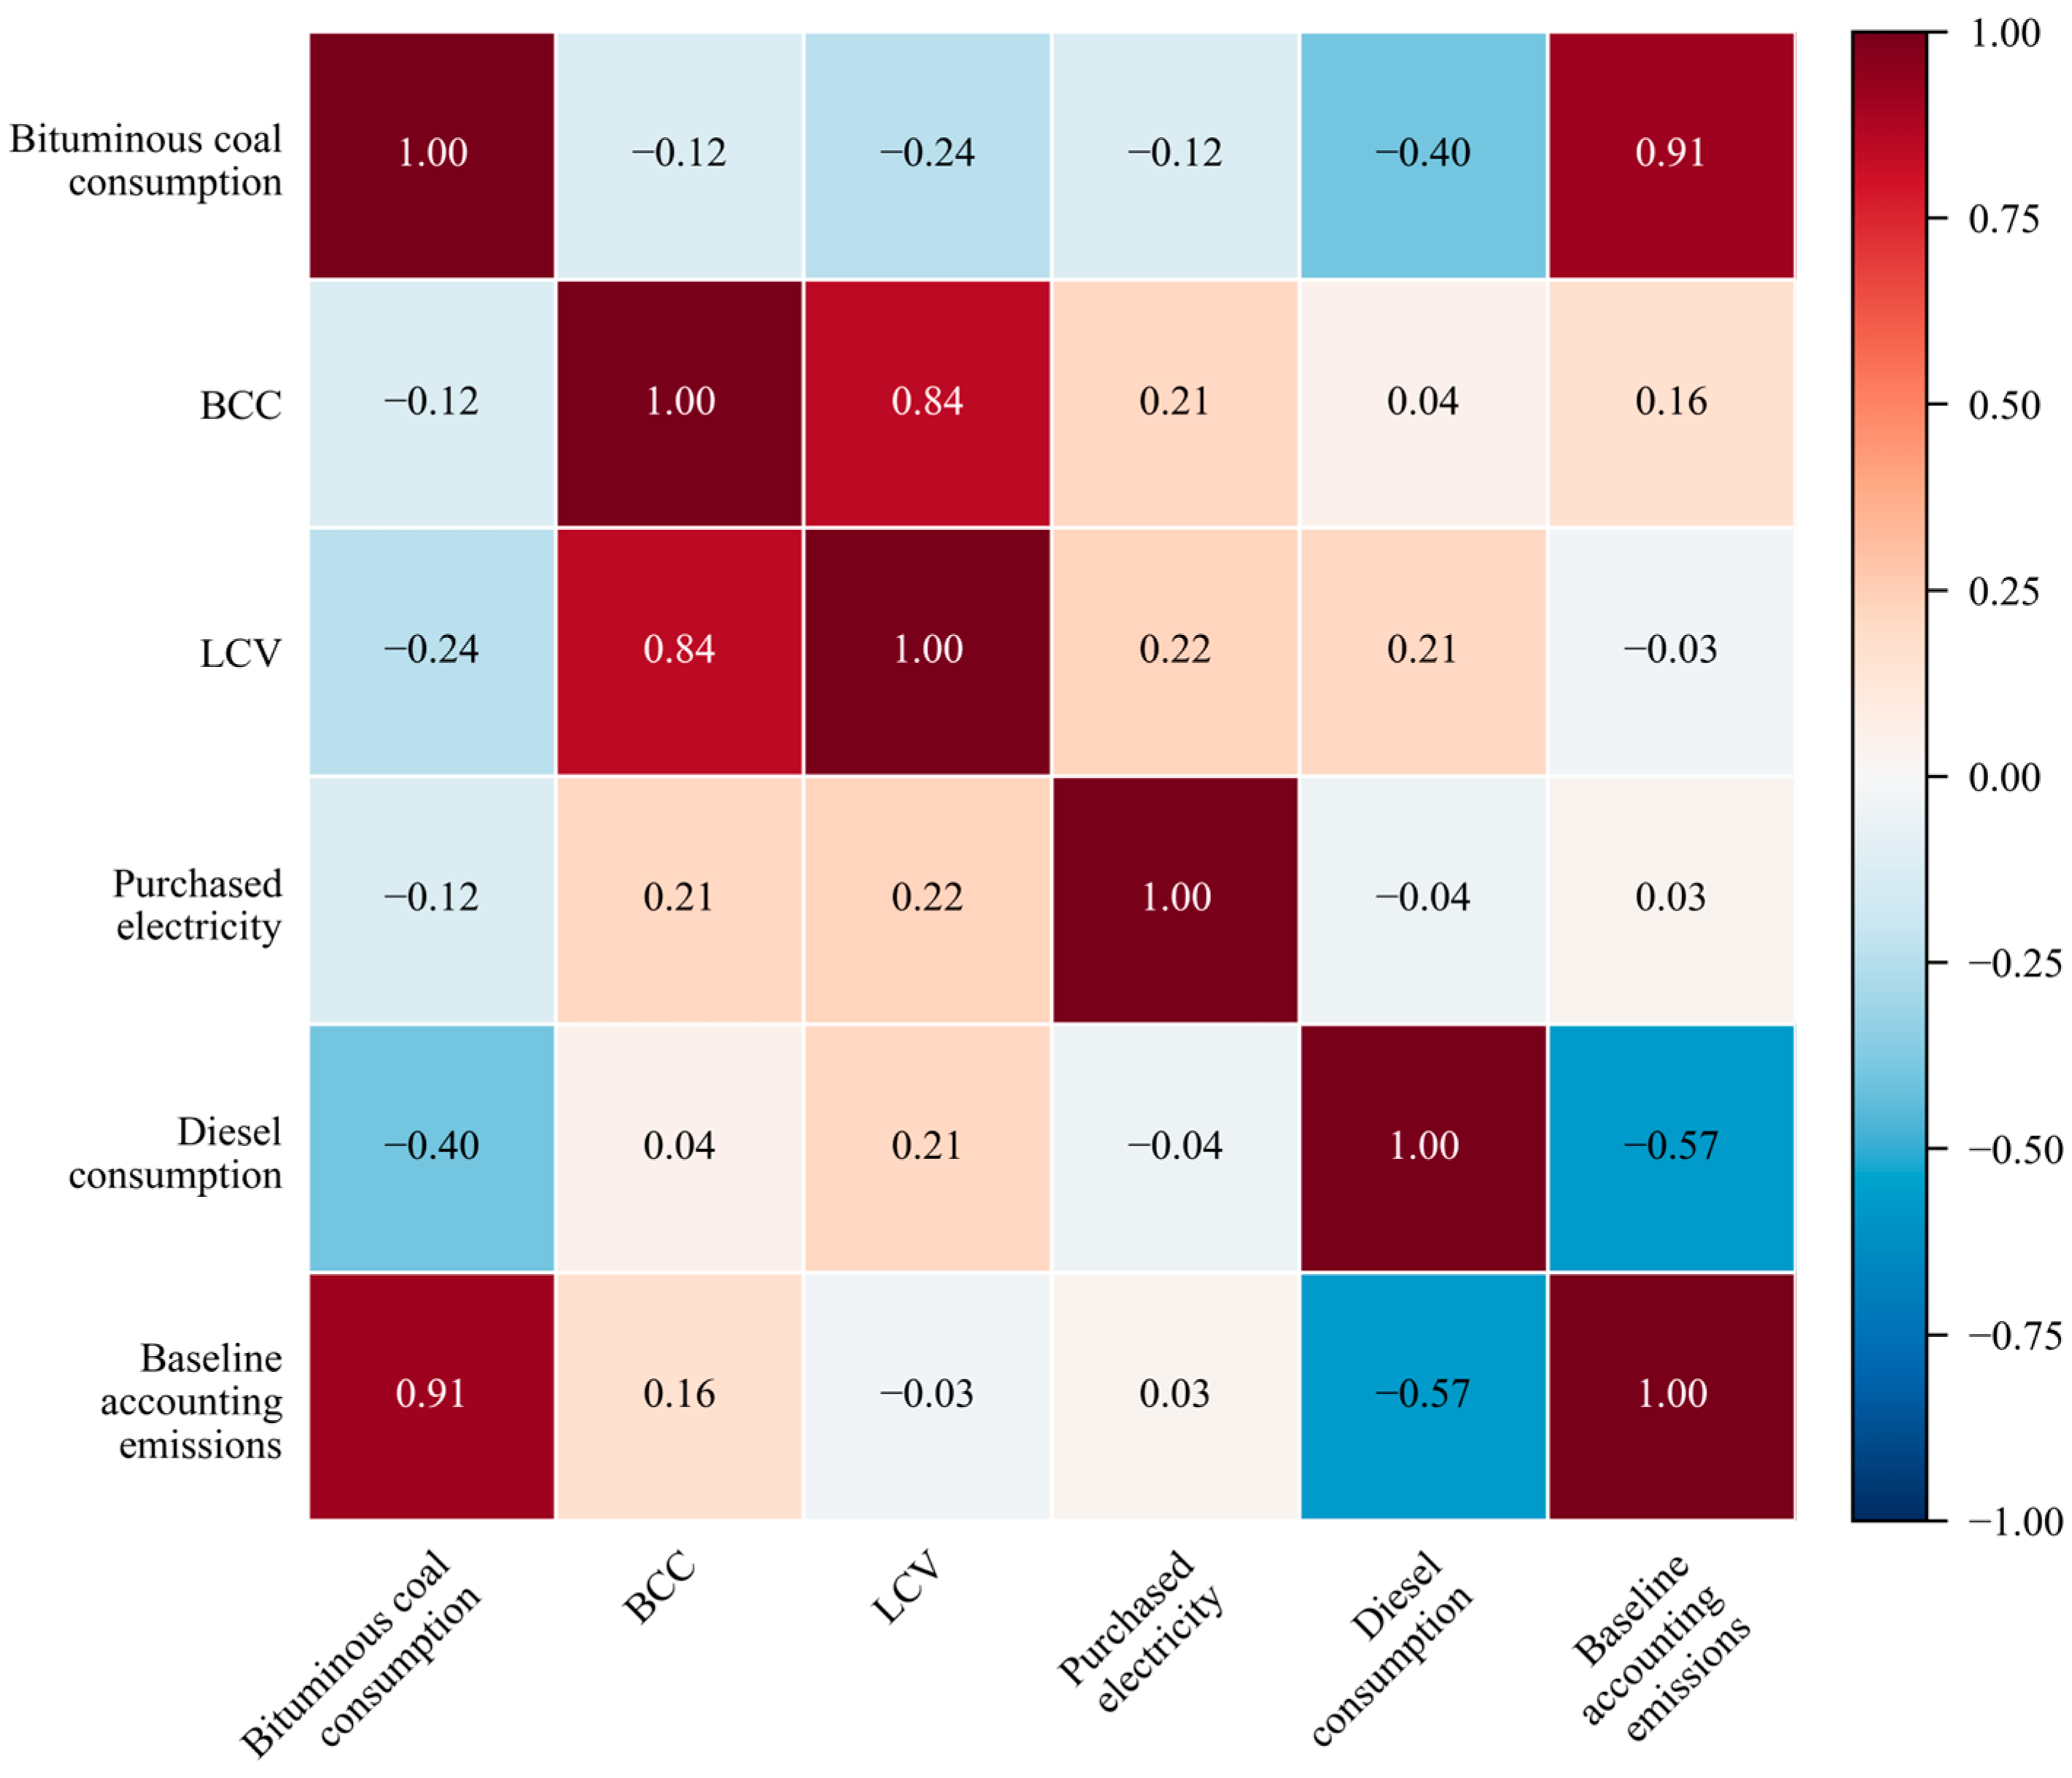
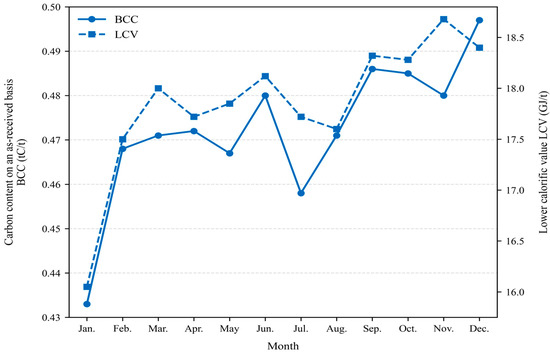
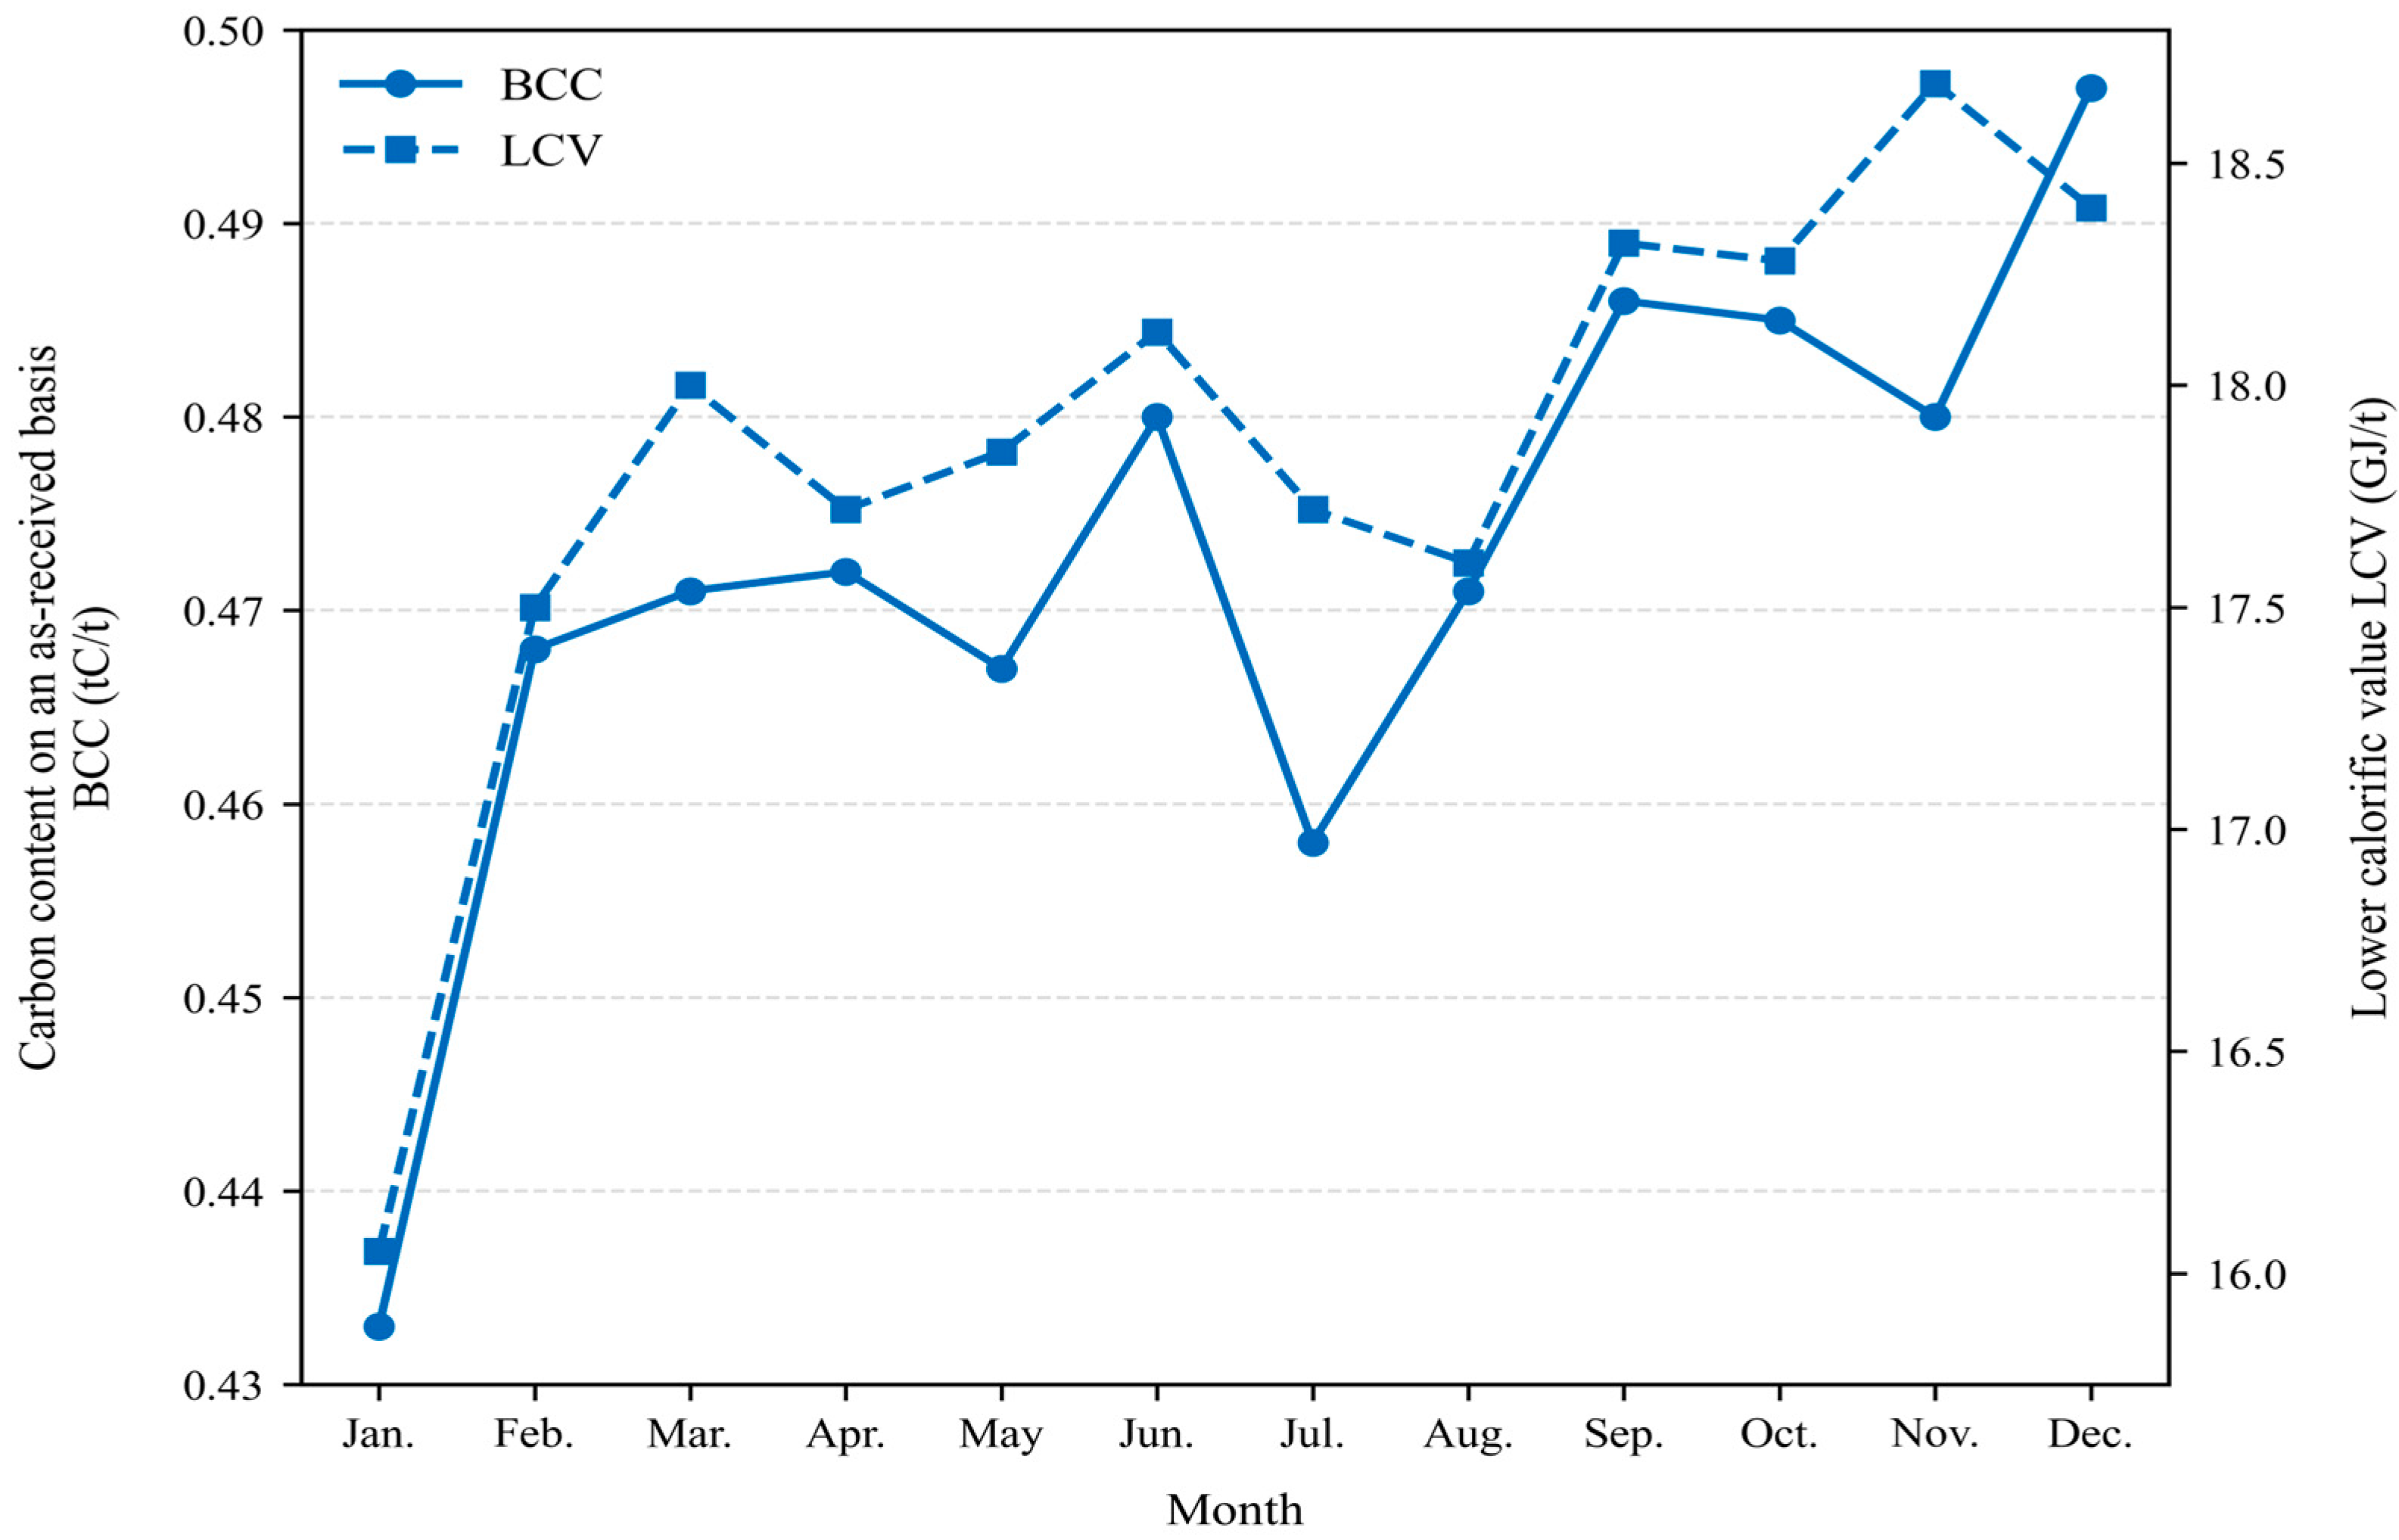
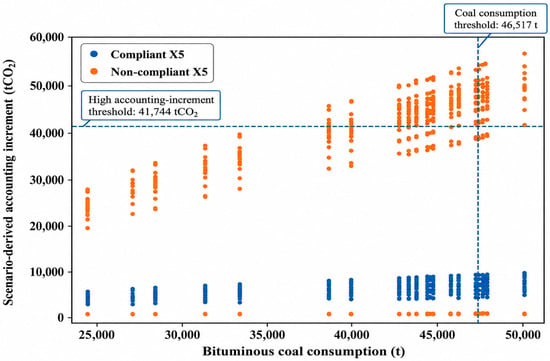
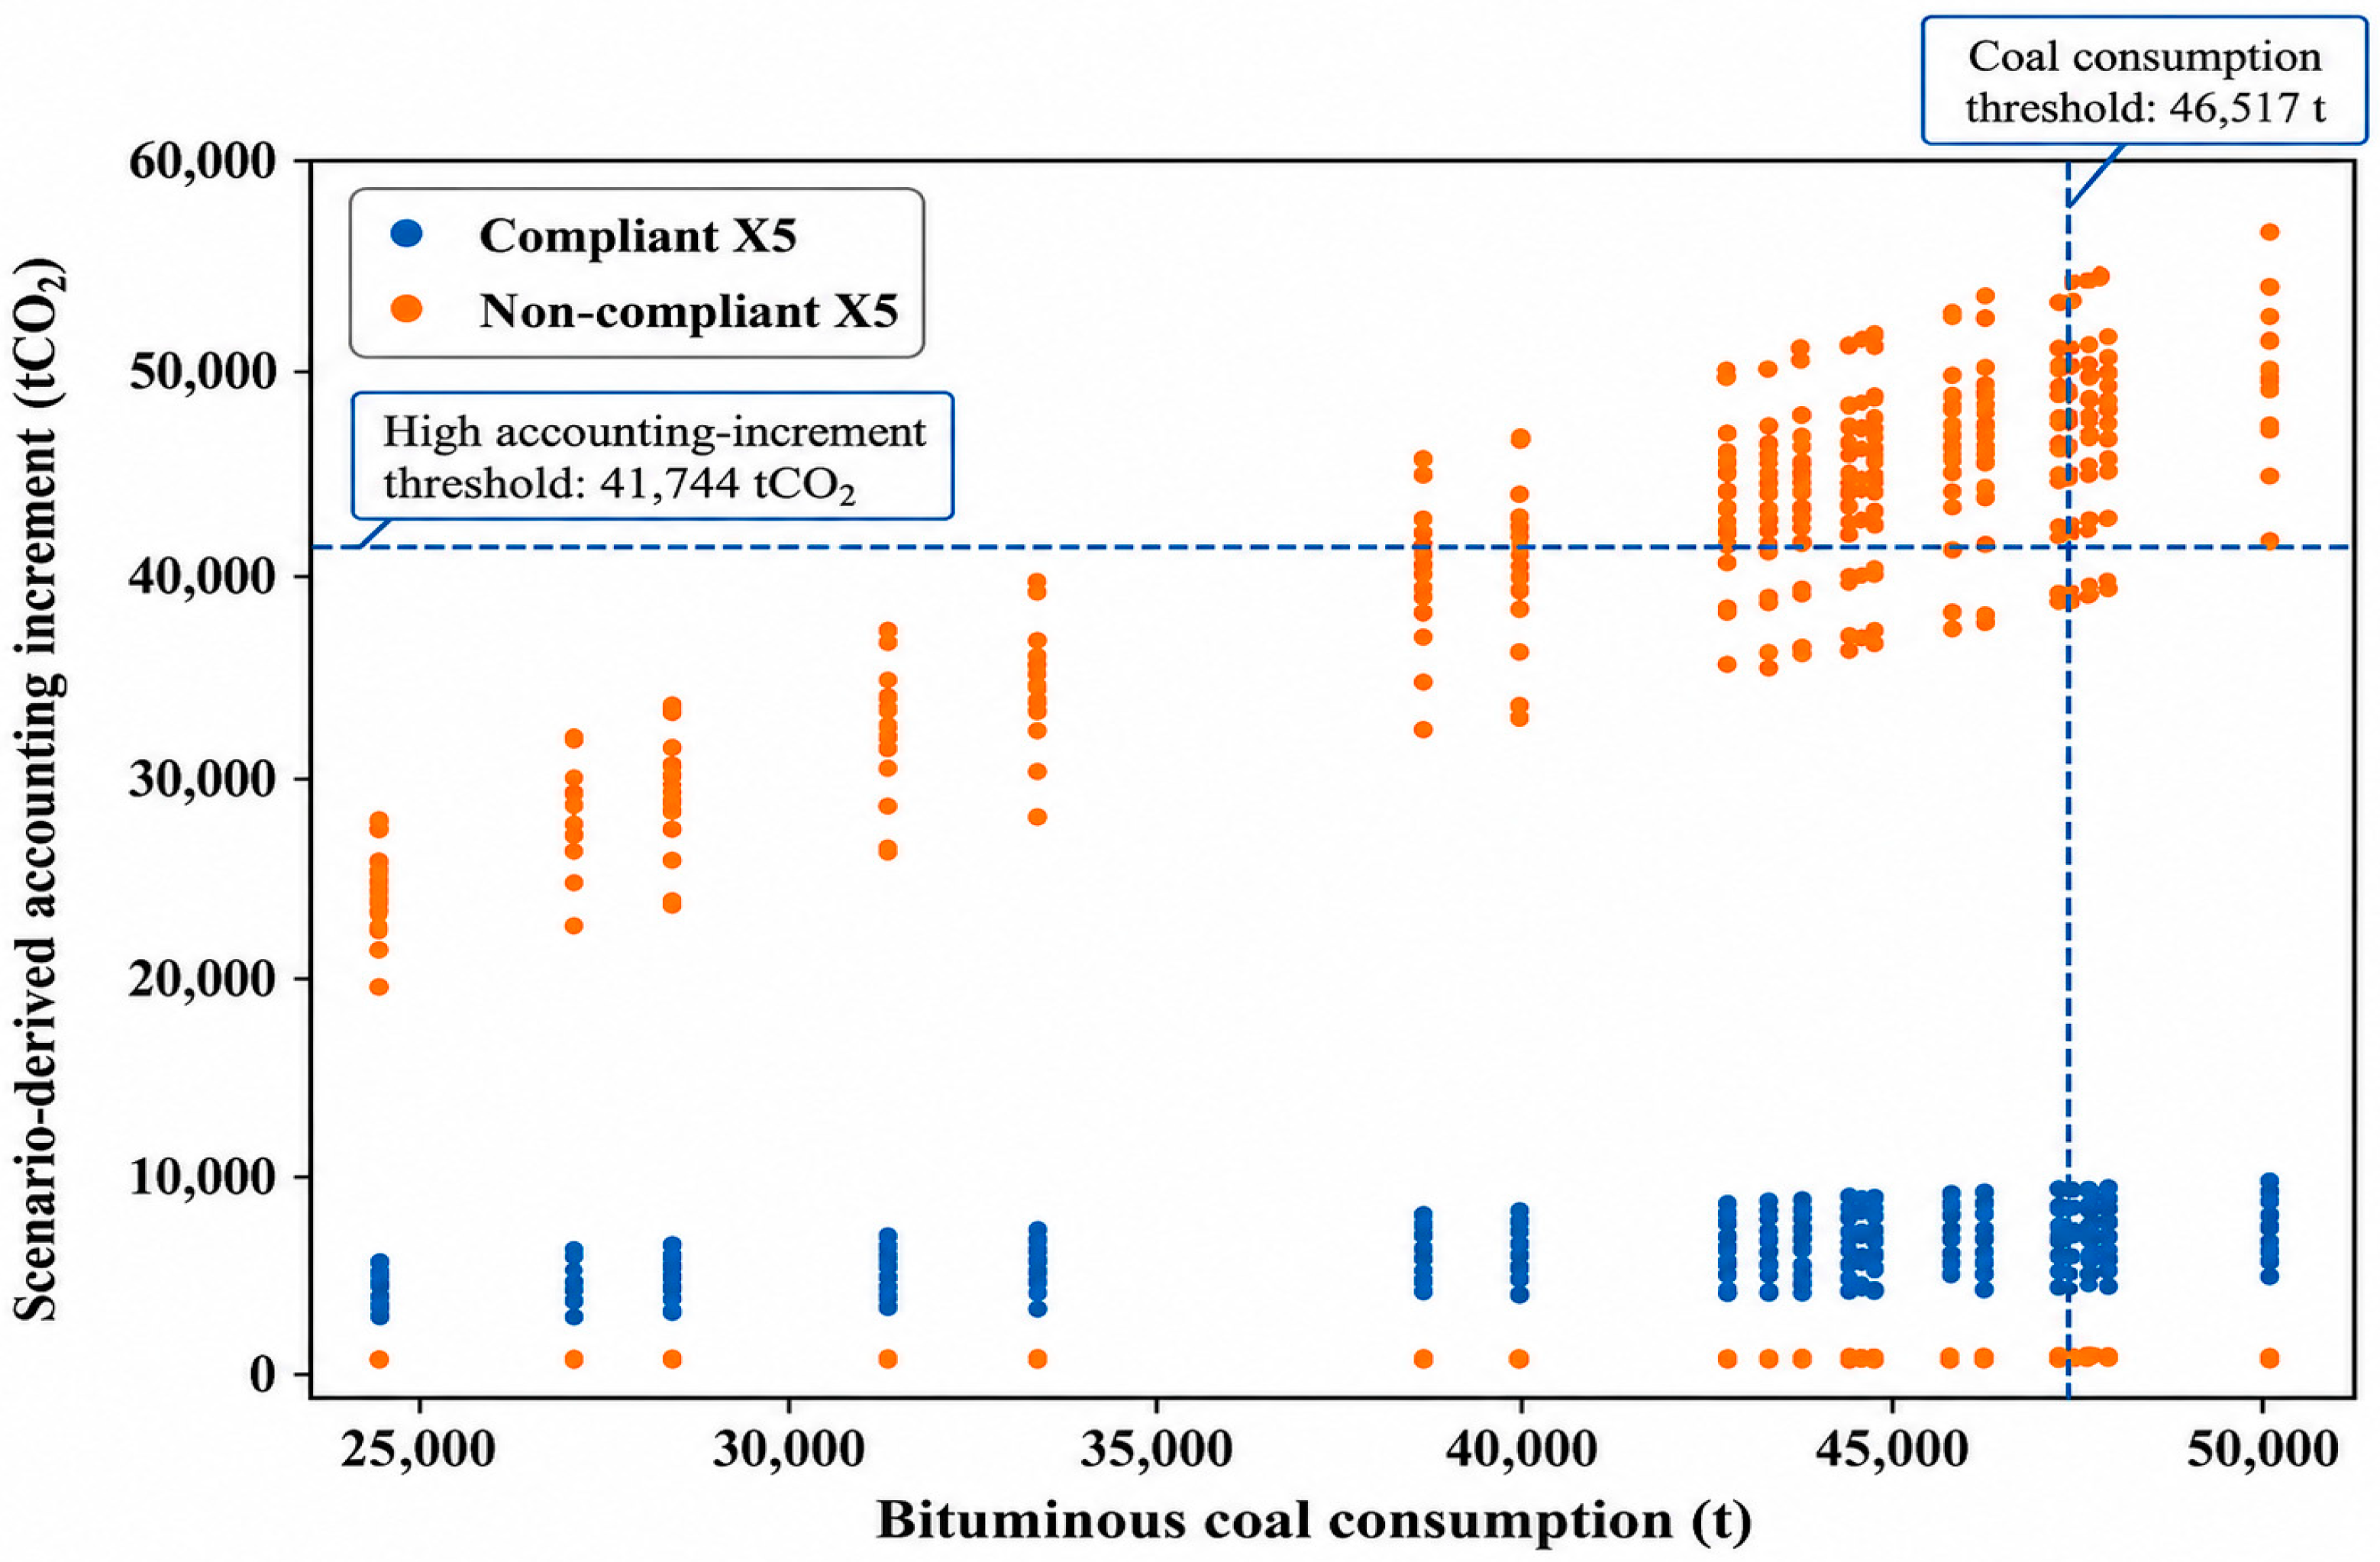
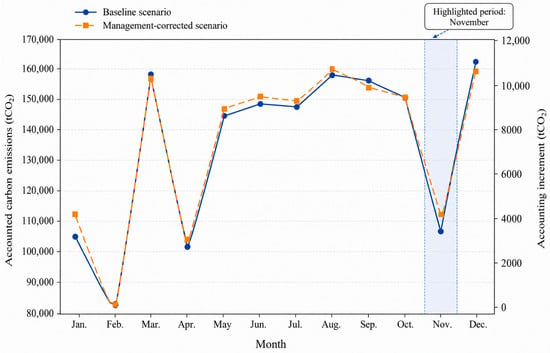
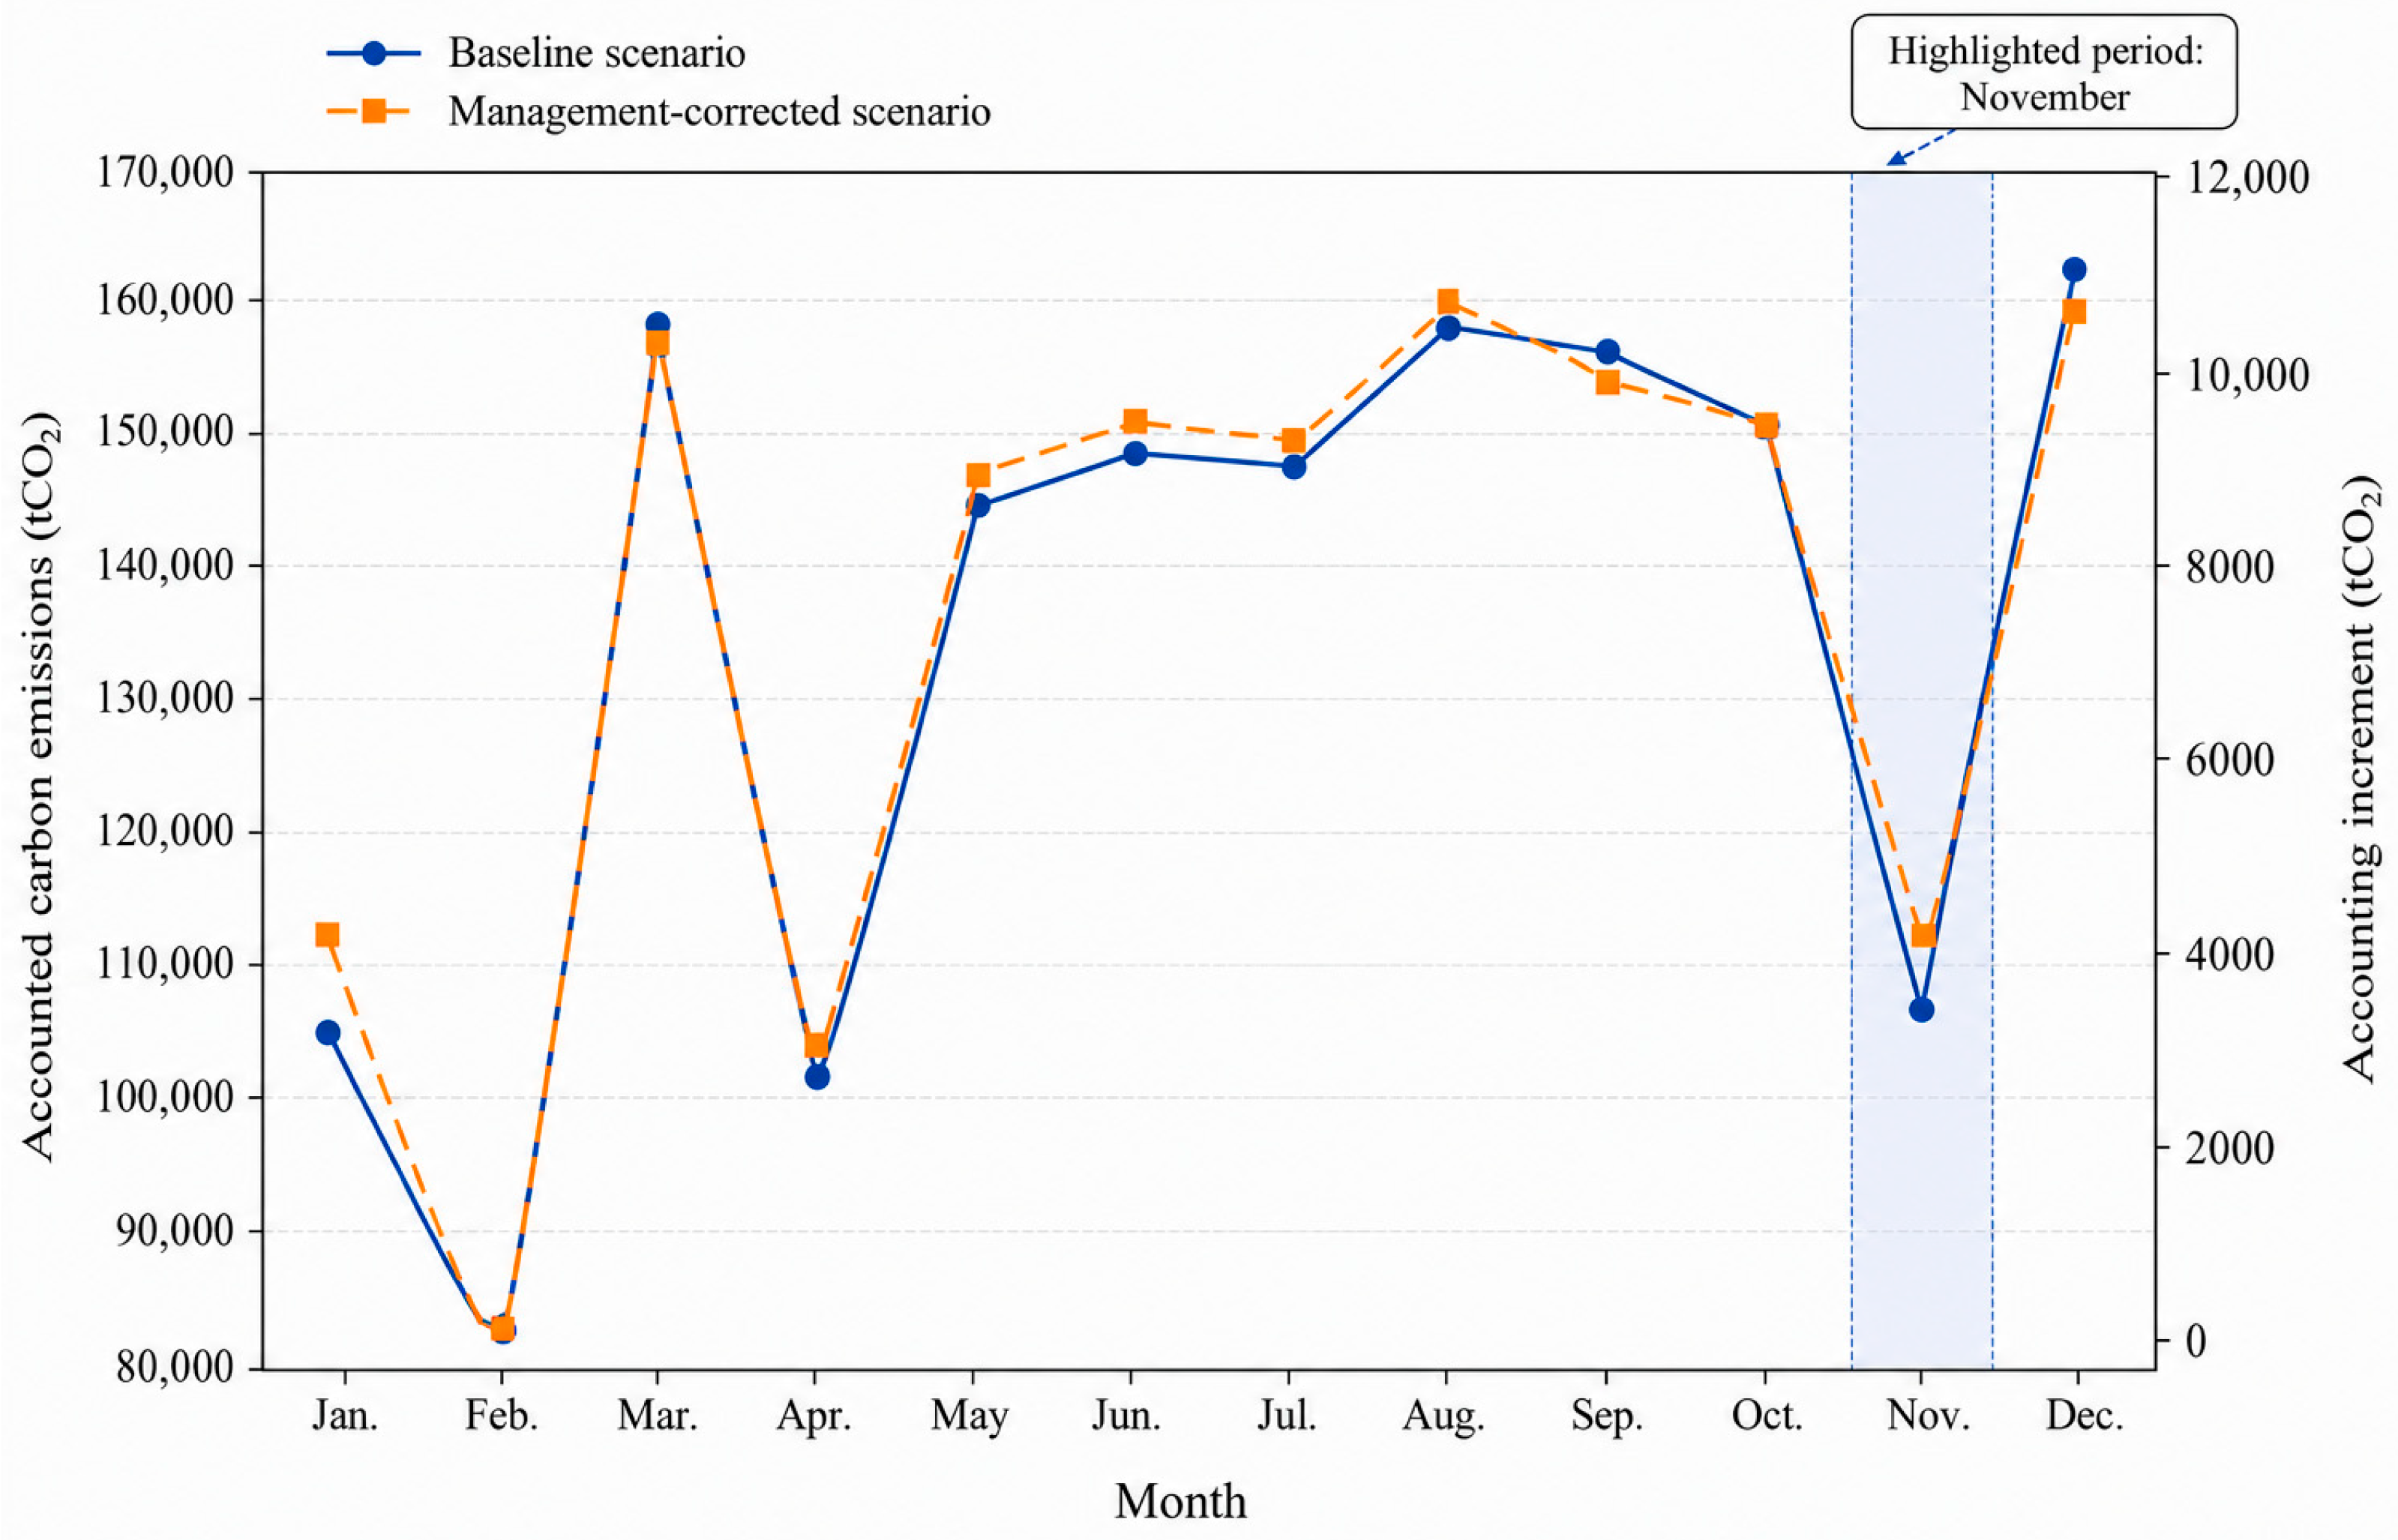
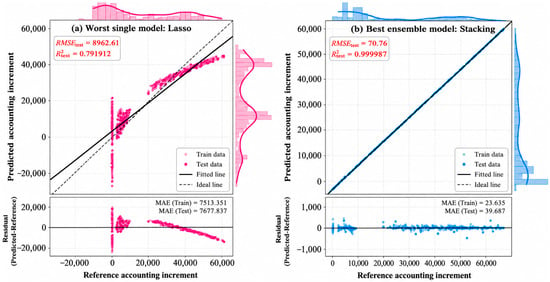
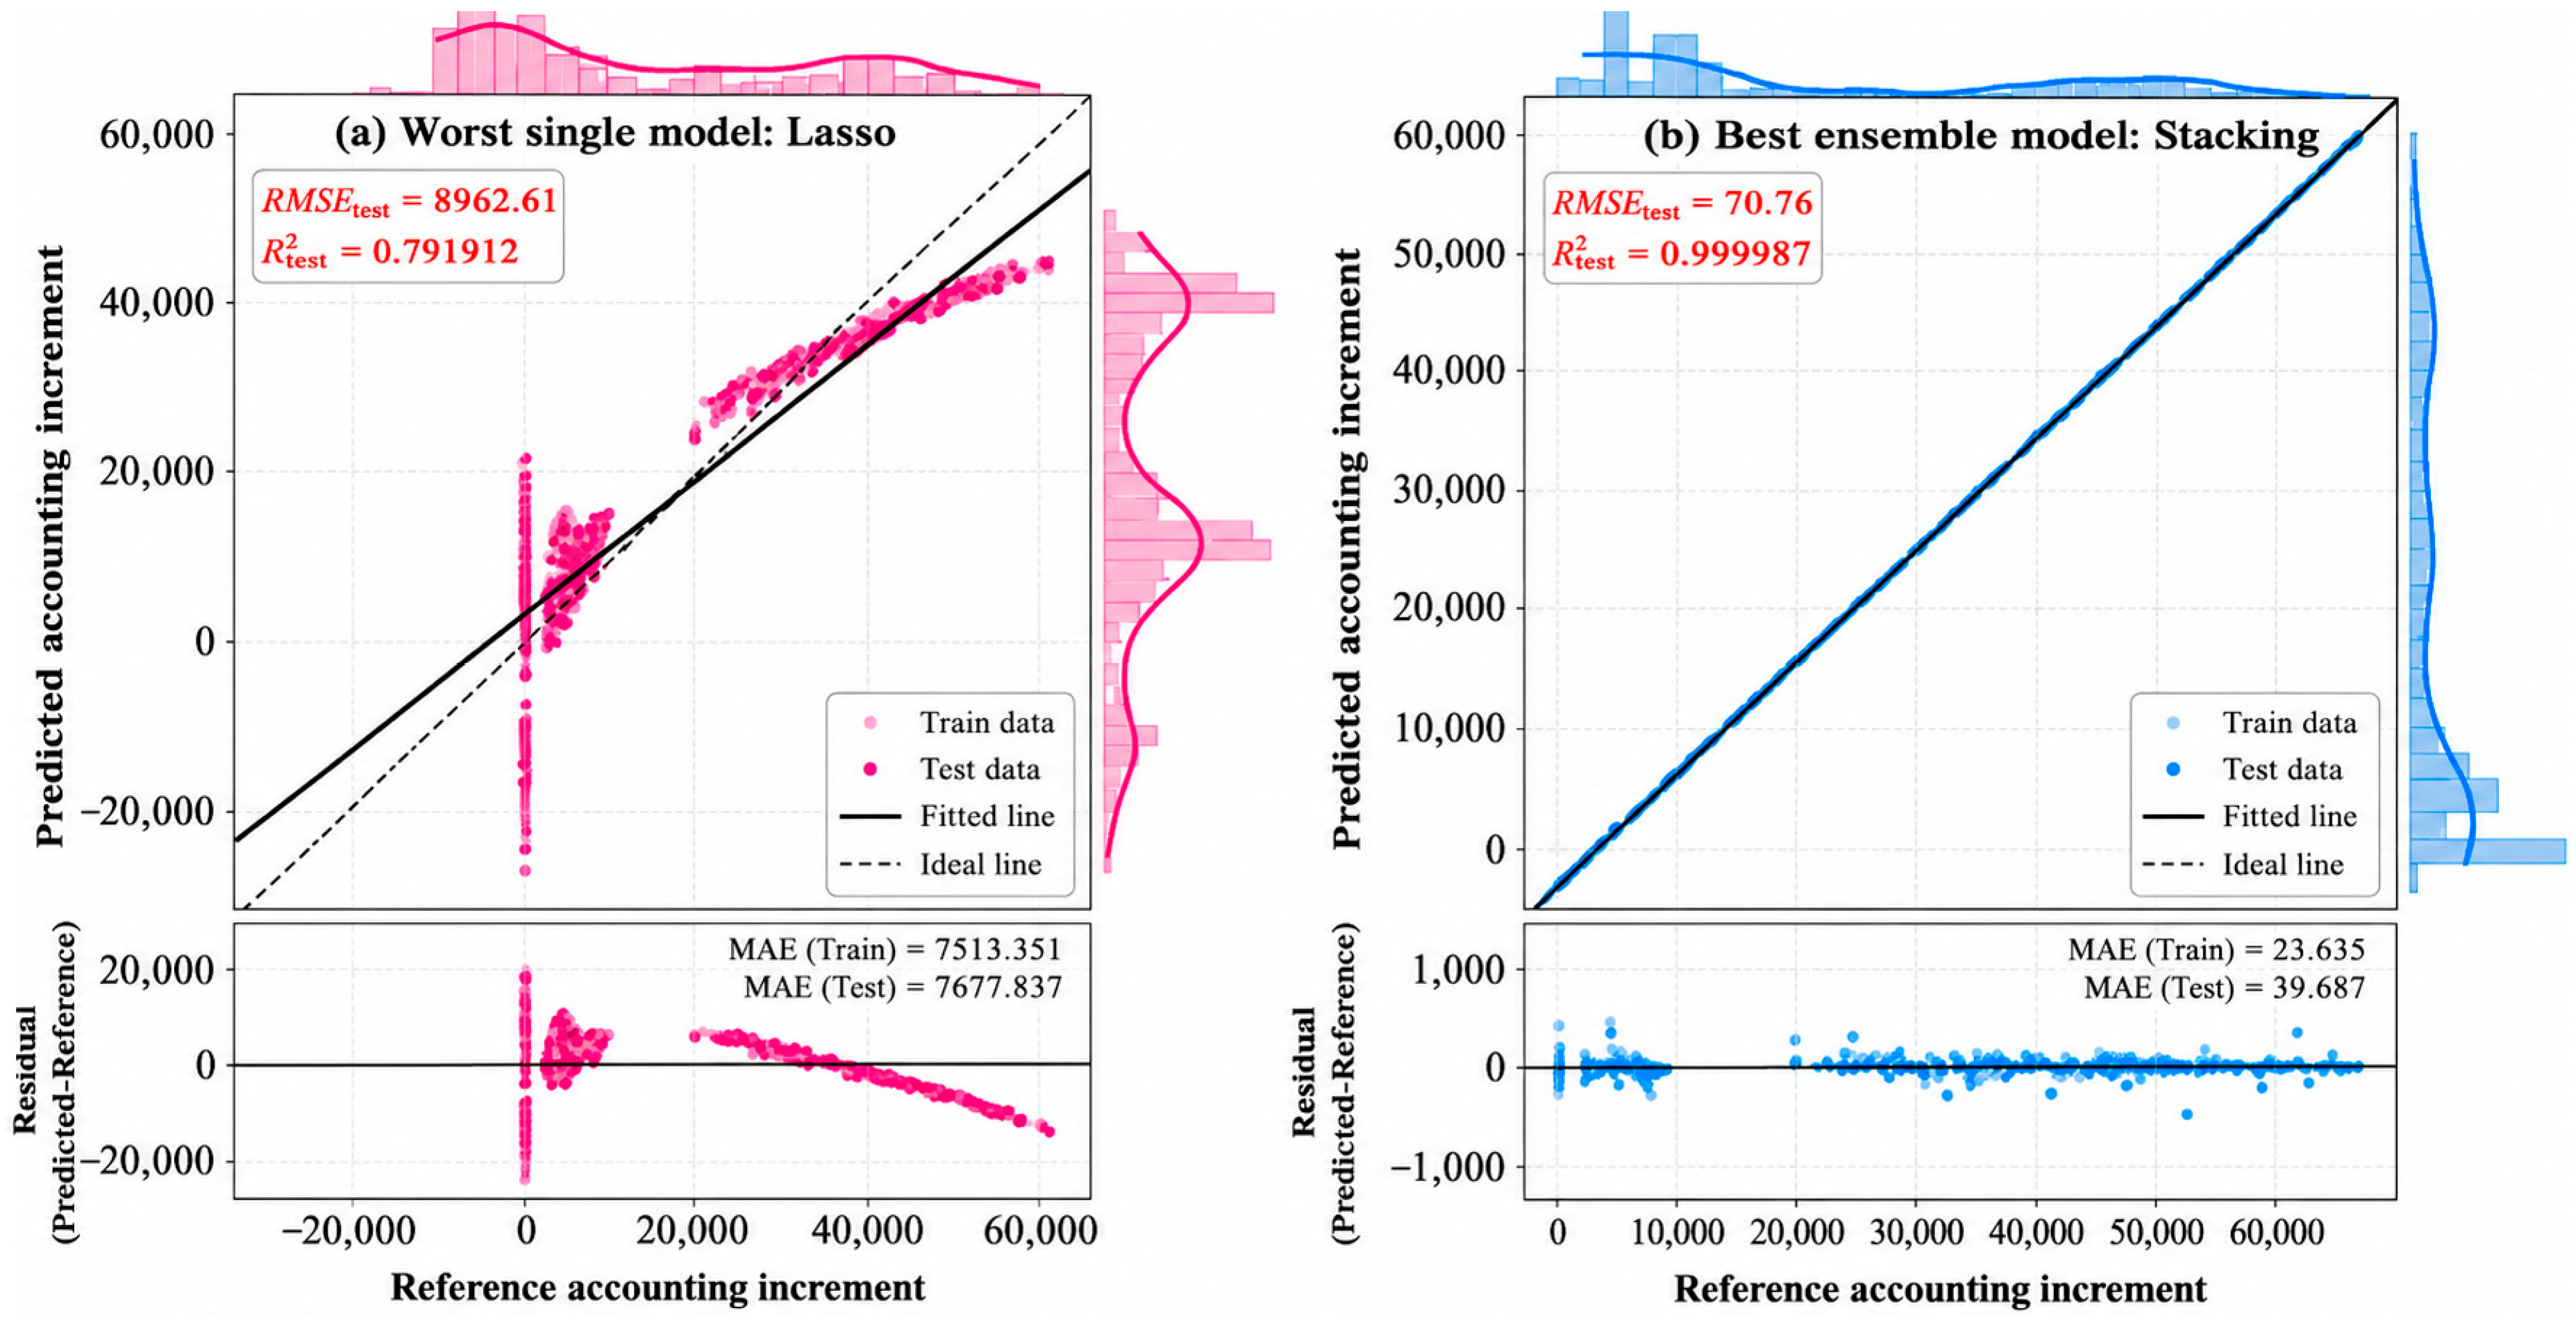
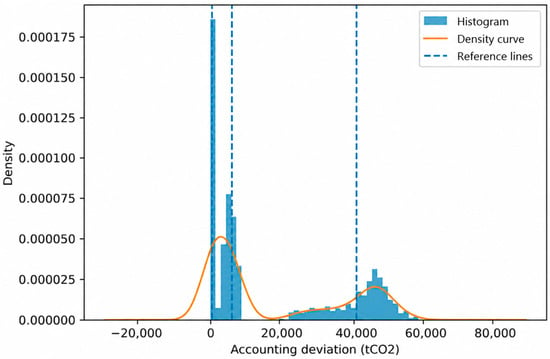
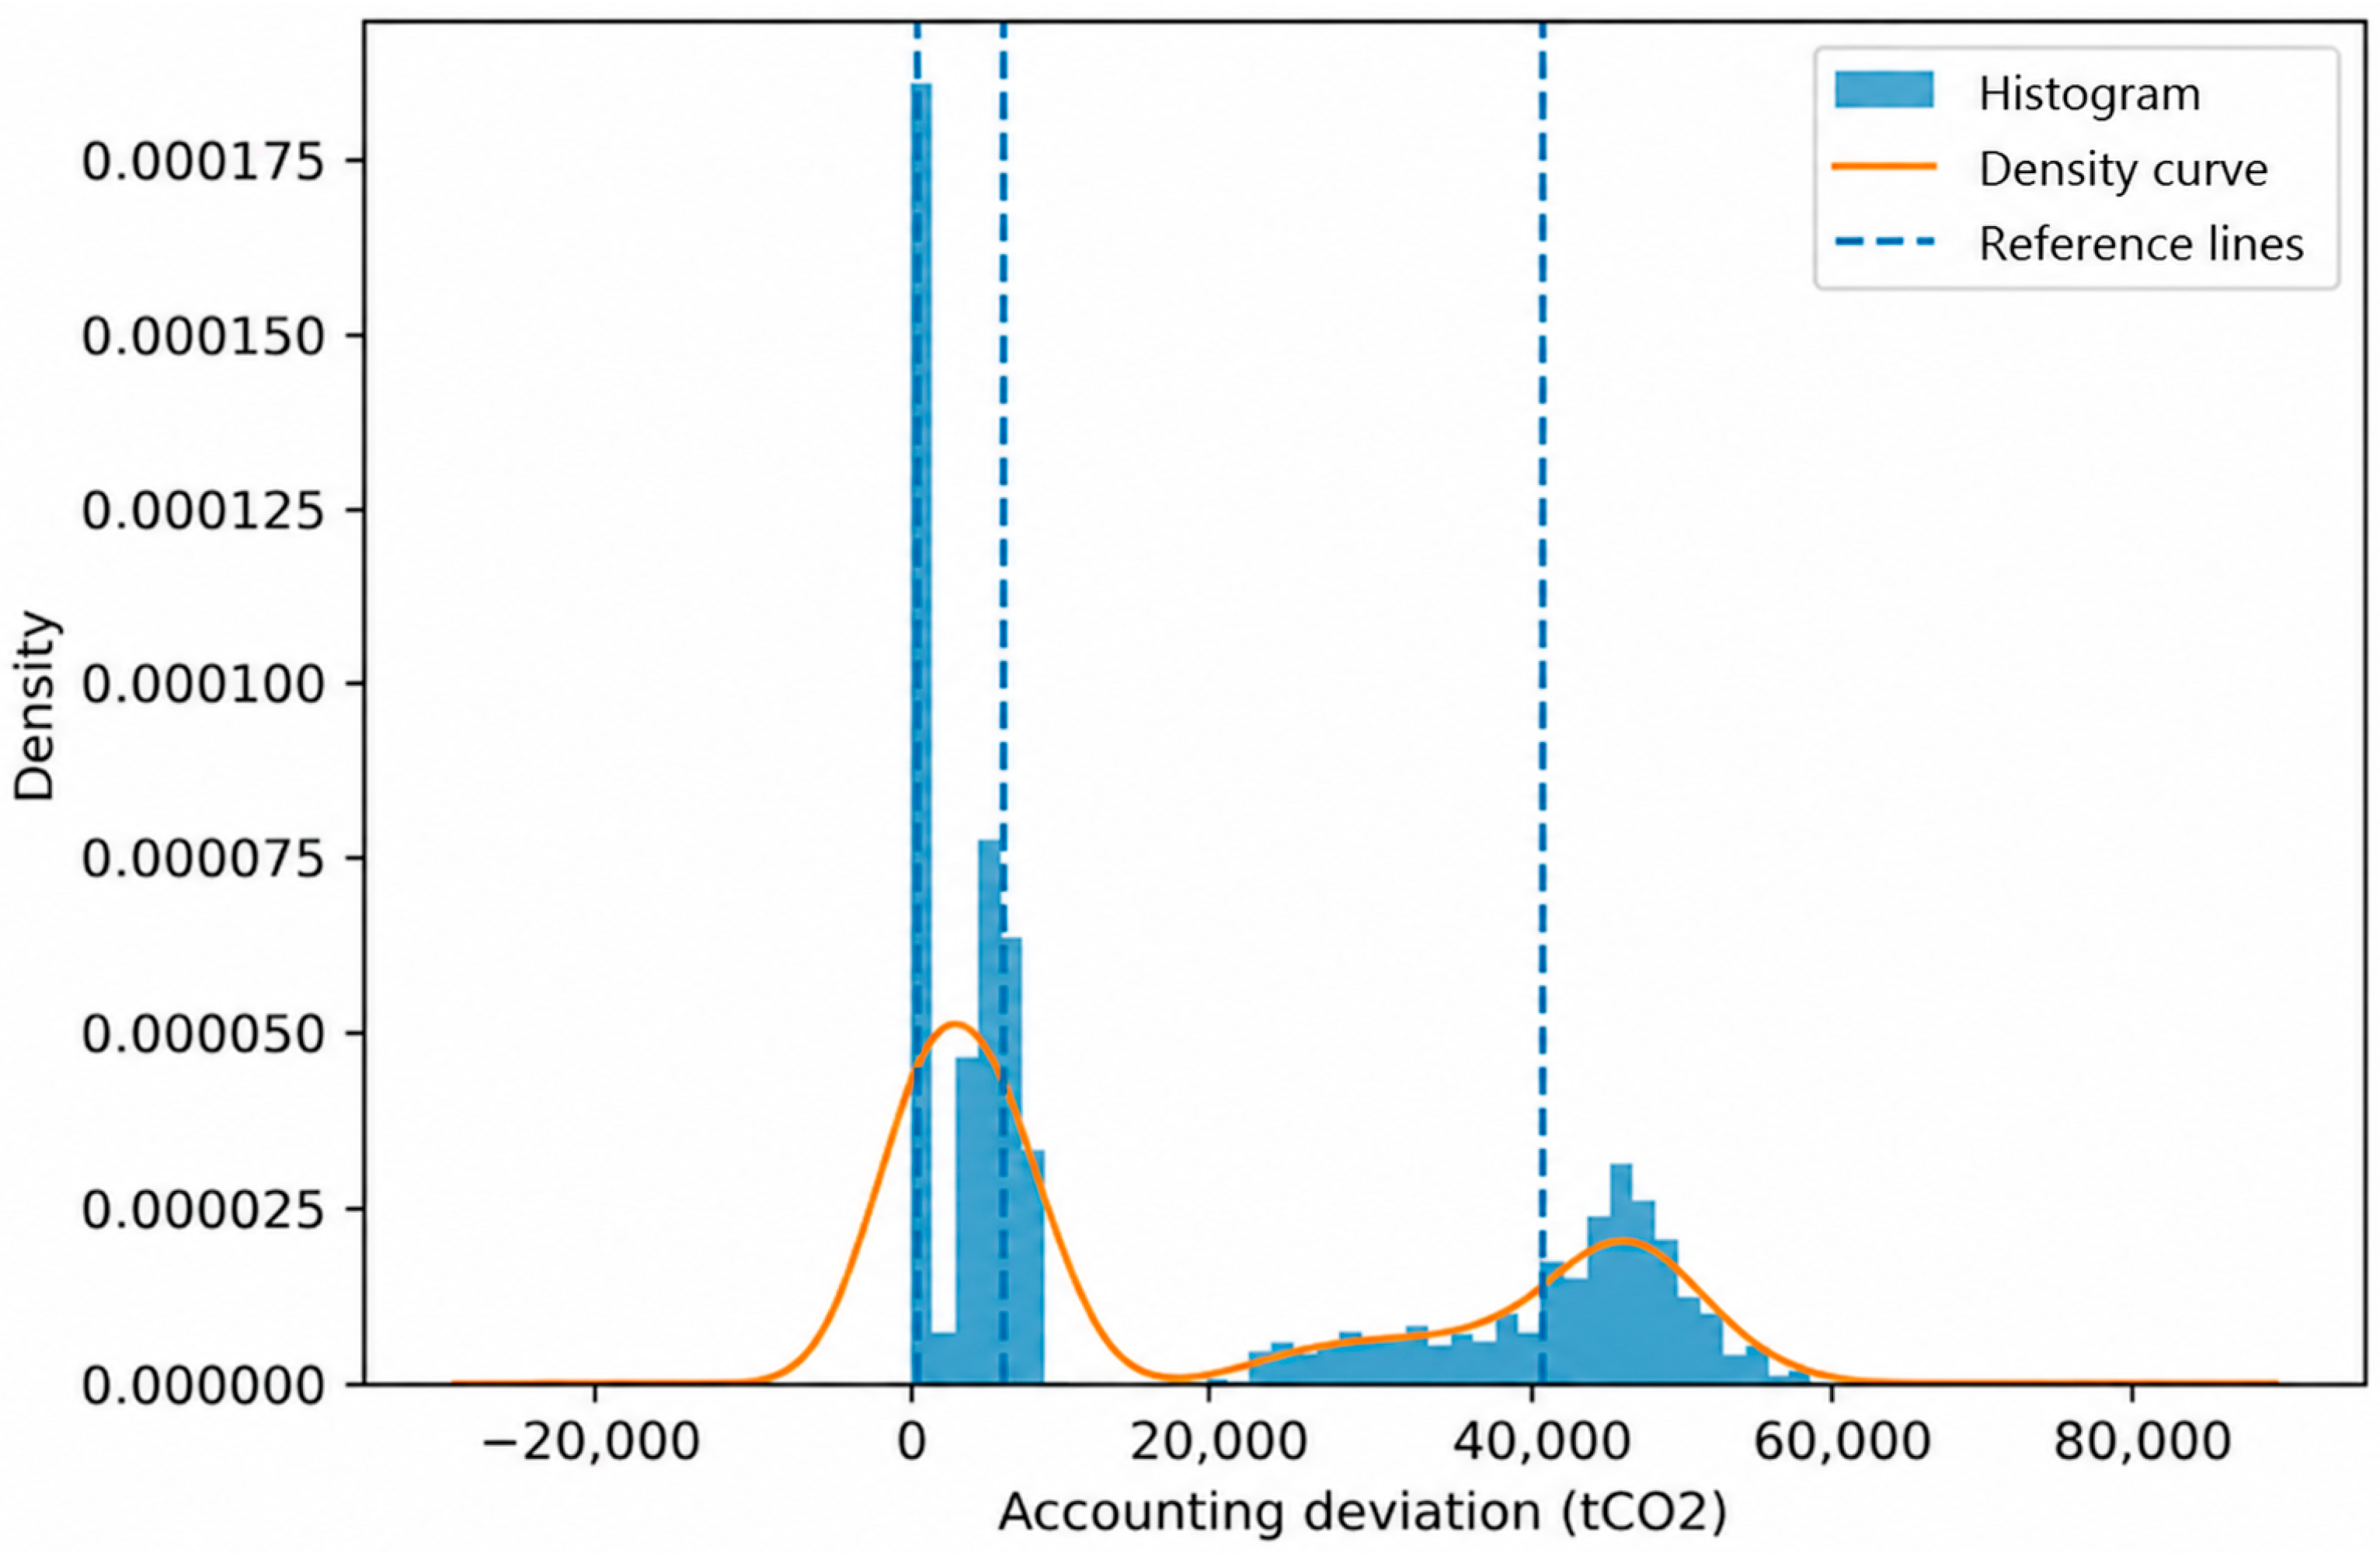
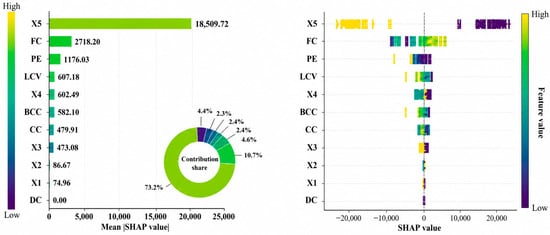
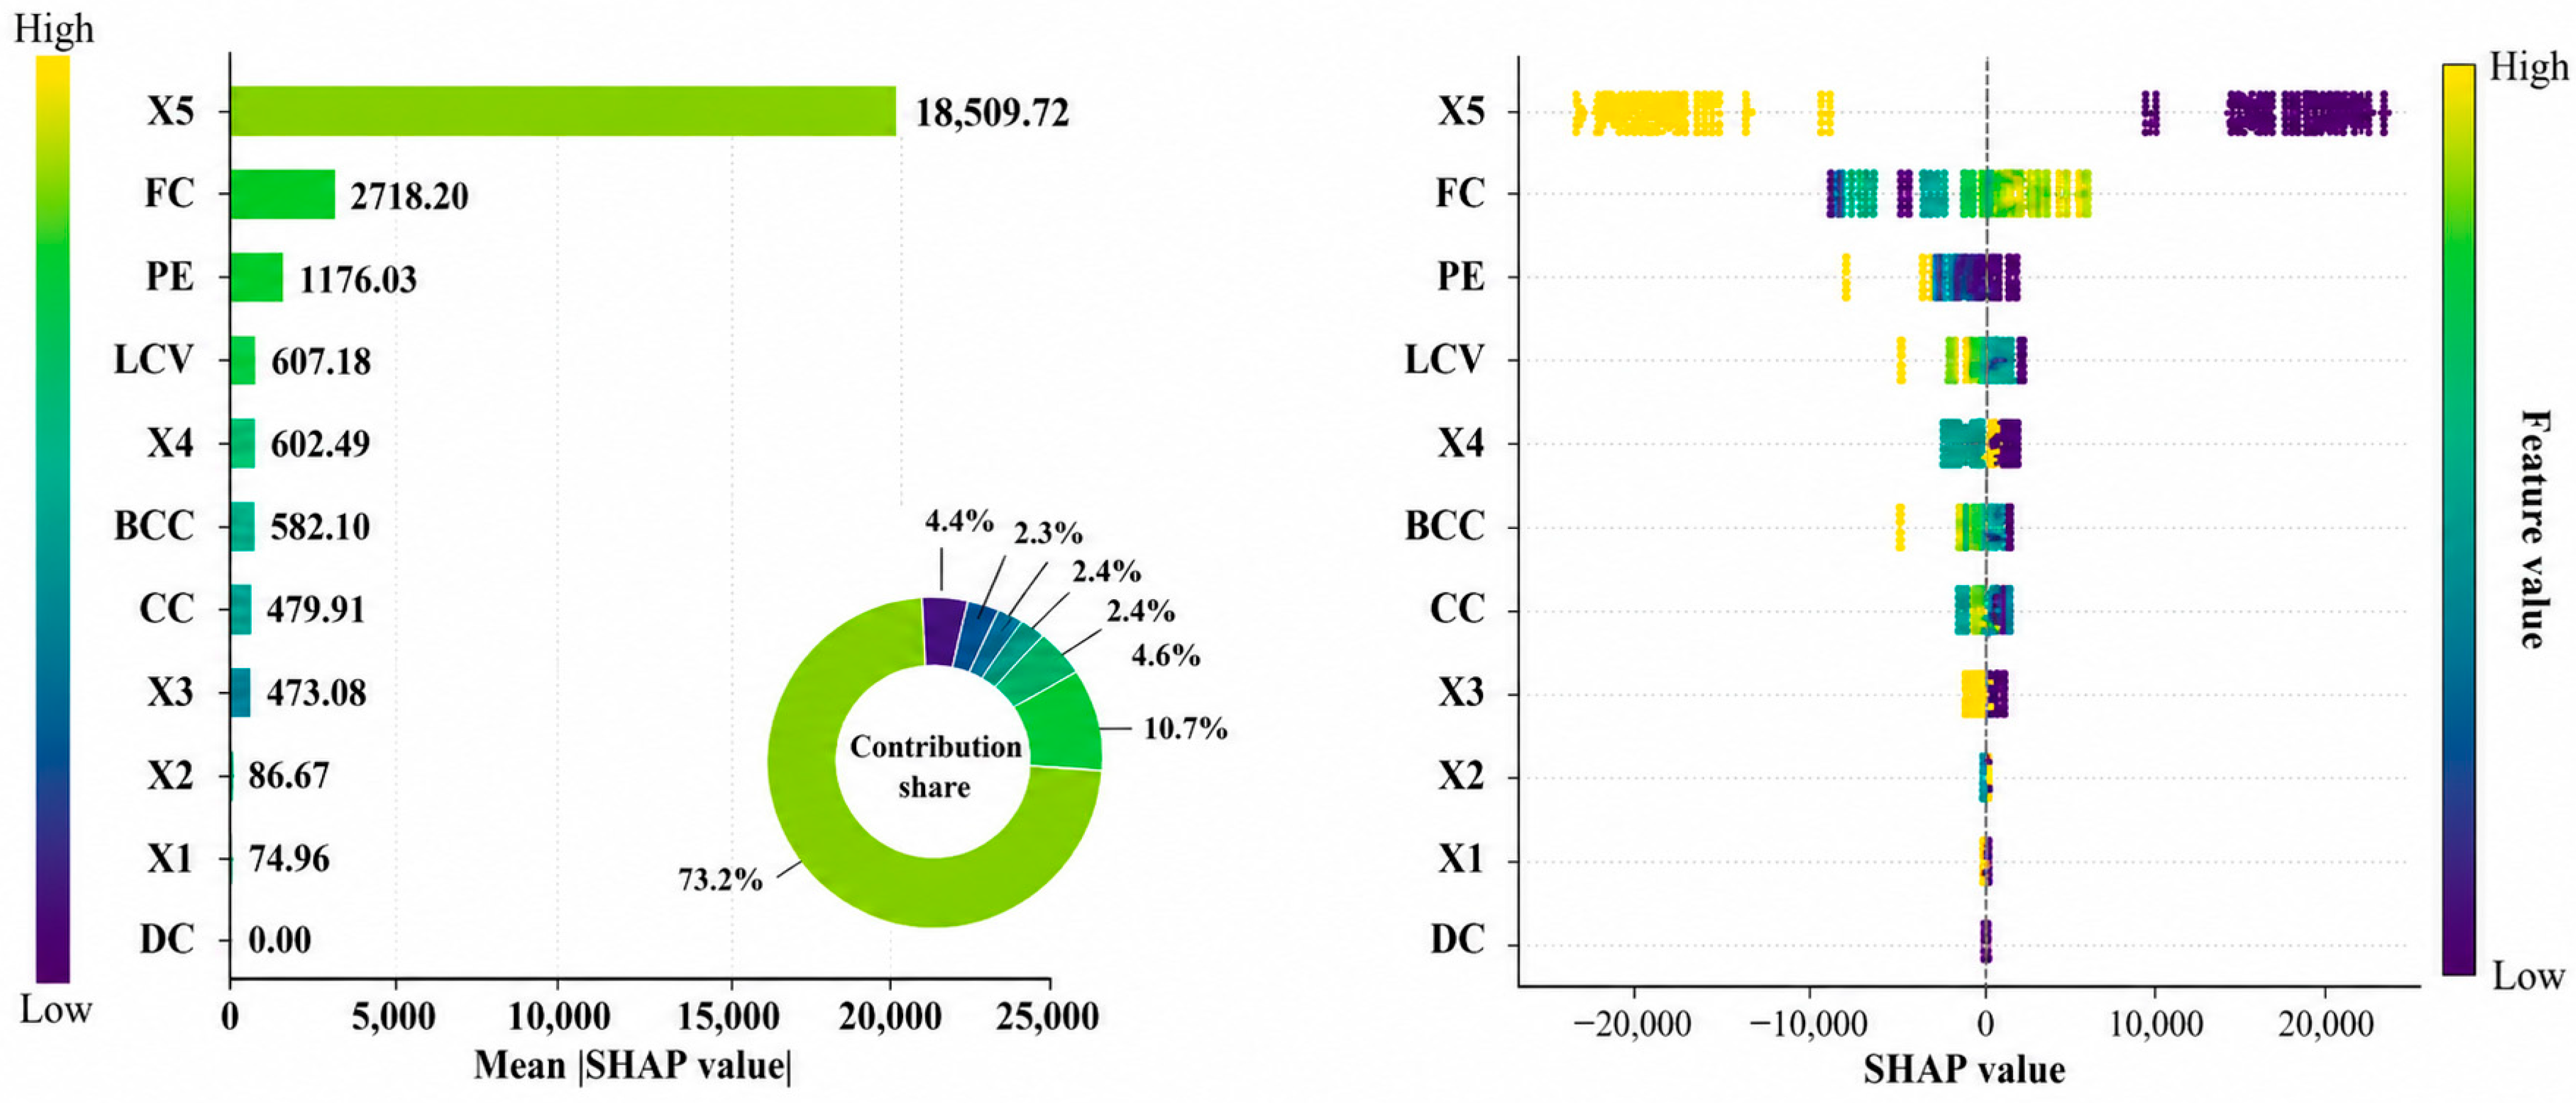
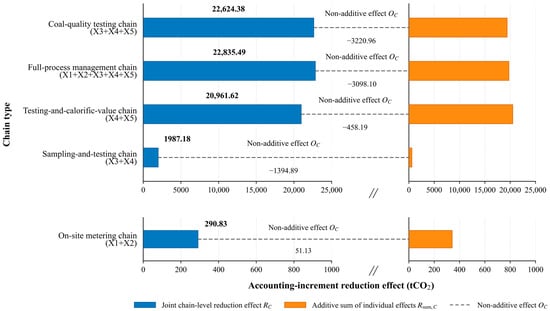
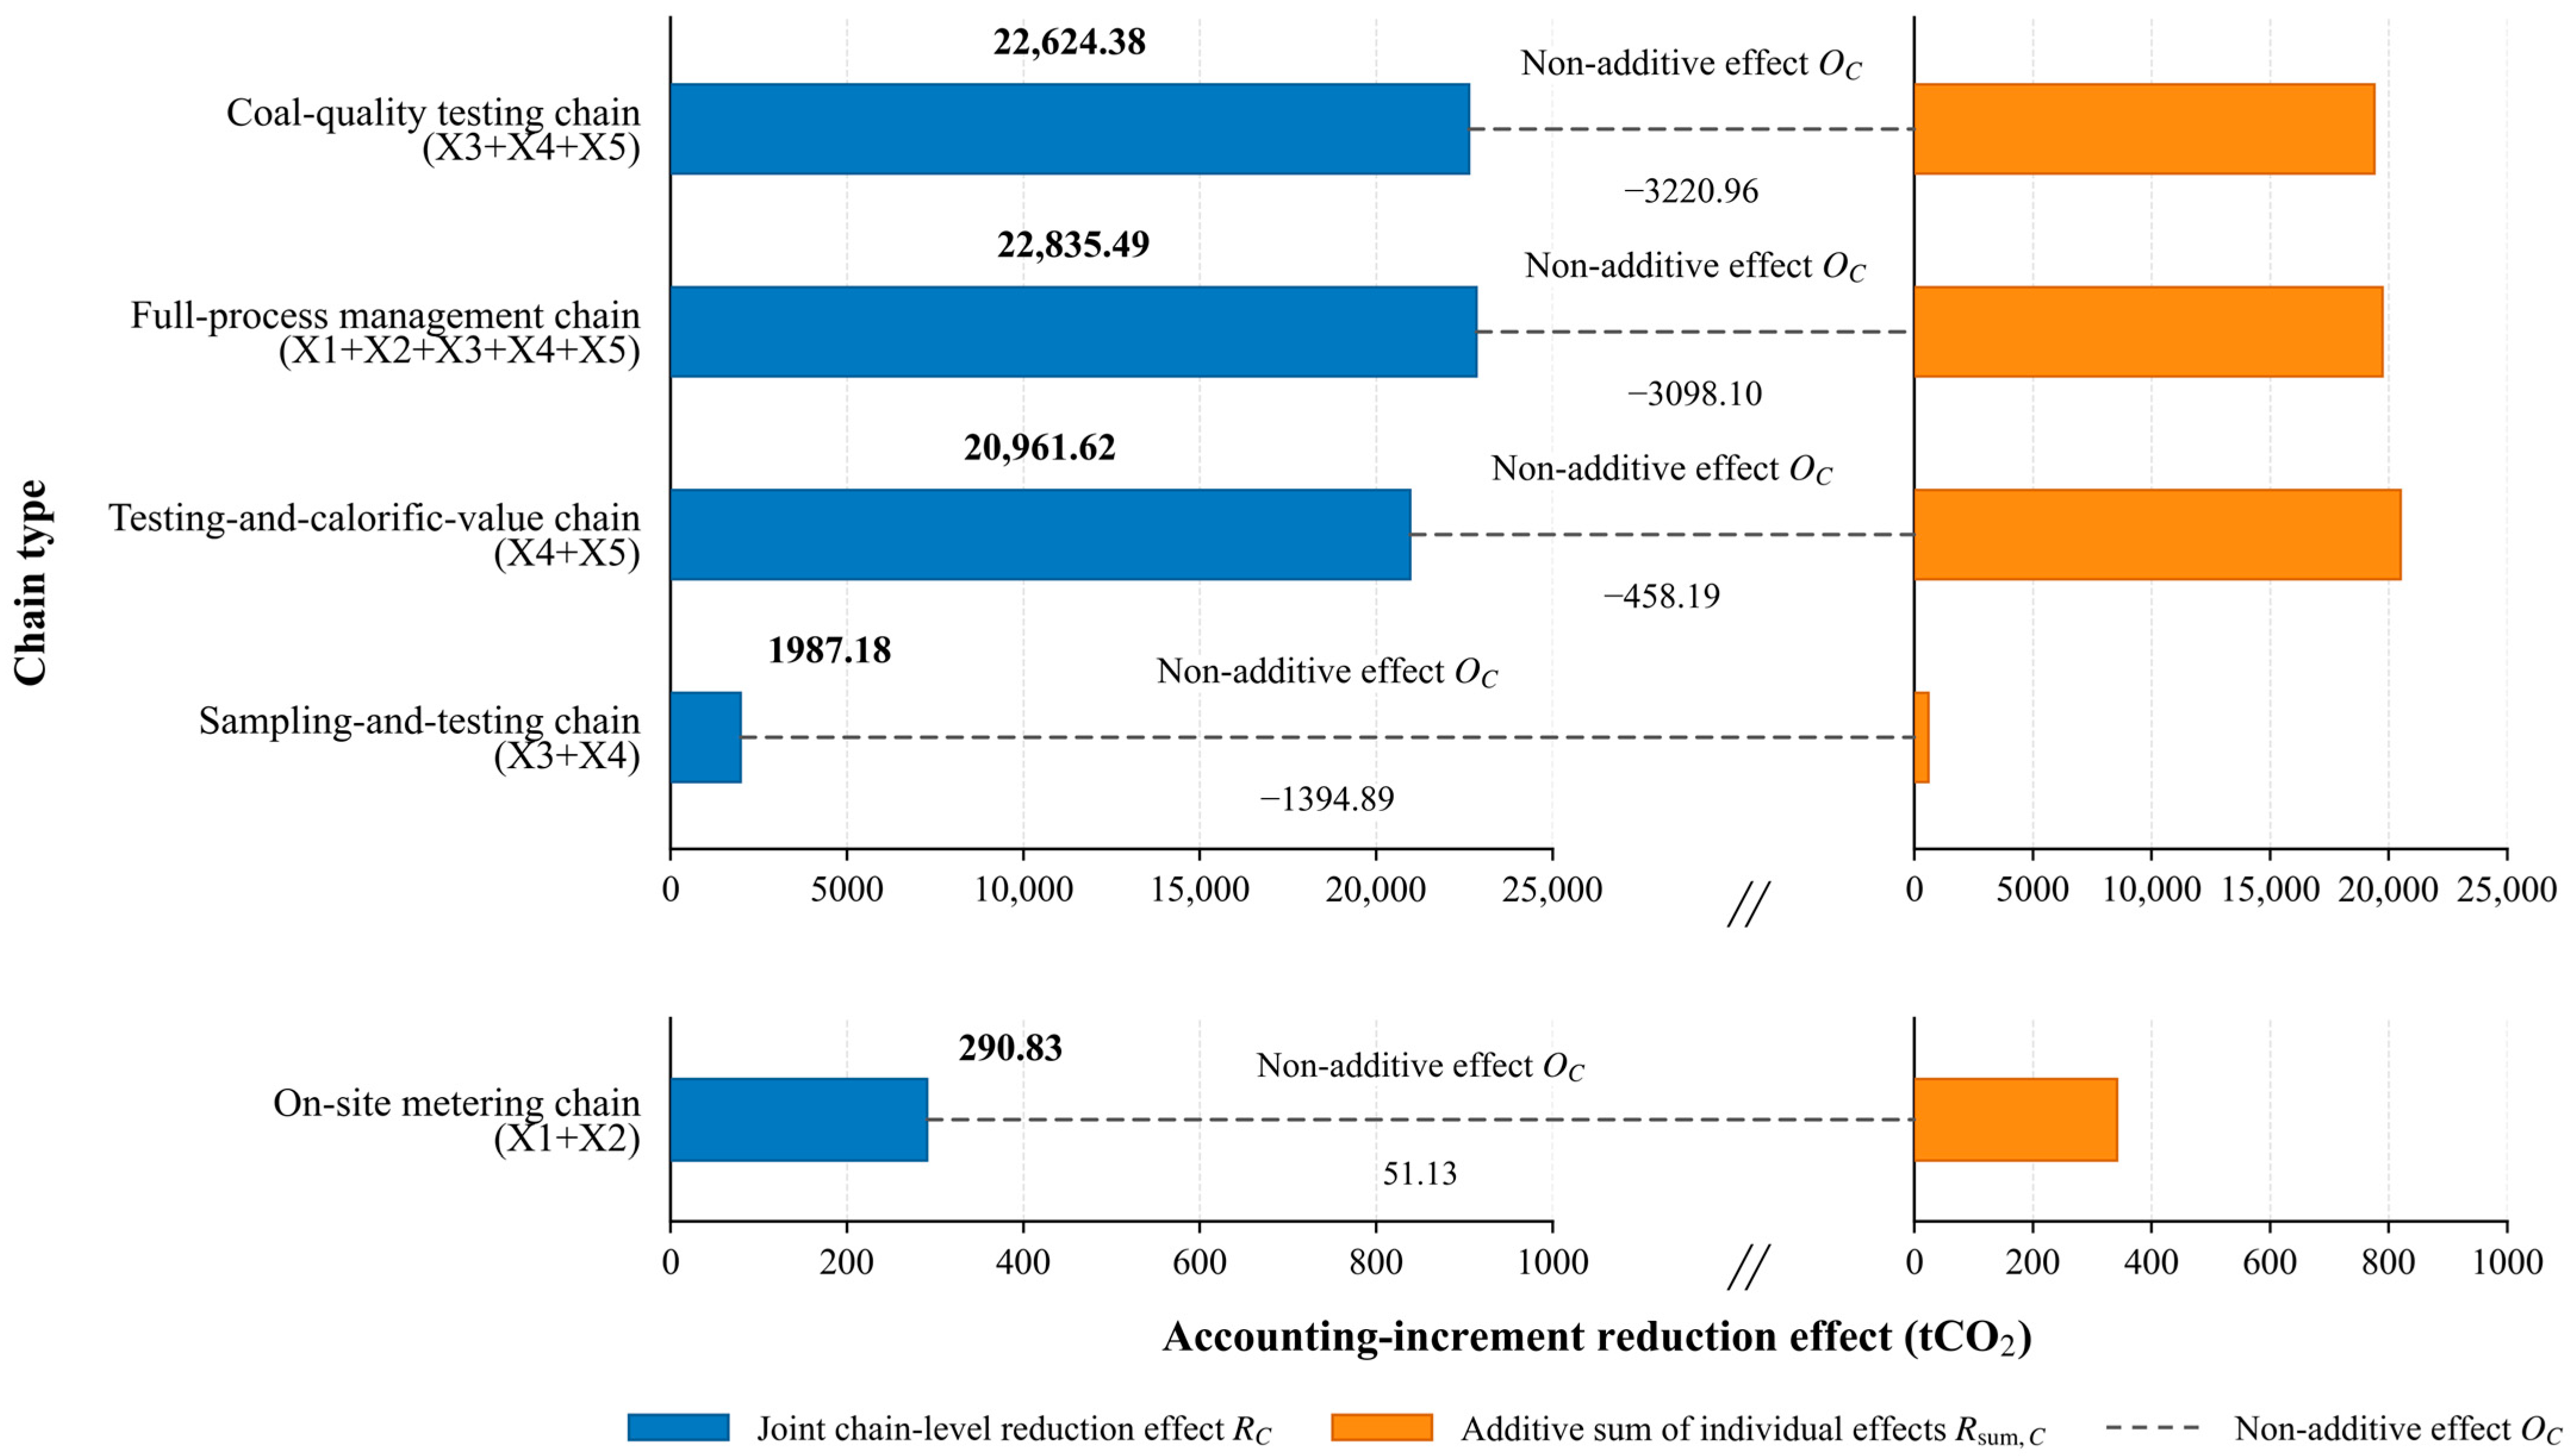
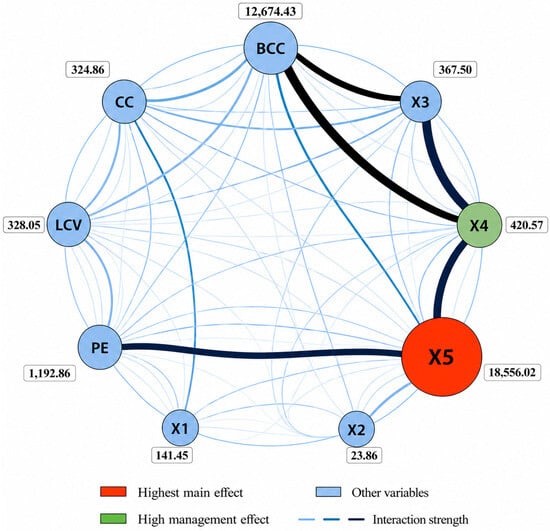
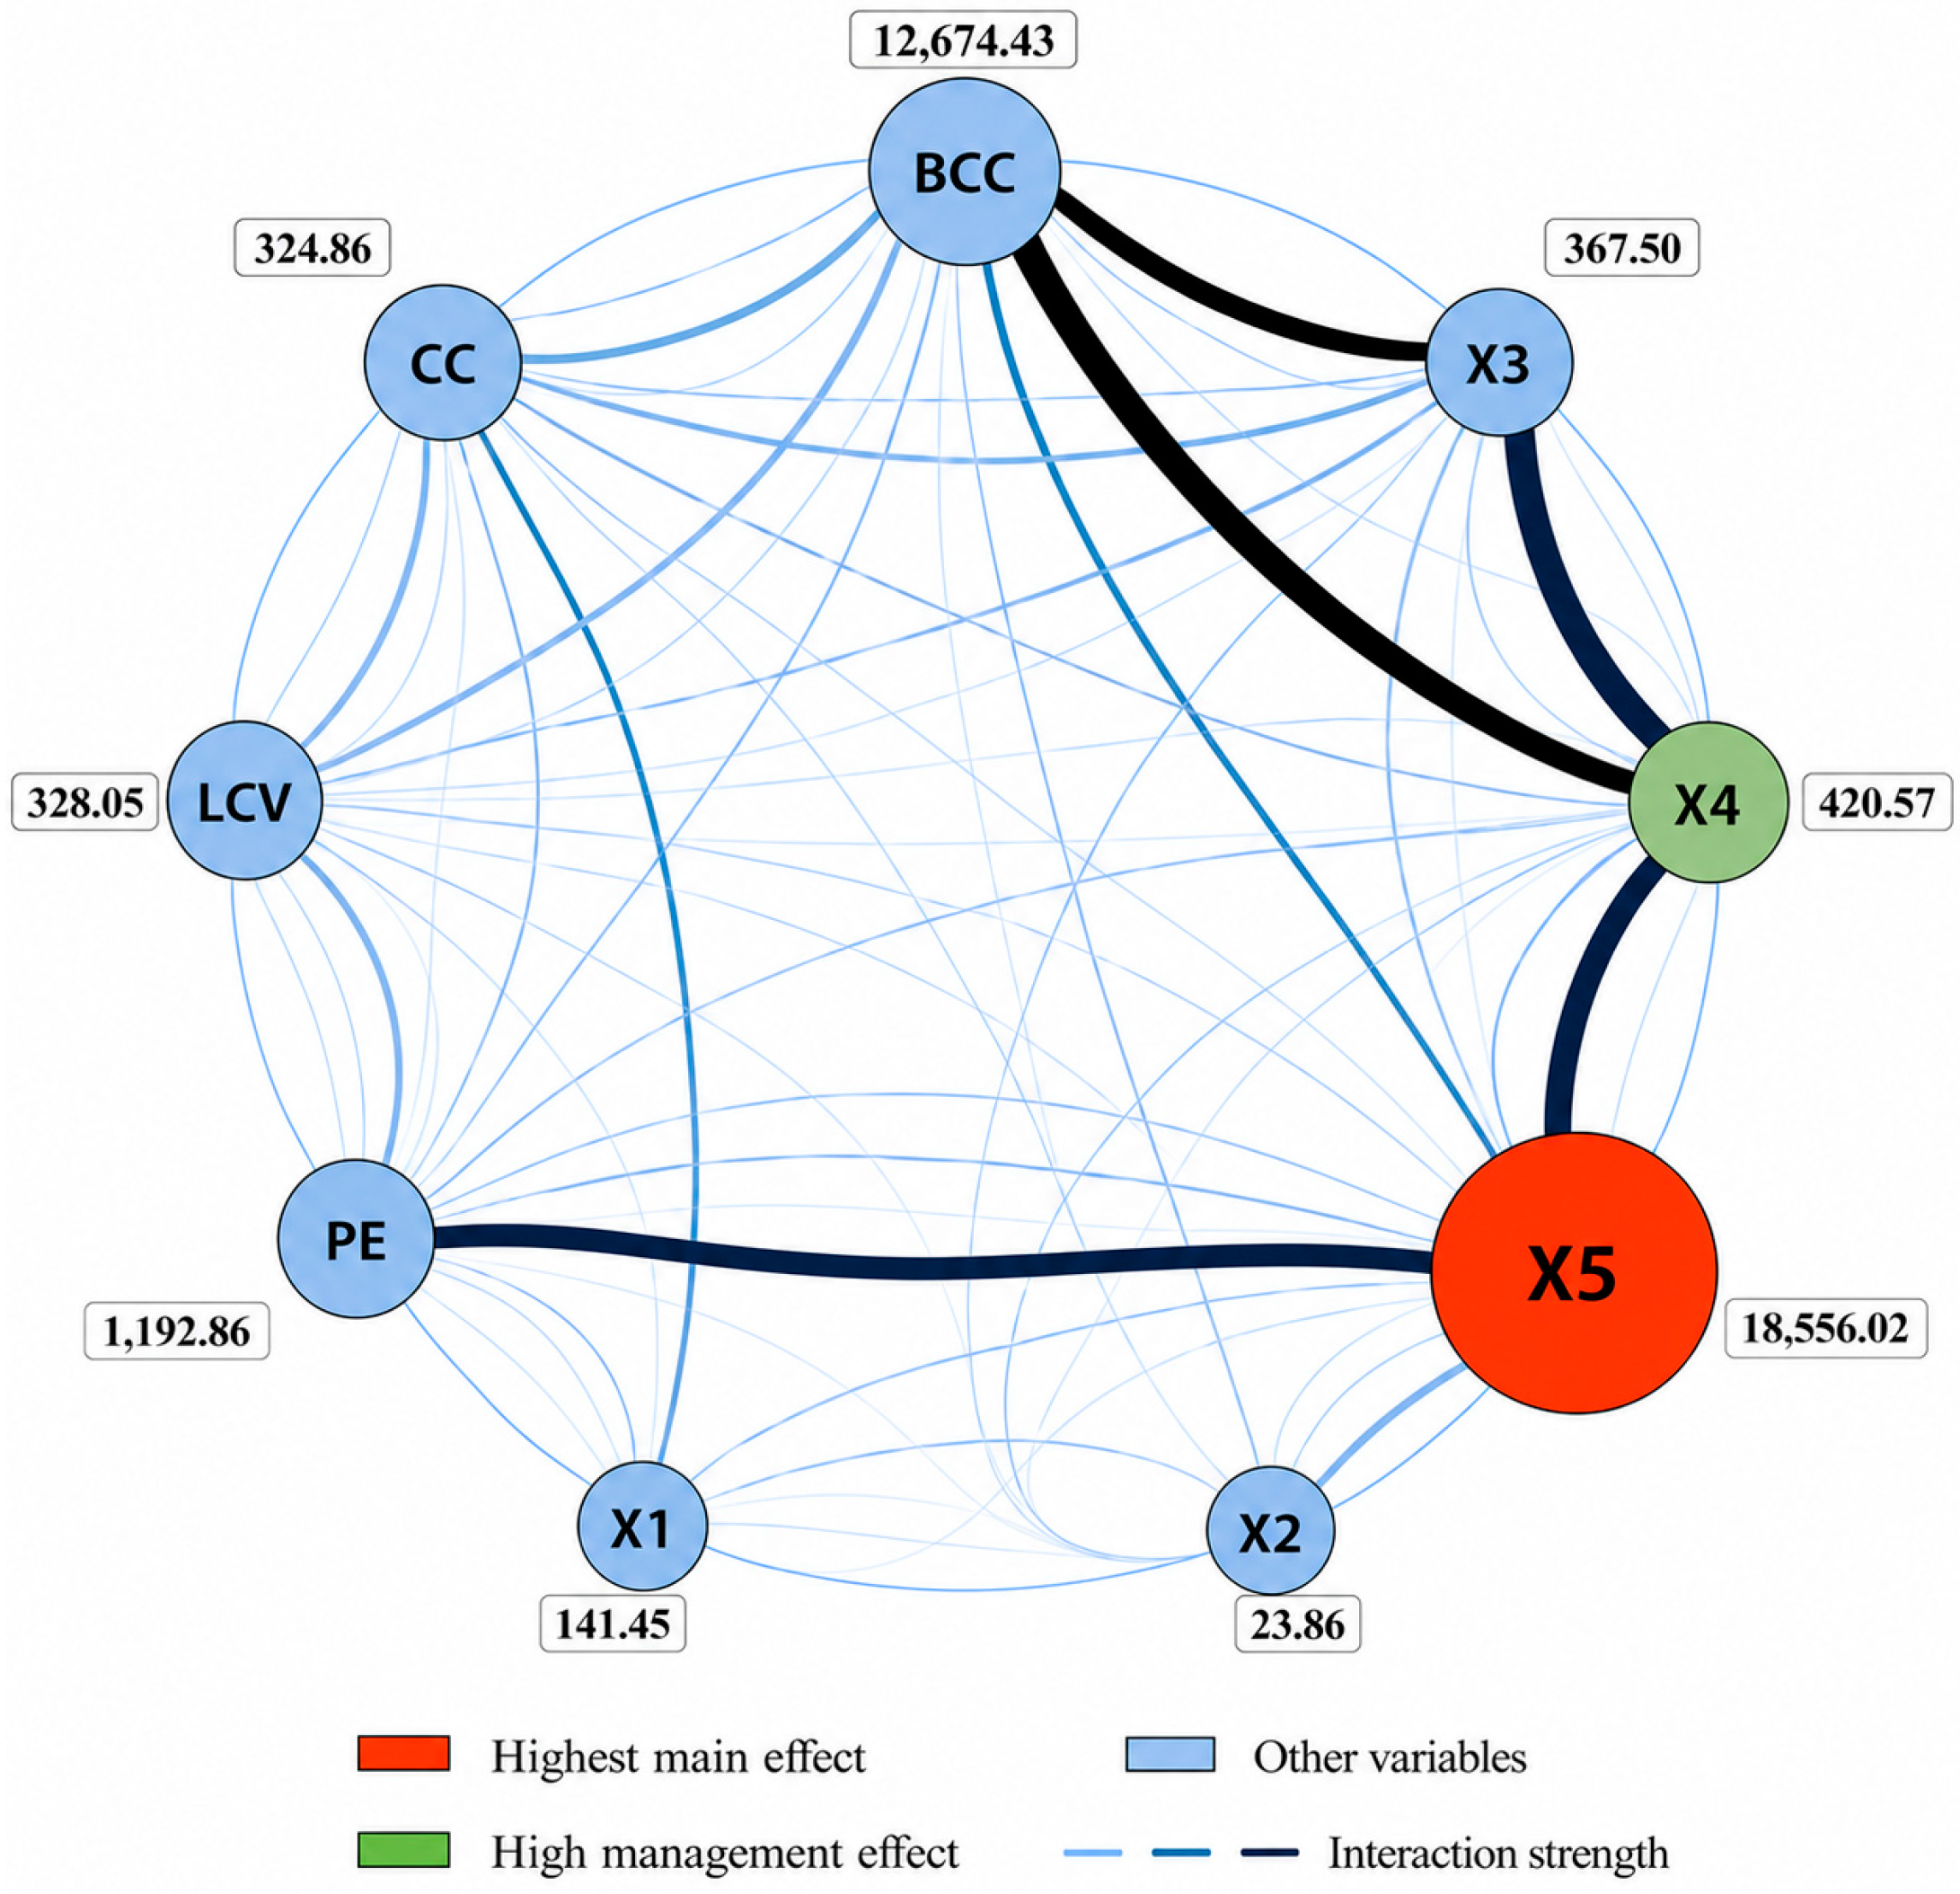
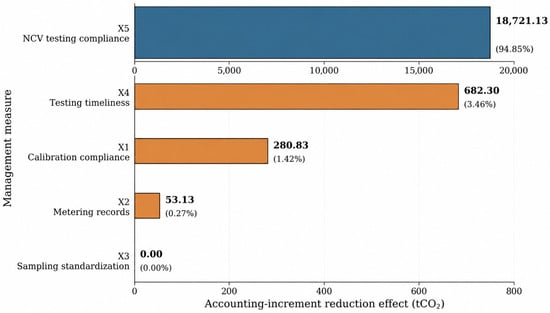
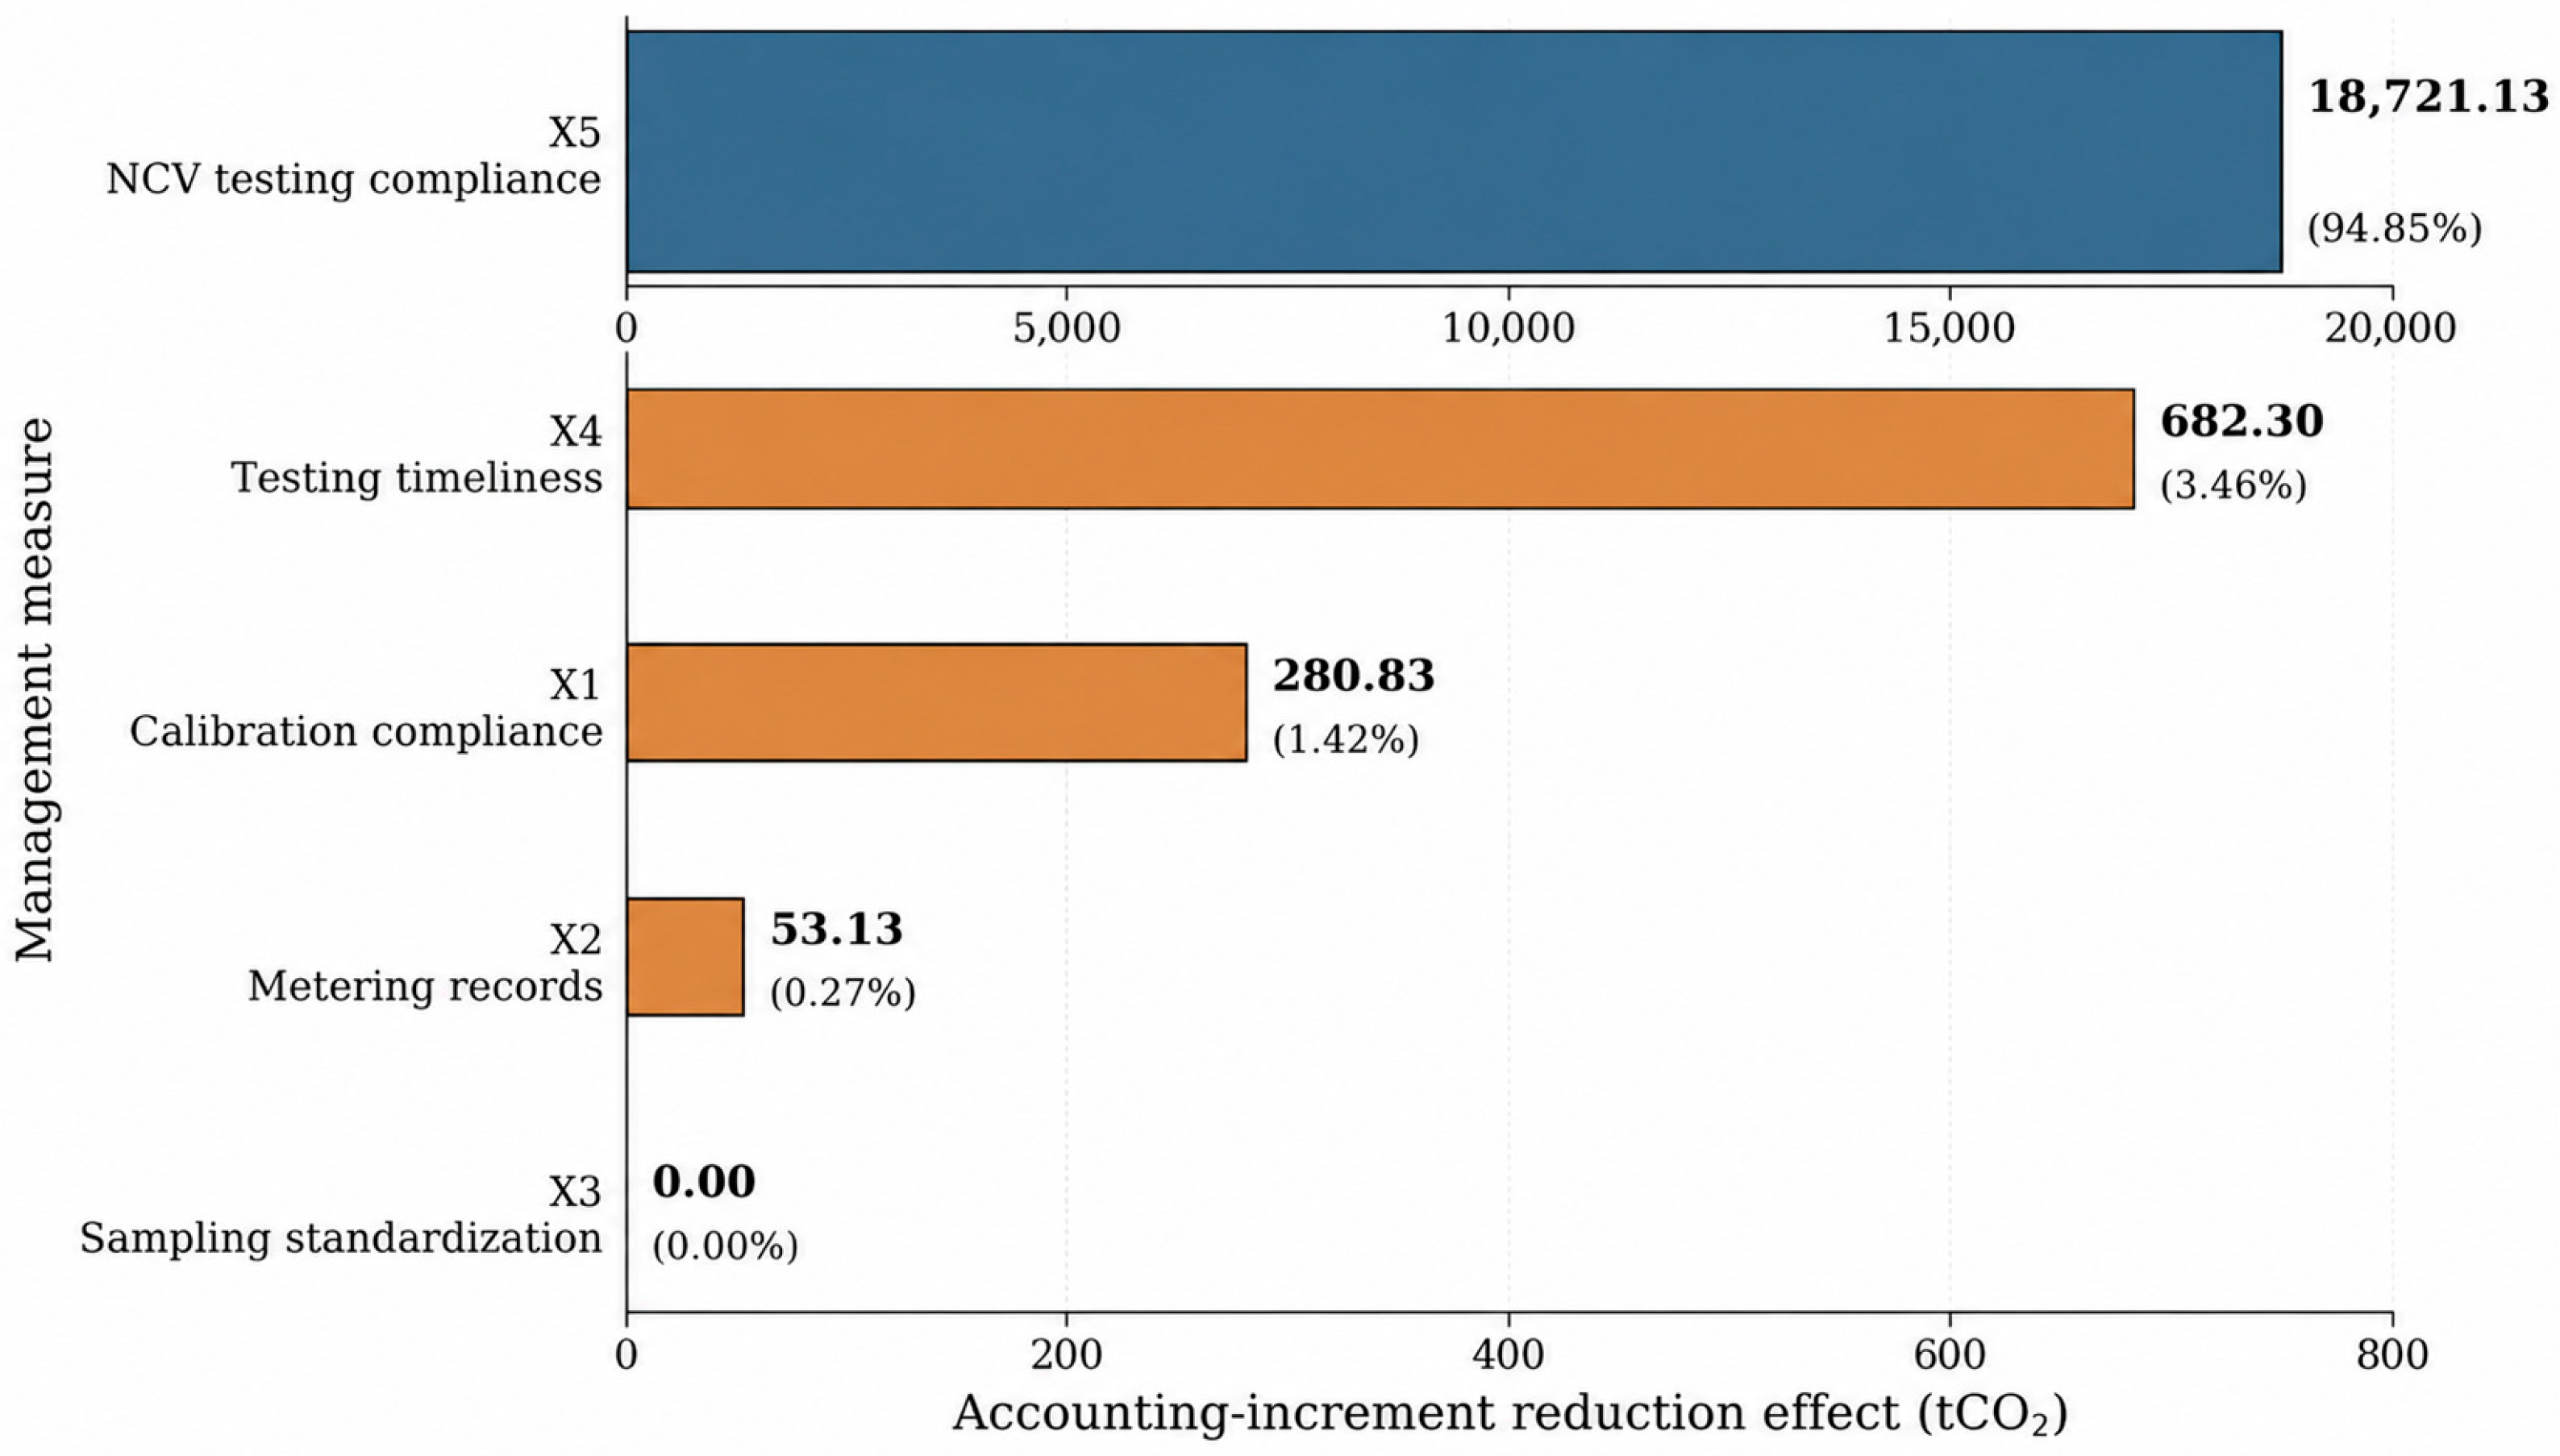
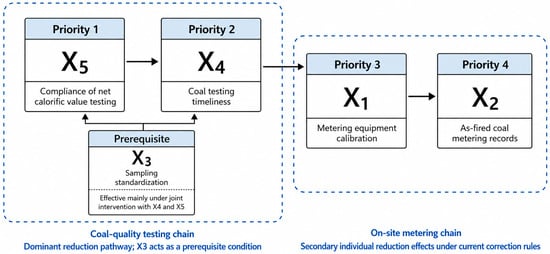
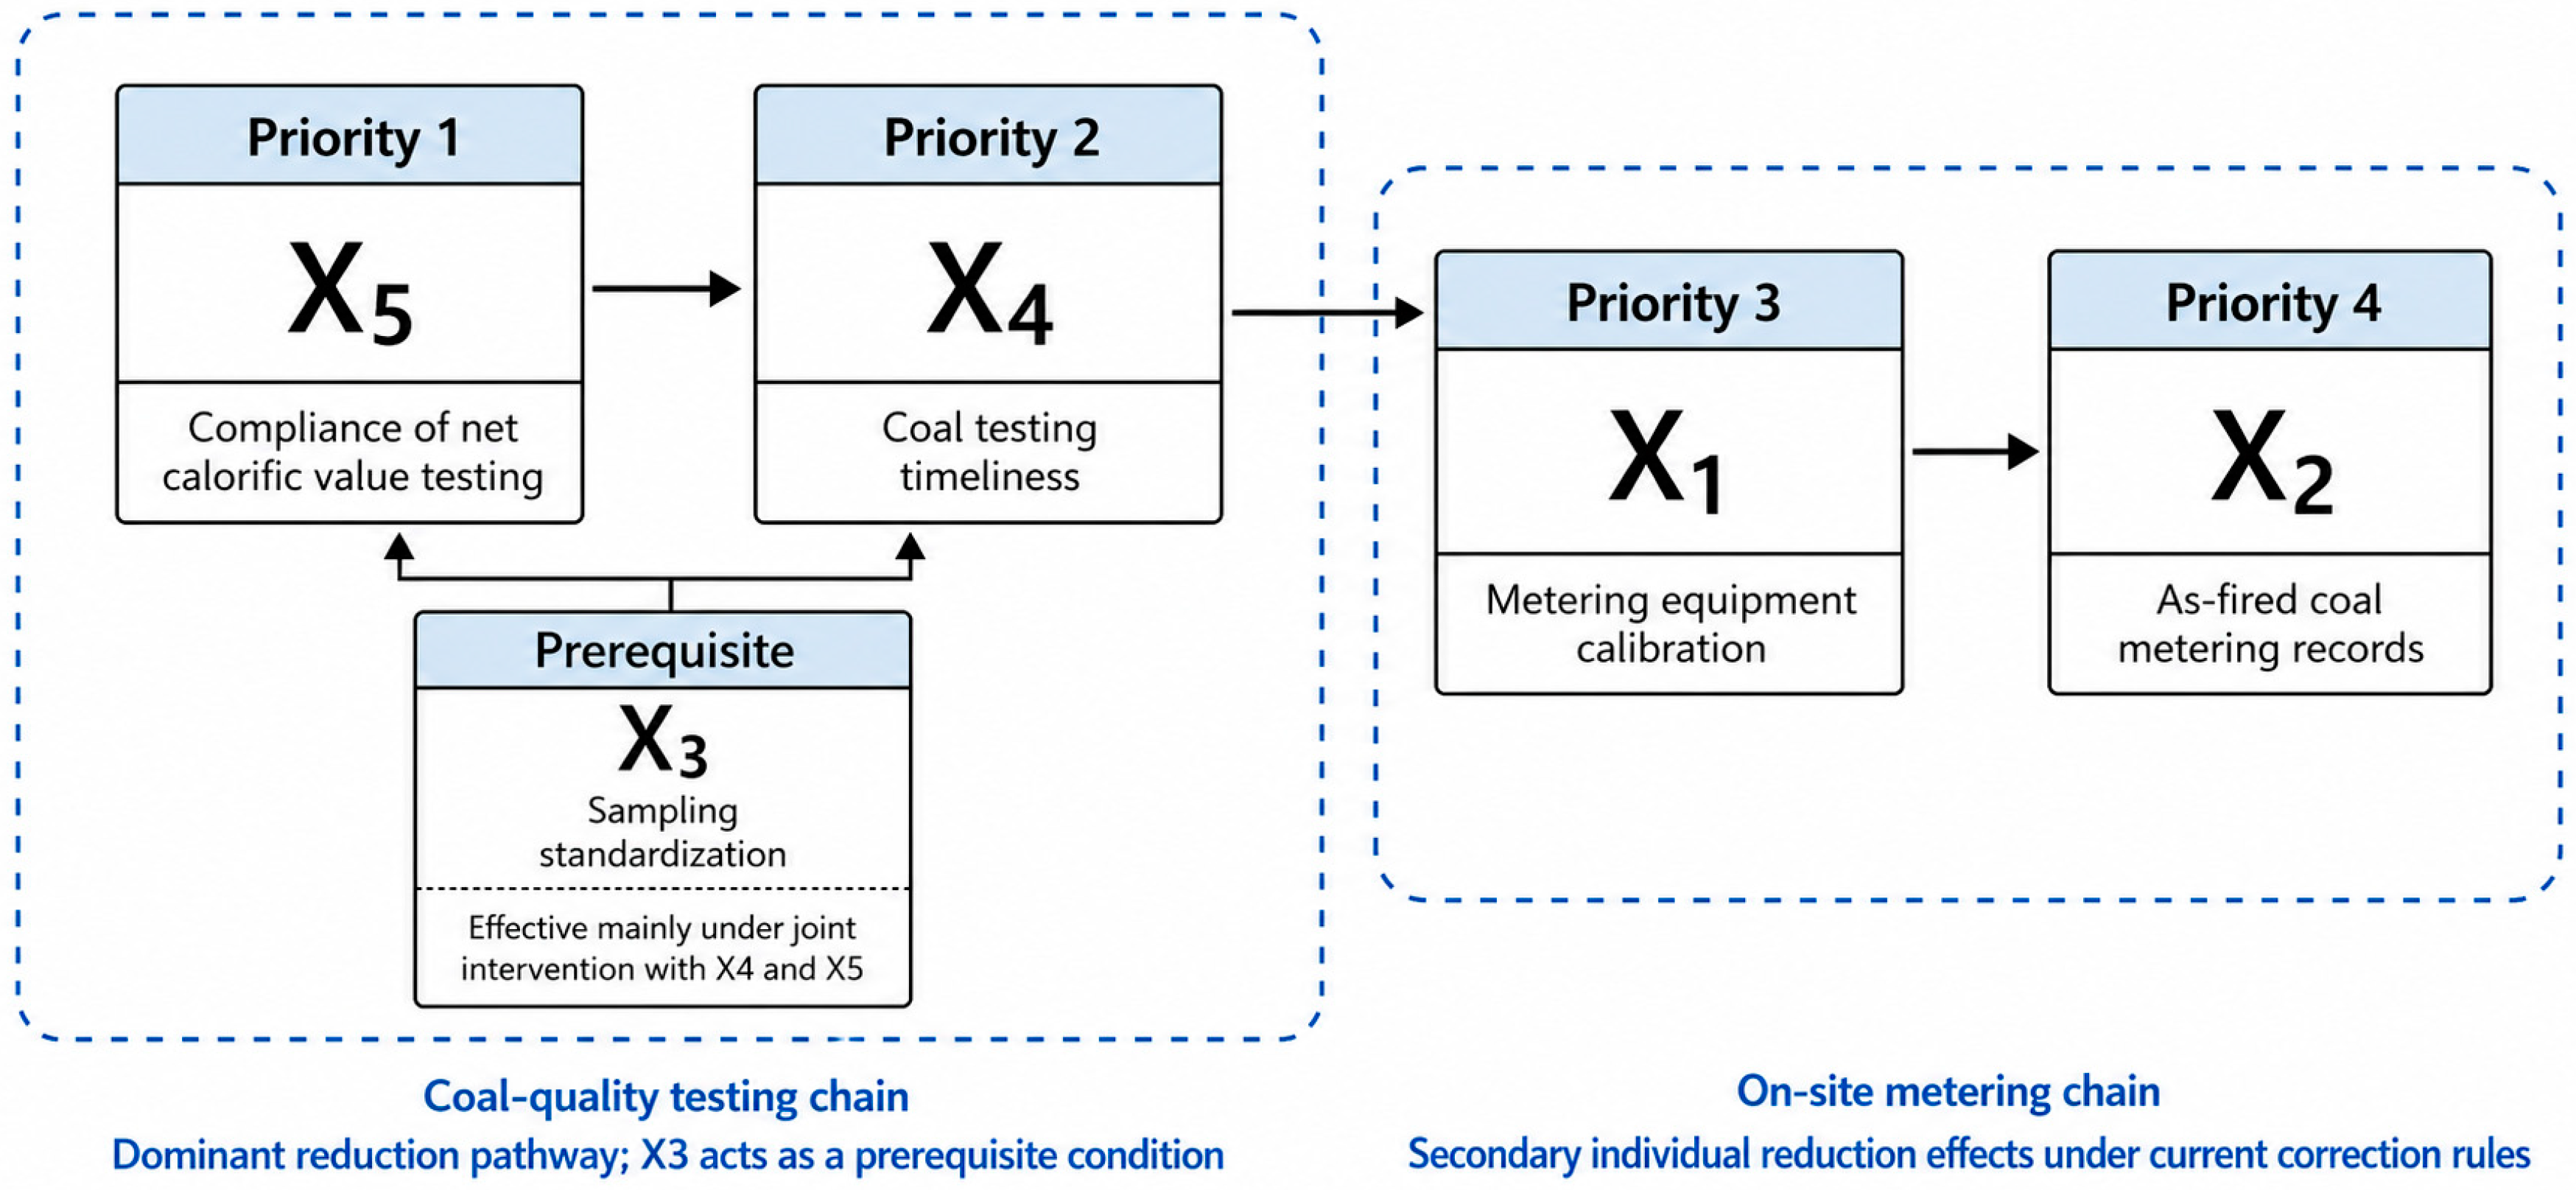

Disclaimer/Publisher’s Note: The statements, opinions and data contained in all publications are solely those of the individual author(s) and contributor(s) and not of MDPI and/or the editor(s). MDPI and/or the editor(s) disclaim responsibility for any injury to people or property resulting from any ideas, methods, instructions or products referred to in the content. |
© 2026 by the authors. Licensee MDPI, Basel, Switzerland. This article is an open access article distributed under the terms and conditions of the Creative Commons Attribution (CC BY) license.