


Abstract
The increasing penetration of distributed generation (DG) units and electric vehicles (EVs) has created significant challenges in minimizing real power loss in modern distribution systems. In this paper, a hybrid Genetic Algorithm–Monte Carlo Simulation (GA–MCS) optimization framework is implemented for the optimal sizing and placement of DG units in a 38-bus radial distribution system under stochastic operating conditions. The analysis is carried out for different voltage-dependent load models considering single-, double-, and triple-DG configurations with different EV categories. The proposed framework is implemented using 50 Monte Carlo scenarios and 50 GA iterations under varying operating conditions. The obtained results indicate that DG2 provides the best performance among single-DG cases in terms of real power loss minimization. In coordinated multi-DG cases, the DG1–DG2 combination reduces real power loss by approximately 6.50–10.07% compared with the best-performing single-DG configuration. The DG1–DG2–DG4 configuration under extended-range electric vehicle (EREV) penetration achieves the minimum real power loss with an additional reduction of approximately 11.89–11.96% with respect to the best-performing single-DG configuration. Voltage profile analysis further confirms the improvement in voltage magnitude after coordinated DG integration. Comparative analysis also indicates the improved convergence characteristics of the proposed GA–MCS framework compared with conventional GA and PSO approaches.
1. Introduction
Distribution networks are no longer operating under the same assumptions that shaped their original design. The growing presence of distributed generations (DGs), particularly renewable-based units, together with the increasing penetration of electric vehicles (EVs), has introduced a level of variability that is difficult to ignore. Unlike conventional demand patterns, EV charging is not only time-dependent but also behavior-driven, while DG output, especially from solar and wind, remains inherently uncertain. When both are in the same system, their combined effect is complex, leading to most planning difficulties.
Earlier studies tried to address this uncertainty in a structured way. For example, stochastic and fuzzy formulations were used to treat DG output and EV demand as uncertain variables rather than fixed inputs [1]. This was a necessary step, but it still depended on simplified models of the practical operating characteristics of EVs. To improve the situation, clustering-based approaches were later introduced to capture different charging patterns and make the modeling less idealized [2]. More recent work has moved further in this direction by embedding uncertainty directly into network reconfiguration and planning problems, such as in bi-level stochastic formulations [3]. Even so, many of these studies remain tied to specific cases and do not fully reflect the diversity of real distribution systems.
Because of the complexity involved, optimization methods have evolved alongside the problem itself. Traditional deterministic techniques have largely been replaced by metaheuristic approaches, which is mainly because the search space becomes too irregular when DGs and EVs are considered together. Hybrid algorithms, in particular, have gained attention. For instance, combining gray wolf optimization with particle swarm optimization has been shown to improve convergence when identifying suitable locations for DGs and charging stations [4]. A similar idea appears in hybrid moth flame optimization, where different search mechanisms are blended to avoid premature convergence in multi-objective problems [5].
At the same time, approaches based on genetic algorithms combined with Monte Carlo simulation have been used to explicitly include randomness in the optimization process [6]. This becomes useful when system conditions cannot be represented by a single scenario. Review studies indicate a growing prevalence of hybrid stochastic–evolutionary frameworks particularly when accounting for realistic load behavior [7,8,9].
Another shift that can be observed in the literature is the move from isolated optimization toward coordinated planning. Instead of treating DGs, EV charging stations, and storage devices separately, more recent studies consider them together within a single framework. This has practical relevance, since these components interact at the network level. For instance, combining DGs and EV charging infrastructure has been shown to reduce losses and improve voltage stability in radial systems [10]. Inadequate coordination, particularly in benchmark systems such as the CIGRE network, may result in unfavorable outcomes, including voltage violations and increased power losses [11].
Multi-objective formulations have also been explored, especially in the context of vehicle-to-grid (V2G) operation, where EVs are treated not only as loads but also as potential energy sources [12]. In parallel, AI-based methods have been applied to improve siting decisions for EV charging stations, often in combination with renewable DGs, with a focus on system reliability [13,14].
One aspect that is still not handled consistently across most of the studies is load modeling. A large portion of the literature continues to assume constant power loads, which is mainly for simplicity. In practice, since loads respond to voltage variations, ignoring this can distort the results. Some works have incorporated ZIP or other voltage-dependent models and reported noticeable changes in optimal DG placement and loss estimation [6,15]. A few recent contributions have attempted to combine realistic load models with EV integration, but this remains relatively limited, particularly when multiple DG units are involved [8].
More recent publications show a clear shift toward more application-oriented work. These studies aim to better reflect real system conditions rather than just algorithm performance. In such studies, optimization frameworks have been proposed for placing EV charging stations within renewable-supported systems while accounting for operational constraints [16,17,18]. The simultaneous operation of electric vehicles (EVs) and renewable distributed generators (DGs) in microgrid environments has been investigated as a means to enhance flexibility [19,20]. There is also increasing interest in managing bidirectional energy flow between EVs and the grid, especially using metaheuristic-based scheduling strategies [21].
New optimization techniques continue to appear as well. The honey badger optimization and hybrid evolutionary methods have been tested for placing EV charging stations and have shown improvements in convergence behavior [22,23,24]. At the same time, robust optimization methods that include storage, demand response, and compensation devices have been used to deal with uncertainty better [25]. Other studies have focused on coordinated EV-renewable systems using multi-stage or multi-objective formulations—often with the aim of reducing operational expenses [26,27,28].
There are also examples of more comprehensive planning approaches. These include the placement of PV-integrated EV charging stations [29], the use of DG-supported infrastructure for sustainable EV integration [30], and strategies for managing dynamic EV charging demand in distribution networks [31]. Recent studies report measurable improvements, and coordinated planning can significantly improve system performance, although it usually comes with increased computational effort [17,32].
Nevertheless, most existing studies primarily emphasize isolated DG allocation, simplified EV representation, or limited operating scenarios, whereas a coordinated comparative assessment of multiple DG configurations with different EV categories under voltage-dependent load conditions remains comparatively limited.
Despite the progress reported in the literature, several limitations remain. First, a large number of studies focus on single-DG configurations or limited multi-DG cases without systematically evaluating coordinated planning across different DG combinations under varying EV penetration conditions. Second, although different EV categories such as battery electric vehicles (BEVs), plug-in hybrid electric vehicles (PHEVs), extended-range electric vehicles (EREVs), and fuel cell electric vehicles (FCEVs) have been considered in several works, their individual impact on DG placement is generally analyzed in isolation, and a unified framework for comparative assessment is still lacking. Third, voltage-dependent load models have been demonstrated to significantly influence system performance and optimal planning strategies; their integration with stochastic optimization techniques in multi-DG environments has not been sufficiently explored. These limitations reduce the applicability of existing approaches for realistic distribution system planning.
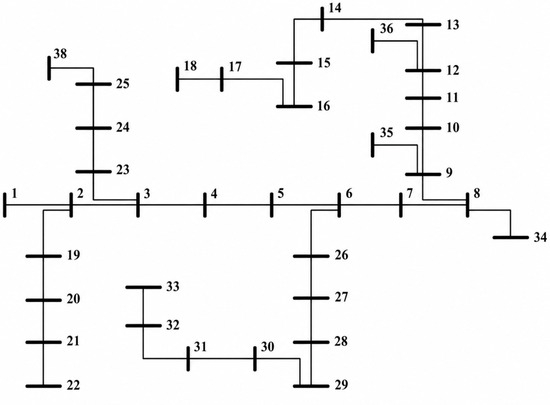
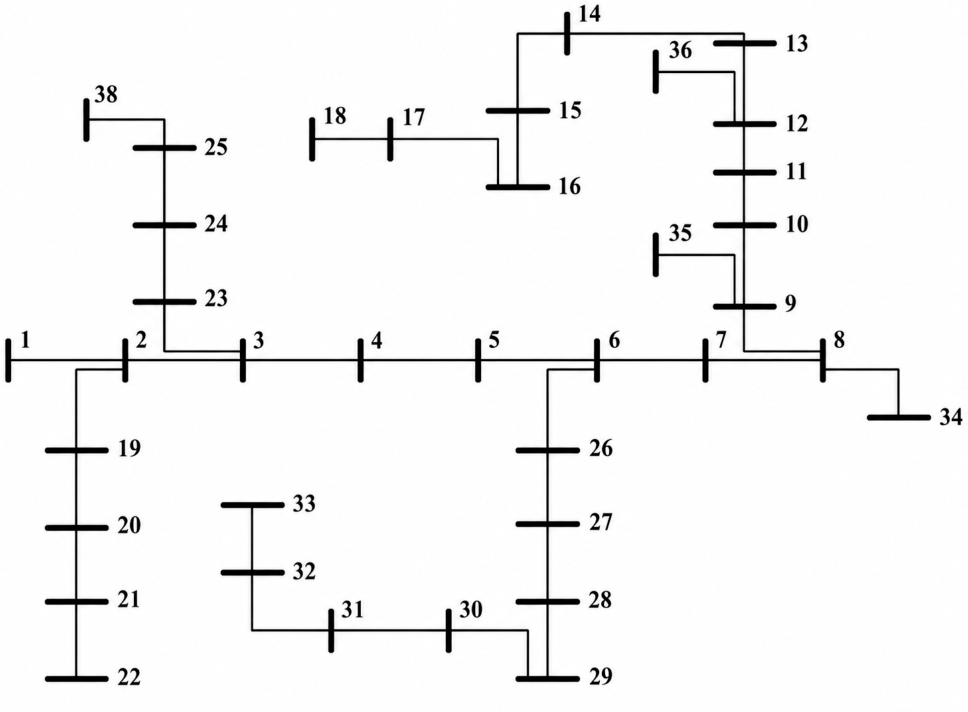
Considering these limitations, this paper investigates the coordinated operation of distributed generation units and electric vehicles in a radial distribution network under different operating conditions. Instead of restricting the analysis to a particular EV category or DG configuration, this paper performs a comparative assessment of single-, double-, and triple-DG configurations in the presence of BEVs, PHEVs, EREVs, and FCEVs while incorporating practical voltage-dependent load behavior. The impact of stochastic operating conditions on DG allocation and active power loss reduction is investigated by means of an optimization approach based on hybrid GA–MCS in a 38-bus distribution system, which is shown in Figure 1. The obtained results further demonstrate the effectiveness of coordinated DG–EV planning under different load and EV penetration scenarios.
Figure 1.
Single-line diagram of the 38-bus radial distribution system.
The major contributions of this paper are summarized as follows:
- A hybrid GA–MCS optimization approach is implemented for coordinated DG and EV integration in a 38-bus radial distribution system under stochastic operating conditions.
- Single-, double-, and triple-DG configurations are systematically investigated under different EV penetration scenarios to analyze coordinated DG–EV integration patterns within the distribution network.
- Practical voltage-dependent load representations associated with industrial, residential, commercial, and constant load models are incorporated to improve the realism of the distribution system analysis.
- The proposed framework is utilized to determine suitable DG locations and DG ratings for minimizing real power loss under varying stochastic operating conditions.
- The influence of different EV categories and load conditions on coordinated DG planning and the overall performance of the distribution system is comparatively evaluated.
The remaining sections of this paper are organized as follows. Section 2 illustrates the mathematical model formulation of different possible combinations of DGs with EVs. Section 3 contains the proposed methodology. Section 4 illustrates simulation and results. Section 5 and Section 6 present the discussion and conclusions, respectively.
2. Mathematical Modeling
In this section, mathematical problem formulation for the planning of single and multiple DGs with different types of EVs is described. In general terms, the DG units are classified based on their active and reactive power delivered/absorbed into the system; these are listed in Table 1. The DG1 system operates only with real power. The DG2 system can handle both real and reactive power components as long as the leading power factor ranges from 0.80 to 0.99. The DG3 system only supports reactive power. Alternatively, the DG4 system has lagging power factors between 0.80 and 0.99, which means it provides the system active power and either absorbs or injects reactive power into the system depending on operating conditions.
Table 1.
Types of different distributed generators.
Similarly, EVs are also categorized into four different forms on the basis of real and reactive power, as detailed in Table 2. These are battery electric vehicles (BEVs), plug-in hybrid electric vehicles (PHEVs), extended-range electric vehicles (EREVs), and fuel cell electric vehicles (FCEVs).
Table 2.
Types of different electric vehicles.
The total MVA intake capacity of the main substation (SS) is given by
where PS and QS are the active and reactive power generated at generating station in MW and MVAR, respectively.
In the case of an individual DG with the main substation, the total MVA intake of the main substation with DG1 having only real power, DG2 having real and reactive power, DG3 having only reactive power, and DG4 having real and reactive power are SS,DG1, SS,DG2, SS,DG3, SS,DG4, respectively, which are expressed by Equations (2)–(5):
In sequence, if the integration of a single DG with different types of EVs is deployed, then the total MVA intake of the main substation with DG1, DG2, DG3 and DG4 with EVs is given by SS,DG1,EV, SS,DG2,EV, SS,DG3,EV, and SS,DG4,EV, respectively, which are shown in Equations (6)–(9):
If the integration of multiple DGs (two DGs at a time) with different types of EVs is implemented in the main substation, then the total MVA intake of the main substation with DG1 and DG2 with EVs is given by SS,DG1,DG2,EV, which is given by Equation (10):
Similarly, any combinations of two DGs can be integrated with EVs with the help of the above equations.
In addition, if the integration of multiple DGs (three DGs at a time) with different types of EVs is implemented in the main substation, then the total MVA intake of the main substation with DG1, DG2, and DG3 with EVs is given by SS,DG1,DG2,DG3,EV, which is given by Equation (11):
Similarly, any combination of three DGs can be integrated with EVs with the help of the above equations.
The objective function for the optimal sizing and location of DGs inside a distribution system is a reduction in the total real power loss of the system, which is represented by PLoss,ij and formulated in Equation (12):
In Equation (12), rij is the resistance in the line section between bus i and bus j, Vi is the bus voltage of the ith bus, and PLoss,ij is a function of all system bus voltage and line resistance.
In the planning of single or multiple DGs with EVs in a distribution system, voltage-dependent load models are adopted along with a constant load model, as presented in Table 3. Practical voltage-dependent load models like industrial load, residential load, and commercial load have been tested [33]. The mathematical formulations are given by Equations (13) and (14):
Table 3.
Different types of voltage-based static load models [33].
In the above equation, x and y are the exponents of active power and reactive power, respectively.
3. Proposed Methodology
3.1. Genetic Algorithm for Active Power Loss Minimization
A genetic algorithm (GA) is a population-driven evolutionary optimization approach derived from the principle of natural selection. In distribution system planning, a GA is particularly effective for addressing nonlinear, nonconvex, and combinatorial optimization problems, such as the following:
- Optimal DG allocation and sizing.
- Optimal placement and penetration of EVs.
- Minimization of active/real power loss (RPL) under bus voltage limits and DG capacity (MVA) constraints.
GA iteratively improves solutions using:
- Selection—by favoring low-loss solutions.
- Crossover—by exchanging good features.
- Mutation—by diversifying the search space.
In the GA formulation for RPL minimization, each chromosome represents a candidate network configuration, where genes encode binary variables for DG and EV bus locations and continuous or discrete variables for DG and EV sizing.
3.1.1. Advantages of GA
- It is efficient for large and discrete search spaces.
- It does not require gradient information.
- It avoids premature convergence better than classical methods.
- It is well suited for the integration of DG–EV placement problems.
3.1.2. Limitations of GA
- In a GA, deterministic evaluation assumes fixed load and EV behavior.
- It is sensitive to uncertainty in EV arrival and departure and load variability.
- Its fitness may be misleading under stochastic operating conditions.
3.2. Monte Carlo Simulation for Active Power Loss Minimization
Monte Carlo simulation (MCS) is a probabilistic technique that evaluates system performance under uncertainty by repeatedly sampling random variables such as load demand (SLMs, ZIP load models), EV charging/discharging patterns, DGs and EVs availability, and component outages or islanding conditions.
3.2.1. Advantages of MCS
- It accurately captures stochastic behavior.
- It evaluates reliability and congestion probability.
- It provides expected and worst-case RPL.
3.2.2. Limitations of MCS
- It requires numerous iterations to be accurate.
- It is computationally expensive for large scenario sets.
- It cannot directly search for optimal DG–EV placement.
3.3. Hybrid GA–MCS Optimization Technique for Active Power Loss Reduction
Hybrid GA–MCS optimization is more suitable because this approach combines the optimization capability of GAs and the uncertainty modeling capability of an MCS. Therefore, within the GA–MCS hybrid framework, the initial population was generated using predefined data sets, and the GA fitness function then chose their final values based on the MCS decision-making capability. In hybrid GA–MCS optimization, the GA generates candidate DG–EV configurations, and the MCS evaluates each candidate under multiple stochastic scenarios.
Mathematical Formulation of the Hybrid GA–MCS Framework
The hybrid GA–MCS optimization framework is mathematically formulated as a constrained stochastic optimization problem for minimizing the total real power loss of the radial distribution system under different EV penetration conditions and voltage-dependent load models. In the proposed framework, the genetic algorithm (GA) performs an optimal search for DG sizing and placement, whereas the Monte Carlo simulation (MCS) evaluates the performance of each candidate solution under multiple stochastic operating scenarios.
The primary optimization objective for the proposed GA–MCS framework is defined as
where f represents the fitness function of the proposed hybrid GA–MCS framework and E[PLoss] denotes the expected real power loss evaluated over all Monte Carlo operating scenarios.
The optimization process is subjected to several operational constraints to maintain feasible system operation. The bus voltage magnitude constraint is represented as
where Vi is the voltage magnitude at the ith bus, while Vmin and Vmax denote the permissible lower and upper voltage limits, respectively.
The DG generation capacity constraint is expressed as
where PDG,i represents the active power generated by the ith DG unit, while PDG,imin and PDG,imax indicate the minimum and maximum DG operating capacities.
Similarly, the power balance constraints for active and reactive powers are maintained during the optimization process and can be expressed as
where PD and QD represent the active and reactive load demands; PEV and QEV represent EV charging demands; PDG,i and QDG,i denote the active and reactive powers generated by the ith DG unit; and NDG represents the total number of DG units integrated into the distribution system.
Within the proposed framework, each chromosome generated by the GA represents a candidate DG–EV configuration consisting of DG locations, DG capacities, and corresponding EV operating conditions. For every chromosome, Monte Carlo simulation repeatedly evaluates the objective function under different stochastic load and EV scenarios. The final fitness value is then determined using the expected real power loss over all considered Monte Carlo scenarios. This combined stochastic–evolutionary optimization process improves the robustness of the obtained solution and reduces the possibility of premature convergence under uncertain operating conditions.
The algorithm steps for this hybrid GA–MCS technique are as follows:
- Step 1:
- Initialize a population of chromosomes whose length equals the number of candidate buses. Each gene is encoded in binary form, where “1” denotes an active bus and “0” denotes an inactive bus. All existing buses in the network are considered active by default.
- Step 2:
- Select one chromosome from the population and perform simulation studies. For the active buses indicated by the chromosome, evaluate the radial distribution system by computing the active power loss, substation MVA loading, and corresponding bus locations.
- Step 3:
- Choose one load scenario from the predefined set of static load models (SLMs), considering any one possible load condition in various voltage-dependent load models.
- Step 4:
- After that, by using MCS, randomly remove a predefined number of buses from the chromosome to generate a modified bus string along with a corresponding off-bus configuration for DGs and EVs.
- Step 5:
- Now, verify the feasibility of system operation under the modified configuration. If islanding or infeasible operation is detected, return to Step 4 and regenerate the configuration.
- Step 6:
- If any DGs or EVs are eliminated during the MCS optimization, replace them with higher-capacity DG and EV units. To maintain balance across different SLM conditions, deploy single or multiple DGs with EVs according to a merit-order–based allocation strategy.
- Step 7:
- Continue the power flow analysis for the remaining buses. Record power flow results for all active buses in the network.
- Step 8:
- Repeat Step 4 and Step 5 under MCS for a large number of random scenarios to capture system uncertainty.
- Step 9:
- Repeat Step 3 for all possible load scenarios derived from the load–duration or load–variation curve.
- Step 10:
- Compute the corresponding real power loss, MVA loading, and bus locations for each evaluated scenario.
- Step 11:
- Determine the minimum real power loss obtained among all evaluated configurations of the 38 bus system.
- Step 12:
- If both the MVA loading and real power loss satisfy predefined low or acceptable limits, proceed directly to Step 18.
- Step 13:
- Using the stored power-flow results, estimate the congestion probability for each active bus in the distribution system.
- Step 14:
- Construct a roulette-wheel selection mechanism for each active bus based on its congestion probability. Then, update the bus status probabilistically by applying the roulette-wheel selection method.
- Step 15:
- Recalculate the total optimal real power loss for the updated network configuration.
- Step 16:
- Return to Step 10 to reassess the performance metrics for the revised configuration.
- Step 17:
- Return to Step 2 and repeat the evaluation for the next chromosome in the GA population.
- Step 18:
- Using the defined objective function, identify the optimal system configuration that yields the minimum total real power loss through the hybrid GA–MCS optimization framework.
3.4. GA–MCS Parameter Settings
The performance of the proposed GA–MCS optimization framework depends on the appropriate selection of the algorithm control parameters. The parameter settings adopted in this paper were selected based on repeated simulation trials to maintain a balance between convergence characteristics, computational effort, and solution stability. Table 4 summarizes the principal parameters used in the implementation of the proposed optimization framework.
Table 4.
GA–MCS parameter settings.
4. Simulation and Results
In the planning of single or multiple DGs with EVs in a distribution system, a 38-bus radial distribution system is adopted for testing. The performance of DGs with or without EVs is investigated on the basis of different voltage-dependent load models along with a constant load model. The analysis is carried out under different operating scenarios, including individual DG integration, double-DG integration, and triple-DG integration with different EV categories using the proposed hybrid GA–MCS optimization framework.
Before discussing the detailed simulation scenarios, the convergence characteristics and comparative validation of the proposed optimization framework are presented to demonstrate the effectiveness of the adopted GA–MCS approach for real power loss minimization under stochastic operating conditions.
4.1. Comparative Convergence Characteristics of the Optimization Methods
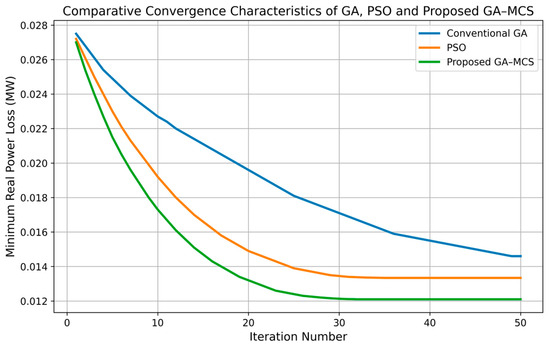
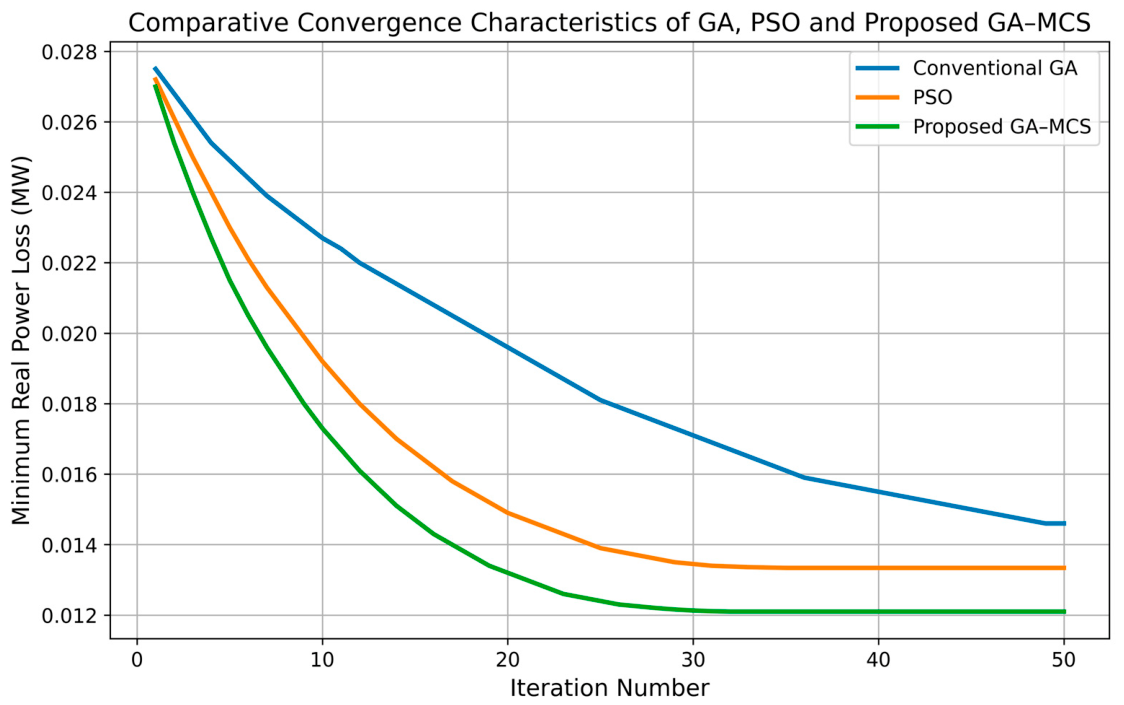
The comparative convergence characteristics of the optimization methods are shown in Figure 2. It can be observed that the proposed GA–MCS framework achieves faster convergence and lower real power loss compared with the conventional GA and PSO approaches. During the initial iterations, all optimization methods exhibit a rapid reduction in real power loss; however, the proposed GA–MCS approach demonstrates improved convergence stability and reaches a lower minimum loss value under stochastic operating conditions. The improved convergence behavior is mainly attributed to the combined search capability of the genetic algorithm and the stochastic evaluation process incorporated through Monte Carlo simulation.
Figure 2.
Comparative convergence characteristics of a conventional GA, PSO, and the proposed GA–MCS optimization framework for reducing real power loss.
4.2. Comparative Validation of the Proposed GA–MCS Optimization Framework
To further validate the effectiveness of the proposed GA–MCS framework, a representative comparison was carried out for the best-performing triple-DG configuration—i.e., DG1, DG2, and DG4—under EREV penetration. The comparative results listed in Table 5 indicate that the proposed GA–MCS approach achieves lower real power loss and improved convergence response compared with conventional GA and PSO methods. The improved performance is mainly attributed to the combined optimization capability of GA and the stochastic evaluation process incorporated through Monte Carlo simulation.
Table 5.
Comparative validation of conventional GA, PSO, and proposed GA–MCS optimization methods for active power loss reduction.
4.3. Statistical Performance Under Monte Carlo Scenarios
To further evaluate the stochastic performance of the proposed GA–MCS framework, statistical performance analysis was performed with 50 Monte Carlo simulation scenarios under different loading conditions. The mean loss, standard deviation, best loss, and worst loss values were calculated based on the optimization results and are summarized in Table 6 to evaluate the stability and consistency of the proposed framework under uncertain operating conditions.
Table 6.
Statistical performance of the proposed GA–MCS framework under different Monte Carlo loading scenarios.
The statistical results in Table 6 further demonstrate that the proposed GA–MCS framework can maintain a stable optimization performance under different stochastic loading conditions. The relatively small standard deviation values indicate limited variation in the obtained minimum real power losses over different Monte Carlo scenarios. In addition, the low difference between best and worst loss values indicates stable performance and convergence consistency of the proposed optimization framework for coordinated DG–EV planning in radial distribution systems.
4.4. Scenario I—Individual DG with Different EVs
In this scenario, four categories of DG—i.e., DG1, DG2, DG3, and DG4—are implemented individually with different EVs (BEV, PHEV, EREV, and FCEV), which are discussed earlier in this paper, on different static load models (SLMs).
4.4.1. Case 1: DG1 Alone with Different EVs
In this case, DG1 having a unity power factor that is integrated with different EVs, the performance of DG1 under different EV penetration conditions is reported in Table 7, in which the optimal value of active power loss (PLoss), optimal sizing and siting of DG1 are represented for each SLM.
Table 7.
Performance of DG1 under EV penetration for different load models.
4.4.2. Case 2: DG2 Alone with Different EVs
In this case, DG2 with a 0.85 leading power factor is integrated with different EVs; the optimal value of active power loss (PLoss) and the suitable siting and sizing of DG2 are represented for each SLM, as detailed in Table 8.
Table 8.
Performance of DG2 under EV penetration for different load models.
4.4.3. Case 3: DG3 Alone With or Without EVs
Furthermore, DG3 alone having zero power factor is integrated with different EVs; the performance of DG3 alone with or without EVs is obtained in terms of the optimal value of real power loss (PLoss) as well as the optimal placement and sizing of DG3, which are represented for each SLM, as shown in Table 9.
Table 9.
Performance of DG3 under EV penetration for different load models.
4.4.4. Case 4: DG4 Alone with Different EVs
In sequence, DG4 alone having a power factor of 0.85 lagging is integrated with different EVs; the performance of DG4 alone with or without EVs is obtained in terms of the optimal value of active power loss (PLoss), DG allocation, and sizing of DG4, which are represented for each SLM, as shown in Table 10.
Table 10.
Performance of DG4 under EV penetration for different load models.
4.5. Scenario II—Multiple DGs (Two DGs at a Time) with Different EVs
In this scenario, all of the possible combinations of a set of two DGs—i.e., DG1 and DG2, DG2 and DG3, DG3 and DG4, DG4 and DG1, DG1 and DG3, and DG2 and DG4—are integrated with different EVs in a 38-bus radial distribution system for different SLMs. All six possible cases are discussed from case 5 to case 10.
4.5.1. Case 5: Integration of DG1 and DG2 with Different EVs
In this case, the combination of DG1 and DG2 is integrated with different EVs. Table 11 presents the analysis of different parameters, like real power loss (PLoss) and the optimal locations of both DGs and sizing.
Table 11.
Performance of DG1and DG2 under EV penetration for different load models.
4.5.2. Case 6: Integration of DG2 and DG3 with Different EVs
Similar to the previous case, now a combination of DG2 having a power factor of 0.85 leading with DG3 having zero power factor is integrated with different EVs in all voltage-dependent static load models. The optimal location of individual DGs and the sizing are obtained for reductions in real power loss, as reported in Table 12.
Table 12.
Performance of DG2 and DG3 under EV penetration for different load models.
4.5.3. Case 7: Integration of DG3 and DG4 with Different EVs
Similarly, a combination of DG3 having zero power factor with DG4 having a 0.85 lagging power factor is integrated with different EVs in all voltage-dependent static load models. The results of GA–MCS optimization for the real power loss, individual sizing and locations of the DGs are shown in Table 13.
Table 13.
Performance of DG3 and DG4 under EV penetration for different load models.
4.5.4. Case 8: Integration of DG4 and DG1 with Different EVs
Following the previous cases, the coordinated integration of DG4 and DG1 is investigated for different voltage-dependent static load models in the presence of different EVs. The detailed results are tabulated in Table 14.
Table 14.
Performance of DG4 and DG1 under EV penetration for different load models.
4.5.5. Case 9: Integration of DG1 and DG3 with Different EVs
In the subsequent case, a combined set of DG1 and DG3 is examined with different EVs. The same GA–MCS framework is applied to obtain the optimal locations and sizing of each DG to achieve minimum real power loss; the observations are tabulated in Table 15.
Table 15.
Performance of DG1 and DG3 under EV penetration for different load models.
4.5.6. Case 10: Integration of DG2 and DG4 with Different EVs
Finally, the last double-DG configuration—i.e., DG2 and DG4—is integrated with different EVs to minimize real power loss. The optimized results are reported in Table 16.
Table 16.
Performance of DG2 and DG4 under EV penetration for different load models.
4.6. Scenario III—Multiple DGs (Triple DGs at a Time) with Different EVs
In this scenario, for the comparative assessment, all the possible combinations of a set of triple DGs are integrated with different EVs in a 38-bus radial distribution system for different voltage-dependent SLMs. All the four possible cases are discussed from case 11 to case14.
4.6.1. Case 11: Integration of DG1, DG2, and DG3 with Different EVs
The simultaneous integration of three DG sets—i.e., DG1, DG2 and DG3—is investigated with different EVs to find the combined impact of these to minimize the real power loss. The optimal siting and sizing of the three DG units obtained using the GA–MCS framework are illustrated in Table 17.
Table 17.
Performance of DG1, DG2 and DG3 under EV penetration for different load models.
4.6.2. Case 12: Integration of DG2, DG3, and DG4 with Different EVs
Similarly, DG2 having a 0.85 leading power factor is integrated with DG3 having zero power factor and DG4 having a 0.85 lagging power factor in the presence of different EVs. In this case, a balanced combination of active and reactive power contributions has been provided to achieve minimum real power loss. The optimized results obtained using the GA–MCS framework are tabulated in Table 18.
Table 18.
Performance of DG2, DG3 and DG4 under EV penetration for different load models.
4.6.3. Case 13: Integration of DG3, DG4, and DG1 with Different EVs
To further analyze the triple-DG configuration comprising DG3, DG4 and DG1 with different EVs, the optimization has been performed for improving real power loss performance. The obtained results in terms of the sizing and siting of each individual DG are presented in Table 19.
Table 19.
Performance of DG3, DG4 and DG1 under EV penetration for different load models.
4.6.4. Case 14: Integration of DG4, DG1, and DG2 with Different EVs
Finally, in the triple-DG scenario, a combined integration of DG4, DG1, and DG2 is examined using the proposed hybrid optimization technique in the presence of EV penetration under different voltage-dependent load model conditions. The results for the 38-node bus distributed system are listed in Table 20.
Table 20.
Performance of DG4, DG1 and DG2 under EV penetration for different load models.
5. Discussion
5.1. Comparative Assessment of DG–EV Configurations
To improve the clarity of the overall result interpretation, the best-performing DG–EV configurations obtained from the detailed scenario-wise analysis are summarized in Table 21. Instead of repeating all of the tabulated results, the representative optimal cases from single-, double-, and triple-DG integration are compared to highlight the effect of DG combinations, EV categories, and voltage-dependent load conditions on active power loss reduction.
Table 21.
Comparative summary of best-performing DG–EV configurations under different planning scenarios.
Table 21 contains the comparative results which indicate that DG2 provides the most effective performance among the individual DG configurations under different operating conditions. The improved performance of DG2 is mainly associated with its capability to provide both active and reactive power support at a leading power factor. In the double-DG cases, the coordinated operation of DG1 and DG2 further reduces real power loss compared with the best-performing individual DG case. Among all of the investigated configurations, the triple-DG arrangement consisting of DG1, DG2, and DG4 under EREV penetration provides the minimum real power loss and demonstrates the best overall network performance for the considered 38-bus radial distribution system.
The comparative analysis under different EV penetration conditions indicates that the coordinated operation of DGs with EVs further improves the performance of the distribution network. Among the investigated EV categories, EREV penetration generally provides comparatively lower real power loss values under most DG configurations and load conditions. BEV and PHEV cases also contribute to reductions in real power loss; however, their performance remains slightly less effective than the corresponding EREV cases under several operating conditions. In contrast, the FCEV cases show comparatively moderate improvement depending on the DG combination and load model considered.
To further examine the improvement achieved through coordinated DG integration, a comparative reduction analysis of real power loss is summarized in Table 22 with respect to the best-performing single-DG configuration under corresponding load conditions.
Table 22.
Comparative reduction in real power loss for coordinated DG configurations under different load models.
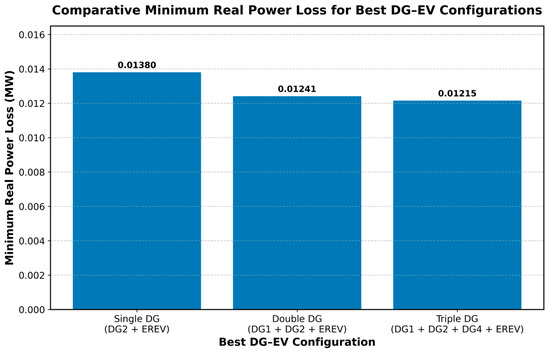
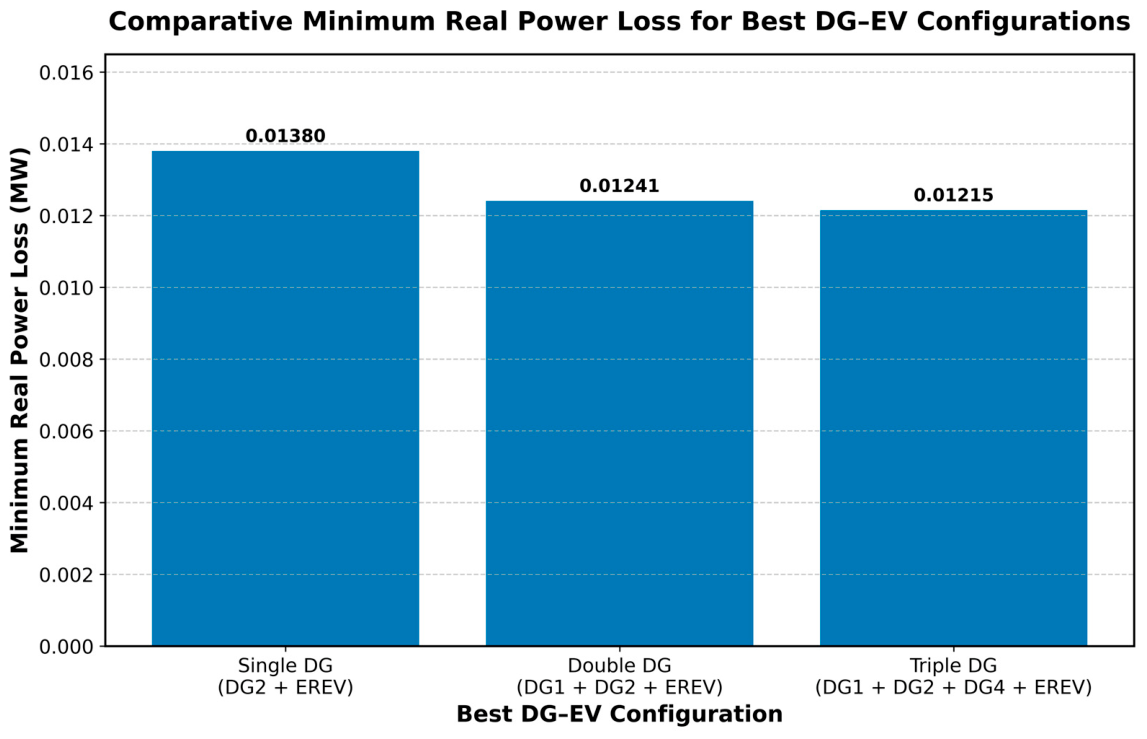
A comparative visualization of the minimum real power loss obtained for the best-performing DG configurations is presented in Figure 3.
Figure 3.
Comparative minimum real power loss for best single-, double-, and triple-DG configurations under different EV penetration conditions.
Figure 3 shows the comparative minimum real power loss obtained for the best-performing DG configurations under EREV penetration conditions. It can be observed that the minimum real power loss decreases progressively from the single-DG case to the coordinated double- and triple-DG configurations. The obtained results indicate that the coordinated operation of multiple DG units provides improved operating performance for the radial distribution system compared with isolated DG operation. Among all of the investigated cases, the DG1–DG2–DG4 configuration achieves the lowest minimum real power loss.
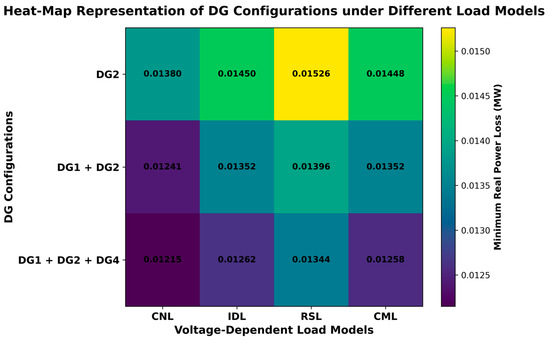
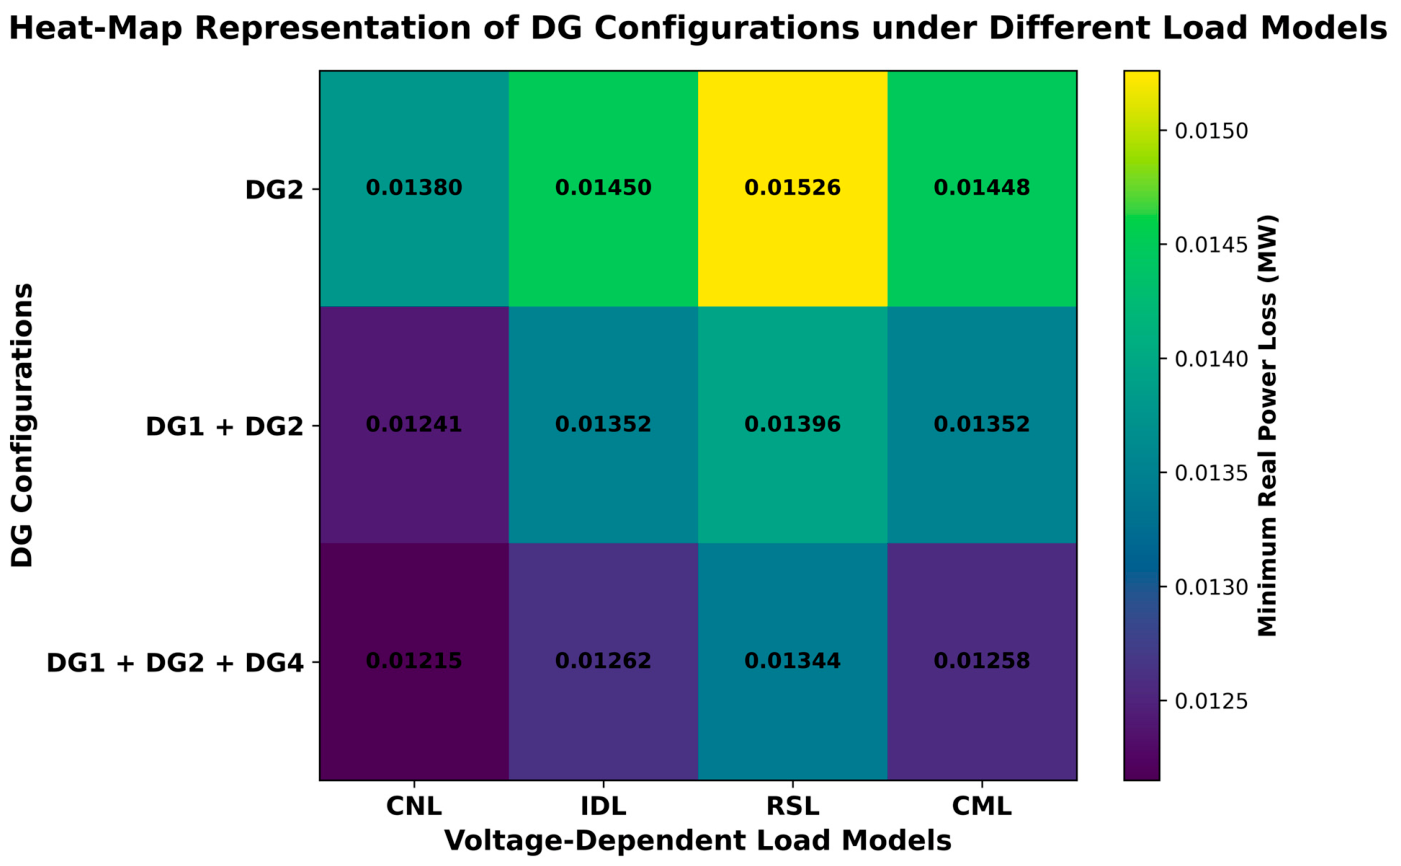
To further illustrate the influence of load models on DG planning performance, a heat-map representation is presented in Figure 4.
Figure 4.
Heat-map representation of DG configurations under different voltage-dependent load models based on minimum real power loss.
Figure 4 provides a comparative visualization of the minimum real power loss obtained for different DG configurations under various voltage-dependent load models. It can be observed that the coordinated integration of DG1, DG2, and DG4 generally produces comparatively lower loss values than the single- and double-DG cases for most loading conditions. The results further indicate that coordinated multi-DG planning improves the effectiveness of loss minimization in real power under different operating conditions within the radial distribution system.
Overall, the analysis of all investigated cases indicates that the coordinated integration of multiple DG units provides better performance than individual DG operation under different EV penetration conditions and voltage-dependent load models. The obtained results indicate that real power loss gradually decreases as the DG planning changes from single-DG integration to coordinated double- and triple-DG configurations. Among the investigated DG combinations, the DG1–DG2–DG4 arrangement under EREV penetration consistently provides the best overall performance in terms of minimum real power loss. The comparative analysis further validates the proper coordination of the DG type, EV category, and load characteristics that play an important role in improving the operating performance of the radial distribution system.
5.2. Voltage Profile Improvement
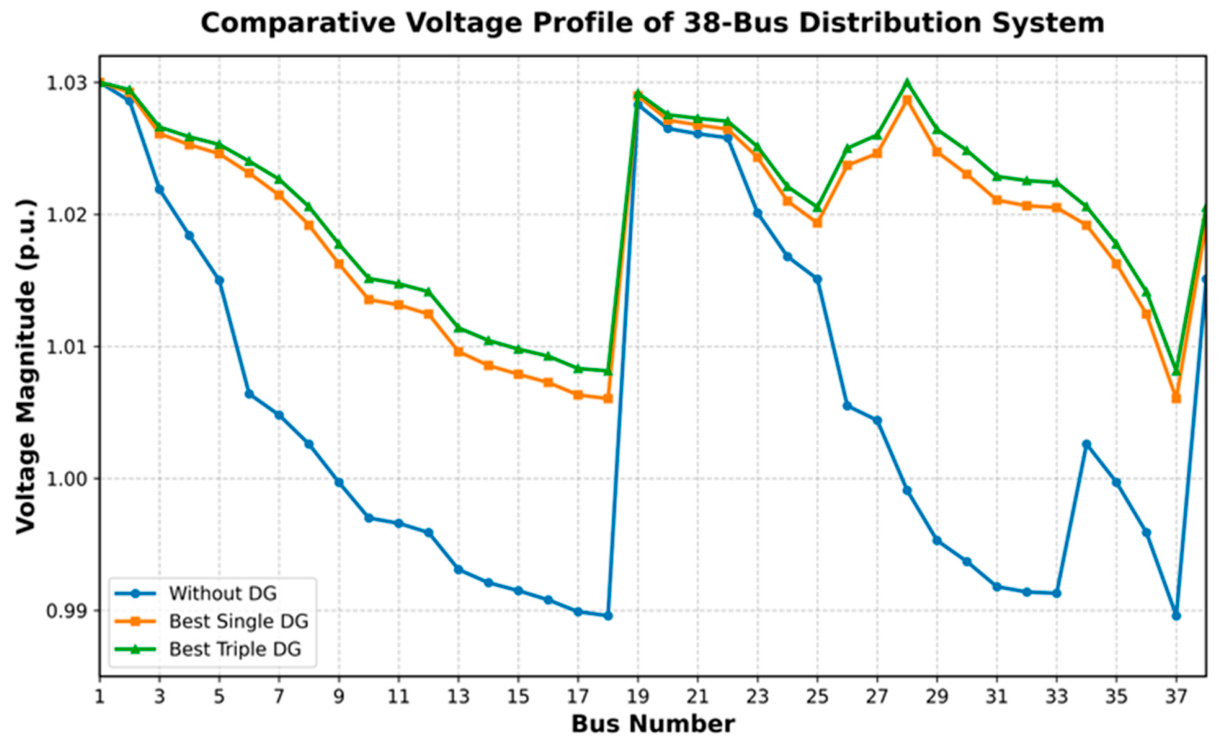
Apart from any reduction in real power loss, the effect of DG and EV integration on the voltage profile of the radial distribution system is also examined. For this purpose, voltage magnitudes obtained for the base system without DGs are compared with the results corresponding to the best single-DG case and the best triple-DG configuration. This comparison helps observe the improvement in voltage regulation achieved through coordinated DG planning under different operating conditions.
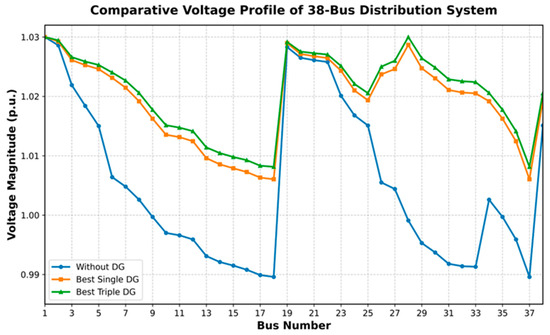
The voltage profile shown in Figure 5 indicates a noticeable improvement in bus voltages after integrating DG units within the distribution network. Compared with the base operating condition, both single- and triple-DG configurations improve the voltage magnitude at different buses, while the triple-DG case provides comparatively better voltage support. The improvement becomes more visible at buses located away from the substation, where the voltage drop is generally higher. These observations indicate that coordinated DG–EV integration contributes not only to a reduction in real power loss but also to an improvement in the overall voltage regulation performance.
Figure 5.
Comparative voltage profile of the distribution system for the base case, best single-DG configuration, and best triple-DG configuration.
For visual clarity, the voltage profile figure presents the base case, best single-DG case, and optimal triple-DG configuration, whereas the corresponding best double-DG voltage magnitudes are numerically summarized in Table 23.
Table 23.
Voltage profile comparison at selected buses for base, best single-DG, best double-DG and best triple-DG configurations.
Table 23 shows the voltage magnitude (p.u.) obtained at selected buses in the 38-bus radial distribution system under different operating conditions. The placement of DG units in the network improves the voltage magnitude at different buses. The improvement is more noticeable at buses 29, 30, and 32, where the base-case voltage values are comparatively lower. Among the considered cases, the triple-DG arrangement provides comparatively better voltage support than the single-DG configuration.
5.3. Physical Interpretation of Optimal DG Locations
The optimization results obtained for different DG–EV combinations indicate that some buses appear repeatedly as suitable locations for DG placement under different operating conditions. In particular, buses 6, 29, and 30 are frequently selected by the proposed GA–MCS framework for minimizing the real power loss and improving the voltage performance in the radial distribution system.
Bus 6 is electrically connected to several downstream sections of the feeder and therefore supports several load points effectively at the same time. Buses 29 and 30 are located near areas with relatively heavier loads and longer feeder branches, which experience higher voltage drops and branch currents. The placement of DG units at these buses helps with the reduction in feeder current, improvement of local voltage magnitude, and minimization of real power loss in the radial distribution network.
The obtained observations indicate that suitable DG placement depends not only on DG capacity and EV penetration level but also on the feeder structure, load concentration, and electrical distance from the substation.
5.4. Limitations and Future Scope
This paper is focused on coordinated DG–EV planning in a 38-bus radial distribution system under stochastic operating conditions using different voltage-dependent load models. Although the proposed GA–MCS framework provides an effective reduction in real power loss and improved voltage performance, certain practical aspects have not been included in this paper. The analysis is carried out using aggregated EV demand representation, while detailed time-varying EV charging behavior, state-of-charge characteristics, and vehicle-to-grid scheduling are not explicitly considered. In addition, economic cost analysis and investigation on larger benchmark distribution systems have not been included in this paper. These aspects may be considered in future studies to further improve the practical applicability of the proposed optimization framework.
6. Conclusions
This paper presented a hybrid GA–MCS optimization framework for the coordinated integration of distributed generation units and electric vehicles in a 38-bus radial distribution system under stochastic operating conditions. The proposed framework was applied to investigate single-, double-, and triple-DG configurations with different EV categories under various voltage-dependent load models. The obtained results indicate that coordinated DG–EV planning improves system performance in terms of active power loss minimization and voltage profile enhancement.
Among the investigated single-DG cases, DG2 provided the best overall performance because of its capability to support both active and reactive power requirements. In the coordinated multi-DG cases, the integration of DG1 and DG2 reduced real power loss by approximately 6.50–10.07% compared with the best-performing single-DG configuration. The minimum real power loss was obtained for the DG1–DG2–DG4 configuration under EREV penetration conditions, which provided an additional reduction of approximately 11.89–11.96% compared with the best-performing single-DG case. The voltage profile analysis also showed a noticeable improvement in voltage magnitude for buses located farther from the substation.
The convergence analysis further showed that the proposed GA–MCS framework achieved lower real power loss with improved convergence characteristics compared with conventional GA and PSO approaches under stochastic operating conditions. In addition, the statistical analysis under Monte Carlo scenarios indicated consistent optimization performance under different loading conditions.
Although the proposed framework provides effective coordinated DG–EV planning under voltage-dependent load conditions, this paper is limited to aggregated EV representation and a 38-bus radial distribution system. A detailed investigation of time-varying EV charging characteristics, vehicle-to-grid (V2G) operation, economic assessment, protection coordination, communication requirements, and analysis on larger benchmark systems may be considered in future studies. In practical distribution system planning, the number of integrated DG units should be determined by considering both technical performance improvement and economic feasibility.
Author Contributions
Conceptualization, M.S. and B.S.; methodology, M.S.; software, M.S.; validation, M.S., B.S. and S.N.S.; formal analysis, M.S.; investigation, M.S.; resources, M.S.; data curation, M.S.; writing—original draft preparation, M.S.; writing—review and editing, M.S.; visualization, M.S.; supervision, B.S. and S.N.S.; project administration, B.S.; funding acquisition, M.S. All authors have read and agreed to the published version of the manuscript.
Funding
This research received no external funding.
Data Availability Statement
The data presented in this study are available on request from the corresponding author.
Conflicts of Interest
The authors declare no conflicts of interest.
Abbreviations
The following abbreviations are used in this manuscript:
| DG | Distributed Generation |
| EV | Electric Vehicle |
| BEV | Battery Electric Vehicle |
| PHEV | Plug-in Hybrid Electric Vehicle |
| EREV | Extended-Range Electric Vehicle |
| FCEV | Fuel Cell Electric Vehicle |
| GA | Genetic Algorithm |
| MCS | Monte Carlo Simulation |
| SLM | Static Load Model |
| CNL | Constant Load Model |
| IDL | Industrial Load Model |
| RSL | Residential Load Model |
| CML | Commercial Load Model |
| PF | Power Factor |
| RPL | Real Power Loss |
Nomenclature
| Symbol | Description |
| PS | Active power generated at the substation |
| QS | Reactive power generated at the substation |
| SS | Total MVA intake capacity of the main substation |
| SS,DG1 | Total MVA intake with DG1 integration |
| SS,DG2 | Total MVA intake with DG2 integration |
| SS,DG3 | Total MVA intake with DG3 integration |
| SS,DG4 | Total MVA intake with DG4 integration |
| SS,DG1,EV | Total MVA intake with DG1 and EVs |
| SS,DG2,EV | Total MVA intake with DG2 and EVs |
| SS,DG3,EV | Total MVA intake with DG3 and EVs |
| SS,DG4,EV | Total MVA intake with DG4 and EVs |
| SS,DG1,DG2,EV | Total MVA intake with DG1, DG2, and EVs |
| SS,DG1,DG2,DG3,EV | Total MVA intake with DG1, DG2, DG3, and EVs |
| PDG1 | Active power supplied by DG1 |
| PDG2 | Active power supplied by DG2 |
| PDG4 | Active power supplied by DG4 |
| QDG2 | Reactive power supplied by DG2 |
| QDG3 | Reactive power supplied by DG3 |
| QDG4 | Reactive power supplied or absorbed by DG4 |
| PEVS | Active power associated with EVs |
| QEVS | Reactive power associated with EVs |
| PLoss,ij | Real power loss between bus i and bus j |
| Pij | Active power flow between bus i and bus j |
| Qij | Reactive power flow between bus i and bus j |
| Vi | Voltage magnitude at bus i |
| rij | Resistance between bus i and bus j |
| Pi | Voltage-dependent active power load |
| Qi | Voltage-dependent reactive power load |
| P0 | Nominal active power load |
| Q0 | Nominal reactive power load |
| x | Exponent of active power in voltage-dependent load model |
| y | Exponent of reactive power in voltage-dependent load model |
| N | Set of buses in the distribution system |
| f | Fitness function |
| E[PLoss] | Expected real power loss |
| Vmin | Minimum bus voltage limit |
| Vmax | Maximum bus voltage limit |
| PDG,i | Active power supplied by the ith DG |
| PDG,imin | Minimum DG active power limit |
| PDG,imax | Maximum DG active power limit |
| QDG,i | Reactive power supplied by the ith DG |
| PD | Active power demand |
| QD | Reactive power demand |
| NDG | Total number of DG units integrated |
| PLoss | Total real power loss of the distribution system |
| QLoss | Total reactive power loss of the distribution system |
References
- Tang, H.; Wu, J.; Wu, F.; Chen, L.; Liu, Z.; Yan, H. An optimization framework for collaborative control of power loss and voltage in distribution systems with DGs and EVs using stochastic fuzzy chance constrained programming. IEEE Access 2020, 8, 49013–49027. [Google Scholar] [CrossRef] [Scilit]
- Yaghoubi-Nia, M.R.; Hashemi-Dezaki, H.; Halvaei Niasar, A. Optimized allocation of microgrids’ distributed generations and electric vehicle charging stations considering system uncertainties by clustering algorithms. IET Renew. Power Gener. 2024, 18, 1798–1818. [Google Scholar] [CrossRef] [Scilit]
- Lotfi, H. Stochastic bi-level modelling and optimization of dynamic distribution networks with DG and EV integration. Energy Inform. 2025, 8, 98. [Google Scholar] [CrossRef] [Scilit]
- Bilal, M.; Rizwan, M.; Alsaidan, I.; Almasoudi, F.M. AI-based approach for optimal placement of EVCS and DG with reliability analysis. IEEE Access 2021, 9, 154204–154224. [Google Scholar] [CrossRef] [Scilit]
- Mohan, B.; Sudhakaran, M.; Srikiruthika, S. Hybrid moth flame optimization-based multi-objective optimal allocation of electric vehicle charging stations and distributed generation in radial and non-radial distribution systems. Iran. J. Sci. Technol. Trans. Electr. Eng. 2025, 49, 1351–1377. [Google Scholar] [CrossRef] [Scilit]
- Vimlesh; Mukherjee, V.; Singh, B. Hybrid GA–MCS-based optimization for integration of DG, DVR, and DSTATCOM planning in distribution networks. Int. Trans. Electr. Energy Syst. 2021, 31, e13223. [Google Scholar] [CrossRef] [Scilit]
- Ramesh; Khursheed, M.; Singh, B. A review on integration of DGs and EVs planning in distribution networks with hybrid MC–GA approach. Proc. Natl. Acad. Sci. USA 2025, 95, 369–387. [Google Scholar] [CrossRef] [Scilit]
- Ramesh; Khursheed, M.; Singh, B. Optimal integration for DGs with EVs planning in distribution networks with hybrid MC–GA technique using realistic load models. J. Electr. Syst. 2024, 20, 339. [Google Scholar] [CrossRef] [Scilit]
- Yang, Z.; Yang, F.; Min, H.; Tian, H.; Hu, W.; Liu, J. Review on optimal planning of power systems with DGs and EVs. Energy Rep. 2023, 9, 501–509. [Google Scholar] [CrossRef] [Scilit]
- Yuvaraj, T.; Suresh, T.D.; Meyyappan, U.; Aljafari, B.; Thanikanti, S.B. Optimizing the allocation of renewable DGs, DSTATCOM, and BESS to mitigate the impact of electric vehicle charging stations on radial distribution systems. Heliyon 2023, 9, e23017. [Google Scholar] [CrossRef] [Scilit] [PubMed]
- Habib, H.U.R.; Waqar, A.; Farhan, B.S.; Ahmad, T.; Jahangiri, M.; Ismail, M.M.; Ahmad, P.; Abbas, A.; Kim, Y.-S. Analysis of optimal integration of EVs and DGs into CIGRE’s MV benchmark model. IEEE Access 2022, 10, 95949–95969. [Google Scholar] [CrossRef] [Scilit]
- Huang, Z.; Fang, B.; Deng, J. Multi-objective optimization strategy for distribution network considering V2G-enabled electric vehicles. Prot. Control Mod. Power Syst. 2020, 5, 7. [Google Scholar]
- Oladigbolu, J.O.; Bilal, M.; Gupta, S.; Mujeeb, A.; Li, L. Optimal deployment of plug-in electric vehicles with integrated renewable energy sources. Electr. Eng. 2025, 107, 3847–3881. [Google Scholar] [CrossRef] [Scilit]
- Ahmad, F.; Ashraf, I.; Iqbal, A.; Marzband, M.; Khan, I. AI-based deployment of EV fast charging stations with solar DGs. Energy Rep. 2022, 8, 11646–11660. [Google Scholar] [CrossRef] [Scilit]
- Injeti, S.K.; Thunuguntla, V.K. Optimal integration of DGs into radial distribution network in the presence of plug-in electric vehicles. Prot. Control Mod. Power Syst. 2020, 5, 3. [Google Scholar] [CrossRef] [Scilit]
- Çeçen, M. Optimal integration of EV charging stations into renewable-supported systems. Electr. Power Syst. Res. 2025, 247, 111832. [Google Scholar] [CrossRef] [Scilit]
- Soliman, I.A.; Tulsky, V.; Abd El-Ghany, H.A.; ElGebaly, A.E. Holistic optimization of EV charging stations with V2G and DG integration. Appl. Energy 2025, 385, 125504. [Google Scholar] [CrossRef] [Scilit]
- Shaheen, A.M.; Ellien, A.R.; El-Ela, A.A.; Ali, E.S. Optimal integration of EV charging infrastructure in distribution systems. Energy 2025, 318, 134567. [Google Scholar] [CrossRef] [Scilit]
- Ghofrani, M. Integration of EVs and renewable DGs in microgrids. Sustainability 2024, 16, 3939. [Google Scholar] [CrossRef] [Scilit]
- Güven, A.F.; Yücel, E. Sustainable energy integration in microgrids with EV charging. Electr. Eng. 2024, 107, 1541–1573. [Google Scholar] [CrossRef] [Scilit]
- Srihari, G.; Krishnam Naidu, R.S.R.; Falkowski-Gilski, P.; Divakarachari, P.B.; Penmatsa, R.K.V. EV integration in smart grids using metaheuristic energy management. Front. Energy Res. 2024, 12, 1357863. [Google Scholar] [CrossRef] [Scilit]
- Muthusamy, T.; Meyyappan, U.; Thanikanti, S.B.; Khishe, M. Optimizing EV charging station integration using honey badger algorithm. Sci. Rep. 2024, 14, 27341. [Google Scholar] [CrossRef] [Scilit] [PubMed]
- Kumar, B.A.; Jyothi, B.; Singh, A.R.; Bajaj, M.; Rathore, R.S.; Tuka, M.B. Hybrid genetic algorithm–simulated annealing-based electric vehicle charging station placement for optimizing distribution network resilience. Sci. Rep. 2024, 14, 7637. [Google Scholar] [CrossRef] [Scilit] [PubMed]
- Srilakshmi, K.; Santosh, D.T.; Ramadevi, A.; Balachandran, P.K.; Reddy, G.P.; Palanivelu, A.; Colak, I.; Dhanamjayulu, C.; Chinthaginjala, R.K.; Khan, B. Development of renewable energy-fed three-level hybrid active filter for EV charging station load using Jaya–grey wolf optimization. Sci. Rep. 2024, 14, 4429. [Google Scholar] [CrossRef] [Scilit] [PubMed]
- Hematian, H.; Askari, M.T.; Ahmadi, M.A.; Sameemoqadam, M.; Nik, M.B. Robust optimization for microgrid management with compensator, EV, storage, demand response, and renewable integration. IEEE Access 2024, 12, 73413–73425. [Google Scholar] [CrossRef] [Scilit]
- Ghofrani, M.; Hersi, N. Multi-objective stochastic optimization for EV and DG integration. In Proceedings of the IEEE Texas Power and Energy Conference (TPEC); IEEE: New York, NY, USA, 2024; pp. 1–6. [Google Scholar] [CrossRef] [Scilit]
- Jin, L.; Zhong, S.; Su, B.; Zhou, D.; Wang, Q.; Yu, X. EV-integrated hybrid renewable energy system optimization. Energy 2025, 330, 136858. [Google Scholar] [CrossRef] [Scilit]
- Rajesh, P.; Shajin, F.H.; Mouli Chandra, B.; Kommula, B.N. Diminishing energy consumption cost and optimal energy management of photovoltaic-aided electric vehicles using the GFO–VITG approach. Energy Sources Part A Recovery Util. Environ. Eff. 2025, 47, 11823–11841. [Google Scholar] [CrossRef] [Scilit]
- Chakraborty, R.; Dawn, S.; Das, P.; Das, D.; Gope, S.; Islam, M.M.; Ustun, T.S. Placement of PV-integrated EV charging stations. Energy Explor. Exploit. 2025, 43, 2015–2040. [Google Scholar] [CrossRef] [Scilit]
- Saw, B.K.; Bohre, A.K. Sustainable deployment of EV charging stations in distribution networks supported with hybrid solar–DG integrated DSTATCOM. IEEE Trans. Ind. Appl. 2025, 61, 7750–7765. [Google Scholar] [CrossRef] [Scilit]
- Yuvaraj, T.; Krishnamoorthy, R.; Arun, S.; Bajaj, M.; Blazek, V.; Prokop, L. Smart energy strategies for dynamic EV charging and renewable integration in distribution systems: A multi-objective optimization framework. Energy Strategy Rev. 2026, 63, 102051. [Google Scholar] [CrossRef] [Scilit]
- Alizadeh, M.; Amani, A.M.; Meegahapola, L.; Jalili, M.; Hill, O. Optimal integration of EV charging stations in distribution networks. IEEE Trans. Ind. Inform. 2025, 21, 7120–7130. [Google Scholar] [CrossRef] [Scilit]
- Price, W.W.; Casper, S.G.; Nwankpa, C.O.; Bradish, R.W.; Chiang, H.-D.; Concordia, C.; Staron, J.V.; Taylor, C.W.; Vaahedi, E.; Wu, G. Bibliography on load models for power flow and dynamic performance simulation. IEEE Power Eng. Rev. 1995, 15, 70. [Google Scholar]

Disclaimer/Publisher’s Note: The statements, opinions and data contained in all publications are solely those of the individual author(s) and contributor(s) and not of MDPI and/or the editor(s). MDPI and/or the editor(s) disclaim responsibility for any injury to people or property resulting from any ideas, methods, instructions or products referred to in the content. |
© 2026 by the authors. Licensee MDPI, Basel, Switzerland. This article is an open access article distributed under the terms and conditions of the Creative Commons Attribution (CC BY) license.