


Abstract
Accurate identification of early-stage insulation aging in 10 kV cross-linked polyethylene (XLPE) cables is required for reliable operation of urban power distribution networks. In this study, the frequency- and temperature-dependent vector impedance under operating-voltage-relevant electrical stress was investigated for insulation aging assessment. Cable specimens were thermally aged at 135 °C for 0, 7, 14, 21, and 28 days. Fundamental capacitance and polarization–depolarization currents were measured at different temperatures to characterize the aging response. An operating-voltage-relevant broadband impedance circuit was then constructed, and synchronized voltage and current waveforms were acquired under 6 kV excitation from 100 Hz to 0.1 Hz at different temperatures. The fundamental capacitance and the fitted current constant bn decreased with aging time, indicating that the insulation remained in the early stage of aging. The phase difference and impedance magnitude extracted from the measurements exhibited variation trends consistent with the low-field capacitance and DC current indices. The discrimination among samples with different aging times was enhanced at 0.1 Hz. These results indicated that operating-voltage-relevant broadband impedance measurement provided a rapid sample-level method for evaluating early-stage insulation aging of 10 kV-class XLPE cable samples under operating-voltage-relevant conditions.
1. Introduction
With the advancement of urbanization and electrification, the installed base of low- and medium-voltage distribution cables has continued to expand [1]. Owing to its excellent electrical insulation and mechanical properties, cross-linked polyethylene (XLPE) is widely used as cable insulation. However, during long-term service, cables were often operated in overload conditions, where the conductor temperature exceeded the rated limit of 90 °C. Therefore, thermal aging of the insulation material was accelerated under such conditions [2]. The previous studies have indicated that long-term aging affected the charge migration ability of XLPE materials [3]. At the same time, changes in impedance and reactance resulted in irreversible degradation of the electrical performance [4]. Therefore, reliable assessment of the aging condition of XLPE cables remains crucial for the safe operation of distribution networks.
Polarization and depolarization current measurements were employed to evaluate the insulation aging condition of cables. In this method, a DC voltage was applied to the conductor and was then removed through a relay. The temporal variation in the current during voltage application and removal was used to characterize the polarization, depolarization, and conduction behaviors within the cable insulation [5].
Furthermore, the insulation aging condition of 10 kV XLPE cables is usually evaluated through changes in impedance and dielectric parameters [6]. Non-destructive tests, such as leakage current measurement, insulation resistance measurement, and dielectric spectrum analysis, are widely used [7]. Since the resistive and dielectric responses were interrelated during the aging process, multiple tests were usually combined, and the assessment sensitivity was improved by varying test conditions such as temperature, voltage amplitude, and frequency [8]. However, at the early stage of thermal aging, only limited changes were induced in the molecular structure and crystallinity, and only slight variations were therefore observed in the corresponding electrical parameters [9]. These results suggested that traditional low-voltage methods might provide insufficient sensitivity. By contrast, high-voltage low-frequency vector impedance measurement and partial discharge testing were performed under conditions closer to actual operating conditions, and higher sensitivity was reported [10]. Broadband impedance measurement also showed potential, but low-voltage excitation was adopted in most previous studies, so the electrical stress applied to the insulation was much lower than that under the operating phase voltage of distribution network cables, approximately 6 kV. Since the dielectric response of cross-linked polyethylene was strongly dependent on voltage amplitude and frequency, broadband measurements under operating-voltage-relevant excitation were expected to provide more informative indicators for insulation assessment [11].
Recent studies have demonstrated that early-stage aging of XLPE insulation can be evaluated using frequency-domain dielectric spectroscopy, polarization–depolarization current analysis, partial-discharge-related features, and data-driven diagnostic indicators. These approaches have advanced the interpretation of dielectric relaxation, charge transport, and incipient defect evolution in cable insulation systems [12,13]. Nevertheless, many diagnostic measurements are still conducted under low-voltage excitation or show higher effectiveness only after appreciable insulation degradation has occurred [14]. In the early stage of thermal aging, changes in capacitance, relaxation current, and impedance-related parameters are often weak, making it difficult to distinguish aging states under conventional test conditions [15]. Low-frequency impedance measurements conducted at voltage amplitudes closer to practical electrical stress may therefore provide additional aging-sensitive information for medium-voltage XLPE cable samples [16].
Accordingly, the polarization–depolarization current characteristics and operating-voltage-relevant broadband impedance characteristics of 10 kV XLPE cables were investigated at different temperatures. Because the assessment of cable insulation aging in distribution networks required indicators that were more representative of service electrical stress, measurements performed under operating-voltage-relevant low-frequency excitation were expected to provide greater practical value than conventional low-voltage dielectric tests.
2. Materials and Methods
2.1. Accelerated Thermal Aging and Pretreatment of Cables
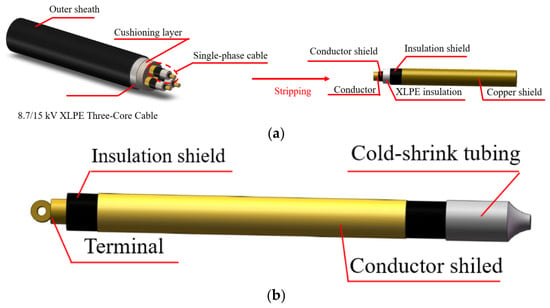
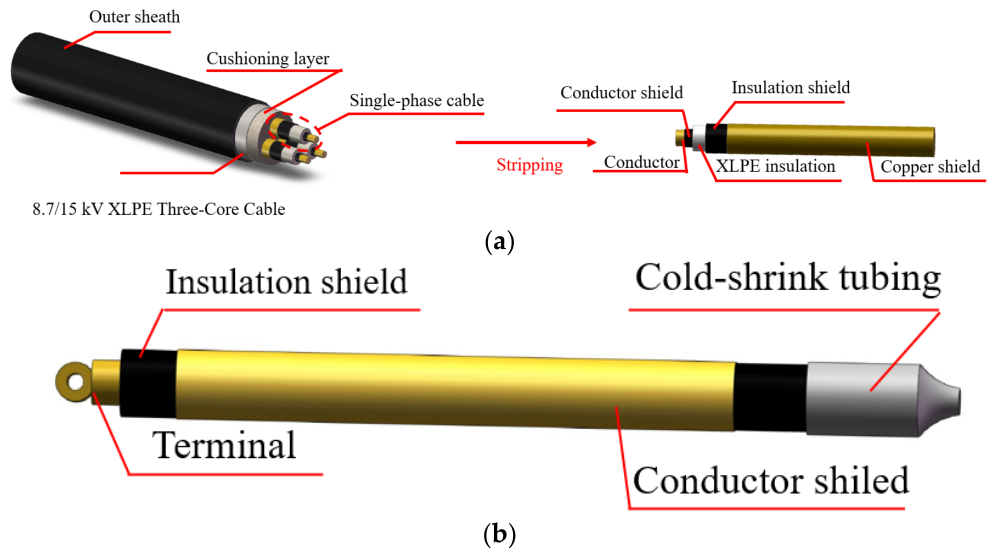
A three-core XLPE cable rated at 8.7/15 kV and commonly used in 10 kV distribution systems was selected as the test object. The conductor cross-sectional area was 300 mm2. In the following sections, this cable is referred to as a 10 kV-class XLPE cable sample for consistency with its distribution-network application. As shown in Figure 1a, the cable cores corresponding to the three phases had identical physical structures and material compositions. Therefore, one phase core of the 10 kV XLPE cable, with a conductor cross-sectional area of 300 mm2, was selected as the representative research object for all thermal-aging tests and electrical measurements. Before thermal aging, the 2 m three-core cable was stripped and cut into six 1 m single-phase cable samples. The copper shield was retained and used for vector-impedance measurement. The principal geometric parameters of each layer are listed in Table 1. According to GB/T 31838.4-2019, the six single-phase cable samples were subjected to accelerated thermal aging at 135 °C in a heat oven (DKM813C, Yamato Scientific Co., Ltd., Tokyo, Japan), and measurements were conducted every 7 days over a total aging time of 28 days [17]. After thermal aging, approximately 10 cm of insulation was removed from one end of each cable sample to expose the conductor, and a copper terminal was installed for electrical connection. At the other end, the insulation shield was stripped over approximately 5 cm, and a cold-shrink tube was installed to suppress discharge between the conductor and the copper shield under operating-voltage-relevant excitation, as shown in Figure 1b.
Figure 1.
Schematic diagram of sample: (a) single-phase cable stripping; (b) cable sample structure.
Table 1.
Table of key physical parameters of cables.
2.2. Polarization and Depolarization Current Measurements
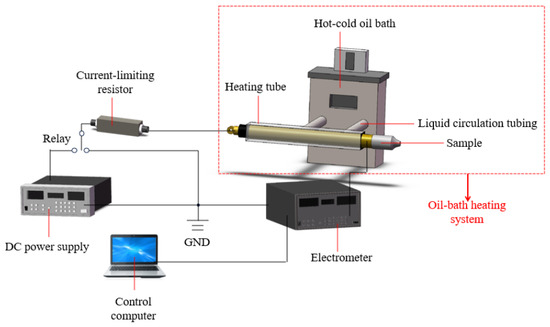
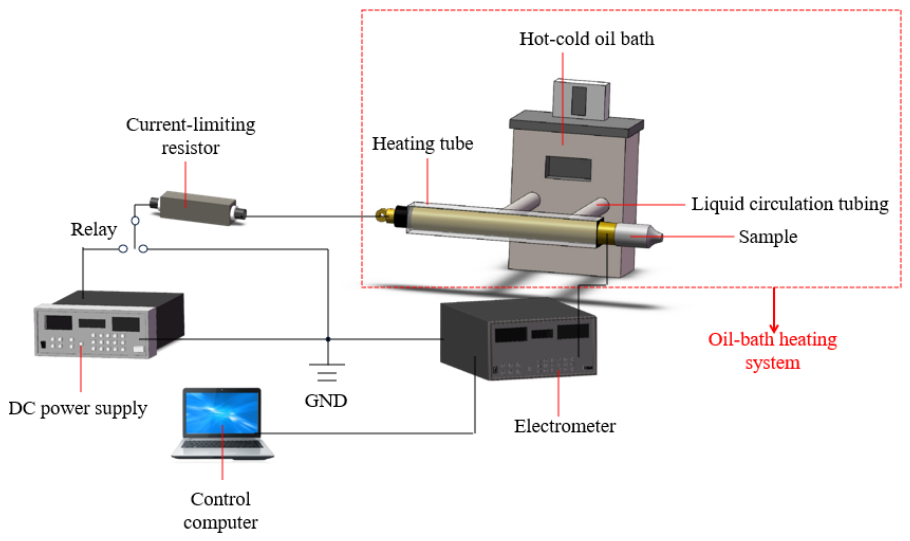
Polarization and depolarization current measurements were performed to characterize the polarization relaxation responses of the insulation. The measured current was further used to characterize the dielectric relaxation characteristics of the insulation, as well as the charge-transport and charge-accumulation behavior of the multilayer cable structure. The measurement circuit is shown in Figure 2. It consisted of a high-voltage dc power supply (2290-10, Keithley Instruments, Solon, OH, USA), an electrometer (6517B, Keithley Instruments, Solon, OH, USA), a hot-bath system (CORIO, Julabo GmbH, Seelbach, Germany), a 1 MΩ current-limiting resistor and a control computer equipped with KickStart software (version 2.11.5, Tektronix, Inc., Beaverton, OR, USA) for data acquisition. Before the polarization and depolarization current measurements, the cable under test was placed in the oil-bath heating tube. The oil-bath system was heated to the preset temperature and maintained for 30 min to ensure that the cable could be heated to the preset temperature. A DC voltage was then applied to the conductor, and the current was recorded as the polarization current, Ip(t) [13]. Then, the high voltage was turned off, and the current was recorded as the depolarization current, Id(t).
Figure 2.
The polarization and depolarization current measurement circuit.
2.3. Operating-Voltage-Relevant Broadband Impedance Measurement Circuit
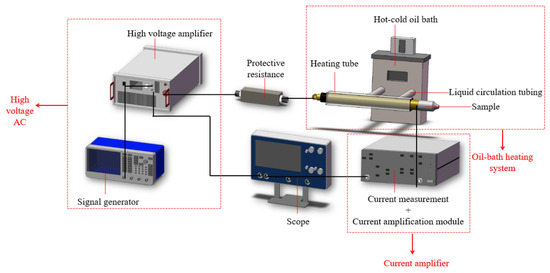
The operating-voltage-relevant broadband impedance measurement circuit is illustrated in Figure 3. The broadband operating-voltage-relevant excitation was generated by a signal generator (AFG31000, Tektronix, Inc., Beaverton, OR, USA) and a high-voltage amplifier (ATA-7050, Xi’an Aigtek Electronic Technology Co., Ltd., Xi’an, China). The current flowing between the conductor and the copper shield was acquired and amplified by a low-noise current amplifier (SR570, Stanford Research Systems, Sunnyvale, CA, USA), which enabled accurate measurement and low-pass filtering of pA-level ac current signals. Meanwhile, the voltage and current signals were captured synchronously by an oscilloscope (2 Series, Tektronix, Inc., Beaverton, OR, USA). The impedance magnitude and phase difference were extracted from the synchronized voltage-current waveforms at the same frequency. The cable temperature was controlled by the same oil-bath system used for the polarization and depolarization current measurements. Finally, a protective resistor, Rp, with a resistance value of 1 MΩ was connected in series between the high-voltage source and the cable sample.
Figure 3.
Diagram of operating-voltage-relevant broadband impedance measurement.
2.4. Test Protocols and Parameter Settings
2.4.1. Fundamental Capacitance Measurement
The target test temperatures were set to 30 °C, 90 °C, and 125 °C, and the oil-bath heating system was used for temperature control. Before measurement, the aged cable was placed in the heating tube for 30 min to ensure that the sample had reached the preset temperature. The fundamental capacitance of the cable was measured using a digital multimeter (DMM6500, Keithley Instruments, Solon, OH, USA). The test voltage was set to 100 mV, and the frequency was 50 Hz. After continuous measurement for 1 min, the capacitance value was recorded. For each sample, three repeated measurements were conducted at the same temperature, and the average value was taken as the final result.
2.4.2. Polarization and Depolarization Current Measurements
The polarization and depolarization currents of the cables were measured using an electrometer (6517B, Keithley Instruments, Solon, OH, USA) and a DC power supply (2290-10, Keithley Instruments, Solon, OH, USA). The test temperatures were set to 30 °C and 90 °C, the applied DC voltage was set to 1 kV, and a 1 MΩ protective resistor was connected in series in the test circuit. During the test, both the polarization current and the depolarization current were recorded for 3600 s with a data collection interval of 6 s. The complete 3600 s recording was used to ensure that the polarization and depolarization processes were sufficiently captured. Within the 3600 s measurement period, the interval from 100 s to 300 s was considered to correspond to the main relaxation release process of the cross-linked polyethylene insulation material [18]. During this stage, the current decay was more sensitive to the charge transport and relaxation behavior of the insulation. As the measurement time increased further, the current gradually approached a quasi-steady low-current level, and the influence of noise and long-term background conduction became more pronounced. Therefore, the data from 0 s to 200 s were selected for the log I–log t fitting, so that the early-stage current decay characteristics could be retained while the interference from the later low-current region could be reduced. The fitted results were then used for subsequent comparison among cables with different aging times.
2.4.3. Operating-Voltage-Relevant Broadband Impedance Measurement
Operating-voltage-relevant broadband impedance measurement was performed at 30 °C, 90 °C, and 125 °C. During the test, a 6 kV variable-frequency sinusoidal voltage was applied, which was approximately equal to the rated phase voltage of the cable under operating conditions. The test frequencies were set to 100 Hz, 50 Hz, 10 Hz, 1 Hz, and 0.1 Hz. Among these frequencies, 0.1 Hz provides a longer polarization time within each measurement cycle, making slow polarization, interfacial polarization, and charge-transport processes in XLPE insulation more pronounced than those under power-frequency excitation [13]. The voltage and current waveforms were acquired synchronously by the oscilloscope at each frequency for subsequent vector-impedance calculation.
3. Results
3.1. Fundamental Capacitance Measurement Results
The measured fundamental capacitances at the three preset temperatures are listed in Table 2. At a given temperature, the fundamental capacitance decreased with increasing aging time, suggesting that the polarization characteristics gradually weakened as thermal aging progressed. Meanwhile, at the same aging time, the value of fundamental capacitance decreased with increasing temperature. This behavior was associated with thermally activated molecular motion in XLPE at elevated temperatures, which weakened the net polarization response and reduced the effective dielectric constant [5]. As shown in Table 2, at the same temperature, the variation in fundamental capacitance between cables with adjacent aging times remained within 10%. This limited variation was associated with three factors. First, during the early stage of thermal aging, molecular-chain rearrangement occurred in XLPE, which increased the crystallinity and reduced the dielectric constant [19]. Second, at elevated temperature, the temperature-induced reduction in polarization response acted as a common background effect for all samples, so the capacitance differences introduced by slight aging remained limited [20]. Third, the limited change in fundamental capacitance of the aged cable suggested that only slight changes occurred in the polarization characteristics of both the bulk insulation and the interfaces, indicating that thermal aging at this temperature remained in the early stage of cable aging.
Table 2.
Fundamental capacitance of cables at different temperatures.
3.2. Polarization and Depolarization Current Measurements
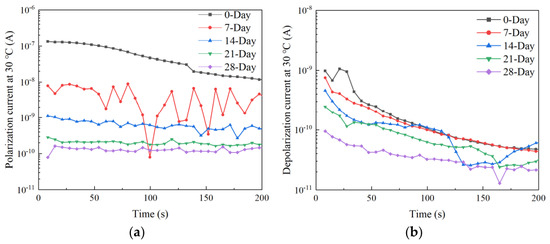
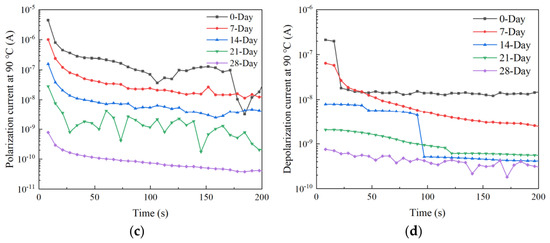
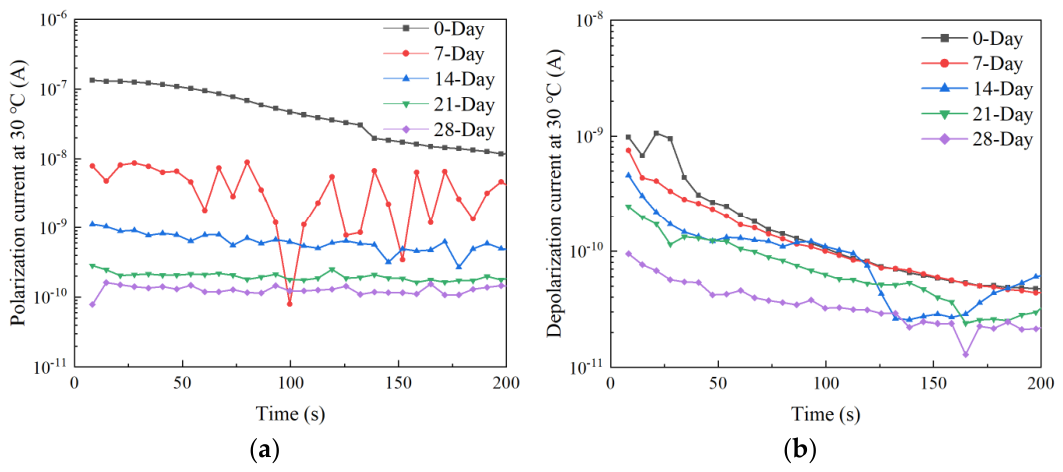
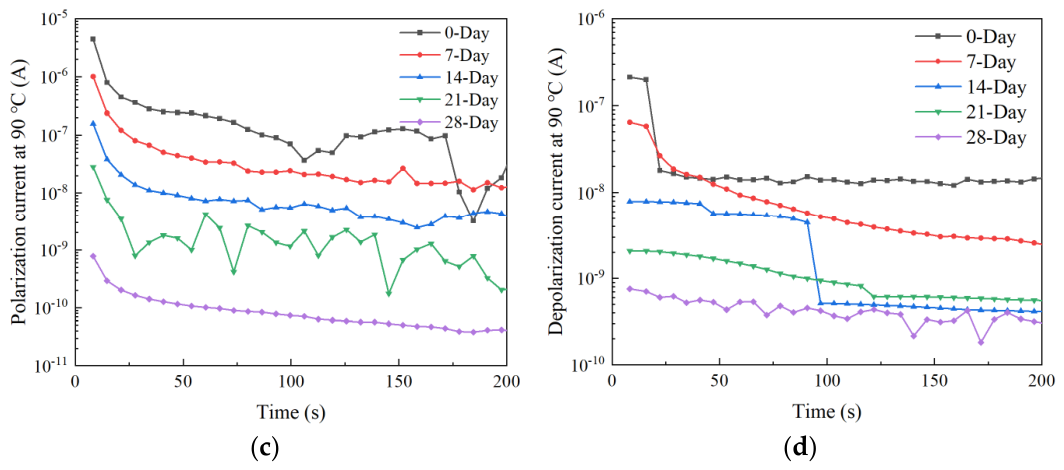
Since the depolarization current represented charge release within the cable insulation and the measured current was negative during this stage, the absolute value of the depolarization current was used in subsequent data analysis [21]. Figure 4 shows the polarization current Ip(t) and depolarization current Id(t) of the cables measured at 30 °C and 90 °C. As shown in Figure 4a,c, Ip(t) decreased with increasing test time at different temperatures. These results suggested that, as the DC voltage was continuously applied to the cable, the polarization process was progressively established, leading to a gradual decrease in current [16]. As shown in Figure 4b,d, the magnitude of Id(t) decreased gradually with time, indicating that the polarization charge accumulated during voltage application was progressively released after the external voltage was removed [22].
Figure 4.
Polarization and depolarization currents of cables aged for different times at 30 °C and 90 °C: (a) polarization current diagram at 30 °C; (b) depolarization current diagram at 30 °C; (c) polarization current diagram at 90 °C; (d) depolarization current diagram at 90 °C.
To investigate the effects of aging time and temperature on the polarization relaxation and charge-transport behavior of the cables, the polarization and depolarization current data within 0–200 s were analyzed. For solid dielectrics, the polarization and depolarization currents were reported to follow a power-law dependence on time [22], which is expressed as:
where I was the polarization or depolarization current (A), t was the time after the application or removal of the external voltage (s), A was a temperature-related factor, and bn was the current decay exponent obtained from the polarization or depolarization current. The parameter bn was determined from the slope of the log I–log t curve, and it was used to reflect the dominant relaxation release process and charge-transport response of the cable insulation. The polarization and depolarization current exponents, denoted as b1 and b2, at different aging times and temperatures are listed in Table 3. At each test temperature, b1 and b2 decreased monotonically with increasing aging time. This result suggested that the current decay within the dominant relaxation release stage became slower and that the charge-transport and relaxation responses of the insulation were progressively altered by thermal aging [23]. At the same aging time, b1 and b2 increased with temperature, indicating that elevated temperature accelerated charge transport and relaxation in the insulation [24]. Together with the results in Table 2 and Table 3, these data suggested that the insulation response at the early stage of thermal aging was affected by aging time and temperature.
Table 3.
Polarization and depolarization current exponents of cables at 30 °C and 90 °C.
Based on the results of the fundamental capacitance and polarization and depolarization current measurements, the cable samples investigated in this study were regarded as being in the early stage of thermal aging. As shown in Table 2, the fundamental capacitance decreased progressively with aging time at all test temperatures, while the variation remained gradual rather than abrupt. Meanwhile, as listed in Table 3, b1 and b2 decreased monotonically with aging time at each temperature, indicating that the current decay became slower and that the charge-transport and relaxation responses of the insulation were progressively altered by thermal aging. These results suggest that the dielectric response of the insulation had already changed with aging time, although no evidence of severe degradation or abrupt failure behavior was observed under the present aging condition [25,26]. Similar features have also been reported in previous studies on early thermal aging of XLPE, in which molecular-chain rearrangement, interfacial modification, and trap redistribution occurred before severe thermo-oxidative degradation became dominant. Therefore, the investigated samples were considered representative of the early stage of cable-insulation aging and were used for the subsequent broadband impedance analysis.
3.3. Operating-Voltage-Relevant Broadband Impedance Measurement Experiment
3.3.1. Validation of Impedance Measurement Circuit Accuracy
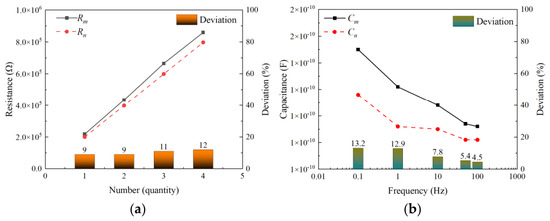
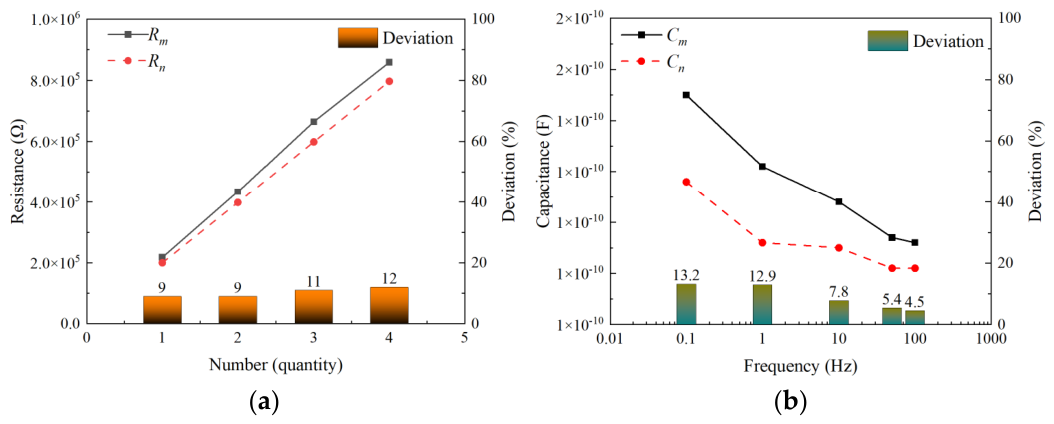
To validate the measurement accuracy of the circuit shown in Figure 3, two basic tests, namely resistance and capacitance tests, were performed at room temperature, and the results are shown in Figure 5. For resistance calibration, four noninductive resistors with a nominal value of 200 kΩ were connected in series. The reference resistance Rn was measured using a digital multimeter (DMM6500, Keithley), and the circuit-derived resistance Rm was calculated from the synchronized voltage-current waveforms measured by the circuit. As shown in Figure 5a, Rm and Rn showed consistent variation trends, and Rm remained slightly higher than Rn, with a deviation of approximately 10%. This difference was mainly associated with the different excitation levels and measurement principles of the two methods, because Rn was obtained under low-voltage measurement by the digital multimeter, whereas Rm was calculated from the high-voltage ac response of the circuit shown in Figure 3. Under high-voltage ac conditions, the effects of distributed capacitance and additional impedance in the test circuit became more pronounced, which caused the calculated Rm to be slightly higher than Rn [27].
Figure 5.
Resistance-capacitance calculation and measurement results and deviations: (a) resistance and deviation; (b) capacitance and deviation.
For capacitance calibration, the resistor string was replaced by a 100 pF high-voltage capacitor, as shown in Figure 5b. The reference capacitance Cn was measured using an LCR meter (IM3533-01, HIOKI E.E. Corporation, Ueda, Nagano, Japan), and the circuit-derived capacitance Cm was calculated under a 1 kV excitation at the same test frequency as that used by the LCR meter. Figure 5 shows that Cm and Cn follow the same frequency-dependent variation trend, and that the deviation between them increases as the frequency decreases, with a maximum deviation of 13.2%. This deviation might have been related to two factors. First, at the same frequency, the effective dielectric constant of the capacitor could vary with the applied voltage because of its nonlinear polarization response under different electric field intensities, which led to different measured capacitance values [11]. Second, as the frequency decreased, the contributions of dipolar polarization and space-charge polarization to the dielectric response of the capacitor became more pronounced [3]. Under the combined effect of operating-voltage-relevant excitation and low frequency, Cm remained higher than Cn, and the deviation increased with decreasing frequency.
The resistance and capacitance calibration results indicated that the circuit shown in Figure 3 could measure resistance and capacitance within the investigated frequency range, and that the maximum deviations remained within 12% and 13.2%, respectively. The above results suggested that the operating-voltage-relevant broadband impedance measurement circuit could characterize the variation trends in the resistance and capacitance of the sample under different test conditions. Therefore, the validation results confirmed that the circuit could track the variation trends of resistance and capacitance within the investigated frequency range. The observed deviations were considered when interpreting the subsequent cable impedance results, especially for small parameter changes between adjacent aging times.
3.3.2. Operating-Voltage-Relevant Broadband Impedance Measurement Results
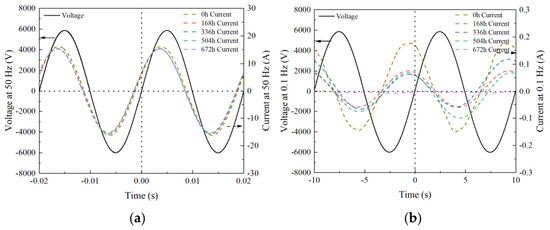
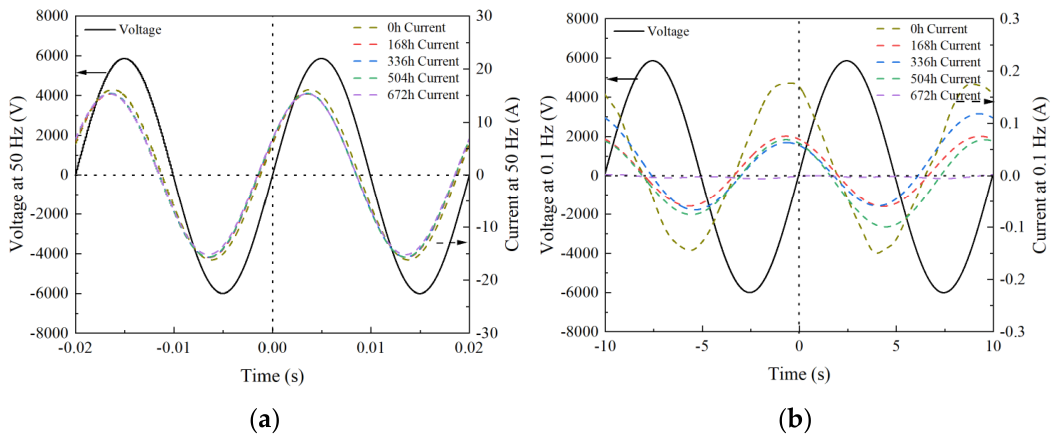
In the operating-voltage-relevant broadband impedance measurement, 3 min were required for each test frequency, and 15 min were required for each cable at a specified temperature. This duration was shorter than that required for the polarization–depolarization current measurement. Figure 6 shows the voltage and current waveforms recorded by the oscilloscope over the same time period at 50 Hz and 0.1 Hz for cables with different aging times. At both frequencies, the current waveforms remained approximately sinusoidal. At 50 Hz, the differences among the current waveforms were limited, and the phase difference and peak current remained close for cables with different aging times. This result was consistent with the small capacitance variation measured at 50 Hz, which corresponded to only a limited difference in the associated voltage-current vectors. By contrast, at 0.1 Hz, clearer separation was observed in both waveform amplitude and phase difference among cables with different aging times, including adjacent aging times. This result indicated that low-frequency excitation improved the discrimination of insulation aging. The enhanced separation at 0.1 Hz was associated with the longer polarization time at low frequency, which allowed dipolar polarization and interfacial polarization to contribute more strongly to the measured response and thus enlarged the differences in the equivalent dielectric behavior among cables with different aging times.
Figure 6.
Voltage and current waveforms of cables at different aging times: (a) current waveform at 50 Hz; (b) current waveform at 0.1 Hz.
From the synchronized voltage-current vectors at each frequency, the phase difference was calculated as [28]:
where θ was the phase difference between the current and voltage within the same period, θi and θu were the phase angles of the current and voltage, respectively, Im and Um were the amplitudes of the current and voltage, respectively, and I0 and U0 were the instantaneous current and voltage at the zero-crossing point of the current waveform, respectively. In this study, Um, Im, U0 and I0 were extracted from the synchronized voltage and current waveforms recorded by the oscilloscope. The phase differences at 50 Hz and 0.1 Hz were calculated and listed in Table 4.
Table 4.
Phase difference in cables at different aging times.
As shown in Table 4, at 50 Hz, the phase difference ranged from 21.43° to 26.75°, whereas at 0.1 Hz it ranged from 81.53° to 88.18°. For cables aged from 7 days to 28 days, the phase difference changed by approximately 1° at 50 Hz, and the phase-difference variation between adjacent aging times remained limited. By contrast, at 0.1 Hz, the phase difference changed by approximately 5°, and the phase-difference variation between adjacent aging times increased significantly. These results indicated that the phase difference measured at 0.1 Hz provided higher sensitivity for evaluating insulation aging than that measured under power-frequency conditions.
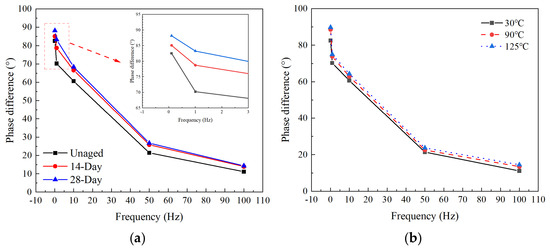
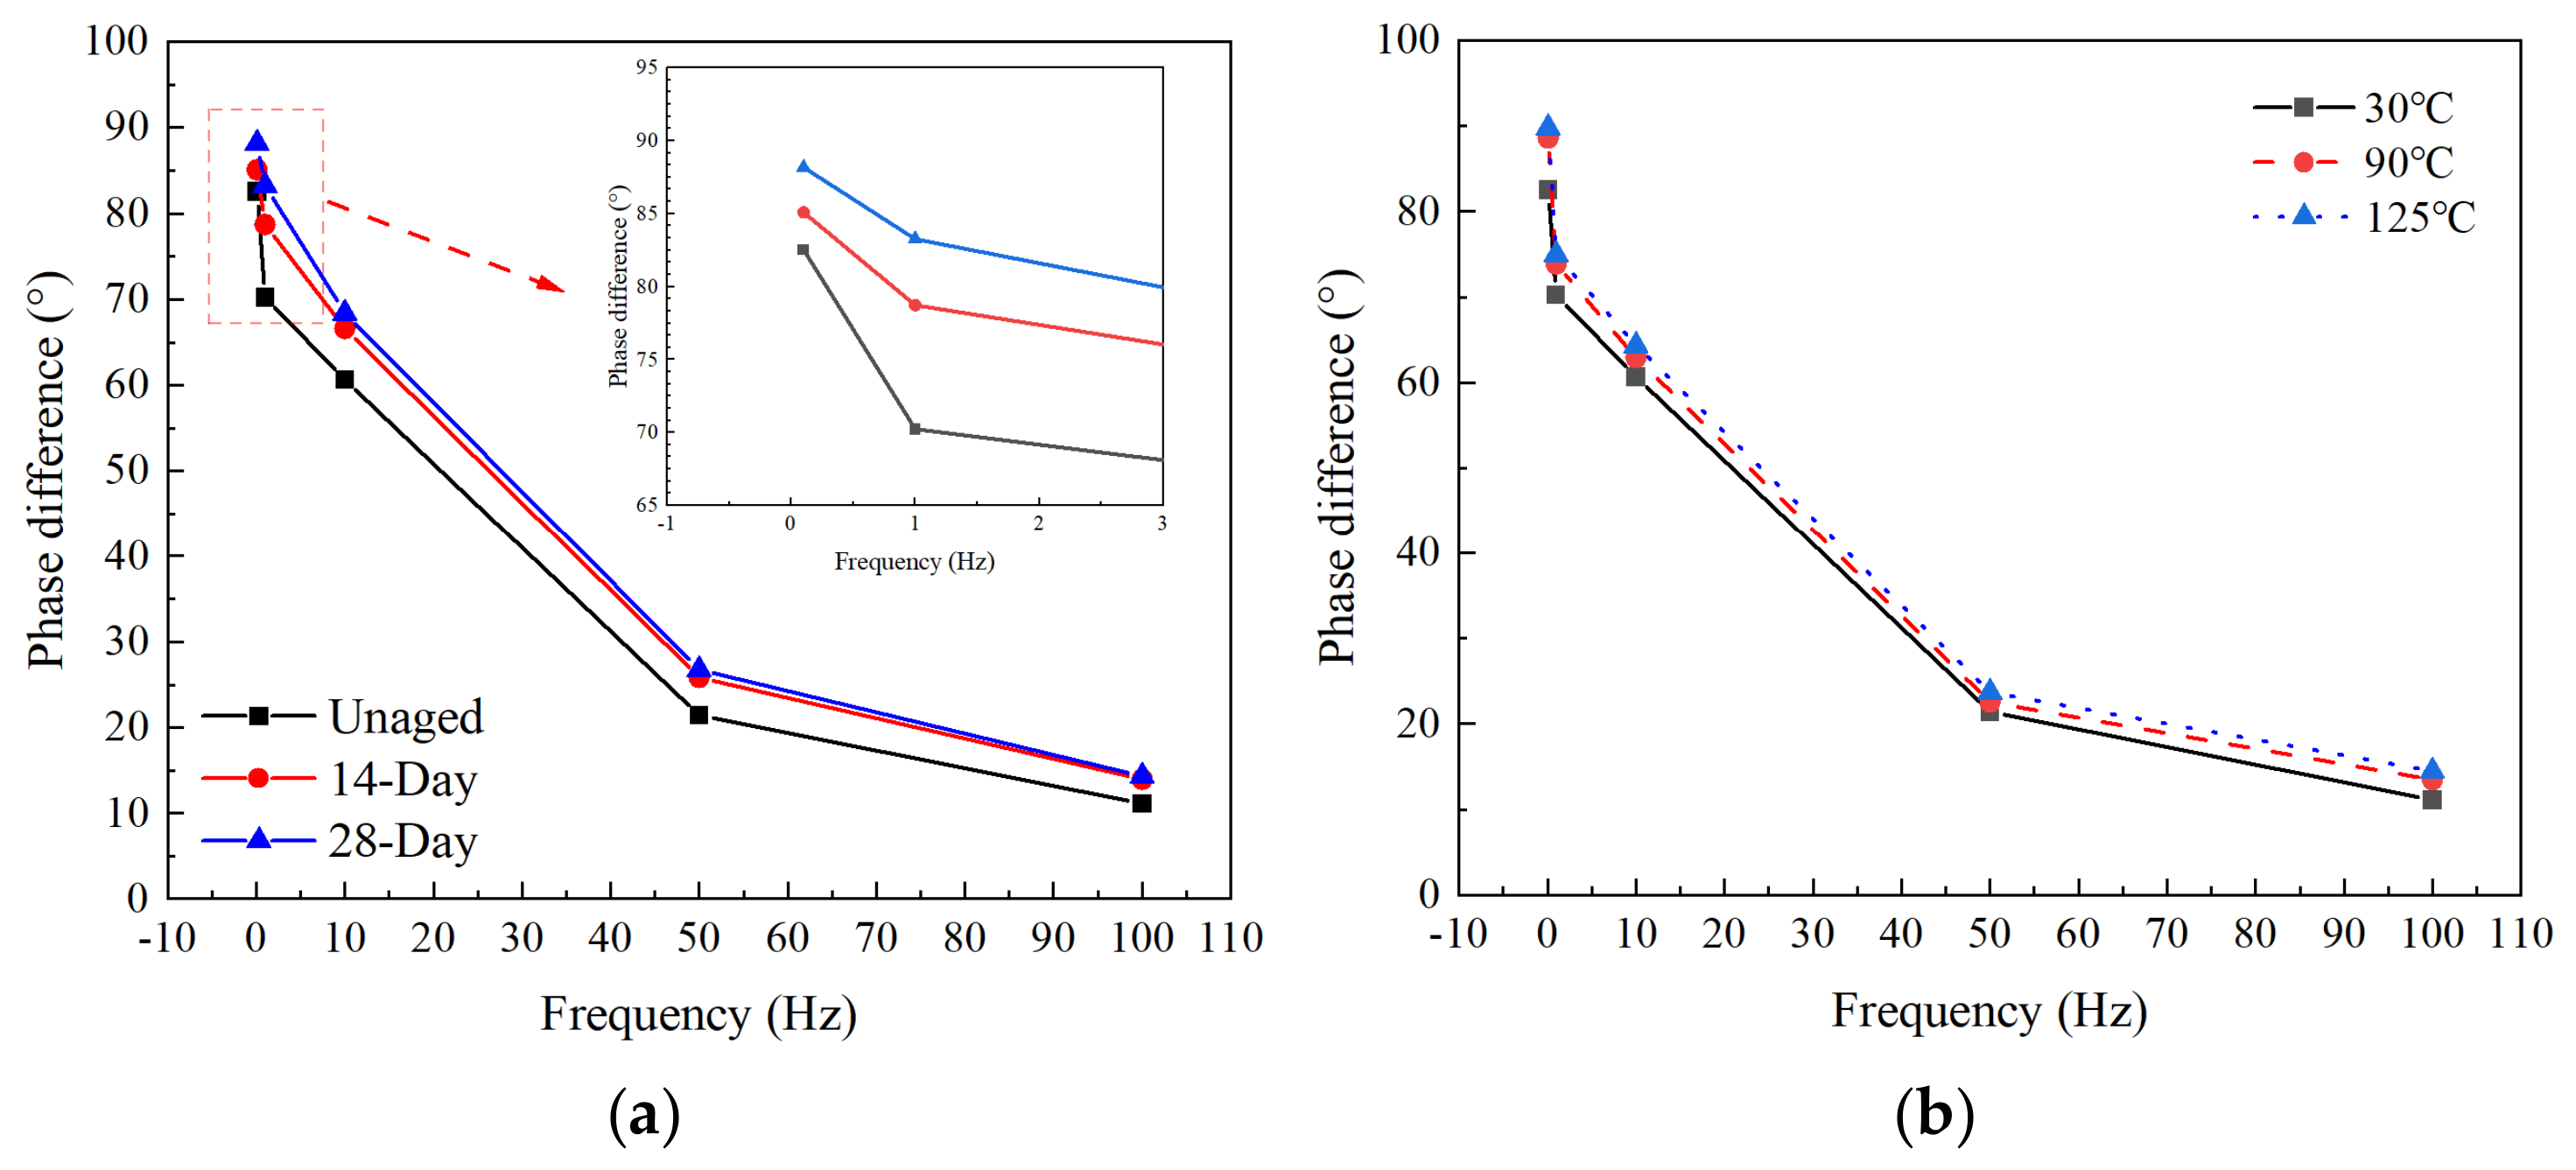
Figure 7 shows the variation in phase difference with frequency and temperature for the unaged cable and the cables aged for 14 days and 28 days. As shown in Figure 7a, the phase difference in each sample increased monotonically with decreasing frequency. More importantly, the separation among samples became progressively clearer as the frequency decreased: it remained limited at higher frequencies, but became more evident at 1 Hz and especially at 0.1 Hz. This result indicated that the phase difference measured by the circuit shown in Figure 3 was more sensitive to differences in aging time under low-frequency excitation. The enhanced discrimination at lower frequencies was associated with the longer polarization time, which allowed dipolar polarization and interfacial polarization to contribute more strongly to the measured response. In Figure 7b, the phase difference increased with temperature, while the frequency-dependent trend remained similar at all temperatures. As the test temperature increased, the enhanced thermal motion of molecular chains in the cable insulation altered the effective dielectric constant. This variation modified the relative contributions of the capacitive and resistive components to the vector impedance of the cable, so the phase differences in the cables varied with temperature [27]. In summary, the operating-voltage-relevant broadband impedance measurement provides a useful phase-difference indicator for assessing cable insulation under different frequency and temperature conditions, with clearer discrimination of aging times obtained at lower frequencies.
Figure 7.
Phase difference as a function of frequency and temperature: (a) phase difference as a function of frequency; (b) phase difference as a function of temperature.
4. Discussion
4.1. Principle of Cable Equivalent Circuit
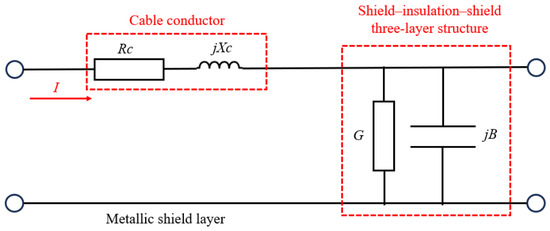
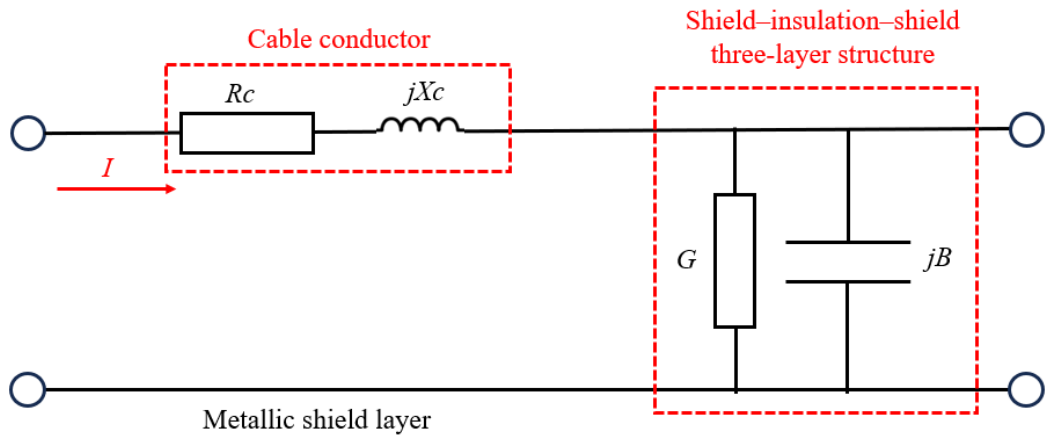
When the frequency ranged from 100 Hz to 0.1 Hz, the equivalent impedance circuit was represented by a lumped-parameter model, as shown in Figure 8. In this model, Rc + jXc was assigned to the conductor branch, whereas G and jB denoted the equivalent conductance and susceptance of the insulation branch. Since a multilayer structure, including the conductor shield, XLPE insulation, insulation shield, and their interfaces, exists between the conductor and the metal shield, the dielectric response of this branch represents the combined response of these components [8].
where εr was the relative permittivity of the insulation, ε0 was the vacuum permittivity, σ referred to the electrical conductivity, d was the outer radius of the conductor shield, namely the inner radius of the insulation layer, and D was the inner radius of the insulation shield, namely the outer radius of the insulation layer [29]. According to (3)–(5), the magnitudes of conductance G and susceptance B were jointly determined by the physical and electrical properties of the cable. When the physical parameters of the cable remained unchanged, variations in G and B signified changes in conductivity and dielectric constant, respectively. Therefore, both dc and ac tests were performed on the cable. The corresponding results reflected the conductivity-related and dielectric-related characteristics of the cable, respectively, thereby enabling assessment of cable insulation aging.
Figure 8.
Equivalent-impedance circuit diagram of cable.
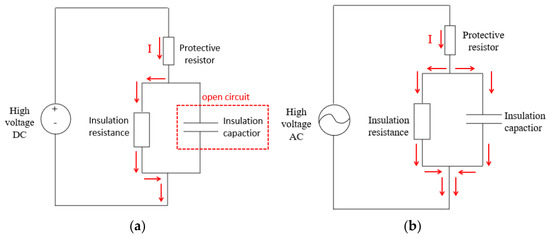
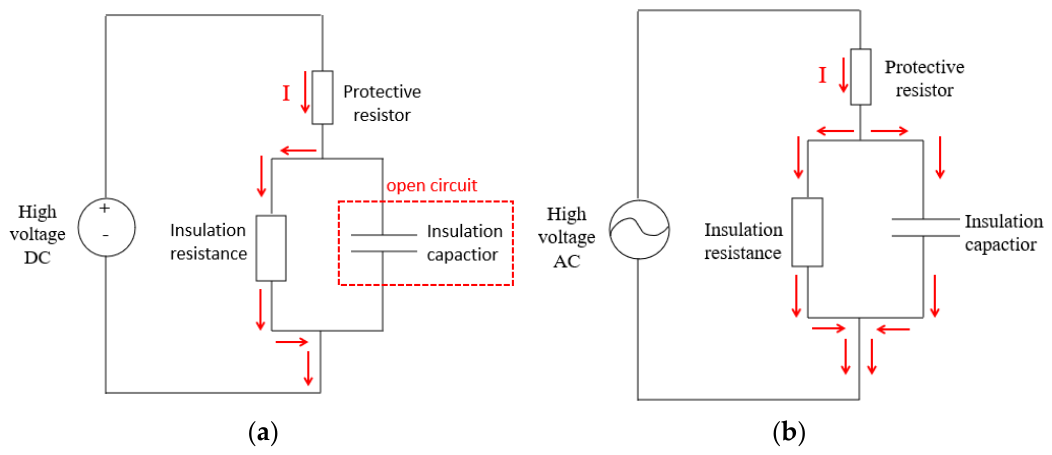
Based on the equivalent circuit model shown in Figure 8, the current paths under dc and ac excitation are illustrated in Figure 9. As shown in Figure 9a, the insulation-capacitive branch was blocked under dc excitation, so the current flowed only through the insulation resistance after a high dc voltage was applied to the conductor. Consequently, the impedance measured under dc voltage mainly represented the conduction-related response of the insulation. Accordingly, polarization and depolarization current measurements under DC conditions were used to represent the charge-transport and relaxation behavior of the XLPE insulation [20]. Under ac excitation, the current was shared by the resistive and capacitive branches, as shown in Figure 9b. At 100 Hz, the capacitive reactance was much smaller than the insulation resistance, so the insulation-capacitive branch dominated the response and the cable behaved predominantly as a capacitor. As the frequency decreased, the capacitive reactance of the cable insulation increased, so the contribution of insulation resistance to the measured vector impedance became more significant. At 0.1 Hz, the voltage-current waveform measured by the impedance measurement circuit was governed jointly by the insulation resistance and insulation capacitance of the XLPE cable [4]. In addition, although the measurement principle shown in Figure 9b was consistent with that of existing methods, such as broadband impedance and leakage-current measurement, the circuit shown in Figure 3 allowed vector impedance to be measured under operating-voltage-relevant low-frequency conditions. Owing to the combined effects of low-frequency polarization and interfacial polarization, the composite insulation structure of the cable exhibited more pronounced capacitance variation under operating-voltage-relevant low-frequency excitation, and these variations became distinguishable among cables with different aging times. Therefore, the circuit shown in Figure 3 provided higher sensitivity for evaluating cable insulation aging.
Figure 9.
Equivalent circuit diagram under AC and DC applied voltages: (a) equivalent current circuit under DC excitation; (b) equivalent current circuit at 0.1 Hz.
4.2. Operating-Voltage-Relevant Broadband Impedance Measurement Characteristics
4.2.1. Variation Characteristics of Cable Impedance Phase Difference
Based on the principle shown in Figure 9b, in the operating-voltage-relevant broadband impedance measurement, when the test frequency ranged from 100 Hz to 0.1 Hz, the measured current magnitude and phase difference mainly reflected changes in the insulation resistance and insulation capacitance of the cable. Under this condition, the impedance between the conductor and the metallic shield was represented by the equivalent insulation resistance R in parallel with the equivalent insulation capacitance C. The corresponding complex impedance Z was expressed by (6), where R was the insulation resistance, C was the equivalent capacitance, and ω was the angular frequency. The phase difference θ was then obtained from (7).
According to (6) and (7), in the frequency range from 100 Hz to 0.1 Hz, ωCR remained much greater than 1, so θ remained close to 90° before severe insulation degradation occurred in the cable. Since the dielectric constant of XLPE typically ranged from 2.0 to 2.8 under power-frequency conditions, the corresponding variation in ωCR remained limited [13]. As a result, the phase differences among cables with adjacent aging times became less distinguishable. Based on Figure 9b, when a protective resistor is connected in series in the circuit, the circuit impedance Zp and θ are expressed by (8):
When ωCR remained much greater than 1, the real term was negligible. The total impedance Zp and the corresponding phase difference in the test circuit are expressed by (9) and (10):
The phase difference in the Rp-cable test loop was primarily determined by the relative magnitudes of the cable capacitive reactance and the selected Rp. When Rp was selected to be comparable to the capacitive reactance in the target frequency band, an appreciable phase separation was maintained in the measured voltage-current vectors, thereby improving the sensitivity of the phase difference to slight variations in insulation capacitance during the early stage of thermal aging. In addition, because the phase differences remained large throughout the low-frequency range, most of the applied voltage was distributed across the cable, and the influence of voltage division between the cable and Rp on the measurement results could be neglected.
As listed in Table 4, at the same frequency, the phase difference increased with aging time. According to (8), an increase in phase difference was associated with an increase in capacitive reactance, which implied a reduction in the equivalent insulation capacitance as aging progressed. This result was consistent with the decrease in fundamental capacitance shown in Table 2. Together with the phase difference and Zm values obtained under operating-voltage-relevant excitation, the measured fundamental capacitance in Table 2 indicated that the insulation capacitance of the cable decreased with increasing aging time and temperature under both low-voltage and high-voltage conditions. Thus, changes in the dielectric properties of the insulation system and its interfacial structure with aging time and temperature were identified under both measurement conditions. Under high-voltage, low-frequency conditions, the effects of polarization and electric field intensity on cable capacitance became more pronounced, although the overall variation trend of the effective dielectric constant remained consistent under different test conditions. In summary, low-voltage measurement still provided useful reference information for cable-condition assessment, whereas high-voltage low-frequency measurement showed higher sensitivity for evaluating cable insulation aging during the early stage of thermal aging. Moreover, when the protective resistor Rp was specified in the measurement loop, the phase difference and impedance magnitude of the cable could be derived directly from the synchronized voltage–current vectors. Therefore, the measurement circuit shown in Figure 3 enabled direct extraction of the phase difference and impedance of the cable sample under high voltage, and these two parameters were jointly used to evaluate the aging condition of the XLPE cable.
4.2.2. Variation Characteristics of Cable Impedance
Based on (9), the cable impedance magnitude Zm was calculated using (12), where Um and Im denoted the measured voltage and current magnitudes, and Rp denoted the selected protective resistor. The resulting impedance values at 50 Hz and 0.1 Hz are listed in Table 5. The results showed that the impedance magnitude was on the order of 106 Ω at 50 Hz and increased to the order of 109 Ω at 0.1 Hz. This large increase was consistent with the frequency dependence of the insulation capacitive reactance. At 50 Hz, the polarization response of the cable insulation remained relatively weak, and the capacitance changed only slightly during the early stage of aging, as listed in Table 2. As a result, the Zm values obtained from the operating-voltage-relevant broadband impedance measurement circuit showed only small differences among cables with different aging times. As the frequency decreased to 0.1 Hz, both dipolar polarization and interfacial polarization became more prominent, which increased the effective capacitance of the cable insulation. The current was then shared by the resistive and capacitive branches, and the measured impedance magnitude was governed by the parallel contribution of the two branches. As shown in Table 5, the ratio of Zm at 0.1 Hz to that at 50 Hz increased significantly with increasing aging time. This result suggested that the measurement circuit shown in Figure 3 was more responsive to insulation aging when the impedance was measured at 0.1 Hz.
Table 5.
Impedance magnitude of cables at different aging times.
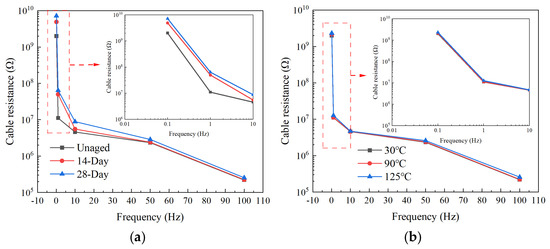
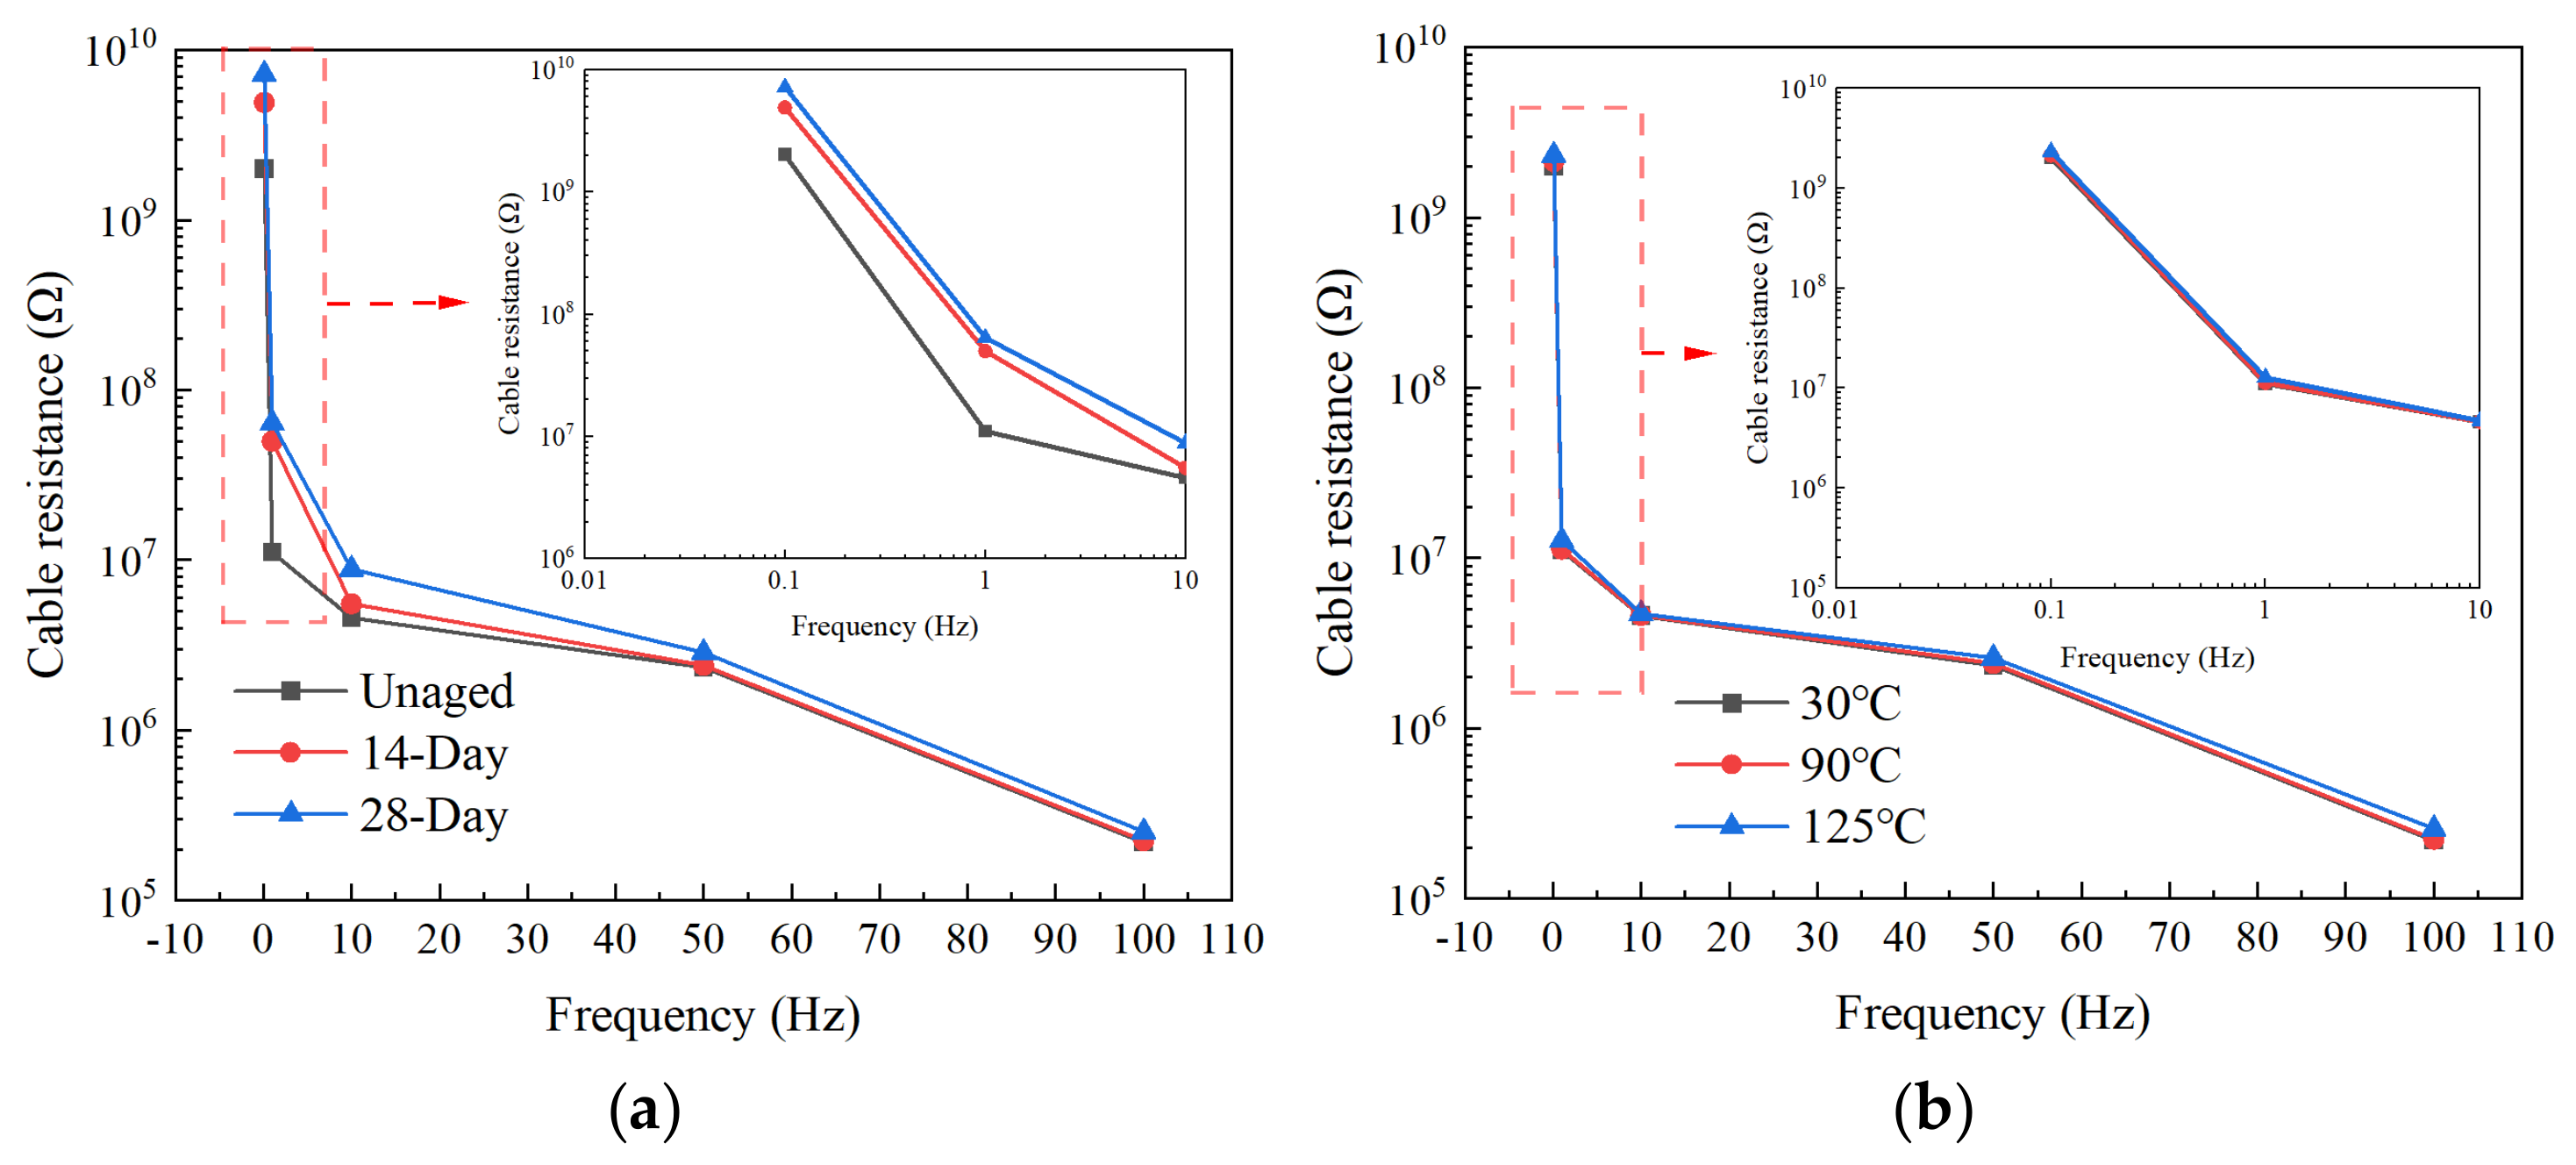
Figure 10 shows the impedance magnitudes of the unaged cable and the cables aged for 14 days and 28 days at different frequencies. As the frequency decreased, the impedance of each aged cable exhibited a nonlinear variation trend. On the one hand, the decrease in frequency caused the capacitive reactance to increase, which increased Zm. On the other hand, at lower frequencies, the polarization response of the cable became more prominent, so the reduction in insulation capacitance with aging also became more evident [30]. As a result, the Zm values of cables with different aging times increased as the frequency decreased, and the increase was more evident for cables with longer aging times. Furthermore, at 1 Hz and 0.1 Hz, the differences in Zm among cables with different aging times became clearer at the same frequency. This result showed that impedance measurement under low-frequency operating-voltage-relevant excitation provided higher sensitivity for evaluating cable insulation aging.
Figure 10.
Impedance magnitude of cables at different frequencies: (a) cable resistance with different aging times; (b) cable resistance with different temperatures.
Since the insulation capacitance was temperature dependent, impedance magnitudes were also calculated from the waveform data of the unaged cable at different temperatures and frequencies, as shown in Figure 10b. At each frequency, the impedance difference induced by temperature variation was maintained below 10%. Therefore, impedance magnitude alone provided limited sensitivity for distinguishing temperature-dependent characteristics under the present conditions. However, Figure 7b showed that under different temperature conditions, the variation in current phase difference reached 20%. Compared with impedance magnitude, the current phase difference showed higher sensitivity to temperature variation and reflected the impedance characteristics of the cables at different temperatures more clearly [31,32]. Moreover, based on the fundamental capacitance in Table 2 and the polarization–depolarization current exponents in Table 3, it was shown that the dominant relaxation release process and charge-carrier mobility inside the cable were enhanced at elevated temperature.
Based on the above results of fundamental capacitance and polarization–depolarization current measurements, it was found that cables with different aging times could be distinguished by the operating-voltage-relevant broadband impedance measurement through the phase difference θ at different frequencies, and the variation in phase difference with aging time and temperature was consistent with the trends observed in the other two tests. When the frequency decreased to 1 Hz and 0.1 Hz, the impedance magnitude Zm measured under high-voltage conditions exhibited more evident separation among cables with different aging times. These results suggested that low-frequency impedance measurement under electrical stress close to the actual operating voltage of the cable provided high sensitivity for evaluating insulation aging under different aging times and temperatures [33].
4.3. Normalized Aging-Sensitivity Comparison at Different Temperatures
To compare the aging sensitivity of different diagnostic indicators, the basic capacitance, PDC parameters, and 0.1 Hz impedance parameters measured at 30 °C and 90 °C were analyzed. The selected indicators were the fundamental capacitance CF, the PDC polarization current exponent b1, the PDC depolarization current exponent b2, and the impedance magnitude at 0.1 Hz, Z0.1Hz. Because these indicators have different units, numerical ranges, and aging-dependent variation directions, their absolute values cannot be directly compared. Therefore, the aging-induced variation in each indicator was first normalized with respect to its unaged value. The normalized aging variation rate was calculated as follows:
where X was the selected aging indicator, ta was the aging time, T was the test temperature, X(ta,T) was the value of the indicator after aging for ta at temperature T, and X(0,T) was the value of the unaged sample at the same temperature. In this study, X included CF, b1, b2, and Z0.1Hz.
Because some indicators increased with aging, whereas others decreased, the absolute value of the normalized variation rate was used to evaluate the overall aging sensitivity. To compare the sensitivity of different indicators on the same time scale, the average sensitivity per 7 d was calculated as follows:
where SX(ta,T) was the average aging sensitivity of indicator X at temperature T, with the unit of %·d−1. For the 28 d aging condition, the sensitivity was calculated as:
The calculated sensitivities of different indicators at 30 °C and 90 °C are listed in Table 6.
Table 6.
Sensitivity comparison of different indicators at 30 °C and 90 °C.
As shown in Table 6, at 30 °C, Z0.1Hz exhibited higher aging sensitivity among the selected indicators, whereas the fundamental capacitance CF showed the lowest sensitivity. This result indicates that, under 30 °C conditions, the low-frequency impedance measurement provided a more sensitive evaluation of aging-induced changes in 10 kV XLPE cables than fundamental capacitance and PDC-based indicators.
When the test temperature increased to 90 °C, the PDC polarization current exponent b1 showed the higher aging sensitivity. This difference could be attributed to the stronger temperature dependence of carrier transport, trap release, and polarization relaxation under DC polarization [34]. At elevated temperatures, the PDC response is more strongly affected by thermally activated charge migration and relaxation processes, making the PDC-derived indicator more sensitive to aging. In contrast, during the 0.1 Hz AC impedance test, the periodic reversal of the electric field suppresses continuous charge accumulation [32]. Therefore, the measured impedance response is closer to an equivalent dielectric response, and its relative sensitivity becomes lower than that of the PDC-derived indicator at 90 °C.
5. Conclusions
In this study, the early stage of aging in 10 kV XLPE cables was first identified through fundamental capacitance measurement and polarization–depolarization current measurement. Subsequently, an operating-voltage-relevant broadband impedance measurement circuit was constructed to investigate the vector impedance characteristics of cable insulation under different temperatures and frequencies. The main conclusions were summarized as follows:
- (1)
- The fundamental capacitance and current constant bn decreased with increasing aging time. With increasing temperature, the fundamental capacitance decreased, whereas bn increased. These results indicate that the cable insulation remained at the early stage of thermal aging.
- (2)
- Phase difference and impedance magnitude were shown to be two effective indicators in operating-voltage-relevant broadband impedance measurement. Their variation trends were consistent with the results obtained from the fundamental capacitance and polarization–depolarization current measurements.
- (3)
- From 0 to 28 d of thermal aging, the impedance magnitude increased by 22.49% at 50 Hz and by 228.17% at 0.1 Hz. At 30 °C, the low-frequency impedance response exhibited greater sensitivity to cable aging time than the conventional diagnostic indicators. These results demonstrate that broadband impedance measurements under operating-voltage-relevant excitation provide a sensitive approach for assessing early-stage insulation aging in XLPE cables.
In summary, the proposed operating-voltage-relevant broadband impedance measurement provides an offline laboratory method for characterizing early-stage insulation aging in medium-voltage XLPE cable samples under electrical stress close to the rated phase voltage. Importantly, although the samples were prepared by stripping and cutting the original three-core cable, the impedance measurement itself did not damage the prepared single-phase cable samples.
Author Contributions
Conceptualization, H.Y. and Y.X.; methodology, H.Y. and Y.X.; investigation, H.Y., S.X., Z.H. and J.H.; formal analysis, H.Y. and S.X.; data curation, S.X., Z.H., J.H. and H.W.; resources, Z.H. and J.H.; validation, Z.H., J.H. and H.W.; writing—original draft preparation, H.Y., S.X. and Z.H.; writing—review and editing, H.Y., J.H., H.W. and Y.X.; supervision, Y.X.; project administration, Y.X.; funding acquisition, Y.X. All authors have read and agreed to the published version of the manuscript.
Funding
This work was supported by the Guangdong Basic and Applied Basic Research Foundation, Grant 2022A1515111024.
Data Availability Statement
The original contributions presented in this study are included in the article. Further inquiries can be directed to the corresponding author.
Conflicts of Interest
Authors Zhuozhan Han and Jiasheng Huang were employed by the Guangdong Power Grid Co., Ltd. The remaining authors declare that the research was conducted in the absence of any commercial or financial relationships that could be construed as a potential conflict of interest.
References
- Samet, H.; Khaleghian, S.; Tajdinian, M.; Ghanbari, T.; Terzija, V. A similarity-based framework for incipient fault detection in underground power cables. Int. J. Electr. Power Energy Syst. 2021, 133, 107309. [Google Scholar] [CrossRef]
- Zhang, T.; Shi, G.; Zhang, N.; Du, A.; Wu, Q. Analysis and aging evaluation method of frequency domain dielectric spectroscopy for high-voltage XLPE submarine cables. Electr. Eng. 2024, 106, 3403–3413. [Google Scholar] [CrossRef]
- Huang, P.; Yu, W.; Lu, C.; He, X.; Zhang, Y.; Liu, Y.; Zhou, J.; Liang, Y. Quantitative evaluation of thermal ageing state of cross-linked polyethylene insulation based on polarization and depolarization current. Polymers 2023, 15, 1272. [Google Scholar] [CrossRef] [PubMed]
- Saleh, M.A.; Alquennah, A.N.; Ghrayeb, A.; Refaat, S.S.; Abu-Rub, H.; Khatri, S.P. A review on the lifetime estimation methods of XLPE power cables. IEEE Open J. Ind. Appl. 2025, 6, 445–489. [Google Scholar] [CrossRef]
- Pourrahimi, A.M.; Pitois, C.; Abbasi, A. XLPE high voltage insulation: A link between DC conductivity and microstructure. Polym. Test. 2024, 131, 108330. [Google Scholar] [CrossRef]
- Pan, Q.; Zhang, C.; Wei, X.; Wan, A.; Wei, Z. Assessment of MV XLPE cable aging state based on PSO-XGBoost algorithm. Electr. Power Syst. Res. 2023, 221, 109427. [Google Scholar] [CrossRef]
- Arikan, O.; Uydur, C.C.; Kumru, C.F. Insulation evaluation of MV underground cable with partial discharge and dielectric dissipation factor measurements. Electr. Power Syst. Res. 2023, 220, 109338. [Google Scholar] [CrossRef]
- Guo, L.; Nie, Z.; Liu, G. A detection method for cable local defects based on Born iteration. Electr. Power Syst. Res. 2024, 226, 109956. [Google Scholar] [CrossRef]
- Qu, K.; Zhang, W.; Zhang, S.; Xiao, X.; Xi, Y.; Zhang, H. Model-free underground cable incipient fault location using two-terminal zero-sequence measurements. Int. J. Electr. Power Energy Syst. 2022, 140, 108057. [Google Scholar] [CrossRef]
- Li, J.; Wang, Y.; Wang, X.; Yong, J. Experimental research on incipient fault voltage disturbance model of power cable insulation. Int. J. Electr. Power Energy Syst. 2023, 145, 108687. [Google Scholar] [CrossRef]
- Bhandia, R.; Chavez, J.J.; Cvetković, M.; García-Vite, P.M.; Popov, M.; Palensky, P. Failure anticipation scheme in distribution systems based on wave distortions and Montecarlo methods. Int. J. Electr. Power Energy Syst. 2024, 156, 109757. [Google Scholar] [CrossRef]
- Li, Y.; Peng, Z.; Xu, D.; Huang, S.; Gao, Y.; Li, Y. Research on the Thermal Aging Characteristics of Crosslinked Polyethylene Cables Based on Polarization and Depolarization Current Measurement. Energies 2024, 17, 2274. [Google Scholar] [CrossRef]
- Shang, Y.; Zhao, Y.; Ji, H.; Ma, J.; Chen, J.; Li, Z.; Wang, K.; Lv, Z. Cable Aging State Diagnosis Adapted from Frequency-Domain Dielectric Spectroscopy and Polarization–Depolarization Current. Energies 2025, 18, 3169. [Google Scholar] [CrossRef]
- Domingos, A.C.; Duarte, L.; Pinheiro, A.P.; Moura, F.A.M.; Vasconcelos, L.; de Carvalho, D.P.; Fadel, F.E.d.F.; Sakai, P.N. Comparative Analysis of Insulation Aging in Cross-Linked Polyethylene and Ethylene–Propylene Rubber Cables through the Progression Rate of Partial Discharge. Energies 2025, 18, 2653. [Google Scholar] [CrossRef]
- Wang, F.; Tang, Z.; Song, Z.; Zhou, E.; Li, M.; Zhang, X. Insulation Condition Assessment of High-Voltage Single-Core Cables Via Zero-Crossing Frequency Analysis of Impedance Phase Angle. Energies 2025, 18, 3985. [Google Scholar] [CrossRef]
- Yang, X.; Wang, Z.; Li, J.; Wu, M.; Wang, G.; Gao, X.; Gao, J. Research on the Carrier Characteristics of Power Cables Considering the Aging Status of Insulation and Semiconducting Layers. Energies 2024, 17, 5655. [Google Scholar] [CrossRef]
- GB/T 31838.4-2019; Power Cables, Insulation Diagnostics, Part 4: Insulation Resistance Measurement. Standardization Administration of China: Beijing, China, 2019.
- Zhang, Y.; Zhong, W.; Wei, W.; Zhou, J.; Wang, G.; Xixi, Z. Analysis of polarization information of XLPE cables based on distribution of relaxation time. IEEE Trans. Dielectr. Electr. Insul. 2023, 30, 946–954. [Google Scholar] [CrossRef]
- Zhang, Y.; Liu, D.; Wu, J.; Yin, Y. A modified algorithm for the simulation of charge behavior in water tree aged cross-linked polyethylene cable. IEEE Access 2018, 6, 23929–23938. [Google Scholar] [CrossRef]
- Zhou, K.; Yuan, H.; Li, Y.; Li, S. Interface polarization behaviors of water tree aged XLPE cable during PDC measurement. IEEE Trans. Dielectr. Electr. Insul. 2025, 32, 967–974. [Google Scholar] [CrossRef]
- Hu, R.; Xu, H.; Lu, X.; Wang, A.; Xu, Z.; Wang, Y.; Zhang, D. Research on live detection technology of distribution network cable insulation deterioration state based on harmonic components. IET Gener. Transm. Distrib. 2024, 18, 2847–2859. [Google Scholar] [CrossRef]
- Lau, K.Y.; Vaughan, A.S.; Chen, G.; Hosier, I.L.; Ching, K.Y.; Quirke, N. Polyethylene/silica nanocomposites: Absorption current and the interpretation of SCLC. J. Phys. D Appl. Phys. 2016, 49, 295305. [Google Scholar] [CrossRef]
- Ansari, A.; Nia, S.Y.; Afshari, A.; Mishra, S. Estimating the insulation health index of XLPE cables using machine learning. Sci. Rep. 2025, 15, 41230. [Google Scholar] [CrossRef] [PubMed]
- Lin, S.; Zhou, K.; Li, Y. Novel parameter identification method of extended Debye model for long-length submarine cables. IEEE Trans. Dielectr. Electr. Insul. 2024, 31, 2652–2660. [Google Scholar] [CrossRef]
- Hu, J.; Zheng, H.; Meng, X.; Sun, Y.; Han, Y.; Li, Z. Influence of relaxation polarization absorption current on the C-V characteristic measurement. Measurement 2025, 244, 116489. [Google Scholar] [CrossRef]
- Hong, Z.; Chen, X.; Yin, K.; Li, C.; Rahman, T.U.; Li, H.; Paramane, A. Simultaneous effect of thermal aging and phase separation on insulation properties of 500-kV DC XLPE blends with voltage stabilizers. IEEE Trans. Dielectr. Electr. Insul. 2025, 32, 2568–2576. [Google Scholar] [CrossRef]
- Dai, X.; Hao, J.; El Moursi, M.; Chen, R.; Liao, R.; Bak, C.L. Dielectric mechanisms and health state estimation for high-voltage XLPE cable insulation under nonuniform thermal aging. IEEE Trans. Dielectr. Electr. Insul. 2025, 32, 2868–2876. [Google Scholar] [CrossRef]
- Florkowski, M.; Kuniewski, M.; Mikrut, P. Effect of voltage harmonics on dielectric losses and dissipation factor interpretation in high-voltage insulating materials. Electr. Power Syst. Res. 2024, 226, 109973. [Google Scholar] [CrossRef]
- Walker, R.C.; Meddeb, A.B.; Perini, S.; Furman, E.; Norrell, M.; Woodward, W.H.; Person, T.; Sengupta, S.; Rajagopalan, R.; Lanagan, M. High-temperature polarization analysis of polyethylene and polyethylene-semicon bilayers. IEEE Trans. Dielectr. Electr. Insul. 2024, 31, 2632–2641. [Google Scholar] [CrossRef]
- Chen, J.; Zhang, W.; Ding, M.; Hu, L.; Wang, J.; Li, C.; Cao, J. Aging characteristics of XLPE insulation of 110 kV cables in the initial stage of operation. Energy Eng. 2021, 118, 1537–1548. [Google Scholar] [CrossRef]
- Wang, Y.; Xu, H.; Wang, A.; Huang, K.; Wang, G.; Lu, X.; Zhang, D. Cable insulation defect prediction based on harmonic anomaly feature analysis. Electronics 2024, 13, 3807. [Google Scholar] [CrossRef]
- Hassan, W.; Shafiq, M.; Hussain, G.A.; Choudhary, M.; Palu, I. Investigating the progression of insulation degradation in power cable based on partial discharge measurements. Electr. Power Syst. Res. 2023, 221, 109452. [Google Scholar] [CrossRef]
- Li, G.; Zhou, W.; Zhou, C.; Jing, Y.; Qiu, L.; Ai, Y. Fault diagnosis of grounding system of high voltage cable circuits using graph attention networks. Int. J. Electr. Power Energy Syst. 2025, 168, 110683. [Google Scholar] [CrossRef]
- Wang, C.; Zhao, X.; Qiao, J.; Xiao, Y.; Zhang, J.; Li, Y.; Cao, H.; Yang, L.; Liao, R. Structural changes and very-low-frequency nonlinear dielectric response of XLPE cable insulation under thermal aging. Materials 2023, 16, 4388. [Google Scholar] [CrossRef] [PubMed]

Disclaimer/Publisher’s Note: The statements, opinions and data contained in all publications are solely those of the individual author(s) and contributor(s) and not of MDPI and/or the editor(s). MDPI and/or the editor(s) disclaim responsibility for any injury to people or property resulting from any ideas, methods, instructions or products referred to in the content. |
© 2026 by the authors. Licensee MDPI, Basel, Switzerland. This article is an open access article distributed under the terms and conditions of the Creative Commons Attribution (CC BY) license.