


Abstract
False Data Injection Attacks (FDIA) pose a serious threat to smart grid security due to their high concealment. In view of the defect that existing detection methods for FDIA in smart grids can only judge whether an attack occurs but fail to accurately locate attacked grid nodes, this study proposes a specialized attack localization and detection framework. To address the node-level class imbalance inherent in attack localization, we design a node-adaptive weighting strategy tailored for multi-label classification. Furthermore, we employ a Hadamard-product-based deep fusion mechanism to integrate spatial and temporal features, which, unlike simple concatenation, enables a more profound feature interaction. The framework is optimized using the gray wolf optimizer (GWO) to enhance convergence and stability. In this method, a graph convolutional network (GCN) is used to extract spatial topological correlation features of power grid measurement data, and a bidirectional long short-term memory (BiLSTM) is adopted to mine temporal dependency features of time-series data. The deep fusion of spatial and temporal features is realized through the Hadamard product. Meanwhile, the GWO is introduced for global optimization of model hyperparameters to optimize network performance and further improve detection and localization accuracy. Simulation results on the IEEE 14-bus and IEEE 118-bus power systems show that the GWO-STFFN model surpasses existing comparative models in key indicators, including detection accuracy, F1-Score, and AUC value, delivering higher node localization precision and lower Hamming Loss. In addition, it maintains favorable robustness under different noise intensities.
1. Introduction
1.1. Motivation and Background
As a quintessential Cyber-Physical System (CPS), the smart grid achieves intelligent operation and management through the deep convergence of power infrastructure with information and communication technologies [1,2]. It enables near-real-time monitoring of power-system status, while leveraging big data analytics and artificial intelligence to optimize dispatch and improve energy efficiency [3,4,5]. However, the information networks underpinning power systems face growing security threats from both external intrusions and internal oversights. Malware infiltration and unauthorized staff actions can each jeopardize the stable operation of network security. These combined factors place power-system security under mounting pressure [6,7,8]. In recent years, cyber-physical attacks targeting smart grids have emerged with increasing frequency, leading not only to major economic losses but also to severe social disruption. For instance, the 2015 Ukraine power grid incident marks the world’s first publicly confirmed case of a power supply outage directly caused by a cyberattack. Attackers deployed malware via spear-phishing emails, then seized control of SCADA systems to disconnect substations. Such incidents expose the vulnerabilities of smart grids in the information security domain, and further underscore the serious challenges cyber-physical attacks pose to grid security [9,10]. Emerging research in the field of wireless traffic analysis has revealed that even encrypted wireless communications can be exploited to infer user app usage behavioral patterns. This underscores a broader threat landscape: side-channel information at the communication layer can be leveraged to compromise the privacy and security of smart grid edge networks [11].
Cyber-physical attacks are characterized by their ability to simultaneously affect both the physical and information layers of the smart grid. By infiltrating the information network, attackers can tamper with collected data and thereby directly disrupt the normal operating state of the power grid. Among the various types of cyber-physical attacks, False Data Injection Attack (FDIA) stands out as a common yet highly damaging form [12]. Beyond traditional cyber-physical attacks like FDIA, emerging research, such as XPorter, has revealed that even peripheral devices like multi-port chargers can serve as attack vectors for privacy leakage and voice injection, further expanding the threat surface of smart grid edge networks [13]. Such attacks are not only highly concealed but also cause severe interference with the operational state of smart grids, further complicating system detection and localization [14]. Notably, beyond grid-level attacks, emerging work such as FOAP has revealed that fine-grained fingerprinting of mobile applications can expose terminal-side behavioral patterns, potentially serving as a new entry point for privacy leakage and targeted data manipulation in smart grid edge networks, further expanding the threat surface of cyber-physical systems [15]. The concept of FDIA was first introduced by Liu et al. in 2011, who demonstrated that attackers could tamper with, delete, or fabricate measurement data to circumvent conventional bad data detection mechanisms [16]. A graph-theoretic algorithm is designed for the construction of FDIA under AC state estimation scenarios. This algorithm can accurately identify attack-injected measurement signals and their corresponding physical locations, effectively lowering the possibility of being detected [17]. FDIA research is expanded from the simplified DC linear state estimation model, which is widely adopted for engineering simplification, to the AC nonlinear state estimation model that is more consistent with real power grid operation conditions. Relevant research fills the research gap of previous studies that overly relied on idealized DC models and lacked alignment with actual power grid operating features. In addition, hiding false data in normal measurement values and limiting the spatial scope of attacks can significantly improve the concealment of tampered data, making distance-based detection strategies invalid [18]. In [19], Belik et al. elaborate on the prerequisites for establishing digital twins of power transformers, which offer theoretical and technical foundations for real-time technical condition evaluation of electrical equipment. Their research reveals that the construction of digital twin models has become an essential trend to realize accurate condition judgment and full-lifecycle management of power transformers. Data integrity attacks in smart grid state estimation are systematically modeled, and it is verified that false data can arbitrarily interfere with state estimation results without activating residual-based detection mechanisms [20]. In contrast to existing attack types, the detection of FDIA thus poses a far greater challenge to conventional security mechanisms.
1.2. Literature Review
A relatively complete research system has been established in the field of cyber-physical security of modern smart grids, covering typical threats such as FDIA and eavesdropping attacks, as well as multiple defense technical routes, including model-driven and data-driven approaches [21]. To address the limitations of existing studies, namely insufficient deep fusion of spatiotemporal features and weak capability in locating compromised attack nodes, this paper proposes corresponding detection and localization methods. At present, existing detection methods fall mainly into two categories. One is model-driven methods, which rely on a known system model to infer the system state and compare it with measured data in order to identify false data. The other is data-driven methods, typically represented by machine learning techniques, which learn the normal operating patterns of power systems through model training and then flag anomalous behavior [22]. Within these categories, detection methods based on physical models usually predict the operating state through accurate system parameters and extensive matrix operations, detecting anomalies by comparing predictions with actual measurements [23,24]. Machine learning-based detection methods, on the other hand, focus on extracting features from the data and identifying anomalies that deviate from learned normal patterns [25,26]. In the face of complex and variable attacks, however, both approaches show limitations. Model-driven methods are sensitive to model accuracy and parameter settings, which constrain their detection efficiency and reliability. Traditional machine learning methods tend to suffer from performance degradation and the dimension disaster when processing high-dimensional time-series data from power grids, and they place high demands on data quality. With the rapid development of big data technologies, deep-learning-based analysis methods have drawn considerable attention for their strong ability to handle high-dimensional data, offering a new research direction for improving FDIA detection performance. A common shortcoming of the above detection methods when dealing with attacks on power systems is that they often overlook the inherent topological structure of the system, which limits their ability to handle complex attacks. For FDIA, such attacks exhibit spatial concealment that makes effective identification difficult for traditional detection methods. To address this weakness, FDIA detection methods based on Graph Neural Networks (GNN) can model the topological structure of the grid, extract the corresponding spatial features, and capture the interconnections between nodes, enabling more accurate identification of anomalous data [27]. This thesis therefore conducts an in-depth study on GNN-based FDIA detection and localization in smart grids, with the goal of improving the detection performance of the model.
Experimental results indicate that methods that ignore network topological structure features generally show weaker detection performance than those with the capability to extract such features under the same conditions [28]. Using GNN for FDIA detection makes it possible to effectively leverage the topological structure information of smart grids [29]. In [30], FDIA detection was achieved by applying a graph convolutional network (GCN) model to analyze the fluctuation characteristics of state estimation values through the graphical structure of the power network. To address the decline in accuracy of data-driven detection methods caused by grid topology changes, ref. [31] proposed an FDIA detection method based on a gated graph neural network (GGNN) and graph attention network (GAT), establishing a GNN-based detection model that integrates grid topology information with operational data. In [32], an end-to-end deep-learning method combining GCN and long short-term memory, namely GCN-LSTM. By constructing the GATCN model, the method realizes both spatiotemporal feature extraction and prediction.
1.3. Motivation and Contribution
Despite the notable progress achieved in FDIA detection, existing studies still face three major limitations. First, most methods focus solely on determining whether an attack has occurred, while neglecting the precise localization of the attacked nodes. This makes it difficult to provide effective support for subsequent fault isolation and recovery control. Second, traditional detection methods typically rely on single-dimensional information, either the temporal features or the spatial topological features of measurement data. They fail to fully exploit the inherent spatiotemporal coupling characteristics of power grid data, which leads to a marked decline in detection performance when facing highly concealed attacks. Third, the hyperparameter tuning of deep-learning models still depends heavily on manual experience and repeated trial and error. This process is not only inefficient but also makes it difficult to obtain the globally optimal parameter combination, thereby limiting the model’s generalization ability and detection accuracy.
To address the above limitations, this study proposes an end-to-end FDIA detection and localization framework that integrates spatiotemporal feature fusion with swarm intelligence optimization. The framework is built to fully exploit the spatiotemporal correlation characteristics of power grid measurement data. It couples the automatic feature extraction capability of deep-learning models with the global optimization capability of swarm intelligence algorithms, thereby enabling accurate FDIA detection and precise localization of attacked nodes within a unified architecture. The main contributions of this study are summarized below:
- We propose an end-to-end FDIA detection and localization framework based on a spatiotemporal feature-fusion network (STFFN). Unlike prior works that treat spatiotemporal features separately via simple concatenation, our framework introduces a deep fusion mechanism based on the Hadamard product. This design enables multiplicative interactions between spatial and temporal feature dimensions, generating joint representations with stronger discriminative power for stealthy attacks.
- We formulate the localization task as a multi-label classification problem and, for the first time in this domain, introduce a node-adaptive weighting strategy to counteract the severe class imbalance issue at the node level. This strategy dynamically adjusts the loss contribution of each node, preventing the model from being biased toward the majority class and significantly improving localization precision.
- To overcome the inefficiency and suboptimality of manual hyperparameter tuning, we integrate the gray wolf optimizer (GWO) into the training pipeline. More than a simple replacement for grid search, GWO enables a global and dynamic search for optimal hyperparameters (e.g., learning rate), which is particularly critical for the complex, non-convex loss landscape of our fused spatiotemporal model, ensuring faster convergence and superior generalization.
The remainder of this paper is organized as follows. Section 2 outlines the basic principles of state estimation and FDIA. Section 3 introduces the gray wolf optimizer optimized spatiotemporal feature-fusion network (GWO-STFFN)-based model for FDIA detection and localization. Section 4 verifies the detection performance of the proposed model through comprehensive experiments on the IEEE 14-bus and IEEE 118-bus power systems. Section 5 summarizes the research contributions of this paper and presents prospects for future work.
2. Power-System Knowledge and FDIA Principles
FDIA is a highly stealthy and destructive cyberattack in the cyber-physical integration scenario of smart grids. By tampering with the measurement data of power systems and interfering with state estimation results, this attack can bypass the traditional bad data detection mechanism and directly threaten the scheduling decision-making, security, and stable operation of power grids. This section focuses on the basic theories of FDIA, and sequentially introduces power-system state estimation, bad data detection (BDD) mechanism, and the principle of FDIA.
2.1. Power-System State Estimation
The new power system is composed of a smart grid, SCADA system, and control center. As the core algorithm of the energy management system, AC state estimation of power systems is mainly used to process the noisy measurement values of physical sensors in power grids and eliminate the inconsistency of measurement data [33]. AC state estimation comprehensively considers Kirchhoff’s Laws of power systems, the complete coupling relationship between node voltage amplitude and phase angle, the real ratio of line resistance to reactance, and other factors, so it can be applied to complex power grid structures and has higher estimation accuracy.
AC state estimation is based on measurement redundancy information and nonlinear AC power flow equations of power systems, and its core task is to eliminate bad data and estimate the state variables of the system, usually including the voltage amplitude and phase angle of each bus. The mathematical model of AC state estimation can be expressed as:
where represents the measurement quantity, including active power and reactive power injected into the node, active power and reactive power on the branch; is the measurement function; is the state variable, composed of voltage modulus and phase angle ; is the random error, obeying the standard normal distribution.
Using the polar coordinate equation can more accurately reflect the relationship between the active power and reactive power injected into the node and the state variables:
where and , respectively, represent the real part and imaginary part of the element in the i-th row and j-th column of the node admittance matrix; represents the voltage phase angle difference between node and node .
The active power and reactive power transmitted on the branch can be expressed as:
where and , respectively, represent the conductance and susceptance of line .
All attack vectors are strictly constructed to satisfy the stealth condition , where is the Jacobian matrix of the AC state estimation model and is an arbitrary non-zero state error vector. This construction guarantees that the post-attack measurement residual remains identical to that under normal operation, thereby bypassing the traditional residual-based bad data detection mechanism. The attack vector is generated under the AC state estimation framework using MATPOWER, rather than by simply superimposing synthetic disturbances on measurements. For samples involving multiple compromised nodes, the attack vector is designed such that its non-zero entries correspond exclusively to the measurements associated with the selected k target nodes, while all other entries remain zero. This design simulates a realistic adversary with limited resources who focuses on compromising a localized region of the grid. The attack modifies both bus injection measurements (active power and reactive power injected at each bus) and branch flow measurements (active power and reactive power on each transmission line). The state variables (voltage magnitudes and phase angles) are not directly manipulated but are indirectly affected through the compromised measurements.
In the solution process of AC state estimation, Weighted Least Squares is one of the most commonly used methods. The estimated value is calculated according to the collected measurement data and system state , and its mathematical expression is:
where represents the weight matrix.
The iterative normal equation method is used to calculate Equation (7). For this unconstrained optimization model, the corresponding first-order optimality condition can be summarized as:
where represents the Jacobian matrix; represents the estimated value of the state variable.
Aiming at the problem that the measurement equation is nonlinear and cannot be solved directly, this method transforms the nonlinear equation into successive linear normal equations for solution through Taylor linearization and iterative update, and then obtains the optimal solution of state estimation.
2.2. State Estimation-Based Bad Data Detection Mechanism
BDD in power systems refers to the identification, correction, or elimination of erroneous data that seriously deviates from the true value due to measurement errors, communication interference, equipment failures, and other reasons in state estimation analysis, so as to ensure the accuracy and reliability of state estimation results [34].
In the process of bad data detection, a core link is to use the residual to judge whether the measurement data contains erroneous data. Under ideal and fault-free conditions, the value of the residual should be very small; when bad data occurs, the residual will increase significantly, thus triggering the detection mechanism. The residual is defined as the difference between the true measurement value and the estimated value based on the measurement, and its formula can be expressed as:
where represents the residual; represents the estimated value of the measurement.
If all measurements are accurate, the residual should obey the Gaussian distribution with zero mean [35]. By judging the size and distribution characteristics of the residual, data anomalies in the system can be identified, and system faults or errors can be located.
At present, the common method to detect bad data is to calculate the residual and compare it with a preset threshold. The specific judgment basis is as follows:
where is the threshold, representing the maximum deviation acceptable to the system. If it exceeds this degree, the system is considered to be attacked.
2.3. Principle of FDIA
FDIA is a malicious attack against power-system state estimation, aiming to destroy information integrity. By tampering with or injecting carefully designed measurement data, the attacker uses the mathematical characteristics of state estimation to generate attack vectors that can bypass residual detection, thereby affecting the state estimation results, causing wrong decisions or hiding actual faults. This kind of attack has the characteristics of strong stealth and great destructiveness, and is difficult to identify by traditional anomaly detection methods, making it one of the main information security threats faced by smart grids.
Let be the measurement data of the system after false data injection, and is expressed by the formula:
where represents the original measurement data; represents the attack vector.
The attacker injects the attack vector to change the measurement vector to , making the state estimation value deviate from the true state estimation value . can be expressed as:
where is the state error vector, and non-zero elements correspond to tampered system state variables.
The attacker can design an attack vector satisfying , so that the false measurement can successfully bypass the traditional detection. The residual after the attack is shown in Equation (12).
According to Equation (12), the expression on the right side of the equal sign is completely consistent with the residual value obtained in Equation (8). This means that injecting false data can change the state estimation results of the power grid without causing any change in the measurement residual. Therefore, such attacks can effectively avoid the bad data detection mechanism, thus seriously endangering the stable operation of the power grid.
3. Detection and Localization Method for FDIA Based on GWO-STFFN Model
This section introduces a novel optimization algorithm-based spatiotemporal framework for FDIA detection and localization in smart grids, as illustrated in Figure 1. Centered on GCN and BiLSTM, the model extracts spatial features from measurement data through GCN and temporal features through BiLSTM. Meanwhile, the GWO is introduced to optimize the network hyperparameters, which further elevates the detection and localization accuracy and enhances the model’s detection performance. Finally, the abnormal data can be detected using the extracted spatiotemporal features.
Figure 1.
The overall framework of the proposed detection model.
3.1. Graph Structure Construction and Input Data
This section elaborates on the formulation of the graph adjacency matrix and essential input feature. Data processing is required before detection to construct the power-system data into graph data. Graph modeling is performed on the power system to construct it as an undirected graph . represents the node set of the graph, represents the adjacency matrix of the graph, represents the edge set of the graph.
GCN is used to mine spatial features among power grid nodes, and its input consists of two types of data: the feature matrix and the power grid topology. The feature matrix is , where denotes the number of power grid nodes and represents the length of the time series; the feature dimensions include active and reactive power injected into buses, as well as active and reactive power of branch power flows. The topology input is the adjacency matrix , which is used to characterize the connection relationships between power grid nodes.
where, if nodes and are connected, the corresponding element is 1, otherwise, it is 0;
where and represent the measured values of active power injection and reactive power injection at node .
BiLSTM is utilized to model the long-term temporal dependencies of power grid measurement data. It takes only the measurement feature matrix as input and requires no additional topological information. With the time series length as the temporal parameter, it simultaneously captures the past and future information of the sequence via the bidirectional encoding mechanism.
3.2. Spatiotemporal Feature-Fusion Network
The Spatial-Temporal Feature-Fusion Network (STFFN) combines graph convolutional networks and bidirectional long short-term memory networks to process spatial-temporal graph structure data. GCN is responsible for capturing the spatial topological dependencies between nodes and completing the extraction of spatial features; BiLSTM relies on the gating mechanism to handle long-term sequence dependencies and simultaneously capture historical and future information bidirectionally to complete the extraction of temporal features. By fusing spatial-temporal features, the STFFN model can comprehensively capture the inherent laws of spatial correlation and temporal evolution in spatial-temporal graph data, providing reliable support for complex power-system analysis.
3.2.1. Graph Convolutional Neural Network
As a widely used neural network in the field of deep learning, GCN has significant advantages in large-scale data classification tasks. Applying the GCN model to load forecasting, graph classification, node classification, and other tasks can effectively analyze data from various networks by virtue of its powerful data processing capability, providing a new solution for processing non-Euclidean spatial data.
GCN models the topological structure and node features of the graph through the graph Laplacian matrix. The graph Laplacian matrix is defined as follows:
where is the graph Laplacian matrix, represents the adjacency matrix; represents the degree matrix, whose diagonal element represents the degree of node .
To simplify the calculation, the graph Laplacian matrix is normalized:
where represents the normalized Laplacian matrix, represents the identity matrix, represents the eigenvector matrix of the Laplacian matrix , and represents the diagonal eigenvalue matrix corresponding to .
After completing the above definitions, the complex correlation relationship between nodes is decoupled through the graph convolution operation.
where represents the input signal, and represents the convolution kernel. However, this method has the problem of high computational complexity, and the amount of calculation will increase sharply with the increase of data dimension, and the eigenvalue decomposition process is also time-consuming. To solve this problem, Chebyshev polynomials are introduced, and the equation is approximately calculated by truncating to the K-order expansion:
where , is the maximum eigenvalue of the normalized Laplacian matrix, and represents the Chebyshev coefficient. The convolution operation is further simplified to alleviate the overfitting problem in the training process. By letting and assuming , the following expression is obtained:
where and are free parameters. If , the iterative process may suffer from gradient vanishing or gradient explosion. The model output will decay rapidly as the number of iterations increases, which further leads to issues such as slow convergence of the neural network. Therefore, is normalized to to alleviate the impact of gradient explosion or vanishing:
where is the sum of the adjacency matrix and the N-order identity matrix , representing the adjacency matrix of the graph with self-connection added; is the degree matrix.
where represents the input of the l-th layer, represents the output of the (l + 1)-th layer, and is the sigmoid activation function.
Figure 2 shows the feature extraction process of the graph convolutional network. Starting from the initial input features of each node in the graph, the neighbor information of each node is aggregated according to the adjacency relationship of the graph. The aggregation method usually adopts the normalized adjacency matrix weighted summation. Then, the aggregated neighbor features are combined with the node’s own features, a linear transformation is performed through the weight matrix, and the updated node feature representation is obtained through the activation function, so as to encode the local graph structure information into the new features of the node and realize efficient extraction of graph data.
Figure 2.
Graph Convolutional Neural Network. Input node features are passed through a graph convolution layer, where information is aggregated along the graph edges (solid lines) via message passing (dashed arrows), producing updated node representations. The lines indicate the connectivity and propagation paths for relational feature extraction.
3.2.2. Bidirectional Long Short-Term Memory Network
The long short-term memory network (LSTM) was first introduced by Hochreiter and Schmidhuber in 1997. The fundamental reason LSTM replaced the Recurrent Neural Network (RNN) in prediction tasks is that RNN suffers from severe gradient vanishing and gradient explosion problems when training long sequence data, making it difficult to capture long-term temporal dependencies, only retain short-term information, and difficult to use long-cycle historical data to complete accurate predictions. LSTM introduces cell state and gating structures, such as forget gate, input gate, and output gate, on the basis of RNN, which can independently screen, retain, and transmit long-term effective information through the gating mechanism, fundamentally alleviating the gradient vanishing problem, making training more stable, and effectively learning long-term dependency laws in temporal data. The LSTM model structure is shown in Figure 3.
Figure 3.
Structure Diagram of LSTM. Arrows indicate data flow; recurrent connections pass temporal information, and branching lines represent gated operations (sigmoid/tanh) that update the cell state and hidden state.
In Figure 3, represents the input signal at time step , is the output signal at time step , and represents the cell state at time step . Correspondingly, and are the input signal and cell state at the previous time step , respectively. represents the hyperbolic tangent function, where the cell state plays a key role in maintaining long-term dependencies of time steps.
The forward propagation process of LSTM is:
where is the input gate; is the output gate; is the forget gate; is the cell state; , , , are the weight matrices of the output gate, cell state, forget gate and input gate, respectively; , , , are the bias vectors of the output gate, cell state, forget gate and input gate, respectively; the cell state is regulated by each gating mechanism and updated by combining the previous moment cell state and current input information.
Under the coordination of key gating and memory units, LSTM can finely regulate information flow, thus achieving higher accuracy in FDIA detection. However, when processing long sequence nonlinear data, traditional LSTMs often cannot fully extract the relevant features required for prediction. In contrast, BiLSTM captures bidirectional context information of the past and future in the sequence by running two independent LSTM layers (forward and backward) simultaneously. The forward layer reads historical information in positive time order, and the backward layer interprets future trends in reverse order, which can more comprehensively capture global dependencies and make feature extraction more complete and accurate. BiLSTM also performs well in temporal data analysis, which models long sequences through bidirectional dependencies in temporal data with built-in memory units. In addition, with the help of the gating unit design, BiLSTM can selectively update, forget, and output information, effectively alleviating problems such as gradient vanishing and gradient explosion. As shown in Figure 4, the BiLSTM structure is mainly composed of an input layer, a forward LSTM layer, a backward LSTM layer, and an output splicing layer.
Figure 4.
Structure diagram of the BiLSTM model. Solid arrows indicate the forward and backward temporal passes through LSTM units, while dashed/branching lines represent feature concatenation or output connections. The model processes sequential input in both directions to capture contextual information for each time step.
The hidden state of the forward LSTM at time step is: .
The hidden state of the backward LSTM at time step is: .
After processing the entire sequence, BiLSTM fuses the hidden states of forward and backward propagation to ensure that the output contains important features from both the start and end of the sequence, thus realizing the fusion of bidirectional temporal information.
where represents the weight matrix of the forward LSTM, represents the weight matrix of the backward LSTM, and is the bias vector of the output layer. In this model, the input signal is processed by the forward LSTM and the backward LSTM at the same time, and their outputs are fused to jointly determine the final output .
3.2.3. Spatiotemporal Feature Fusion
Considering the spatial correlation and temporal dependence of power grid data, the spatial features extracted by GCN and the temporal features extracted by BiLSTM can be fused to further improve the representation ability. Specifically, the preprocessed measurement data are taken as the input of the model. In the process of spatial correlation processing, the adjacency matrix is first constructed according to the power grid topological structure, and the corresponding normalized Laplacian matrix is calculated, and then GCN is used to effectively aggregate the information of adjacent nodes.
where and represent the learnable weight matrix and bias vector, respectively.
After completing the spatial feature extraction, BiLSTM is used to model the time series of power grid measurement data, capture the forward and backward dependencies, and extract the temporal features of power grid data.
where and represent the parameter matrix and bias vector of the model, respectively.
To realize the effective fusion of temporal and spatial features and improve the overall feature expression ability, the fusion method adopted in this study is feature interaction based on the Hadamard product, rather than simple feature splicing, and its mathematical expression is:
where and are two learnable weight matrices, and represents element-wise product (Hadamard product).
The STFFN model is mainly composed of three modules: a graph convolutional neural network, a bidirectional long short-term memory network, and a fully connected layer, which can model using both the topological structure and time-series characteristics of the power grid. STFFN uses GCN and BiLSTM modules to mine the spatial and temporal features of power-system data, respectively, and realizes the comprehensive extraction of spatial-temporal features of measurement data through the combination of the two. It effectively solves the problems of insufficient detection accuracy and large positioning deviation under single feature extraction. The network structure of the model is shown in Figure 5, and the overall process is divided into three main stages: spatial feature extraction, temporal feature extraction, and output prediction.
Figure 5.
Structure Diagram of GWO-STFFN Network. Arrows indicate the sequential data flow: topology and node features feed into graph convolution for spatial extraction, followed by temporal extraction, fusion, dense layers, and final output. The pipeline captures both spatial and temporal dependencies for prediction.
3.3. Gray Wolf Optimizer
The gray wolf optimizer is a swarm intelligence-based global optimization algorithm that searches for optimal solutions by simulating the hunting behavior and social hierarchy mechanism of gray wolf populations [36]. GWO boasts the advantages of fast convergence speed, few parameters, simple structure, and strong global search capability. Applying GWO to the hyperparameter optimization of models can automatically search for better parameter combinations without repeated manual trial and error, effectively reducing workload and lowering the time cost of hyperparameter tuning. Gray wolf packs have a strict hierarchical social order, as shown in Figure 6.
Figure 6.
Classification of Gray Wolf Social Hierarchy.
In the GWO algorithm, the optimal solution is denoted as , corresponding to the lead wolf in the pack; the suboptimal solution is denoted as , assisting in decision-making; the third optimal solution is denoted as , obeying and ; the remaining candidate solutions are denoted as , responsible for balancing the population. The hunting process is dominated by , and wolves, and wolves update their positions by following these three leaders to achieve an efficient solution of complex problems. It mathematically models the strict social hierarchy and cooperative hunting behavior of gray wolf packs to realize an efficient search for global optimal solutions. GWO divides the hunting behavior of gray wolves into three stages, namely encircling, hunting, and attacking, with the corresponding mathematical models for each stage as follows:
- (1)
- Encircling the Prey: After a gray wolf discovers prey, it gradually forms an encirclement. This behavior is modeled by the following formulas:where is the current number of iterations; represents the current position of the gray wolf; represents the current position of the prey; represents the distance between the gray wolf and the prey; and are coefficient vectors, with the formulas shown below:where and are random vectors in the interval [0, 1], increasing search randomness; denotes the convergence factor, which linearly decreases from 2 to 0 with the number of iterations.
- (2)
- Hunting Behavior: In the GWO algorithm, the position of the prey is estimated by the positions of , and wolves. Therefore, it is necessary to calculate the distance between each wolf and these three leaders, and update its own position according to their positions:where , , represent the distances between the wolf to be updated and the , , wolves, respectively; , , represent the positions of , , wolves, respectively; , , represent the candidate positions of , , wolves, respectively.
The final updated position is obtained by averaging the above vectors, with the formula as follows:
- (3)
- Attacking the Prey: When the prey stops moving, the gray wolves launch an attack. This stage is realized by the decrease of parameter a: as the iteration proceeds, linearly decreases from 2 to 0, causing the value range of to shrink from [−2, 2] to [0, 0]. When approaches 0, the moving step size of the gray wolf decreases, and it finally converges to the prey position (optimal solution).
To simulate the behavior of gray wolves searching for prey in a wide area, the GWO algorithm utilizes the randomness of the vector: when , gray wolves expand their search scope to explore new areas, helping the algorithm jump out of local optimal solutions and enhance global search capability. When , gray wolves narrow the encirclement to conduct a local search in the current area, which helps accelerate convergence to the optimal solution. Considering the influence of and , the position update mode of gray wolves can be determined, as shown in Figure 7.
Figure 7.
Schematic diagram of gray wolf position update in GWO.
Although introducing GWO for global hyperparameter search eliminates manual trial-and-error and raises the upper limit of model accuracy, it substantially increases the computational burden during model training. GWO maintains multiple “gray wolf” individuals within the hyperparameter space, which means that more than ten times full training epochs are required to complete one round of parameter optimization under identical conditions. In practical industrial scenarios, power grid data are updated daily. If retraining is triggered frequently, the existing single-machine computing resource will fail to meet the time window requirements. A compromise solution to this issue is to adopt an offline-training and online-inference deployment paradigm. Nevertheless, how to guarantee that the offline optimized hyperparameters can adapt to the slow drift of power grid topologies and load characteristics during long-term operation remains to be further investigated.
This model is composed of GWO, GCN, and BiLSTM. In the model training stage, the GWO algorithm is used to optimize the hyperparameters of the network (such as learning rate, etc.). As a heuristic optimization algorithm, GWO can effectively avoid local optimal solutions in the complex solution space and find global optimal solutions. In the model of this study, GWO effectively improves the convergence speed and location detection accuracy of the model by dynamically adjusting hyperparameters. The maximum number of iterations of the optimization process is set to 10 to represent the number of searches; the initial learning rate is set to 0.002, and a dynamic decay mechanism is introduced to adjust the learning rate; the number of training rounds is 300.
Search Space: The search space is defined by four key hyperparameters: (1) Learning rate in [10−6, 10−2] (log-scale); (2) GCN hidden units in [16, 128] (step 16); (3) BiLSTM hidden units in [16, 128] (step 16); (4) L2 regularization in [10−6, 10−3] (log-scale). Population Size: The population size is set to P = 10, consistent with the maximum iteration number T = 10, balancing search diversity and computational cost. Computational Complexity: The overall complexity is O(T × P × C), where C denotes the cost of one full training-validation cycle. With T = 10 and P = 10, the total cost is roughly 100 full training runs. Optimization Time: On our hardware, the complete GWO process takes approximately 12 h for the IEEE 14-bus system and 28 h for the IEEE 118-bus system. This offline cost is acceptable since the optimized hyperparameters are deployed for online inference without additional latency. Convergence Metrics: The final optimal configuration is: learning rate = 1.2 × 10⁻³, GCN hidden units = 64, BiLSTM hidden units = 48, L2 regularization = 5.6 × 10⁻⁵.
3.4. Novelty and Contributions Compared with Existing Works
- (1)
- Fundamental difference in architectural paradigm: parallel versus serial. Existing GCN-LSTM methods generally adopt a serial fusion architecture, in which spatial features extracted by GCN are sequentially fed into the LSTM at each time step. Essentially, this forms a unidirectional information flow dominated by temporal information, with spatial information as an auxiliary. Such a design gradually dilutes spatial topological information during temporal modeling and creates tight coupling between GCN and LSTM: the input of LSTM depends entirely on the output of GCN, making independent optimization of the two modules impossible. The proposed STFFN in this paper adopts a fully parallel two-branch architecture. The GCN branch and BiLSTM branch process input data independently to extract spatial topological features and temporal dependency features, respectively, followed by deep fusion at the feature level. This architecture preserves the distinct physical semantics of each branch: the spatial branch characterizes static topological constraints of the power grid, while the temporal branch reflects dynamic operating trajectories of the system. It eliminates feature entanglement and information loss inherent to serial schemes.
- (2)
- Difference in depth of feature fusion: Hadamard product versus simple concatenation. Most existing GCN-LSTM models merely perform straightforward vector concatenation at the fusion stage. As a linear operation, concatenation fails to model nonlinear interactions between spatial and temporal features. The Hadamard product fusion adopted in this work realizes element-wise multiplicative interactions, which can capture cross-modal correlations of second order and above and yield fused features with stronger discriminative capability.
- (3)
- Extension of task dimension: from detection to localization. The vast majority of existing GCN-LSTM studies only focus on binary detection tasks (identifying whether an attack occurs). This paper expands the problem scope to node-level multi-label localization. Furthermore, a node-adaptive weighting strategy is innovatively introduced for this task to address class imbalance, a scheme that has not been reported in existing literature on FDIA localization.
Remark on Architectural Novelty: While our framework builds upon established components (GCN, BiLSTM), the novelty lies in their problem-specific integration and augmentation. First, the method proposed in this paper is not a simple combination of GCN, BiLSTM, and GWO. Conventional GCN-LSTM architectures employ serial fusion, which sequentially feeds the outputs of GCN into the LSTM. By contrast, we adopt a parallel architecture that completely retains the unique physical semantics of the two modalities. Specifically, spatial adjacency serves as a static topological constraint, whereas temporal measurement data reflect dynamic operating trajectories. This design avoids the feature entanglement commonly seen in serial fusion schemes. Second, the Hadamard product is not merely a fusion technique—it enables multiplicative feature interactions that capture second-order correlations between spatial and temporal patterns, which is particularly effective for detecting stealthy attacks that manifest as coordinated anomalies across both dimensions. This design choice is empirically validated in ablation studies, where removing either branch causes non-trivial performance degradation, confirming that both streams contribute complementary information beyond what a single network can capture.
Compared with Particle Swarm Optimization (PSO), the GWO simulates the strict social hierarchy of wolf packs and the three-layer encircling hunting mechanism. It employs three leading wolves, α, β, and δ, to jointly guide position updates, instead of relying on a single global optimum. This effectively prevents the algorithm from falling into local optima, endowing it with superior balancing capacity between global exploration and local exploitation within the non-convex loss landscapes of deep learning.
When benchmarked against Bayesian Optimization, GWO eliminates the need to construct surrogate models such as Gaussian processes. It can uniformly optimize both continuous hyperparameters (e.g., learning rate) and discrete hyperparameters (e.g., network depth, batch size). This circumvents risks stemming from low surrogate model accuracy or biased initial sampling, while also removing the requirement for special transformations of the search space.
In contrast to the Optuna framework, GWO is a surrogate-free direct search algorithm immune to estimation errors of probabilistic surrogate models, rendering it more robust over highly non-convex search spaces. Relative to grid search, GWO reduces search complexity from exponential to linear order, enabling it to explore a far broader range of hyperparameter combinations under an identical computational budget.
Admittedly, the offline optimization runtime of GWO is approximately ten times that of a single standard training run. Nevertheless, this paper adopts an offline optimization–online inference deployment paradigm: hyperparameter search is only executed offline during model update iterations, whereas the online detection phase merely loads the optimal hyperparameters for forward propagation without incurring extra inference latency. This approach yields globally optimal hyperparameter configurations while preserving real-time detection responsiveness, fully satisfying the dual requirements of accuracy and efficiency in FDIA detection scenarios.
3.5. Detection and Localization Architecture
GWO-STFFN adopts the feature interaction method based on the Hadamard product to complete the deep fusion of spatial and temporal features, avoiding the problems of information redundancy and dimensional disaster caused by simple feature splicing, and generating high-dimensional fused spatial-temporal features with both topological correlation and temporal dependence. After completing the spatial-temporal feature fusion, the fusion feature is input to the fully connected layer, and the classification result is output through the sigmoid activation function to judge whether the power grid data are normal or abnormal.
where is the model output result, is the learnable weight matrix, and is the bias vector. Furthermore, in the training stage of the neural network, a loss function needs to be constructed to calculate errors, and network parameters are updated through back propagation. Since the FDIA detection task is essentially a binary classification problem, dense layers, a sigmoid classifier, and a binary cross-entropy loss function are adopted to realize FDIA detection and classification. The formula of the loss function is given as follows:
where is the batch size, is the actual grid operation status label.
Building upon successful attack detection, we further undertake the precise localization of FDIA. In contrast to the global binary detection task, localization demands the accurate identification of which specific nodes are compromised. This is framed as a multi-label classification problem, as the state of each node is assessed independently, and a single attack can simultaneously affect multiple nodes. For a power system containing N nodes, the model independently predicts the probability of each node being attacked. This results in the localization prediction vector:
where denotes the predicted probability that node is being attacked.
The localization task is formulated as a multi-label classification problem, where each physical bus node corresponds to an independent binary label. For a system with N nodes, the label vector for each sample is y ∈ {0,1}, with indicating that node is under attack and otherwise.
The localization task faces an obvious class imbalance. This imbalance exists both globally, where the number of attack samples is far larger than that of normal samples, and locally, as each node mostly maintains a normal state. Combined with the characteristics of multi-label binary classification tasks, we introduce a node-level weighting strategy to solve this problem:
where represents the count of attacked samples for node n within the training set to alleviate class imbalance.
Subsequently, the weight of each node is utilized to construct the loss function for the localization task. We adopt the weighted binary cross-entropy loss function, and its formula is presented as follows:
where represents the batch size, represents the total number of nodes in the power system, is the probability that node in sample is attacked, and is the real label. The loss function calculates the deviation between the prediction results of all nodes and the real labels, and optimizes the model parameters by minimizing the loss value.
3.6. Detection and Localization Algorithm Based on GWO-STFFN
Based on the above spatiotemporal network using GWO-STFFN, the specific steps for FDIA detection and localization are presented as follows:
Step 1 Data and Graph Structure Preprocessing: Following Equations (13) and (14), the active and reactive power data of grid buses are collected to form the feature matrix. Concurrently, an adjacency matrix is constructed based on the grid topology. The constructed matrix is then expanded to match the dimension of the input data, thereby ensuring alignment between the topological structure and the sample features.
Step 2 Joint Spatiotemporal Feature Extraction: This process first applies graph convolution to input features to extract spatial correlation features according to Equation (24). BiLSTM extracts relevant temporal features from the data based on Equation (25). The extracted spatial and temporal features are fused via Hadamard product as specified in Equation (26). The parallel constructed model architecture guarantees the collaborative extraction of spatial and temporal features.
Step 3 GWO-based Hyperparameter Optimization: It is implemented by simulating the social hierarchy and hunting behavior of gray wolves. Equations (27) and (28) are used to calculate the distance between gray wolves and prey and update their positions. The coefficient vectors are calculated via Equations (29) and (30), the distance is computed by Equation (31), candidate positions are determined using Equation (32), and the final position update is conducted in accordance with Equation (33), which accomplishes global hyperparameter optimization.
Step 4 Attack Detection and Localization: In the detection task, Equation (34) is used to output binary classification results through fully connected layers and the sigmoid function, and the model is optimized by the binary cross-entropy loss function shown in Equation (35). For the localization task, Equation (36) is first adopted to obtain the probability prediction vector of attacked buses. Then, the node-level weighting strategy in Equation (37) is applied to solve the class imbalance problem, and the weighted binary cross-entropy loss function in Equation (38) is utilized for multi-label classification optimization. Model parameters are updated via back propagation using the Adam optimizer and cosine annealing learning rate scheduler.
4. Simulation Results and Analysis
Simulation experiments are carried out using IEEE 14-bus system and IEEE 118-bus system data to evaluate the performance of the constructed model. The simulation experiments are performed on a laptop equipped with an AMD Ryzen 7 7840H processor, Radeon 780M integrated graphics card, and 16GB RAM. The software environment includes Python 3.10, PyTorch 2.0.0, and images are drawn by MATLAB R2023a after reading Python simulation results.
4.1. Data Processing
To simulate real power grid conditions, this section uses the actual load data of the CAPITL region provided by NYISO. The dataset covers 365 days (January to December 2021), with measurements recorded every 10 min. The MATPOWER 7.0 toolbox is utilized to conduct AC power flow calculation and state estimation for generating measurement samples under normal operating conditions. The attack vectors are constructed based on the principles described in Section 2.3. Specifically, the attack is realized by modifying the original measurement vector z to z + a, where the attack vector a is generated to satisfy a = H c. This construction ensures that the injected false data can bypass the traditional residual-based bad data detection mechanism. All attacks are generated under the AC state estimation model, which is more consistent with real grid operations compared to the simplified DC model. To simulate the stealth characteristic of real-world attacks, the attack vector is restricted to alter only the measurements of partial nodes. For each attack sample, 1 to 3 target nodes are randomly selected from all N nodes. The attack magnitude follows a uniform distribution ranging from 5% to 20% of the nominal operating values of corresponding nodes, while the measurements of unselected nodes remain unchanged. Target nodes are chosen via a random selection strategy to ensure that all nodes in the dataset share roughly equal probabilities of being compromised. The above settings are adopted to mimic practical adversarial attacks. The complete processing workflow of load data at each time step is elaborated as follows:
- (1)
- Write the load data of each bus into the case file structure of MATPOWER, and update the corresponding P and Q parameters of load buses;
- (2)
- Invoke the runpf function of MATPOWER to perform AC power flow calculation, and obtain system state variables including bus voltage magnitudes and phase angles, as well as active and reactive power flows on all branches;
- (3)
- On the basis of power flow results, call the runse function to implement WLS state estimation, and construct the measurement vector containing bus injected active/reactive power and branch active/reactive power flows.
Gaussian white noise is superimposed on the true power flow values to mimic practical measurement errors, where the standard deviation of the noise ranges from 2% of the corresponding measurement value. One complete measurement sample is generated for each time step, and a benchmark dataset consisting of 52,560 samples is finally established. All 52,560 samples are chronologically split into a training set, a validation set, and a test set at a ratio of 6:2:2. The training set contains 31,536 samples, while the validation set and test set each consist of 10,512 samples. The input sequence length is set to 24 (corresponding to a 4 h period with one sampling point every 10 min). Samples are generated via a sliding window approach with a step size of 1. Both measurement data and network topology are used as system inputs. All measurement data are normalized using the Min-Max scaler to the range [0, 1] before being fed into the model, with the scaling parameters fitted exclusively on the training set. To reflect the concealment of FDIA in the real world, the ratio of normal to attacked samples is heavily imbalanced. Specifically, among the total generated samples, only 10% are injected with FDIA, while the remaining 90% are normal operational data. The robustness of the model is further evaluated under different measurement noises. Through the above methods, a FDIA dataset supported by real data is generated to evaluate the performance of the proposed model.
4.2. Evaluation Metrics
Four metrics are used to evaluate the performance of the model: Accuracy (Acc), Precision (Pre), Recall (Rec), and F1-Score. The calculation formulas are as follows:
where TP, TN, FP, and FN represent the number of true positives, true negatives, false positives, and false negatives, respectively; T and F are used to reflect whether the prediction result is correct (correct is T, wrong is F); P and N represent the positive and negative categories of the sample, respectively.
In classification tasks, accuracy is an intuitive evaluation index. The higher the value of this index, the better the detection effect of the model. F1-Score takes both precision and recall into account, and the higher the value, the better the comprehensive performance of the model.
To further evaluate the accuracy of node-level attack localization, we introduce a localization accuracy metric. The localization accuracy of a single node is defined as:
4.3. Ablation Experiment
To evaluate the contribution of each component to the overall performance of the model, this section designs ablation experiments by removing the three components of GWO, GCN, and BiLSTM from the GWO-STFFN model, respectively. For the IEEE 14-bus and IEEE 118-bus systems, the F1-Score is evaluated after individually removing each major component to assess its impact on model performance.
The experimental results are shown in Table 1. The results show that the GWO-STFFN model achieves the best performance, with F1-Score reaching 98.55% and 95.72% on the IEEE 14-bus system and IEEE 118-bus system, respectively. After removing the GWO module, the F1-Score decreases by 0.78% and 1.12% on the two systems, respectively, highlighting the key role of GWO in hyperparameter optimization, especially in more complex systems. Removing the GCN module reduces the F1-Score by 0.20% and 0.28%, respectively, indicating the effectiveness of GCN in extracting spatial correlations from graph structure data. Similarly, removing the BiLSTM module causes the F1-Score to decrease by 0.11% and 0.20%, respectively, proving its contribution to enhancing temporal feature extraction. The absence of any component leads to a decrease in F1-Score to varying degrees. The synergistic effect of the three components significantly improves the overall performance of the model, which fully verifies the effectiveness of the GWO-STFFN model.
Table 1.
Ablation Experiment Results.
Rationale for GWO Adoption: The marginal performance gain from GWO in ablation studies should be interpreted in context. First, the baseline STFFN already achieves strong performance, leaving limited room for improvement—any further gain is inherently challenging. Second, and more importantly, GWO’s primary value lies in hyperparameter automation and training stability, not merely in peak accuracy. Manual hyperparameter tuning is not only labor-intensive but also highly dependent on prior experience and often yields suboptimal configurations, especially when the model is deployed across different grid topologies (e.g., from 14-bus to 118-bus systems). GWO systematically explores the search space and identifies robust parameter combinations, ensuring consistent performance without expert intervention. Third, the computational overhead of GWO is approximately 10 times that of a single conventional training run, which mainly arises from the parallel search of wolf populations. Such overhead is acceptable under offline training scenarios. To reduce the computational burden introduced by GWO, this paper adopts an offline training plus online learning mode for practical engineering deployment. Specifically, GWO hyperparameter optimization is only carried out offline during model update iterations. In the online detection phase, only the optimized hyperparameters obtained from the searching process are loaded to perform forward propagation.
4.4. Visualization of Spatial-Temporal Features Under FDIA
To illustrate the detection mechanism of the proposed GWO-STFFN model, this section uses consistent system, load, attack, and model configurations to compare the evolution of spatial-temporal features in line measurements before and after FDIA. For clarity, Figure 8 and Figure 9 show the first 1000 consecutive time steps of the IEEE 14-bus system (28 features) and the IEEE 118-bus system (236 features), respectively. Under normal operation, the measurement data of both systems show smooth, continuous, and periodic spatial-temporal patterns, reflecting the stable changes of power grid load and power flow, as shown in Figure 8a,b. In contrast, when subjected to FDIA, these regular patterns are significantly disrupted: abnormal injection introduces sudden outliers, discontinuous jumps, and local distortions at specific time points and spatial nodes, forming unique attack footprints in the spatial-temporal dimension, as shown in Figure 9a,b. By jointly modeling these local anomalies and their global propagation effects, the model learns to closely align its predictions with the true attack labels, thereby achieving high-precision FDIA detection and location.
Figure 8.
Comparison of spatiotemporal features of the IEEE 14-bus system before and after the attack.
Figure 9.
Comparison of spatiotemporal features of the IEEE 118-bus system before and after the attack.
4.5. Model Detection Performance
For fair comparison, all baseline models (GCN-LSTM [28], GGNN-GAT [27], and GCN [26]) are implemented under the same software environment and trained with the same split. The number of hidden units is set to 64 for each model, the initial learning rate is 0.002, and the Adam optimizer is adopted. The hyperparameters of baselines are kept as recommended in their original papers without additional tuning. To verify the performance of the GWO-STFFN model, this section compares it with several widely used graph neural network detection models, including GCN-LSTM [28], GGNN-GAT [27], and GCN [26]. GCN [26] only adopts graph convolutional networks to extract the spatial topological correlation features of power grids, without introducing a temporal feature extraction module, and serves as a baseline model for single spatial feature detection. GGNN-GAT [27] fuses GGNN and GAT, optimizes feature extraction by combining power grid topology information with an attention mechanism, and fails to realize the deep fusion of spatiotemporal features. GCN-LSTM [28] fuses GCN and LSTM in a series structure, only performs simple concatenation of spatiotemporal features, and neither uses the Hadamard product for deep fusion nor introduces swarm intelligence algorithms to optimize hyperparameters. Experiments are carried out on the IEEE 14-bus system and the IEEE 118-bus system, respectively. Acc, Rec, Pre, and F1-Score are used to evaluate the performance of the detection model.
The experimental results show that the GWO-STFFN model outperforms other comparison models in both the IEEE 14-bus system and the IEEE 118-bus power system. To evaluate the performance of the GWO-STFFN detection model, this section compares it with common detection models such as GCN-LSTM [28], GGNN-GAT [27], and GCN [26], and carries out simulation experiments on the IEEE 14-bus system and the IEEE 118-bus system to comprehensively evaluate the GWO-STFFN model and each comparison model. As shown in Figure 10, all evaluation indicators of the GWO-STFFN model are better than those of the comparison models. The model has an accuracy of 99.17%, a recall of 99.21%, a precision of 99.15%, and an F1-Score of 99.18%, all of which are better than other models.
Figure 10.
Detection Results of the IEEE 14-bus system.
The results show that the GWO-STFFN model has good detection performance and can accurately identify FDIA in the IEEE 14-bus system. Figure 11 shows the detection results of the IEEE 118-bus system. It can be seen that the GWO-STFFN model has an accuracy of 97.57%, a recall of 97.70%, a precision of 97.51%, and an F1-Score of 97.61%. It is worth noting that the accuracy of the GCN [28] model is only 92.37%. In summary, the GWO-STFFN model can also accurately detect FDIA in complex systems. As can be seen from Figure 10 and Figure 11, the detection performance of the GWO-STFFN model is significantly better than that of the GCN [26] model, indicating that the fusion of spatial-temporal feature extraction can greatly improve the model detection ability. The results of the GCN-LSTM [28] model further verify the effectiveness of spatial-temporal feature fusion in improving detection performance.
Figure 11.
Detection Results of the IEEE 118-bus system.
4.6. Attack Location Performance Analysis of the Detection Model
To verify the feasibility of the proposed method in the precise location of FDIA, this section carries out attack location simulation experiments on the IEEE 14-bus system and IEEE 118-bus system, and compares the GWO-STFFN model with models such as GCN-LSTM [28], GGNN-GAT [27], and GCN [26]. The simulation results are shown in Figure 12. The figure shows the node location accuracy of each model on the two test systems.
Figure 12.
Node Localization Accuracy of Different Systems.
The results show that the GWO-STFFN model achieves the highest location accuracy and the most stable performance on all nodes. In contrast, the accuracy of other comparison models fluctuates significantly on different nodes, especially in the IEEE 118-bus system with a larger power grid scale and more complex topological structure. The experimental results confirm that by fusing spatial-temporal features and optimizing hyperparameters with the optimization algorithm, the GWO-STFFN model can better present the attack propagation law under the power grid topology, and then realize a more precise location of node attacks. Therefore, the proposed model not only has advantages in small-scale power systems but also can maintain good performance in large-scale power grids.
To evaluate the comprehensive performance of each model in multi-label binary classification tasks, Figure 13 shows the Hamming Loss curve of each model on the test set. Hamming Loss reflects the proportion of misclassified labels, and the smaller the value, the higher the location accuracy. As shown in Figure 13, the Hamming Loss of the GWO-STFFN model on both test systems is significantly lower than that of all benchmark models, indicating that the proposed model can more effectively learn the dependency relationship between node states through joint training of spatial-temporal modules and improve the stability of multi-label binary classification. It is worth noting that in the IEEE 118-bus system with a more complex topological structure, the performance advantage of GWO-STFFN is more prominent, further verifying its strong generalization ability in processing large-scale graph data.
Figure 13.
Comparison of Hamming Loss Between IEEE 14-bus and IEEE 118-bus systems.
In addition, Figure 14 shows the ROC curves and corresponding AUC values of each model on the IEEE 14-bus system and the IEEE 118-bus system. The closer the ROC curve is to the upper left corner and the higher the AUC value, the better the classification effect, i.e., the stronger the model’s ability to distinguish FDIA samples from normal power grid operation samples and the better the detection performance. As shown in Figure 14, the proposed GWO-STFFN method achieves the optimal ROC curve position and the highest AUC value in both system scenarios. In the IEEE 14-bus system, the AUC value of GWO-STFFN reaches 99.95%, which is 1.21%, 4.58% and 12.12% higher than that of GCN-LSTM [28], GGNN-GAT [27] and GCN [26], respectively; in the IEEE 118-bus system, its AUC value is still as high as 98.93%, exceeding the above three comparison models by 0.59%, 5.12% and 12.88%, respectively.
Figure 14.
ROC Curves of Each Detection Model.
The experimental results fully show that the GWO-STFFN model not only has a high recognition rate for FDIA but also can accurately capture the abnormal spatial-temporal features of the attack and avoid being covered by the normal operation fluctuation of the power grid. By learning spatial-temporal dependencies, the model can effectively distinguish the normal operation state of the power grid (such as conventional tie-line power fluctuation, small load change) from the real attack mode, thereby reducing the unnecessary cost of security response. The experimental results also further verify the excellent generalization performance of the GWO-STFFN model. Combined with its balanced ROC curve, the model achieves a good balance between accurately identifying attacks and reducing false alarms under normal scenarios, showing reliable, comprehensive performance in attack detection and location tasks.
In summary, the GWO-STFFN model has significant advantages in the precise location of FDIA: it not only achieves the highest and most stable node location accuracy, but also is superior to other comparison models in many evaluation indicators such as Hamming Loss and ROC performance. This advantage is mainly due to the deeply fused spatial-temporal feature extraction mechanism of the model, which can simultaneously capture the dynamic evolution law of the attack in the temporal dimension and the propagation path in the spatial topology, providing an effective technical solution for the rapid and precise location and isolation of faults in power systems under collaborative stealth attack scenarios.
4.7. Preliminary Robustness Analysis
This section provides a preliminary assessment of the proposed GWO-STFFN model under different noise intensities. In the IEEE 14-bus system and IEEE 118-bus system, the robustness of the proposed model under different noise intensities is further verified. The environmental data noise intensities are set to 0, 5%, 10%, 15% and 20%, respectively, and the performance of the GWO-STFFN model and other models under different noise intensities is tested. The results are shown in Figure 15 and Figure 16, respectively. With the increase of noise intensity, the accuracy of the proposed model shows a gentle downward trend, while the accuracy of the GCN [26] model declines rapidly. The reason for this is that in a high-noise environment, the GCN [26] model is difficult to distinguish normal measurement data from noise-polluted measurement data. In contrast, the accuracy of the GWO-STFFN model is significantly higher than that of all comparison models. It is worth noting that for the IEEE 14-bus system, even when the noise intensity reaches 20%, the accuracy of the proposed model remains above 90%. The experimental results show that the GWO-STFFN model has stronger anti-noise ability.
Figure 15.
Influence of Different Noise Intensities on Accuracy in the IEEE 14-bus system.
Figure 16.
Influence of Different Noise Intensities on Accuracy in the IEEE 118-bus system.
In addition, the proposed model shows the smallest accuracy fluctuation with noise level, indicating stronger stability. For example, in the IEEE 14-bus system, when the noise increases from 15% to 20%, its accuracy only decreases by 1.87%, while the GCN [26] model decreases by nearly 10% in the same range. In summary, the model not only has good performance in a noise-free environment but also can maintain high accuracy when noise increases, showing strong robustness and operational stability.
4.8. Statistical Significance Tests and Computational Efficiency Analysis
Statistical Significance Tests: To rigorously validate the superiority of the proposed GWO-STFFN model, we conduct statistical significance tests following standard practices in machine learning literature. All experiments are repeated with 10 different random seeds (42, 123, 456, 789, 1024, 2048, 4096, 8192, 16,384, 32,768) and the same train/validation/test split. For each run, we record the F1-Score, AUC, and Accuracy on the test set. Then, we perform paired two-tailed t-tests between GWO-STFFN and each baseline model at the significance level 0.05.
As summarized in Table 2, all p-values are below the 0.05 threshold on both IEEE 14-bus and IEEE 118-bus systems, indicating that the performance improvements of GWO-STFFN over all baseline models are statistically significant. Notably, the smallest margin is observed between GWO-STFFN and GCN-LSTM on the IEEE 118-bus system, yet it still falls below the significance threshold. These results confirm that the observed advantages are not attributable to random variation but reflect genuine algorithmic superiority.
Table 2.
Statistical Significance Test Results (p-values of paired t-tests against GWO-STFFN).
For binary detection tasks, we additionally employ McNemar’s test to assess whether the two classifiers make significantly different predictions on the same test set. The test statistic yields χ2 values of 21.3 (vs. GCN-LSTM), 46.7 (vs. GGNN-GAT), and 78.5 (vs. GCN) on the IEEE 14-bus system, all exceeding the critical value of 3.84 for degrees of freedom (df = 1) at p = 0.05, further corroborating the significant differentiation of our method.
Computational Efficiency Analysis: GWO maintains multiple ‘gray wolf’ individuals within the hyperparameter space (the population size is set to 10 in this paper), which means that more than ten times full training epochs are required to complete one round of parameter optimization.
The time consumption of offline optimization based on GWO is approximately ten times that of a single conventional model training in Table 3. Nevertheless, this paper adopts an engineering deployment scheme combining offline optimization and online inference: hyperparameter search is only performed in the offline phase of model iterative update; only the optimal hyperparameters are loaded to complete forward propagation during the online detection phase, without introducing additional inference latency. The proposed method can not only obtain the globally optimal hyperparameter combination, but also guarantee the response speed of real-time detection, which fully meets the dual requirements of accuracy and real-time performance in the scenario of false data injection attack detection.
Table 3.
Analysis of Computational Efficiency.
5. Conclusions
This paper proposes a FDIA detection and localization method for smart grids based on the GWO-STFFN. By employing a graph convolutional network to extract spatial topological correlations and bidirectional long short-term memory to capture temporal dependencies, and further fusing these features via the Hadamard product, the model effectively overcomes the limitation of single-dimensional feature representation. The introduction of GWO enables automatic global hyperparameter tuning, eliminating inefficient manual search and improving both detection accuracy and node localization precision. Extensive simulations on IEEE 14-bus and IEEE 118-bus systems demonstrate that GWO-STFFN achieves F1-Score of 98.55% and 95.72%, AUC values of 99.95% and 98.93%, respectively, along with lower Hamming Loss and superior robustness under noise intensities up to 20%, significantly outperforming existing baseline models in terms of detection performance and localization stability.
Despite the promising results in localization, we acknowledge several limitations. First, due to the exploratory nature of our localization module, we have not yet conducted exhaustive comparisons with state-of-the-art dedicated localization algorithms, nor have we provided node-level confusion matrices. We consider this a critical direction for our forthcoming research. Second, the current localization evaluation is primarily based on node-wise accuracy, Hamming Loss, and ROC curves; a more comprehensive metric set including Subset Accuracy and Macro/Micro F1 will be systematically investigated in future implementations. Future research can be conducted in the following directions: verify the practical applicability of the model with real power grid data under more diverse coordinated attack scenarios; explore advanced swarm intelligence algorithms or adaptive strategies to improve the computational efficiency of the optimization module; and integrate the detection and localization framework with near-real-time defense and attack resilience control mechanisms to construct a closed-loop protection architecture.
Author Contributions
Methodology, Y.L. and X.W.; Software, J.P.; Validation, J.P.; Resources, Y.L. and X.W.; Data curation, J.P., Y.L. and X.W.; Writing—original draft, J.P., Y.L. and X.W.; Project administration, J.P. and X.W. All authors have read and agreed to the published version of the manuscript.
Funding
This research was funded by the Key Research and Development Program of Xuzhou City for Modern Agriculture Project: Research and Application of Electric, Efficient, Intelligent Mechanical Weeding Robots. The project number is KC23133. And The APC was funded by MDPI.
Data Availability Statement
The original contributions presented in the study are included in the article, further inquiries can be directed to the corresponding author.
Conflicts of Interest
The authors declare no conflict of interest.
References
- Harkat, H.; Camarinha-Matos, L.M.; Goes, J.; Ahmed, H.F. Cyber-physical systems security: A systematic review. Comput. Ind. Eng. 2024, 188, 109891. [Google Scholar] [CrossRef]
- Wang, X.; Geng, Y.; Luo, X.; Guan, X. Detection of dummy data injection attacks by using particle swarm optimization-attention temporal graph convolutional network model in power system. Eng. Appl. Artif. Intell. 2026, 171, 114259. [Google Scholar] [CrossRef]
- Hasan, M.K.; Habib, A.A.; Shukur, Z.; Ibrahim, F.; Islam, S.; Razzaque, A. Review on cyber-physical and cyber-security system in smart grid: Standards, protocols, constraints, and recommendations. J. Netw. Comput. Appl. 2023, 209, 103540. [Google Scholar]
- Manandhar, K.; Cao, X.; Hu, F.; Liu, Y. Detection of faults and attacks including false data injection attack in smart grid using Kalman filter. IEEE Trans. Control Netw. Syst. 2014, 1, 370–379. [Google Scholar] [CrossRef]
- Sridhar, S.; Hahn, A.; Govindarasu, M. Cyber–physical system security for the electric power grid. Proc. IEEE 2011, 100, 210–224. [Google Scholar] [CrossRef]
- Feng, L.; Bodanbai, S.; Bo, Y. Data Security Risk Analysis and Protection of New Power System. In Proceedings of the 2024 IEEE 7th Information Technology, Networking, Electronic and Automation Control Conference (ITNEC), Chongqing, China, 20–22 September 2024; Volume 7, pp. 222–226. [Google Scholar]
- Meyer, G.J.; Lorz, T.; Wehner, R.; Jaeger, J.; Dauer, M.; Krebs, R. Hybrid fuzzy evaluation algorithm for power system protection security assessment. Electr. Power Syst. Res. 2020, 189, 106555. [Google Scholar] [CrossRef]
- Foroutan, S.A.; Salmasi, F.R. Detection of false data injection attacks against state estimation in smart grids based on a mixture Gaussian distribution learning method. IET Cyber-Phys. Syst. Theor. Appl. 2017, 2, 161–171. [Google Scholar] [CrossRef]
- Zhao, L.; Yuan, H.; Xu, K.; Bi, J.; Li, B.H. Hybrid network attack prediction with Savitzky–Golay filter-assisted informer. Expert Syst. Appl. 2024, 235, 121126. [Google Scholar]
- Qu, Z.; Yang, J.; Wang, Y.; Georgievitch, P.M. Detection of false data injection attack in power system based on Hellinger distance. IEEE Trans. Ind. Inf. 2023, 20, 2119–2128. [Google Scholar] [CrossRef]
- Li, J.; Wu, S.; Zhou, H.; Luo, X.; Wang, T.; Liu, Y.; Ma, X. Packet-Level Open-World App Fingerprinting on Wireless Traffic. In Proceedings of the 29th Network and Distributed System Security Symposium (NDSS), San Diego, CA, USA, 24–28 April 2022; pp. 1–18. [Google Scholar]
- Hao, J.; Kang, E.; Sun, J.; Wang, Z.; Meng, Z.; Li, X.; Ming, Z. An adaptive Markov strategy for defending smart grid false data injection from malicious attackers. IEEE Trans. Smart Grid 2016, 9, 2398–2408. [Google Scholar] [CrossRef]
- Ni, T.; Chen, Y.; Xu, W.; Xue, L.; Zhao, Q. XPorter: A Study of the Multi-Port Charger Security on Privacy Leakage and Voice Injection. In Proceedings of the 29th Annual International Conference on Mobile Computing and Networking, Madrid Spain, 2–6 October 2023; pp. 1–15. [Google Scholar]
- Wang, X.; Zhu, H.; Luo, X.; Guan, X. Data-Driven-Based Detection and Localization Framework Against False Data Injection Attacks in DC Microgrids. IEEE Internet Things J. 2025, 12, 36079–36093. [Google Scholar]
- Li, J.; Zhou, H.; Wu, S.; Luo, X.; Wang, T.; Zhan, X.; Ma, X. FOAP: Fine-Grained Open-World Android App Fingerprinting. In Proceedings of the 31st USENIX Security Symposium (USENIX Security 22), Boston, MA, USA, 10–12 August 2022; pp. 2631–2648. [Google Scholar]
- Liu, Y.; Ning, P.; Reiter, M.K. False data injection attacks against state estimation in electric power grids. ACM Trans. Inf. Syst. Secur. 2011, 14, 1–33. [Google Scholar] [CrossRef]
- Hug, G.; Giampapa, J.A. Vulnerability assessment of AC state estimation with respect to false data injection cyber-attacks. IEEE Trans. Smart Grid 2012, 3, 1362–1370. [Google Scholar] [CrossRef]
- Chaojun, G.; Jirutitijaroen, P.; Motani, M. Detecting false data injection attacks in AC state estimation. IEEE Trans. Smart Grid 2015, 6, 2476–2483. [Google Scholar] [CrossRef]
- Belik, M.; Rubanenko, O.; Rubanenko, O. Prerequisites for the Creation of Digital Twin in the Tasks of Determining the Technical Condition of Power Transformers in Specific Operating Conditions. Przegląd Elektrotechniczny 2023, 99, 180–187. [Google Scholar]
- Giani, A.; Bitar, E.; Garcia, M.; McQueen, M.; Khargonekar, P.; Poolla, K. Smart grid data integrity attacks. IEEE Trans. Smart Grid 2013, 4, 1244–1253. [Google Scholar] [CrossRef]
- Ni, T.; Lan, G.; Wang, J.; Zhao, Q.; Xu, W. AppListener: Eavesdropping mobile app activity via radio-frequency energy harvesting. In Proceedings of the 32nd USENIX Security Symposium (USENIX Security 23), Anaheim, CA, USA, 9–11 August 2023; pp. 5243–5260. [Google Scholar]
- Li, X.; Hu, L.; Lu, Z. Detection of false data injection attack in power grid based on spatial-temporal transformer network. Expert Syst. Appl. 2024, 238, 121706. [Google Scholar]
- Narang, J.K.; Bag, B. Physical model learning based false data injection attack on power system state estimation. Sustain. Energy Grids Netw. 2024, 40, 101524. [Google Scholar] [CrossRef]
- Li, J.; Li, H.; Su, Q. Dynamic load altering attack detection for cyber physical power systems via sliding mode observer. Int. J. Electr. Power Energy Syst. 2023, 153, 109320. [Google Scholar] [CrossRef]
- Varmaziari, H.; Dehghani, M. Cyber attack detection in PMU networks exploiting the combination of machine learning and state estimation-based methods. In Proceedings of the 2021 11th Smart Grid Conference (SGC), Tabriz, Iran, 7–9 December 2021; pp. 1–6. [Google Scholar]
- Mohamed, A.; Heilala, J.; Madonsela, N.S. Machine Learning-Based Intrusion Detection Systems for Enhancing Cybersecurity. In Proceedings of the 2023 Second International Conference on Smart Technologies for Smart Nation (SmartTechCon), Singapore, 18–19 August 2023; pp. 366–370. [Google Scholar]
- Boyaci, O.; Umunnakwe, A.; Sahu, A.; Narimani, M.R.; Ismail, M.; Davis, K.R.; Serpedin, E. Graph neural networks based detection of stealth false data injection attacks in smart grids. IEEE Syst. J. 2021, 16, 2946–2957. [Google Scholar] [CrossRef]
- Takiddin, A.; Atat, R.; Ismail, M.; Boyaci, O.; Davis, K.R.; Serpedin, E. Generalized graph neural network-based detection of false data injection attacks in smart grids. IEEE Trans. Emerg. Top. Comput. Intell. 2023, 7, 618–630. [Google Scholar] [CrossRef]
- Liao, W.; Bak-Jensen, B.; Pillai, J.R.; Wang, Y.; Wang, Y. A review of graph neural networks and their applications in power systems. J. Mod. Power Syst. Clean Energy 2021, 10, 345–360. [Google Scholar]
- Vincent, E.; Korki, M.; Seyedmahmoudian, M.; Stojcevski, A.; Mekhilef, S. Detection of false data injection attacks in cyber–physical systems using graph convolutional network. Electr. Power Syst. Res. 2023, 217, 109118. [Google Scholar] [CrossRef]
- Li, X.; Wang, Y.; Lu, Z. Graph-based detection for false data injection attacks in power grid. Energy 2023, 263, 125865. [Google Scholar]
- Behnam, R.; Baghaee, H.R.; Gharehpetian, G.B. GCN-LSTM-based detection of data integrity cyberattacks on STATCOM. Comput. Electr. Eng. 2026, 129, 110809. [Google Scholar]
- Ashok, A.; Govindarasu, M. Cyber attacks on power system state estimation through topology errors. In Proceedings of the 2012 IEEE Power and Energy Society General Meeting, San Diego, CA, USA, 22–26 July 2012; pp. 1–8. [Google Scholar]
- Bhalla, V.; Prajapat, G.P.; Harsh, A. Bad data detection enabled estimation based PSS for a grid connected generator. e-Prime Adv. Electr. Eng. Electron. Energy 2025, 11, 100921. [Google Scholar] [CrossRef]
- Wang, J.; Chen, H.; Si, Y.; Zhu, Y.; Zhu, T.; Yin, S.; Liu, B. FDIA localization and classification detection in smart grids using multi-modal data and deep learning technique. Comput. Electr. Eng. 2024, 119, 109572. [Google Scholar] [CrossRef]
- Jiang, W.; Liu, Z.; Wang, Y.; Lin, Y.; Li, Y.; Bi, F. Enhancing jamming source tracking capability via adaptive grey wolf optimization mechanism for passive radar network. Signal Process. 2025, 235, 110026. [Google Scholar] [CrossRef]
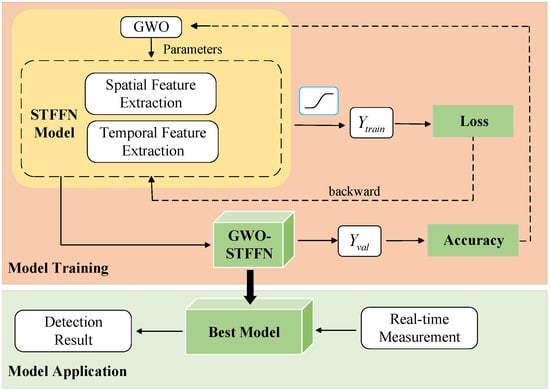
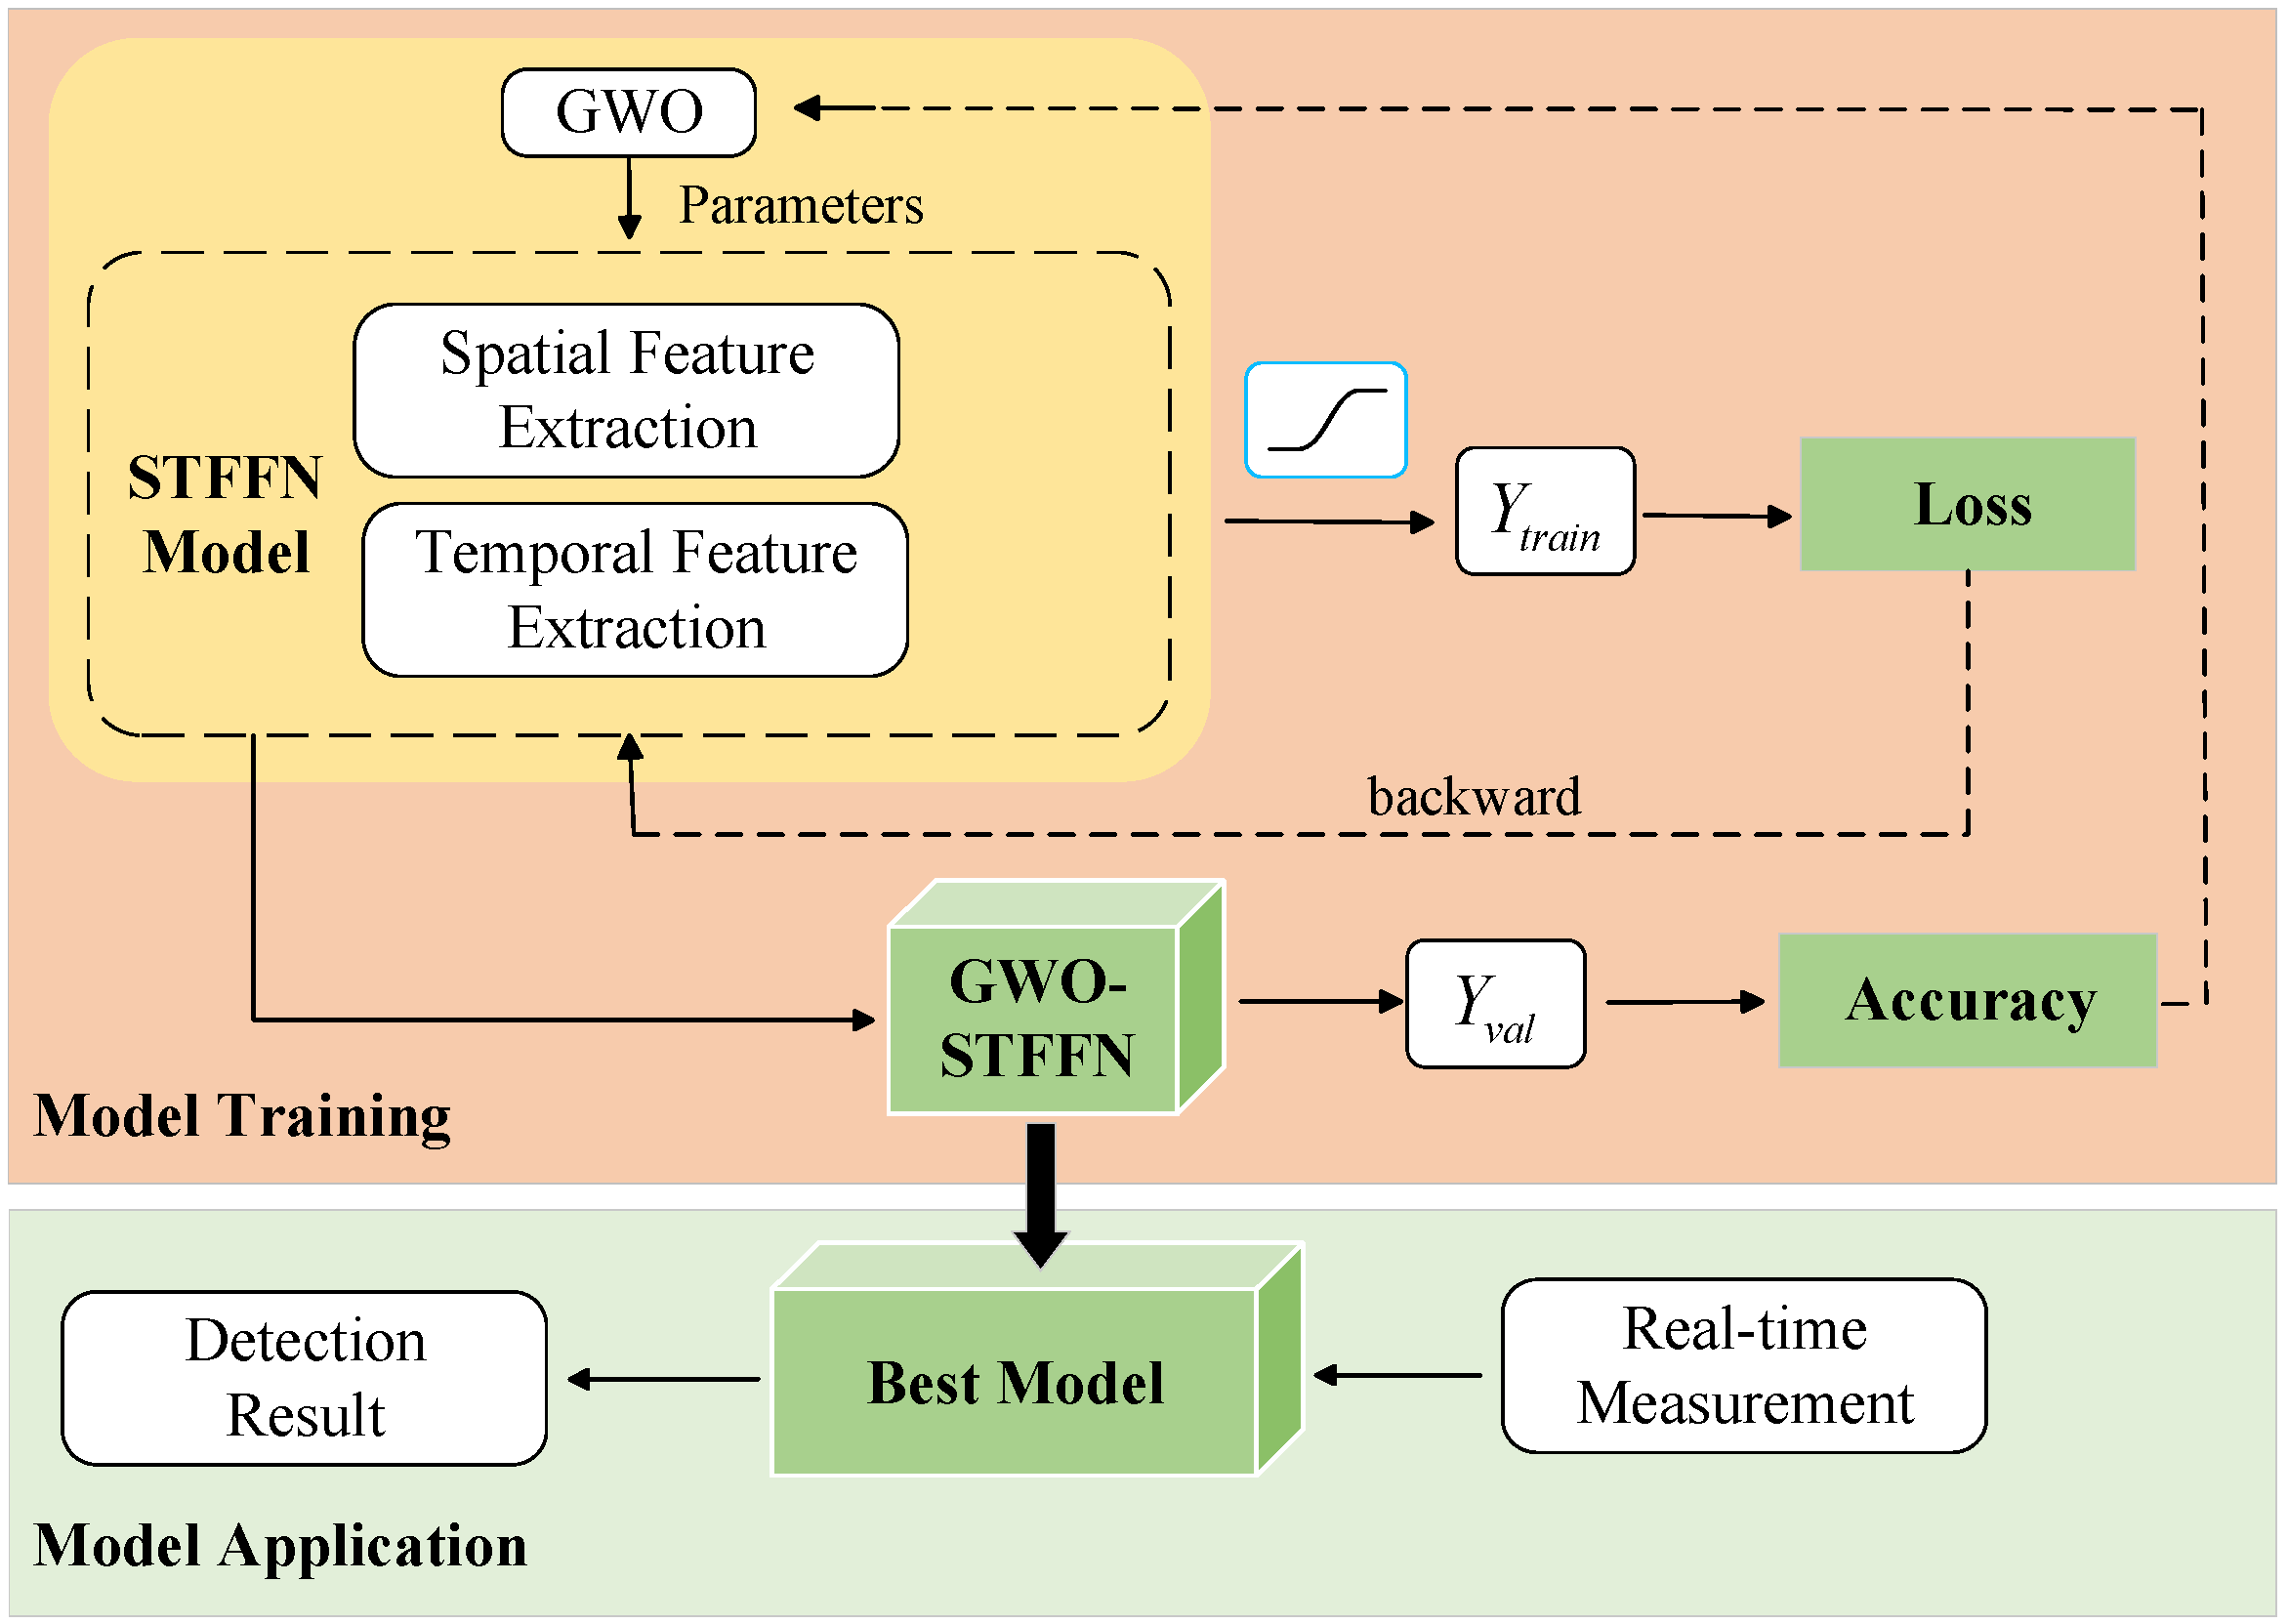
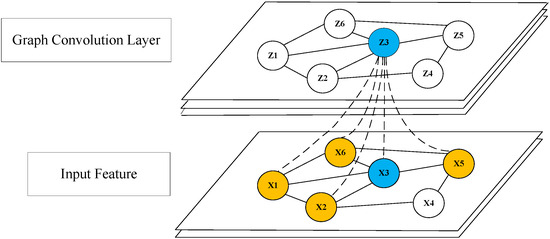
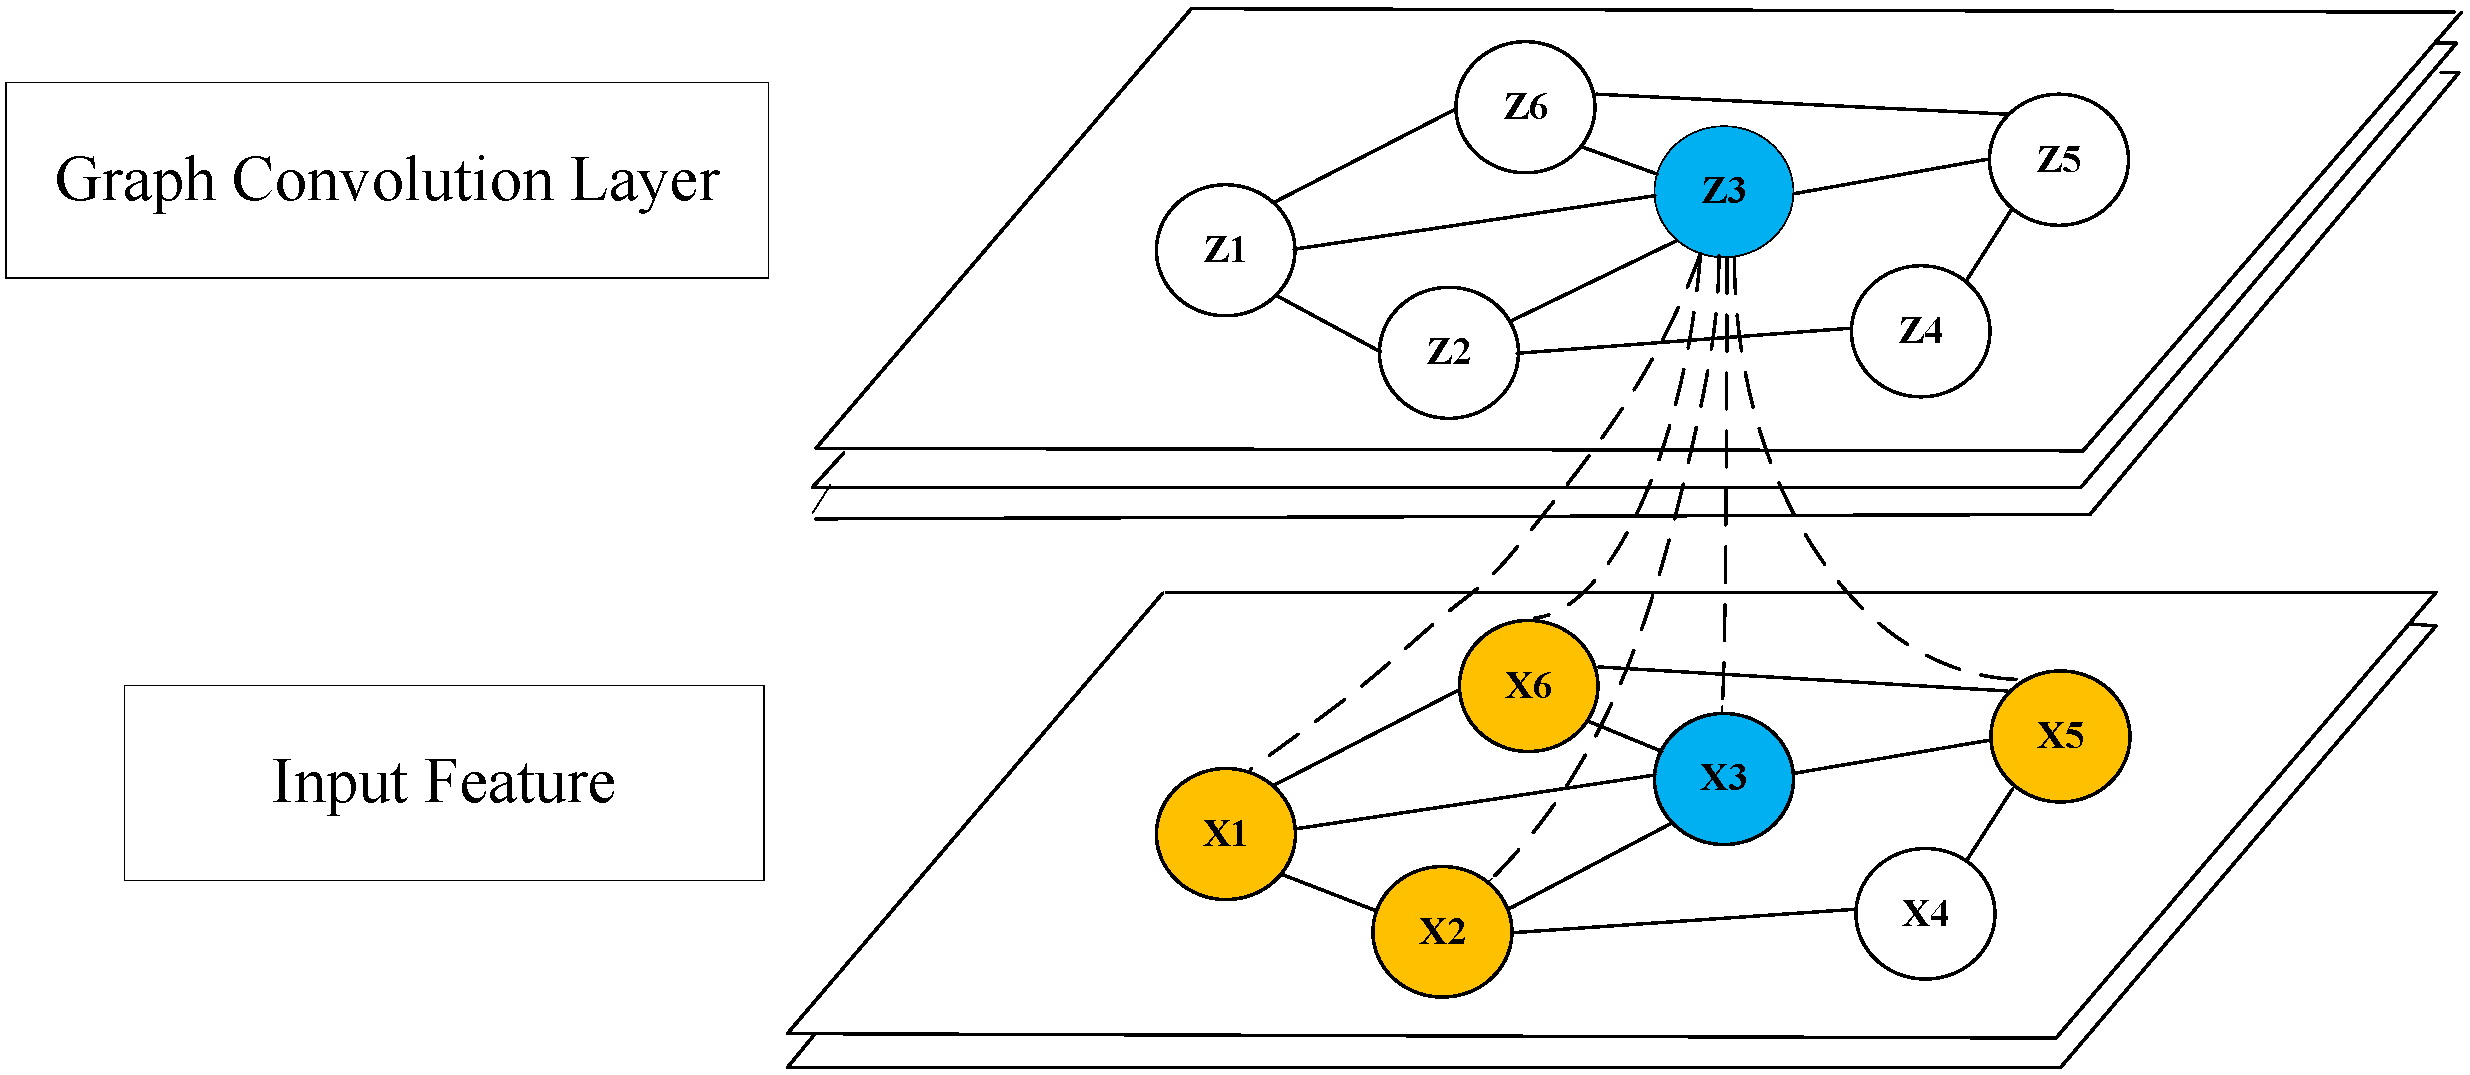
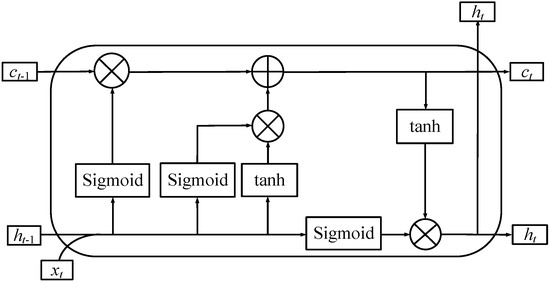
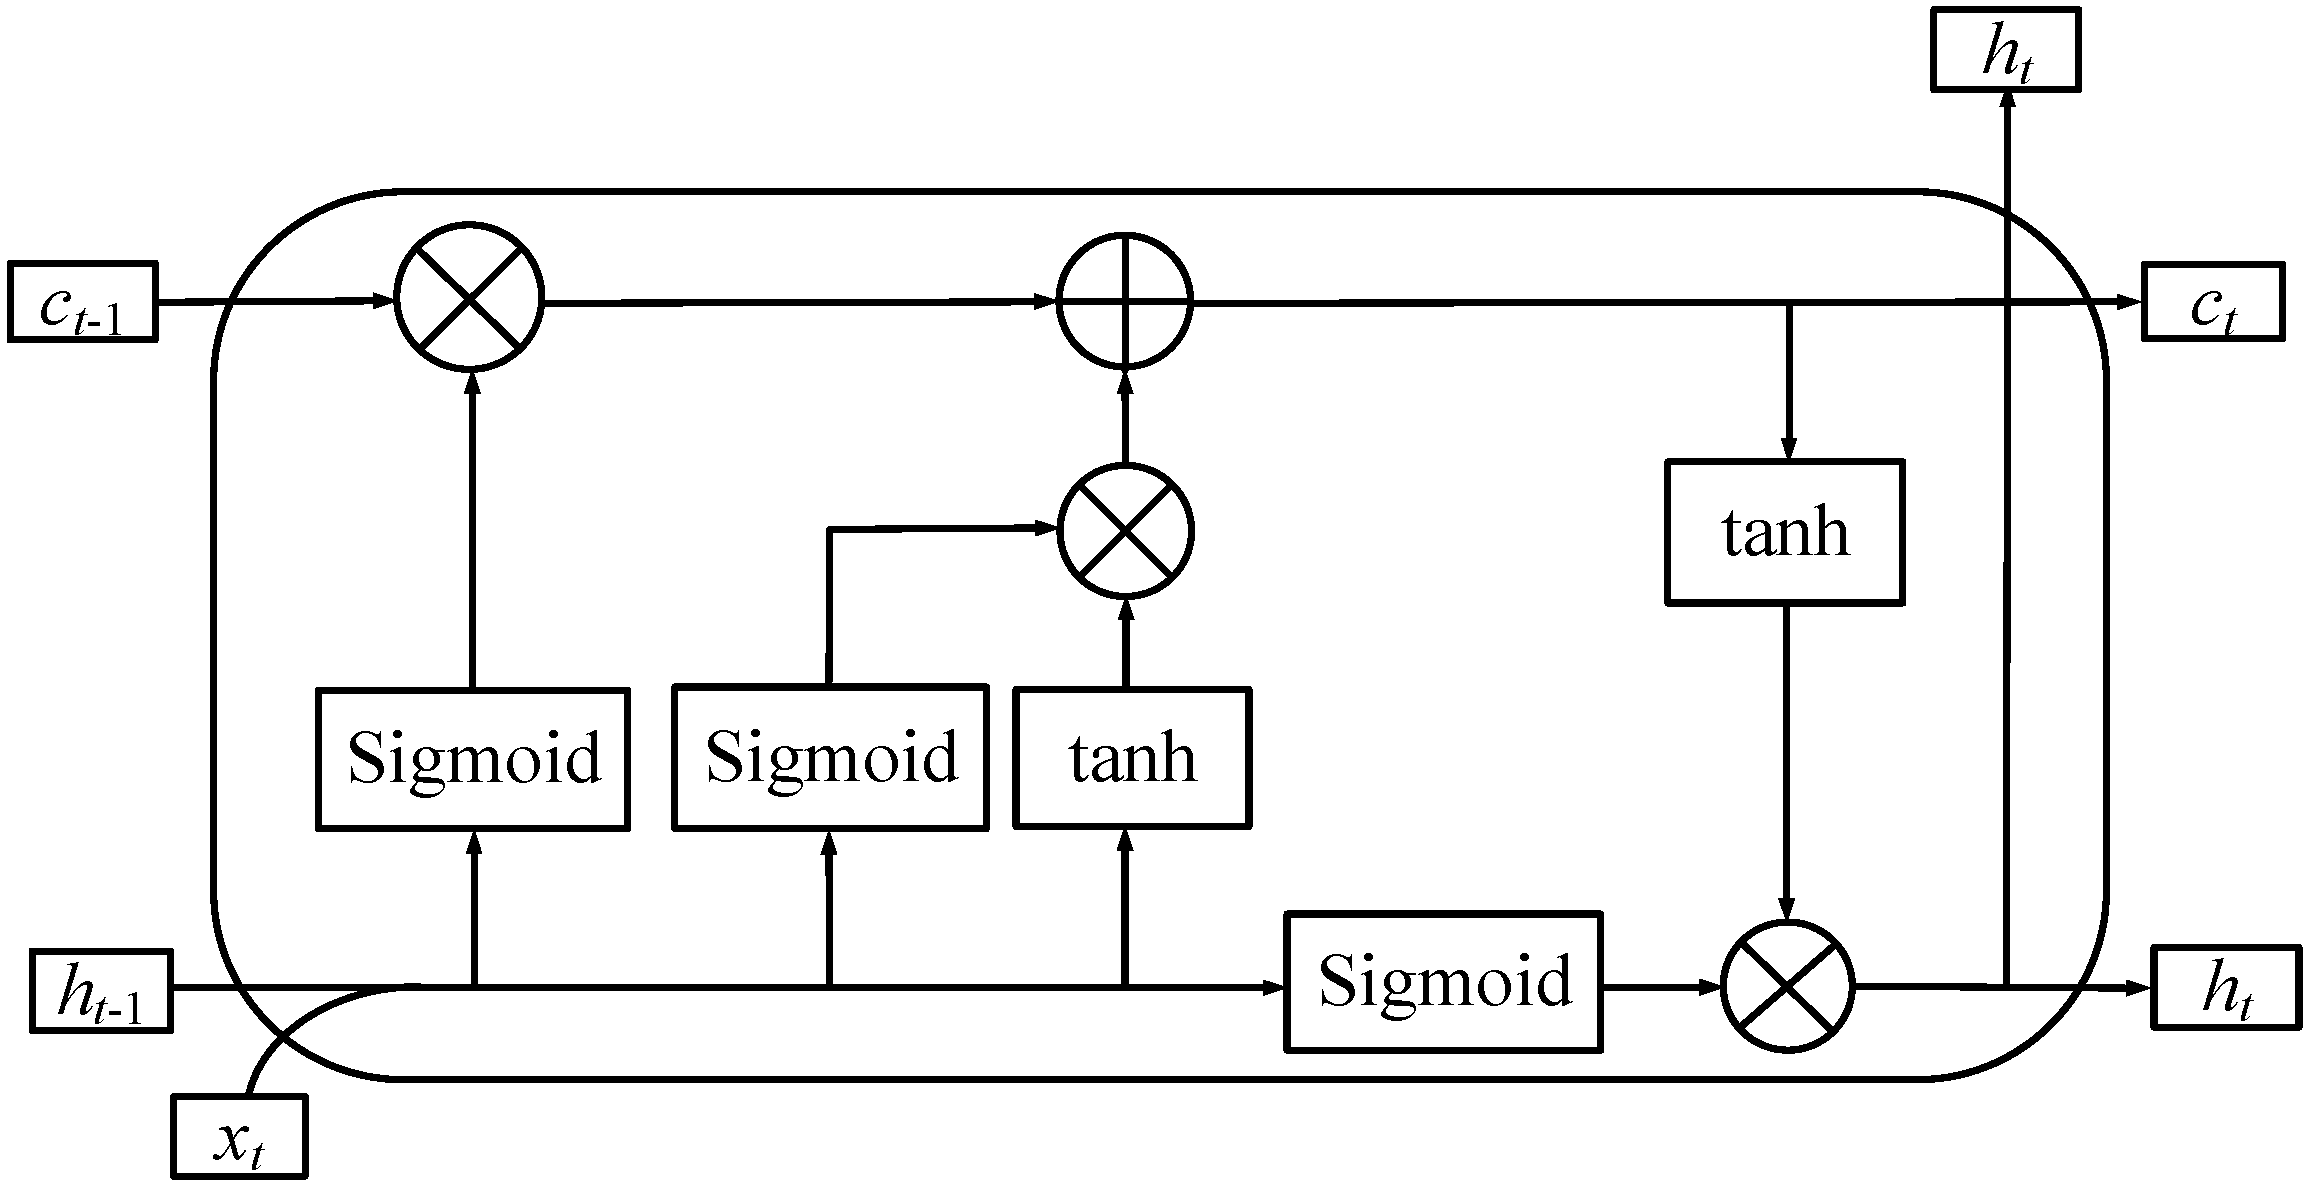
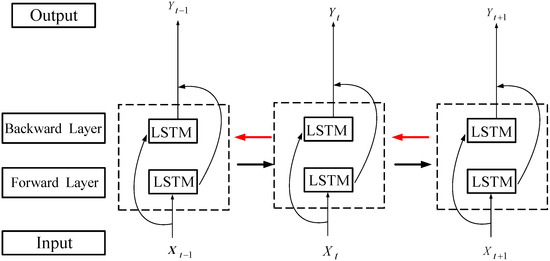
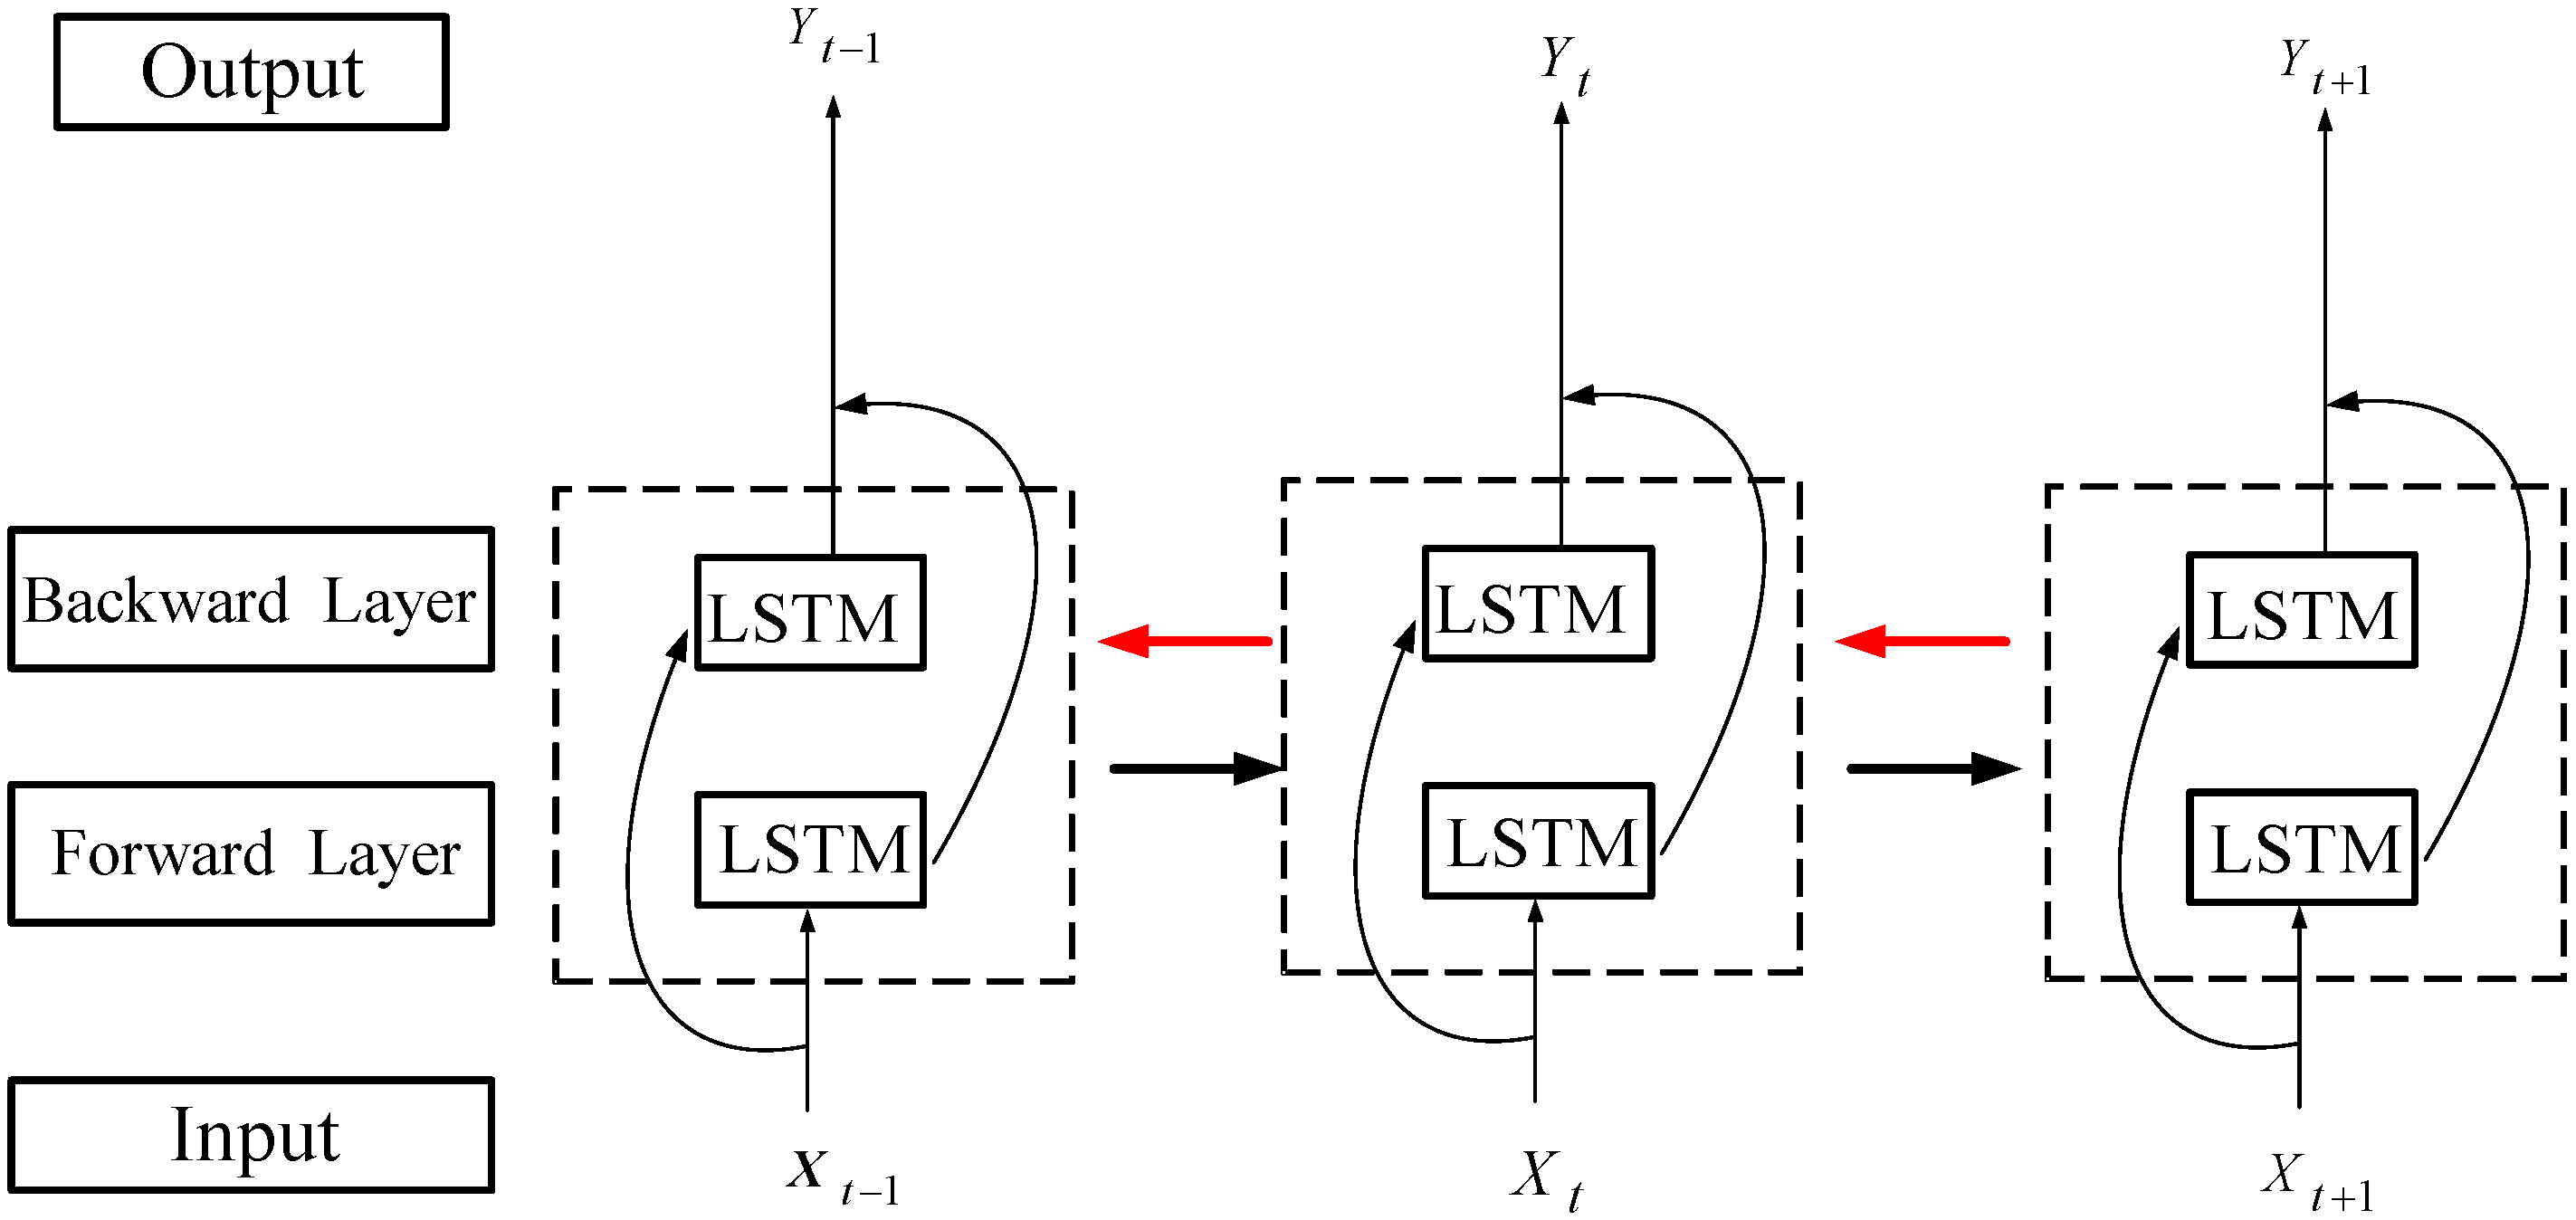
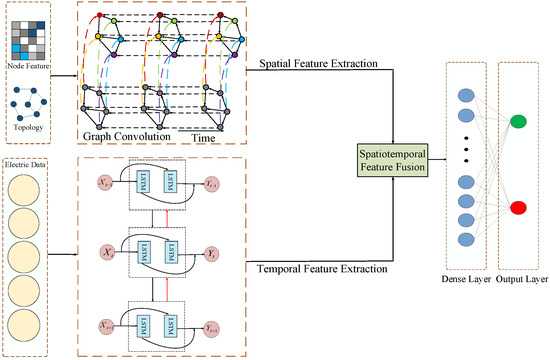
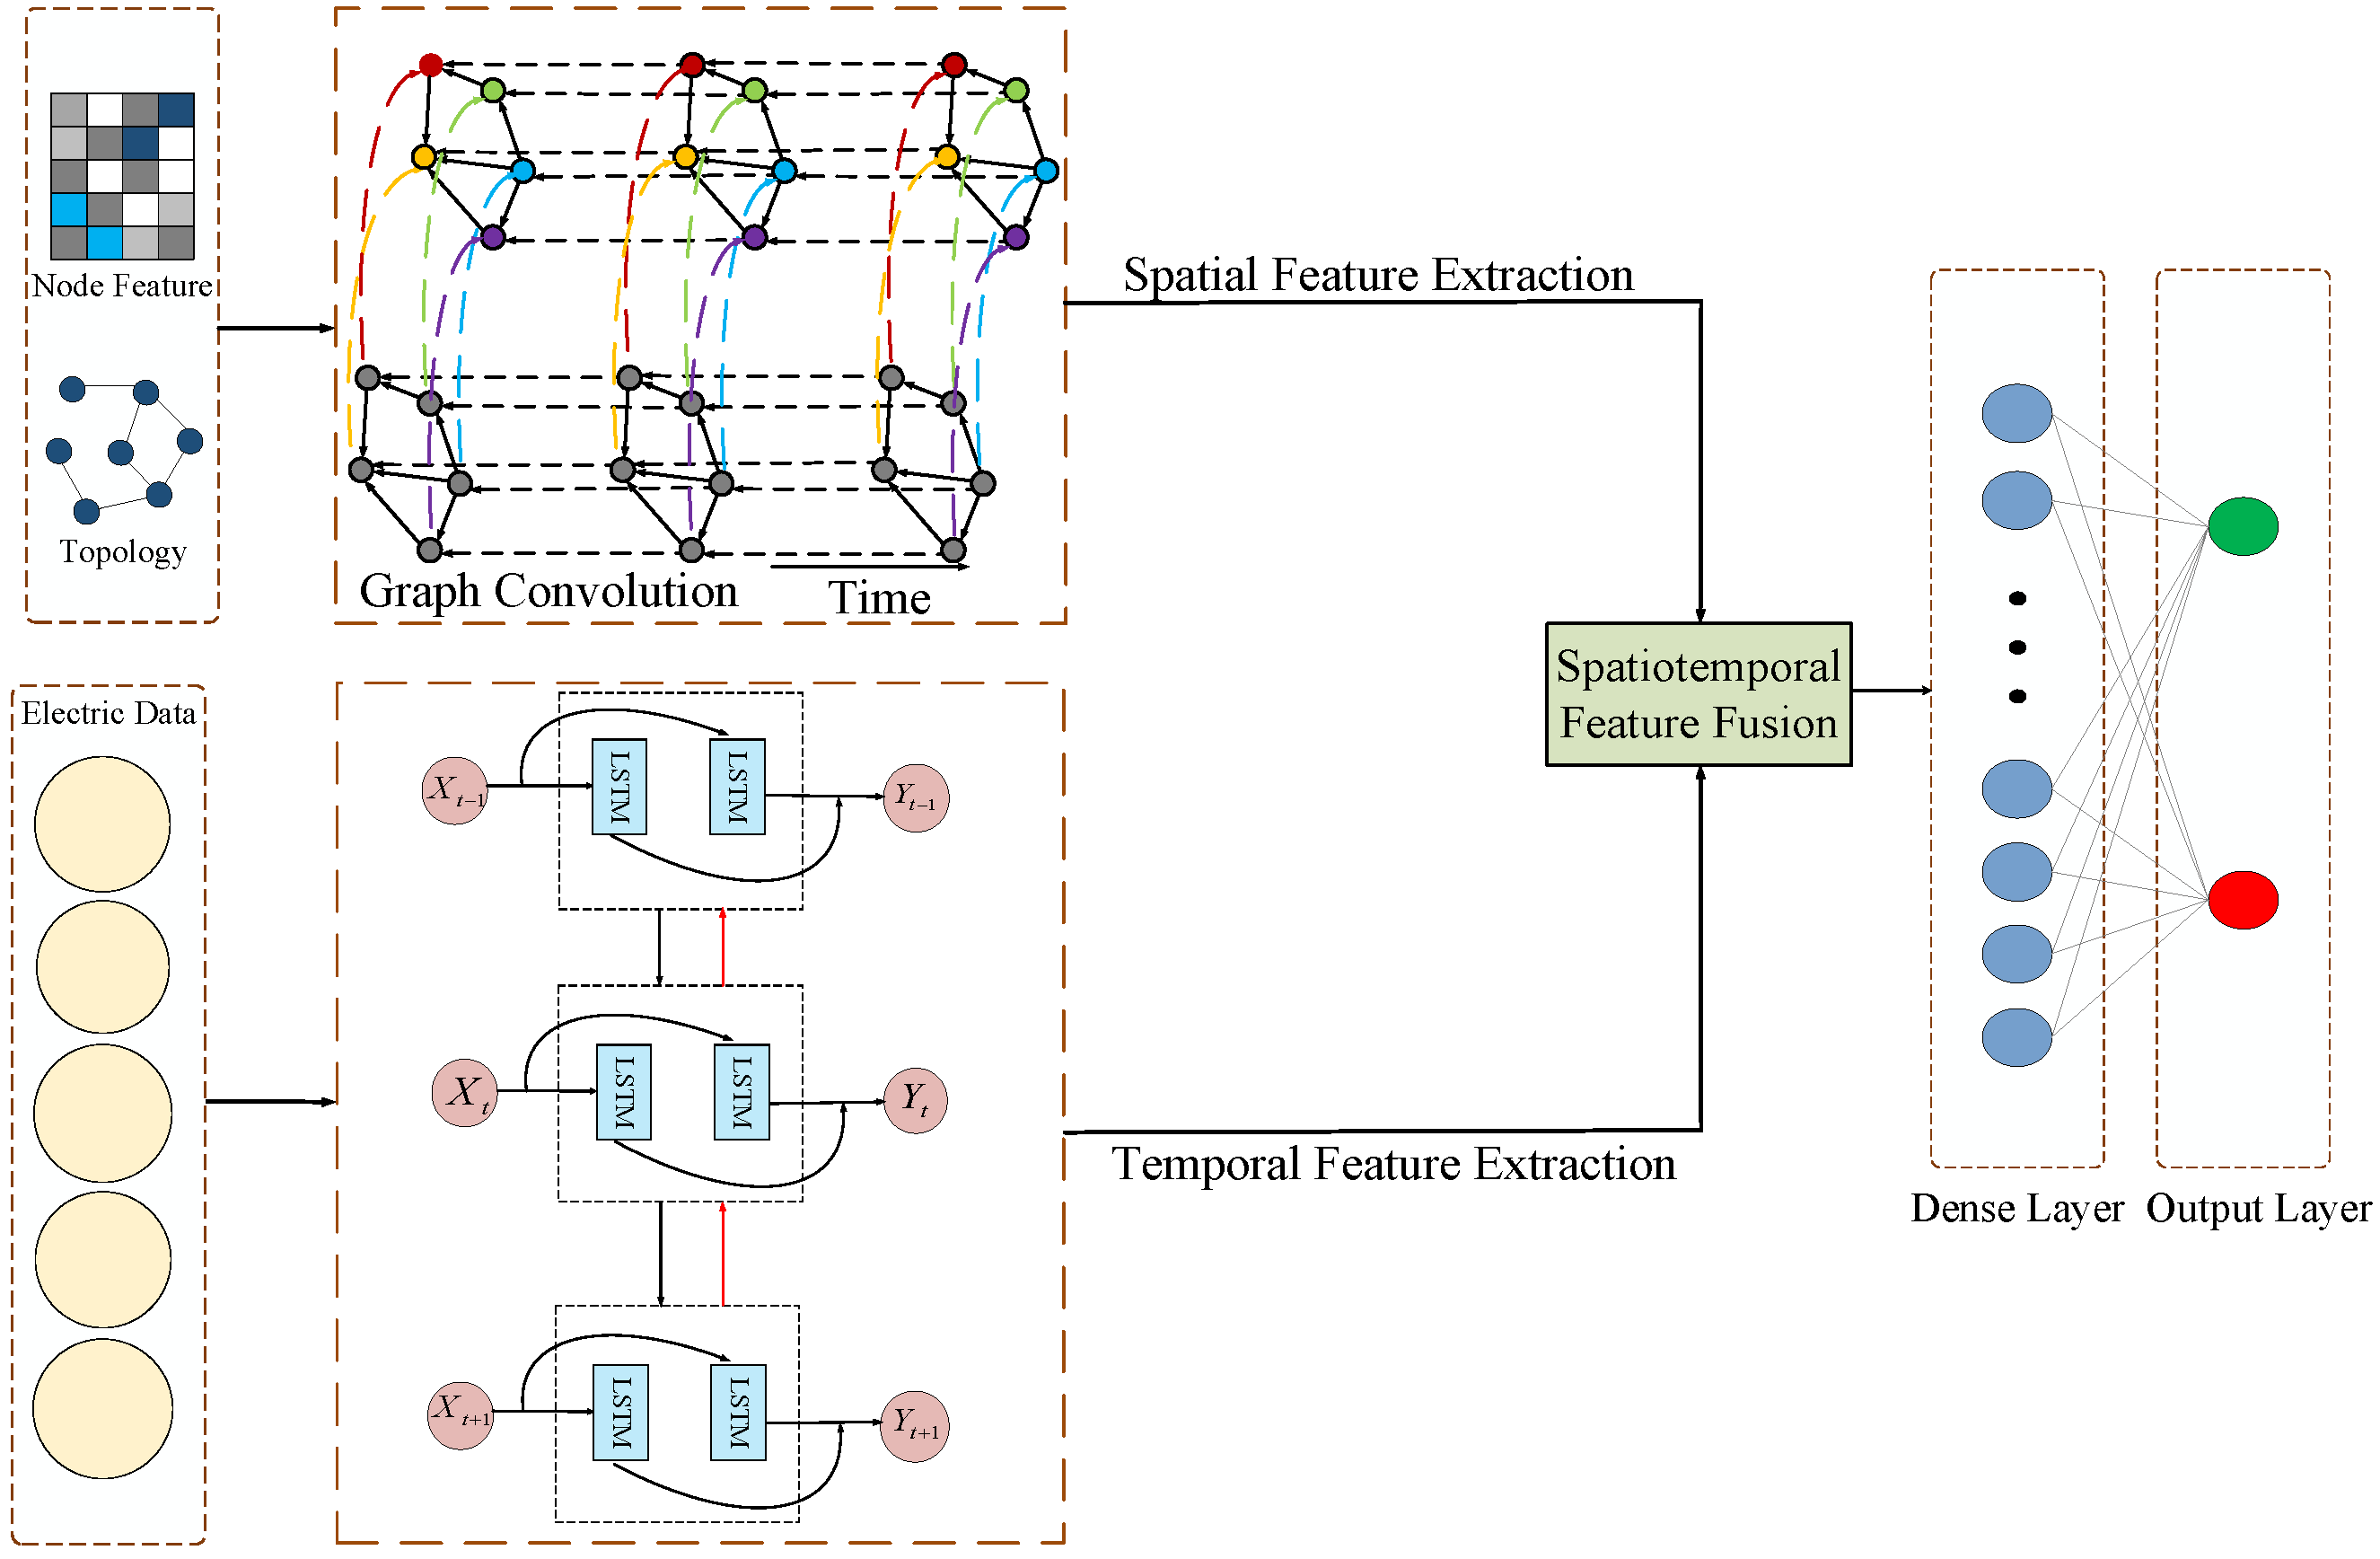
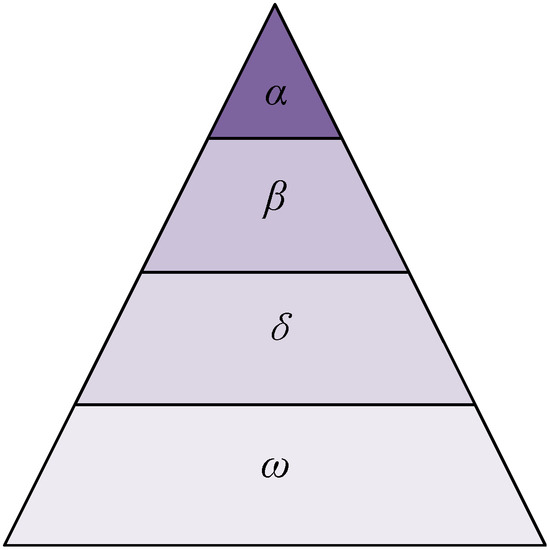
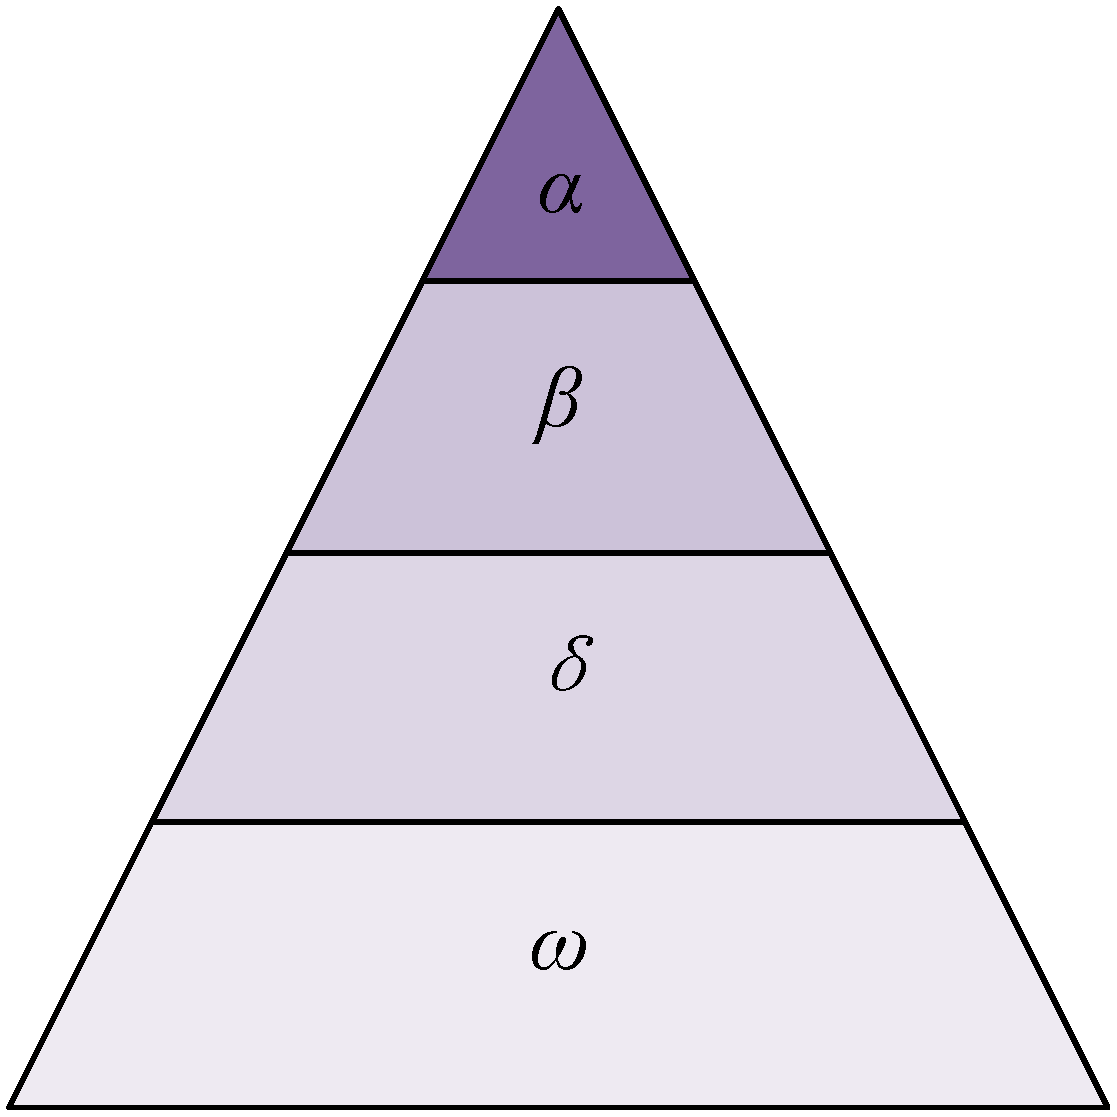
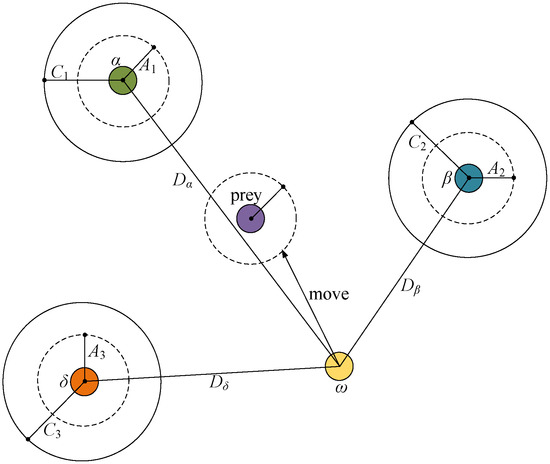
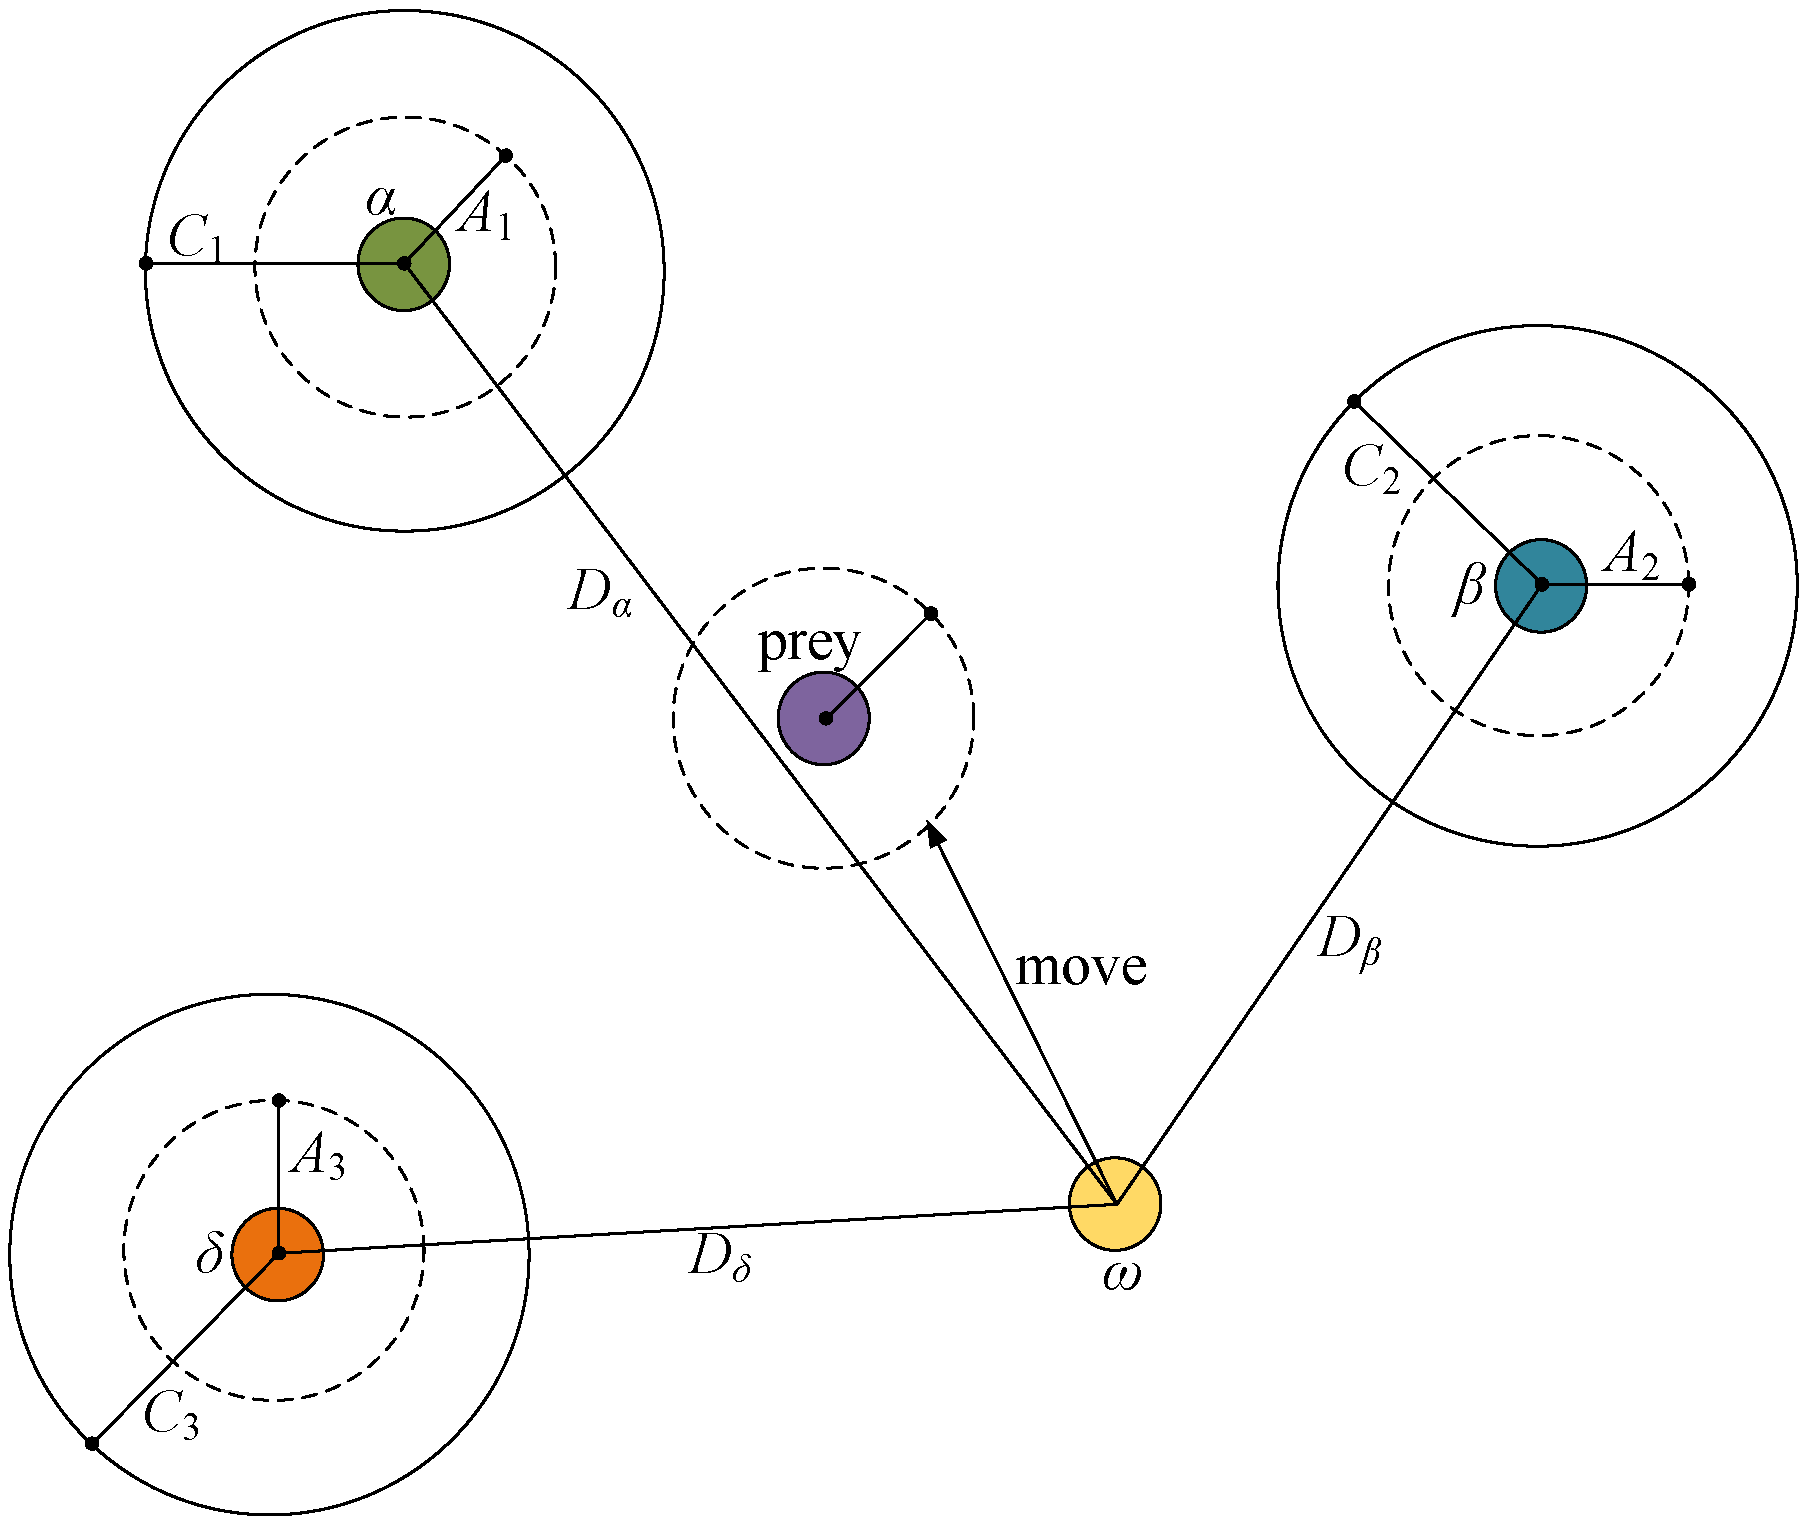
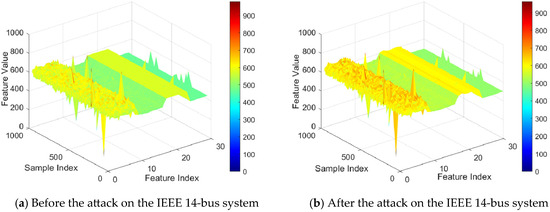
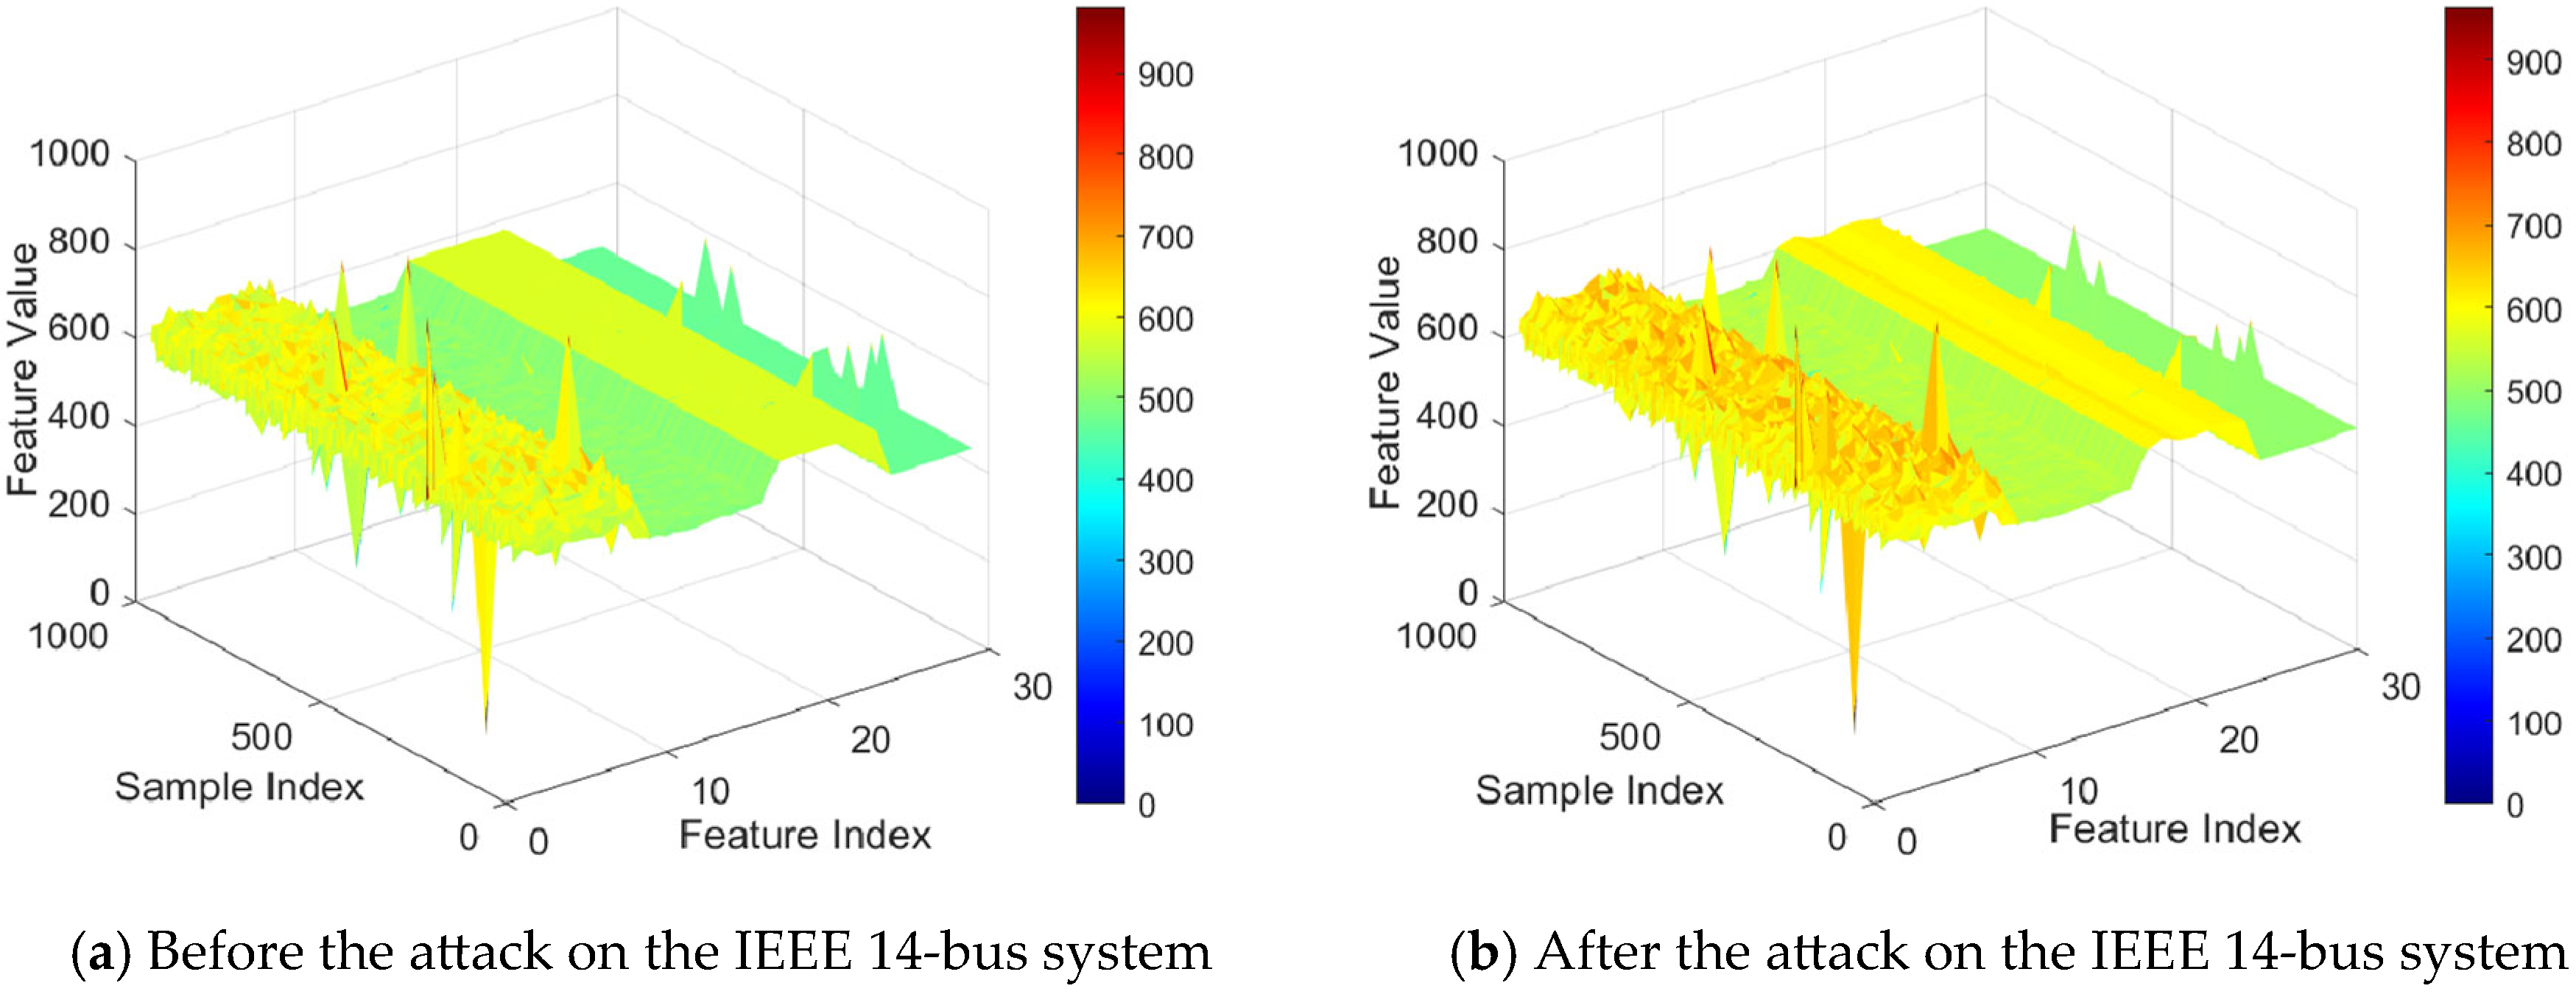
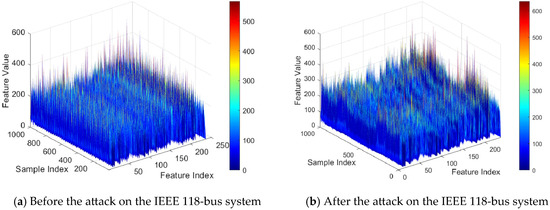
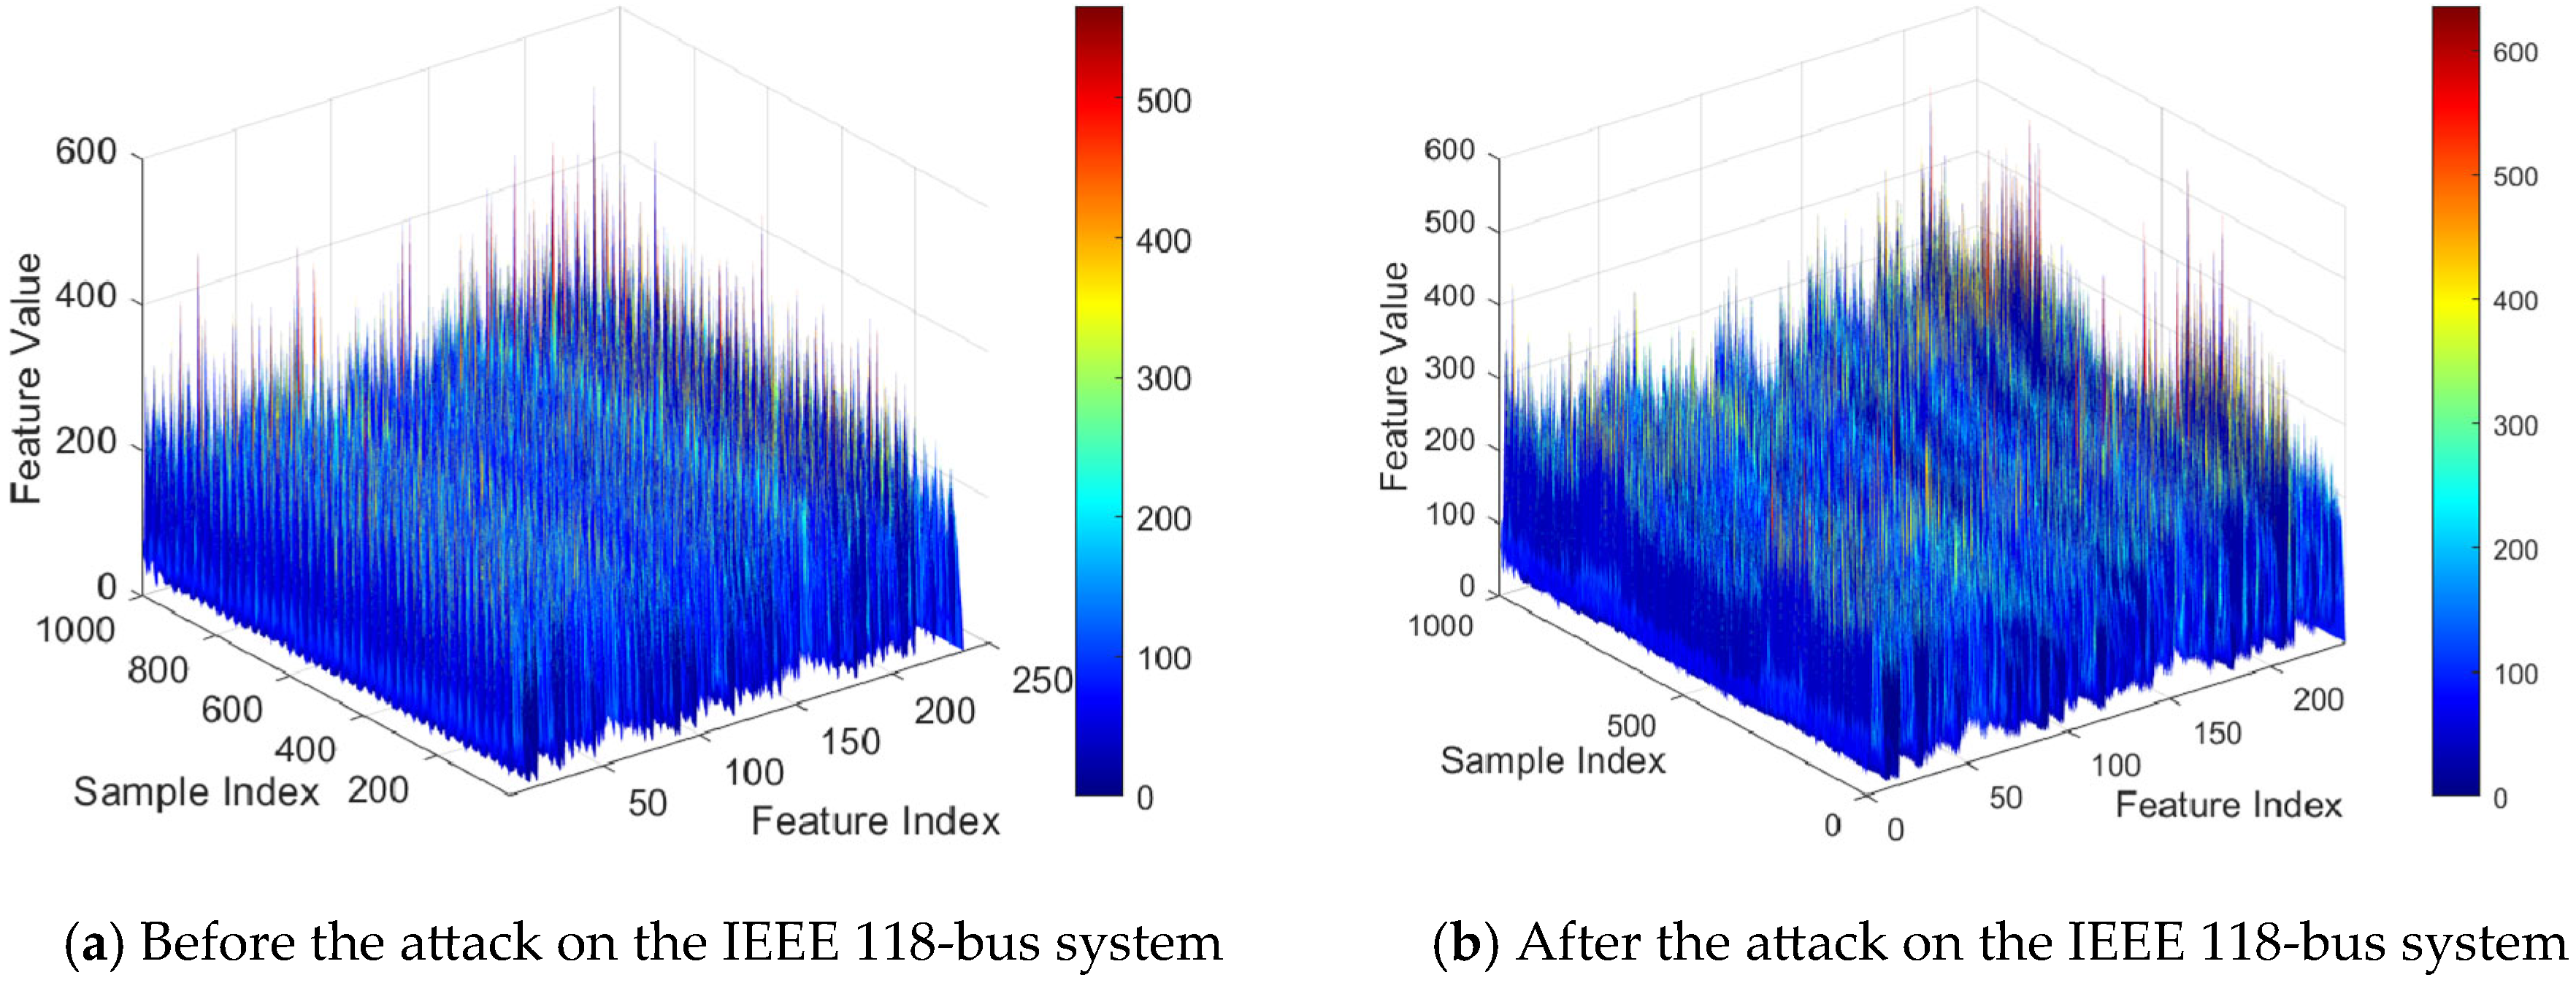
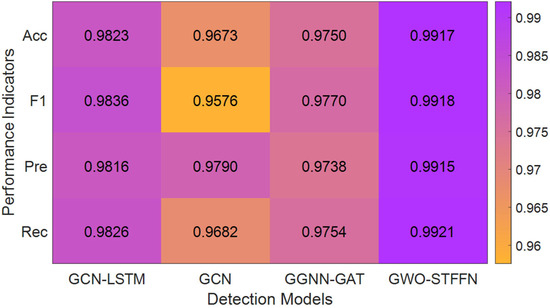
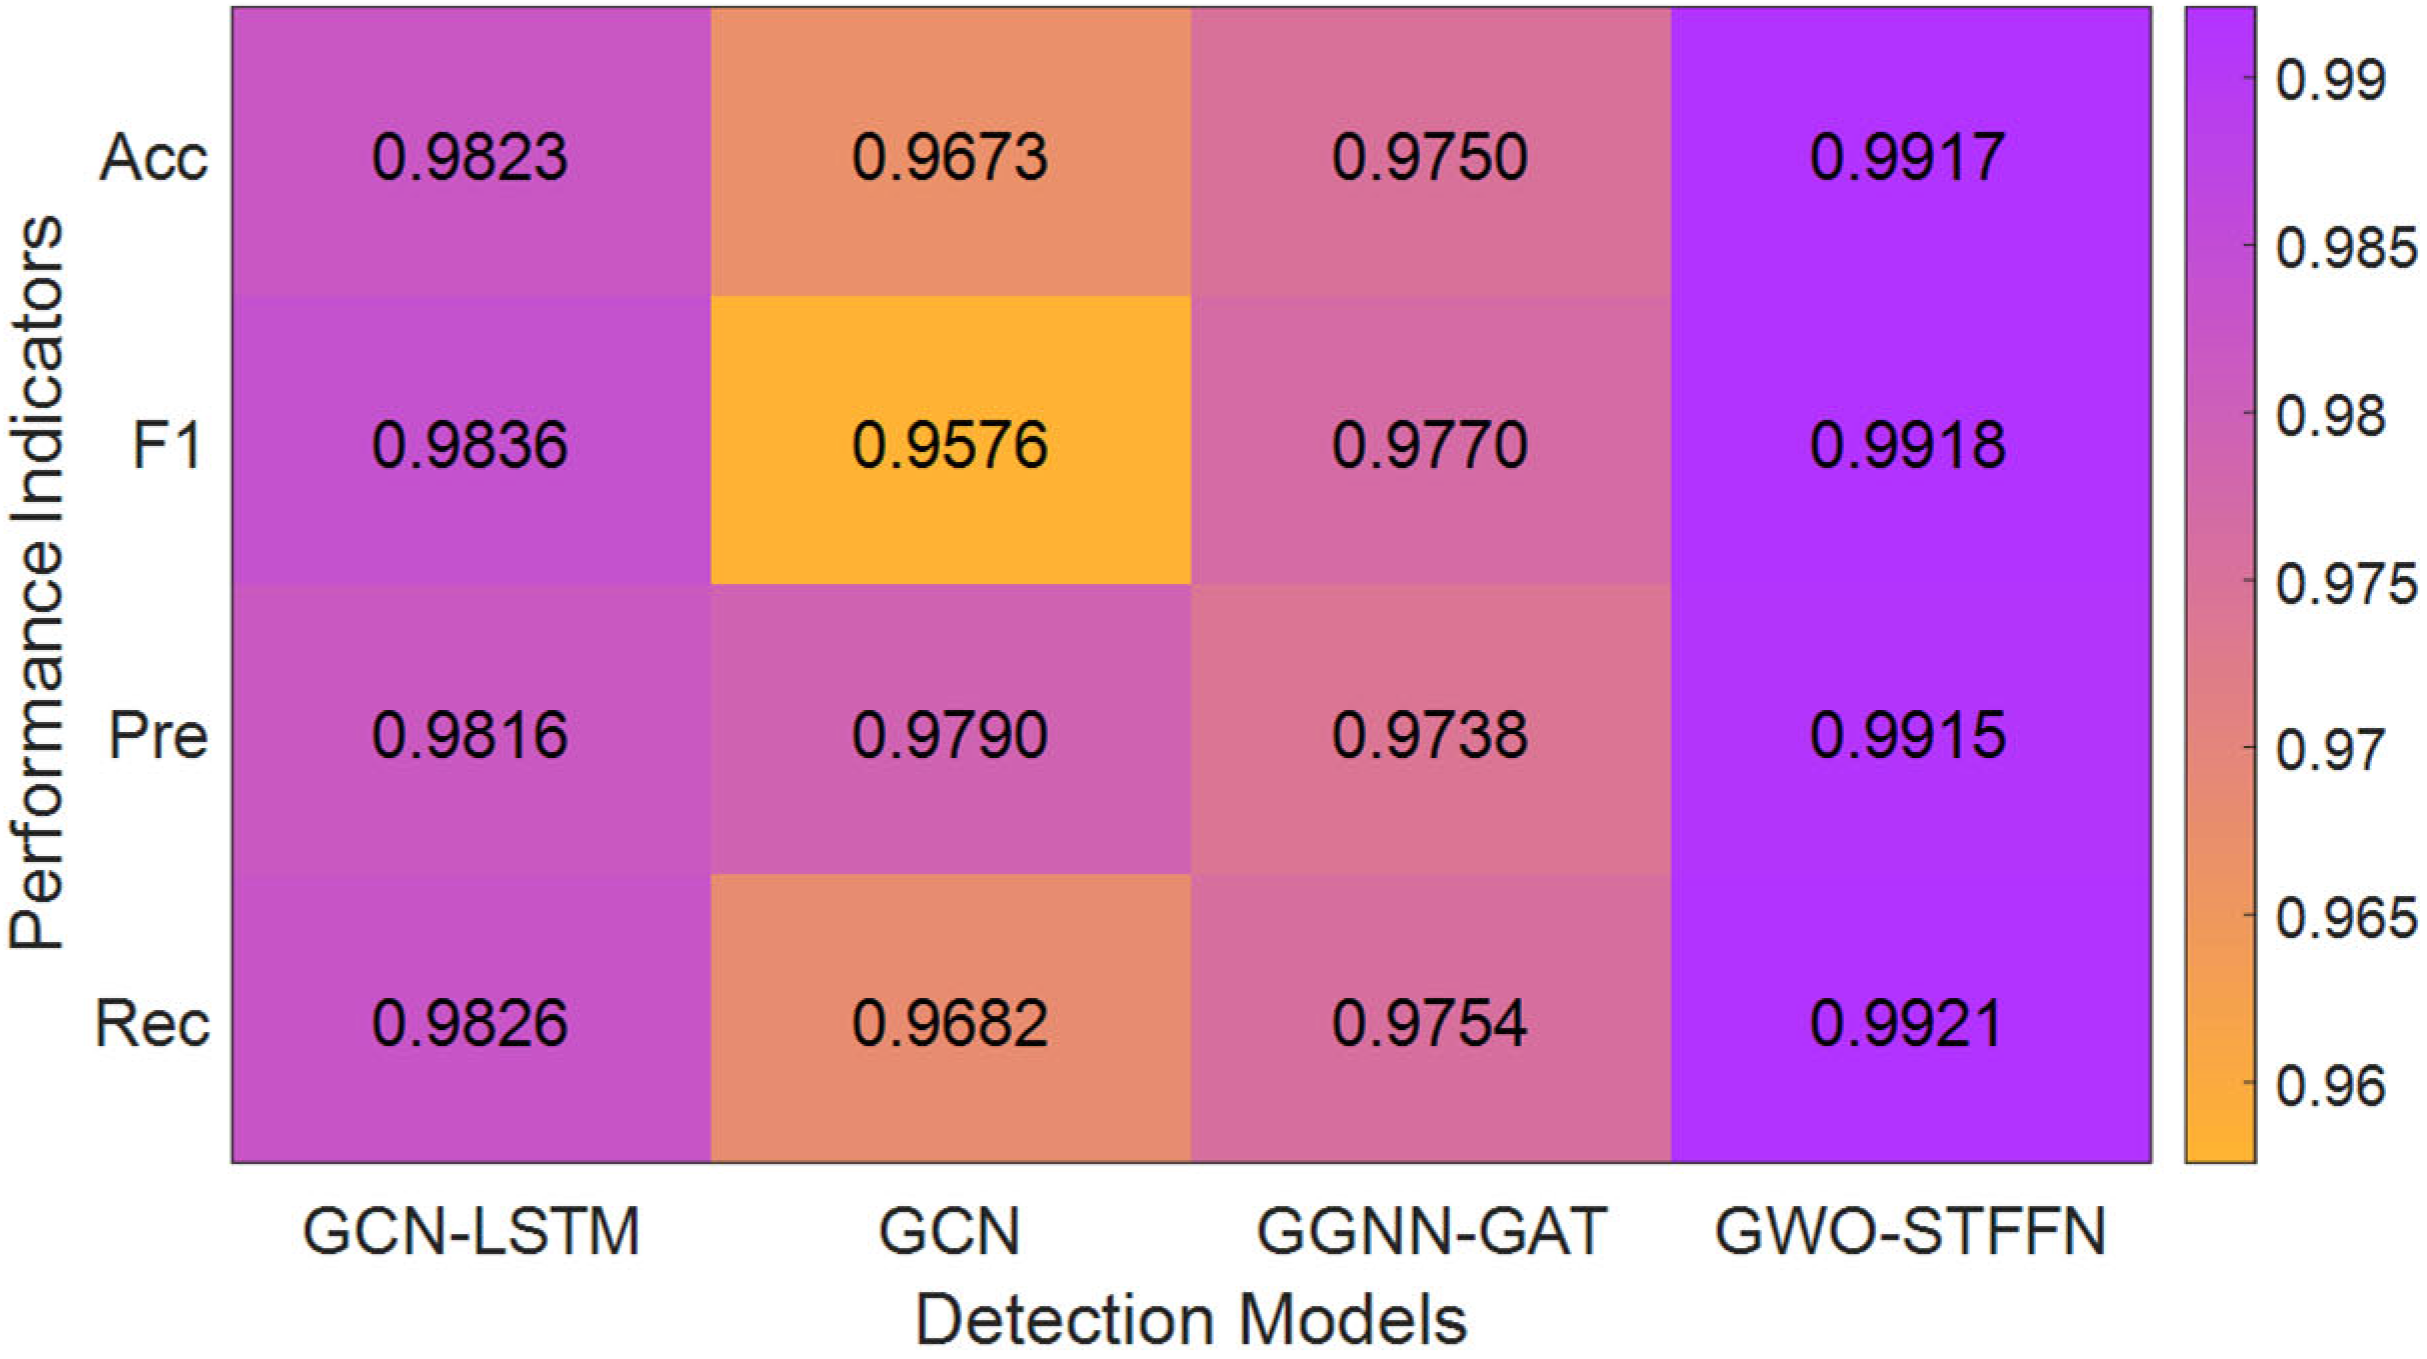
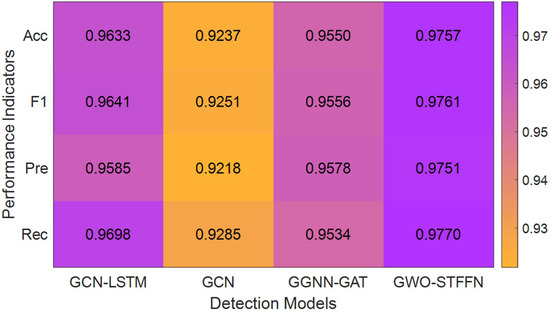
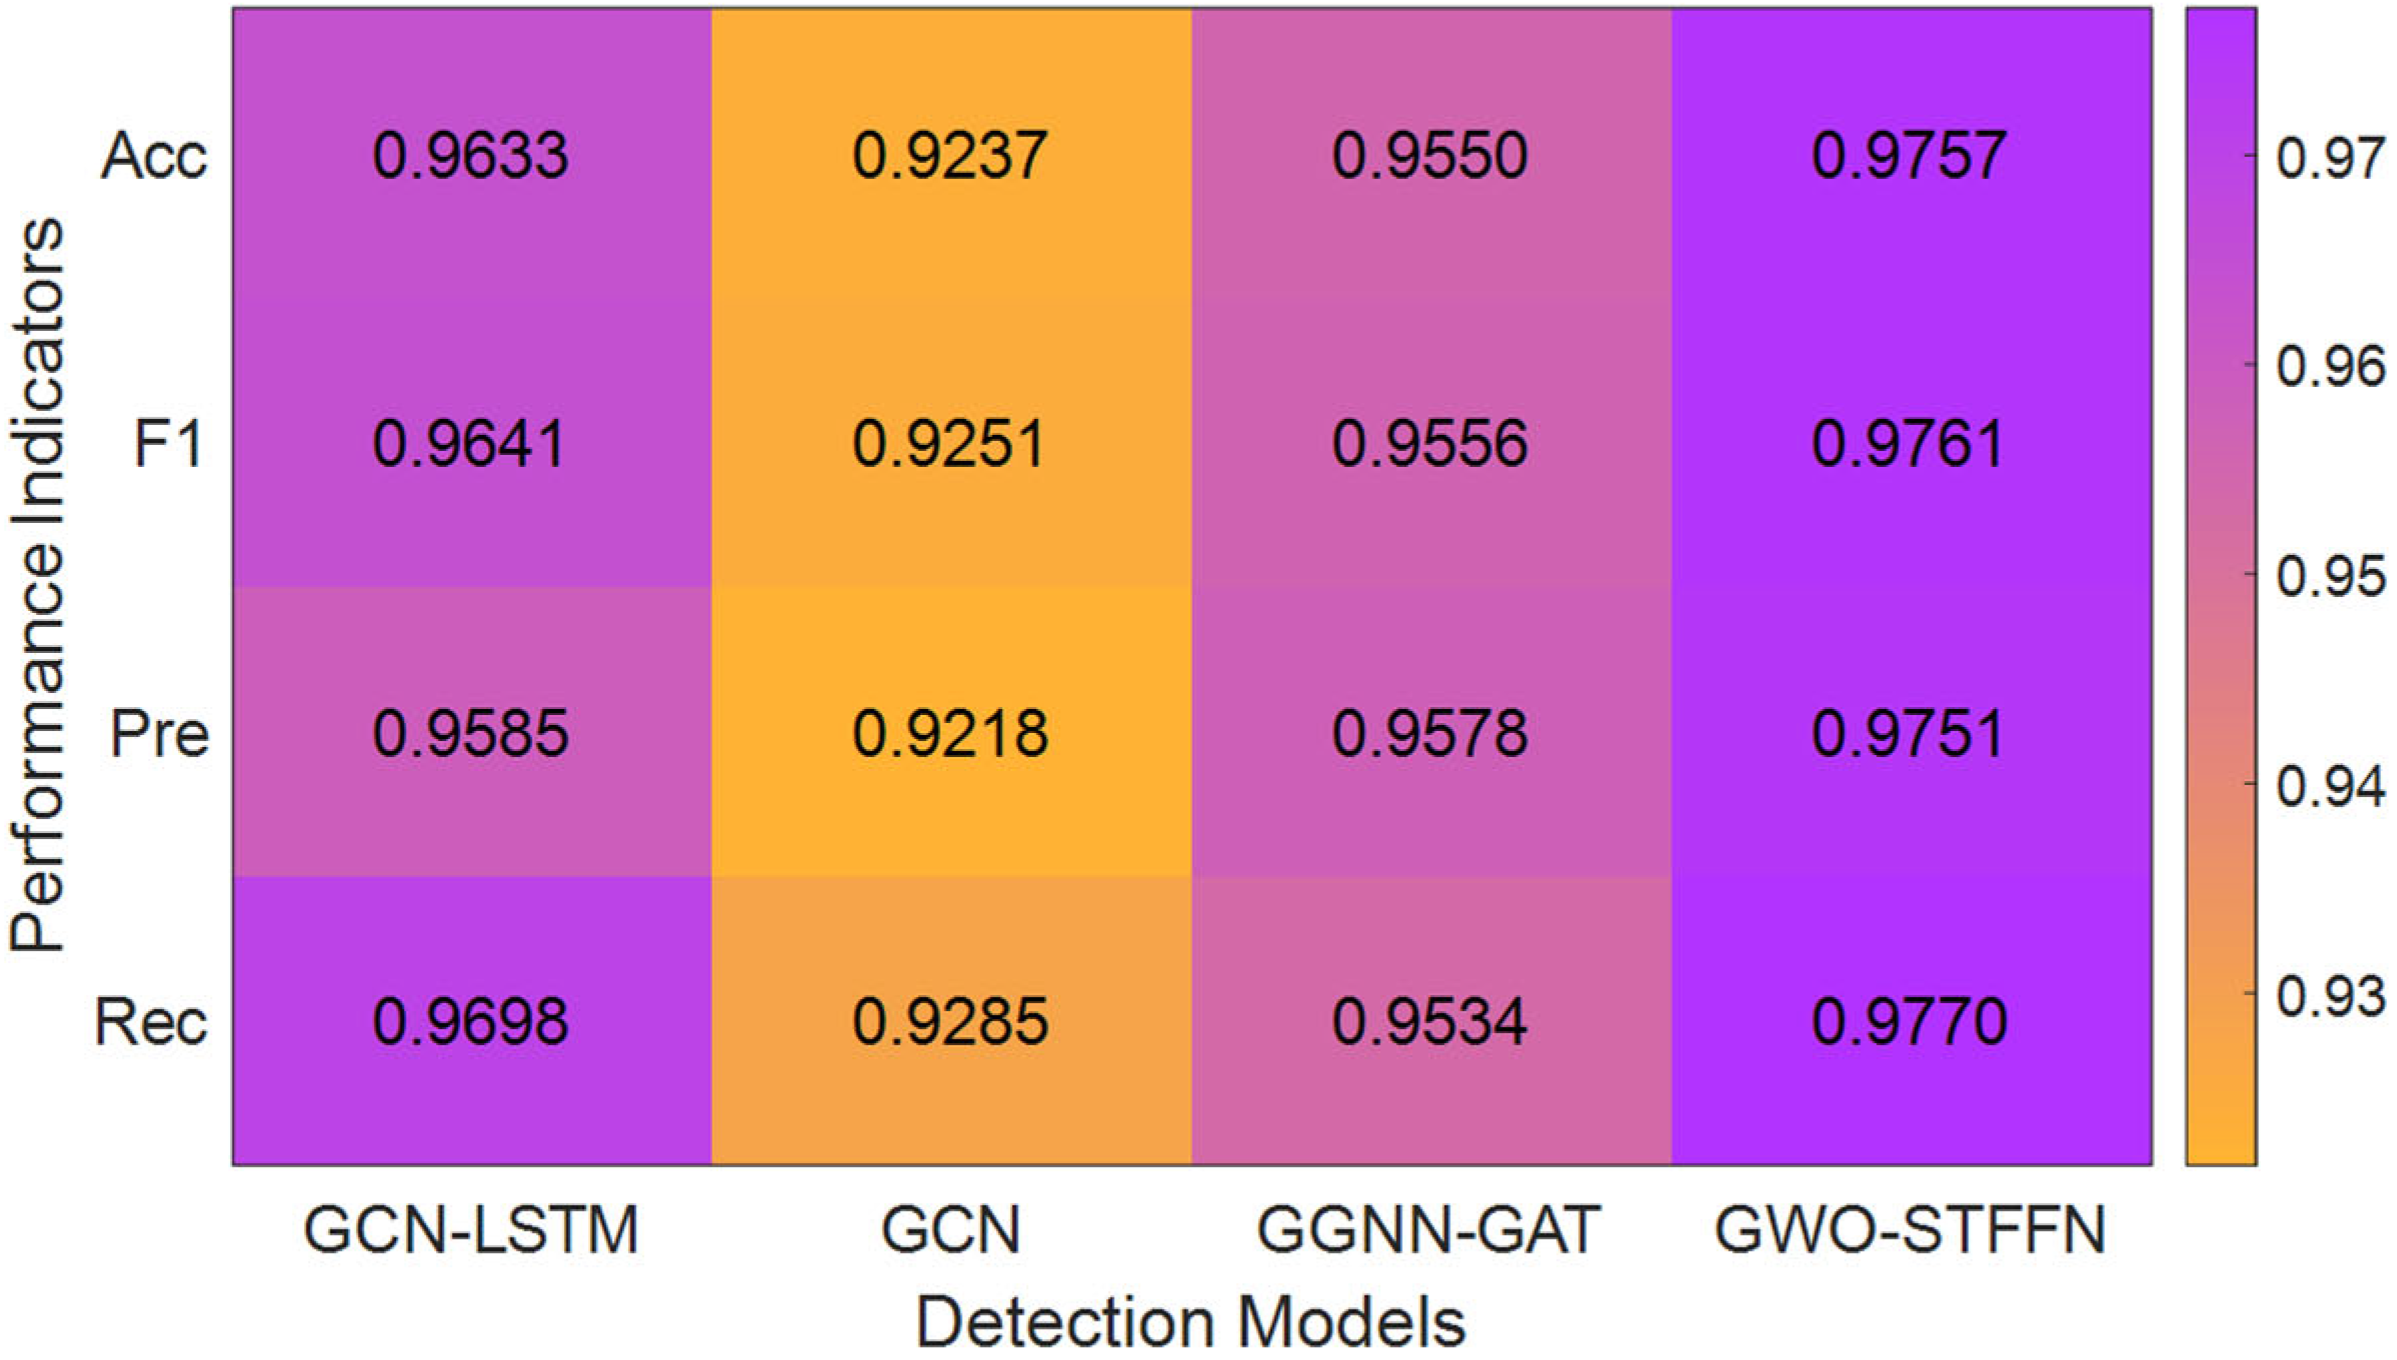
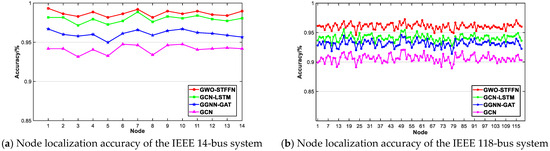
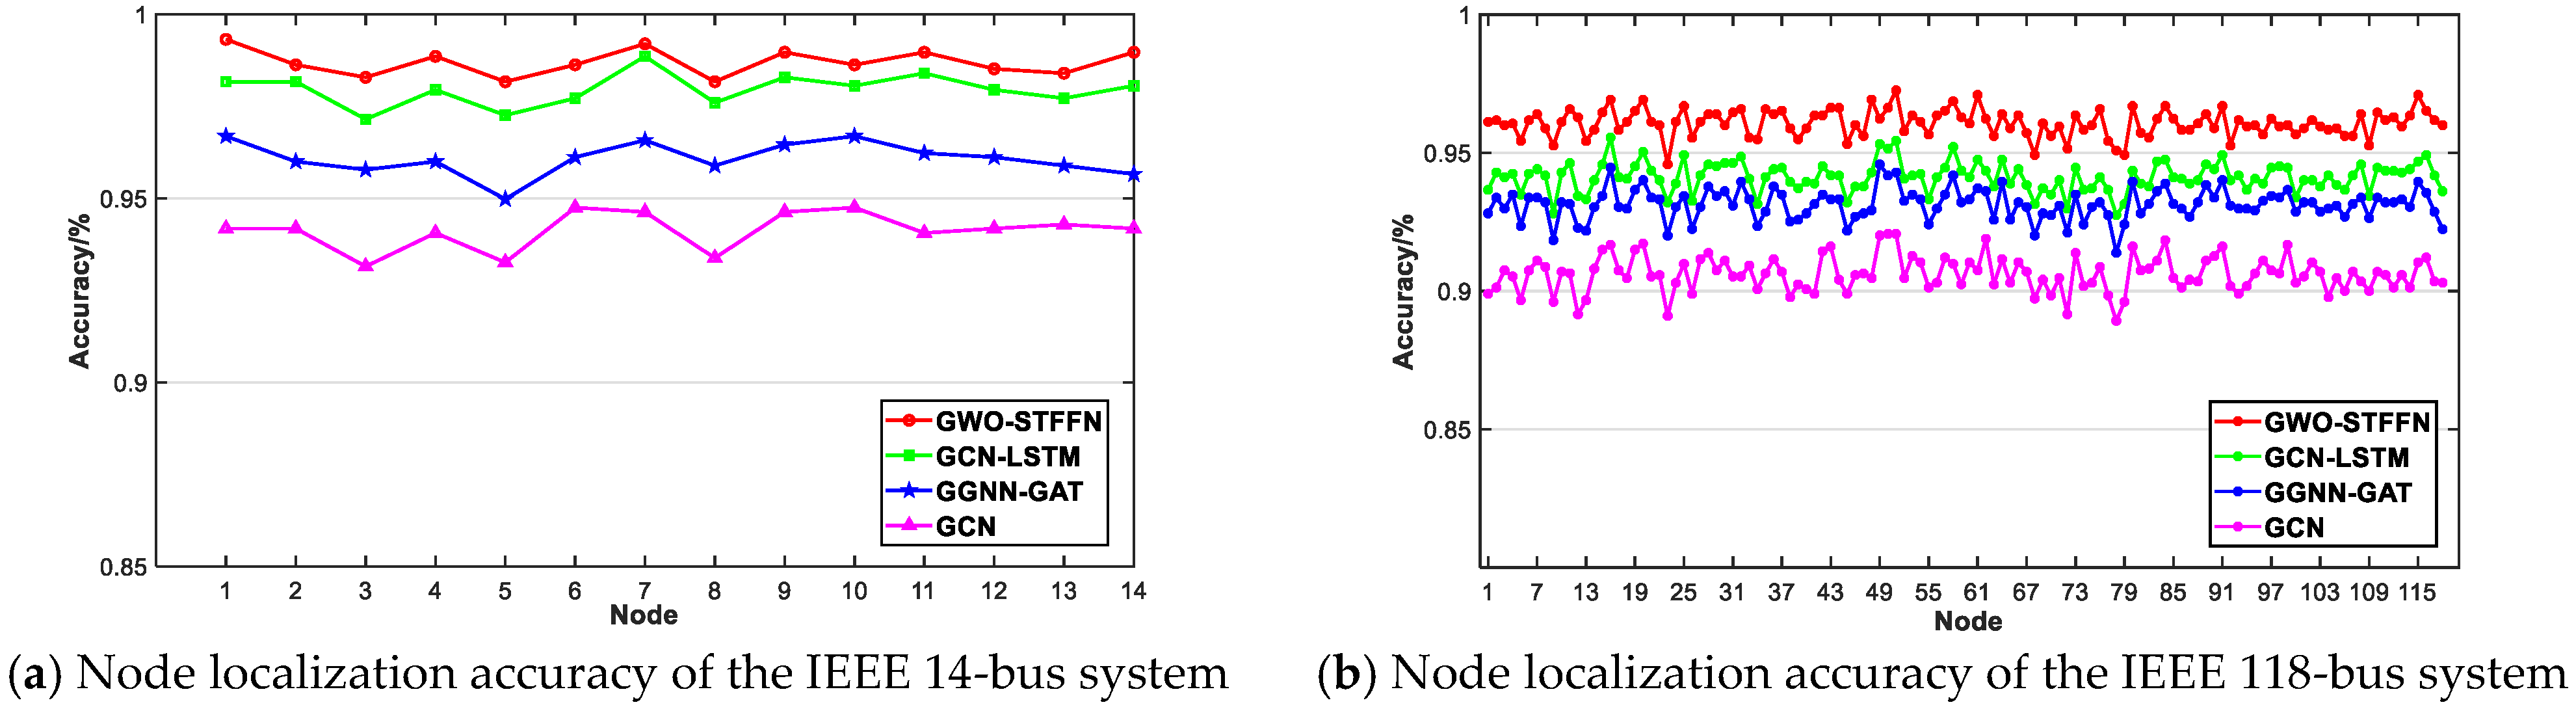
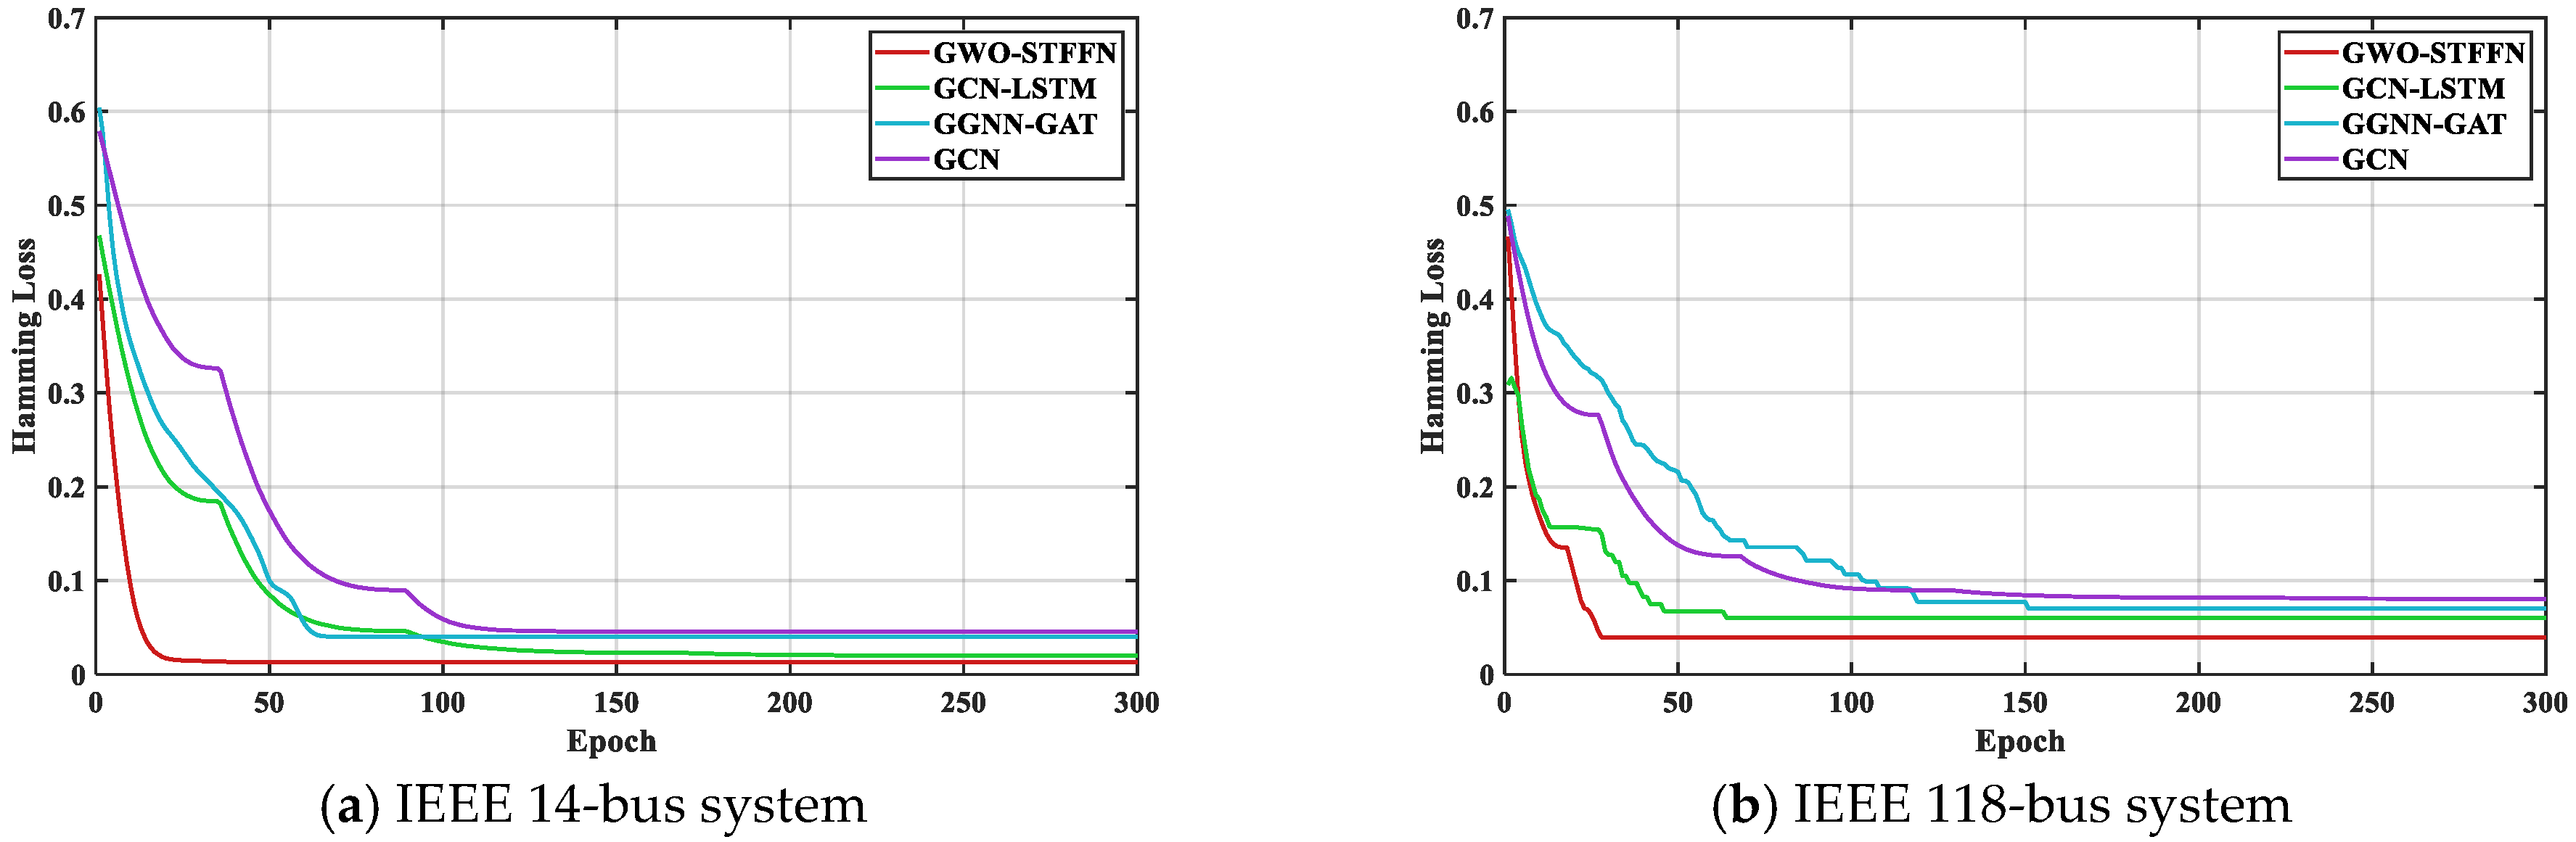
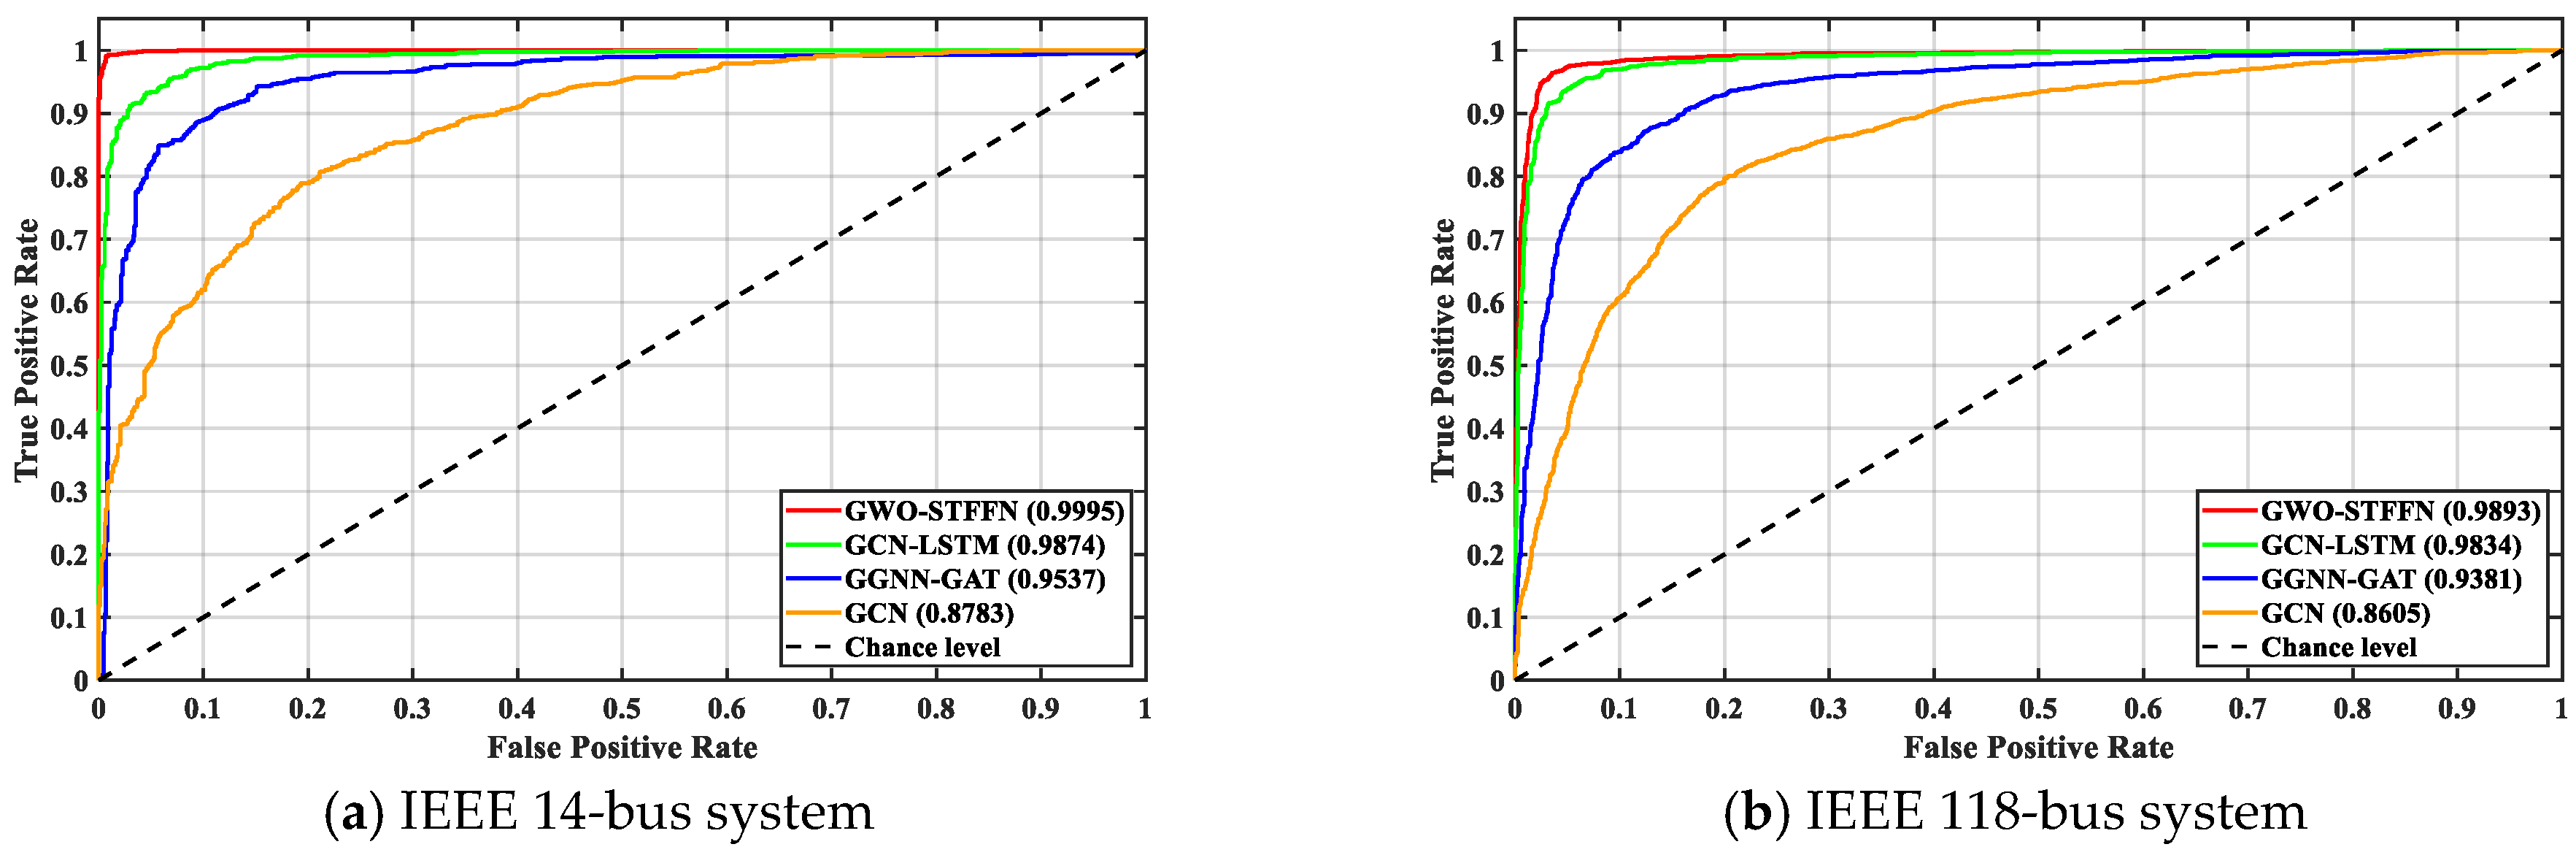
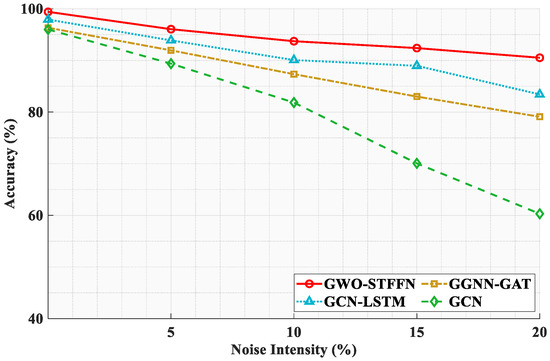
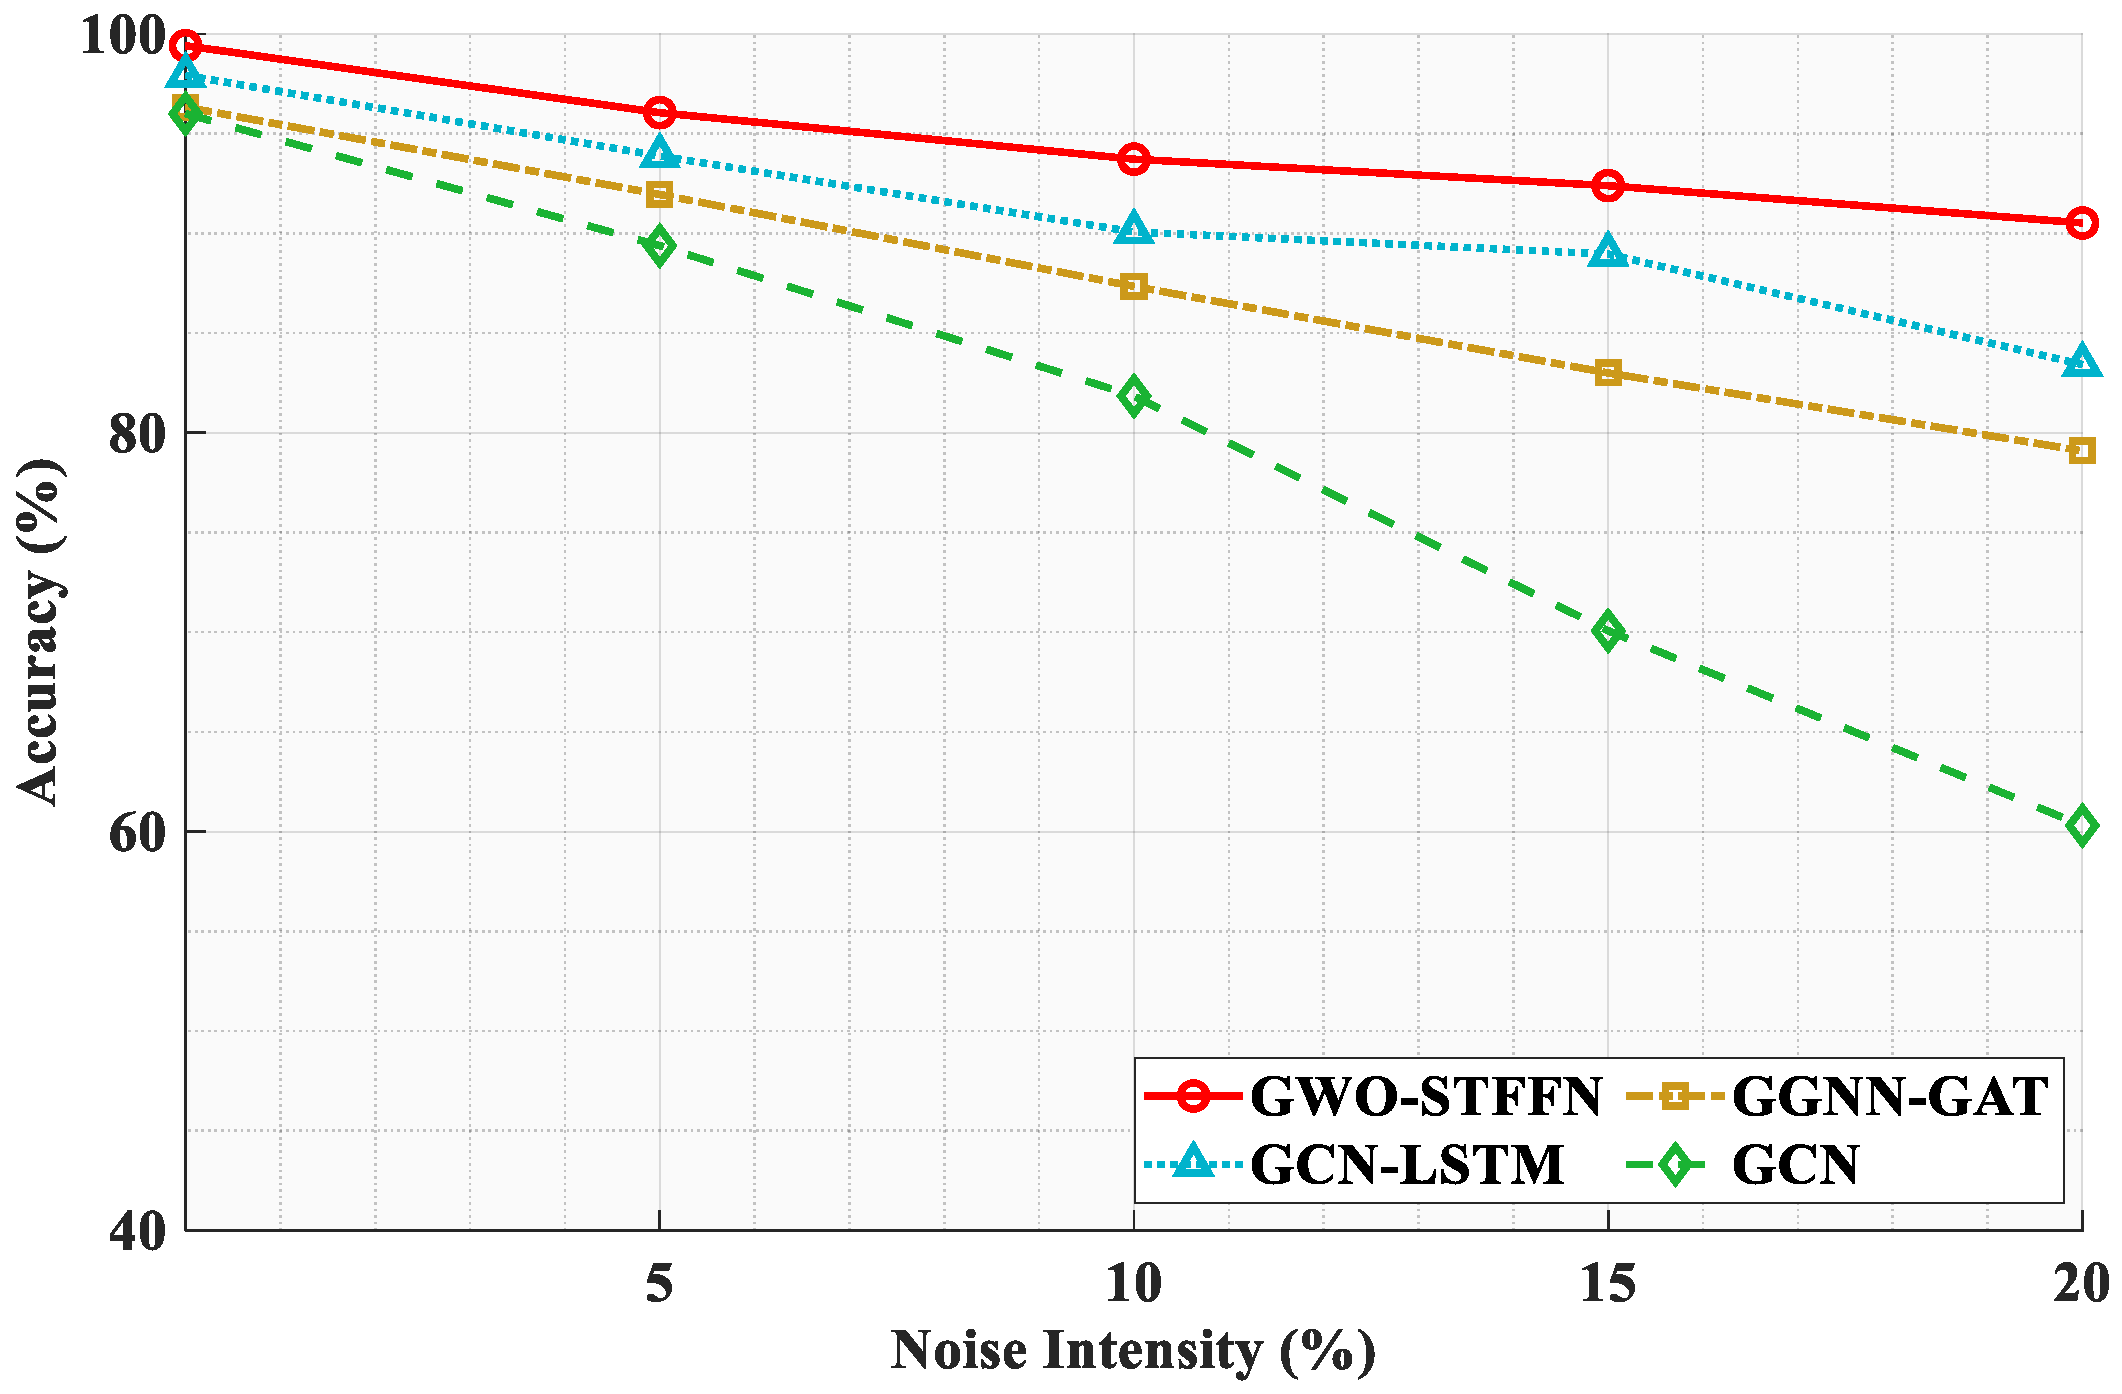
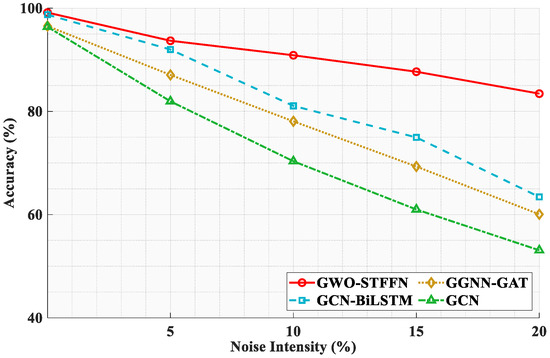
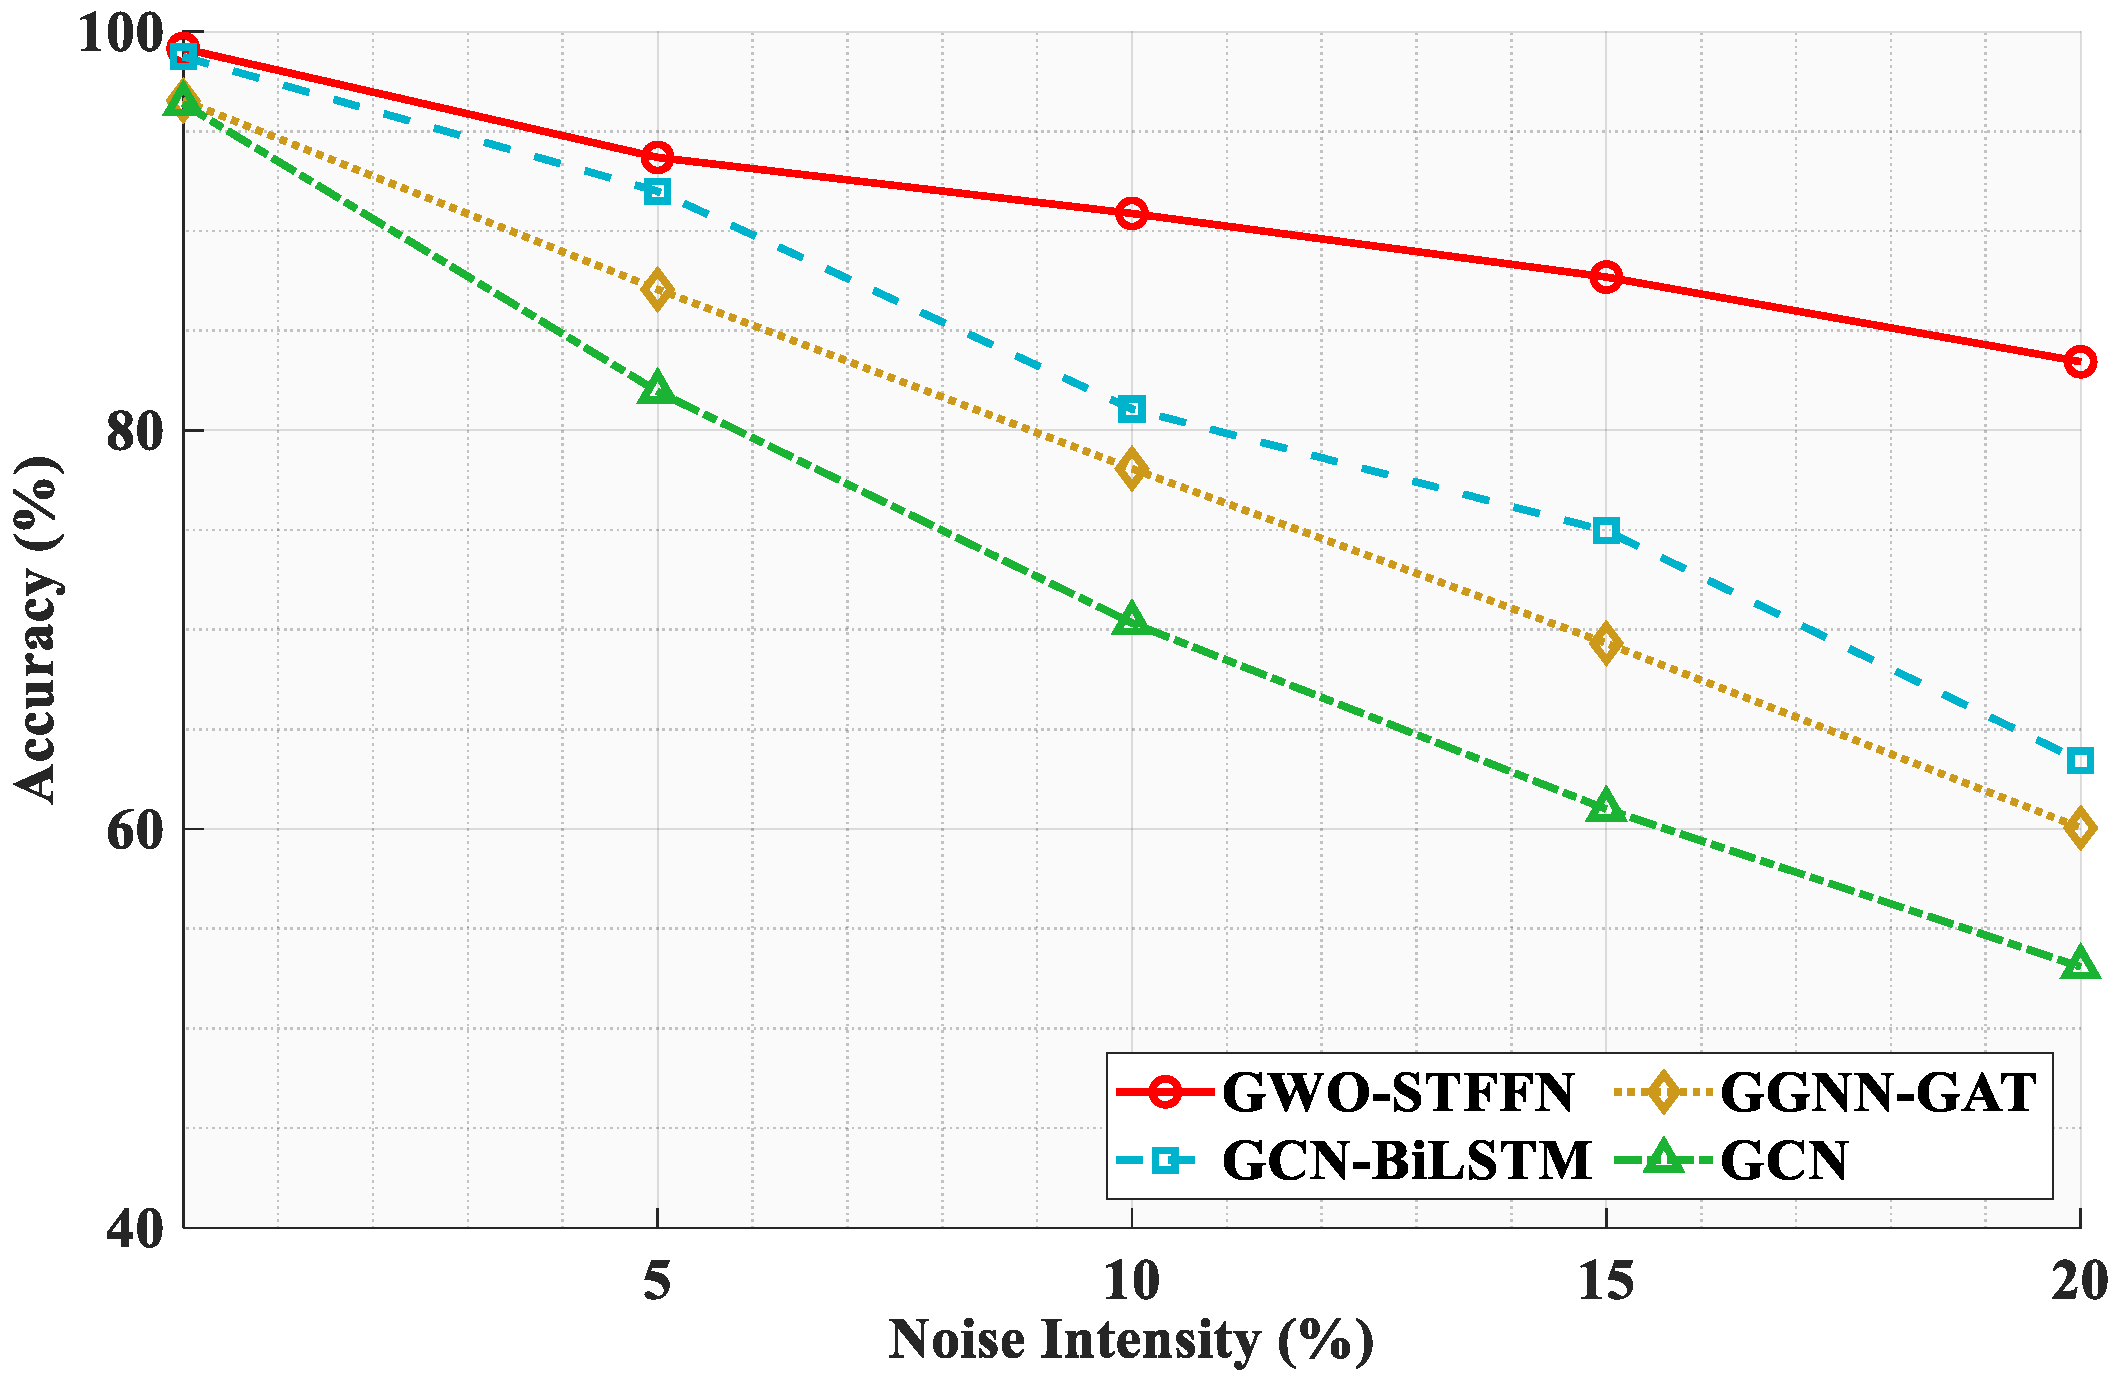

Disclaimer/Publisher’s Note: The statements, opinions and data contained in all publications are solely those of the individual author(s) and contributor(s) and not of MDPI and/or the editor(s). MDPI and/or the editor(s) disclaim responsibility for any injury to people or property resulting from any ideas, methods, instructions or products referred to in the content. |
© 2026 by the authors. Licensee MDPI, Basel, Switzerland. This article is an open access article distributed under the terms and conditions of the Creative Commons Attribution (CC BY) license.