Article

Analysis of HiPE200 Integration Potential in Photovoltaic Off-Grid Residential System in Poland—A Case Study


by
Korneliusz Sierpowski
1,2,
Przemysław Ptak
3,*,
Grzegorz Debita
1,2 and
Bartosz Polnik
2
1
Department of Computer Science and New Technologies, General Tadeusz Kościuszko Military University of Land Forces, ul. Piotra Czajkowskiego 109, 51-147 Wrocław, Poland
2
KOMAG Institute of Mining Technology, Pszczyńska 37 Street, 44-101 Gliwice, Poland
3
Department of Power Electronics, Gdynia Maritime University, 81-225 Gdynia, Poland
*
Author to whom correspondence should be addressed.
Energies 2026, 19(13), 3175; https://doi.org/10.3390/en19133175
Submission received: 20 May 2026 / Revised: 28 June 2026 / Accepted: 30 June 2026 / Published: 3 July 2026
(This article belongs to the Special Issue Power Systems: Stability Analysis and Control)

Abstract

This scientific article presents a comprehensive case study detailing the design of a fully off-grid household in Poland, utilizing an energy solution that combines high-pressure hydrogen energy storage and photovoltaic (PV) technology. In response to the growing demand for sustainable and self-sufficient energy sources, the current study investigates the efficiency and yearly energy balance of this innovative system. The off-grid household is powered by a hybrid system that seamlessly integrates PV panels to harness solar energy and a high-pressure hydrogen energy storage system for long-term energy management. The presented case study examines the design and performance of a system integrating solar energy production with hydrogen storage. Through an analysis of real-world data and operational parameters, this research contributes valuable insights into the viability of such an off-grid solution in Polish environmental conditions. These findings provided an interesting approach to off-grid residential systems, offering a glimpse into the possible future of residential energetic autonomy in the pursuit of a greener and more resilient energy landscape.

1. Introduction

During 2023, the Committee on Industry, Research and Energy (ITRE) in the European Parliament debated and voted on the amendments to the Energy Performance of Buildings Directive as part of the Fit for 55 package. The objective of this amendment is the modernization of both public and private buildings, both residential and non-residential—with the clear intention of significantly reducing home heating and hot water production costs, decreasing electricity consumption, and mitigating carbon dioxide emissions [1].
From 2028, it will be mandatory to install photovoltaic systems on the roofs of new buildings. Starting in 2026, all new public buildings, and from 2028, all other new buildings, are required to be carbon neutral. By no later than 2035 (or 2040, depending on the decision of the European Commission), the use of fossil fuels for heating both new and renovated buildings should be discontinued [2].
In the European Union, buildings are responsible for 43% of total energy consumption. Residential buildings account for approximately 60% of buildings’ energy consumption, which in total sums up to approximately 25% of total energy consumption in the European Union. Space heating consumes approximately 70% of household energy, while electrical appliances account for 13% and water heating is responsible for 14% [3].
In Poland, according to the WT 2021 standard [4] for new residential buildings built after 2020, buildings are required to have their maximum allowed annual demand for primary energy from non-renewable sources used for heating, hot water supply, cooling, and ventilation lowered, and compliance with certain thermal insulation standards, set by maximum allowed heat transfer coefficients for interior partitions (i.e., walls, roofs, floors, ceilings), as well as technical systems, is mandatory [4].
One of the solutions to fulfill Fit for 55 packet guidelines is to design fully off-grid households with zero carbon emissions. In this article, a proposal for a fully off-grid household in Poland integrated with novel hydrogen energy storage and photovoltaics is investigated.
A significant number of off-grid systems can be found in the literature. Off-grid systems are not only developed for remote locations with a lack of electricity or power-grid existence. One of the reasons for such developments is the need for passive household solutions, passive neighborhood concepts or off-grid solutions for automotive infrastructure.
The article [5] presents the Passive House standard as a key solution in energy-efficient and sustainable construction. It discusses the main principles, such as very high thermal insulation, air-tightness, windows with extremely low heat transfer coefficients, elimination of thermal bridges, and mechanical ventilation with highly efficient heat recovery, which together enable a reduction in heating and cooling energy demand by up to 80–90% compared to conventional buildings. The text emphasizes the importance of passive heat gains (from solar radiation, occupants, and household appliances) while ensuring high thermal comfort, excellent indoor air quality, and very low operating costs. It treats the Passive House concept as a comprehensive approach that integrates energy efficiency with environmental protection and sustainable development [5]. A 2024 article [6] shows a sustainable and self-sufficient house using novel PV-hydrogen pilot technology. It presents the design, construction, and two-year operational results of a hybrid photovoltaic-hydrogen demonstrative pilot system (PVHyP) implemented in a social housing unit in Novales, Spain. The system integrates an 8 kWp PV installation, 9.6 kWh lithium-ion batteries, an anion exchange membrane electrolyzer, a proton exchange membrane fuel cell, and hydrogen storage (including a buffer tank and high-pressure tanks up to 300 bar), controlled by a PLC-based energy management strategy (EMS) with SCADA for remote monitoring and automated operation. By utilizing real consumption data (average ~2513 kWh/year) and optimizing the setup to minimize the net present cost and levelized cost of energy, the pilot achieved 100% electrical self-sufficiency and grid independence under varying climatic conditions, producing 13,327 kWh from PV over two years, and generating 271.72 Nm3 (≈24.5 kg) of green hydrogen, with an overall system efficiency of 47.5%. This resulted in avoiding 2258 kg of CO2 emissions, saving 15,199 kWh of primary energy, and reducing electricity bills by approximately €1170 (100% savings), directly benefiting vulnerable residents at risk of energy deficit while demonstrating the feasibility of renewable hydrogen for seasonal energy storage and decarbonization in the residential sector [6].
Construction has begun on a groundbreaking low-emission residential development in Śrem, Poland, led by Śremskie TBS (Towarzystwo Budownictwa Społecznego, Śrem Social Construction Association). The project involves building eight four-story buildings with a total of 195 fully finished (“turnkey”) apartments ranging from 29 to 72 m2 (1- to 4-room units), delivering over 10,000 m2 of usable space. Key features include preparation for planned hydrogen-based heating systems, hybrid heating combining ground-source heat pumps and connection to the district heating network, photovoltaic panels, vertical-axis wind turbines, and other renewable energy solutions, resulting in very low (below 52 kWh/m2) annual energy consumption. The use of prefabrication technology by general contractor Grupa Agrobex will enable rapid completion in under 10 months (within one year). The development also encompasses elevators for accessibility, balconies or terraces, internal roads, 120 parking spaces, bike storage, sidewalks, and recreational areas. Financed with a record-breaking 121.7 million PLN (primarily from external funds including the National Economy Bank, Government Housing Development Fund, and the National Recovery Plan), this marks one of the largest and most innovative affordable social housing projects in the city’s history, emphasizing sustainability, low emissions, and readiness for green hydrogen integration [7].
Analysis [8] of 168 studies published between 2002 and 2019 on off-grid hybrid renewable energy systems (HRES-OFF) for remote communities reveals that the most typical configurations integrate photovoltaic (PV) panels and wind turbines as primary renewable sources, often supplemented by diesel generators for backup and batteries for energy storage. The predominant setups include PV–wind–diesel–battery (the most frequently examined, particularly in tropical regions with 16 studies), PV–diesel–battery (9 studies in tropical zones), and PV–wind–battery (7 studies in tropical areas). Diesel generators serve as the preferred backup strategy in 61.3% of the cases (103 out of 168 studies), addressing the intermittency of renewables and low plant factors of PV and wind. Batteries emerge as the dominant storage technology, utilized in 80.4% of the reviewed systems, primarily lead-acid types due to their maturity, cost-effectiveness, and availability [9]. Photovoltaic systems dominate as the leading renewable component across all latitudes, frequently combined with wind energy, while fully renewable configurations (without diesel) remain less common, appearing mainly in locations with favorable resource complementarity or stringent environmental constraints. Alternative storage options, such as hydrogen (with fuel cells) and pumped hydro storage, are applied in only about 7.7% of cases each, and marine renewables (e.g., wave or tidal energy) are significantly underutilized—despite nearly half of the studies focusing on coastal or island communities—being incorporated in just 15 investigations owing to economic, technological, and developmental barriers [8]. These trends underscore the reliance on mature, accessible PV and wind technologies paired with conventional diesel backup and battery storage to ensure reliability in isolated settings, while highlighting the need for greater emphasis on 100% renewable solutions to advance sustainability.
The aim of this study was to propose a novel approach to the off-grid household model using photovoltaics, a vanadium redox flow battery, a high-pressure alkaline electrolyzer (HiPE200 technology being researched in ITG KOMAG), hydrogen storage at a pressure of 200 bars, and a hydrogen furnace. Such a system is thought to fulfill the electrical energy and heat demand for a chosen location in Poland. Photovoltaics are known for their reliability, low efficiency degradation during their lifetime and low maintenance costs [9,10,11]. The lead-acid battery, lithium-ion battery and vanadium redox flow battery (VRFB) are compared in Table 1. The comparison shows that VRFB technology has the highest risk of discharge possibilities and number of charging–discharging cycles. Despite lower efficiency and higher investment costs, VRFBs seem to be a good choice in the long term. Also, their lifetime is multiple times longer than other battery technologies. It is worth noting that VRFBs offer decoupled power and accumulated energy parameters, which offers unique flexibility during the system performance design process in comparison with other electrical energy storage solutions [12]. The heat demand would be fulfilled via combustion of hydrogen fuel in hydrogen boilers. Hydrogen would be produced using HiPE200 (high-pressure electrolyzer 200 bars) technology [13].
According to the comparison of different types of batteries in Table 1, vanadium redox flow batteries boast the highest number of life cycles. One of the disadvantages is the higher installation cost (CAPEX), but the energy installation cost is comparable to the other types. That means that VRFB technology is more affordable for scalable projects. Thus, because of longevity and good scalability, the VRFB technology was considered in the proposed system for energy storage and buffering.
This article consists of five chapters. The Section 2 describes the architecture of the proposed system, VRFB technology in general and HiPE200 technology. In the Section 3, the methodology of this research is described, including the detailed mathematical model of the proposed system, block diagram of the Python program that performs the numerical calculations describing the proposed model, and input data for the model. The Section 4 shows results of the performed calculations. The Section 5 summarizes the research and shows the conclusions.

2. System Description and Modeling Methodology

2.1. Proposed System

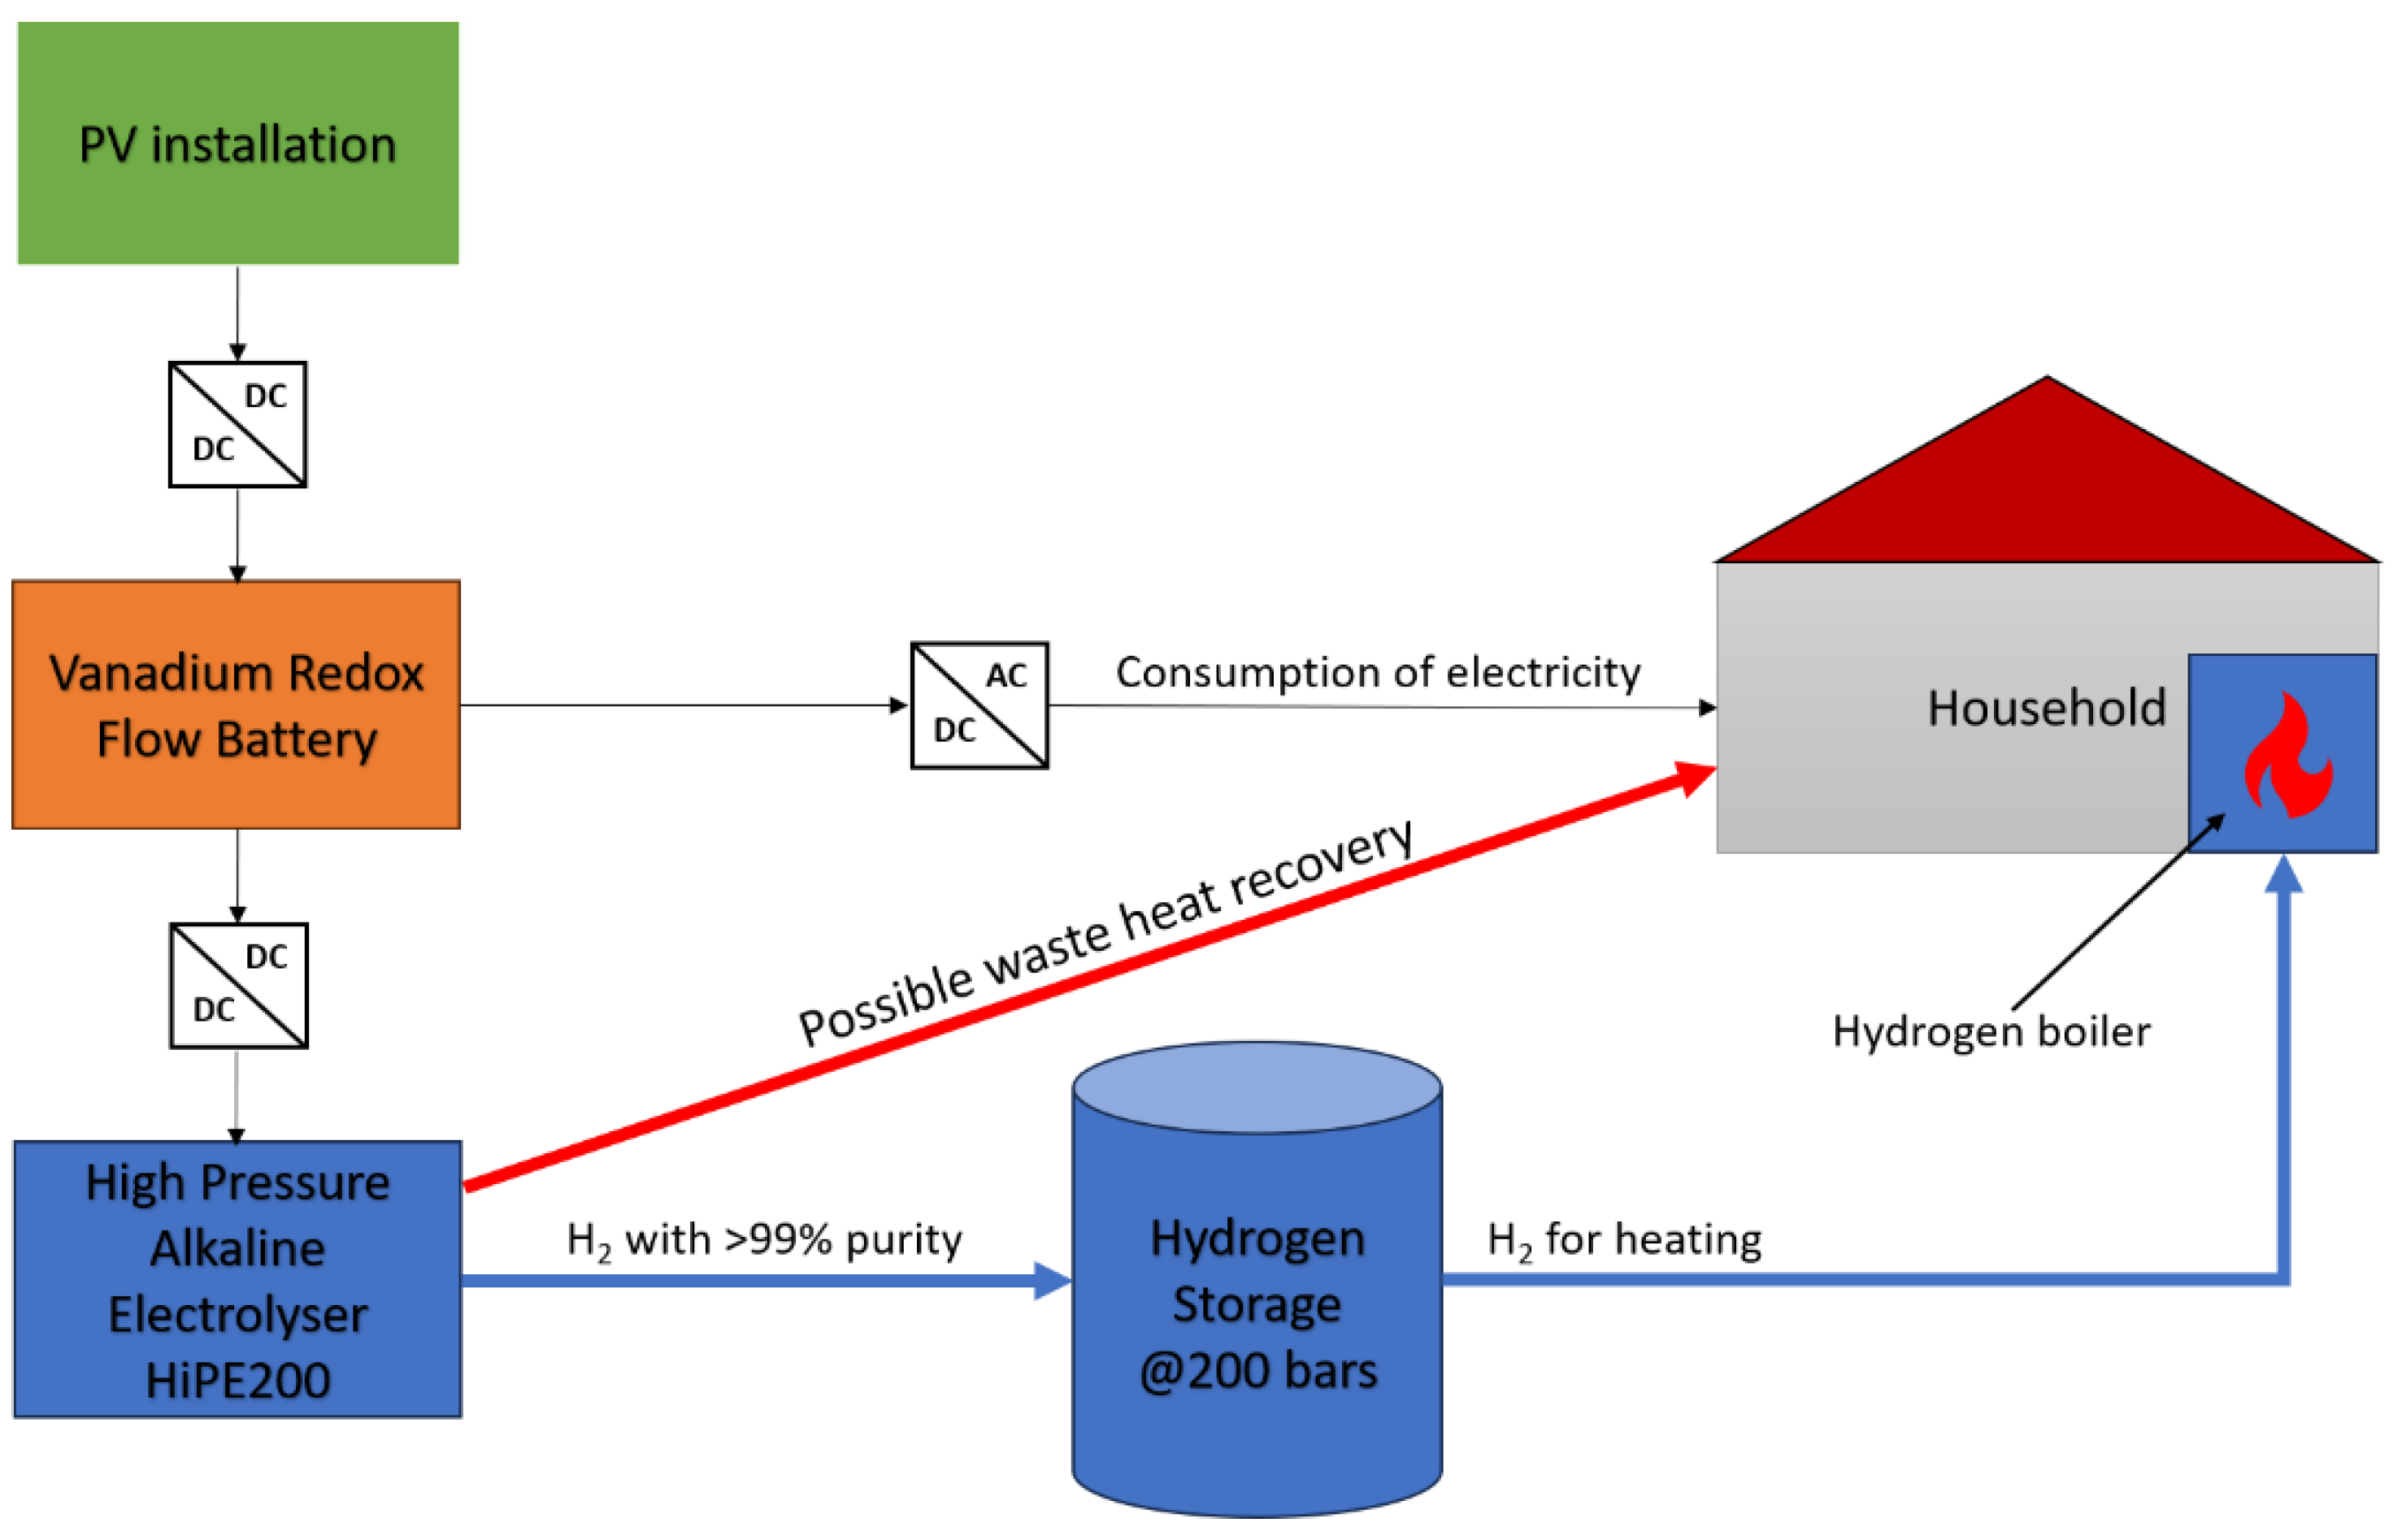
The proposed system consisted of hydrogen storage and an electrolyzer working at pressures above 200 bars, powered by on-roof photovoltaics. The working pressure of the system was chosen to make the cost of installation affordable and technologically available on the market. The 200-bar hydrogen tanks are common in industrial applications [19,20]. The assumed household was located in Rawicz, Poland, and the floor area is 150 m2. The assumed household was assumed to fulfill the WT 2021 standard requirements. The photovoltaic array slope was 40 degrees, and the azimuth was −3 degrees and was assumed to be roof-mounted or to be fixed to the ground. The system schematic shows the possible heating of the water using electricity. water heating from a hydrogen boiler was assumed. The proposed system needed no hydrogen compressor, because the electrolyzer produced hydrogen at a 200-bar pressure. The system scheme proposal is shown in Figure 1.
Figure 1 shows a schematic overview of the proposed system, consisting of a PV installation connected to a VRFB via a DC-DC converter, and a VRFB connected to the household via a DC-AC converter and connected via a DC-DC converter to the HiPE200 electrolyzer (KOMAG Institute, Gliwice, Poland), which is connected with the hydrogen storage, which in turn is connected with the hydrogen boiler.
The system consists of a photovoltaic array, two DC-DC converters, one DC-AC converter, a vanadium redox flow battery, a high-pressure electrolyzer and hydrogen storage. The main goal of the system is to utilize year-round excess electrical energy to convert it into hydrogen and use the hydrogen for heating a household with a hydrogen boiler. Such an approach is a result of the assumption of a household that has no possibility of being integrated with the existing grid infrastructure or is not integrated on purpose and has to be self-sufficient energetically all year round. Also, a lack of access to fossil fuels like diesel or gasoline was assumed, so there was no possibility to support the proposed system with commonly used diesel generators. Also, the proposed system should have low maintenance costs and infrequent needs for system part replacements. VRFB technology gives an opportunity to last for at least 25 years of operation. The parameters of the system are shown in Table 2.
Round-trip efficiencies (RTEs) exceeding 85% have been demonstrated in small-scale laboratory cells, while commercial kW-scale systems typically achieve 70–80% due to auxiliary losses [15]. DC-DC converter, DC-AC converter, and hydrogen furnace efficiencies are based on the available literature [23,24,25].

2.2. Vanadium Redox Flow Battery Technology

Vanadium redox flow batteries (VRFBs) are currently among the most technologically mature and commercially deployed flow battery technologies for grid-scale energy storage [26]. Their operation relies on reversible redox reactions of the V4+/V5+ pair (catholyte) and V2+/V3+ pair (anolyte) in a vanadium sulfate solution in sulfuric acid, enabling independent scaling of power and energy capacity [12]. The main electrochemical reactions occurring in the cell during discharge are shown below.
Anode (negative electrode − oxidation) [12]:
V2+ → V3+ + e   (E0 ≈ −0.26 V vs. SHE)
Cathode (positive electrode − reduction) [12]:
VO2+ + 2H+ + e → VO2+ + H2O (E0 ≈ +1.00 V vs. SHE)
Overall cell reaction [12]:
VO2+ + V2+ + 2H+ → VO2+ + V3+ + H2O (E0 ≈ 1.26 V)
During charging, the reactions proceed in the reverse direction. The main advantages of VRFBs include an exceptionally long cycle life (over 20,000 cycles while retaining >80% of nominal capacity) [17,26], absence of cross-contamination degradation due to the use of the same element on both sides of the cell [12], high safety (aqueous electrolyte, no thermal runaway reactions) [14,26], as well as the ability to undergo full and deep discharge without significant lifetime reduction [12].
In recent years, significant progress has been made in critical components. Advanced membrane modifications have substantially improved the proton conductivity-to-vanadium ion selectivity ratio, resulting in higher energy efficiency (up to ~85% under realistic conditions) [5]. Novel approaches to carbon electrode modification have enhanced redox reaction kinetics and reduced polarization [6]. Improvements in electrolyte formulation and additives have also contributed to better thermal stability and overall performance [12]. Despite these advances, major challenges remain. These include a low energy density (~25–40 Wh·L−1), high cost of the vanadium electrolyte, and considerable system complexity due to pumps and electrolyte circulation [12,26]. Current research directions focus on increasing vanadium solubility, improving electrolyte thermal stability across a wide temperature range, and further cost reduction through new electrolyte synthesis methods and vanadium recycling [12]. However, VRFBs remain one of the few energy storage technologies that have reached the commercial MW/MWh scale and are being intensively deployed in grid projects worldwide, particularly in applications requiring short-duration storage (6–12 h) due to self-discharge comparable to lead-acid batteries [14,18].

2.3. HiPE200 Technology

The main objective of the project was to design, build and test a prototype of an alkaline electrolyzer operating under a pressure of 200 bars. The research aimed to confirm the efficiency and performance of the alkaline electrolysis process over a relatively wide range of pressure and temperature, as well as to achieve a minimum Technology Readiness Level (TRL) of 4—the level reached after completion of proof-of-concept studies. As part of the completed project, a high-pressure alkaline electrolyzer was developed at Technology Readiness Level 4 (TRL-4).
On the constructed test stand, verification tests were carried out to confirm the assumptions and parameters of the project product. The device achieved leak-tightness at pressures in the order of 200 bar, as well as electrical efficiency (LHV) in the hydrogen production process above 50% at a unit current load of 400 mA/cm2 on the electrode. The purity of the produced hydrogen exceeded 98%. The Institute plans to further develop the product by obtaining funding to reach higher Technology Readiness Levels.

3. Methodology

The photovoltaic technology used was crystalline silicon. The PV-based energy production was calculated using PVGIS with SARAH3 solar radiation and meteorological data. The efficiency of the photovoltaic array is temperature-dependent and was calculated in PVGIS [27,28,29]. The slope angle of the PV array was 40 degrees, and the azimuth angle of the PV array was −3 degrees. The chosen location was Rawicz, Greater Poland Voivodeship, Poland. The lower heating value of hydrogen is 33.3 kWh/kg [30]. It was assumed that electrolysis occurs for a maximum of 8 h per diem, during the nighttime. Such a conservative approach to energy management strategy ensures that there will be no blackouts in the system during the day if all the energy surplus was consumed and the electrolysis process was steady and efficient under the optimal parameters of work. The energy density of the VRFB electrolyte was conservatively assumed to be 25 Wh·L−1. The impact of VRFB battery self-discharge came to 0.1% to 0.4% of total capacity in the 24 h cycle and therefore was negligible.

3.1. Energy Balance

Overall energy balance for the proposed system was calculated assuming the daily electrical energy balance and monthly heat demand. Calculations were divided into two steps: daily energy balance and yearly energy balance. The balance was calculated using Equations (1)–(16). Equation (1) shows the total yearly energy balance of the system, calculated as the sum of all daily energy surpluses minus the total annual heat demand of the household:
E = Δ E i = 1 n E h r , i
where n denotes number of days in the given period, E denotes the total yearly energy balance, ΔE denotes the sum of the daily surplus energy production and Ehr,i denotes a reduced heat energy demand.
Equation (2) defines the total annual energy surplus as the summation of daily energy surpluses over the period considered:
Δ E = i = 1 n Δ E i
where n denotes the number of days in the given period, ΔE denotes the sum of the daily surplus energy production and ΔEi denotes the daily surplus of energy production.
Equation (3) determines the daily net PV surplus by subtracting the daily household electricity demand from the daily PV energy production:
Δ E P V r , i = E P V r , i E e l r , i
where ∆EPVr,i denotes the daily net PV surplus, EPVr,i denotes reduced daily PV energy production and Eelr,i denotes the daily reduced household electricity demand.
Equation (4) determines the actual daily energy available for hydrogen production by applying the efficiencies of the DC-DC converter and the electrolyzer to the daily PV surplus:
Δ E i = Δ E P V r , i · η D C D C · η e l e c t r o l y s i s
where ΔEi denotes the daily surplus of energy production, ∆EPVr,i denotes the daily net PV surplus, ηDC-DC denotes the efficiency of the DC-DC converter and ηelectrolysis denotes the efficiency of electricity conversion to hydrogen.
Equation (5) determines the actual daily PV energy production reduced due to the efficiency of the DC-DC converter and VRFB energy storage:
E P V r , i = E P V , i · η R T E · η D C - D C
where EPVr,i denotes reduced daily PV energy production, EPV,i denotes daily PV energy production, ηRTE denotes the round trip efficiency of a vanadium flow battery and ηDC-DC denotes the efficiency of a DC-DC converter.
Equation (6) shows a simplified form expressing daily PV generation based on the peak power of the installed PV system:
E P V , i = P P V · E p u , i
where EPV,i denotes daily PV energy production, PPV denotes the installed peak power of PV installation and Epu,i denotes daily solar irradiation per unit peak power.
Equation (7) represents the actual daily household electricity demand, which is adjusted by dividing the end-use electricity by the efficiency of the DC-AC inverter:
E e l r , i = E e l , i η D C - A C
where Eelr,i denotes the daily reduced household electricity demand, Eel,i denotes the daily electrical energy demand of the respective household and ηDC-AC denotes the efficiency of the DC-AC converter.
Equation (8) shows the actual heat demand of a hydrogen furnace considering its efficiency:
E h r , i = E h , i η f u r n a c e
where Ehr,i denotes the reduced heat energy demand, Eh,i denotes the daily household heat energy demand and ηfurnace denotes the efficiency of a hydrogen furnace.
Equation (9) represents the maximum electrolysis power based on the assumed time of electrolysis:
P e l e c t r o l y s e r = max ( Δ E i ) t e l e c t r o l y s i s
where Pelectrolyzer denotes the electrolyzer electrical power, ΔEi denotes the daily surplus of energy production and telectrolysis denotes the operating time of the electrolyzer per diem.
Equation (10) determines the total volume of demanded hydrogen according to the actual heat demand during the given period in m3:
V V H 2 = i = 1 n E h r , i L H V · ρ H 2 @ 200 b a r
where n denotes number of days in the given period, Ehr,i denotes reduced heat energy demand, VVH2 denotes the yearly volume of hydrogen storage at 200 bars, LHV denotes the lower heating value of hydrogen and H2@200bar denotes the density of hydrogen at 200 bars.
Equation (11) determines the total demanded hydrogen volume according to the actual heat demand during the given period in kWh:
V H 2 = i = 1 n E h r , i
where n denotes the number of days in the respective time period, VH2 denotes the yearly volume of hydrogen storage at 200 bars in equivalent energy and Ehr,i denotes the reduced heat energy demand.
Equation (12) determines the total volume of produced hydrogen according to the actual heat demand during the respective time period in m3:
V p V H 2 = Δ E L H V · ρ H 2 @ 200 b a r
where VpH2 denotes the yearly volume of produced hydrogen in equivalent energy, ΔE denotes the sum of the daily surplus energy production, LHV denotes the lower heating value of hydrogen and H2@200bar denotes the density of hydrogen at 200 bars.
Equation (13) determines the total volume of produced hydrogen according to the actual heat demand during the given period in kWh:
V p H 2 = Δ E
Equation (14) determines the volume of hydrogen stored in the tank when there is daily excess energy after covering the daily heat demand during the given period:
V tan k H 2 = i = 1 n ( ( Δ E i E h r , i ) / L H V / ρ H 2 @ 200 b a r i f ( Δ E i E h r , i ) > 0   k W h )
where n denotes the number of days in the given period, ΔEi denotes the daily surplus of energy production, Ehr,i denotes the reduced heat energy demand, LHV denotes the lower heating value of hydrogen and H2@200bar denotes the density of hydrogen at 200 bars.
Equation (15) shows the maximum volume of the VRFB energy storage respecting the assumed energy density of the electrolyte:
V V R F B = max ( Δ E P V r , i ) E ρ V
where VVRFB denotes the daily volume of the VRFB electrolyte tank, EPVr,i denotes the reduced daily PV energy production and E⍴V denotes the volumetric energy density of the VRFB electrolyte.
Equation (16) determines the power output of the VRFB energy storage to empower the electrolysis process:
P V R F B P e l e c t r o l y s e r η D C - D C
where PVRFB denotes the VRFB stack power, Pelectrolyzer denotes the electrolyzer electrical power and ηDC-DC denotes the efficiency of the DC-DC converter.
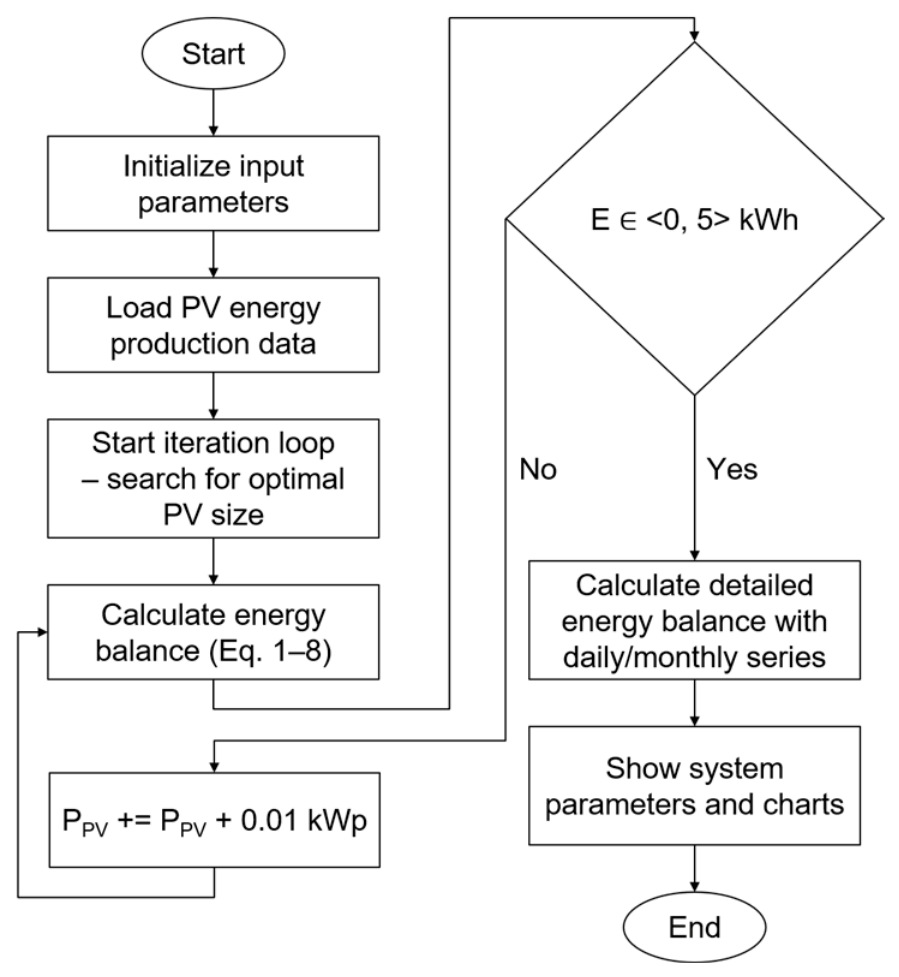
Figure 2 shows the algorithm of the performed calculations using a simplified flowchart.
The numerical calculations were performed using the Python 3.14 programming language, Pandas 3.03, NumPy 2.4.6 and Matplotlib 3.10.9 modules. The simplified algorithm is shown in Figure 2. The energy balance was determined based on the daily average PV production, daily average electricity demand, and monthly heat demand of the household. The parameters of the proposed system were optimized to obtain a yearly energy balance, where 0 kWh < E < 5 kWh. The value of the convergence criterion was chosen deliberately, as it causes PV sizing errors lower than the iteration step (0.01 kWp).
A representative monthly energy consumption profile for a typical new single-family detached house in Poland was developed for the purposes of this study. The building was assumed to have a heated floor area of 140 m2 and to be occupied by 3–4 people [31,32]. It was designed in accordance with the current Polish Technical Conditions 2021 (WT 2021) standard [4], resulting in an annual thermal energy demand of approximately 100 kWh/m2, which corresponds to a total of 14,000 kWh per year for space heating and domestic hot water (DHW) combined [32,33].
Electricity consumption was limited to basic household needs (lighting, appliances, and electronics, excluding any form of electric heating or heat pumps) and set at 2800 kWh per year (approximately 233 kWh per month on average) [31]. The monthly distribution of space heating demand was calculated proportionally to heating degree days (HDD) with a base temperature of 18 °C, using typical meteorological year (TMY) climatic data representative of the Polish climate [34]. Domestic hot water consumption was modeled as nearly constant throughout the year at approximately 2850 kWh annually (200–210 kWh per month), based on standard per-capita norms of 40–50 L of hot water per person per day at a temperature rise of 45 K [32].
Electricity demand exhibited moderate seasonal variation, with an approximately 12% increase during the winter months due to shorter days and higher indoor occupancy [1]. Heating demand reached its peak in January and December and dropped to nearly zero in July and August, which is consistent with the seasonal pattern of heating degree days in Poland [34].
All values were derived from official national statistics and reference building profiles. The monthly thermal energy profile (space heating and DHW) was developed by combining the nearly constant DHW component with the HDD-proportional space heating demand, following the methodology applied in Polish energy performance calculations and reference building models [32,33].
All the parameters were gathered using PVGIS and SARAH3 [27,28,29] for the meteorological period 2023–2025, and they are shown in Table 3.
Data gathered in Table 3 were used as input parameters to the mathematical model of the proposed system. It is worth noting that all the parameters may differ depending on the individual habits of the household residents. The sum of energy output per PV unit equals 1057.2 kWh/kWp/year.

3.2. Economic Analysis

To determine the economic feasibility of the proposed hybrid energy system, a comprehensive techno-economic assessment was carried out. The analysis involved a detailed calculation of capital expenditures (CAPEX), operational expenditures (OPEX), levelized cost of energy (LCOE), and net present value (NPV) over the assumed system lifetime, using realistic component costs, energy prices, and financial parameters such as discount rate and project duration. Long-term forecasting of electricity prices is inherently challenging, and the projections presented in [35] are now outdated; therefore, a fixed (constant) value at the level of 200 $/MWh was adopted. The assumed discount rate is 5% and the project duration is assumed to be 25 years. Input parameters for CAPEX, LCOE and NPV calculations are gathered in Table 4.
The levelized cost of energy (LCOE) was calculated using parameters from Table 4. The LCOE is described with the following formula [38,39,40]:
L C O E = t = 0 n I t + M t + F t 1 + r t t = 0 n E t 1 + r t
where It denotes investment expenditures (CAPEX) in year t, Mt denotes operations and maintenance expenditures (OPEX) in year t, Ft denotes fuel expenditures in year t, Et denotes electricity generated (or useful energy produced) in year t, r denotes the discount rate, n denotes the lifetime of the system in years, and t denotes the year index (from 0 to n). Ft equals 0 in renewable energy systems that use no diesel backup generators.
The net present value was calculated using the parameters from Table 4. The NPV is described with the following formula [38]:
N P V = I 0 + t = 1 n C F t 1 + r t
where CFt denotes the net cash flow in year t (revenues minus costs), I0 denotes the initial investment at time zero, r denotes the discount rate, n denotes the project lifetime in years, and t denotes the time period (year index). In the considered cases, I0 equals investment expenditures (It, CAPEX). In addition, the NPV analysis did not include potential electrical and heating savings, as the building considered was assumed to be a new investment.

3.3. Model Sensitivity Analysis

To evaluate the robustness and practical feasibility of the proposed hybrid energy system, a comprehensive sensitivity analysis using OTA [41] was conducted. The analysis showed how system sizing requirements and the energy balance change under variations in key parameters: electrolyzer efficiency (45–65% LHV range), VRFB RTE (70–85%), PV degradation (0.5–1% per year), and heating demand ±20%. The main goal of the sensitivity analysis was to determine the influence of selected input parameter change (presented in Table 5) on the LCOE. Snow shading was assumed on the basis of [42,43,44]. Sources [42,43,44] state that in the Polish IWMW (Institute of Meteorology and Water Management) Meteorological Yearbooks for similar lowland stations in western and central Poland, typically 35–45 days with snowfall per year were recorded in recent years (e.g., around 40 days in 2022–2024). The Municipal Climate Change Adaptation Plan for the City of Rawicz reports for the region (data from Leszno, IWMW) states that there are approximately 40 days with snow coverage per season and an average potential snow season length of approximately 100 days. The number of days with actual snowfall is usually slightly higher than the number of days with snow cover, as snow may fall and melt on the same day. The time period from November to March is 151 days, and assuming that the snow shading occurs between 40 and 100 days, the assumption of 50% of normal PV production (−12.17% annual yield) is fully justified.

4. Results

4.1. Proposed System

Energy balance equations were numerically solved with the condition of 0 kWh < E < 5 kWh. The presented results fulfill the condition with E = 4.04 kWh. Table 6 shows the calculated parameters of the system.
The baseline system should consist of at least 33.32 kWp (in the last year of the exploitation period) worth of PV arrays, 24.78 kW worth of HiPE200 electrolyzers, 13.35 m3 worth of hydrogen tanks, which corresponds to 193.3 kg, and a VRFB with over 26.08 kW of power and 4.36 m3 of volumetric capacity or 109 kWh of electrical capacity.
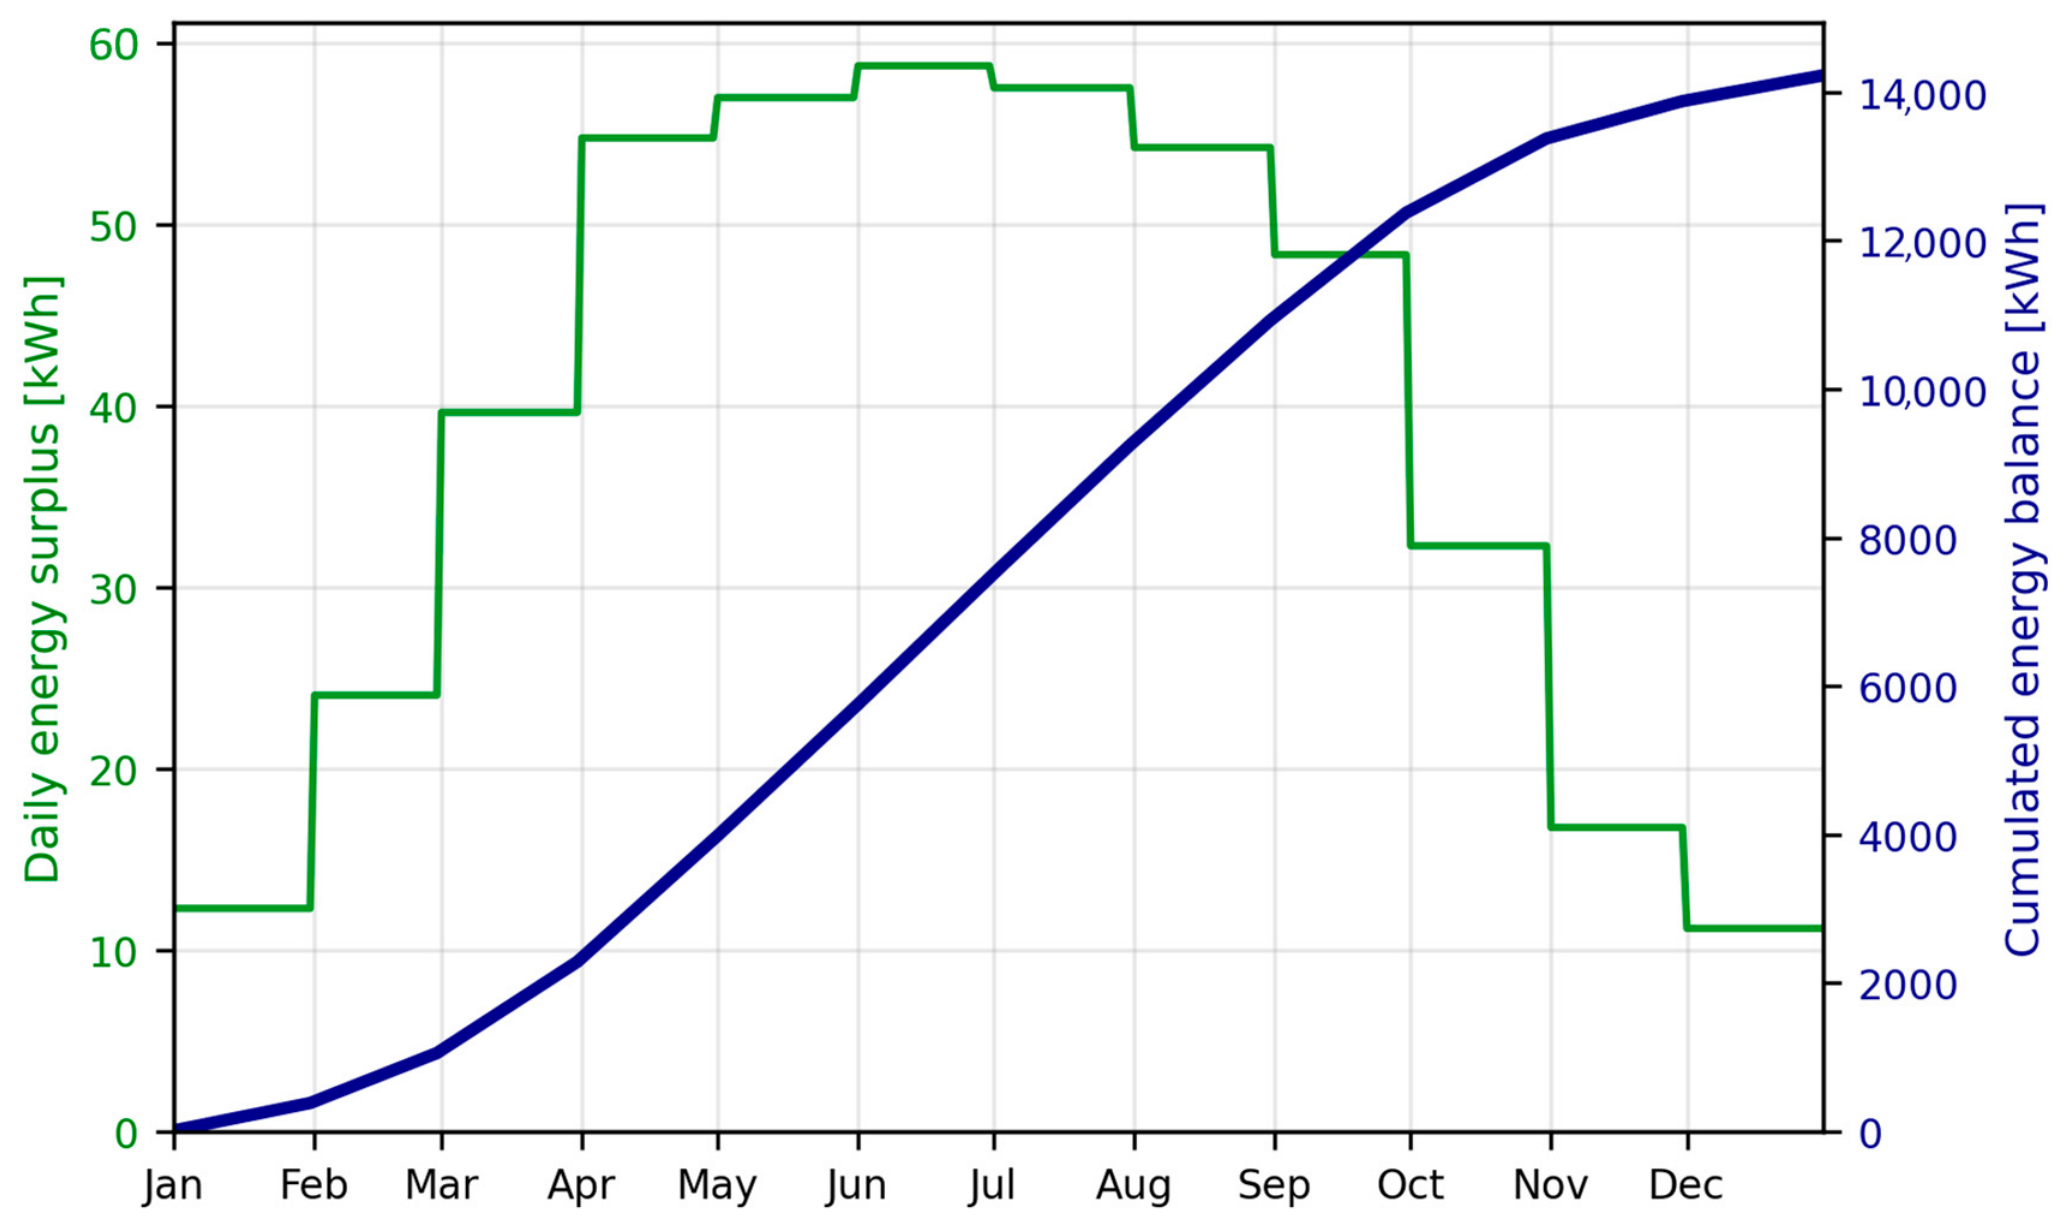
Figure 3 shows the daily energy surplus and cumulated energy balance in the respective time period. The optimal PV size found guarantees that no days during the respective time period exhibit energy deficiency.
Figure 3 shows that the cumulated energy in the respective time period was over 14 MWh, while the maximum value of the daily energy surplus was almost 60 kWh in June. The lowest values of daily energy surplus were calculated during the winter months—December and January. Electrical energy produced by the PV installation was not sufficient to fulfill the total energy demand of the household considered. Therefore, all of the accumulated energy was used to produce hydrogen for heating purposes.
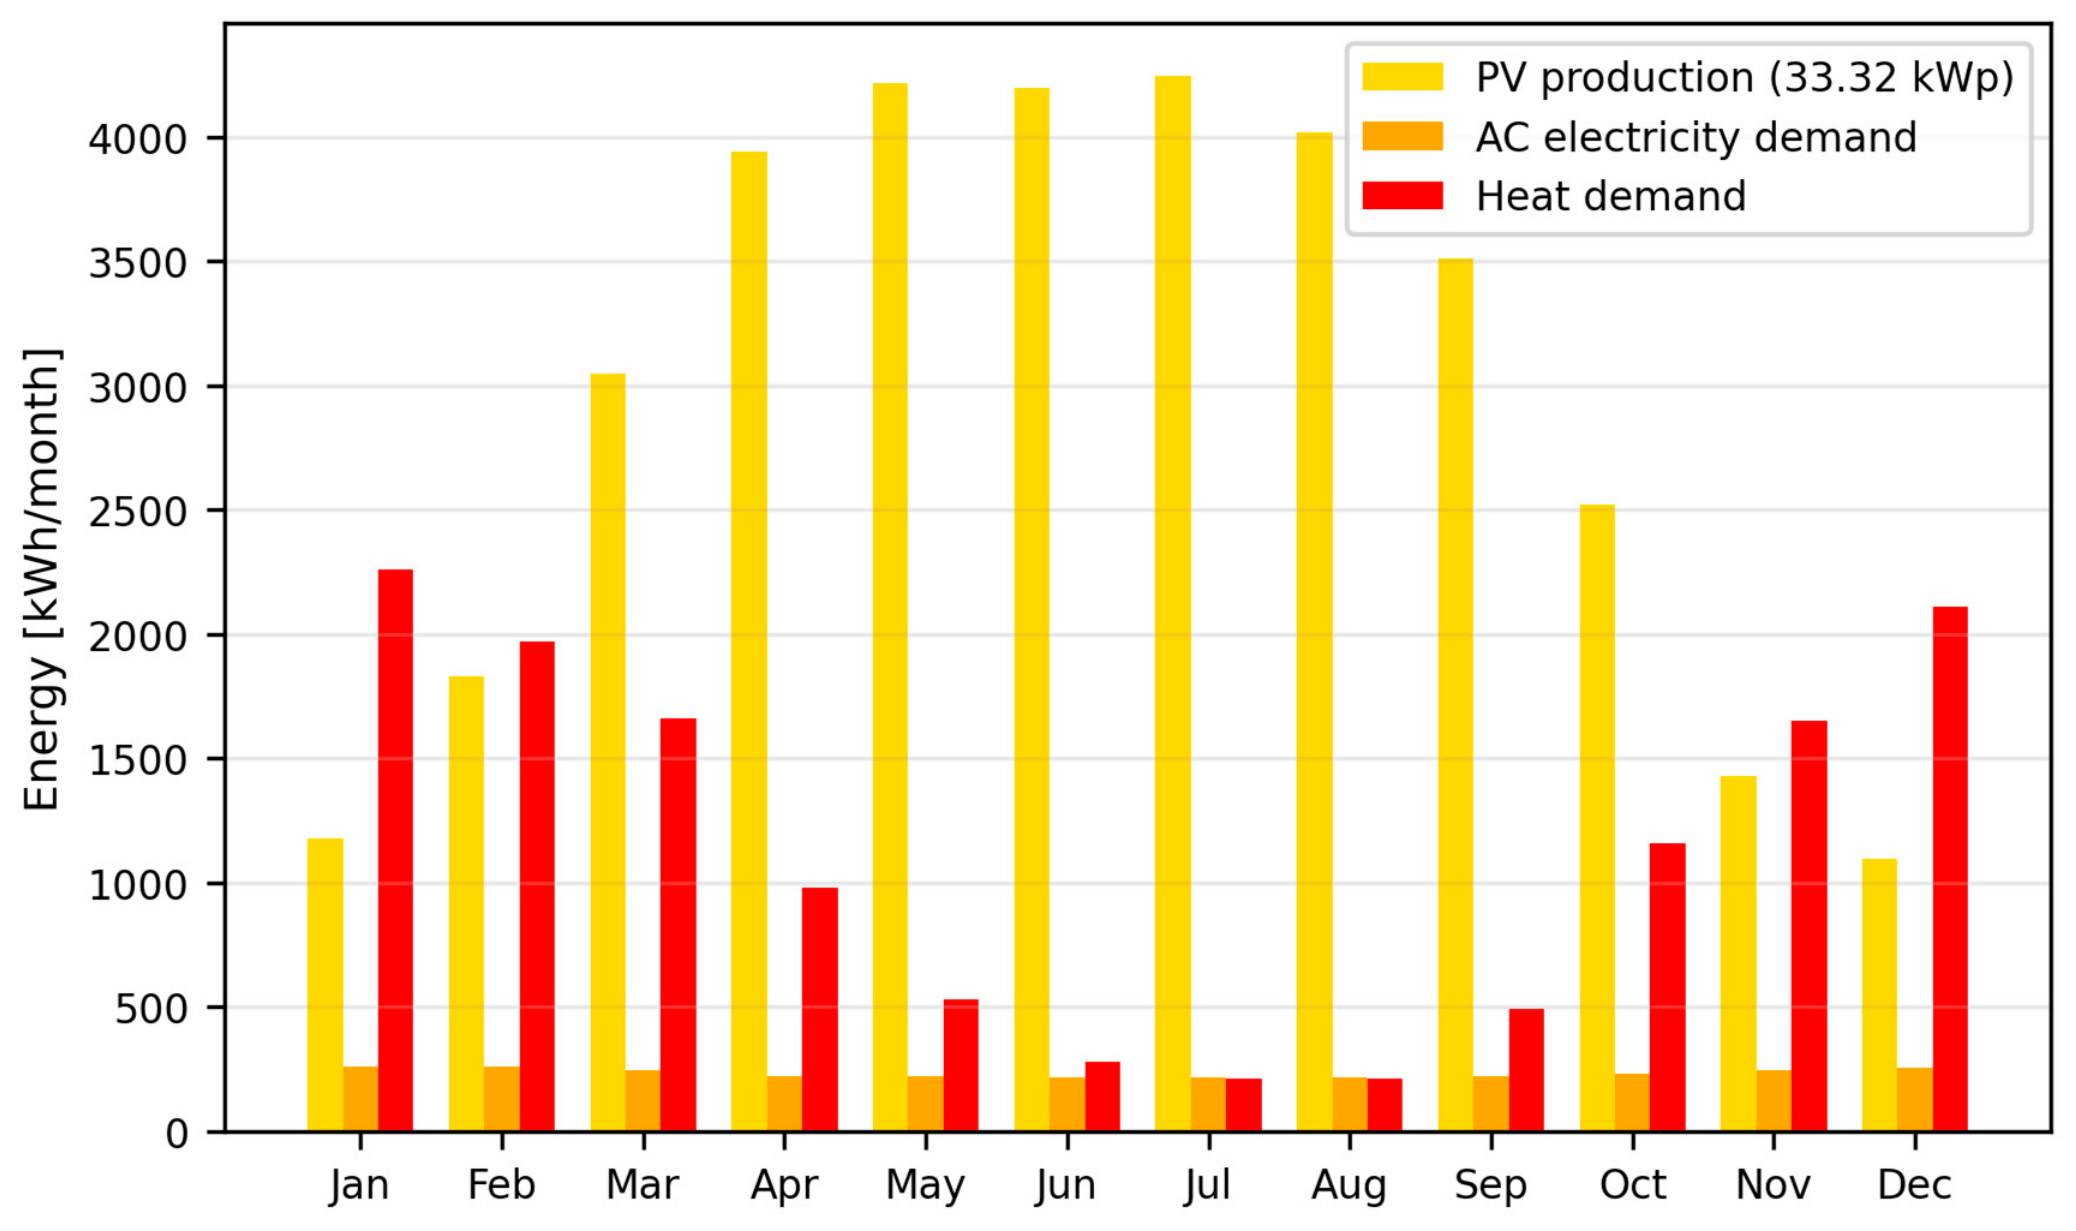
Figure 4 shows the PV energy production, electricity demand and heat demand in the months of the time period considered.
Figure 4 shows that during summertime (June, July and August), PV energy production was stable and reached over 4 MWh of energy per month, while the heat demand was minimal. The AC electricity demand was quite stable during the respective time period. Energy produced by the PV installation in the winter months was insufficient to cover heat demand. It is worth noting that during winter, snow could deteriorate the efficiency of the PV modules, so hydrogen storage is an appropriate solution for long-term energy storage for heating purposes.
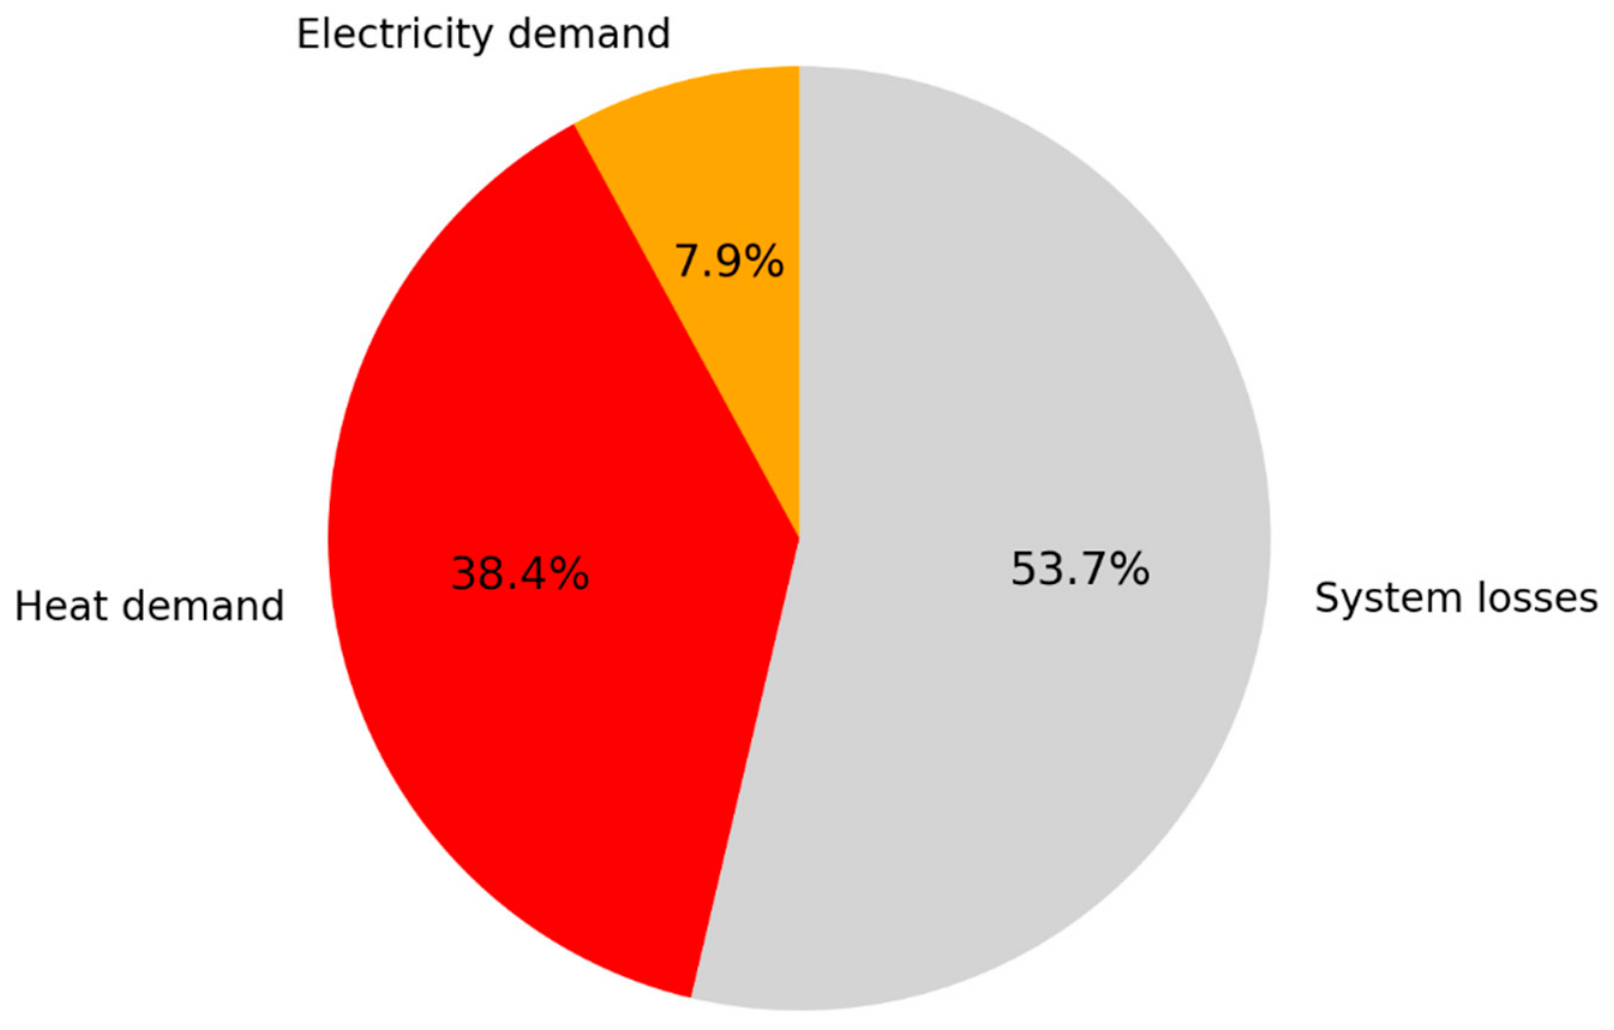
Figure 5 visualizes the energy share in the system.
Figure 5 shows that 53.7% of the total energy produced in the proposed system was lost during the operation of the system. Only 7.9% was directly used as electricity and 38.4% was used to fulfill the heat demand of the household considered. Despite system losses reaching over half of the energy produced in the household, the heat demand could be fulfilled using hydrogen storage. System losses determine the oversizing of the PV installation. The main cause of high system losses is electrolyzer efficiency.
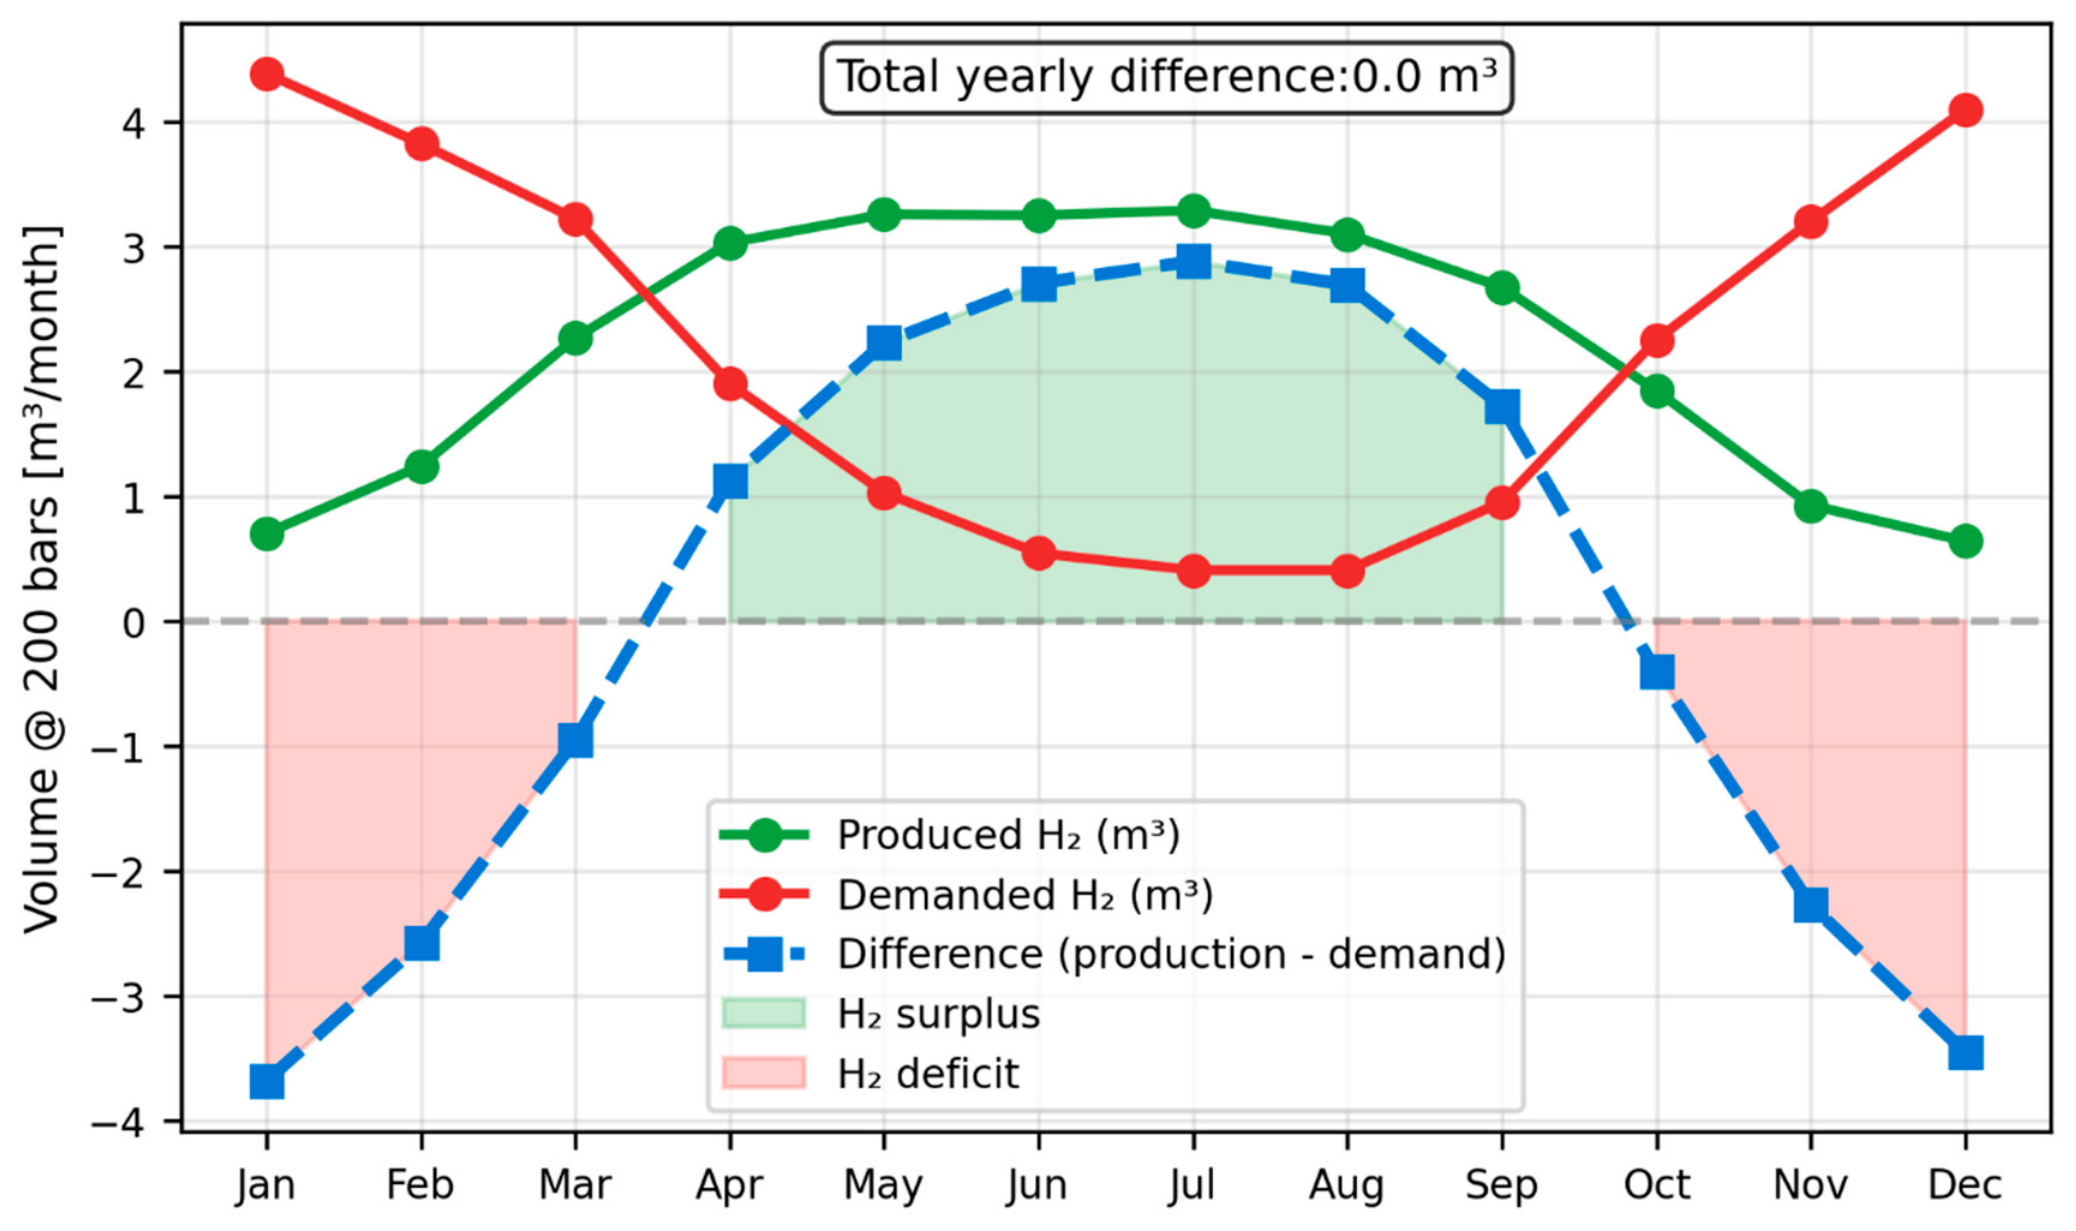
Figure 6 shows the volumetric balance of demanded and produced hydrogen.
Figure 6 shows that months from October to February exhibited energy deficiency, and the total balance exhibited energy overproduction from April to August. March and September are so-called swing months when it comes to energy surplus or deficit. It is worth noting that these characteristics are valid only for the chosen location and the assumed input parameters of the proposed system.
The vast amount of heat demand is related to colder months in Poland associated with autumn, winter and early spring. Due to hydrogen overproduction and storage, it is possible to fulfill demands of the fully off-grid household in a given time period. Results shown above prove that reaching a state of a fully off-grid household in the Polish climate is possible using only PV, VRFB and HiPE200 technology.

4.2. Economic Analysis and Model Sensitivity

The capital expenditure (CAPEX) of the system came to 363,359 $. The baseline system NPV came to −403,618.74 $, which equals the total loss on investment during the 25-year period of operation of the proposed system. Despite significant net loss, it is worth noting that the system is proposed for buildings and households being isolated from existing grid infrastructure on purpose. Further economic analyses were conducted, and a sensitivity analysis on levelized cost of energy was performed. Table 7 presents the results of a deterministic, individual sensitivity analysis examining how deviations in selected input parameters affect the levelized cost of electricity (LCOE) of the modeled off-grid system.
The baseline configuration yields an LCOE of 2045.01 $/MWh. The largest cost increases arise from lowering the HiPE200 conversion efficiency to 45% LHV (+19.24%) and from raising the heating demand by 20% (+17.88%). The snow-shading scenario (detailed in Table 5) raises the LCOE by 16.9%. A 1% annual PV degradation rate increased the LCOE by 6.56%. In contrast, raising HiPE200 efficiency to 65% LHV reduced the LCOE by 8.75%, while an 20% reduction in heating demand lowers it by 18.68%. Variations in round-trip efficiency (RTE) of the storage system within the narrow band of 70–77.5% produced less significant changes (+3.61% and +1.62%, respectively). Reducing the maximum electrolysis time to 6 h increased the LCOE by 6.35% to 2174.97 $/MWh. In contrast, extending this time to 10 h lowered the LCOE by 3.92% to 1964.84 $/MWh. Increasing the hydrogen boiler cost to $6000 resulted in a moderate rise in LCOE of 1.40% to 2073.63 $/MWh. Maximum electrolysis time changes remained within a range similar to the variations in round-trip efficiency (RTE) of ±1.6–3.6% and were clearly weaker than the largest effects observed in the other cases (up to +19.24% or −18.68%). This indicated that, within the analyzed parameter range, the maximum electrolysis time and hydrogen boiler cost are of secondary importance to the final LCOE value.
These outcomes indicate that the economics of the system are driven primarily by the performance of the hydrogen-to-power conversion step (HiPE200) and by the magnitude of the thermal load, with less significant material contributions from winter PV yield losses due to snow and long-term module degradation.
The absolute baseline LCOE of approximately 2.05 $/kWh is exceptionally high and represents a fundamental barrier to widespread deployment of the proposed off-grid architecture in Poland-like conditions. Typical European off-grid or islanded PV–battery systems with modest diesel backup achieve LCOEs of 0.34–0.46 €/kWh (roughly 0.37–0.50 $/kWh) for household-scale applications [45]. Global reviews of decentralized 100% renewable off-grid systems report averages around 0.29 $/kWh in recent years [46], although values exceed 1 $/kWh in challenging locations or configurations requiring extensive seasonal storage. This elevated figure is consistent with a system that relies on hydrogen for seasonal balancing in a heating-dominated load profile under low winter irradiation and snow cover.
The pronounced sensitivity to heating demand is technically sound but reveals a critical design dependency. In Poland’s continental climate, space and water heating can constitute 50–70% of annual final energy use in existing buildings. Any increase in this load directly scales the required PV array and storage capacities, inflating capital expenditure and therefore LCOE. Conversely, a well-insulated envelope or high-COP heat pump coupled with thermal storage offers significant potential for cost reduction—larger than most supply-side improvements within the ranges tested.
The snow-shading case (+16.9% LCOE) is highly relevant to the chosen location, but incompletely characterized. Static modeling based on average climate data cannot capture inter-annual variability in snowfall depth, duration, or timing, nor the stochastic nature of losses due to surface dirt adsorption. In Polish lowlands, annual snow-related PV yield reductions of 5–15% are common even with optimized tilt (45–60°); in the case of poorly designed or maintained arrays, they can exceed 20–30% in severe winters.

5. Conclusions

This study points to the possibility of constructing a household integrated with a proposed hydrogen storage system to achieve full off-grid capability. It is feasible to provide year-round electrical and thermal energy. The possible system consists of 33.32 kWp worth of crystalline silicon photovoltaics, 24.78 kW worth of high-pressure electrolyzers, 13.35 m3 worth of hydrogen storage, and a vanadium flow battery with 109 kWh capacity and at least 26.08 kW power. The power of the vanadium flow battery should be individualized according to the lifestyle of the household residents—this article shows only the possibility of the system arrangement. One of the conclusions is the necessity of regular cleaning of the photovoltaic panels from dust and snow since uncontrolled efficiency decline in processing solar energy from the panels will disrupt the short-term and long-term energy balance. The presented system consists of technologies at an advanced stage of development, so within a few years, such a system may be commercially available.
It is worth noting that winters in Poland in recent years have been relatively mild, and therefore, any off-grid system designed for current conditions should have an emergency source of both heat and electrical power. Poland’s climate—temperate continental with cold, snowy winters, moderate annual solar irradiation, and pronounced seasonal mismatch between PV generation and heating-driven demand—places the analyzed system at the difficult end of the European off-grid spectrum. Comparable conditions exist in most of Germany, the Baltic states, lowland Scandinavia, and parts of the northern U.S. Midwest.
The calculated LCOE of the proposed system, regarding the sensitivity on system parameters, showed the order of 2 $/kW, which can be considered as one of the biggest barriers for common usage of hydrogen systems for off-grid installations. Purely renewable configurations that incorporate seasonal hydrogen storage to achieve near-100% autonomy in cold, high-heating-demand settings typically exhibit LCOEs in the 1–3 $/kWh range or higher, driven by the same factors highlighted in Table 7—winter load peaks, snow-induced yield losses, and the capital intensity of long-duration storage. Comparable microgrid optimization studies covering comparable winter conditions (cold, snowy, heating-dominated) demonstrate that hydrogen-based pathways enable high renewable fractions but at a substantial cost premium relative to battery-only or hybrid diesel systems; sensitivity to electrolyzer and fuel-cell efficiency, as well as thermal-load assumptions, mirrors the HiPE200 and heating-demand results above [47].
In contrast, Mediterranean or southern-European off-grid PV–battery systems (higher winter irradiance, lower heating demand, negligible snow) routinely achieve LCOEs below 0.5 $/kWh, even at high degrees of autonomy. The performance gap underscores that the economics of seasonal-storage off-grid solutions deteriorate sharply with latitude and heating intensity—precisely the conditions represented by the Polish climate.
The surface area of photovoltaic panels with a capacity of 33.32 kWp can range between 140 m2 and 200 m2. This indicates the need to integrate the panels into the roof on the southern side and allocate a portion of the building plot. Another approach is to establish energy cooperatives within neighborhoods and, at the design stage of the settlement, plan the location of a photovoltaic farm, a flow battery energy storage system, an electrolyzer, and hydrogen tanks. Also, the initiatives of so-called “hydrogen neighborhoods” [7] show the potential for utilizing both wind and solar energy to fulfill the requirements of fully off-grid households. New European Union regulations regarding the passive nature of households should keep pace with technological trends and real technological possibilities, with particular attention to necessary changes in urban planning due to the sizes of full off-grid systems.

Author Contributions

Conceptualization, K.S., P.P., G.D. and B.P.; methodology, K.S. and G.D.; validation, K.S., P.P., G.D. and B.P.; investigation, K.S., P.P., G.D. and B.P.; writing—original draft preparation, K.S., P.P., G.D. and B.P.; writing—review and editing, K.S. and P.P.; visualization, K.S.; supervision, P.P. and B.P. All authors have read and agreed to the published version of the manuscript.

Funding

This research was funded by the European Funds for a Modern Economy (FENG) Programme under Priority II, Proof of Concept call 1/2023. Project title: “Wysokociśnieniowy Elektrolizer Alkaliczny 200 bar” (English version: “High-Pressure Alkaline Electrolyzer 200 bars”), acronym: HiPE200, grant agreement no. FENG.02.07-IP.05-0048/23.s.

Data Availability Statement

All of the data used in the article is included.

Conflicts of Interest

The authors declare no conflicts of interest. The funders had no role in the design of this study; in the collection, analyses, or interpretation of data; in the writing of the manuscript; or in the decision to publish the results.

Abbreviations

The following abbreviations are used in this manuscript:
PVPhotovoltaics
DC-DCDirect Current to Direct Current
DC-ACDirect Current to Alternating Current
VRFBVanadium Redox Flow Battery
EVElectric Vehicle
LHVLower Heating Value
HHVHigher Heating Value
HiPE200High-Pressure Electrolyzer 200 Bars
CAPEXCapital Expenditure
OPEXOperating Expenses
LCOELevelized Cost of Energy
NPVNet Present Value

References

  1. REHVA. ITRE Adopts EPBD Amendments with Strong Support for IEQ Requirements. Available online: https://www.rehva.eu/news/article/itre-adopts-epbd-amendments-with-strong-support-for-ieq-requirements (accessed on 19 May 2026).
  2. European Parliament. Amendments Adopted by the European Parliament on 14 March 2023 on the Proposal for a Directive of the European Parliament and of the Council on the Energy Performance of Buildings (Recast) (2021/0426(COD)) (T9-0068/2023). Available online: https://www.europarl.europa.eu/doceo/document/TA-9-2023-0068_EN.html (accessed on 19 May 2026).
  3. Lapillonne, B. Definition of ODEX Indicators in ODYSSEE Data Base. ODYSSEE-MURE Project. 2020. Available online: https://www.odyssee-mure.eu/publications/other/odex-indicators-database-definition.pdf (accessed on 19 May 2026).
  4. Choromański, J. New Energy Performance Standards for Buildings—Standard WT 2021. PMR Construction Insight: Poland. 2021. Available online: https://www.millercanfield.com/resources-PMR-Construction-Insight-Poland-February-2021.html (accessed on 19 May 2026).
  5. Ionescu, G.-L. Passive house. J. Appl. Eng. Sci. 2017, 7, 23–27. [Google Scholar] [CrossRef] [Scilit]
  6. Maestre, V.M.; Ortiz, A.; Ortiz, I. Sustainable and self-sufficient social home through a combined PV-hydrogen pilot. Appl. Energy 2024, 363, 123061. [Google Scholar] [CrossRef] [Scilit]
  7. Property News. Rusza Budowa Nowego Osiedla w Śremie. 195 Mieszkań w rok i Gotowych na Wodór. Available online: https://www.propertynews.pl/mieszkania/rusza-budowa-nowego-osiedla-w-sremie-195-mieszkan-w-rok-i-gotowych-na-wodor,195304.html (accessed on 19 May 2026).
  8. López-Castrillón, W.; Sepúlveda, H.H.; Mattar, C. Off-grid hybrid electrical generation systems in remote communities: Trends and characteristics in sustainability solutions. Sustainability 2021, 13, 5856. [Google Scholar] [CrossRef] [Scilit]
  9. Tshemese, Z.; Dziike, F.; Linganiso, L.Z.; Roro, K. Reliability study of solar photovoltaic systems for long-term use. In Electrode Materials for Energy Storage and Conversion; CRC Press: Boca Raton, FL, USA, 2021. [Google Scholar] [CrossRef] [Scilit]
  10. Karim, A.Z.A.; Osman, M.S.; Rahmat, M.K. A review on risk and reliability analysis in photovoltaic power generation. Energies 2025, 18, 3790. [Google Scholar] [CrossRef] [Scilit]
  11. Jordan, D.C.; Kurtz, S.R. Photovoltaic degradation rates—An analytical review. Prog. Photovolt. Res. Appl. 2013, 21, 12–29. [Google Scholar] [CrossRef] [Scilit]
  12. Agyekum, E.B.; Abdullah, M.; Odoi-Yorke, F.; Ameen, A.; Chowdhury, P.; Raza, M.A.; Rashid, F.L.; Hussein, A.K. A state-of-the-art review of electrolyte systems for vanadium redox flow battery—Status of the technology, and future research directions. Energy Convers. Manag. X 2025, 27, 101180. [Google Scholar] [CrossRef] [Scilit]
  13. Sierpowski, K.; Bałaga, D.; Siegmund, M.; Debita, G.; Górski, K.; Ptak, P. Wysokociśnieniowy elektrolizer alkaliczny HiPE200 jako polowa ładowarka wodorowa do BSP zasilanych wodorem [High-Pressure Alkaline Electrolyzer HiPE200 as a Field Hydrogen Charger for Hydrogen-Powered UAVs]. Przegląd Elektrotechniczny 2025, R.101, 90–96. [Google Scholar] [CrossRef] [Scilit]
  14. Elalfy, D.A.; Gouda, E.; Kotb, M.F.; Bureš, V.; Sedhom, B.E. Comprehensive review of energy storage systems technologies, objectives, challenges, and future trends. Energy Strategy Rev. 2024, 54, 101482. [Google Scholar] [CrossRef] [Scilit]
  15. Reynard, D.; Dennison, C.R.; Battistel, A.; Girault, H.H. Efficiency improvement of an all-vanadium redox flow battery by harvesting low-grade heat. J. Power Sources 2018, 390, 30–37. [Google Scholar] [CrossRef] [Scilit]
  16. Bindner, H.; Kær, S.K.; You, C. Characterization of Vanadium Flow Battery (Risø-R-1753(EN)). Technical University of Denmark. 2011. Available online: https://orbit.dtu.dk/en/publications/characterization-of-vanadium-flow-battery (accessed on 19 May 2026).
  17. Jiang, H.R.; Sun, J.; Wei, L.; Wu, M.C.; Shyy, W.; Zhao, T.S. A high power density and long cycle life vanadium redox flow battery. Energy Storage Mater. 2020, 24, 529–540. [Google Scholar] [CrossRef] [Scilit]
  18. Guarnieri, M.; Trovò, A.; D’Anzi, A.; Alotto, P. Developing vanadium redox flow technology on a 9-kW 26-kWh industrial scale test facility: Design review and early experiments. Appl. Energy 2018, 230, 1425–1434. [Google Scholar] [CrossRef] [Scilit]
  19. U.S. Department of Energy, Hydrogen and Fuel Cell Technologies Office. Hydrogen Infrastructure Technologies FY 2024 Merit Review and Peer Evaluation Report. Available online: https://www.hydrogen.energy.gov/docs/hydrogenprogramlibraries/pdfs/review24/2024-amr-06-hydrogen-infrastructure-technologies.pdf (accessed on 19 May 2026).
  20. Yang, M.; Hunger, R.; Berrettoni, S.; Sprecher, B.; Wang, B. A review of hydrogen storage and transport technologies. Clean Energy 2023, 7, 190–216. [Google Scholar] [CrossRef] [Scilit]
  21. European Commission, Joint Research Centre. PVGIS—Photovoltaic Geographical Information System [Online Tool]. Available online: https://re.jrc.ec.europa.eu/pvg_tools/en/ (accessed on 19 May 2026).
  22. Huld, T.; Müller, R.; Gambardella, A. A new solar radiation database for estimating PV performance in Europe and Africa. Sol. Energy 2012, 86, 1803–1815. [Google Scholar] [CrossRef] [Scilit]
  23. Wang, P. High-Efficiency and High-Power-Density DC-DC Converters for Data Center Application. Ph.D. Thesis, Technical University of Denmark, Lyngby, Denmark, 2024. Available online: https://backend.orbit.dtu.dk/ws/files/394260846/PhD_thesis_pinhe.pdf (accessed on 19 May 2026).
  24. Huawei Technologies Co., Ltd. Huawei Inverter Lifetime Report: SUN2000 Series Three-Phase String Inverters. Available online: https://solar.huawei.com/download?p=%2F-%2Fmedia%2FSolarV4%2Fsolar-version2%2Feurope%2Ffr%2Fnews-room%2Fnews-img%2F2025%2Fhuawei-inverter-lifetime-report%2FKiloWattsol.pdf (accessed on 19 May 2026).
  25. Rosenow, J. A meta-review of 54 studies on hydrogen heating. Cell Rep. Sustain. 2024, 1, 100010. [Google Scholar] [CrossRef] [Scilit]
  26. Barzigar, A.; Ebadati, E.; Mujumdar, A.S.; Hosseinalipour, S.M. A comprehensive review of vanadium redox flow batteries: Principles, benefits, and applications. Next Res. 2025, 2, 100767. [Google Scholar] [CrossRef] [Scilit]
  27. Pfeifroth, U.; Trentmann, J.; Kothe, S. Validation Report Meteosat Solar Surface Radiation and Effective Cloud Albedo Climate Data Record SARAH-2.1 Climate Data Records. 2019. Available online: https://www.cmsaf.eu/SharedDocs/Literatur/document/2019/saf_cm_dwd_val_meteosat_hel_sarah_2_3_pdf.pdf?__blob=publicationFile&v=5 (accessed on 19 May 2026).
  28. Gracia Amillo, A.M.; Taylor, N.; Martinez, A.M.; Dunlop, E.D.; Mavrogiorgios, P.; Fahl, F.; Arcaro, G.; Pinedo, I. Adapting PVGIS to Trends in Climate, Technology and User Needs. In Proceedings of the 38th European Photovoltaic Solar Energy Conference and Exhibition, Online Meeting, 6–10 September 2021; EU PVSEC: Munich, Germany, 2021; pp. 907–911. [Google Scholar] [CrossRef]
  29. Copernicus Climate Change Service (C3S). Atmospheric Reanalysis ERA5 Products. European Centre for Medium-Range Weather Forecasts. Available online: https://climate.copernicus.eu/climate-reanalysis (accessed on 19 May 2026).
  30. Linstrom, P. NIST Chemistry WebBook; NIST Standard Reference Database Number 69; NIST Office of Data and Informatics: Gaithersburg, MD, USA, 2021. [CrossRef] [Scilit]
  31. Główny Urząd Statystyczny (GUS). Zużycie energii w gospodarstwach domowych w 2024 r. [Energy Consumption in Households in 2024]. GUS: Warsaw, Poland, 2026. Available online: https://stat.gov.pl/obszary-tematyczne/srodowisko-energia/energia/zuzycie-energii-w-gospodarstwach-domowych-w-2024-r-,12,3.html (accessed on 19 May 2026).
  32. Narodowa Agencja Poszanowania Energii (NAPE). Jednorodzinny Budynek Referencyjny NAPE [Reference Single-Family Building NAPE]; NAPE: Warsaw, Poland, 2022; Available online: https://nape.pl/wp-content/uploads/2022/03/Jednorodzinny_bud_NAPE.pdf (accessed on 19 May 2026).
  33. Ministerstwo Rozwoju i Technologii. Dane Klimatyczne do Obliczeń Energetycznych Budynków—Typowe Lata Meteorologiczne (TMY) [Climatic Data for Energy Calculations of Buildings—Typical Meteorological Years]. Warsaw, Poland, 2023. Available online: https://www.gov.pl/web/archiwum-inwestycje-rozwoj/dane-do-obliczen-energetycznych-budynkow (accessed on 19 May 2026).
  34. Rozporządzenie Ministra Infrastruktury w sprawie warunków technicznych, jakim powinny odpowiadać budynki i ich usytuowanie (WT 2021). J. Laws Repub. Pol. 2022, poz. 1225. Available online: https://isap.sejm.gov.pl/isap.nsf/download.xsp/WDU20220001225/O/D20221225.pdf (accessed on 19 May 2026).
  35. Wiśniewski, G.; Curkowski, A.; Pejas, B. The scenario of average costs of electricity up to 2050 in Poland and forecast of electricity prices in tariffs for selected groups of consumers up to 2030. Energy–Society–Politics 2017, 2, 53–80. [Google Scholar] [CrossRef] [Scilit]
  36. Committee on Climate Change. Hydrogen in a Low-Carbon Economy; Committee on Climate Change: London, UK, 2018; Available online: https://www.theccc.org.uk/wp-content/uploads/2018/11/Hydrogen-in-a-low-carbon-economy.pdf (accessed on 7 June 2026).
  37. Big Four Manufacturers Make Hydrogen-Ready Boiler Price-Promise. ESS Magazine, 29 July 2021. Available online: https://essmag.co.uk/big-four-manufacturers-make-hydrogen-ready-boiler-price-promise/ (accessed on 7 June 2026).
  38. Short, W.; Packey, D.J.; Holt, T. A Manual for the Economic Evaluation of Energy Efficiency and Renewable Energy Technologies (NREL/TP-462-5173); National Renewable Energy Laboratory: Golden, CO, USA, 1995. Available online: https://www.nrel.gov/docs/legosti/old/5173.pdf (accessed on 11 June 2026).
  39. International Energy Agency. Projected Costs of Generating Electricity 2020; International Energy Agency: Paris, France, 2020; Available online: https://www.iea.org/reports/projected-costs-of-generating-electricity-2020 (accessed on 11 June 2026).
  40. International Renewable Energy Agency. Renewable Power Generation Costs in 2024; International Renewable Energy Agency: Abu Dhabi, United Arab Emirates, 2025. Available online: https://www.irena.org/-/media/Files/IRENA/Agency/Publication/2025/Jul/IRENA_TEC_RPGC_in_2024_2025.pdf (accessed on 11 June 2026).
  41. Morris, M.D. Factorial sampling plans for preliminary computational experiments. Technometrics 1991, 33, 161–174. [Google Scholar] [CrossRef]
  42. Gmina Rawicz. Miejski Plan Adaptacji do Zmian Klimatu Dla Miasta Rawicz [Municipal Climate Change Adaptation Plan for the City of Rawicz]. 2025. Available online: https://rawicz.pl/wp-content/uploads/2025/11/Miejski-Plan-Adaptacji-do-Zmian-Klimatu-dla-miasta-Rawicz-ostateczny-.pdf (accessed on 25 June 2026).
  43. Instytut Meteorologii i Gospodarki Wodnej—Państwowy Instytut Badawczy. Rocznik Meteorologiczny 2022; IMGW-PIB: Warsaw, Poland, 2022; Available online: https://danepubliczne.imgw.pl/data/dane_pomiarowo_obserwacyjne/Roczniki/Rocznik%20meteorologiczny/Rocznik%20Meteorologiczny%202022.pdf (accessed on 25 June 2026).
  44. Instytut Meteorologii i Gospodarki Wodnej—Państwowy Instytut Badawczy. Rocznik Meteorologiczny 2024; IMGW-PIB: Warsaw, Poland, 2024. Available online: https://danepubliczne.imgw.pl/data/dane_pomiarowo_obserwacyjne/Roczniki/Rocznik%20meteorologiczny/Rocznik%20Meteorologiczny%202024.pdf (accessed on 25 June 2026).
  45. Kosmadakis, I.E.; Elmasides, C. A sizing method for PV–battery–generator systems for off-grid electrification. Energies 2021, 14, 1988. [Google Scholar] [CrossRef] [Scilit]
  46. Weinand, J.M.; Hoffmann, M.; Göpfert, J.; Terlouw, T.; Schönau, J.; Kuckertz, P.; McKenna, R.; Kotzur, L.; Linßen, J.; Stolten, D. Global LCOEs of decentralized off-grid renewable energy systems. Renew. Sustain. Energy Rev. 2023, 183, 113478. [Google Scholar] [CrossRef] [Scilit]
  47. Mühlbauer, A.; Fan, Y.F.; Sambor, D.J.; Jacobson, M.Z. Minimizing the multi-decadal cost of islanded renewable microgrids. Smart Energy 2025, 20, 100208. [Google Scholar] [CrossRef] [Scilit]
Figure 1. Proposed system for fully off-grid household.
Energies 19 03175 g001
Figure 2. Simplified flowchart for the numerical solution of energy balance.
Energies 19 03175 g002
Figure 3. The daily energy surplus and cumulated energy balance during respected period.
Energies 19 03175 g003
Figure 4. The monthly profile of PV production, electricity demand and heat demand in the time period considered.
Energies 19 03175 g004
Figure 5. Chart showing the energy usage in the system, including the total system losses.
Energies 19 03175 g005
Figure 6. The volumetric balance of produced and demanded hydrogen in the proposed system.
Energies 19 03175 g006
Table 1. Comparison between parameters for different battery technologies suitable for domestic use [14].
ParametersLead-Acid BatteryLi-Ion BatteryFlow Battery
Efficiency, %75–8080–8660–85 [14,15,16]
Energy density, Wh/kg50–100200–35020–70
Power density, W/kg10–500100–3500depends on the fuel cell
Life cycle500–20001000–5000>10,000 [14], >20,000 [17,18]
Self-discharge per month, %3–1253–12
Depth of discharge, %70<100100
Power installation cost, €/kW150–200150–2001000–1500
Energy installation cost, €/kWh100–250300–800300–500
Table 2. Assumed parameters of the proposed system.
DeviceWorking PressureAssumed Efficiency
Photovoltaic array (crystalline silicon) Temperature-dependent, PVGIS calculated [21,22]
High-pressure electrolyzer (HiPE200) (KOMAG Institute, Gliwice, Poland)200 bar55% LHV
(HiPE200 experimental data)
Hydrogen Storage *200 bar
Vanadium redox flow battery RTE 85% [15,16]
DC-DC converter 95% [23]
DC-AC converter 98% [24]
Hydrogen boiler<1 bar95% LHV [25]
* No hydrogen leakage assumed.
Table 3. Assumed parameters for the chosen location—baseline case.
MonthPV Energy Output per PV Unit Peak Power, kWh/kWpAssumed Monthly Heat Demand (Space Heating and HDW), kWhAssumed AC Electricity Demand, kWh
January35.22260260
February54.811970260
March91.521660245
April118.2980220
May126.57530220
June126.0280215
July127.32210215
August120.71210215
September105.25490220
October75.781160230
November42.831650245
December33.012110255
Table 4. Input parameters for CAPEX, LCOE and NPV calculations.
ComponentCAPEX [$/kW]Replacement [$/kW]OPEX [% of CAPEX]Lifetime [Years]Source
PV65050% CAPEX525[6]
Converter60085% CAPEX525[6]
Electrolyzer305030% CAPEX225[6]
Hydrogen tank850/kg of H285% CAPEX125[6]
Hydrogen boiler3000100% CAPEX515Assumed on basis of [36,37]
Table 5. Assumed parameters for the model sensitivity analysis of the proposed system.
DeviceAssumed Parameter Range
Photovoltaic array (crystalline silicon)Temperature-dependent, PVGIS calculated [21,22]
PV degradation 0.5–1%
HiPE200 (KOMAG Institute, Gliwice, Poland)45–65% LHV
Vanadium redox flow batteryRTE 70–85%
Heating demand±20%
Snow shading50% of normal PV production during
November–March (−12.17% annual yield)
Maximum electrolysis time6–10 h
Hydrogen boiler cost$6000
Table 6. Calculated parameters of the proposed system—baseline case.
DevicePowerCapacity
Photovoltaic array (crystalline silicon)33.32 kWp at the last year of exploitation,
initially 37.75 kWP at 0.5%/year degradation rate
-
High-pressure electrolyzer (KOMAG Institute, Gliwice, Poland)24.78 kW-
Pressurized hydrogen storage @200 bars-13.35 m3, 193.3 kg
Vanadium flow battery>26.08 kW4.36 m3, 109 kWh
Table 7. Influence of input parameters change on LCOE.
Case #Changed ParameterNew ValueLCOE [$/MWh]LCOE Change
Baseline--2045.01-
1PV degradation1%2179.17+6.56%
2HiPE200 efficiency45% LHV2438.52+19.24%
3HiPE200 efficiency65% LHV1866.1−8.75%
5RTE70%2118.83+3.61%
6RTE77.5%2078.24+1.62%
7Heating demand120%2410.62+17.88%
8Heating demand80%1662.96−18.68%
9Snow shadinglook Table 52390.72+16.91%
10Maximum electrolysis time6 h2174.97+6.35%
11Maximum electrolysis time10 h1964.84−3.92%
12Hydrogen boiler cost$60002073.63+1.40%
Disclaimer/Publisher’s Note: The statements, opinions and data contained in all publications are solely those of the individual author(s) and contributor(s) and not of MDPI and/or the editor(s). MDPI and/or the editor(s) disclaim responsibility for any injury to people or property resulting from any ideas, methods, instructions or products referred to in the content.