


Abstract
This paper proposes an optimal reconfiguration methodology for electrical distribution systems aimed at improving operational efficiency and service quality. Traditionally, distribution network reconfiguration has focused on minimizing technical losses and improving the voltage profile; however, these approaches do not explicitly incorporate reliability criteria or geospatial aspects associated with the actual operation of distribution networks. The proposed methodology minimizes active power losses while incorporating reliability constraints through the calculation of Energy Not Supplied and a relative georeferenced spatial-operational indicator for the selected switching devices. The approach is based on a topological analysis combined with the Manta Ray Foraging Optimization metaheuristic algorithm, while the electrical evaluation is performed using the fast-decoupled power flow method with the FDXB formulation. The weighted scalar objective function considers active power losses, Energy Not Supplied associated with N–1 contingencies, and the relative georeferenced spatial-operational indicator associated with the selected switching devices. The voltage profile is subsequently evaluated as a technical performance indicator to verify the operational quality of the obtained configurations. The methodology is validated using test systems, achieving loss reductions, improvements in the voltage profile, and a decrease in Energy Not Supplied, thereby demonstrating configurations with improved electrical and reliability performance that are more representative of practical distribution network operation.
1. Introduction
Distribution systems constitute the final stage of the electricity supply chain; therefore, their proper management is essential to provide users with a continuous and high-quality service [1]. In this regard, the optimal reconfiguration of electrical distribution networks is important for improving system performance, increasing supply reliability, and optimizing network resources, thereby reducing losses and ensuring more efficient operation [2].
Distribution network reconfiguration consists of changing the status of sectionalizing and tie-switching devices from open to closed or vice versa while maintaining the radial structure of the electrical network [3], with the aim of improving its electrical and operational performance. Traditionally, this problem has been formulated as an optimization problem that considers constraints such as radiality, voltage limits, and current capacities [4]. In this context, the integration of switches to perform reconfiguration maneuvers enables the generation of multiple feasible solutions aimed at optimizing the operating conditions of the network and ensuring improved distribution system performance [5].
Given the inherent limitations of traditional optimization methods, interest in the use of more advanced techniques has increased in recent years, particularly in metaheuristic algorithms, due to their strong capability to explore large search spaces and their good performance in solving nonlinear and simultaneous problems [6,7]. Several studies have addressed the optimal reconfiguration of distribution systems using metaheuristic algorithms with multi-objective functions [8].
Along these lines, ref. [5] proposes a distribution system reconfiguration methodology aimed at improving the voltage profile and reducing active power losses using an enhanced particle swarm optimization algorithm (Enhanced PSO). This approach considers the variability of load conditions and the operational constraints of the system to determine optimal configurations, thereby achieving improvements in both voltage levels and power losses when applied to test systems. The results show that reconfiguring the network structure is an effective way to provide a higher-quality electricity service, especially in systems with voltage drop problems or low-performance configurations.
In recent years, network reconfiguration studies have incorporated analyses based on power quality and reliability indicators [9]. Accordingly, ref. [10] presents a multi-objective methodology for unbalanced distribution networks based on the improved transient search optimization algorithm (ITSOA), through which power losses, the voltage profile, and Energy Not Supplied (ENS) are simultaneously reduced. The results obtained from simulations performed on test systems show improved operational performance in unbalanced networks, as well as an increase in system reliability.
Similarly, ref. [11] proposes an optimal reconfiguration strategy based on the ant lion optimization algorithm (ALO), focused on reducing active power losses and improving system reliability by minimizing ENS. In addition, this study considers operational constraints associated with voltage limits, line currents, and radiality conditions. The results obtained show a significant reduction in power losses and an improvement in voltage levels, demonstrating that this type of metaheuristic technique is well suited for solving reconfiguration problems.
The work presented in [12] introduces a topological reconfiguration methodology that integrates the Manta Ray Foraging Optimization (MRFO) metaheuristic algorithm with the fast-decoupled power flow method using the FDXB formulation. In this study, reconfiguration is formulated as a multi-objective optimization model focused on reducing active power losses while considering constraints such as voltage levels, radiality conditions, load, and line currents. This approach makes it possible to identify the most efficient network configurations.
Although previous studies have demonstrated the effectiveness of metaheuristic algorithms for distribution network reconfiguration, most approaches still focus primarily on electrical performance indicators, particularly active power losses and voltage profile improvement. Other contributions have incorporated reliability-oriented indicators, such as Energy Not Supplied, or have considered operational constraints related to voltage limits, line currents, and radiality. However, these aspects are usually treated independently, and limited attention has been given to the simultaneous integration of reliability assessment, switching-device operability, and spatial-operational criteria within the same reconfiguration framework. In particular, the location of switching devices and the practical feasibility of implementing switching maneuvers are rarely included as explicit decision-making criteria, even though these factors may influence field operation and service restoration in real distribution networks.
The analysis proposed in [12] mainly aims to improve traditional technical indicators, such as active power losses and the voltage profile. However, aspects related to service reliability or the georeferenced location associated with network components are not analyzed. In practice, the quality of electricity supply does not depend solely on electrical variables, but also on factors such as the frequency and duration of interruptions, as well as the time required to restore electricity service after a fault, which is directly related to the physical location of network elements [13].
Within this framework, one of the most relevant reliability indicators is ENS, since it quantifies the energy that is not delivered to users due to faults or contingencies in the electrical system [13,14]. This indicator directly reflects the impact of interruptions on end users and represents an important criterion that should be considered when planning and operating distribution systems [15].
Furthermore, the georeferencing of network elements is relevant to access, repair, and switching considerations, which may influence the duration of interruptions and, consequently, the reliability levels of the system in practical distribution networks [16]. Therefore, disregarding reliability and georeferencing in electrical network reconfiguration may lead to configurations that are optimal from an electrical standpoint but not fully representative of the actual operation of the distribution system.
In this context, the present article is based on [12] and extends it by incorporating ENS as a reliability criterion, as well as a relative georeferenced spatial-operational indicator within the evaluation process of the reconfiguration alternatives. The methodology preserves the topological analysis based on incidence matrices and the use of the MRFO metaheuristic algorithm, while expanding the weighted scalar objective function and the decision-making criteria to obtain configurations that better balance electrical performance, reliability, operational feasibility, and spatial criteria, while being more representative of the practical operation of electrical distribution systems.
Compared with the baseline methodology reported in [12], the main contribution of this work lies in extending the reconfiguration model from a predominantly electrical optimization approach toward a more comprehensive operational framework. Specifically, the proposed methodology incorporates Energy Not Supplied as a reliability-oriented criterion, introduces a switching-device availability constraint to exclude non-operable or impractical maneuvers, and integrates a relative georeferenced spatial-operational indicator associated with the selected switching devices. These additions allow the reconfiguration process to evaluate active power losses and the resulting voltage profile, while also considering the potential impact of service interruptions and the practical feasibility of implementing the resulting configurations.
The remainder of this article is organized as follows. Section 2 presents the formulation of the distribution system reconfiguration problem, defining the extended weighted scalar objective function, which aims to reduce active power losses and ENS while also incorporating the availability criterion of network elements. Section 3 describes the proposed methodology based on the MRFO metaheuristic algorithm for searching optimal configurations, together with the electrical evaluation of each solution using the fast-decoupled power flow method with the FDXB formulation, the calculation of reliability indicators, and the incorporation of the relative georeferenced spatial-operational indicator. Section 4 presents the implementation of the methodology in the IEEE 33-bus and 69-bus test systems using MATLAB R2025b and MATPOWER 8.1 tool, where the obtained results are analyzed in terms of electrical losses, voltage profile, reliability criteria, and the relative georeferenced spatial-operational indicator within the reconfiguration process. Finally, Section 5 presents the conclusions of this study.
2. Problem Formulation
Considering the approach presented in [12], the reconfiguration problem is formulated as an optimization process involving discrete variables associated with the open or closed status of sectionalizing devices. The topological analysis of the network is supported by incidence matrices to identify loops and determine feasible configurations that preserve system radiality, while the feasibility assessment is based on power flow analysis and on verifying the electrical and operational parameters for each candidate configuration.
In the reference work, the problem formulation focuses on reducing power losses. In the present study, the conceptual structure aimed at reducing technical losses is maintained, while additionally incorporating a service reliability criterion through the quantification of Energy Not Supplied (ENS) as an extension of the aforementioned formulation.
2.1. Technical Constraint and Service Reliability
The reconfiguration problem is expressed through functions oriented toward technical constraints and service reliability. The first function corresponds to the reduction of active power losses in the network branches:
where represents the total number of branches in the system, and corresponds to the active power loss in branch i.
As an extension of the traditional approach, system reliability is incorporated into the function through ENS:
where represents the failure rate of branch k, is the mean repair time, and is the total unserved power associated with the contingency in that branch. This term helps avoid configurations that, in the event of failures, lead to higher levels of load disconnection.
The decision-variable vector associated with the status of the sectionalizing devices is defined as:
where each indicates the device selected to be opened within loop k.
2.2. Constraints Associated with the Availability of Switching Devices
In addition to conventional electrical constraints, operational feasibility conditions related to the availability of switching devices are considered. In this context, certain sectionalizing devices may be excluded from the set of candidates due to factors such as equipment age, infrastructure deterioration, lack of remote-control capability, or location in areas with difficult access. This allows the obtained solutions to be more realistically aligned with the specific characteristics of electrical distribution networks [17].
Formally, if represents the original set of candidate switches for loop k, the feasible set is redefined as:
where corresponds to the availability constraint matrix of the switching devices.
3. Proposed Methodology
The proposed methodology for the optimal reconfiguration of the distribution system is based on the approach developed in [12], which integrates a topological analysis using incidence matrices, MRFO metaheuristic optimization, and electrical evaluation through the FDXB power flow method. In the present work, this structure is extended by incorporating the ENS reliability indicator, operational constraints associated with availability, and the relative georeferenced spatial-operational indicator associated with the selected switching devices.
3.1. Topological Analysis and Loop Identification
The initial stage consists of the structural representation of the distribution system through a node–branch incidence matrix, which describes the electrical connectivity of the network and allows the identification of paths, connection relationships, and the formation of loops associated with tie lines. Based on this representation, the sets of sectionalizing devices linked to each loop are determined.
At this stage, the constraint associated with the availability of switching devices is explicitly integrated, and it is directly reflected in the selection matrix of candidate sectionalizing devices for each loop. Thus, switches whose operation is not feasible according to the technical criteria established by the distribution utility are excluded from the candidate set before the optimization process begins.
Formally, device availability is incorporated through a switching constraint matrix G, associated with the candidate sectionalizing devices, defined as:
In this way, the search space is reduced to configurations that are technically and operationally implementable.
3.2. Incorporation of the Relative Georeferenced Spatial-Operational Indicator
To incorporate spatial characteristics into the optimization process, a relative georeferenced spatial-operational indicator based on the location of the system nodes is included.
Since the IEEE 33-bus and 69-bus test systems do not provide actual geographic information, representative geographic coordinates are assigned to each node while preserving the original topological structure. This coordinate assignment makes it possible to establish a georeferenced relationship among the different network elements without modifying their electrical parameters.
Based on this information, the distance between the nodes that define each branch is calculated using latitude and longitude. In this way, each branch is associated with a distance representing its spatial extent within the georeferenced network.
The indicator is formulated as a relative georeferenced spatial-operational indicator associated with the switching devices selected for opening maneuvers. For each candidate switching device, a representative georeferenced distance is assigned from the geographic coordinates of the buses connected by the corresponding branch. This distance is calculated from the latitude and longitude of the terminal buses and is used only as a relative spatial measure within the adopted representative coordinate system.
Accordingly, for a candidate reconfiguration, the relative georeferenced spatial-operational indicator is defined as:
where represents the representative georeferenced distance associated with the switching device selected in loop k, and is the number of switching devices selected for opening in the candidate radial configuration.
It should be emphasized that is not intended to represent the total physical length of the distribution network, an actual road-travel distance, or a direct estimate of crew travel time. Instead, it is used as a relative geospatial proxy that penalizes configurations requiring switching maneuvers associated with greater spatial separation within the adopted representative coordinate model. Therefore, allows the optimization process to compare candidate configurations from a spatial-operational perspective while preserving the original electrical and topological characteristics of the IEEE test systems.
This term allows spatial information to be incorporated into the optimization process, favoring configurations associated with lower representative spatial separation of the selected switching devices without altering the electrical parameters of the system.
It is important to note that the binary constraint matrix and the georeferenced component perform different functions within the proposed model. The matrix acts as a structural availability constraint, excluding switching devices whose operation is not feasible under technical or operational criteria. In contrast, is included in the objective function as a relative georeferenced spatial-operational indicator associated with the selected switching maneuvers. Thus, while modifies the feasible set of candidate solutions, influences the ranking of feasible configurations by introducing a spatial-operational preference into the optimization process.
3.3. Optimization Using Manta Ray Foraging Optimization
The Manta Ray Foraging Optimization (MRFO) algorithm is employed as a metaheuristic strategy to explore the configuration space defined in the previous stages [18,19]. Each individual in the population represents a candidate topology based on the sectionalizing devices selected for each loop. MRFO combines global exploration and local exploitation mechanisms inspired by the feeding patterns of manta rays, such as chain foraging, cyclone foraging, and somersault foraging [20], enabling progressive convergence toward solutions close to the global optimum.
In the context of distribution system reconfiguration, each individual in the population represents a candidate radial topology, defined by a discrete decision vector associated with the selection of sectionalizing devices for each loop.
Because the original MRFO algorithm updates continuous position variables, a discretization stage is required to map each continuous value into a feasible switching device. Let be the feasible set of available candidate switching devices for loop k, after applying the availability constraint matrix . The number of feasible candidates in loop k is denoted by . For each individual i and loop k, the continuous position variable generated by MRFO is first bounded within the search interval and then converted into a discrete index associated with the corresponding feasible candidate set.
The mapping is performed as:
where is the discrete position index within the feasible set . The switching device selected for loop k is then obtained as:
This procedure allows each continuous MRFO position to be consistently mapped to a valid discrete switching device, even when the loops have different numbers of candidate switches. Therefore, each candidate solution contains one selected switching device per loop, and the final decision vector is expressed as:
where is the number of loops, which is equal to the number of switching devices to be opened in order to obtain a radial configuration.
Let be the decision vector associated with individual i at iteration t, with dimension k, where k represents the total number of loops in the system. Each component of this vector indicates the sectionalizing device selected to maintain network radiality. The aforementioned algorithm operates on a population of size and iteratively generates new configurations through three main search mechanisms [20,21].
Chain foraging: This mechanism focuses on the coordinated movement of manta rays toward regions with higher food availability within the search space. Therefore, in the optimization context, each individual adjusts its position by simultaneously considering the best global solution obtained and the solution of the previous individual in the chain, which promotes a more intensive search in more promising regions. Mathematically, the update can be expressed as:
where r is a uniformly distributed random number in the interval , and is an adaptive coefficient that controls the strength of the attraction toward the best solution.
Cyclone foraging: This strategy imitates the spiral-shaped grouping behavior of manta rays when they concentrate to feed. Within the algorithm, this mechanism enables a deeper exploration of high-quality neighboring solutions, thereby increasing the probability of finding globally optimal solutions. The update of an individual can be modeled as:
where is a weighting factor that depends on both the maximum number of iterations T and the current iteration t, allowing the exploitation intensity to be dynamically adjusted.
Somersault foraging: The third mechanism introduces local perturbations around the best-known solution, simulating the somersault movements of manta rays during feeding. This process helps prevent premature convergence by diversifying the search space:
where S is the somersault factor and and are random numbers in .
In this research, the MRFO algorithm is adapted to the discrete reconfiguration problem through the mapping defined in (6)–(8). Thus, although the search mechanisms of MRFO generate continuous position updates, each updated variable is converted into a feasible switch index belonging to the corresponding loop-specific candidate set. Subsequently, the configurations generated at each iteration undergo a structural validation process to ensure network radiality and compliance with operational constraints.
For each candidate solution, the selected switching devices are opened and the set of closed branches is updated. The resulting network is then represented as an undirected graph , where is the set of buses and is the set of branches that remain in service. A candidate topology is considered feasible only if it satisfies the following conditions:
where is the number of buses and is the number of connected components of the graph. Equation (12) ensures that the number of closed branches is compatible with a radial network, Equation (13) guarantees that all buses remain connected to the network, and Equation (14) verifies the absence of closed loops. If any of these conditions is not satisfied, the candidate configuration is discarded and is not evaluated by the power flow and ENS calculation stages. In this way, all reported configurations correspond to connected radial topologies with exactly closed branches.
During each iteration, the algorithm updates the positions of individuals within the discrete search space and evaluates their performance through a weighted scalar objective function. Unlike the conventional approach, this research incorporates the minimization of ENS into the evaluation process, allowing reliability criteria to be integrated into the selection of optimal configurations. The weighted scalar objective function can be generally expressed as:
where corresponds to the active power losses of the system, ENS represents the annual Energy Not Supplied, and corresponds to the relative georeferenced spatial-operational indicator associated with the selected switching devices. This last term is used to account for the representative spatial separation of the switching maneuvers within the adopted coordinate system, rather than to represent the total feeder length, an actual road-travel distance, a switching-operation time, or a service restoration time.
The parameter is a weighting factor that makes it possible to reconcile quantities with different units, namely kW for losses and kWh/year for ENS. Thus, it acts as a normalization coefficient that balances the relative influence of each term within the optimization process.
The incorporation of this term allows the algorithm to favor configurations that not only reduce technical losses but also minimize the energy impact of supply interruptions.
The parameter represents the empirical weighting factor associated with the relative georeferenced spatial-operational indicator. This factor scales the spatial indicator so that it can be incorporated into the weighted scalar objective function together with the electrical and reliability terms. Its role is not to convert distance into an exact operational cost or to fully normalize all terms into equivalent units, but to allow the optimization process to penalize candidate configurations with less favorable representative spatial separation of switching maneuvers. This parameter allows the relative influence of to be adjusted with respect to the electrical and reliability criteria within the weighted scalar objective function.
3.4. Electrical Evaluation Using the FDXB Power Flow Method
The configurations obtained from the optimization process are electrically evaluated using the fast-decoupled power flow method with the FDXB formulation. This method was selected due to its computational efficiency and its suitable convergence behavior for repeated power flow evaluations during the reconfiguration process. The power flow analysis makes it possible to obtain the voltage magnitude at each node, line currents, and active power losses, while also verifying compliance with the technical constraints of the distribution network.
3.5. Reliability Evaluation Through Energy Not Supplied
As a complement to the electrical analysis, each configuration is evaluated in terms of reliability through the calculation of ENS. This indicator quantifies the energy that is not delivered to users in the event of faults and can be represented as shown in (2).
The integration of ENS into the multi-objective function of the algorithm makes it possible to discriminate against configurations that, although electrically efficient, exhibit greater vulnerability under fault conditions, thereby guiding the search toward topologies with improved reliability performance from an operational perspective.
In this work, ENS is calculated as a comparative reliability indicator through an contingency analysis for each branch of the system. For each simulated fault, a graph is built using the energized branches of the candidate topology, and the resulting electrical islands are identified through connected components. If an island does not contain any source bus, the demand associated with that island is considered unserved. Therefore, the ENS value used in this study quantifies the expected unserved energy associated with the loss of each branch under the analyzed topology.
It should be clarified that the proposed ENS calculation does not perform a complete post-fault service restoration optimization. In other words, additional corrective switching actions after the occurrence of each fault, such as the optimal closing of tie switches for load transfer, are not explicitly optimized within the ENS calculation stage. Instead, ENS is used as a consistent comparative index to evaluate how each candidate reconfiguration affects the amount of load that may become disconnected under branch contingencies. This assumption allows the reliability impact of different radial configurations to be compared under the same methodological framework.
For the reliability parameters, a uniform branch failure rate failures/year and a uniform mean repair time h were assigned to all branches. This assumption was adopted because the IEEE 33-bus and 69-bus test systems do not provide utility-specific historical reliability records, failure statistics, maintenance data, or repair-time information for each branch. Using uniform values makes it possible to isolate the effect of the network topology and switching configuration on ENS, avoiding the introduction of additional biases caused by assumed branch-dependent reliability data. In real distribution systems, these parameters should be replaced by utility-specific values obtained from historical outage records, equipment condition, line type, environmental exposure, and maintenance practices. Table 1 summarizes the implemented procedure for calculating ENS.
Table 1.
Pseudocode for ENS calculation.
In the simulations reported in this study, and were considered uniform for all branches in order to evaluate the effect of the candidate topology under identical reliability parameters.
4. Application of the Methodology
To validate the proposed methodology, the IEEE 33-bus and 69-bus test systems are considered as case studies, as they are widely used for analyzing the reconfiguration of distribution systems. In both systems, the procedure described in the previous sections is applied. For both test systems, every candidate topology generated by the MRFO algorithm was subjected to the radiality validation described in Section 3.3 before the electrical and reliability evaluations were performed. Therefore, only configurations satisfying connectivity, acyclicity, and the condition of exactly closed branches were considered feasible.
All simulations were implemented in MATLAB R2025b using the MATPOWER package for power flow calculations. The IEEE 33-bus and 69-bus systems were modeled using MATPOWER Case Format Version 2, with a base apparent power of 10 MVA and a base voltage of 12.66 kV. In both systems, branch impedances were specified in ohms and converted to per-unit values, while load data were converted from kW and kvar to MW and Mvar. The fast-decoupled power flow method was configured in MATPOWER using the FDXB formulation, with verbose output and printed results disabled.
The population size was set to for both test systems, which provides a reduced computational burden while preserving sufficient diversity in the discrete search space defined by the five loops of each network. The maximum number of iterations was adjusted according to the system size, using 55 iterations for the IEEE 33-bus system and 45 iterations for the IEEE 69-bus system. The somersault factor was set to , following the standard MRFO formulation, in order to promote local refinement around the best solution without excessively increasing the dispersion of the population. To assess the robustness of the proposed methodology, 30 independent runs were performed under identical parameter settings. The weighting factors and were used to incorporate reliability and georeferenced-distance criteria into the objective function while maintaining the dominance of the electrical performance term.
The reliability parameters reported in Table 2 were applied uniformly to all branches of each test system. This modeling decision was adopted to provide a controlled comparison among candidate topologies and to focus the analysis on the influence of reconfiguration on ENS. Since no historical outage database is associated with the standard IEEE 33-bus and 69-bus test systems, branch-dependent failure rates and repair times were not assigned. In practical applications, these parameters should be adapted according to the actual reliability records and maintenance conditions of the distribution utility.
Table 2.
MRFO algorithm parameters and simulation settings used for the IEEE 33-bus and 69-bus systems.
4.1. Case Studies
4.1.1. IEEE 33-Bus System
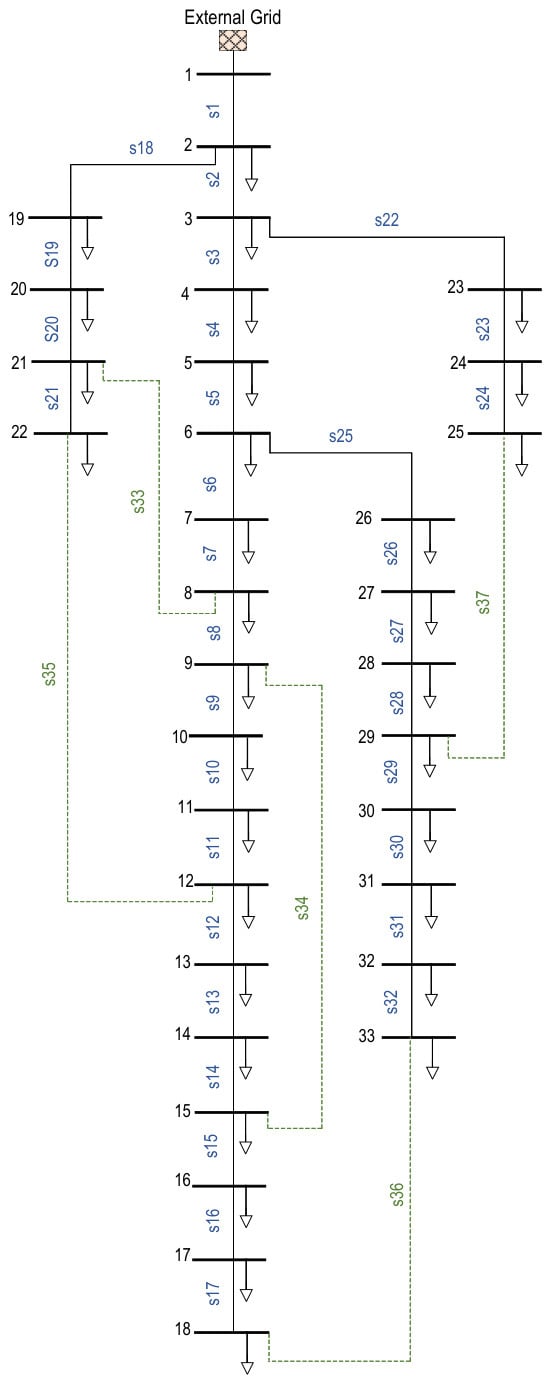
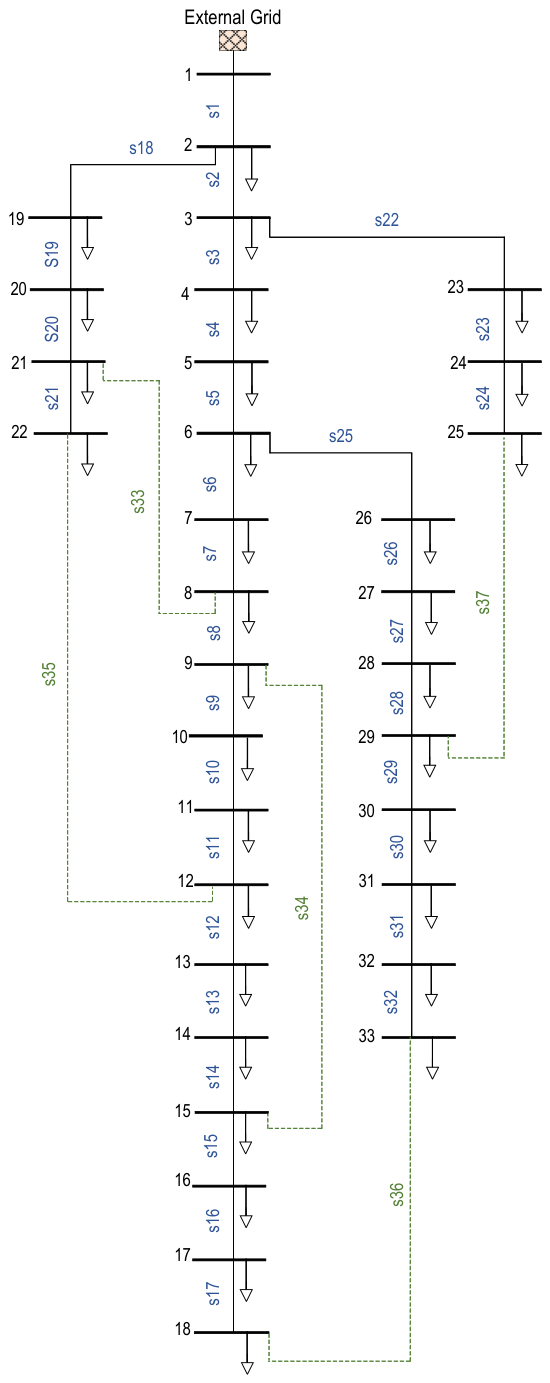
The IEEE 33-bus system is a three-phase radial network composed of a main feeder and four laterals originating from buses 2, 3, and 6. It consists of 33 buses and 37 lines, with a base voltage of 12.66 kV and a base apparent power of 10 MVA.
The single-line diagram of the IEEE 33-bus test system is shown in Figure 1. This representation facilitates the visualization of the main feeder, laterals, and tie branches considered in the reconfiguration process, as well as the location of the sectionalizing and tie-switching devices used in the topological analysis.
Figure 1.
Single-line diagram of the IEEE 33-bus test system.
Based on the topological structure shown in Figure 1, the incidence-matrix analysis and the temporary closing of the tie lines allow the system loops to be identified. By applying the formulation proposed in [12], the switch configuration matrix for operating maneuvers in each loop is obtained. This matrix defines the set of candidate sectionalizing devices to be opened in order to preserve radiality.
4.1.2. IEEE 69-Bus System
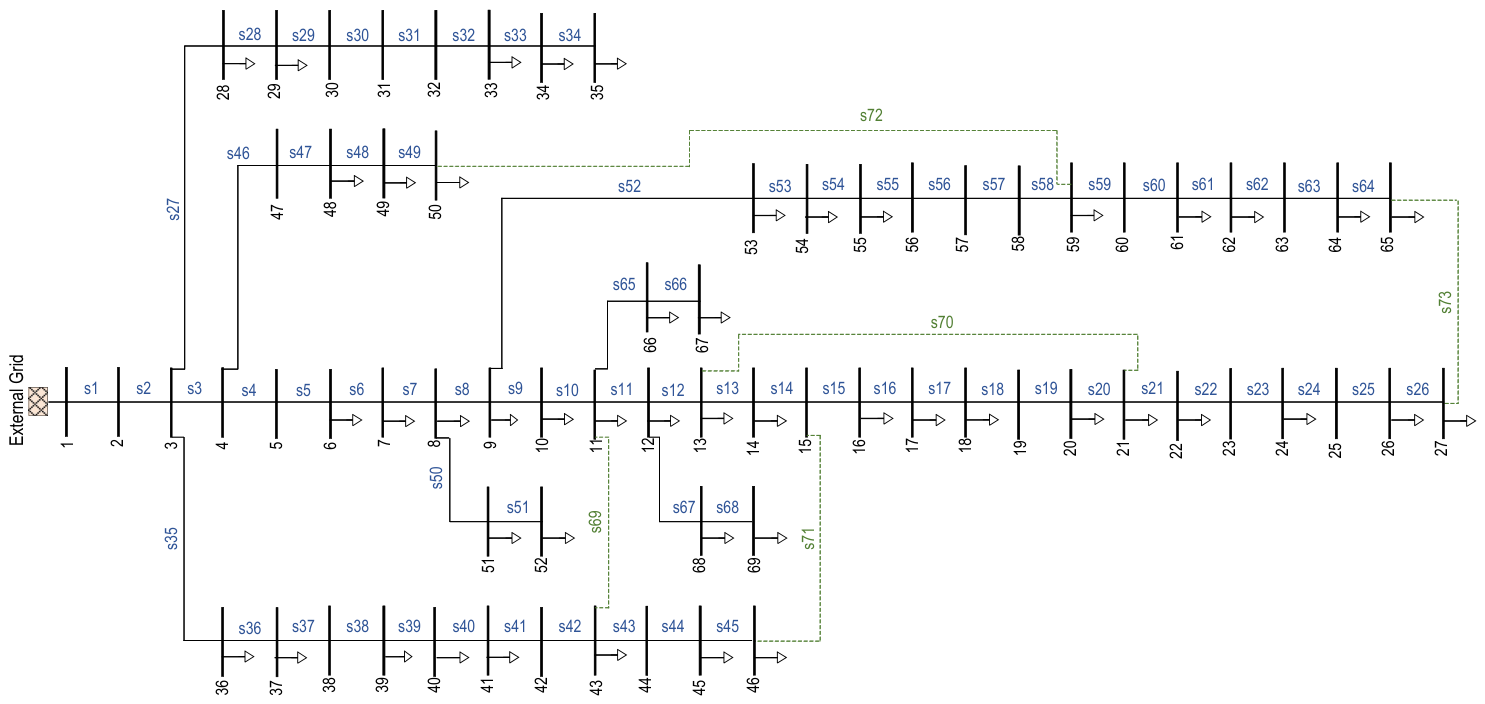
The IEEE 69-bus system corresponds to a three-phase radial system composed of a main feeder and eight laterals originating from buses 3, 4, 8, 9, 11, and 12. It consists of 69 buses and 68 lines, with a base voltage of 12.66 kV and a base apparent power of 10 MVA. The single-line diagram of the IEEE 69-bus test system is shown in Figure 2. This diagram provides a clearer view of the feeder arrangement, the lateral branches, and the location of the sectionalizing and tie-switching devices considered in the reconfiguration process.
Figure 2.
Single-line diagram of the IEEE 69-bus test system.
Similar to the previous case, the topological analysis is performed on the network shown in Figure 2 using the incidence matrix to identify the loops generated by the tie lines.
This matrix provides a complete representation of the possible switching maneuvers within the meshed network, offering relevant information on the structure, connectivity, and possible power flow paths. Since each loop may contain a different number of candidate switching devices, the loop-specific discretization procedure defined in (6)–(8) was applied independently to each row of the candidate-switch matrices shown in Table 3 and Table 4. In addition, each generated topology was validated using the graph-based radiality criteria defined in Equations (12)–(14) before being accepted as a feasible solution.
Table 3.
Switch matrix for operating maneuvers in each loop of the 33-bus system.
Table 4.
Switch matrix for operating maneuvers in each loop of the 69-bus system.
4.2. Integration of the Switching Device Availability Constraint
In this study, before executing the optimization algorithm, the configuration matrix is filtered using a switching device availability constraint matrix, which excludes switches whose operation is not feasible under real operating conditions. The resulting availability-constrained switch matrix for the IEEE 33-bus system is presented in Table 5.
Table 5.
Switch matrix for operating maneuvers with availability constraints for the 33-bus system.
As in the 33-bus system, the configuration matrix of the 69-bus system is modified by applying the device availability constraint matrix. The corresponding availability-constrained switch matrix for the IEEE 69-bus system is shown in Table 6.
Table 6.
Switch matrix for operating maneuvers with availability constraints for the 69-bus system.
4.3. Results of Incorporation of the Relative Georeferenced Spatial-Operational Indicator
To incorporate the georeferenced component into the model analysis, geographic coordinates were assigned to each bus of the IEEE 33-bus and 69-bus test systems. Based on this information, the distances between network elements were calculated, allowing the spatial structure of the test systems to be characterized.
Table 7 presents the spatial characterization of the test systems under analysis. The IEEE 33-bus system has an estimated total length of 6.42 km, with an average distance of 0.20 km between nodes and a maximum distance of 0.42 km, attributed to its branched structure. In contrast, the IEEE 69-bus system has a total length of 10.69 km and an average distance of 0.16 km between consecutive buses.
Table 7.
General spatial characterization of the IEEE test systems based on consecutive network branches.
It should be emphasized that Table 7 provides only a general spatial characterization of the base IEEE test systems based on the distances between consecutive network branches. These values are not the same complete set of distances used to compute . The indicator is calculated using the representative distances associated with the selected candidate switching devices, including tie or non-consecutive branches, as reported in Appendix C and Appendix D.
It is important to note that, since the IEEE test systems do not include geographic data, real geographic coordinates from the city of Quito were used as a reference. These coordinates were adapted to represent the spatial structure of the IEEE 33-bus and 69-bus systems while preserving their topological and geographic characteristics. The coordinates used for both test systems are presented in Appendix A and Appendix B, respectively.
It should be noted that the assigned coordinates are representative and are not intended to reproduce an actual utility GIS database. Therefore, the relative georeferenced spatial-operational indicator is used in this study as a spatial-operational proxy to evaluate the capability of the proposed methodology to incorporate representative spatial information into the reconfiguration process. Under this assumption, the calculated distances should not be interpreted as exact field distances, but rather as relative spatial indicators that allow the optimization model to compare the representative spatial separation of selected switching devices. This approach preserves the electrical and topological characteristics of the IEEE test systems while enabling the methodological evaluation of the relative georeferenced spatial-operational indicator within the proposed weighted scalar framework.
The distances used in this study were calculated from the assigned latitude and longitude coordinates of the terminal buses of each branch. Therefore, they correspond to georeferenced straight-line distances within the representative spatial model and not to road-network distances. Consequently, these values should not be directly interpreted as field travel distances, switching-operation times, or restoration times. Their purpose is to provide a consistent relative spatial criterion for comparing alternative reconfiguration solutions under the same coordinate assignment.
To make the calculation of the relative georeferenced spatial-operational indicator fully traceable, the representative distance associated with each candidate switching device was computed from the latitude and longitude of the terminal buses of the corresponding branch. The complete set of candidate-switch distances is reported in Appendix C for the IEEE 33-bus system and Appendix D for the IEEE 69-bus system. For each candidate topology, the value of reported in the results tables was obtained by summing the distances associated with the five selected switching devices, according to Equation (5).
4.4. Sensitivity Analysis of the Parameter
For the sensitivity analysis of the parameter , the value of was kept constant in order to independently evaluate the influence of the relative georeferenced spatial-operational indicator within the proposed weighted scalar optimization process. In this way, the observed results in active power losses, ENS, and the relative georeferenced spatial-operational indicator can be directly attributed to the variation of .
First, the simulation is performed for the 33-bus system, resulting in Table 8.
Table 8.
Sensitivity analysis of the parameter for the IEEE 33-bus system.
Then, the simulation is performed for the 69-bus system, and the results are shown in Table 9.
Table 9.
Sensitivity analysis of the parameter for the IEEE 69-bus system.
Table 10 verifies how the reported values of are obtained for representative configurations. In each case, the indicator corresponds to the sum of the representative georeferenced distances associated with the five switching devices selected for opening. Therefore, the values reported in Table 8 and Table 9 are not interpreted as the total physical feeder length, but as a relative spatial indicator associated with the selected switching maneuvers.
Table 10.
Verification of the indicator for representative configurations.
Based on the obtained results, it is observed that high values of tend to prioritize the reduction of the georeferenced indicator, which may lead to less favorable active power losses or ENS values. Conversely, very low values do not produce a significant impact on the spatial distribution of the switching maneuvers.
The selection of the weighting factor was based on the trade-off observed among active power losses, ENS, and the relative georeferenced spatial-operational indicator associated with the selected switching devices. In this regard, the value was identified as the lowest weighting factor capable of producing a noticeable reduction in while maintaining active power losses and ENS within a narrow range of variation. Therefore, is not intended to normalize all objective terms into equivalent units, but rather to introduce an empirical weighting factor that allows to act as a secondary spatial-operational criterion when candidate configurations have comparable electrical and reliability performance. This value allows the spatial-operational indicator to influence the optimization process without dominating the electrical and reliability criteria. In contrast, higher values of tend to excessively prioritize the reduction of , which may lead to configurations with degraded electrical performance or higher ENS values. Therefore, the selected weighting factor provides an appropriate balance between the relative spatial-operational indicator and system performance.
4.5. Results Considering ENS and the Device Availability Constraint
This section compares the results of the IEEE 33-bus and 69-bus test systems under the initial condition, corresponding to the base configuration with open tie lines, against the results obtained with the optimal configuration. The latter was obtained by minimizing power losses and ENS, while additionally incorporating the binary operability constraint , which limits the set of candidate sectionalizing devices to those that are technically operable. The optimal configuration was obtained using MRFO.
In this scenario, the relative georeferenced spatial-operational indicator is not yet incorporated into the weighted scalar objective function; therefore, the analysis focuses only on electrical, reliability, and operational feasibility criteria. The base and optimal configurations obtained for the IEEE 33-bus and 69-bus systems are summarized in Table 11.
Table 11.
Configuration of the MRFO Algorithm.
The evaluation considers active power losses and ENS as the main indicators, along with the variation in voltage level as the resulting electrical indicator.
Table 12 presents the comparative results obtained for the IEEE 33-bus and 69-bus systems, considering the base case, without performing the optimization process, and the obtained optimal configuration, without considering the relative georeferenced spatial-operational indicator . In both systems, a significant improvement is observed in the analyzed indicators, demonstrating the effectiveness of the proposed method.
Table 12.
Comparison of results for the IEEE 33-bus and 69-bus systems.
Active power losses show significant reductions with respect to the base case in both systems. In the 33-bus system, losses decrease from 202.677 kW to 143.711 kW, equivalent to a reduction of 29.094%. Likewise, in the 69-bus test network, losses decrease from 224.991 kW to 73.129 kW, achieving a more pronounced reduction of 67.497%. These results indicate that the obtained configurations redistribute the power transfer in the network more efficiently, reducing currents in the most heavily loaded branches and, consequently, the losses associated with conductor resistance.
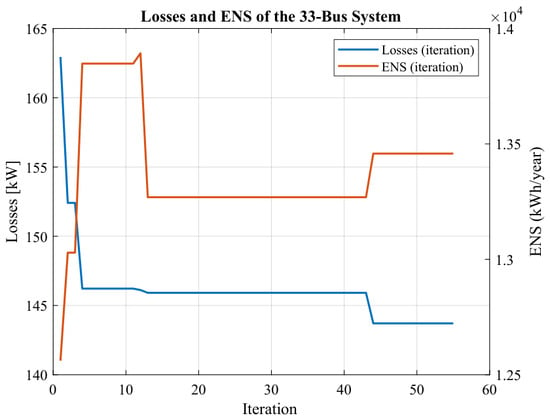
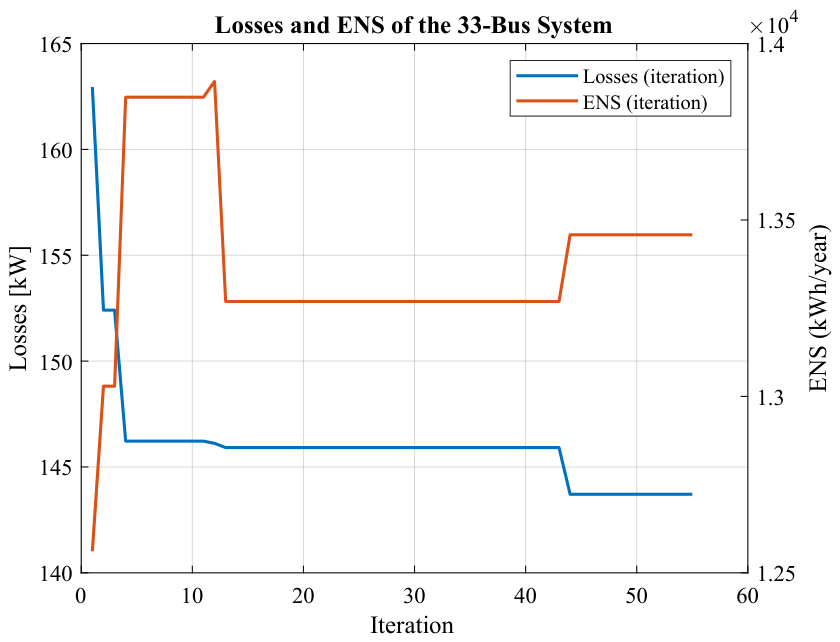
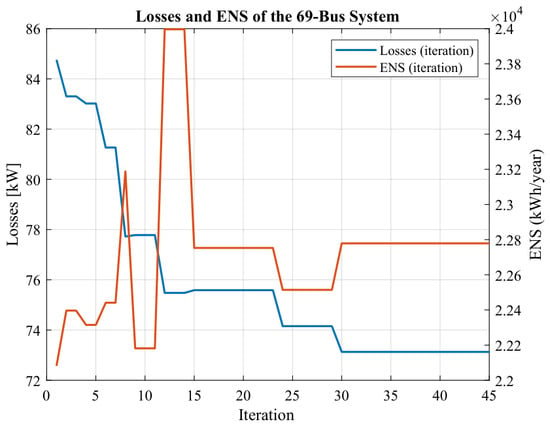
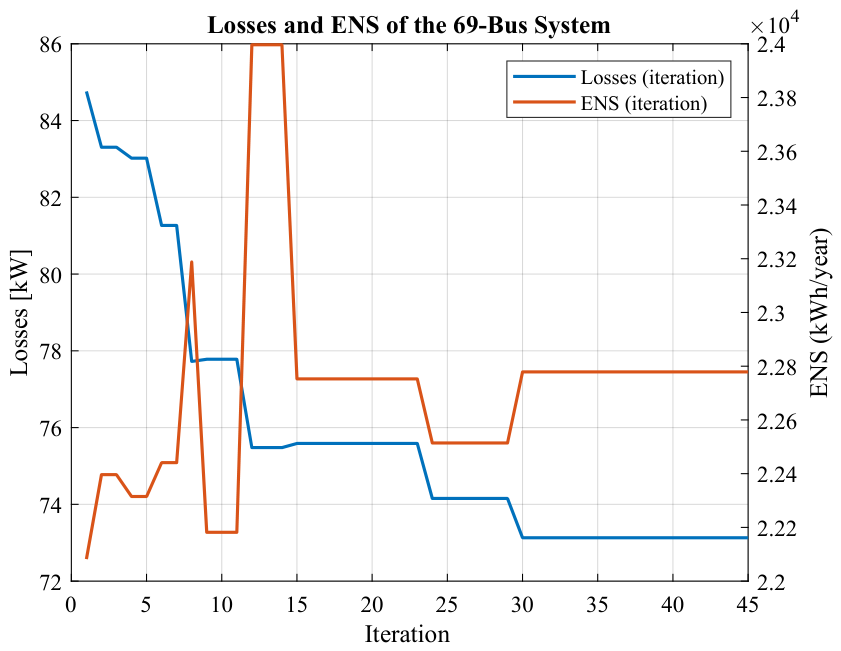
In terms of reliability, ENS also improves in both systems. In the 33-bus system, ENS decreases from 16,212 kWh/year to 13,458 kWh/year, representing a reduction of 16.987%. For the 69-bus system, ENS decreases from 29,674.5 kWh/year to 22,778.82 kWh/year, equivalent to a reduction of 23.238%. These results confirm that incorporating the ENS index into the optimization process makes it possible to identify configurations that not only reduce technical losses but also decrease the energy impact of service interruptions under contingencies. The evolution of active power losses and ENS during the optimization process for the IEEE 33-bus and 69-bus systems is shown in Figure 3 and Figure 4, respectively.
Figure 3.
Comparison of losses and ENS for the IEEE 33-bus system.
Figure 4.
Comparison of losses and ENS for the IEEE 69-bus system.
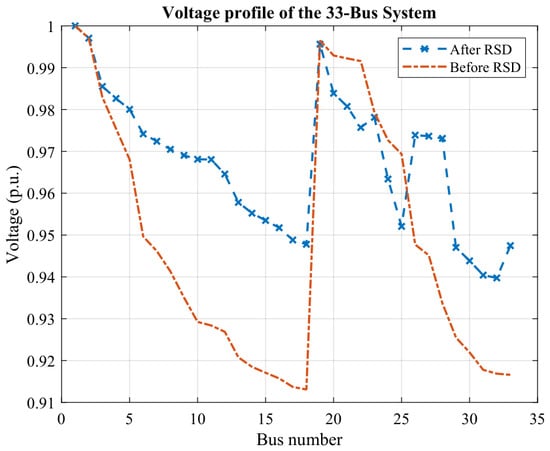
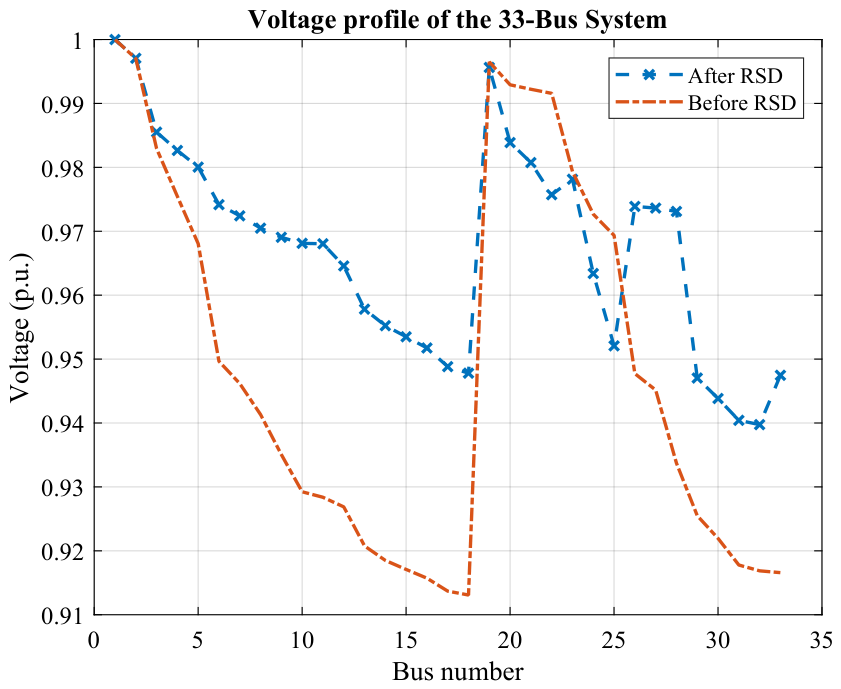
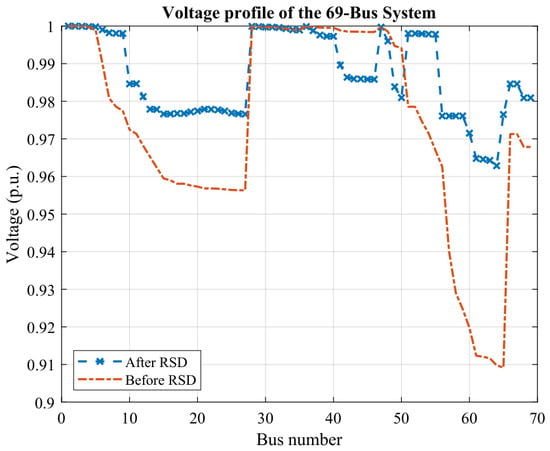
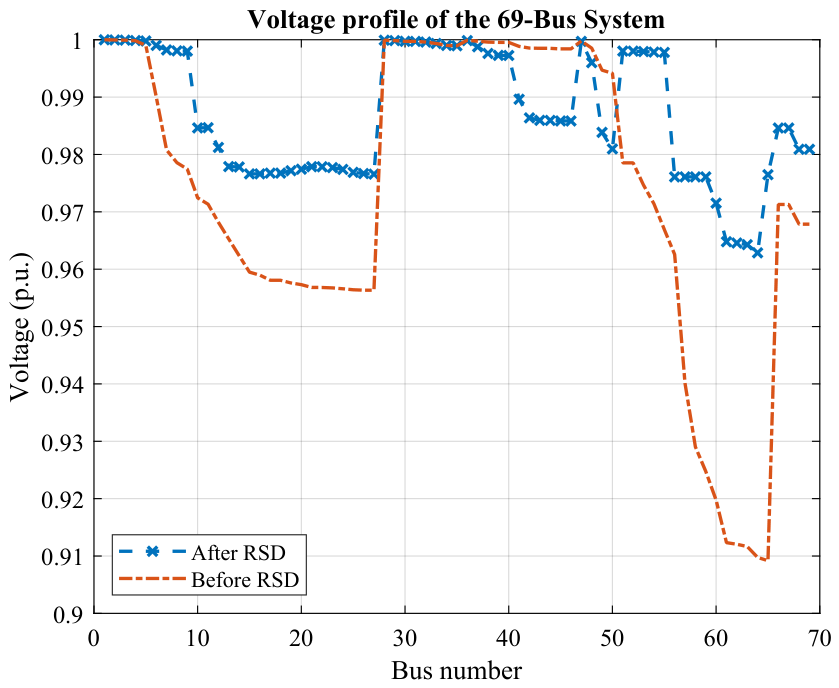
Regarding the voltage profile, both systems show an improvement in the minimum voltage after reconfiguration. In the 33-bus system, the minimum voltage increases from 0.913 p.u. to 0.939 p.u., which represents an improvement of 2.848%. In the 69-bus network, the minimum voltage increases from 0.909 p.u. to 0.960 p.u., corresponding to an improvement of 5.611%. The reduction in losses and the redistribution of power flows indirectly contribute to improving the voltage conditions at the buses located farthest from the feeder. The voltage profiles before and after reconfiguration for the IEEE 33-bus and 69-bus systems are presented in Figure 5 and Figure 6, respectively.
Figure 5.
Voltage profile for the IEEE 33-bus system.
Figure 6.
Voltage profile for the IEEE 69-bus system.
Overall, the data shown in Table 12 demonstrate that the proposed methodology makes it possible to simultaneously improve energy efficiency, supply reliability, and service quality in both smaller networks and networks with greater topological complexity. This confirms the ability of the algorithm to efficiently analyze all possible solutions and identify optimal configurations under electrical and operational constraints.
Although the obtained results demonstrate significant improvements in electrical performance indicators, it is necessary to complement the analysis with a statistical validation of the optimization algorithm and an assessment of the impact of the relative georeferenced spatial-operational indicator on the obtained configurations.
4.6. Results Considering ENS, the Device Availability Constraint , and the Relative Georeferenced Spatial-Operational Indicator
In this scenario, the relative georeferenced spatial-operational indicator is incorporated into the weighted scalar objective function in order to include spatial information associated with the selected switching devices within the adopted representative coordinate model. Unlike the previous case, this scenario simultaneously considers power losses, ENS, the switching device availability constraint , and the relative georeferenced spatial-operational indicator .
To quantitatively evaluate the performance of the proposed methodology, a direct comparison is made with the results reported in [12], where distribution system reconfiguration is addressed using incidence matrices and the MRFO algorithm considering only electrical criteria.
The results of the proposed methodology are presented through two analysis scenarios: one in which the relative georeferenced spatial-operational indicator is included and another in which it is not considered, as described in Section 4.5. This comparison is performed to assess the impact of incorporating the relative georeferenced spatial-operational indicator into the optimization process.
For the 33-bus system, the inclusion of the relative georeferenced spatial-operational indicator leads to a reduction in from 7.247 km to 3.763 km. In addition, the configuration obtained with presents a slightly lower ENS value, decreasing from 13,458 kWh/year to 13,020 kWh/year, while active power losses remain within a narrow range, changing from 143.711 kW to 143.185 kW. These results indicate that incorporating the relative georeferenced spatial-operational indicator reduces the representative spatial separation of the selected switching maneuvers without degrading the electrical or reliability performance of the system. Therefore, for the IEEE 33-bus case, the proposed formulation with provides a more favorable compromise among active power losses, ENS, and the relative spatial indicator. A summary of these results is presented in Table 13.
Table 13.
Comparison of results for the IEEE 33-bus system.
A corresponding comparison for the IEEE 69-bus system is presented in Table 14.
Table 14.
Comparison of results for the IEEE 69-bus system.
For the 69-bus system, the inclusion of the relative georeferenced spatial-operational indicator made it possible to substantially reduce from 11.322 km to 5.503 km. In addition, the results show a slight improvement in active power losses, decreasing from 73.129 kW to 72.559 kW, while ENS remains practically unchanged, varying from 22,778.82 kWh/year to 22,762.02 kWh/year. These results indicate that the proposed methodology achieves a balanced solution among electrical performance, reliability, and the relative spatial distribution of the selected switching devices.
The obtained results indicate that, although conventional reconfiguration approaches may achieve slightly greater reductions in technical losses when this variable is considered as the only optimization criterion, such configurations do not necessarily represent more realistic operating conditions when evaluated in terms of reliability and switching feasibility. In contrast, the proposed methodology explicitly integrates the ENS index, operational constraints, and the relative georeferenced spatial-operational indicator associated with the selected switching devices, thereby restricting and ranking the search space according to technically implementable and spatially informed configurations.
This weighted scalar formulation makes it possible to obtain solutions that not only optimize energy performance but also improve supply continuity and are more representative of the operating conditions present in electrical distribution networks.
4.7. Statistical Validation of the Proposed Methodology
To evaluate the consistency of the proposed methodology, particularly with respect to the electrical and reliability indicators, a statistical validation is performed based on 30 runs of the simulation algorithm under identical initial conditions. Multiple simulations are carried out for the 33-bus and 69-bus systems, obtaining the results shown in Table 15.
Table 15.
Statistical validation of the proposed methodology for the IEEE 33-bus and 69-bus systems.
Table 15 summarizes the main statistical indicators, namely minimum, maximum, mean, standard deviation, and coefficient of variation (CV), for the variables considered in the optimization process. These variables include active power losses, ENS, and the indicator, with the aim of characterizing the dispersion of the solutions obtained in the independent runs.
For active power losses, the coefficient of variation remains below 1% in both test systems. This low dispersion indicates that the proposed methodology consistently converges toward configurations with similar electrical performance, despite the stochastic nature of the MRFO search process.
Similarly, ENS presents relatively low dispersion, with CV values of 3.51% for the IEEE 33-bus system and 1.84% for the IEEE 69-bus system. These results indicate stable reliability performance among the independent runs and show that the proposed formulation consistently identifies configurations with comparable ENS values.
In contrast, the indicator presents higher variability, with CV values of 25.57% and 37.40% for the IEEE 33-bus and 69-bus systems, respectively. This result should not be interpreted as robustness of the georeferenced term itself. Rather, it indicates that several spatially different switching configurations may provide similar electrical and reliability performance. Therefore, the higher variability of reflects the existence of multiple feasible spatial arrangements within the search space, instead of convergence instability in the main electrical indicators.
Overall, the statistical results support the robustness claim mainly with respect to the electrical and reliability indicators, namely active power losses and ENS, for which low CV values were obtained. The higher dispersion observed in should not be interpreted as robustness of the georeferenced indicator itself. Instead, it reflects spatial flexibility among feasible configurations and highlights the need to analyze the relative georeferenced spatial-operational indicator as a complementary operational criterion rather than as the sole indicator of convergence quality.
5. Conclusions
This work presented an optimal reconfiguration methodology for electrical distribution systems that incorporates technical, reliability, operational, and spatial criteria within a unified optimization framework. Unlike conventional approaches focused mainly on active power loss reduction and voltage profile improvement, the proposed formulation explicitly includes Energy Not Supplied (ENS) as a reliability indicator, allowing the reconfiguration process to account for the impact of service interruptions under contingency conditions.
The incorporation of ENS into the objective function, through a suitable weighting factor, makes it possible to combine reliability-related information with electrical performance indicators. As a result, the optimization process is guided toward configurations that not only reduce technical losses but also mitigate the energy impact associated with supply interruptions. This provides a more comprehensive assessment of the operational benefits obtained through network reconfiguration.
In addition, the proposed availability constraint for switching devices allows non-operable or impractical maneuvers to be excluded from the search space. This constraint, implemented through a binary matrix associated with the candidate sectionalizing devices in each loop, accounts for conditions such as equipment deterioration, lack of remote-control capability, physical limitations, or difficult access. Therefore, the resulting configurations are more feasible from an operational standpoint and better aligned with the practical conditions of real distribution networks.
The inclusion of the relative georeferenced spatial-operational indicator further enhances the proposed methodology by incorporating representative spatial information related to the location of network elements and switching devices. By considering the representative georeferenced distance associated with the selected switching devices, the model favors solutions with lower representative spatial separation without modifying the electrical parameters of the test systems. This aspect is relevant for practical operation, since spatial location may be associated with access, travel, and switching considerations that can influence service restoration and reliability performance in real distribution networks; however, the proposed indicator should be interpreted as a relative spatial-operational proxy rather than as an exact measure of travel time, switching-operation time, or restoration time.
The methodology was validated using the IEEE 33-bus and 69-bus test systems. The results showed reductions in active power losses, improvements in the minimum voltage profile, and decreases in ENS, confirming that the proposed approach can simultaneously improve energy efficiency, supply reliability, and service quality. Moreover, the statistical validation demonstrated consistent behavior in the electrical and reliability indicators, particularly active power losses and ENS. The higher variability observed in should be interpreted as spatial flexibility among feasible switching configurations rather than as direct evidence of convergence robustness for the relative georeferenced spatial-operational indicator.
It is worth noting that the georeferenced information used in this study is representative and does not correspond to an actual utility GIS database. Therefore, should be interpreted as a relative georeferenced spatial-operational indicator rather than as an exact field distance, road-network distance, or operational time metric. Similarly, the uniform failure rates and repair times used for ENS calculation should be interpreted as controlled assumptions for the IEEE test systems, since these systems do not provide historical reliability records. In real distribution networks, these parameters may vary according to line type, equipment condition, environmental exposure, maintenance practices, and utility-specific outage statistics. Consequently, the application of the proposed methodology to real distribution networks with GIS information, historical interruption records, remote-control availability data, and practical switching constraints represents a relevant direction for future work.
Overall, the proposed methodology provides a more realistic and comprehensive framework for distribution system reconfiguration. By integrating electrical performance, reliability, switching-device availability, and the relative georeferenced spatial-operational indicator, the approach supports the selection of configurations that are technically efficient, operationally feasible, and more representative of the practical operation of electrical distribution networks.
Author Contributions
Conceptualization, K.P. and C.B.-S.; methodology, K.P. and C.B.-S.; software, K.P.; validation, K.P. and C.B.-S.; formal analysis, K.P. and C.B.-S.; investigation, K.P.; resources, C.B.-S.; data curation, K.P.; writing–original draft preparation, K.P.; writing–review and editing, C.B.-S.; visualization, K.P.; supervision, C.B.-S.; project administration, C.B.-S. All authors have read and agreed to the published version of the manuscript.
Funding
This research received no external funding. The APC was funded by Universidad Politécnica Salesiana (UPS), Quito, Ecuador.
Data Availability Statement
The data supporting the findings of this study are available from the corresponding author upon reasonable request. Processed simulation results used to generate the tables and figures can be provided upon reasonable request.
Conflicts of Interest
The authors declare no conflicts of interest.
Appendix A. Geographic Coordinates of the IEEE 33-Bus System
The following coordinates correspond to the spatial representation adopted for the IEEE 33-bus test system. Since the original IEEE system does not include geographic information, representative coordinates located within the city of Quito were assigned while preserving the topological structure of the network.
Table A1.
Geographic coordinates assigned to the IEEE 33-bus system.
Appendix B. Geographic Coordinates of the IEEE 69-Bus System
The following coordinates correspond to the spatial representation adopted for the IEEE 69-bus test system. Since the original IEEE system does not include geographic information, representative coordinates located within the city of Quito were assigned while preserving the topological structure of the network.
Table A2.
Geographic coordinates assigned to the IEEE 69-bus system.
Appendix C. Georeferenced Distances of Candidate Switching Devices for the IEEE 33-Bus System
The following table reports the representative georeferenced distance associated with each candidate switching device of the IEEE 33-bus test system. These values were calculated from the latitude and longitude of the terminal buses of each corresponding branch. The distances are used to compute the indicator for each candidate reconfiguration.
Table A3.
Representative georeferenced distances of candidate switching devices for the IEEE 33-bus system.
Appendix D. Georeferenced Distances of Candidate Switching Devices for the IEEE 69-Bus System
The following table reports the representative georeferenced distance associated with each candidate switching device of the IEEE 69-bus test system. These values were calculated from the latitude and longitude of the terminal buses of each corresponding branch. The distances are used to compute the indicator for each candidate reconfiguration.
Table A4.
Representative georeferenced distances of candidate switching devices for the IEEE 69-bus system.
References
- Varadejsatitwong, P.; Banomyong, R.; Julagasigorn, P. A Proposed Performance-Measurement System for Enabling Supply-Chain Strategies. Sustainability 2022, 14, 11797. [Google Scholar] [CrossRef] [Scilit]
- Pareja, L.A.G. Optimal Integration of Distribution Network Reconfiguration and Conductor Selection in Power Distribution Systems. Energies 2023, 16, 6998. [Google Scholar] [CrossRef] [Scilit]
- Šošić, D.; Rajić, T.; Stefanov, P.; Stojanović, B. Distribution Network Reconfiguration Using the Open Switch Moving Register Method. In Proceedings of the 2021 IEEE PES Innovative Smart Grid Technologies Conference—Latin America (ISGT Latin America); IEEE: New York, NY, USA, 2021; pp. 1–5. [Google Scholar] [CrossRef] [Scilit]
- Ntombela, M.; Kabeya, M.; Leoaneka, M.C. Artificial Intelligence Hybrid Algorithm for System Reconfiguration to Reduce Power Losses in the Distribution System. In Proceedings of the ICONIC 2022 Conference, Balaclava, Mauritius, 8–9 December 2022; pp. 213–220. [Google Scholar] [CrossRef] [Scilit]
- Mariño, W.; Barrera-Singaña, C.; Muñoz, J.; Pavón, W.; Jaramillo, M. Distribution System Reconfiguration for Voltage Profile Improvement using Enhanced Particle Swarm Optimization. In Proceedings of the 2023 IEEE IAS Global Conference on Renewable Energy and Hydrogen Technologies (GlobConHT), Malé, Maldives, 11–12 March 2023. [Google Scholar] [CrossRef] [Scilit]
- Mehta, P.; Sait, S.M.; Yildiz, B.S.; Yildiz, A.R. Enhanced Hippopotamus Optimization Algorithm and Artificial Neural Network for Mechanical Component Design. Mater. Test. 2025, 67, 655–662. [Google Scholar] [CrossRef] [Scilit]
- Talha, A.; Mannan, M.A.; Ahmad, S.; Hazari, R. Optimization of Distribution Network Reconfiguration using Various Algorithms for Power Loss Minimization. In Proceedings of the 2024 International Conference on Innovative Science, Engineering and Technology (ICISET); IEEE: New York, NY, USA, 2024; pp. 1–6. [Google Scholar] [CrossRef] [Scilit]
- Mishra, A.; Tripathy, M.; Ray, P. A survey on different techniques for distribution network reconfiguration. J. Energy Rep. 2024, 12, 173–181. [Google Scholar] [CrossRef] [Scilit]
- Alanazi, A.; Alanazi, M. Artificial Electric Field Algorithm: Pattern Search for Multi-Criteria Distribution Network Reconfiguration Considering Power Quality and Energy Not Supplied. Energies 2022, 15, 5269. [Google Scholar] [CrossRef] [Scilit]
- Alanazi, M.; Alanazi, A.; Almadhor, A.; Memon, Z.A. Multiobjective reconfiguration of unbalanced distribution networks using improved transient search optimization algorithm considering power quality and reliability metrics. Sci. Rep. 2022, 12, 13686. [Google Scholar] [CrossRef] [Scilit] [PubMed]
- Souifi, H.; Abdallah, H.H. Optimal Distribution Network Reconfiguration Using Ant Lion Optimizer. In Proceedings of the 2022 IEEE 21st International Conference on Sciences and Techniques of Automatic Control and Computer Engineering (STA); IEEE: New York, NY, USA, 2022; pp. 555–560. [Google Scholar] [CrossRef] [Scilit]
- Gonzalez-Solorzano, E.; Barrera-Singana, C.; Arcos, H. Optimal Topology Configuration Analysis in Distribution Systems Using Incidence Matrix and Manta Ray Foraging Optimization Algorithm. In Proceedings of the 2025 IEEE Ninth Ecuador Technical Chapters Meeting (ETCM); IEEE: New York, NY, USA, 2025. [Google Scholar] [CrossRef] [Scilit]
- Aschidamini, G.L.; da Cruz, G.A.; Resener, M.; Leborgne, R.C.; Pereira, L.A. A Framework for Reliability Assessment in Expansion Planning of Power Distribution Systems. Energies 2022, 15, 5073. [Google Scholar] [CrossRef] [Scilit]
- Jooshaki, M.; Abbaspour, A.; Fotuhi-Firuzabad, M.; Muñoz-Delgado, G.; Contreras, J.; Lehtonen, M.; Arroyo, J.M. An Enhanced MILP Model for Multistage Reliability-Constrained Distribution Network Expansion Planning. IEEE Trans. Power Syst. 2022, 37, 118–131. [Google Scholar] [CrossRef] [Scilit]
- Niño Callejas, S.D.; Palombi Gómez, J.C. A Methodology to Calculate the Non-Supplied Energy Level in Distribution Grids with Radial Structure. Trans. Energy Syst. Eng. Appl. 2021, 2, 23–32. [Google Scholar] [CrossRef] [Scilit]
- Viganò, G.; Clerici, D.; Michelangeli, C.; Moneta, D.; Bosisio, A.; Morotti, A. Energy Transition through PVs, EVs, and HPs: A Case Study to Assess the Impact on the Brescia Distribution Network. In Proceedings of the 2021 AEIT International Annual Conference (AEIT), Milan, Italy, 4–8 October 2021. [Google Scholar] [CrossRef] [Scilit]
- Al Hasan Shaikat, M.; Roy, B.; Faruk, M.F.H.; Srabonti, T.M.; Huda, A.S.N. Effect of Component Unavailability on Power Distribution Feeder Reliability. In Proceedings of the 2023 6th International Conference on Electrical Information and Communication Technology (EICT), Khulna, Bangladesh, 7–9 December 2023; pp. 1–6. [Google Scholar] [CrossRef] [Scilit]
- Soleimanian Gharehchopogh, F.; Ghafouri, S.; Namazi, M.; Arasteh, B. Advances in Manta Ray Foraging Optimization: A Comprehensive Survey. J. Bionic Eng. 2024, 21, 953–990. [Google Scholar] [CrossRef] [Scilit]
- Tang, A.; Zhou, H.; Han, T.; Xie, L. A Modified Manta Ray Foraging Optimization for Global Optimization Problems. IEEE Access 2021, 9, 128702–128719. [Google Scholar] [CrossRef] [Scilit]
- Mohammed, A.; Hassan, I.H.; Abdullahi, M.D.; Aliyu, I.; Kim, J. Manta Ray Foraging Optimization Algorithm: Modifications and Applications. IEEE Access 2023, 11, 53315–53343. [Google Scholar] [CrossRef] [Scilit]
- Wang, H.-J.; Dao, T.-K.; Vu, V.-D.; Ngo, T.-G.; Nguyen, T.-X.-H.; Nguyen, T.T. A Manta Ray Foraging Algorithm Solution for Practical Reactive Power Optimization Problem. In Advances in Intelligent Systems and Computing; Springer: Berlin/Heidelberg, Germany, 2021; pp. 259–270. [Google Scholar] [CrossRef] [Scilit]

Disclaimer/Publisher’s Note: The statements, opinions and data contained in all publications are solely those of the individual author(s) and contributor(s) and not of MDPI and/or the editor(s). MDPI and/or the editor(s) disclaim responsibility for any injury to people or property resulting from any ideas, methods, instructions or products referred to in the content. |
© 2026 by the authors. Licensee MDPI, Basel, Switzerland. This article is an open access article distributed under the terms and conditions of the Creative Commons Attribution (CC BY) license.