


Abstract
To address the issues of high switching losses in power devices and device temperature rise caused by hard switching in conventional plasma power supplies, this study presents a dielectric barrier discharge plasma power supply system based on a zero-voltage switching (ZVS) control strategy. First, the design of the plasma power supply input module, the plasma drive control board, the high-frequency transformer, and the dielectric barrier discharge load is presented. Next, a phase-shifted full-bridge topology simulation model based on the ZVS control strategy is developed using PLECS, and the optimal combination of parameters—including duty cycle, phase shift, resonant inductance, and dead time—is discussed. Subsequently, experimental tests are conducted on the dielectric barrier discharge plasma power supply system, with analyses focusing on the soft-switching waveforms of the power devices under the ZVS control strategy and the performance of the dielectric barrier discharge plasma generator load. Experimental results demonstrate that within the proposed system, the plasma exhibits a uniform distribution. Furthermore, junction temperature measurements of the power devices on the circuit board using a temperature tester show that the temperature rise remains within a reasonable range, thereby validating the feasibility of the designed dielectric barrier discharge plasma power supply system.
1. Introduction
As a material state characterized by high energy density and significant non-equilibrium properties, plasma has found extensive applications in fields such as environmental remediation, materials surface engineering, biomedical sterilization, precision component cleaning, and advanced manufacturing. Among various plasma sources, dielectric barrier discharge (DBD) plasma is a typical non-equilibrium low-temperature plasma, offering advantages including high electron temperature, low heavy-particle temperature, high density of reactive species, uniform discharge, a wide operating pressure range, and the absence of a vacuum system [1]. These attributes endow DBD plasma with irreplaceable technical value in areas such as exhaust gas purification, material modification, thin-film fabrication, and plasma catalysis, making it a prominent focus of interdisciplinary research.
In practical industrial applications, dielectric barrier discharge plasma power supplies are typically required to operate stably over extended periods under high-frequency, high-voltage, and high-power conditions. However, conventional high-frequency, high-voltage, and high-power power supplies often fall short of meeting the demands of modern plasma discharge and advanced manufacturing in terms of circuit topologies, control strategies, energy conversion efficiency, and operational reliability. Therefore, the development of dedicated high-frequency, high-voltage power supplies featuring low loss, high efficiency, low temperature rise, and high output waveform purity is critical to enabling the engineering implementation and large-scale industrial application of dielectric barrier discharge plasma technology.
To enhance the performance of dielectric barrier discharge plasma power supplies, various technical solutions have been proposed in existing studies. For instance, Su et al. developed a high-power-factor plasma power supply that effectively improves input current quality and output stability [2]. Cai and Neretti et al. proposed high-frequency high-voltage power supply solutions for plasma cleaning and dielectric barrier discharge applications from the perspectives of resonant topologies and adaptive regulation, demonstrating the feasibility of soft-switching and self-tuning control under plasma loads [3,4]. In addition, multi-module parallel inverter systems have been employed in plasma-related applications to increase system capacity and operational reliability.
With the rapid advancement of wide-bandgap semiconductor devices, SiC and GaN devices—characterized by high breakdown voltage, low conduction loss, and excellent high-frequency performance—have opened up new technological pathways for high-frequency high-power dielectric barrier discharge power supplies [5]. These devices significantly enhance power density and operating frequency, driving the miniaturization and efficiency improvement of dielectric barrier discharge equipment. Relevant studies indicate that LLC resonant converters and high-frequency inverter power supplies based on SiC devices offer notable advantages in terms of efficiency and power density, while GaN devices demonstrate strong potential in very-high-frequency AC power supplies and pulsed power applications. Furthermore, continuous progress in packaging and interconnection technologies for SiC devices has further promoted their engineering applications in high-voltage, high-power power supply systems.
Despite the positive progress made in the aforementioned studies, several key engineering challenges remain for dielectric barrier discharge plasma power supplies under high-frequency and high-voltage conditions. On one hand, conventional hard-switching inverter topologies suffer from significant voltage–current overlap, resulting in high switching losses, strong electromagnetic interference, and substantial device temperature rise—drawbacks that are further amplified at high frequencies. On the other hand, the strongly nonlinear and time-varying characteristics of dielectric barrier discharge loads can easily lead to output waveform distortion, loss of soft-switching operation, and reduced energy transfer efficiency. Moreover, conventional phase-shifted full-bridge ZVS converters face issues such as difficulty in achieving soft-switching for the leading leg under light-load conditions, sensitivity of the lagging leg to parameter variations, significant influence of parasitic parameters at high frequencies, and duty cycle loss under capacitive loads, making it challenging to maintain stable and efficient operation over a wide load range [6,7].
To address the issues of high switching losses in power devices and the temperature rise caused by hard switching in conventional dielectric barrier discharge plasma power supplies, this paper proposes a phase-shifted full-bridge dielectric barrier discharge plasma power supply scheme based on a zero-voltage switching (ZVS) control strategy. Section II primarily presents the design and analysis of the phase-shifted full-bridge topology [8]. Section III focuses on the system design of the dielectric barrier discharge plasma power supply, completing the integrated design of the external input PFC power module, power supply drive control board, high-frequency transformer, and plasma power supply load tailored to the characteristics of the dielectric barrier discharge load. Section IV mainly describes the design of the ZVS control strategy for the dielectric barrier discharge plasma power supply, detailing the PLECS simulation model developed based on the ZVS control strategy and analyzing the effects of duty cycle, phase shift, resonant inductance, and dead time on the drive signals and output signals [9]. Section V primarily presents the experimental analysis of the dielectric barrier discharge plasma power supply system. Experiments are conducted to analyze the ZVS soft-switching test waveforms, output waveforms of the drive control board, and the load characteristics of the dielectric barrier discharge plasma power supply. The proposed system achieves stable ZVS soft-switching operation, controllable temperature rise in power devices, high-quality output waveforms, and uniform plasma discharge, thereby providing a highly stable design solution for dielectric barrier discharge plasma power supply systems.
2. Design and Analysis of Phase-Shifted Full-Bridge Topology
In this paper, a phase-shifted full-bridge (PSFB) converter is employed to achieve zero-voltage switching (ZVS) for the plasma power supply, thereby achieving higher conversion efficiency [10]. Its core advantage lies in its ability to leverage the inherent resonant components in the circuit—namely the series inductor LrLr and the parasitic output capacitance Coss of the switching devices—to achieve zero-voltage switching of the switches [11].
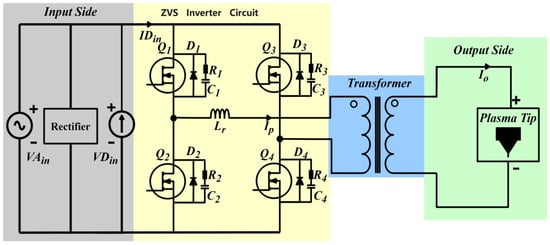
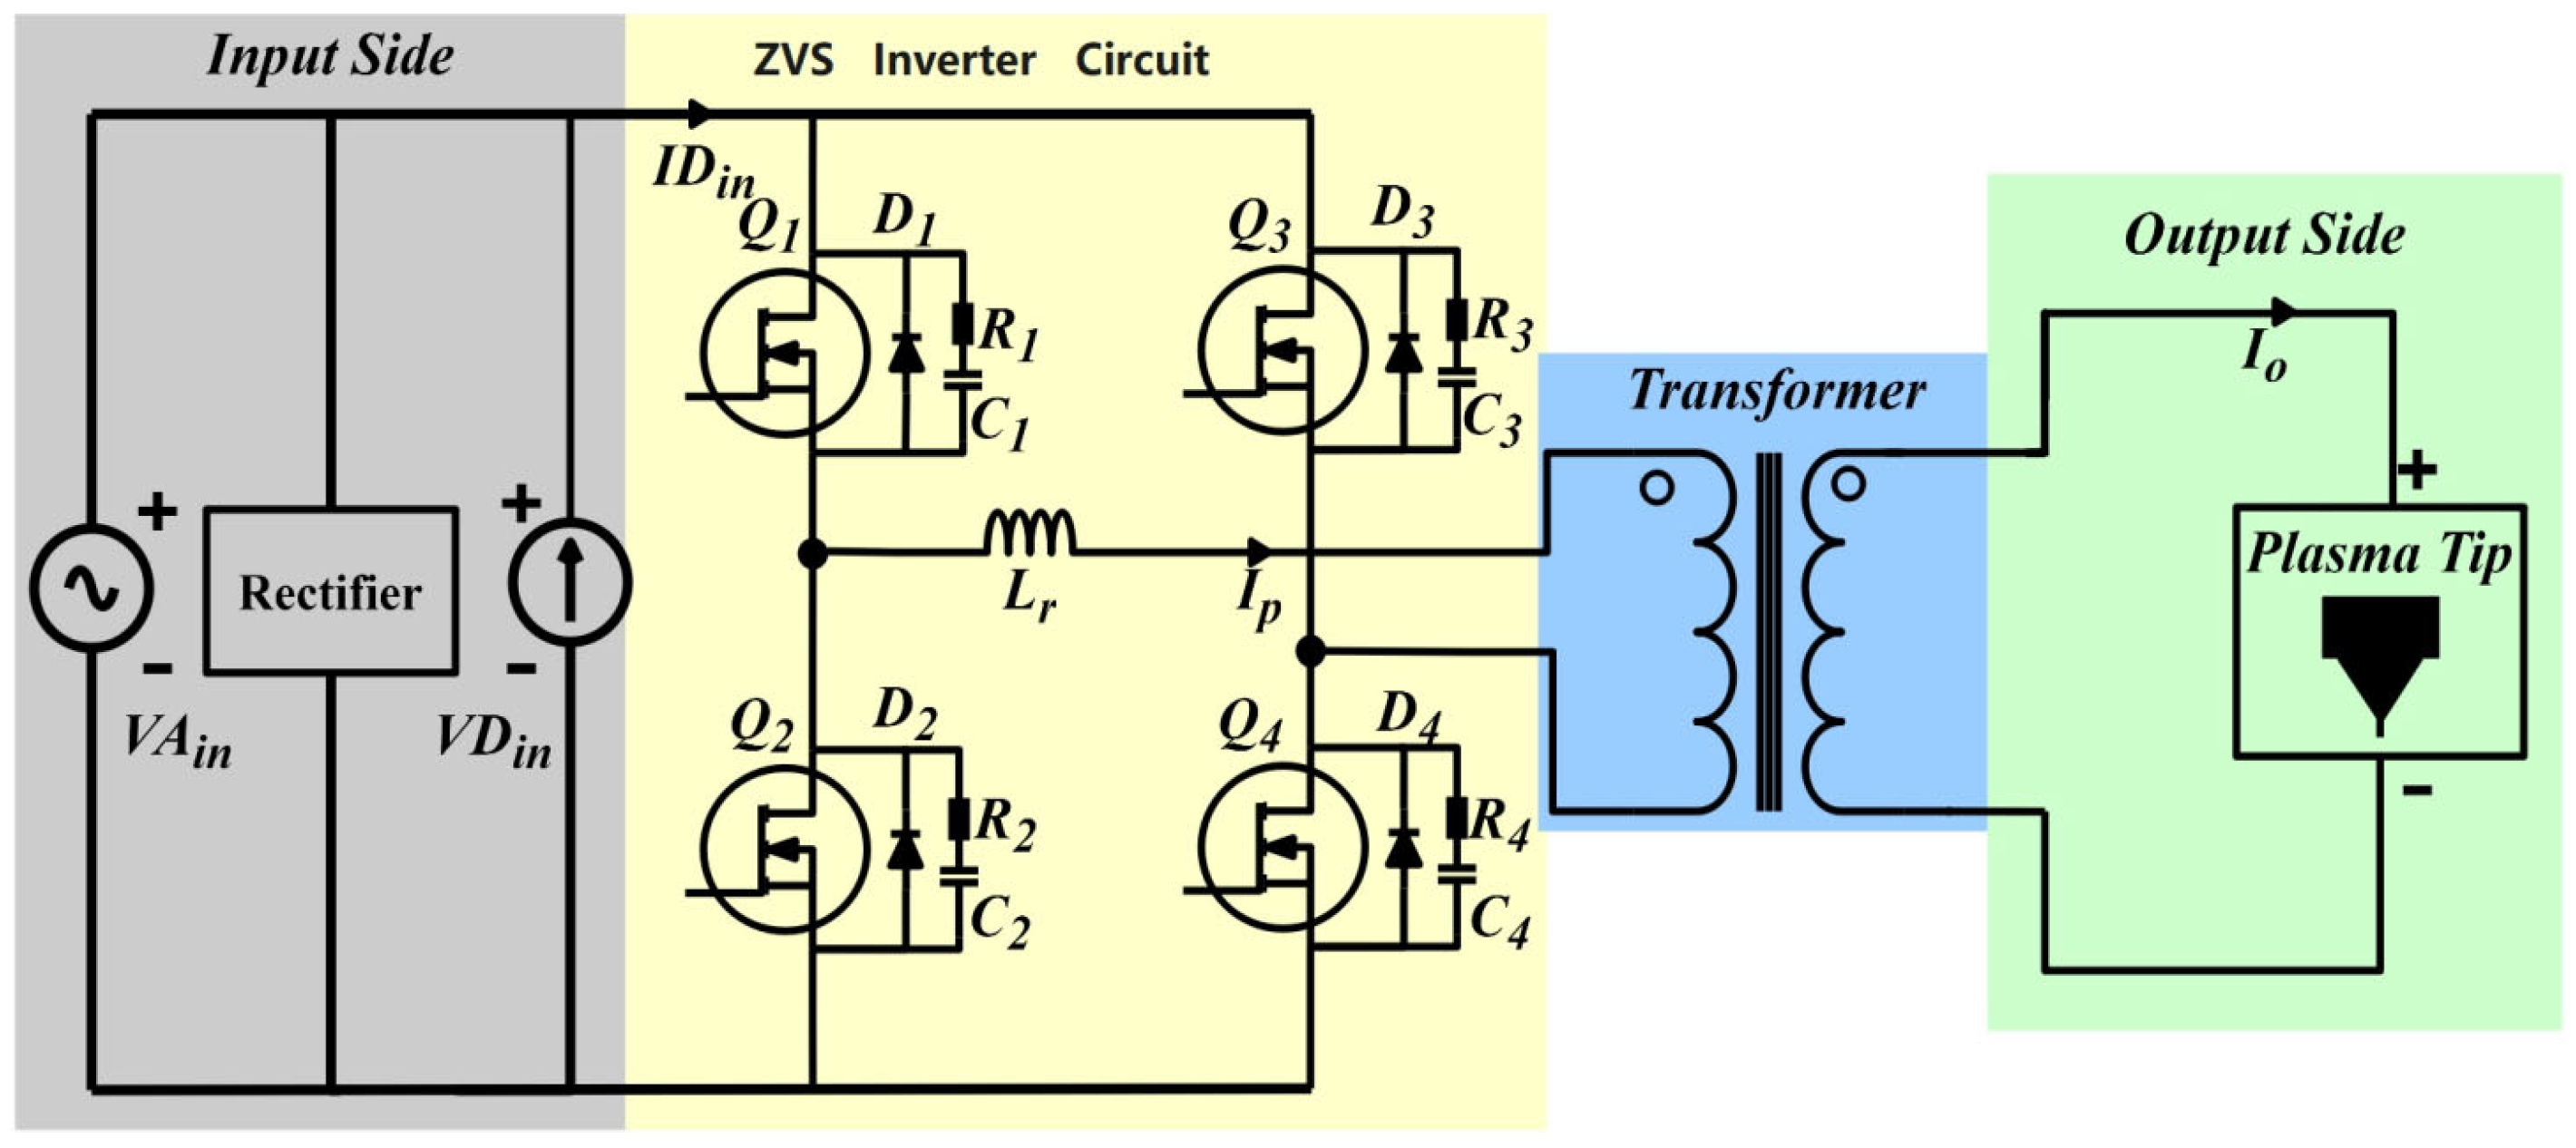
The PSFB circuit topology adopted in this paper is shown in Figure 1, which consists of the following components: (1) Input rectification stage: rectifies the AC input VAin into a DC input VDin [12]; (2) Full-bridge inverter: composed of the leading leg (switches Q1 and Q2) and the lagging leg (switches Q3 and Q4), where the leading leg operates with a fixed duty cycle and leads the lagging leg, while the lagging leg regulates the output power through phase-shift control relative to the main bridge, with Lr serving as the resonant inductor [13,14,15,16]; (3) Transformer: provides high-voltage isolation and voltage step-up; (4) Output filter circuit: filters the high-frequency AC output from the transformer secondary to drive the plasma load [17].
Figure 1.
Phase-shifted full-bridge topology.
For the PSFB topology shown in Figure 1 to achieve zero-voltage switching (ZVS), the key is to provide sufficient inductive energy and an appropriate dead time. To satisfy the inductive energy condition, the PSFB must deliver adequate inductive energy EL to fully charge and discharge the output capacitance of the switching devices according to Equation (1). Here, Ceq represents the board-level equivalent capacitance, which includes the output capacitance Ctr of the switching devices and the parasitic capacitance CXFMR of the transformer and printed circuit board, as expressed in Equation (2).
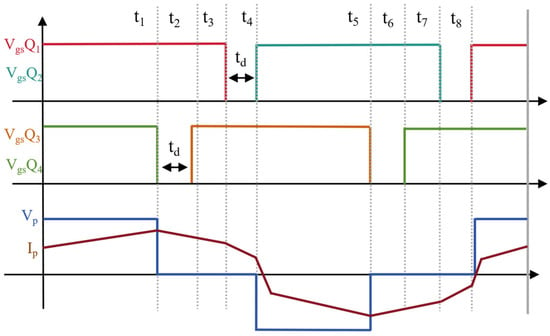
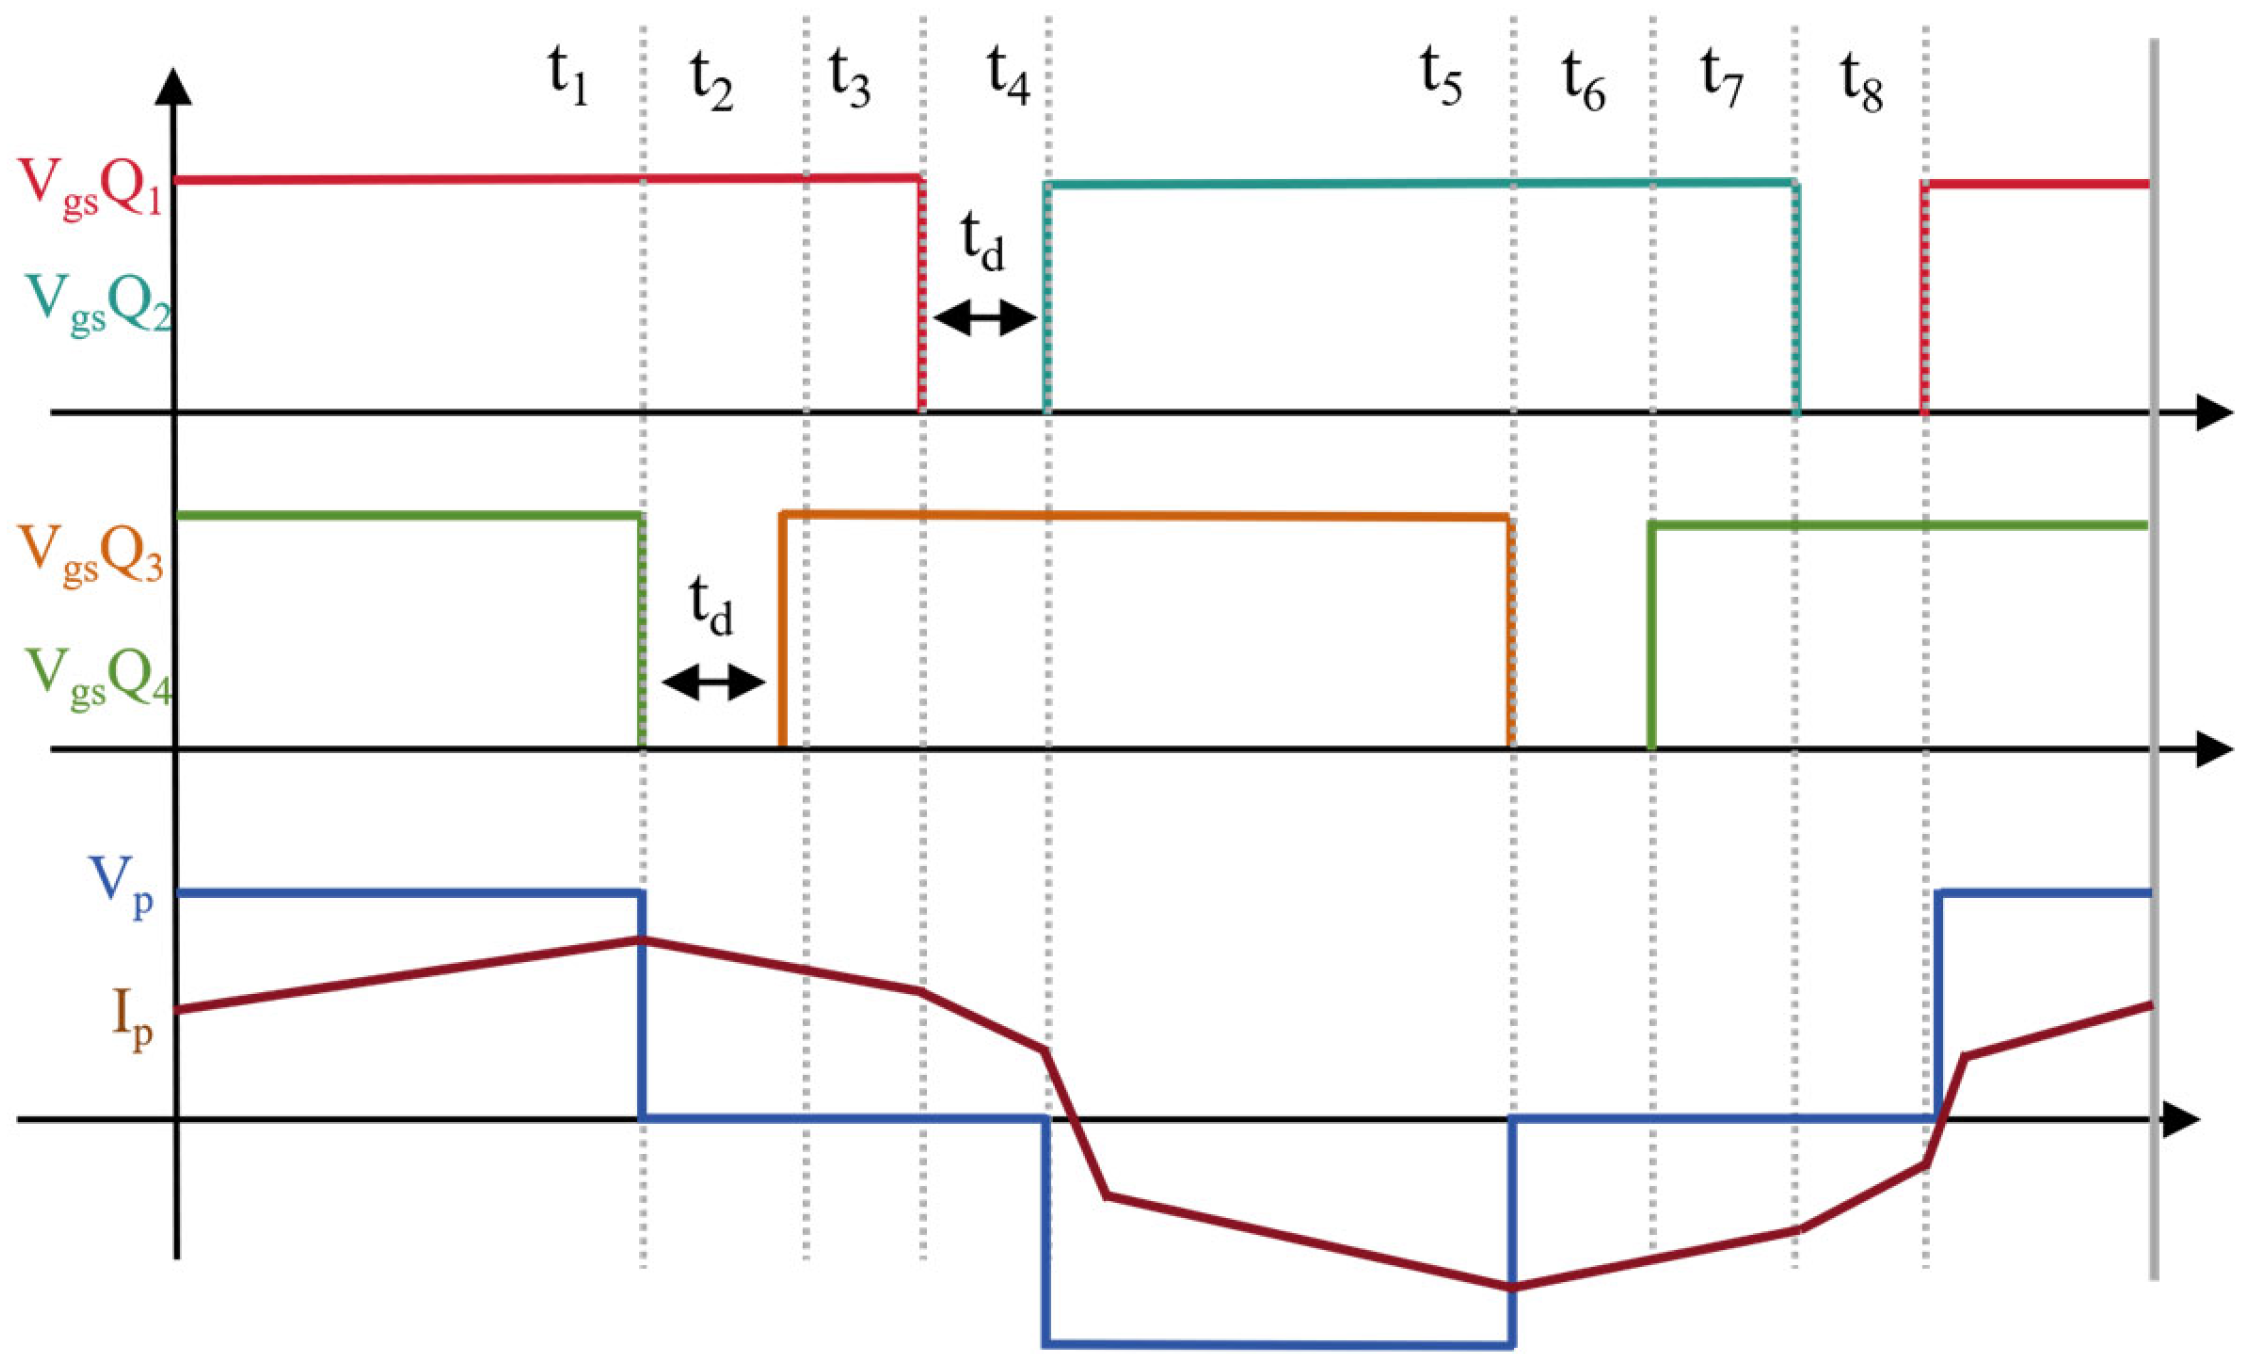
For the leading and lagging legs, the inductive energy available during commutation differs because their output capacitance charging and discharging occur at different time points, as illustrated in Figure 2. When the output capacitance of the transistors in the leading leg is being discharged, the primary-side current reverses its polarity [18]. This causes current commutation in the secondary-side rectifier transistors, resulting in zero voltage across the transformer secondary. This indicates that the inductive energy available for achieving ZVS in the leading leg is primarily provided by the transformer leakage inductance, as defined in Equation (3). For the lagging leg, the situation is more favorable. During the capacitance discharge, the primary-side current is at its maximum and is mainly formed by the current flowing through the secondary-side filter inductor Lf reflected to the primary side. The current in this filter inductor also participates in the charging and discharging process of the capacitance, with its energy defined by Equation (4).
Figure 2.
Switching timing diagram and primary side voltage/current waveforms.
In this context, Leq_lead represents the effective inductance involved in resonance during ZVS commutation of the leading leg, which is typically close to the transformer leakage inductance Llk. Ieq_lead is the primary-side current flowing through Leq_lead at the moment of leading-leg commutation; due to the polarity reversal of the primary current at this instant, its magnitude is generally small and less influenced by the output current [19,20]. 2Ctr denotes the total dynamic output capacitance of the two switches in the leading leg. Leq_lag is the effective inductance involved in resonance during ZVS commutation of the lagging leg, typically represented by the series inductance; Ieq_lag is the primary-side current flowing through Leq_lag at the moment of lagging-leg commutation, and 2Ctr is the total dynamic output capacitance of the two switches in the lagging leg [21].
As described above, the leading leg relies on leakage inductance and a relatively small current to achieve ZVS, whereas the lagging leg depends on the series inductance Lr and a larger current (Ip_lag, determined by the load). This difference makes ZVS easier to achieve for the lagging leg over a wide load range, while ZVS for the leading leg tends to fail under light-load conditions. To address this issue, one approach is to add an auxiliary inductor, which can provide sufficient inductive energy to charge and discharge the capacitances when the leading leg is operating under no-load conditions. This means that the magnetizing current of the transformer alone can be sufficient to achieve ZVS [22,23]. This solution improves efficiency under no-load conditions. However, the introduction of an auxiliary inductor also brings drawbacks such as increased losses, phase-shift limitations, and parasitic oscillations.
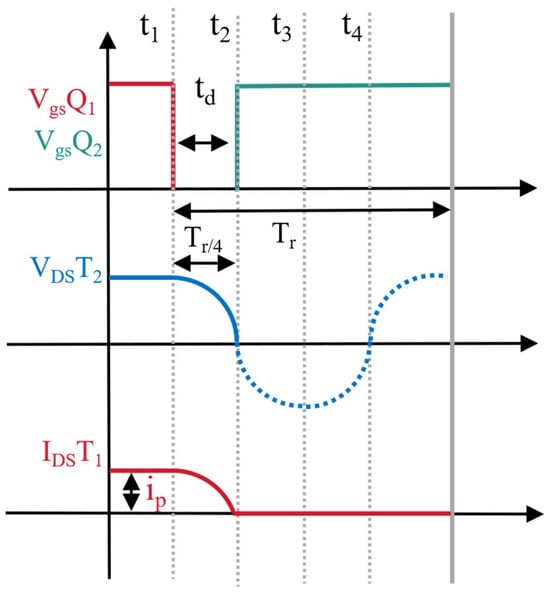
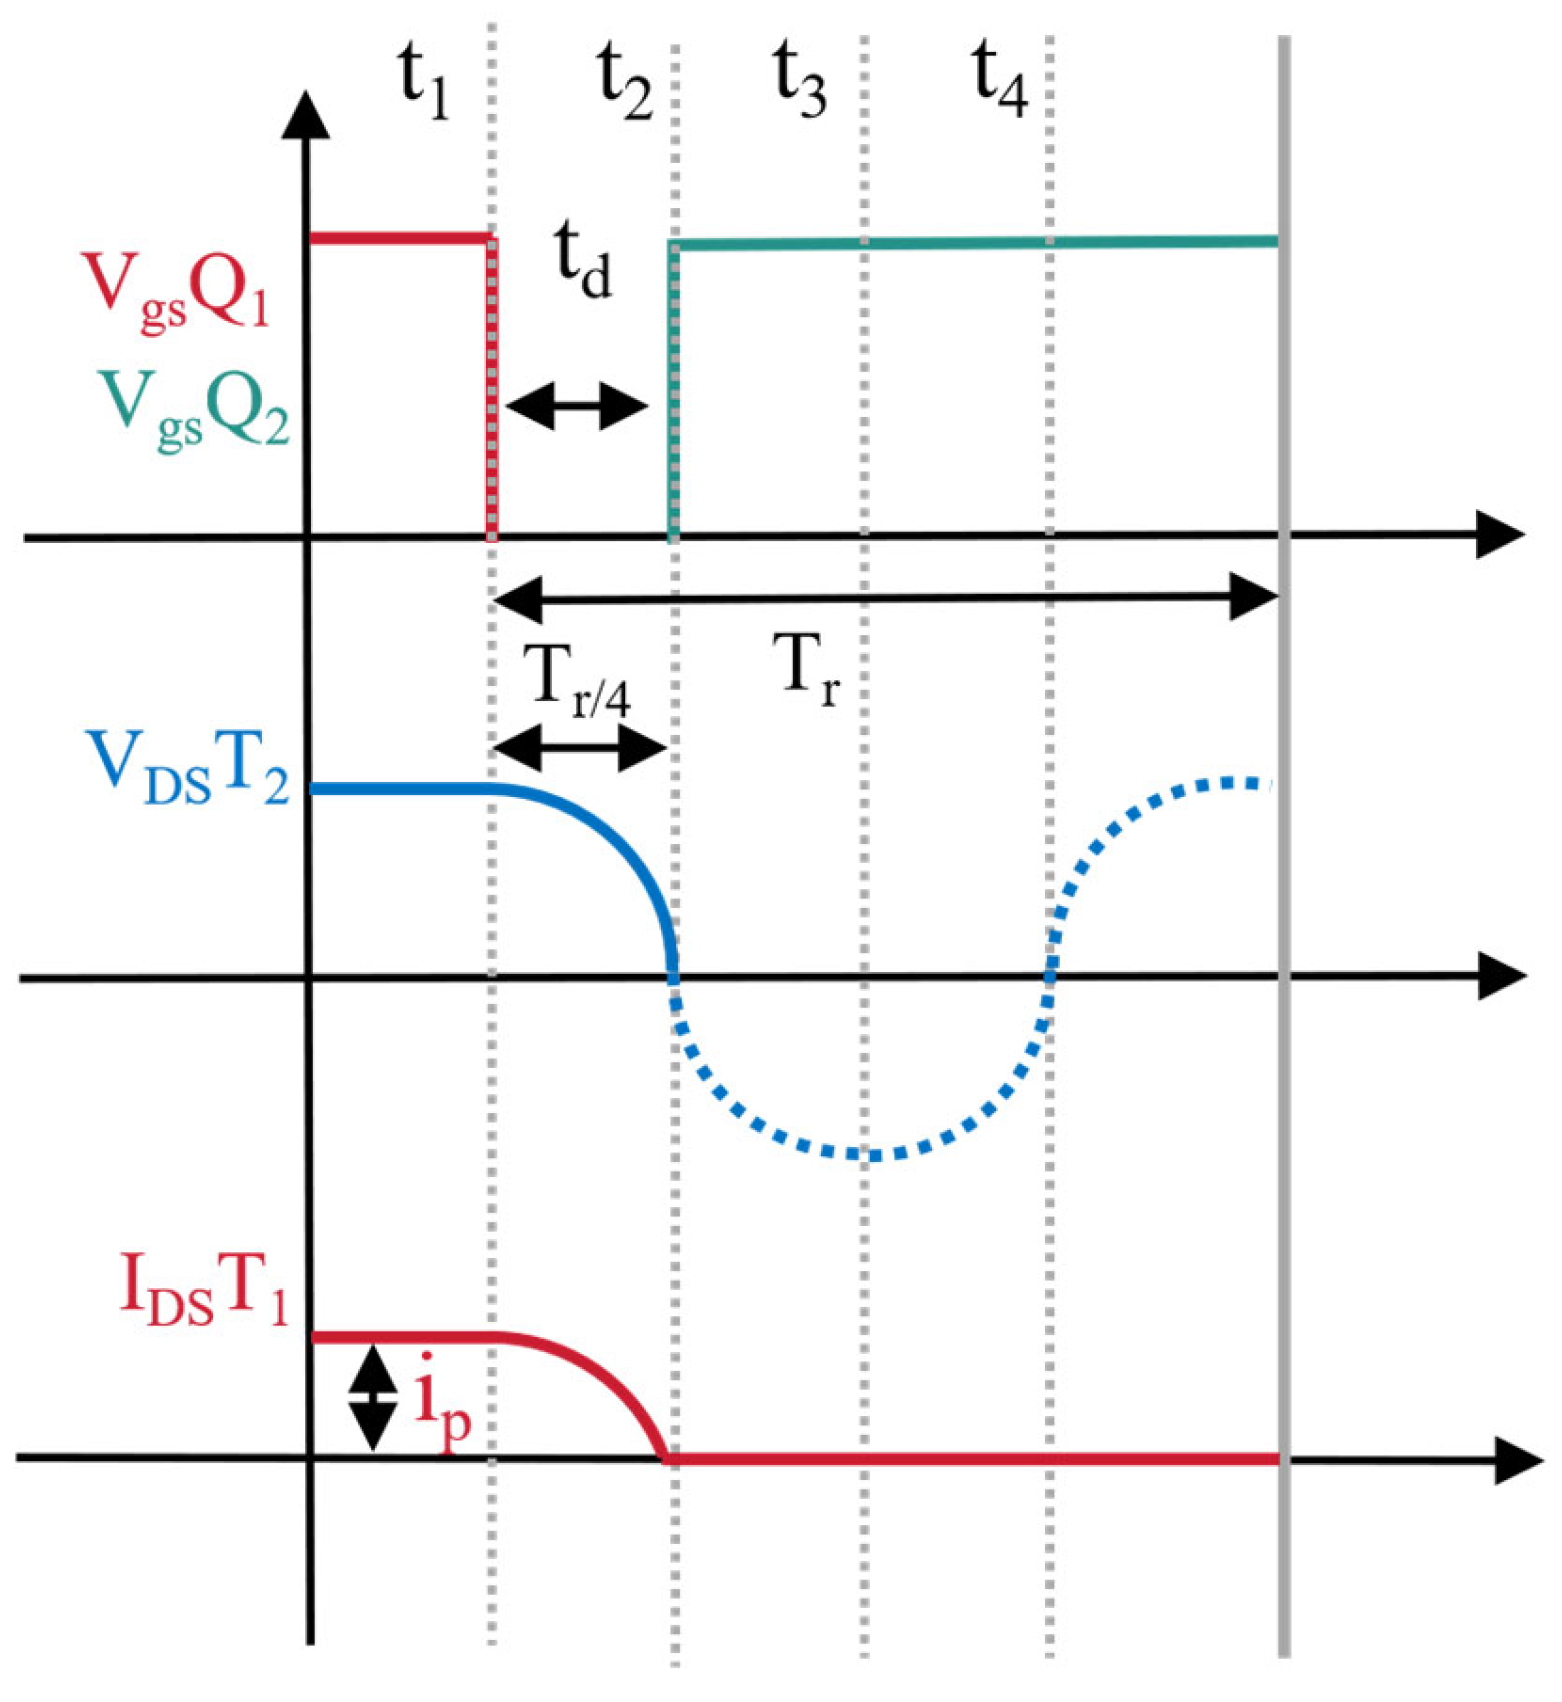
The second method is to ensure a sufficiently long dead time. The capacitive energy and the inductive energy form a resonant tank, causing the voltage across the transistor to decrease in a resonant manner, as shown in Figure 3. When the dead time is shorter than one-quarter of the resonant period Tr, zero-voltage switching (ZVS) cannot be achieved. Extending the dead time can enable ZVS; however, it also leads to an unnecessarily prolonged conduction period of the transistor’s antiparallel diode, resulting in increased losses. Conversely, an excessively long dead time may also cause ZVS failure. Therefore, the optimal dead time should be precisely set at the moment when the voltage falls to zero, which requires accurate alignment with the resonant period of the circuit. Ideally, the gate drive signal should be applied exactly when the drain-source voltage across the switch resonates to zero, achieving perfect zero-voltage turn-on.
Figure 3.
Resonant fall of collector voltage.
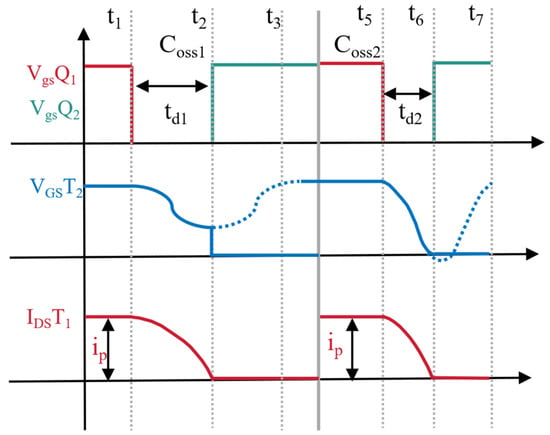
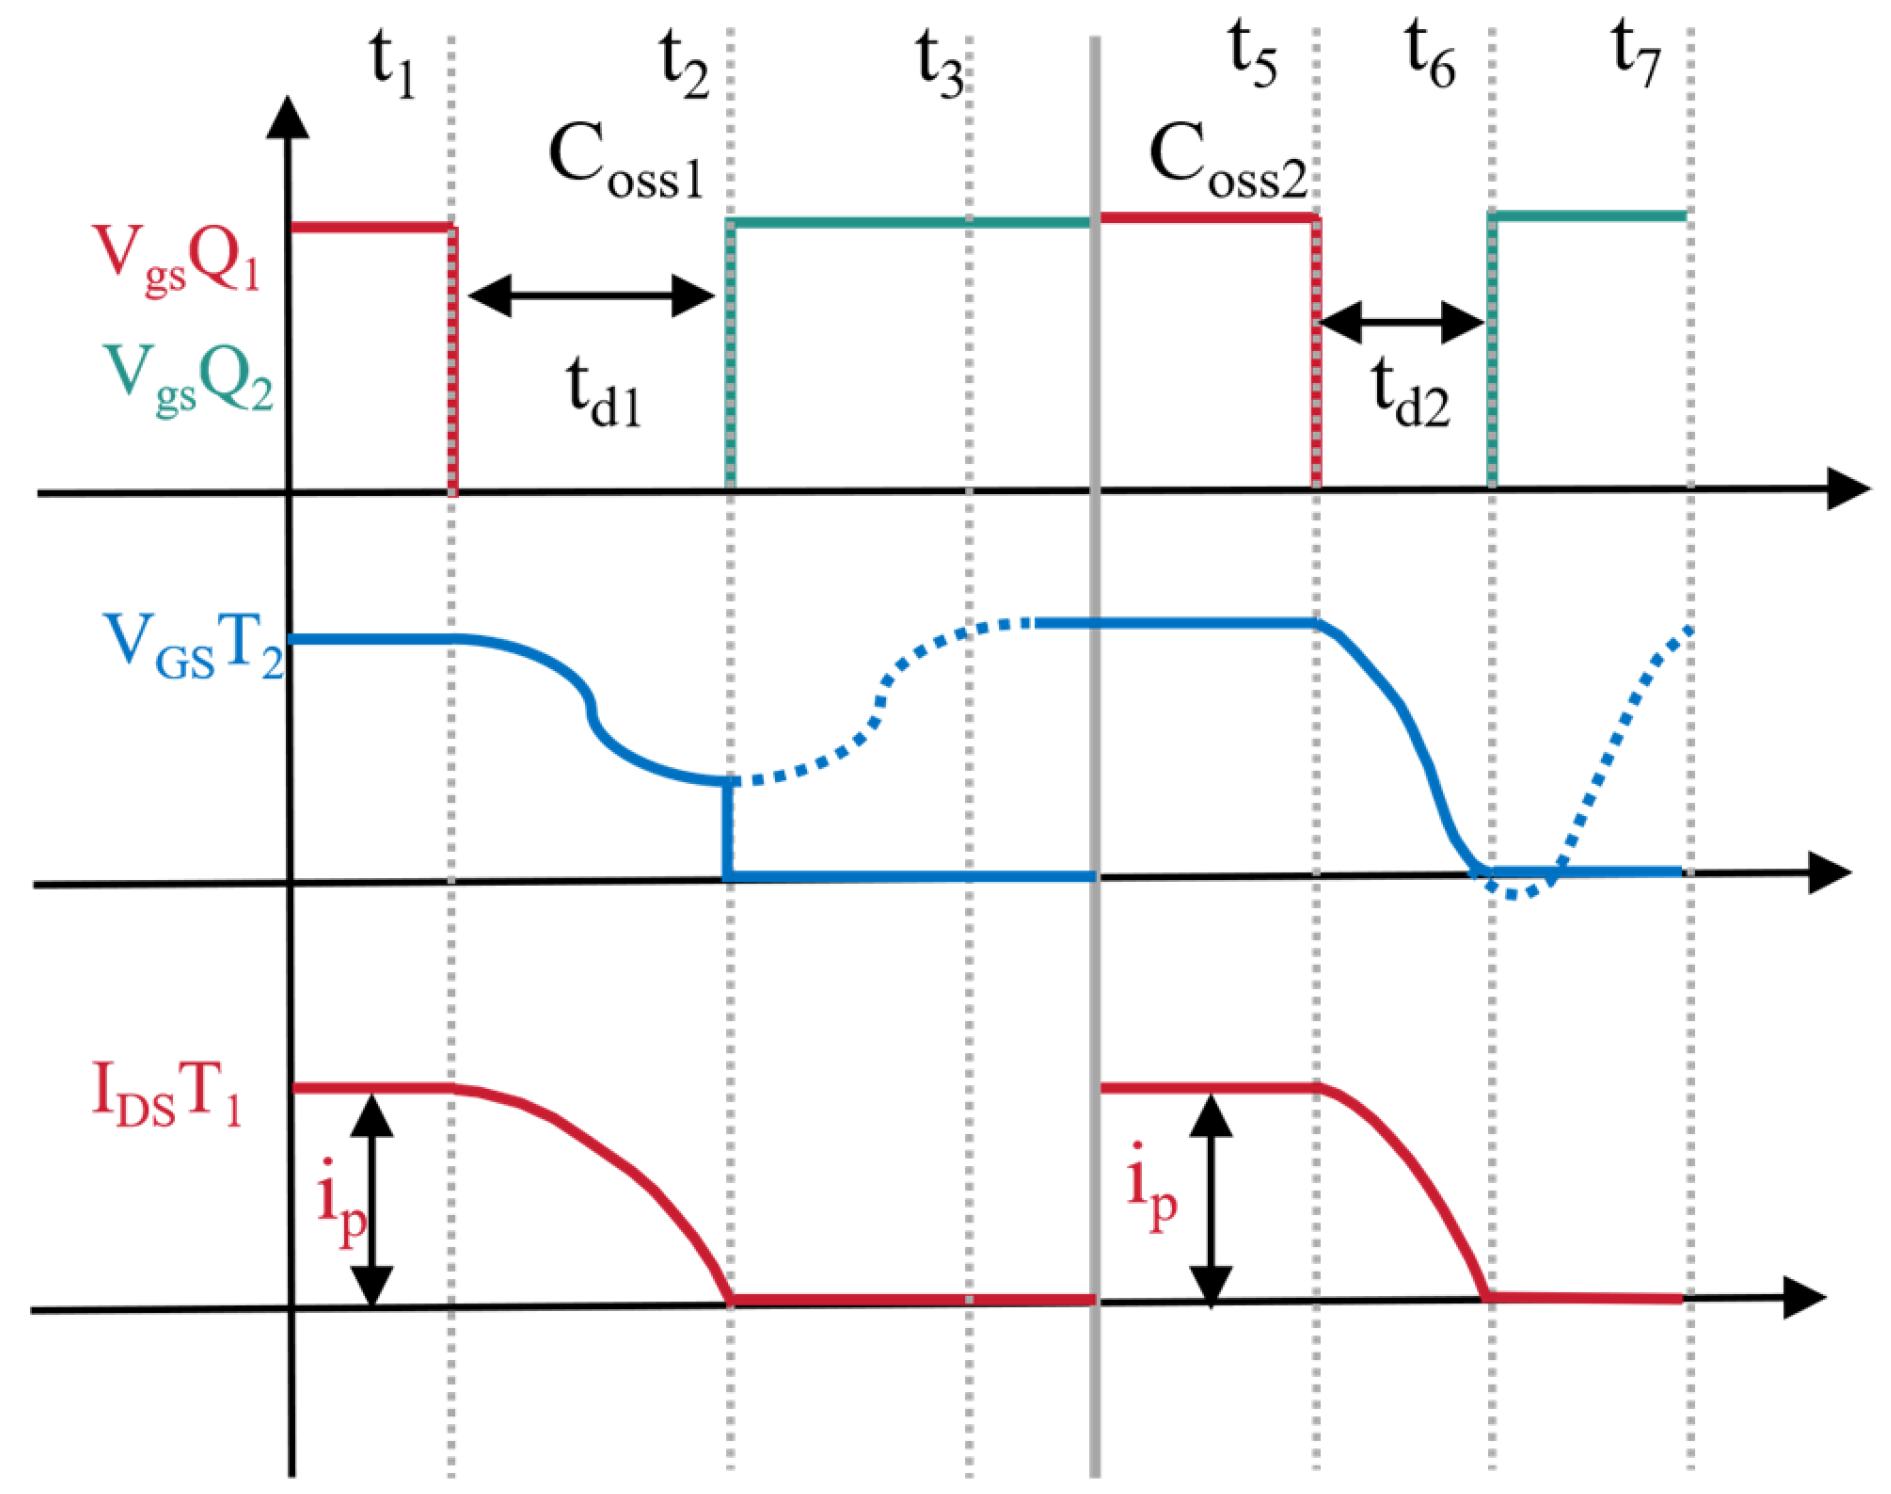
The conclusion indicates that reducing the capacitive energy—that is, minimizing the output capacitance of the transistors—remains highly advantageous. The waveforms in Figure 4 illustrate a comparison of the voltage fall across transistors with different output capacitances (C1 > C2) under constant inductive energy and load conditions. This figure demonstrates that when the output capacitance is large and the inductive energy remains unchanged, zero-voltage switching (ZVS) may fail to be achieved even if the dead time is sufficiently long.
Figure 4.
Schematic diagram of the effect of different output capacitances (C1 > C2) on achieving ZVS.
Based on the foregoing analyses and considering the objective of achieving soft-switching operation and control in high-frequency high-voltage plasma power supplies as pursued in this study, appropriate tuning of key circuit components—such as switching devices and other parameters—is required to address the complex issues encountered in practical applications.
3. System Design of the Dielectric Barrier Discharge Plasma Power Supply Apparatus
Based on the foregoing analysis of the soft-switching implementation mechanism of the phase-shifted full-bridge topology for the plasma power supply, and in consideration of the design objectives for the high-frequency high-voltage plasma power supply pursued in this study, the overall performance specifications of the power supply are determined as listed in Table 1 [24]. This set of specifications provides clear constraints and a theoretical basis for the subsequent selection of key components and the design of the modular system.
Table 1.
Performance specifications of the dielectric barrier discharge plasma system.
3.1. Design of the External Input PFC Power Module
As illustrated in Figure 5, which presents the interconnection schematic between the power factor correction (PFC) module and the drive control board, the proposed plasma power supply is energized from the utility grid at a nominal line voltage of 220 V AC with a frequency of 50 Hz [25,26]. This AC input is first routed to the PFC module, where active power factor correction is performed. The module subsequently outputs a regulated DC bus voltage of 380 V, which serves as the primary power source for the drive control board.
Figure 5.
Schematic diagram of the connection between the PFC module and the drive control board.
The PFC module is designed to meet the following key performance specifications: universal AC input range of 100–240 V, tightly regulated DC output of 380 V with a tolerance of ±2%, near-unity power factor between 0.92 and 0.99 under full-load conditions, high conversion efficiency exceeding 95%, and a rated output power of 3000 W. Based on these requirements, the XN-Q0619E-3000 PFC module, manufactured by Suzhou Xiniu Electronic Technology Co., Ltd. (Suzhou, China), was selected for its proven reliability and compliance with the above parameters.
Internally, the module employs a dedicated control integrated circuit that first rectifies the 220 V AC input into a pulsating DC voltage with a peak value of approximately 310 V. This pulsating voltage is then fed into a Boost converter stage, which steps it up to the target 380 V DC level. Through closed-loop control, the built-in power factor correction algorithm actively shapes the input current waveform to be nearly sinusoidal and in phase with the line voltage, thereby achieving a power factor close to unity. Meanwhile, the output voltage is precisely regulated to maintain a stable 380 V DC supply, ensuring consistent and reliable operation of the downstream power control board under varying load and line conditions.
3.2. Design of the Drive Control Board for the Dielectric Barrier Discharge Plasma Power Supply
The drive control system of the proposed plasma power supply employs an integrated architecture. The drive circuit utilizes the M57962AL chip, manufactured by Mitsubishi.(Tokyo, Japan), which features high-speed optocoupler isolation and desaturation protection with a propagation delay of only 1 µs. For current and voltage sampling, CHB-1000S and CHV-25P Hall-effect sensors, manufactured by Beijing SENSOR Electronic Co., Ltd. (Beijing, China) are employed, respectively, enabling high-precision non-contact measurement. The main control unit is based on the STM32F334C8T6 microcontroller, manufactured by STMicroelectronics. (Geneva, Switzerland), which leverages its high-resolution timer to achieve digital closed-loop control [27]. Additionally, a hardware-software cooperative overcurrent and overvoltage protection mechanism is implemented to ensure dynamic response and operational safety of the system. The power switching devices used in the full-bridge inverter are SiC MOSFETs (model IV2Q12030T4Z, manufactured by InventChip Technology Co., Ltd. (Shanghai, China)). The key parameters of this device are: drain-source breakdown voltage V = 1200 V, continuous drain current I = 79 A at TC = 25 °C. The device was selected for its low on-resistance, fast switching speed, and high-temperature capability, which are essential for high-frequency high-voltage plasma power supply applications.
3.3. Design of High-Frequency Transformer
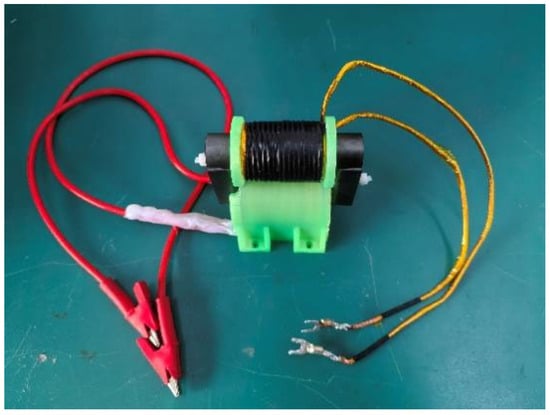
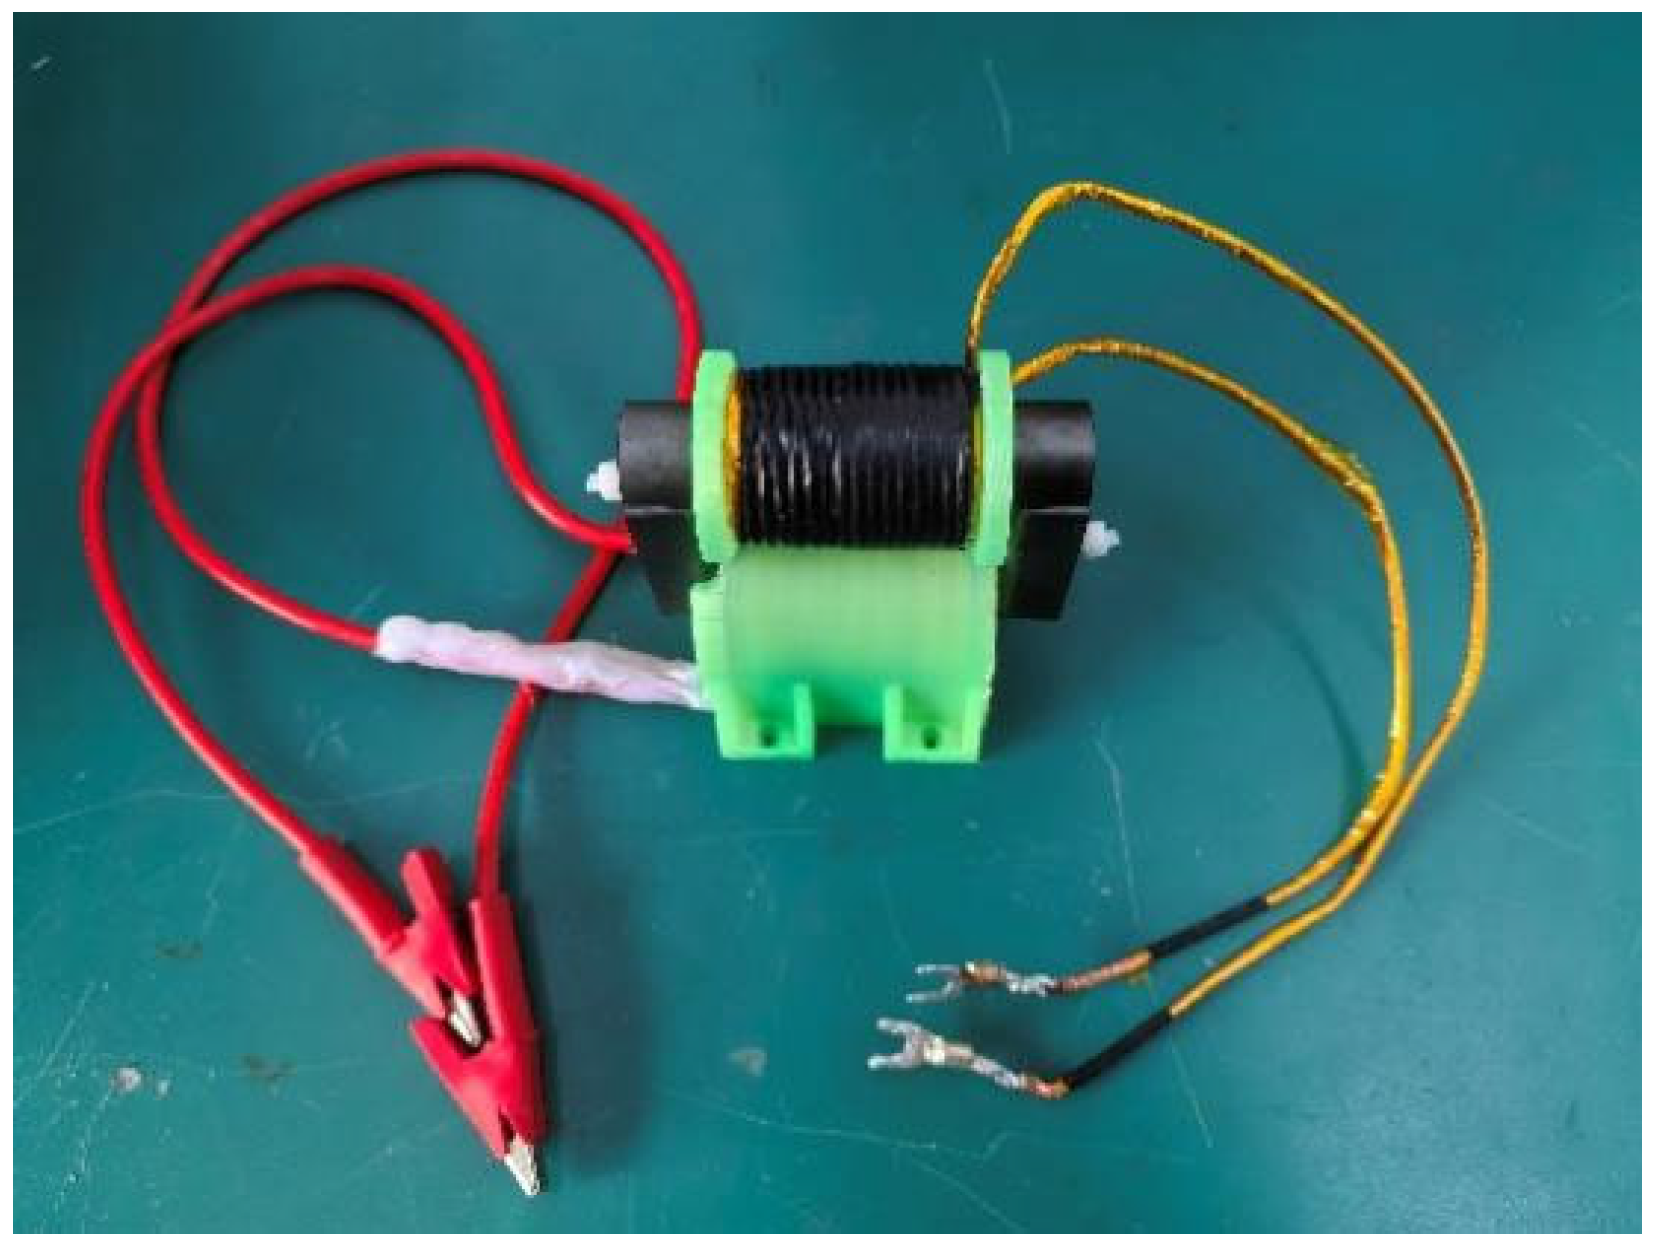
Figure 6 presents the physical design of the high-frequency transformer, whose overall dimensions are 81.8 mm × 94.1 mm. The secondary output winding is constructed using stranded wire (Litz wire) with a total cross-sectional area of 3.14 mm2. This configuration effectively mitigates skin and proximity effects at high operating frequencies, thereby significantly reducing AC copper losses. The outer insulation of the winding is composed of a high-temperature-resistant film that can reliably withstand continuous exposure to temperatures up to 180 °C, ensuring long-term dielectric integrity and thermal stability under the severe electrical and thermal stresses inherent in high-voltage, high-frequency operation [28].
Figure 6.
Physical structure of high-frequency transformer.
To achieve high magnetic coupling efficiency while minimizing core losses, an amorphous alloy material is chosen as the transformer core. Owing to its high permeability, low coercivity, and exceptionally low high-frequency core loss, this material is particularly well-suited for high-power, high-frequency energy conversion applications. Furthermore, to satisfy the air breakdown voltage requirements and to provide an adequate safety margin, the primary winding is designed with 34 turns, while the secondary winding consists of 800 turns, yielding a turns ratio of *n* = 800:34 (approximately 23.5:1). This design ensures that the required high voltage can be stably generated at the secondary side from the nominal primary DC bus voltage, thereby enabling reliable excitation of the dielectric barrier discharge load under practical operating conditions.
3.4. Load Design of the Dielectric Barrier Discharge Plasma Power Supply Apparatus
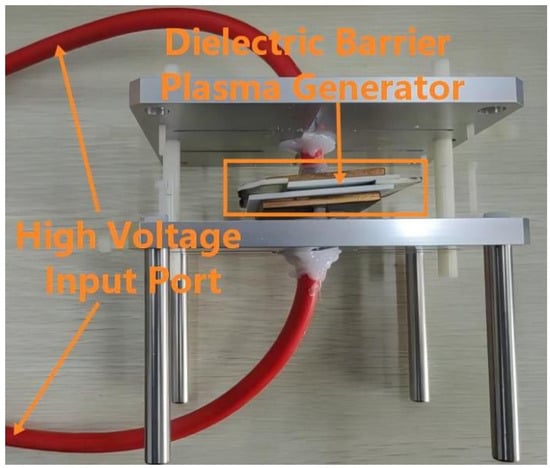
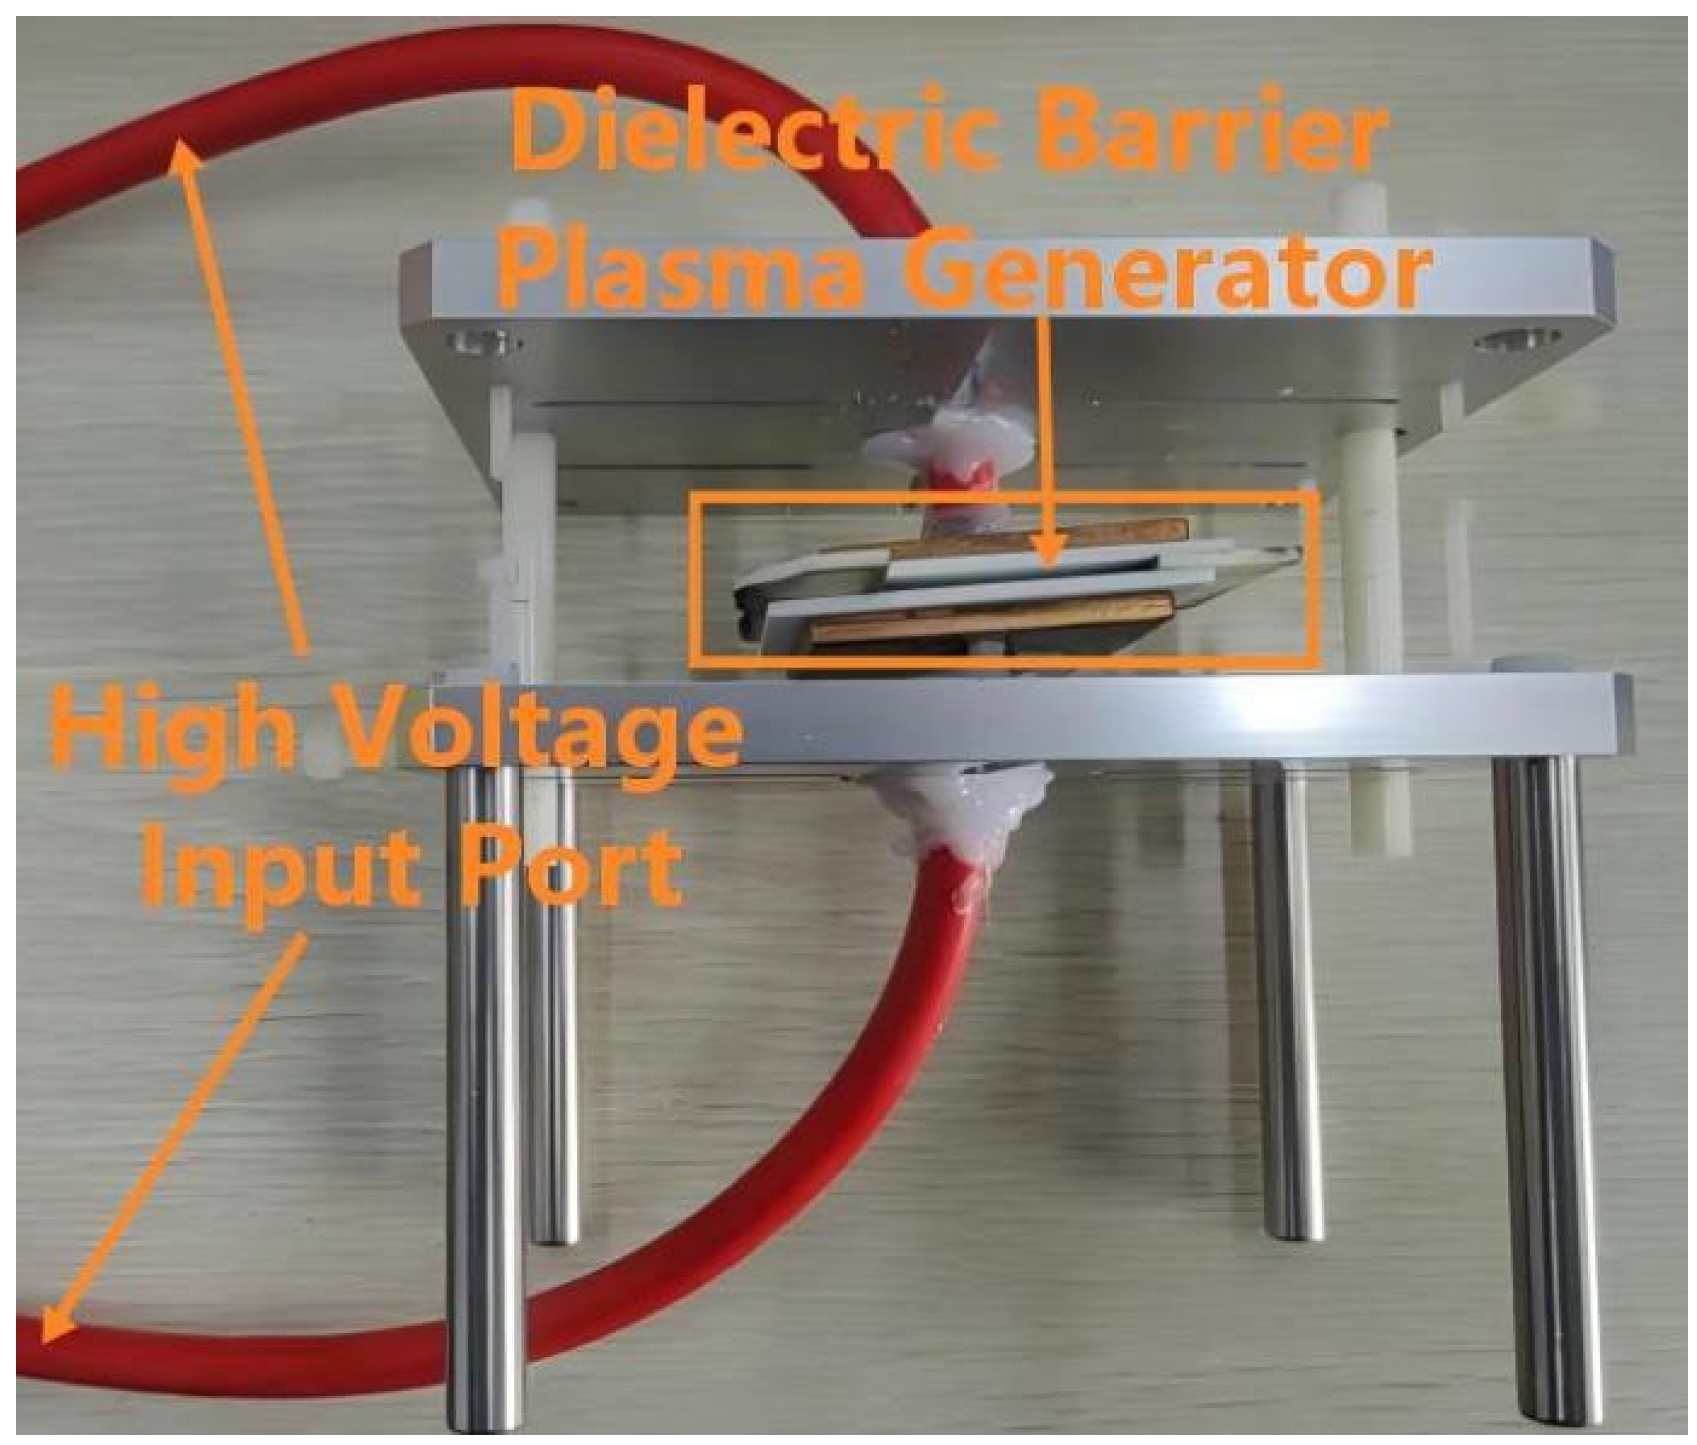
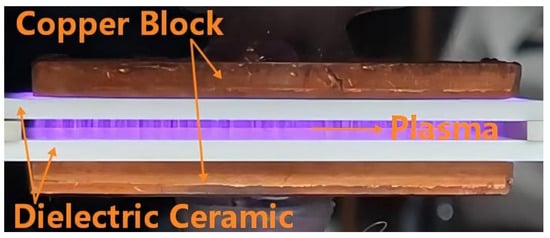
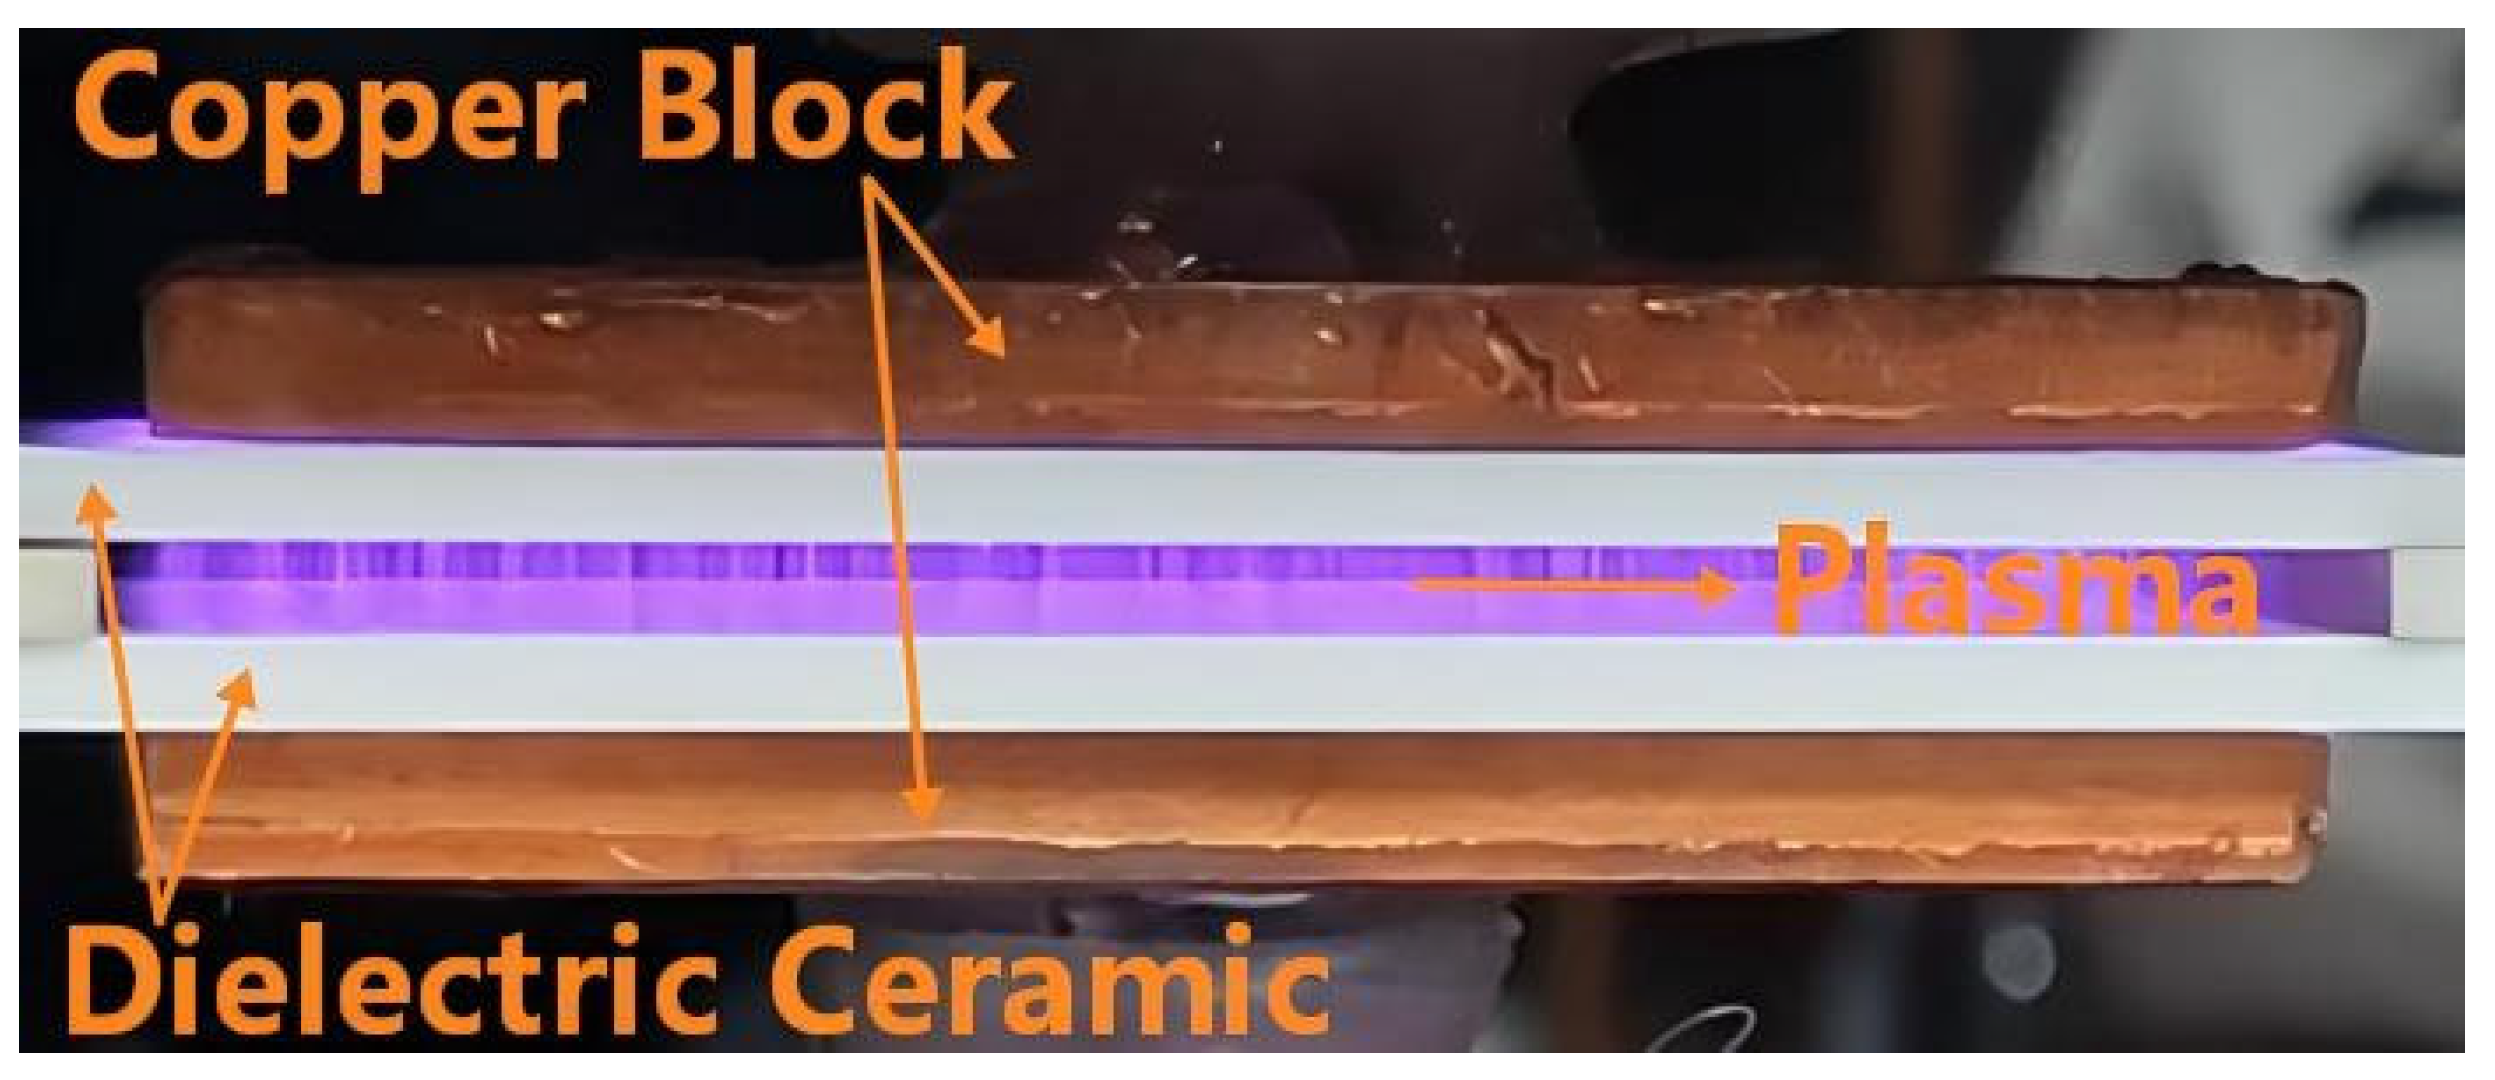
Figure 7 shows the dielectric barrier discharge plasma generator. The dimensions of the upper and lower dielectric ceramic plates are 60 mm × 60 mm × 2 mm, the copper plates are 50 mm × 50 mm × 4 mm, and the air gap between the upper and lower copper plates is 2 mm [29].
Figure 7.
Dielectric barrier discharge plasma generator.
4. Design of ZVS Control Strategy for Dielectric Barrier Discharge Plasma Power Supply
4.1. Design of PLECS Simulation Model Based on ZVS Control Strategy
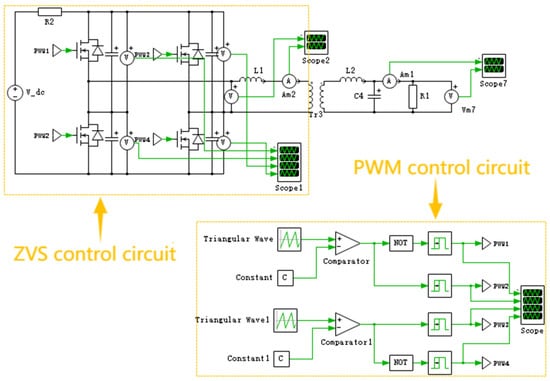
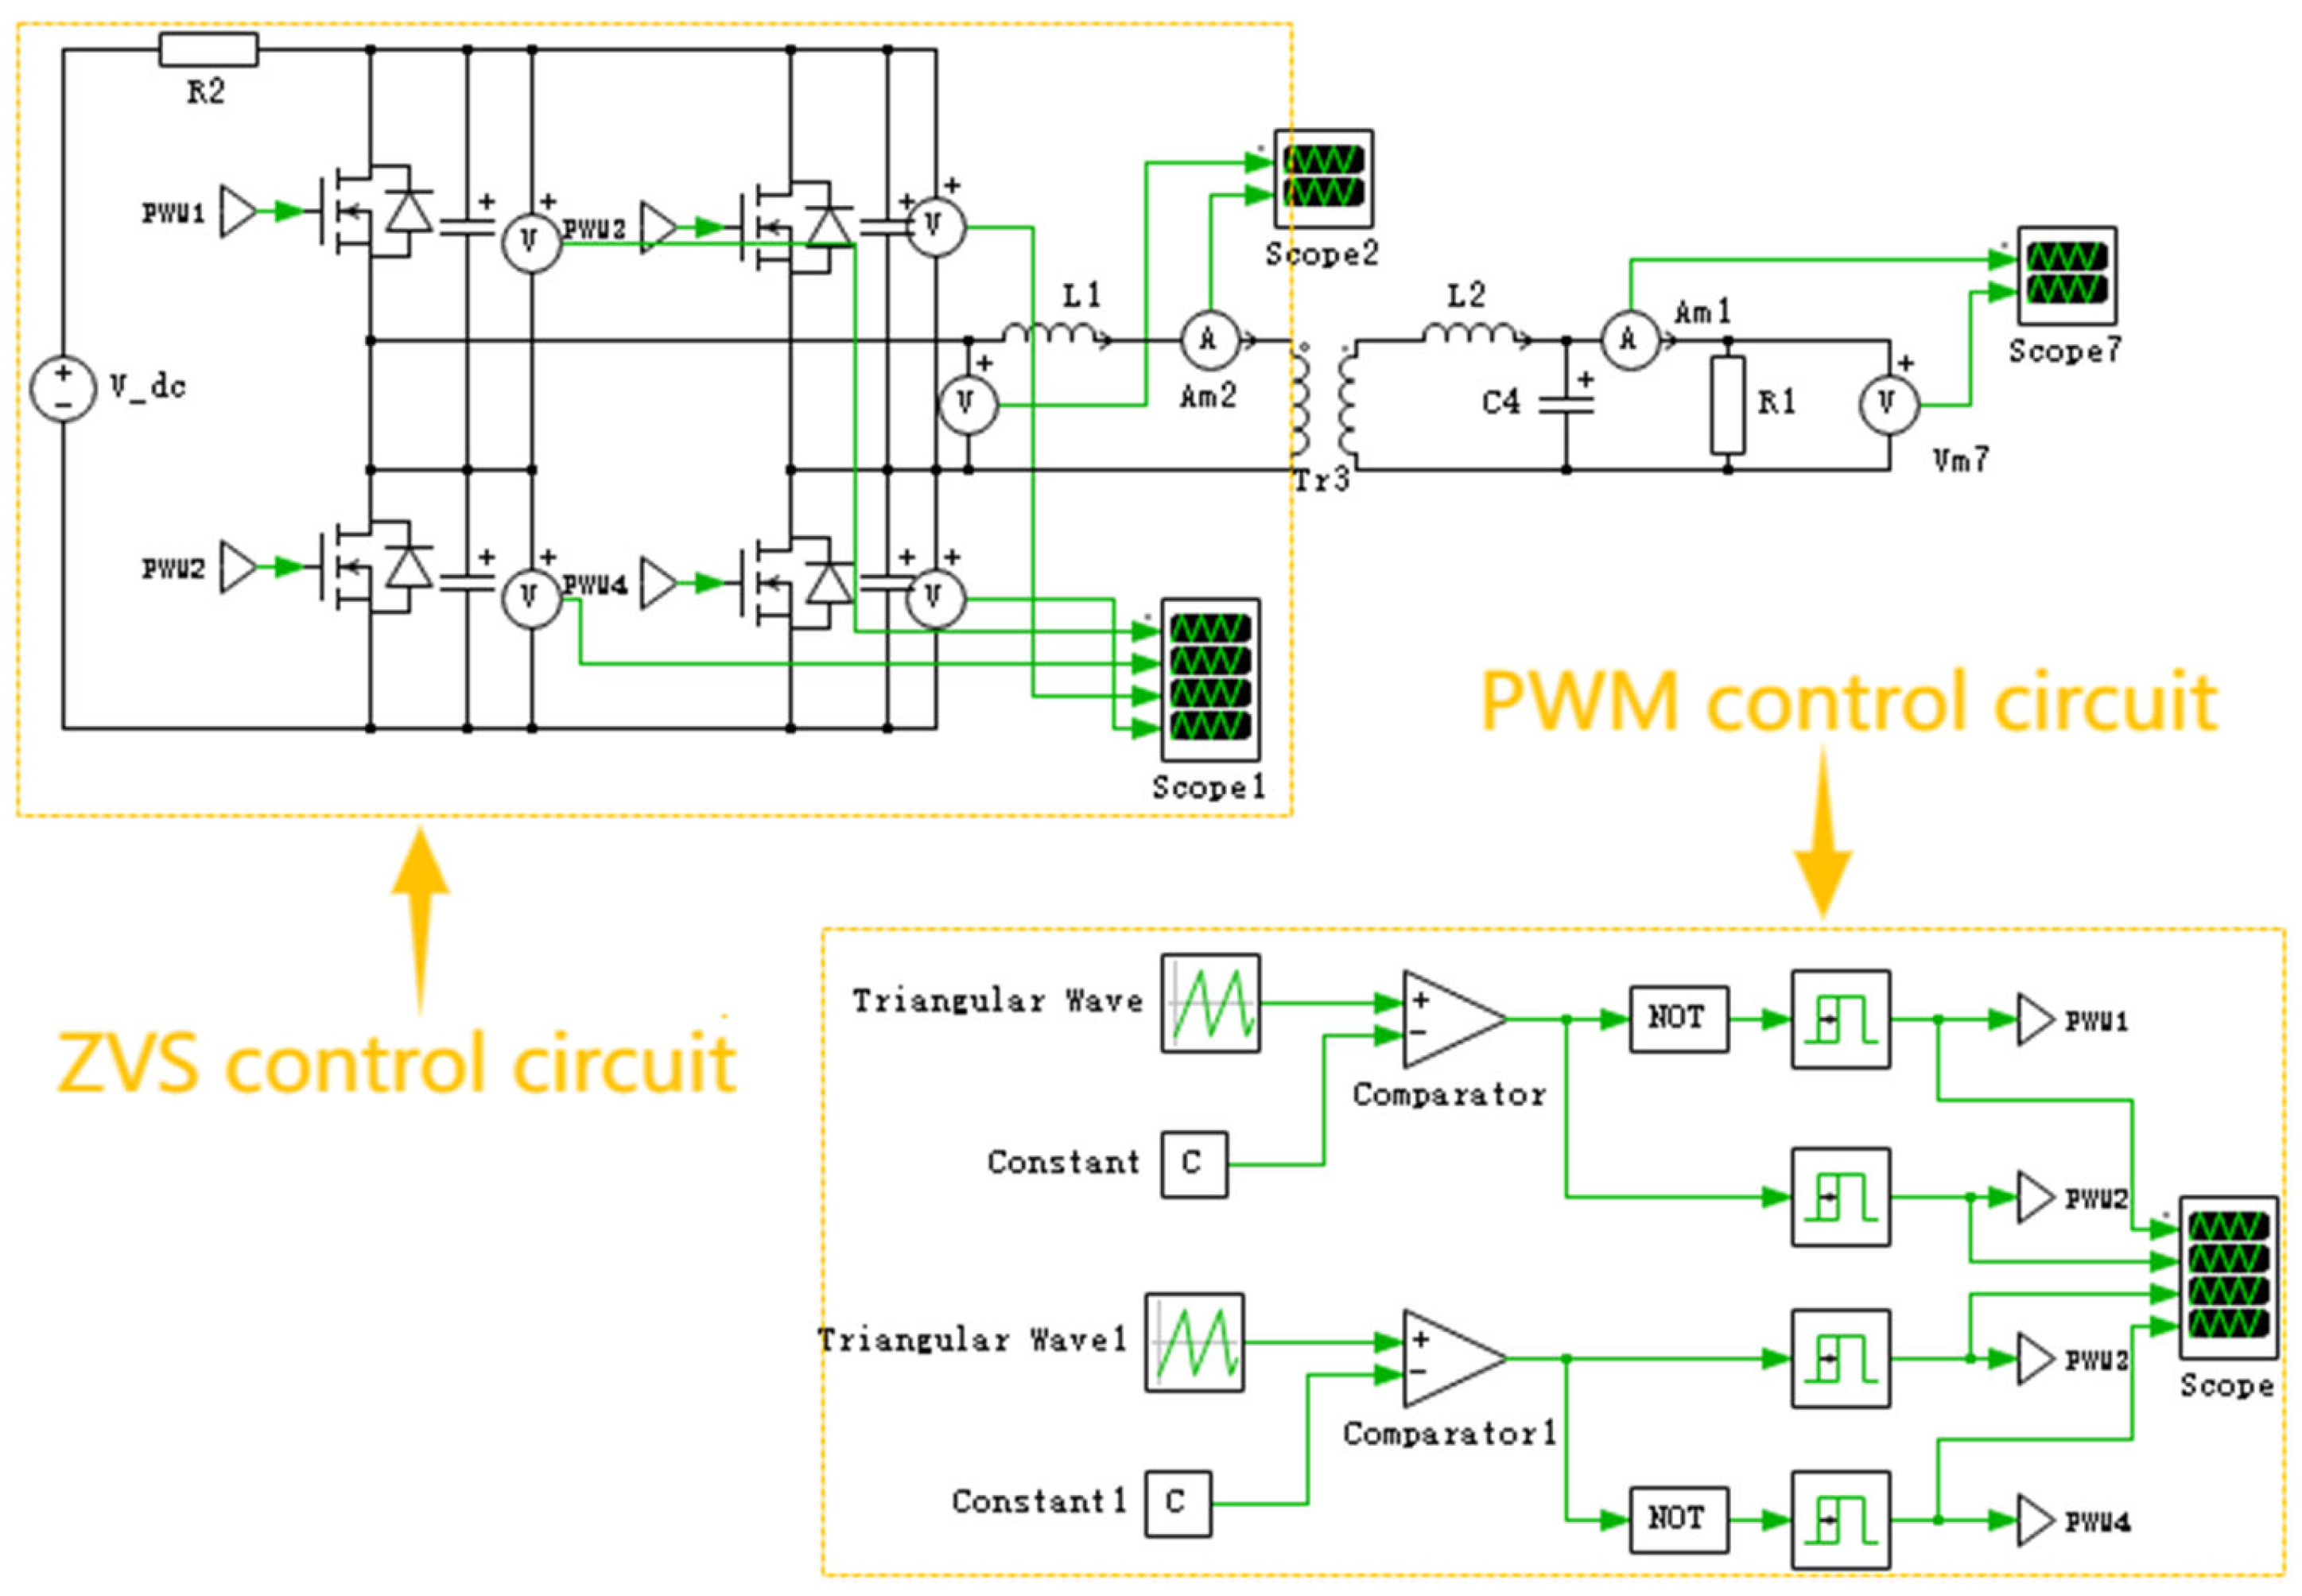
According to the design scheme described above, a PLECS simulation model based on the ZVS control strategy is constructed, as shown in Figure 8. The simulation model mainly consists of the following parts: First, the 220 V single-phase AC power is converted into a smooth DC voltage through a PFC rectifier bridge and filter capacitor [30,31]. This 380 V DC voltage is then input to a full-bridge inverter circuit composed of four SiC switching devices, where high-frequency inversion is achieved through phase-shift control, outputting a high-frequency AC square wave. Subsequently, the energy is coupled to the secondary side via a high-frequency transformer, producing an AC output, thereby completing the full power conversion process [32]. It is important to acknowledge that the simulation model employs a simplified resistive-capacitive load (10 Ω resistor with 30 μF capacitance) to represent the DBD plasma reactor. This simplification is adopted to enable systematic parameter optimization and to isolate the fundamental effects of the control parameters on ZVS operation. It should be noted that the current simulation model employs an open-loop control scheme, which is adopted to isolate and systematically analyze the effects of individual parameters on ZVS operation. Closed-loop control, while offering improved regulation and adaptability, would introduce additional complexity that could obscure the fundamental relationships between the parameters and ZVS performance. Nevertheless, closed-loop operation is a direction for future work, and the parameter optimization results obtained from this study provide a solid foundation for the design of closed-loop controllers.
Figure 8.
PLECS simulation model based on ZVS control strategy.
Two PWM driving waveforms with a fixed phase-shift angle are directly generated using a signal generator in the simulation software, and are used to control the switching devices in the two legs of the full-bridge circuit, respectively. The driving signals maintain a constant duty cycle (set to 0.5) and a constant phase-shift angle, which determine the amount of power transferred. After being processed by a rectifier diode and an LC filter at the output stage, a DC voltage is supplied to the load.
Since the system adopts an open-loop control scheme, the output voltage and current signals are used only for observation and recording, and are not fed back to the input side for dynamic regulation. The operating state of the switching devices is determined solely by the preset driving signals and is not affected by load fluctuations or input voltage variations.
The simulation parameters are as follows: bus input voltage 380 V, dead time 2 μs, junction capacitance 2.3 nF, operating frequency 15 kHz, load resistance 10 Ω, load capacitance 30 μF, and the duty cycle of the driving signals fixed at 0.5. The phase-shift angle is adjusted within the range of 0° to 180° to vary the output voltage, and simulation tests are conducted accordingly.
4.2. Optimization Methodology for Key Control Parameters
The optimal design parameters—duty cycle, phase difference, resonant inductance, and dead time—are determined through a systematic and iterative simulation-based optimization approach. The methodology proceeds as follows:
Step 1: Establish baseline parameters based on theoretical calculations. The initial values are derived from the circuit equations presented in Section 2, ensuring that the inductive energy condition for ZVS is satisfied.
Step 2: Perform individual parameter sweeps. Each parameter is varied while keeping others fixed at their baseline values. The ranges explored are: duty cycle (0.3–0.6), phase difference (45–135°), resonant inductance (100–400 μH), and dead time (0.5–3 μs).
Step 3: Evaluate waveform quality and ZVS performance. The criteria for optimal selection include: (a) absence of distortion in drive signal waveforms, (b) clean output voltage and current waveforms without ringing or flat steps, (c) successful ZVS turn-on with drain-source voltage reduced to near zero, and (d) acceptable duty cycle loss within design tolerance.
Step 4: Validate the optimal combination. The selected parameter set (duty cycle = 0.5, phase difference = 90°, resonant inductance = 300 μH, dead time = 2 μs) is validated through multiple simulation runs and subsequently verified experimentally.
The optimal design parameters are determined through a systematic simulation-based optimization approach. The quantitative criteria used for evaluating waveform quality and ZVS performance are defined as follows:
- (a)
- Overshoot: The peak voltage or current exceeding the steady-state value during switching transients. Acceptable limit: <10% of steady-state value.
- (b)
- Ringing amplitude: The peak-to-peak amplitude of high-frequency oscillations observed after switching. Acceptable limit: <5% of the nominal signal amplitude.
- (c)
- ZVS margin: The residual drain-source voltage at the turn-on instant. ZVS is considered achieved when < 5% of the nominal bus voltage (i.e., <19 V for a 380 V bus).
- (d)
- Output voltage ripple: The peak-to-peak variation in the output voltage. Acceptable limit: <2% of nominal output voltage.
- (e)
- Total Harmonic Distortion (THD): Measured for the primary voltage waveform. Acceptable limit: <5%.
4.3. Analysis of the Effect of Duty Cycle on Drive Signals
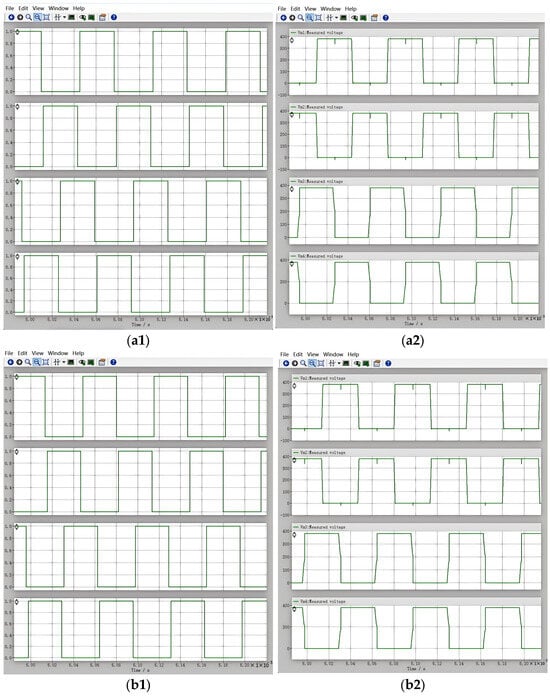
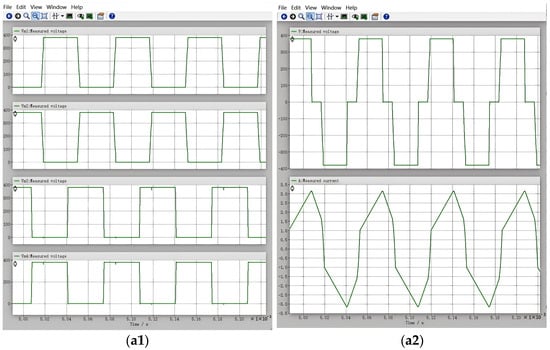
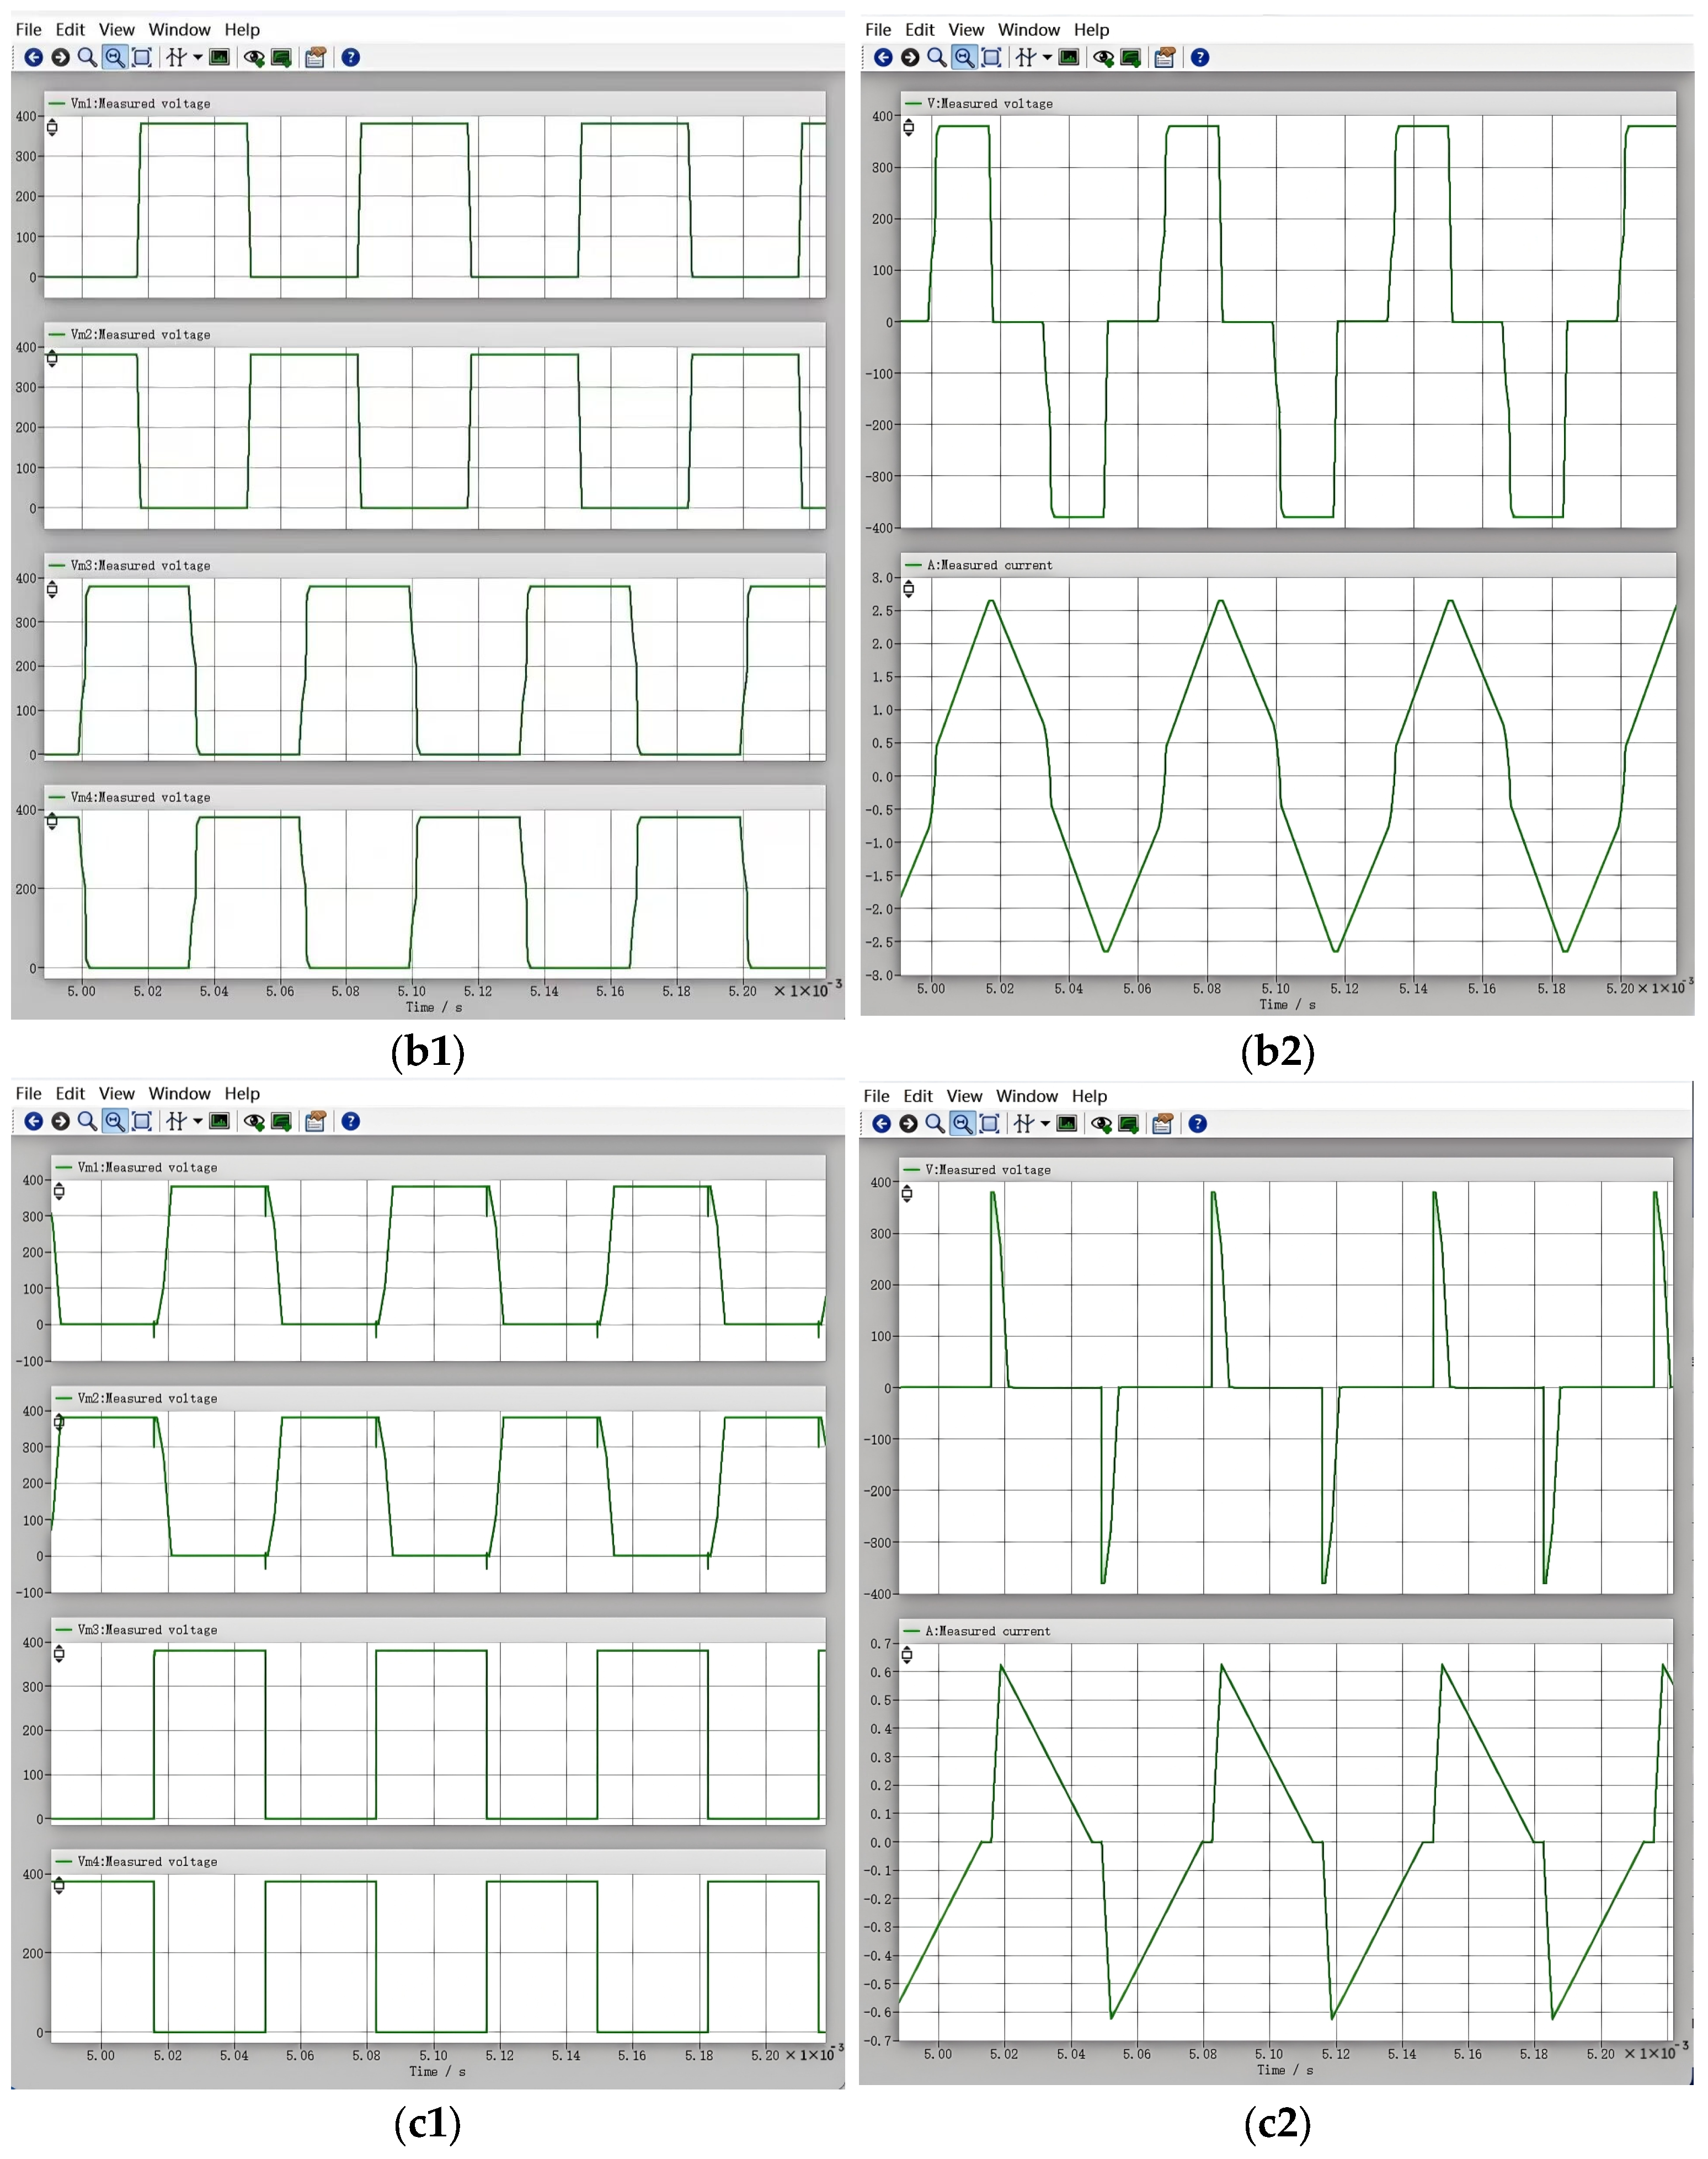
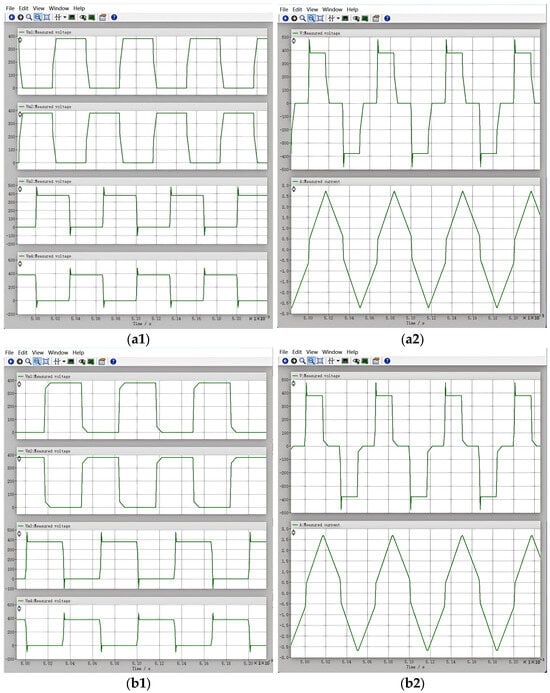
In phase-shift-controlled ZVS control, with other parameters fixed, the duty cycle of the drive signals is varied to 0.3, 0.4, 0.5, and 0.6, and the resulting MOS drive signal waveforms are presented.
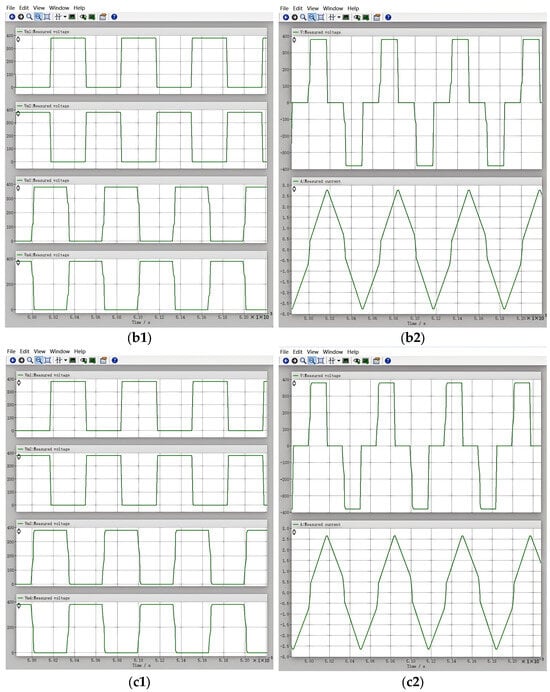
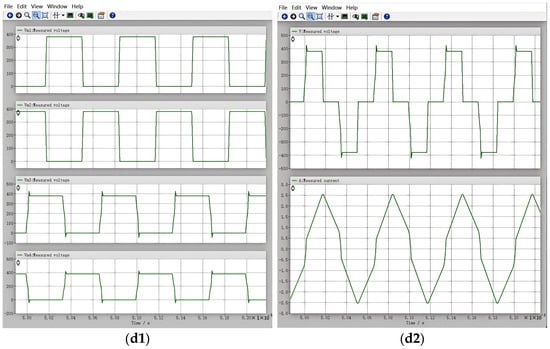
It can be observed from Figure 9(c2) that when the duty cycle is 0.5, the drive signal waveform exhibits no distortion. A duty cycle of 0.5 ensures that the on-time equals the off-time for all four switching devices. Only on this symmetrical basis can the width of the voltage waveform obtained across the transformer primary be linearly varied by simply shifting the drive signals of the lagging leg, thereby enabling precise control of the energy transferred to the secondary side.
Figure 9.
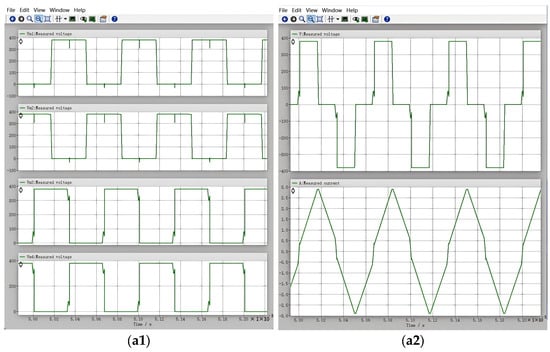
Voltage Waveforms of the four MOSFETs under different duty cycles: (a1) MOSFET drive signal waveform at a duty cycle of 0.3; (a2) Voltage waveforms of the four MOSFETs. (b1) MOSFET drive signal waveform at a duty cycle of 0.4; (b2) Voltage waveforms of the four MOSFETs; (c1) MOSFET drive signal waveform at a duty cycle of 0.5; (c2) Voltage waveforms of the four MOSFETs. (d1) MOSFET drive signal waveform at a duty cycle of 0.6; (d2) Voltage waveforms of the four MOSFETs.
From Figure 9(a2,b2,d2), it can be seen that when the duty cycle deviates from 0.5, the switching timing of the devices does not match the energy reset period of the resonant inductor, resulting in a failure to achieve zero-voltage switching (ZVS). Under such non-ZVS conditions, when a switching device turns on, a residual voltage remains across its drain and source terminals, causing the junction capacitance to discharge through the switch at the turn-on instant, which generates a large current spike. This spike current is coupled into the gate drive loop through the Miller capacitance (Cgd), superimposing a high-frequency oscillation (ringing) or spike onto the drive waveform and causing distortion.
4.4. Analysis of the Effect of Phase Difference on Output Current Signal
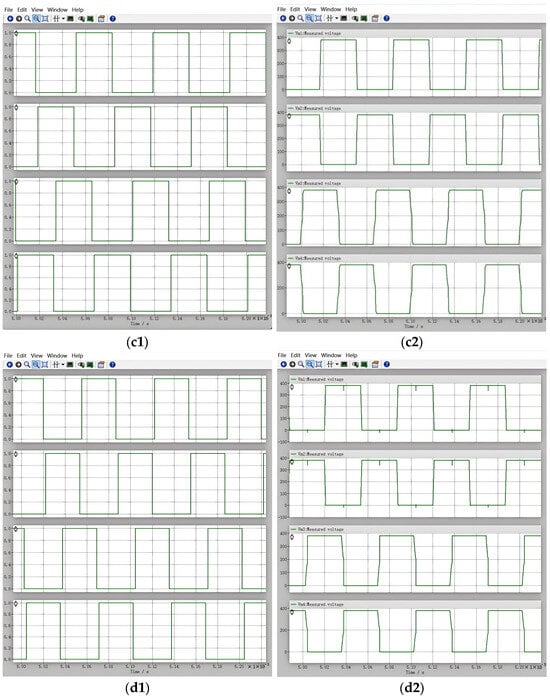
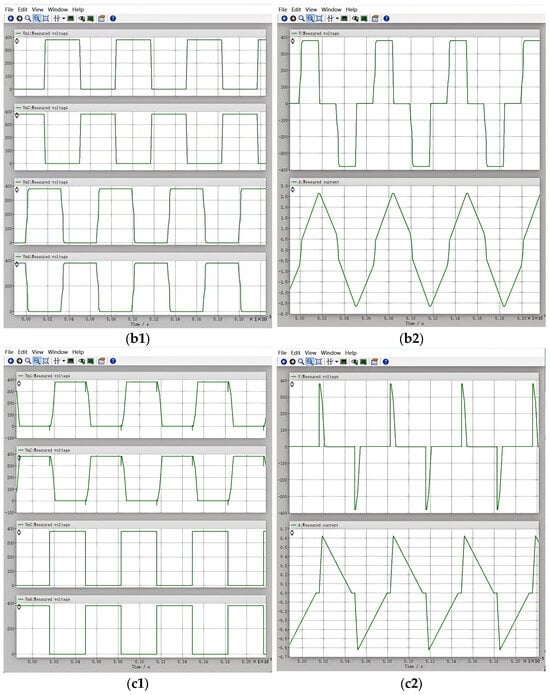
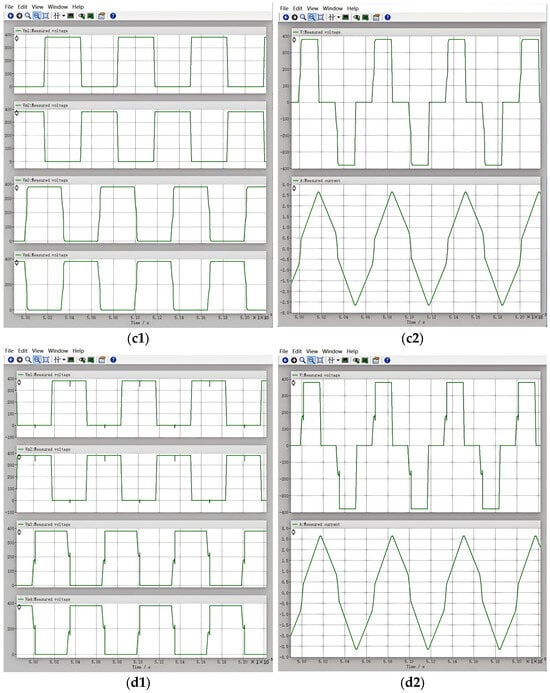
In phase-shift-controlled ZVS control, the duty cycle of the drive signals for the four switching devices is typically fixed, and the pulse width of the transformer primary voltage is varied by adjusting the phase difference (i.e., the phase-shift angle) between the drive signals of the diagonal switches, thereby regulating the output voltage. With other parameters fixed, the output voltage and current signals are obtained by adjusting the phase difference to 45°, 90°, 135°, and 150°.
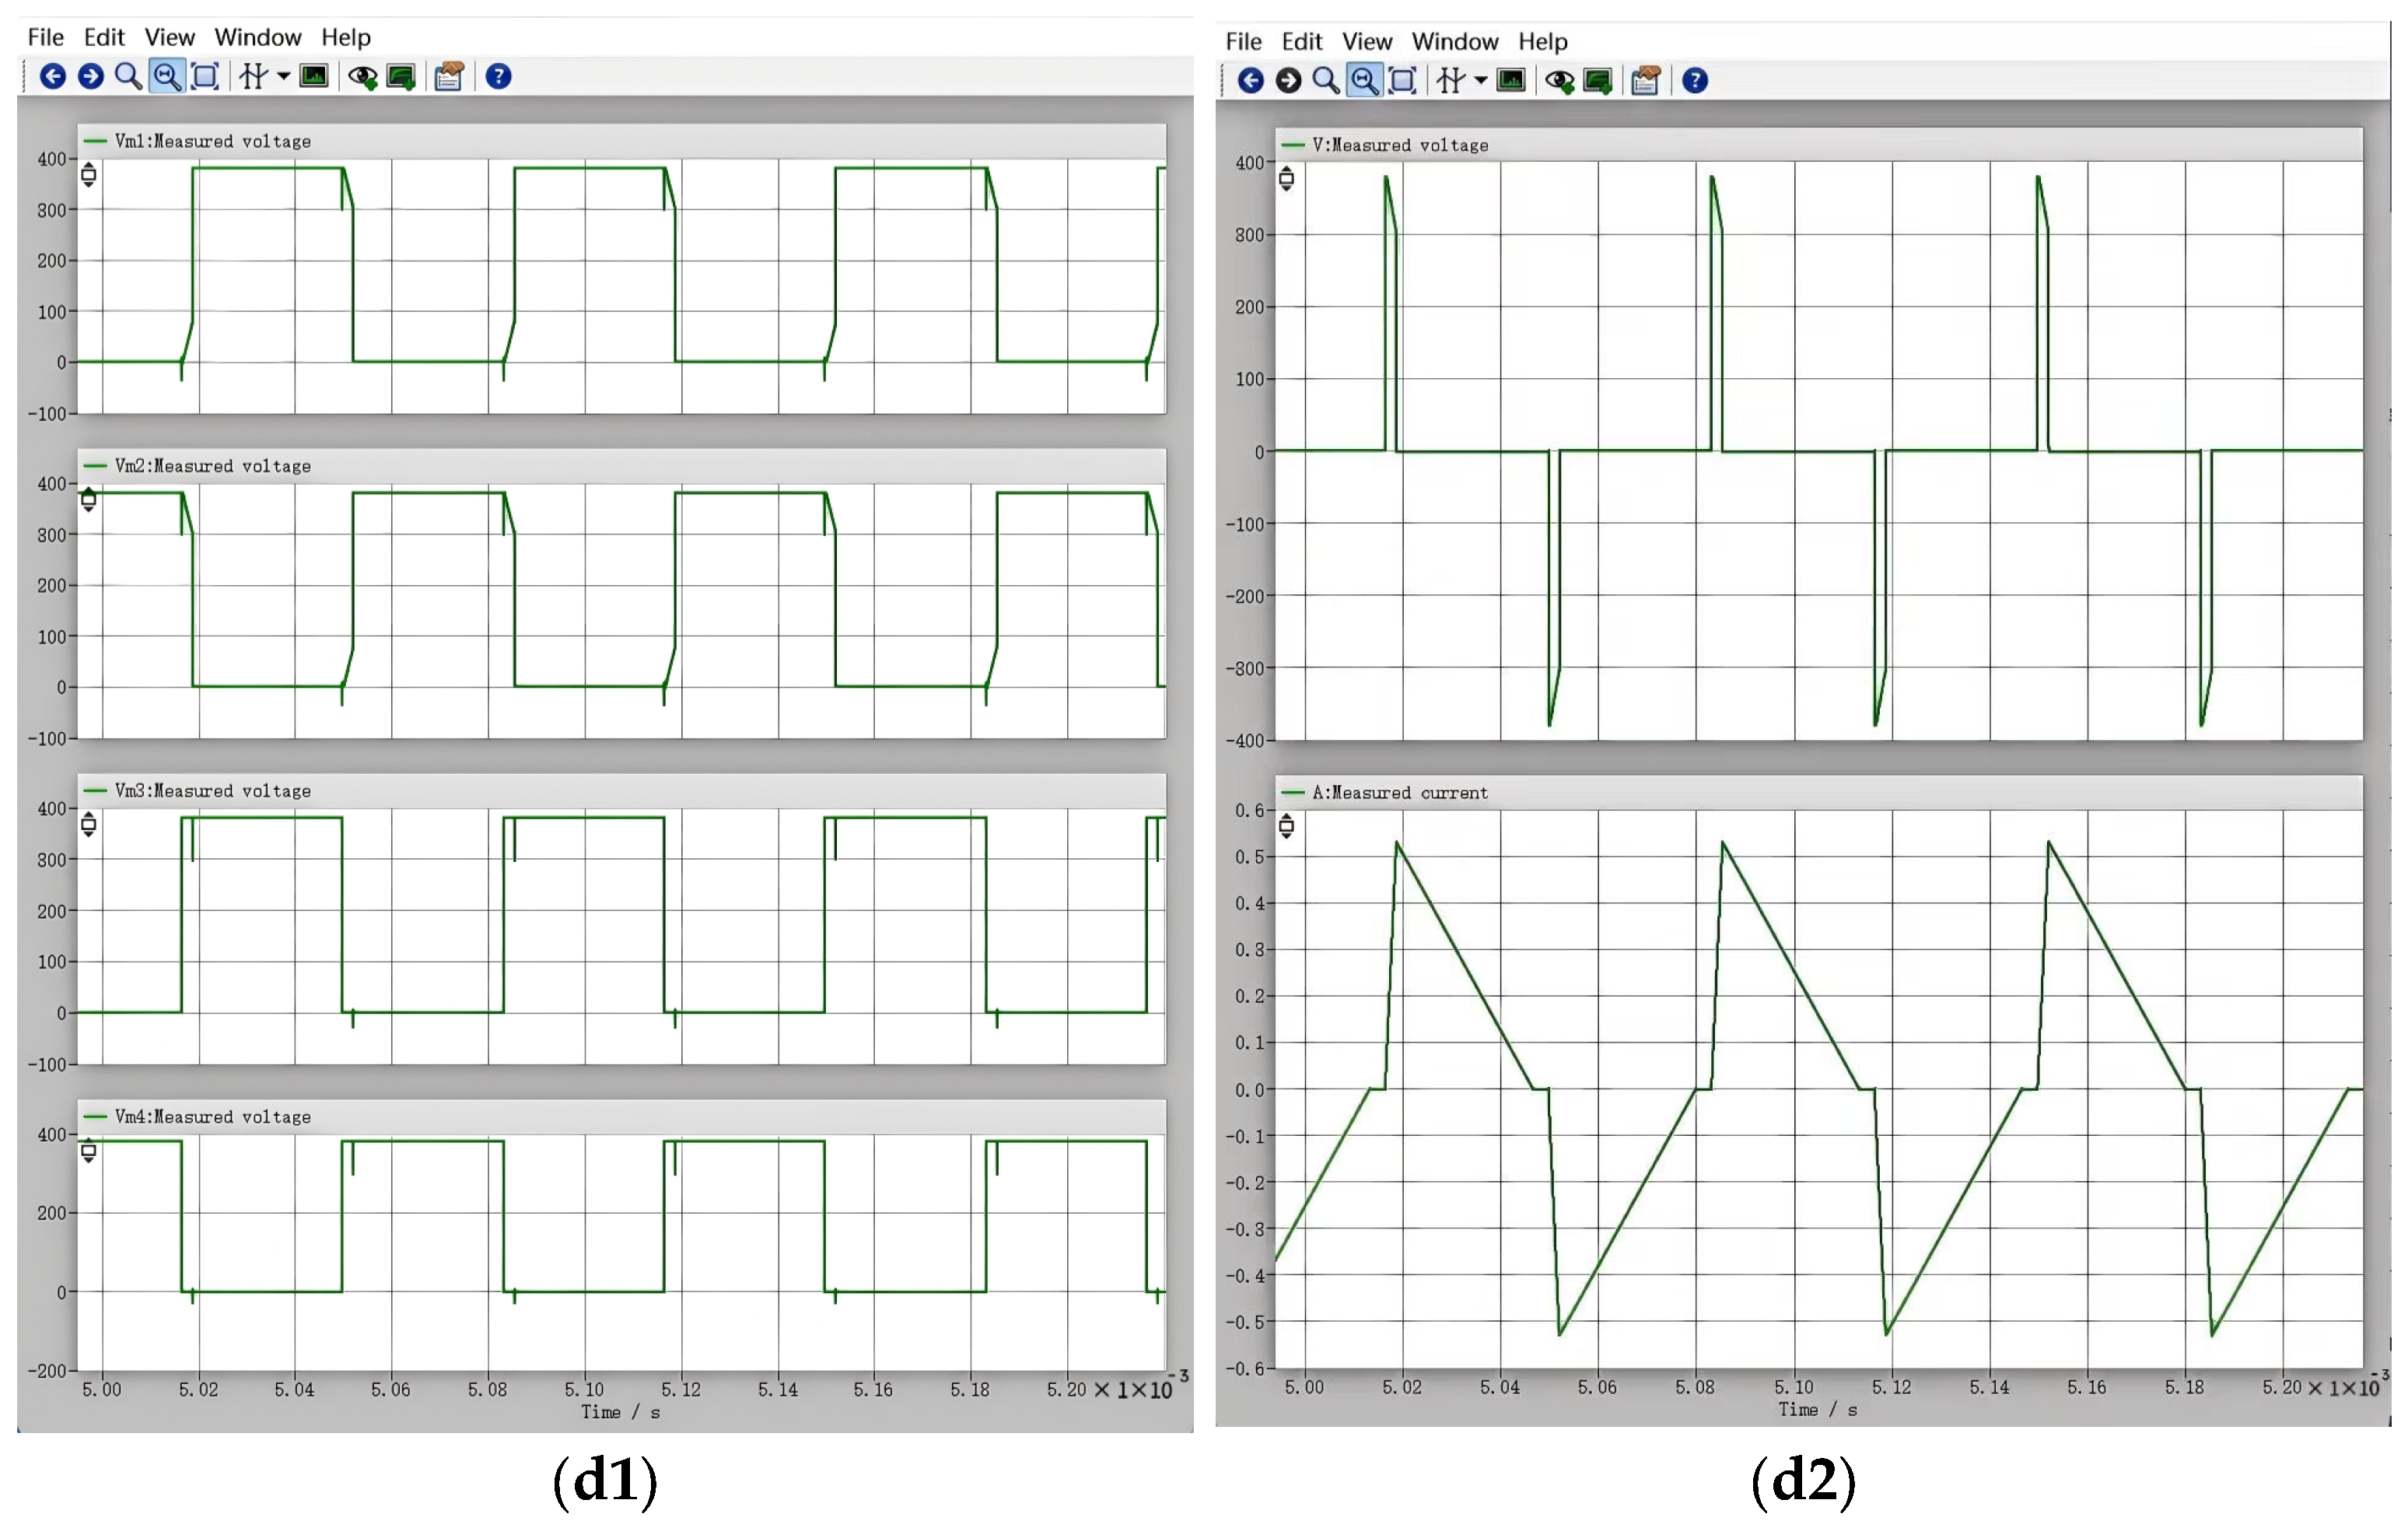
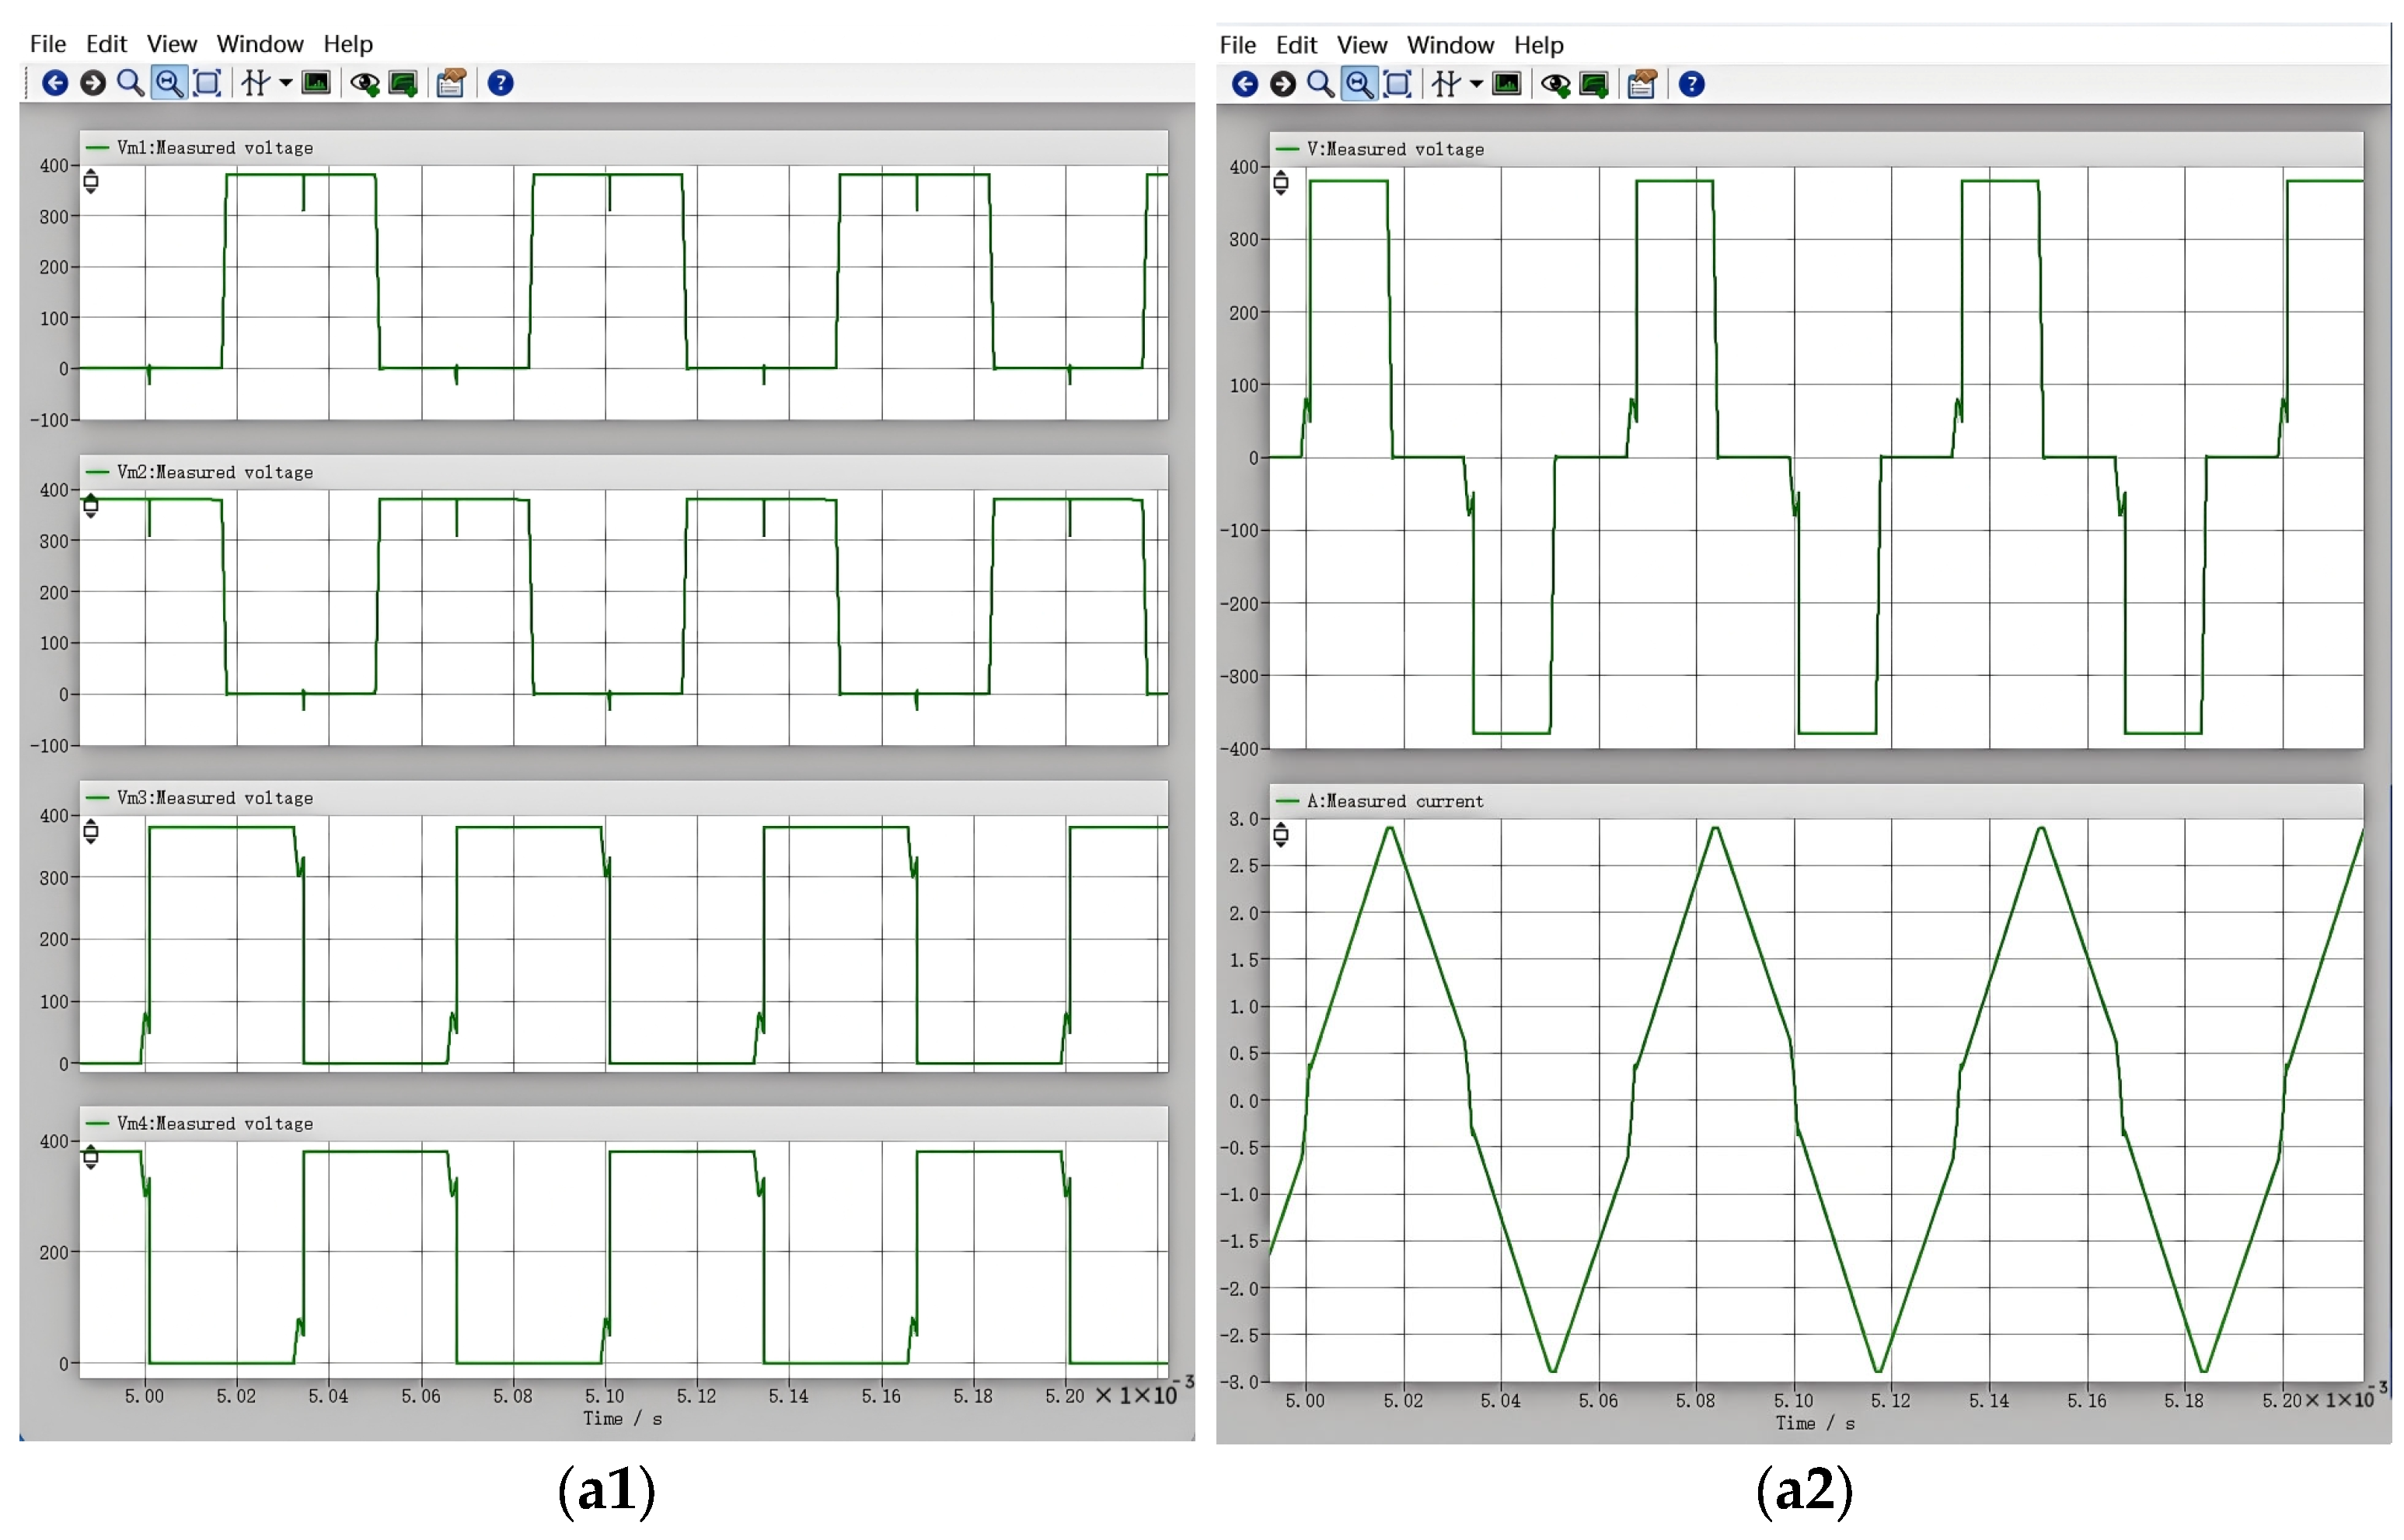
As shown in Figure 10(b2), when the phase difference is 90°, the output current signal waveform exhibits no distortion. When the phase-shift angle φ is 90°, it means that within one complete switching cycle (360°), the transformer primary side experiences positive and negative voltages for 90° + 90° = 180° each (excluding dead time). Under this condition, the primary voltage of the transformer is a symmetric AC square wave with a duty cycle of 50%. Under such symmetric excitation, the primary current waveform is also completely symmetric in the positive and negative half-cycles. The rising and falling slopes of the current are consistent, and the zero-crossing points are clear and smooth. Under this waveform, the current change rate di/dt is linear, without any abnormal abrupt points.
Figure 10.
Output voltage and current waveforms for different phase differences: (a1) Voltage waveforms of the four MOSFETs at a phase difference of 45°; (a2) Output voltage and current waveforms. (b1) Voltage waveforms of the four MOSFETs at a phase difference of 90°; (b2)Output voltage and current waveforms. (c1) Voltage waveforms of the four MOSFETs at a phase difference of 135°; (c2) Output voltage and current waveforms. (d1) Voltage waveforms of the four MOSFETs at a phase difference of 150°; (d2) Output voltage and current waveforms.
As can be seen from Figure 10(a1,c3,d4), the use of an inappropriate phase difference leads to waveform distortion.
The smaller the phase angle (approaching 0°), the higher the output voltage, which corresponds to a lighter load (assuming constant output voltage). Under light-load conditions, the energy stored in the secondary-side output inductor is very low, causing the inductor current to drop to zero during the latter half of the switching cycle, thereby driving the circuit into discontinuous conduction mode (DCM) [33]. In DCM, the secondary-side rectifier diodes turn off at the current zero-crossing instant. At this moment, the parasitic capacitances on the secondary side (including the junction capacitances of the rectifier diodes and the winding capacitance of the transformer) begin to resonate with the primary-side resonant inductor (Lr) [34,35]. This resonance is coupled to the secondary side through the transformer, superimposing a high-frequency sinusoidal oscillation onto the output current waveform and resulting in waveform distortion.
The larger the phase angle (approaching 180°), the lower the output voltage, which corresponds to a heavy load and leads to duty cycle loss. When the phase angle reaches 150°, the effective on-time becomes very short, and the proportion of duty cycle loss is very large. The primary-side current requires a longer time to complete commutation [36]. During this commutation interval, all secondary-side rectifier diodes are conducting, the transformer secondary is short-circuited, and the output voltage becomes zero. Reflected in the output current waveform, a flat step (i.e., a period with no current change) appears where the current would otherwise rise or fall linearly, resulting in waveform distortion.
4.5. Analysis of the Effect of Resonant Inductance on Output Voltage Signal
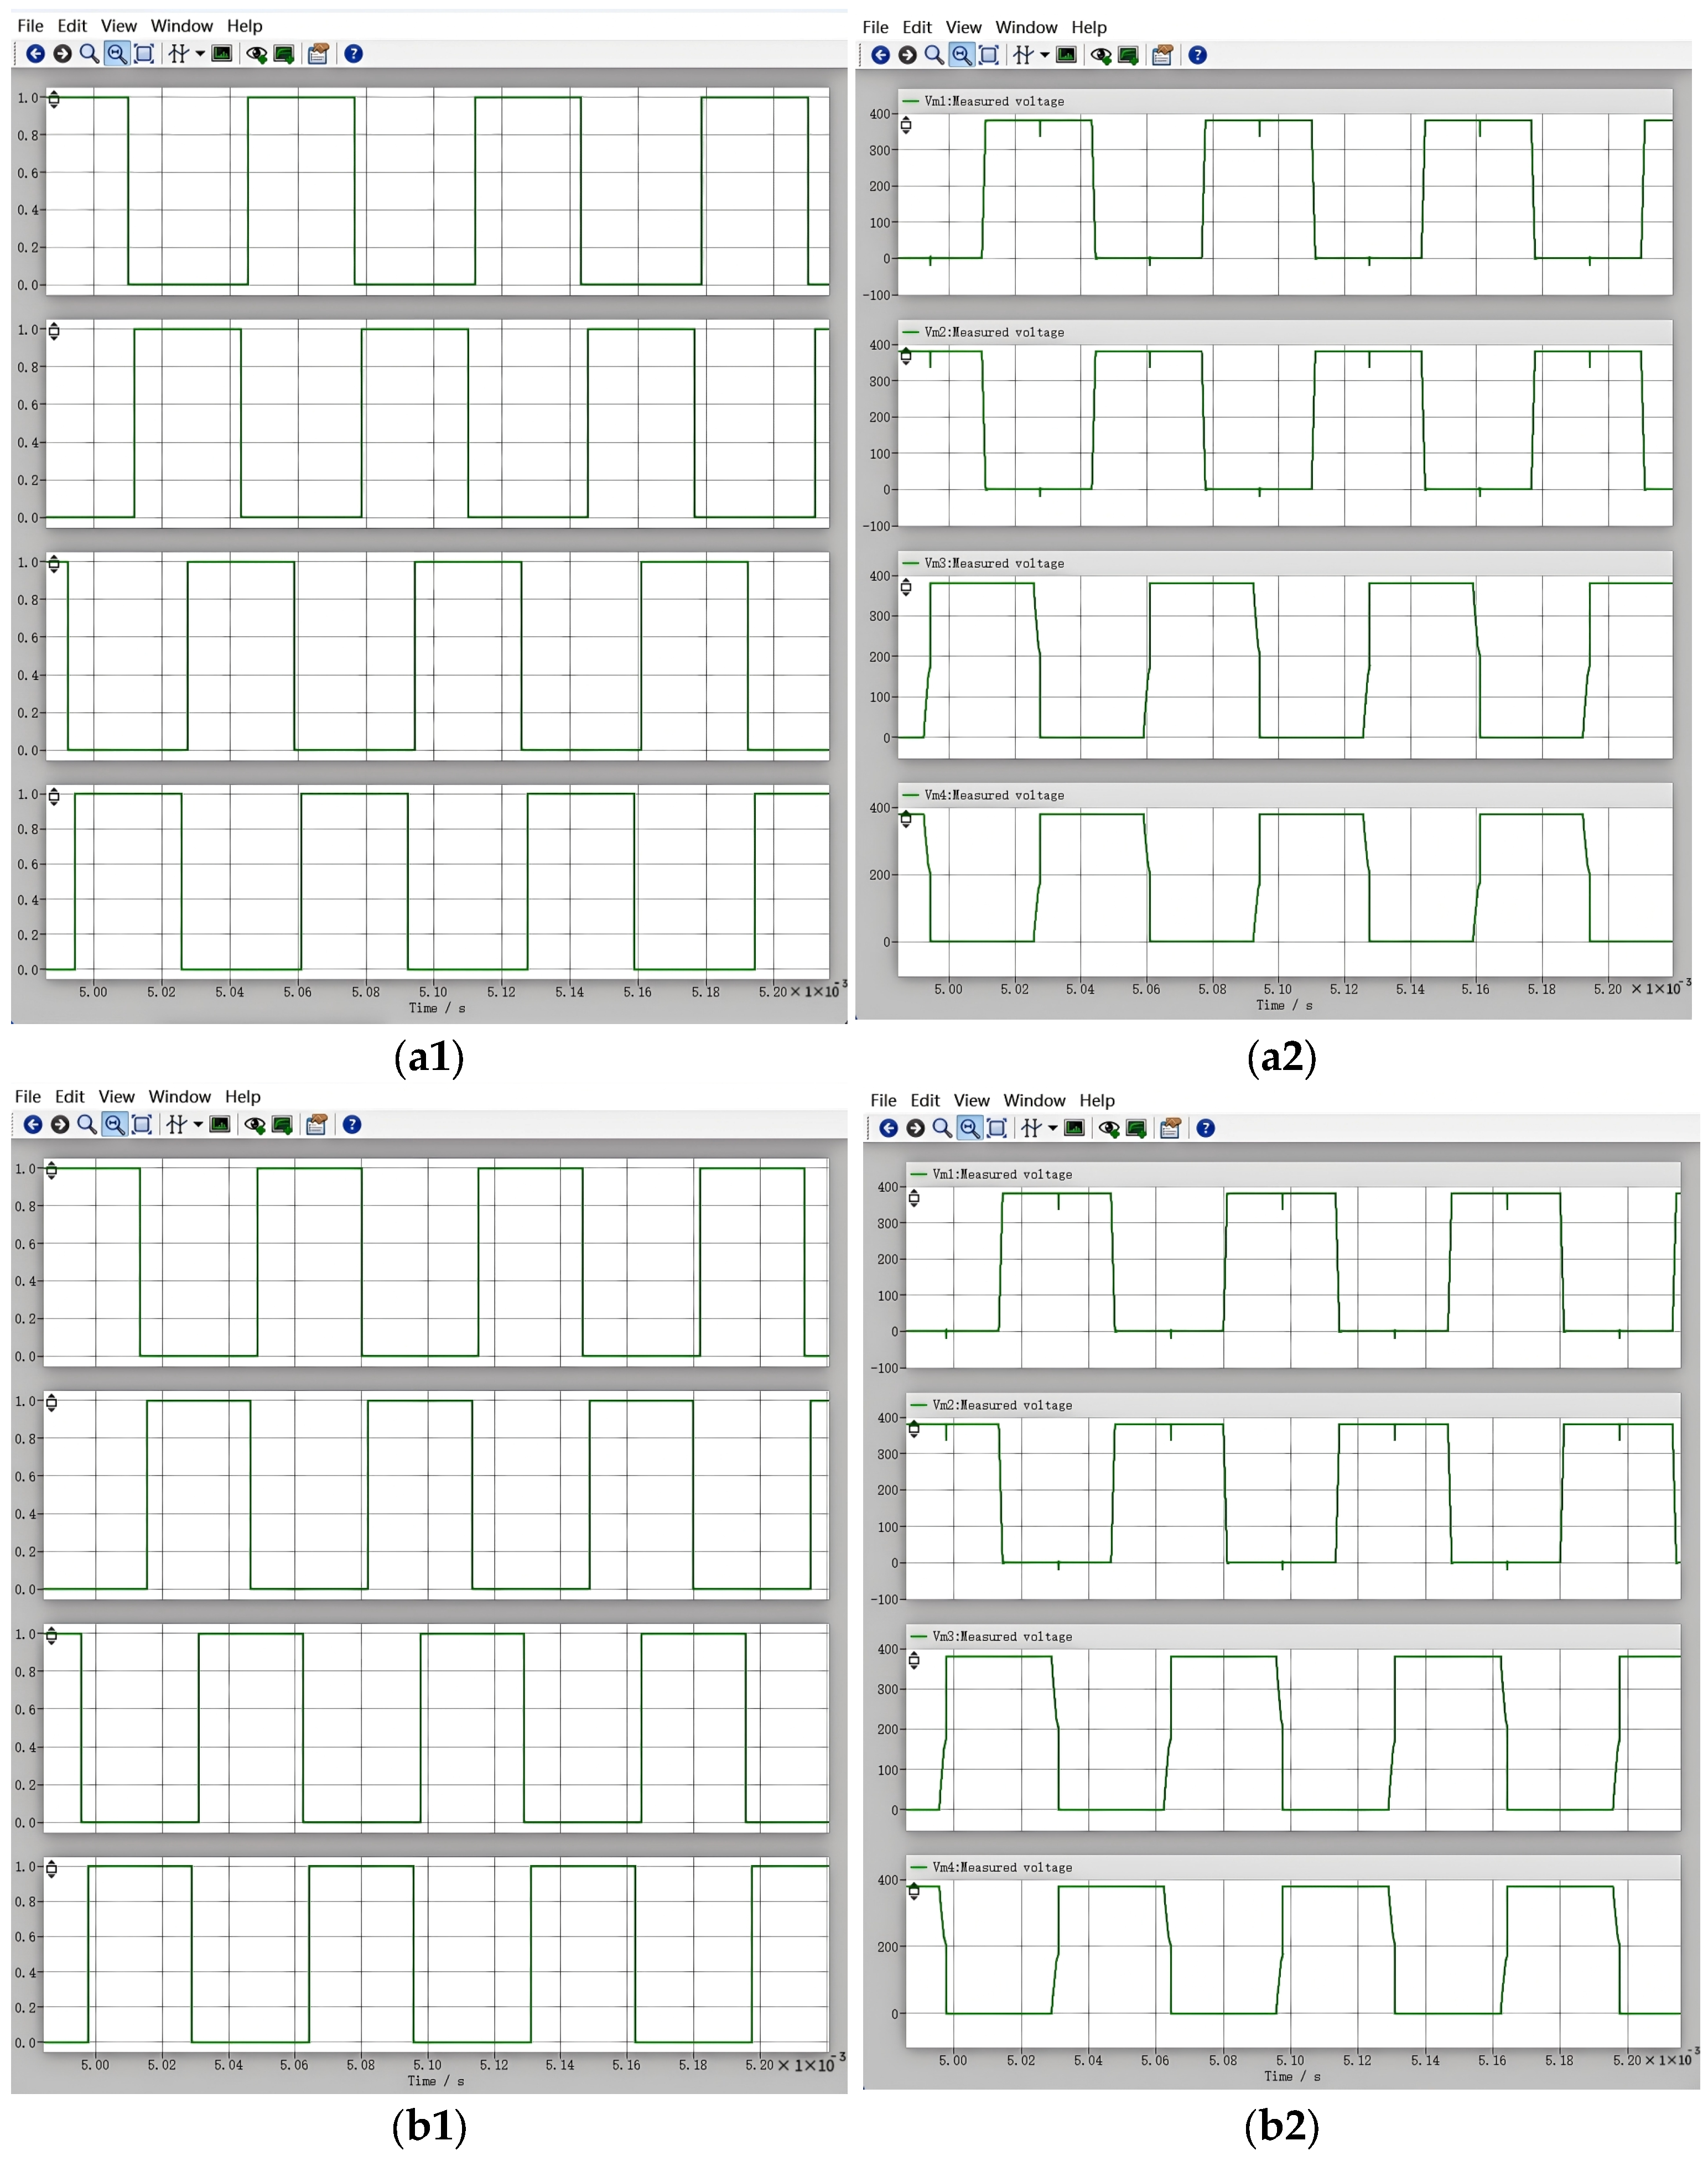
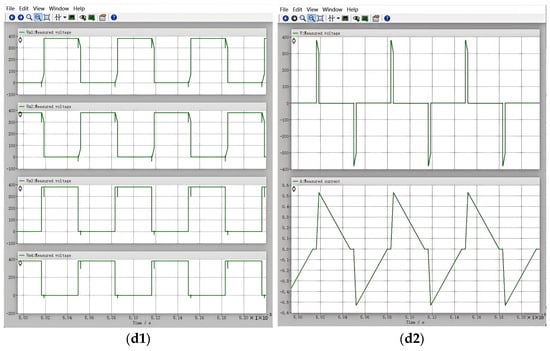
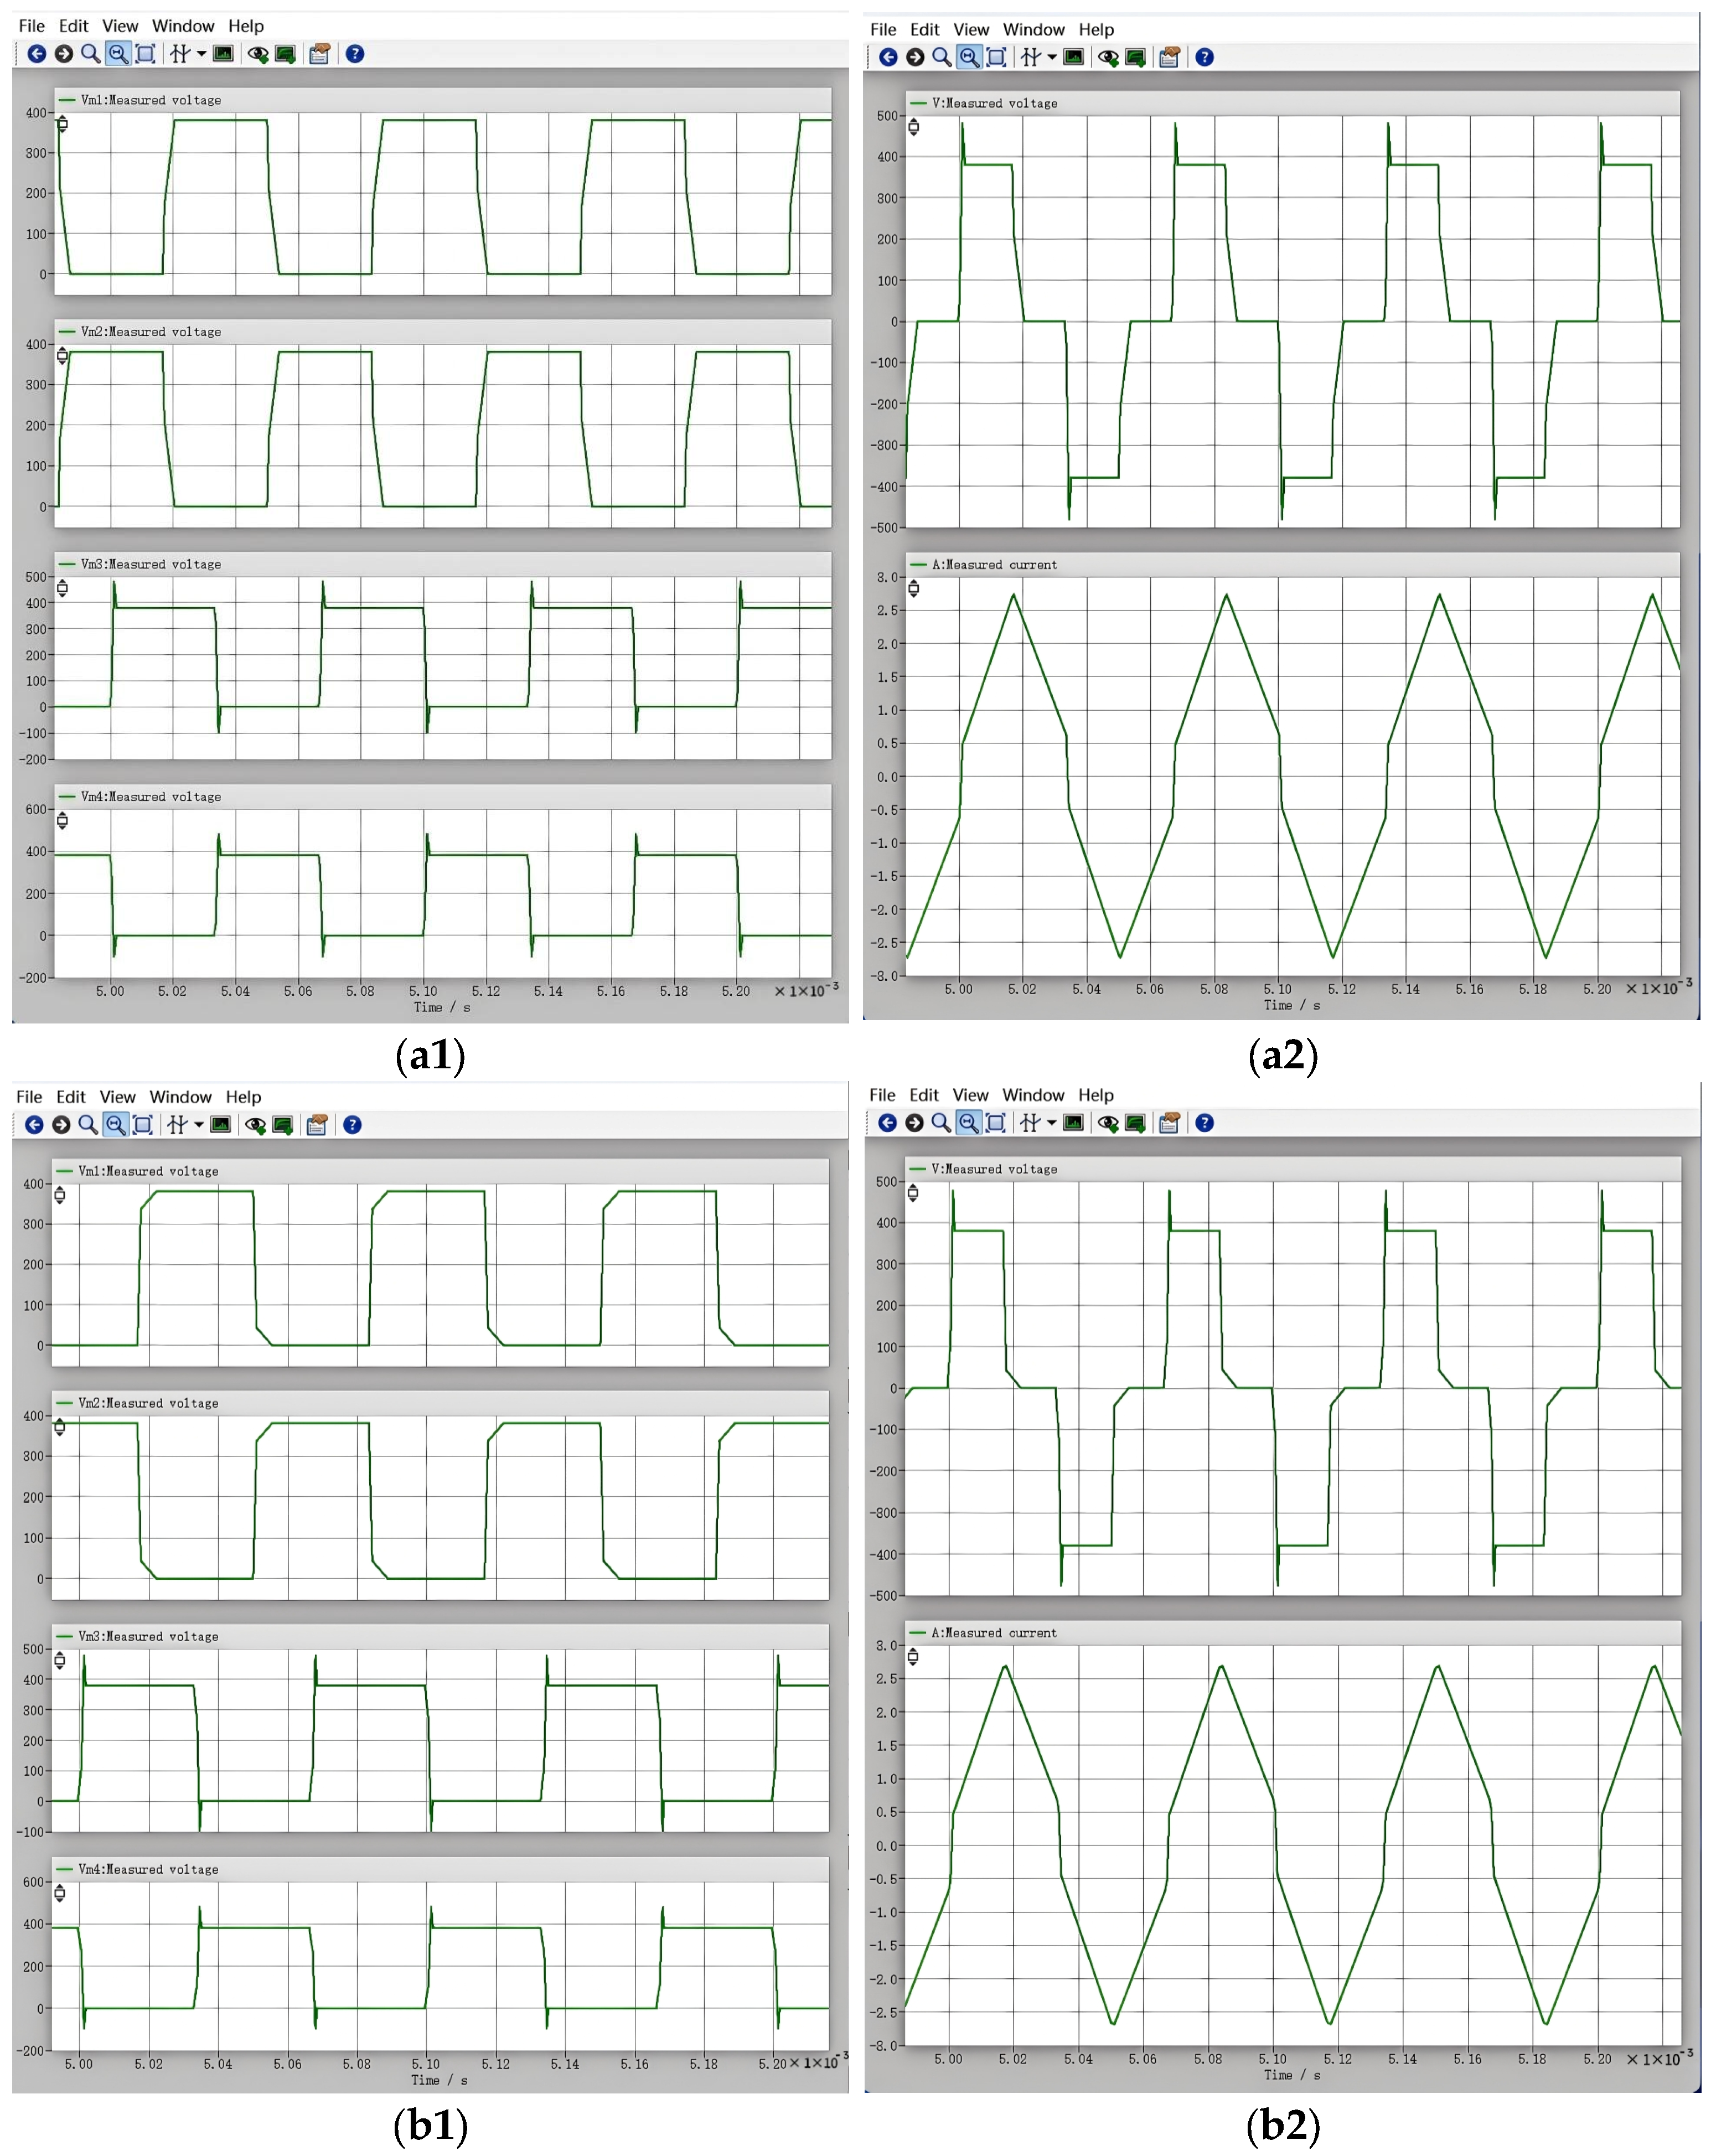
In phase-shift-controlled ZVS control, the resonant inductance serves as the sole source of energy for resonance in the lagging leg. It also effectively suppresses abrupt changes in the primary-side current, significantly reducing the severe oscillations (ringing) caused by parasitic inductance and capacitance during switching transients, thereby lowering voltage and current spikes, reducing switching losses, and mitigating electromagnetic interference [37]. With other parameters fixed, the resonant inductance is varied to 100 μH, 200 μH, 300 μH, and 400 μH, and the resulting output voltage and current signals are examined.
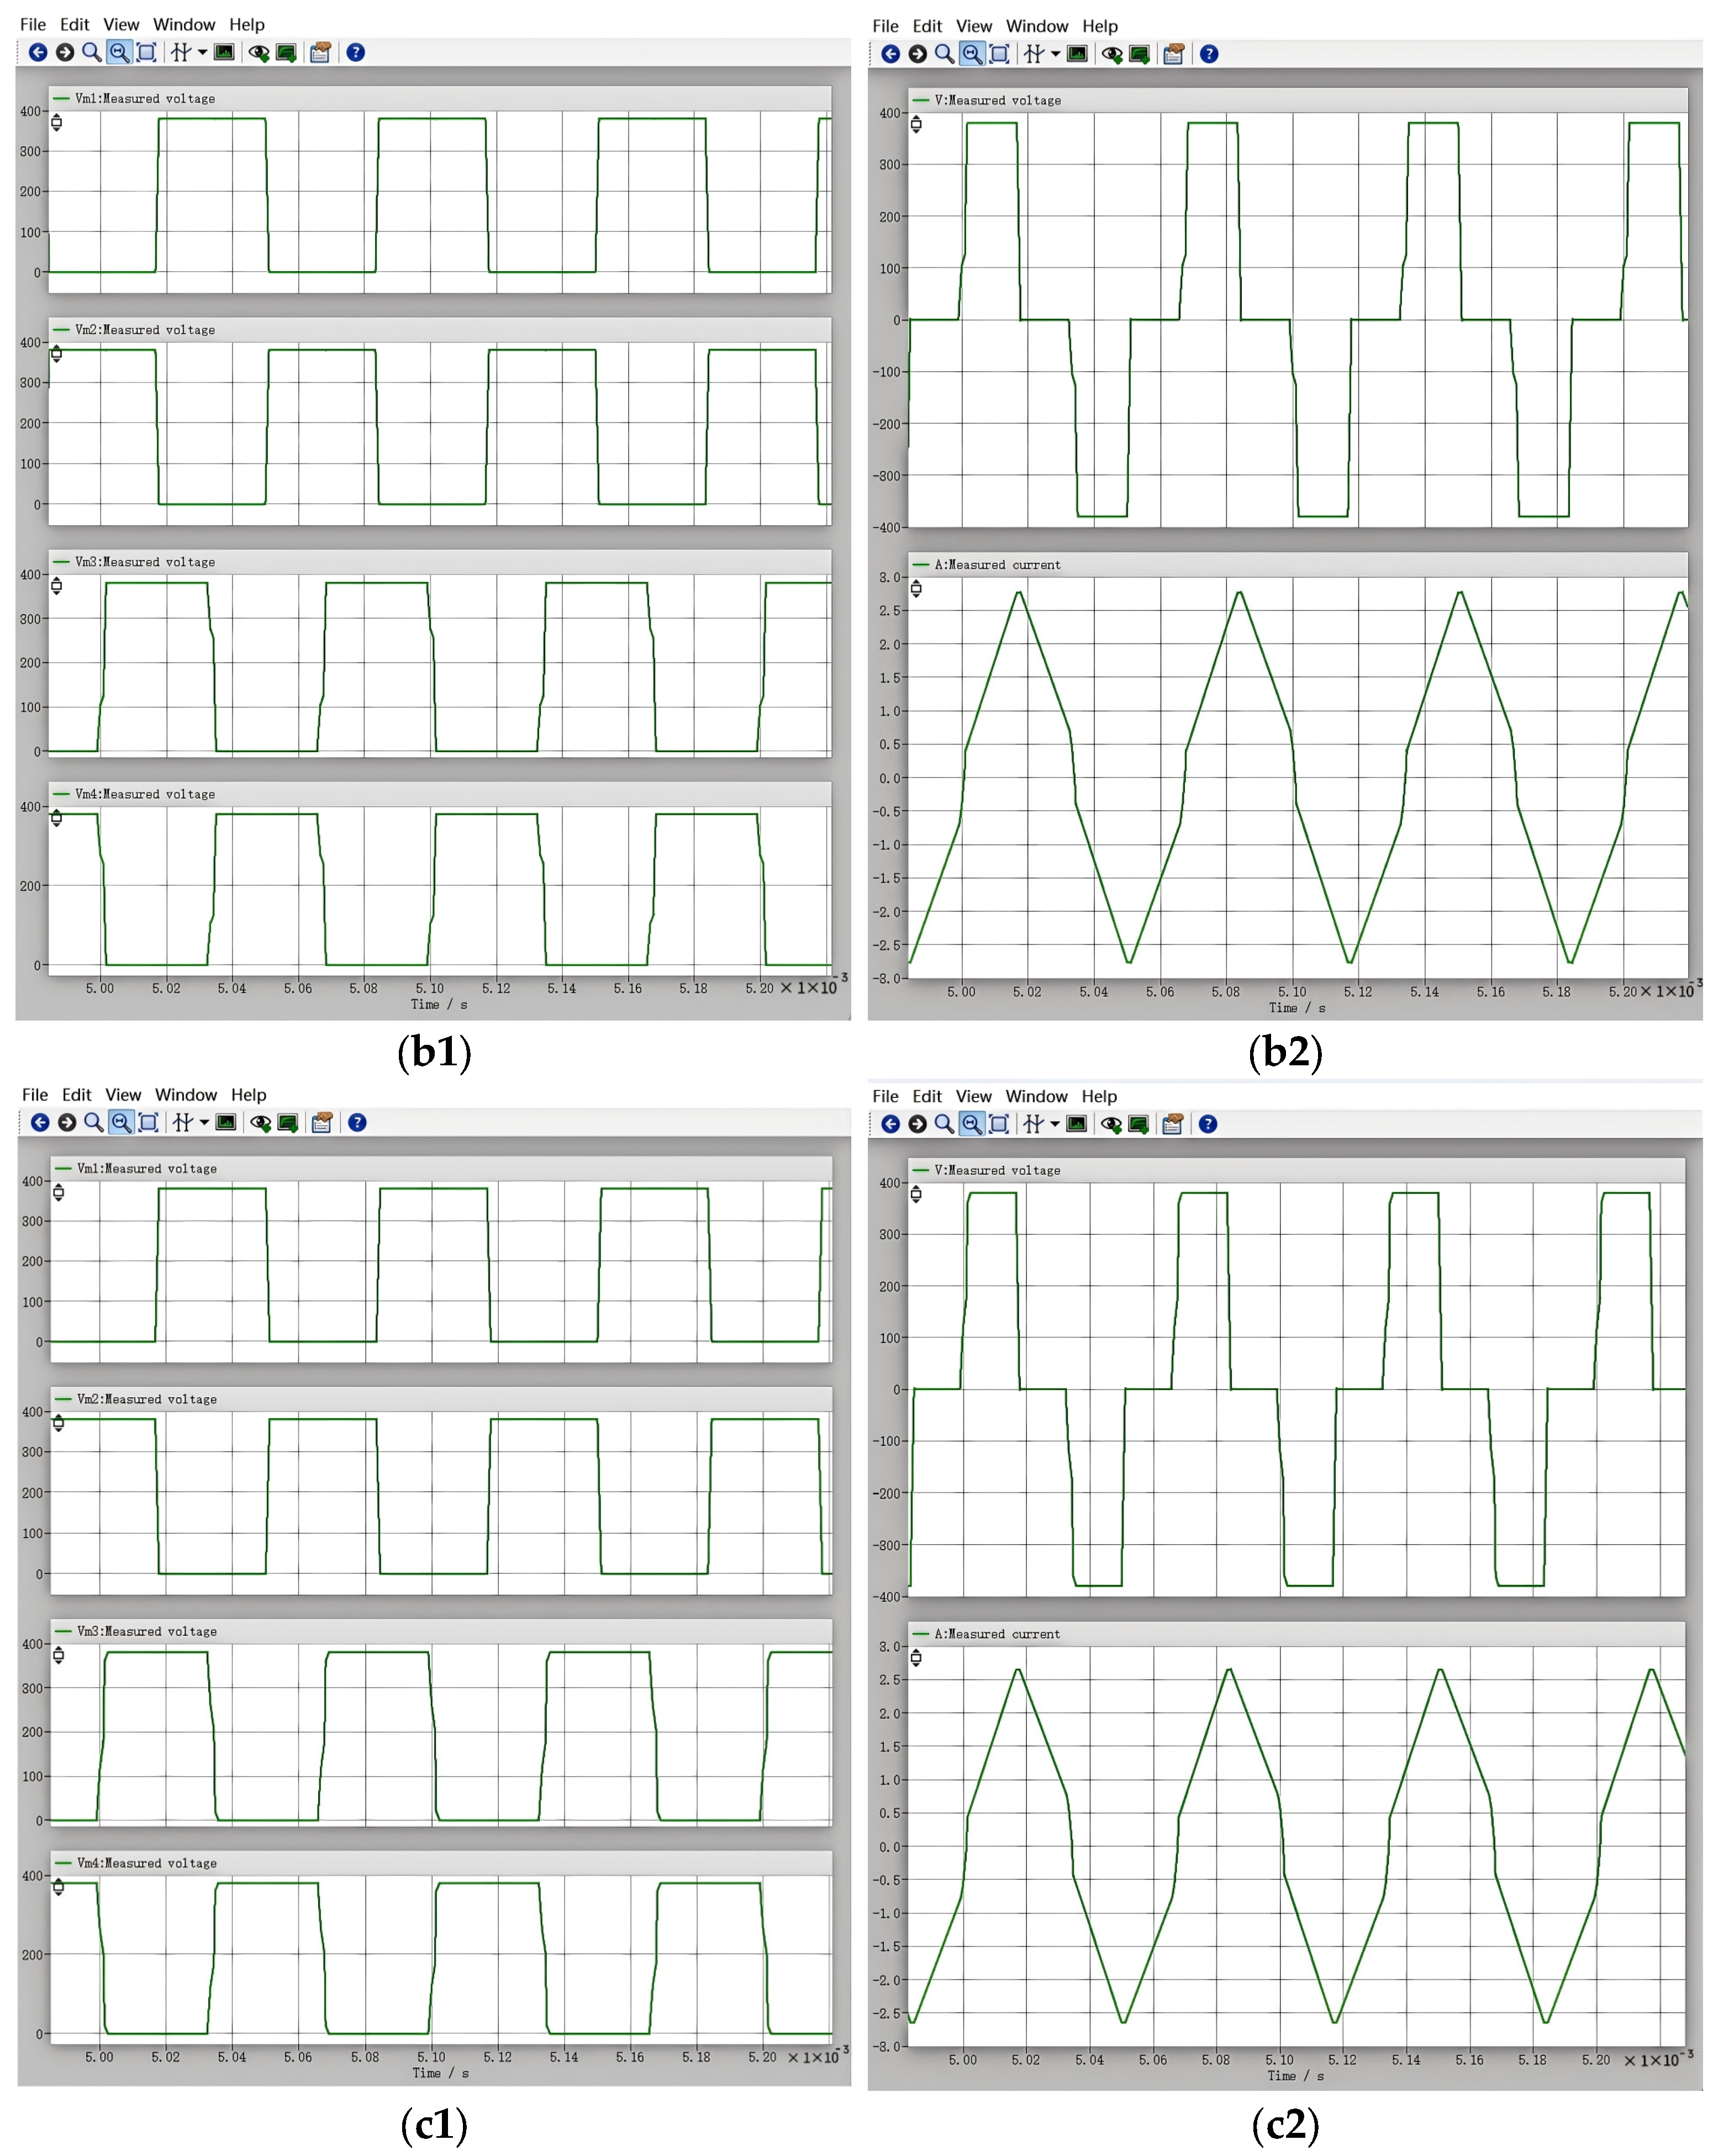
As shown in Figure 11(c2), when the resonant inductance is 300 μH, the output voltage signal waveform exhibits no distortion. At this value, the resonant inductance is at an optimal balance point: it reliably charges and discharges the junction capacitance of the switching devices in the lagging leg to ensure zero-voltage switching (ZVS), while also being sufficiently large to suppress abrupt changes in the primary-side current and slow down the commutation speed of the secondary-side rectifier diodes. Consequently, the severe high-frequency oscillations (ringing) caused by diode reverse recovery combined with transformer leakage inductance and parasitic capacitances are effectively mitigated [38]. Although a certain degree of duty cycle loss is introduced, this loss remains within the design tolerance and does not cause a noticeable “plateau” or step in the secondary-side voltage waveform.
Figure 11.
Output voltage and current waveforms for different resonant inductances: (a1) Voltage waveforms of the four MOSFETs with a resonant inductance of 100 μH; (a2) Output voltage and current waveforms. (b1) Voltage waveforms of the four MOSFETs with a resonant inductance of 200 μH; (b2) Output voltage and current waveforms. (c1) Voltage waveforms of the four MOSFETs with a resonant inductance of 300 μH; (c2) Output voltage and current waveforms. (d1) Voltage waveforms of the four MOSFETs with a resonant inductance of 400 μH; (d2) Output voltage and current waveforms.
When the resonant inductance is too small, as shown in Figure 11(a1,b1), the inductive energy stored in the 100 μH inductor is severely insufficient. After the lagging-leg switching devices turn off, the current in the resonant inductor fails to resonate the junction capacitance voltage of the opposite device down to zero, resulting in the switch being forcibly turned on while a voltage still remains across it—i.e., hard switching. Hard switching generates extremely high voltage and current spikes, which are coupled into the drive circuit through parasitic parameters such as the Miller capacitance, causing distortion of the drive waveform. More importantly, this severe switching transient excites high-frequency resonance between the transformer leakage inductance and the parasitic capacitance of the secondary-side rectifier diodes, which is directly conducted to the output terminal [39]. Consequently, large-amplitude high-frequency ringing is superimposed onto the output voltage/current waveforms, leading to severe waveform distortion.
When the resonant inductance is excessively large, as shown in Figure 11(d1), although a voltage square wave exists on the primary side and the 400 μH inductor stores sufficient energy, the current must first flow through this large inductor Lr for a long time to complete commutation before energy can be transferred to the secondary side. During this commutation interval, both secondary-side rectifier diodes conduct simultaneously, short-circuiting the transformer secondary and causing the secondary voltage to drop to zero. This interval represents the lost duty cycle for the secondary side [40]. The larger the resonant inductance, the more severe the duty cycle loss [41,42]. Severe duty cycle loss means that the effective on-time of the secondary voltage is greatly shortened. To maintain the output voltage, more energy must be transferred within the remaining very short time, resulting in an abnormally high peak primary current.
4.6. Analysis of the Effect of Dead Time on Output Voltage Signal
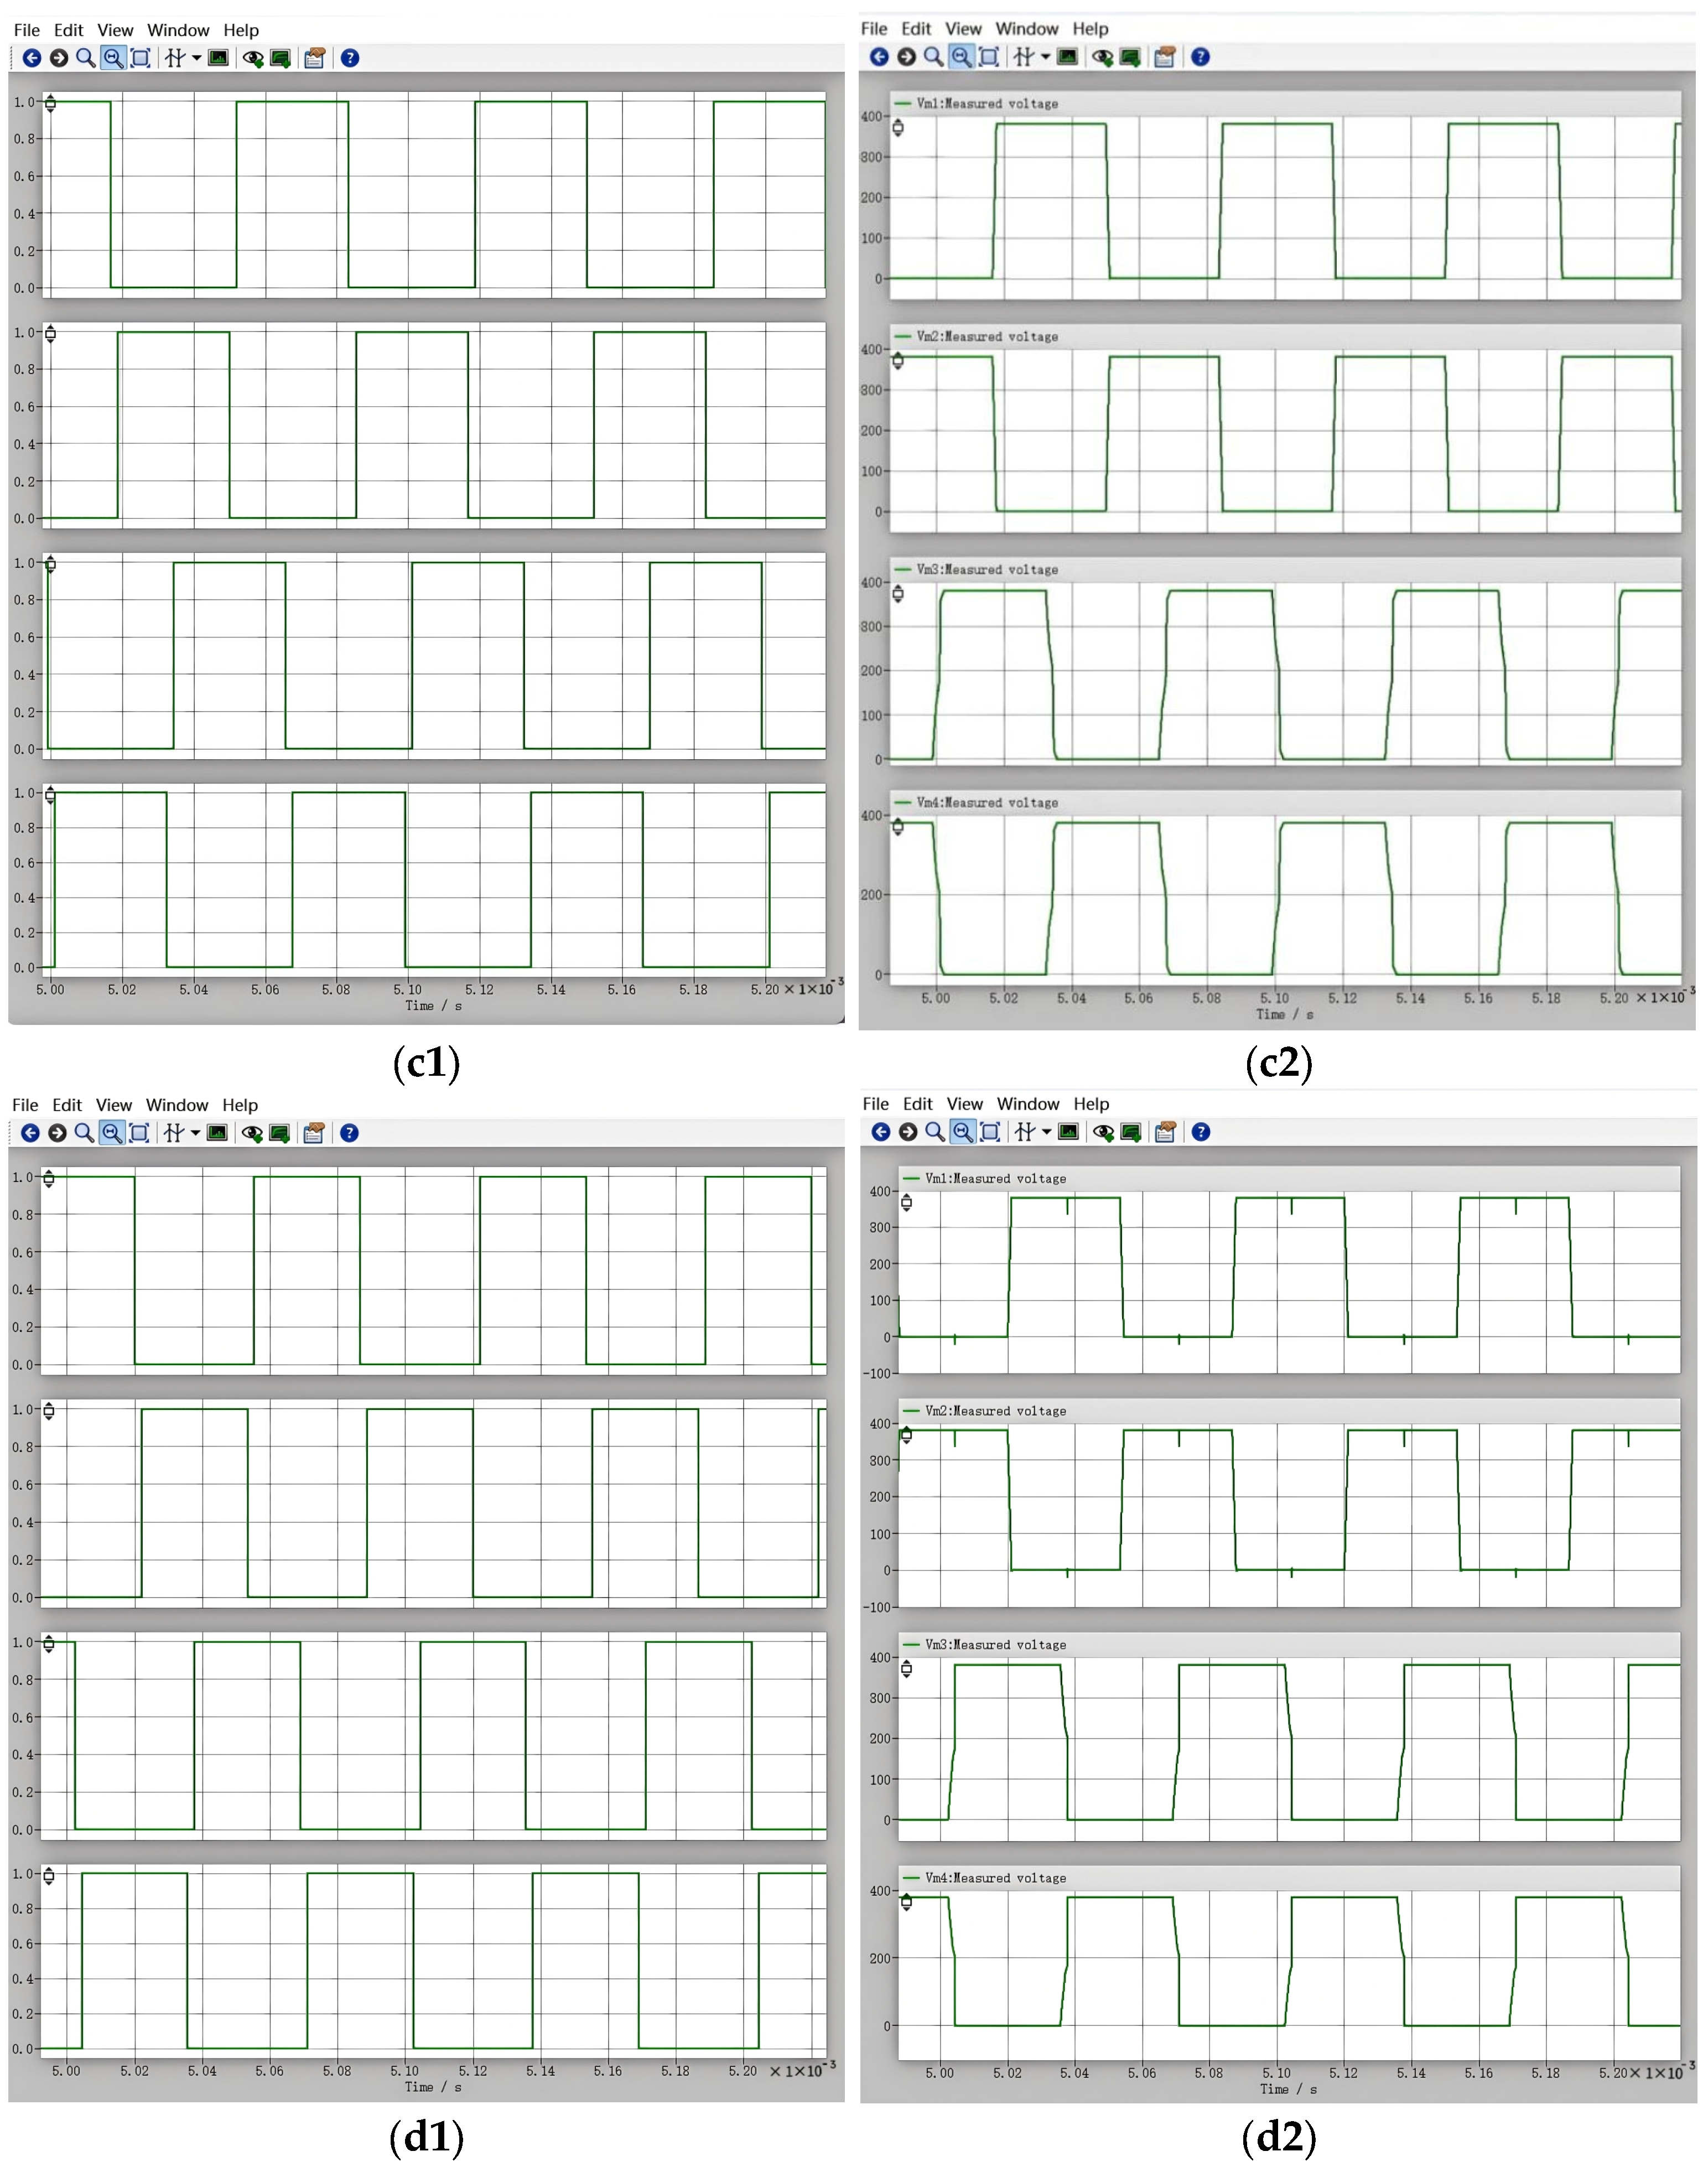
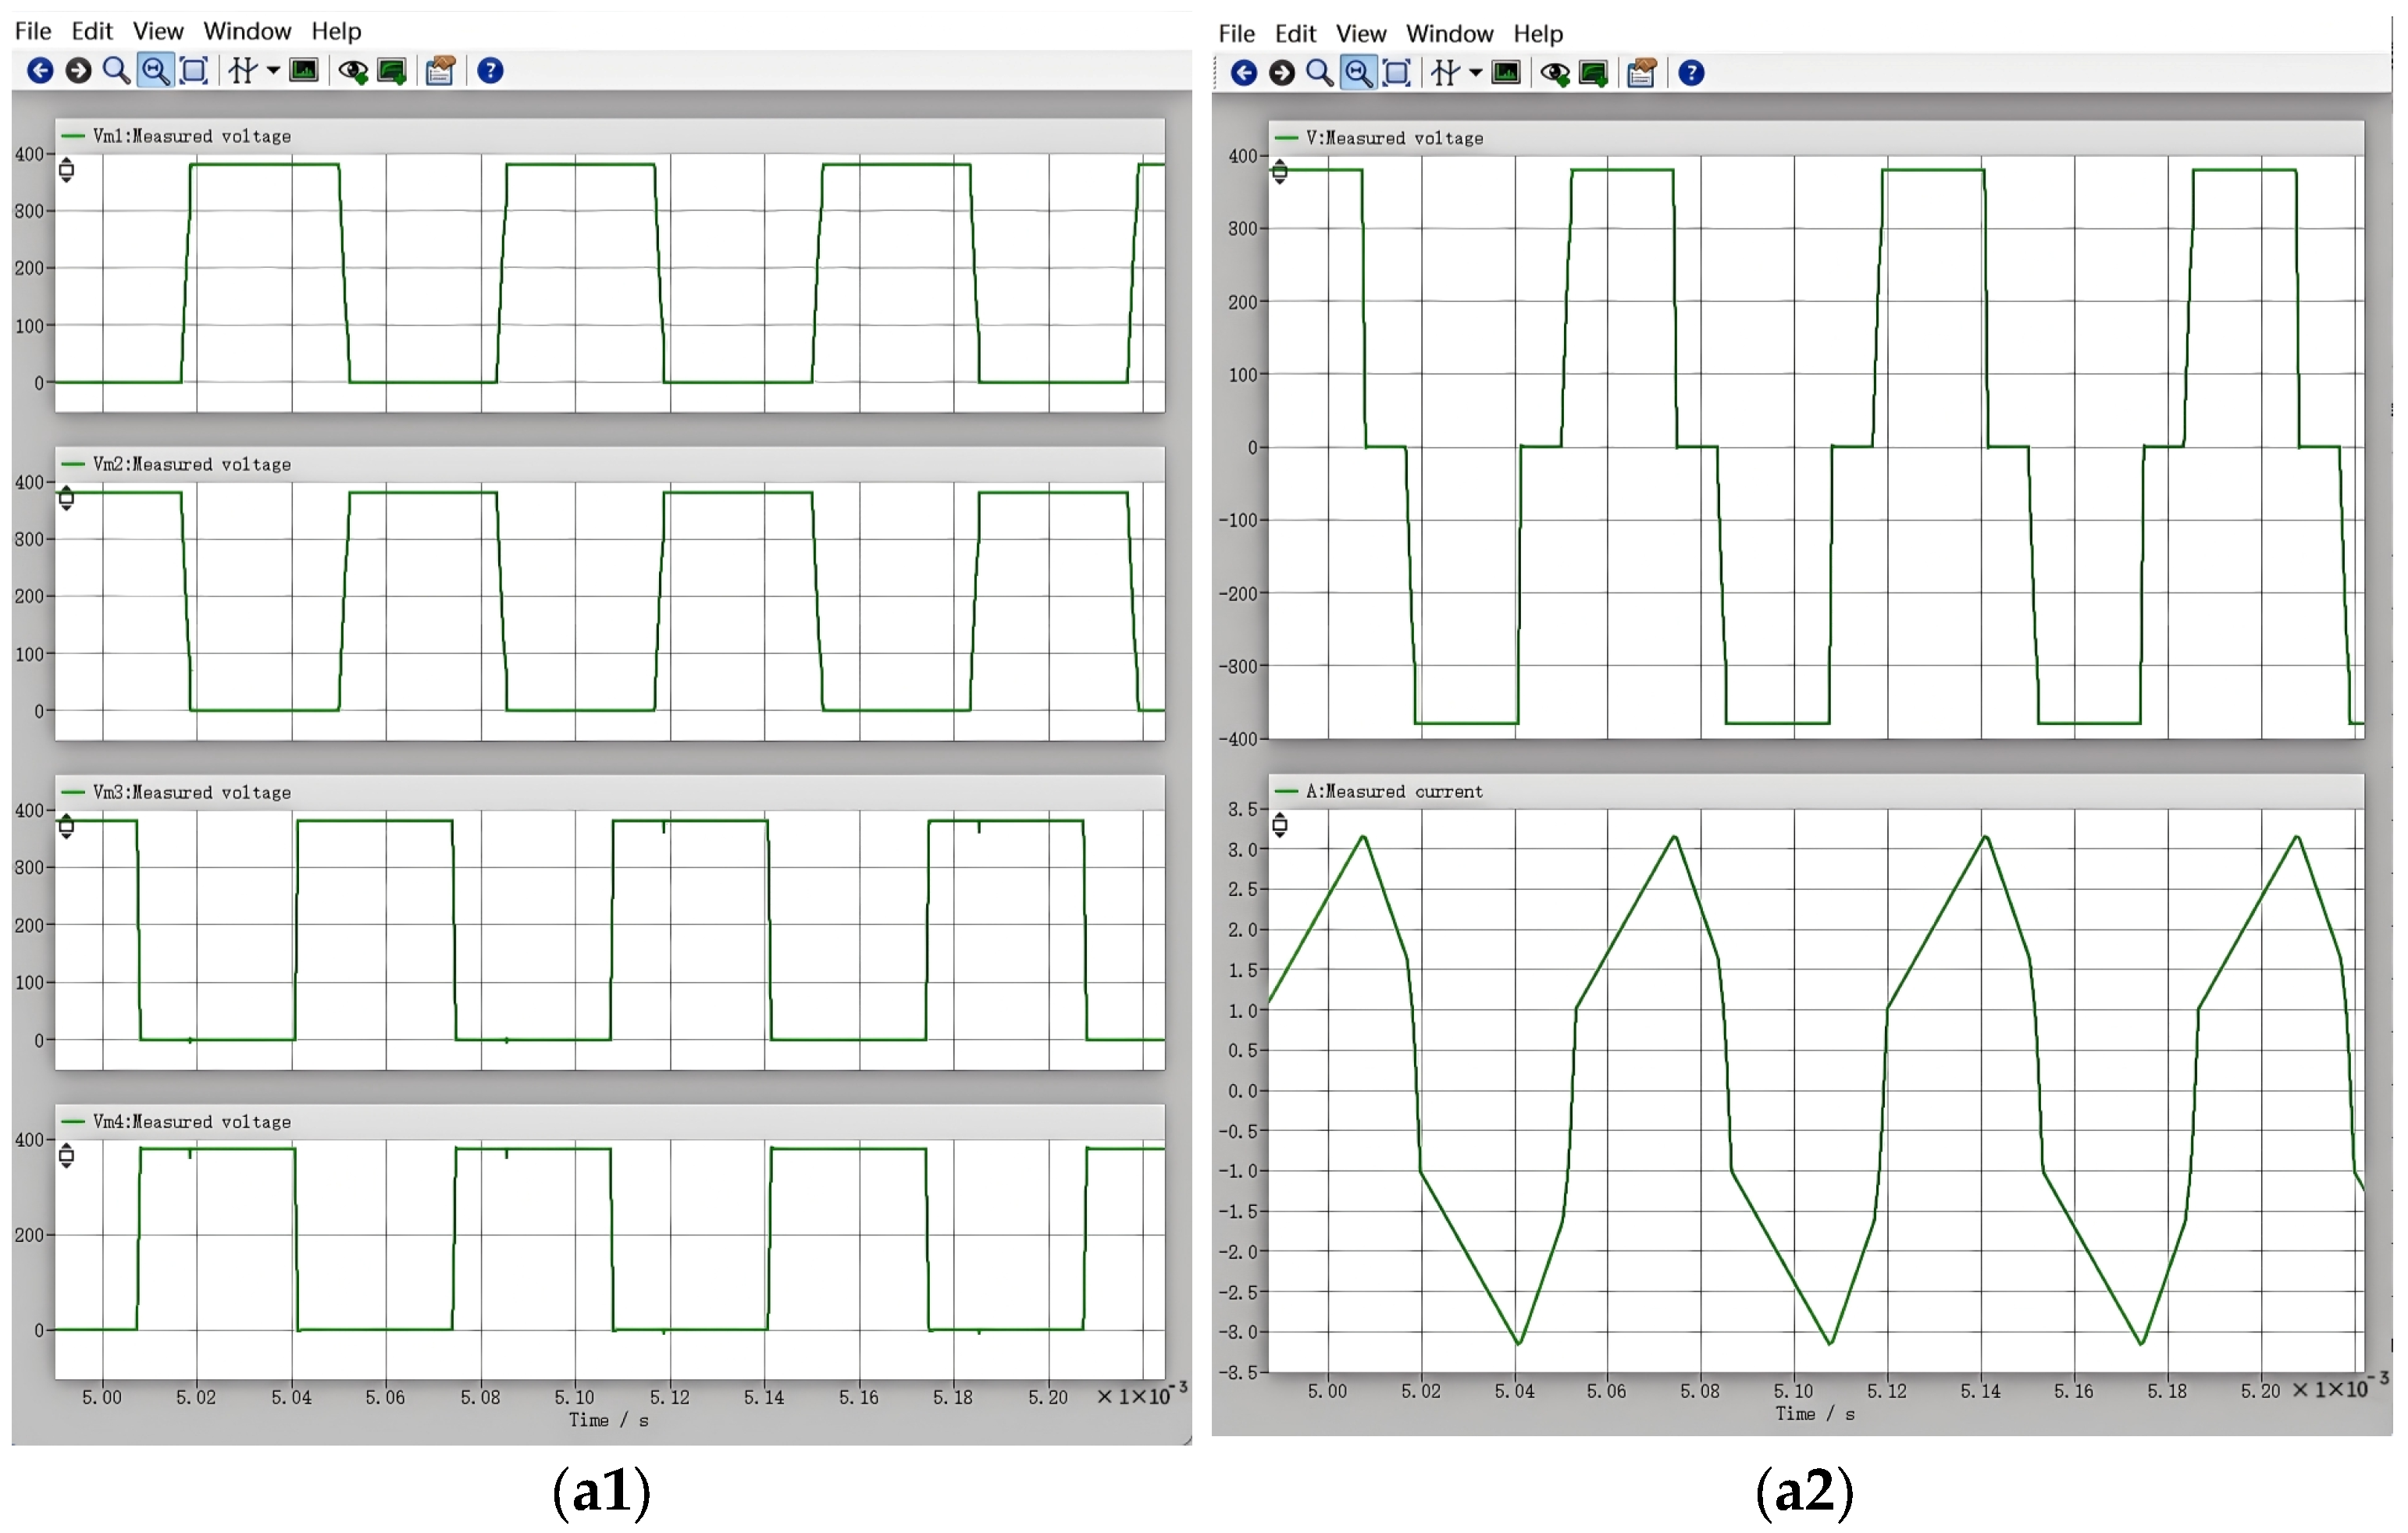
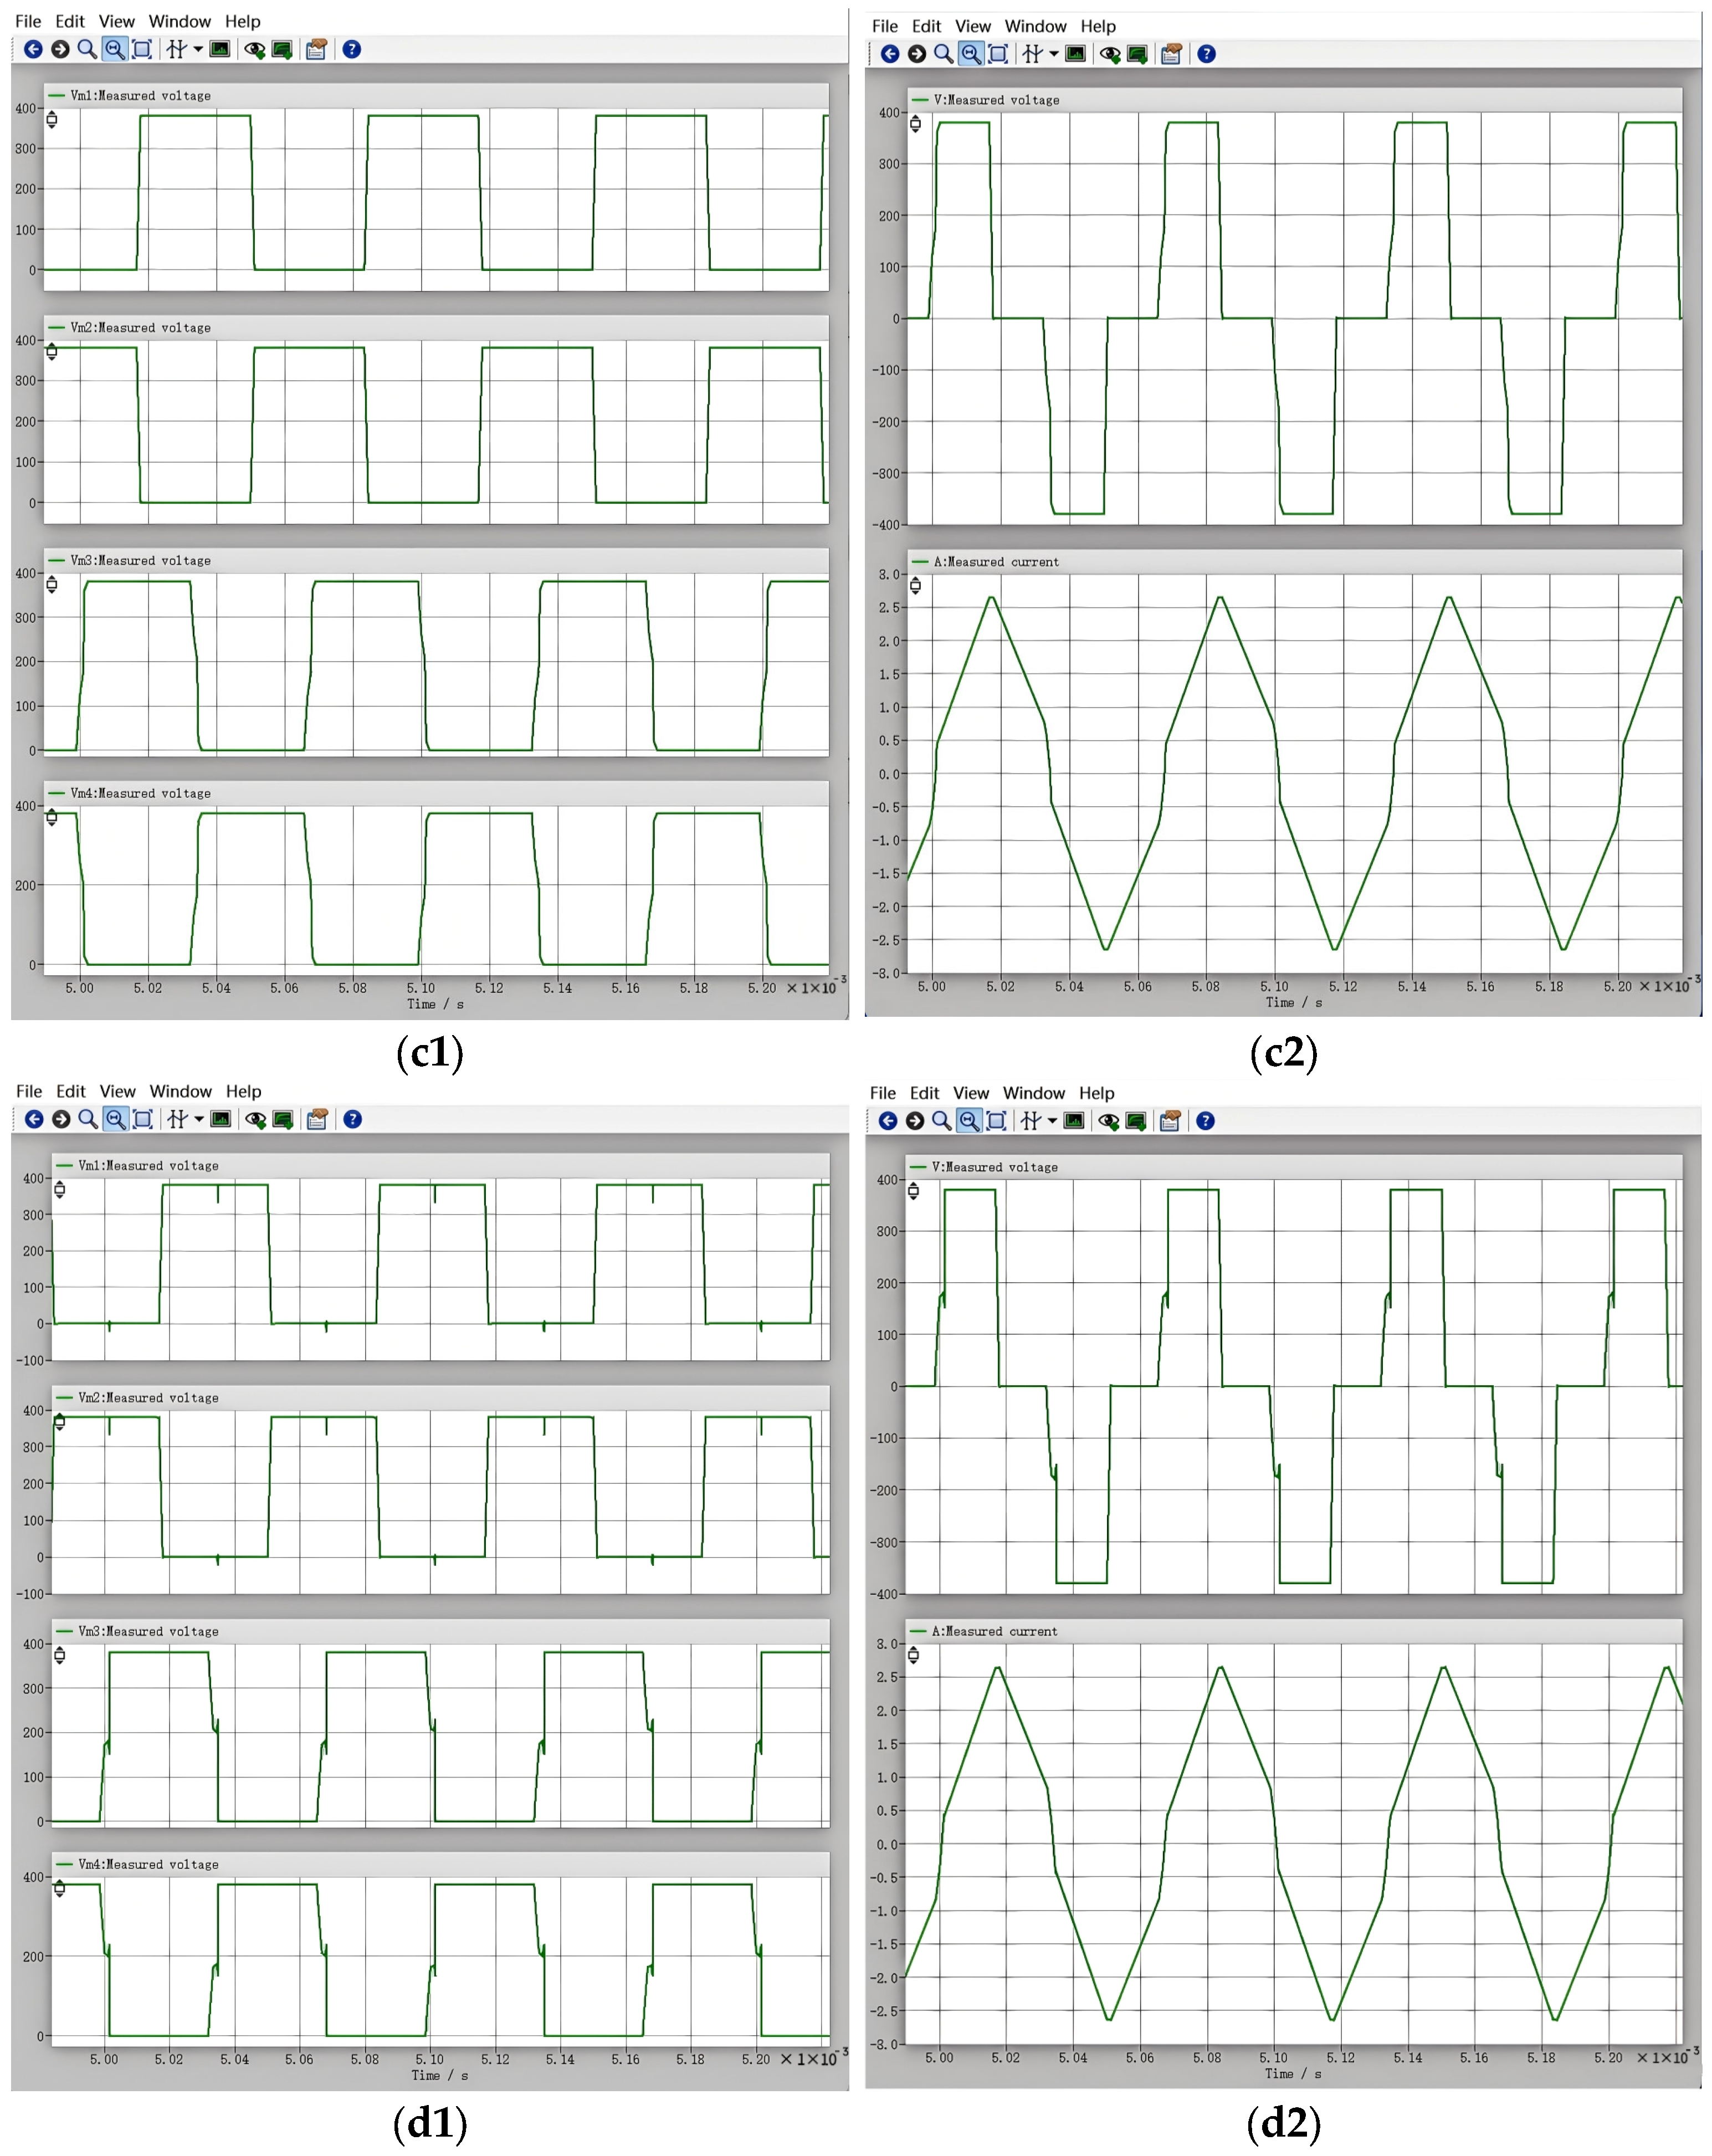
In phase-shift-controlled ZVS control, the function of the dead time is to reserve a precisely sufficient interval before the switching devices turn on, allowing the resonant inductor (Lr) and the junction capacitance (Coss) of the switches to complete resonance and bring the voltage across the switches down to zero, thereby creating the condition for achieving zero-voltage switching (ZVS). This interval must be accurately matched to the resonant period of the circuit [43]. With other parameters fixed, the dead time is varied to 0.5 μs, 1 μs, 2 μs, and 3 μs, and the resulting output voltage and current signals are examined.
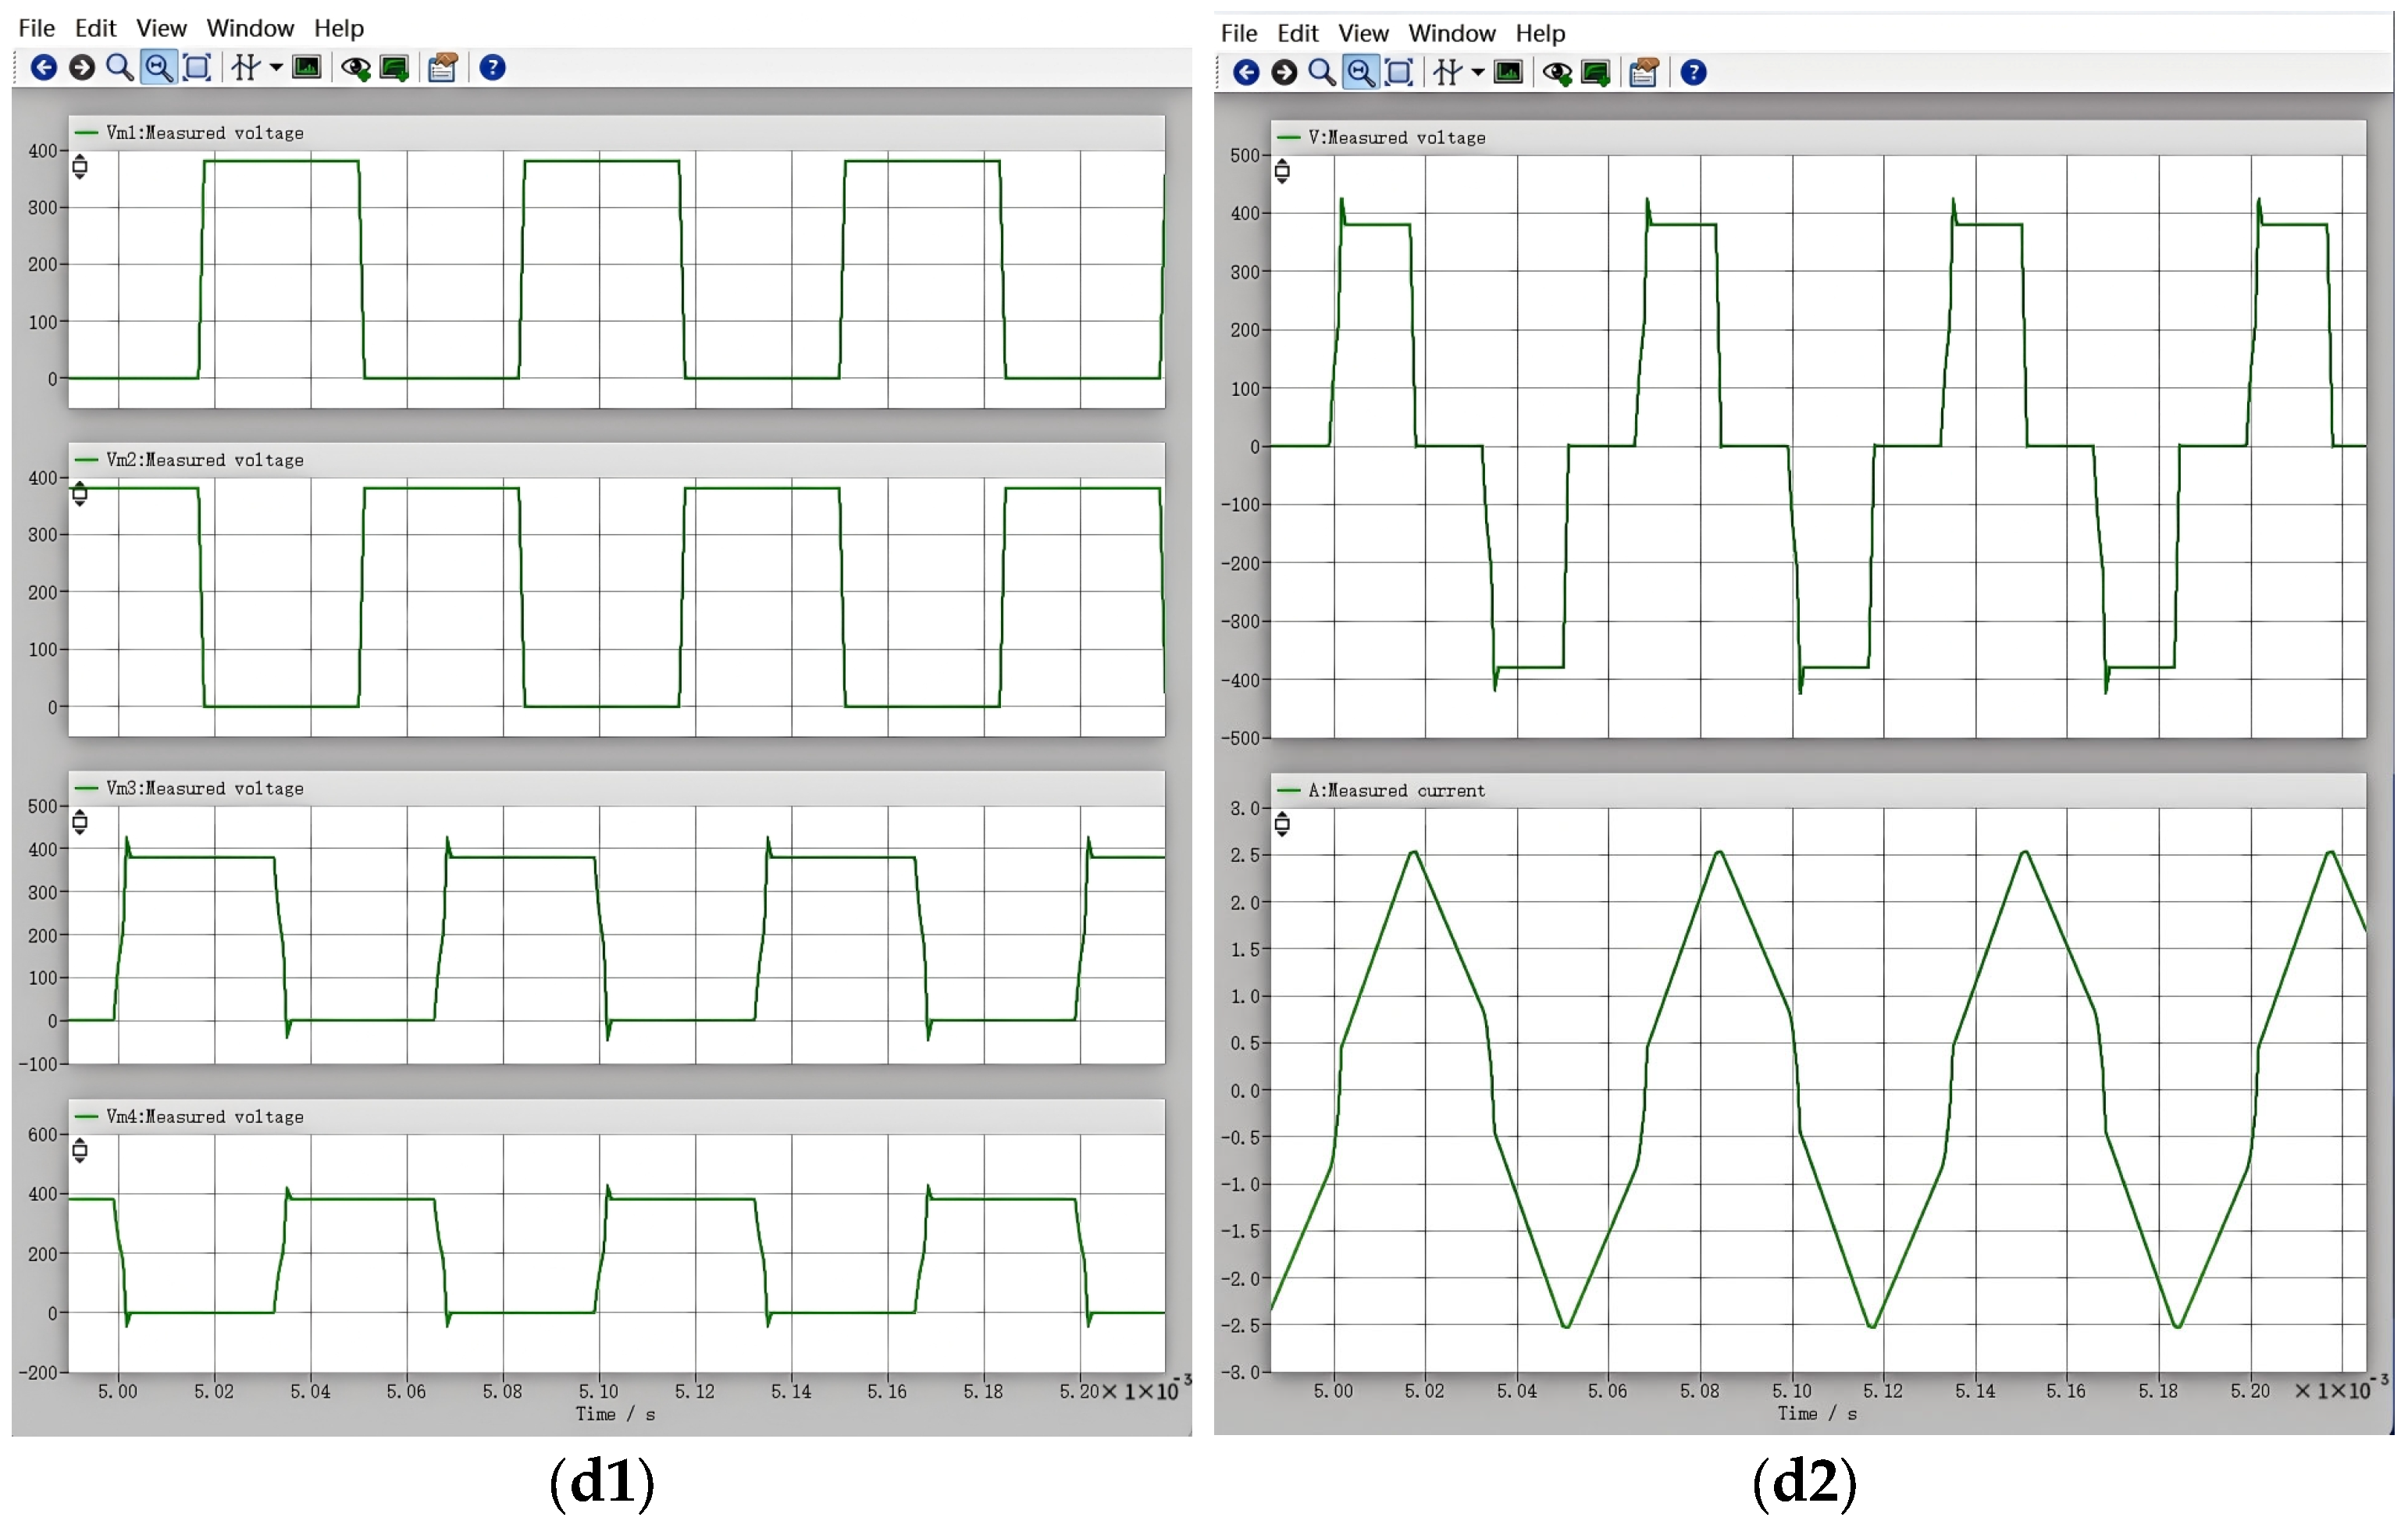
As shown in Figure 12(c2), when the dead time is 2 μs, the output voltage signal waveform exhibits no distortion. A dead time of 2 μs corresponds exactly to the resonant period required to complete one full resonance cycle. This precise dead time ensures that at the moment the gate drive signal is applied to the switching device, the drain-source voltage (Vds) across the device has just resonated to zero [44].
Figure 12.
Output voltage and current waveforms for different dead times: (a1) Voltage waveforms of the four MOSFETs with a dead time of 0.5 μs; (a2) Output voltage and current waveforms. (b1) Voltage waveforms of the four MOSFETs with a dead time of 1 μs; (b2) Output voltage and current waveforms. (c1) Voltage waveforms of the four MOSFETs with a dead time of 2 μs; (c2) Output voltage and current waveforms. (d1) Voltage waveforms of the four MOSFETs with a dead time of 3 μs; (d2) Output voltage and current waveforms.
When the dead time is reduced to 1 μs or even shorter, it forcibly intervenes before the resonance is completed, thereby disrupting the soft-switching process. The resonant inductor Lr and the junction capacitance Coss do not have sufficient time to finish charge transfer and voltage resonance. Consequently, when the switching device turns on, its drain-source voltage (Vds) remains high and has not yet fallen to zero. This forced turn-on under high voltage constitutes hard switching, leading to severe waveform distortion.
When the dead time is extended to 3 μs, the circuit encounters the opposite extreme—excessive waiting also disrupts soft-switching. After 2 μs, the resonance between the resonant inductor Lr and the junction capacitance Coss has already completed [45]. Once the switch voltage resonates to zero, if the resonant inductor still retains residual energy, the voltage may continue to develop in the negative direction (clamped by the body diode) or start rising again. By the time the dead time ends, the voltage across the switch may have already deviated from zero [46]. This leads to two adverse consequences. First, if the switch voltage rises again after having resonated to zero, the subsequent turn-on becomes hard switching. Second, even if the body diode has already conducted and clamped the voltage—seemingly achieving zero-voltage switching—the excessively long dead time means that the primary current circulates in an ineffective freewheeling state for a longer period, exacerbating duty cycle loss. Both conditions result in waveform distortion.
In summary, to ensure high-quality waveforms for both the drive signals and the output voltage/current signals while avoiding signal distortion caused by improper parameter settings, this paper selects the following key parameters based on a comprehensive consideration of system stability: the duty cycle of the drive signals is set to 0.5 to achieve distortion-free drive signal waveforms; the phase difference between the drive signals is set to 90° to operate the system in an appropriate resonant state, thereby reducing switching losses and improving energy transfer efficiency; the resonant inductance is chosen as 300 μH to match other resonant components in the system and ensure reliable soft-switching operation; and the dead time is set to 2 μs, which effectively prevents shoot-through of the power switches while avoiding waveform distortion or reduced voltage utilization due to an excessively long dead time.
5. Experimental Analysis of the Dielectric Barrier Discharge Plasma Power Supply System
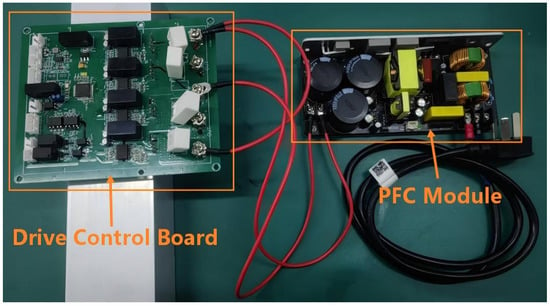
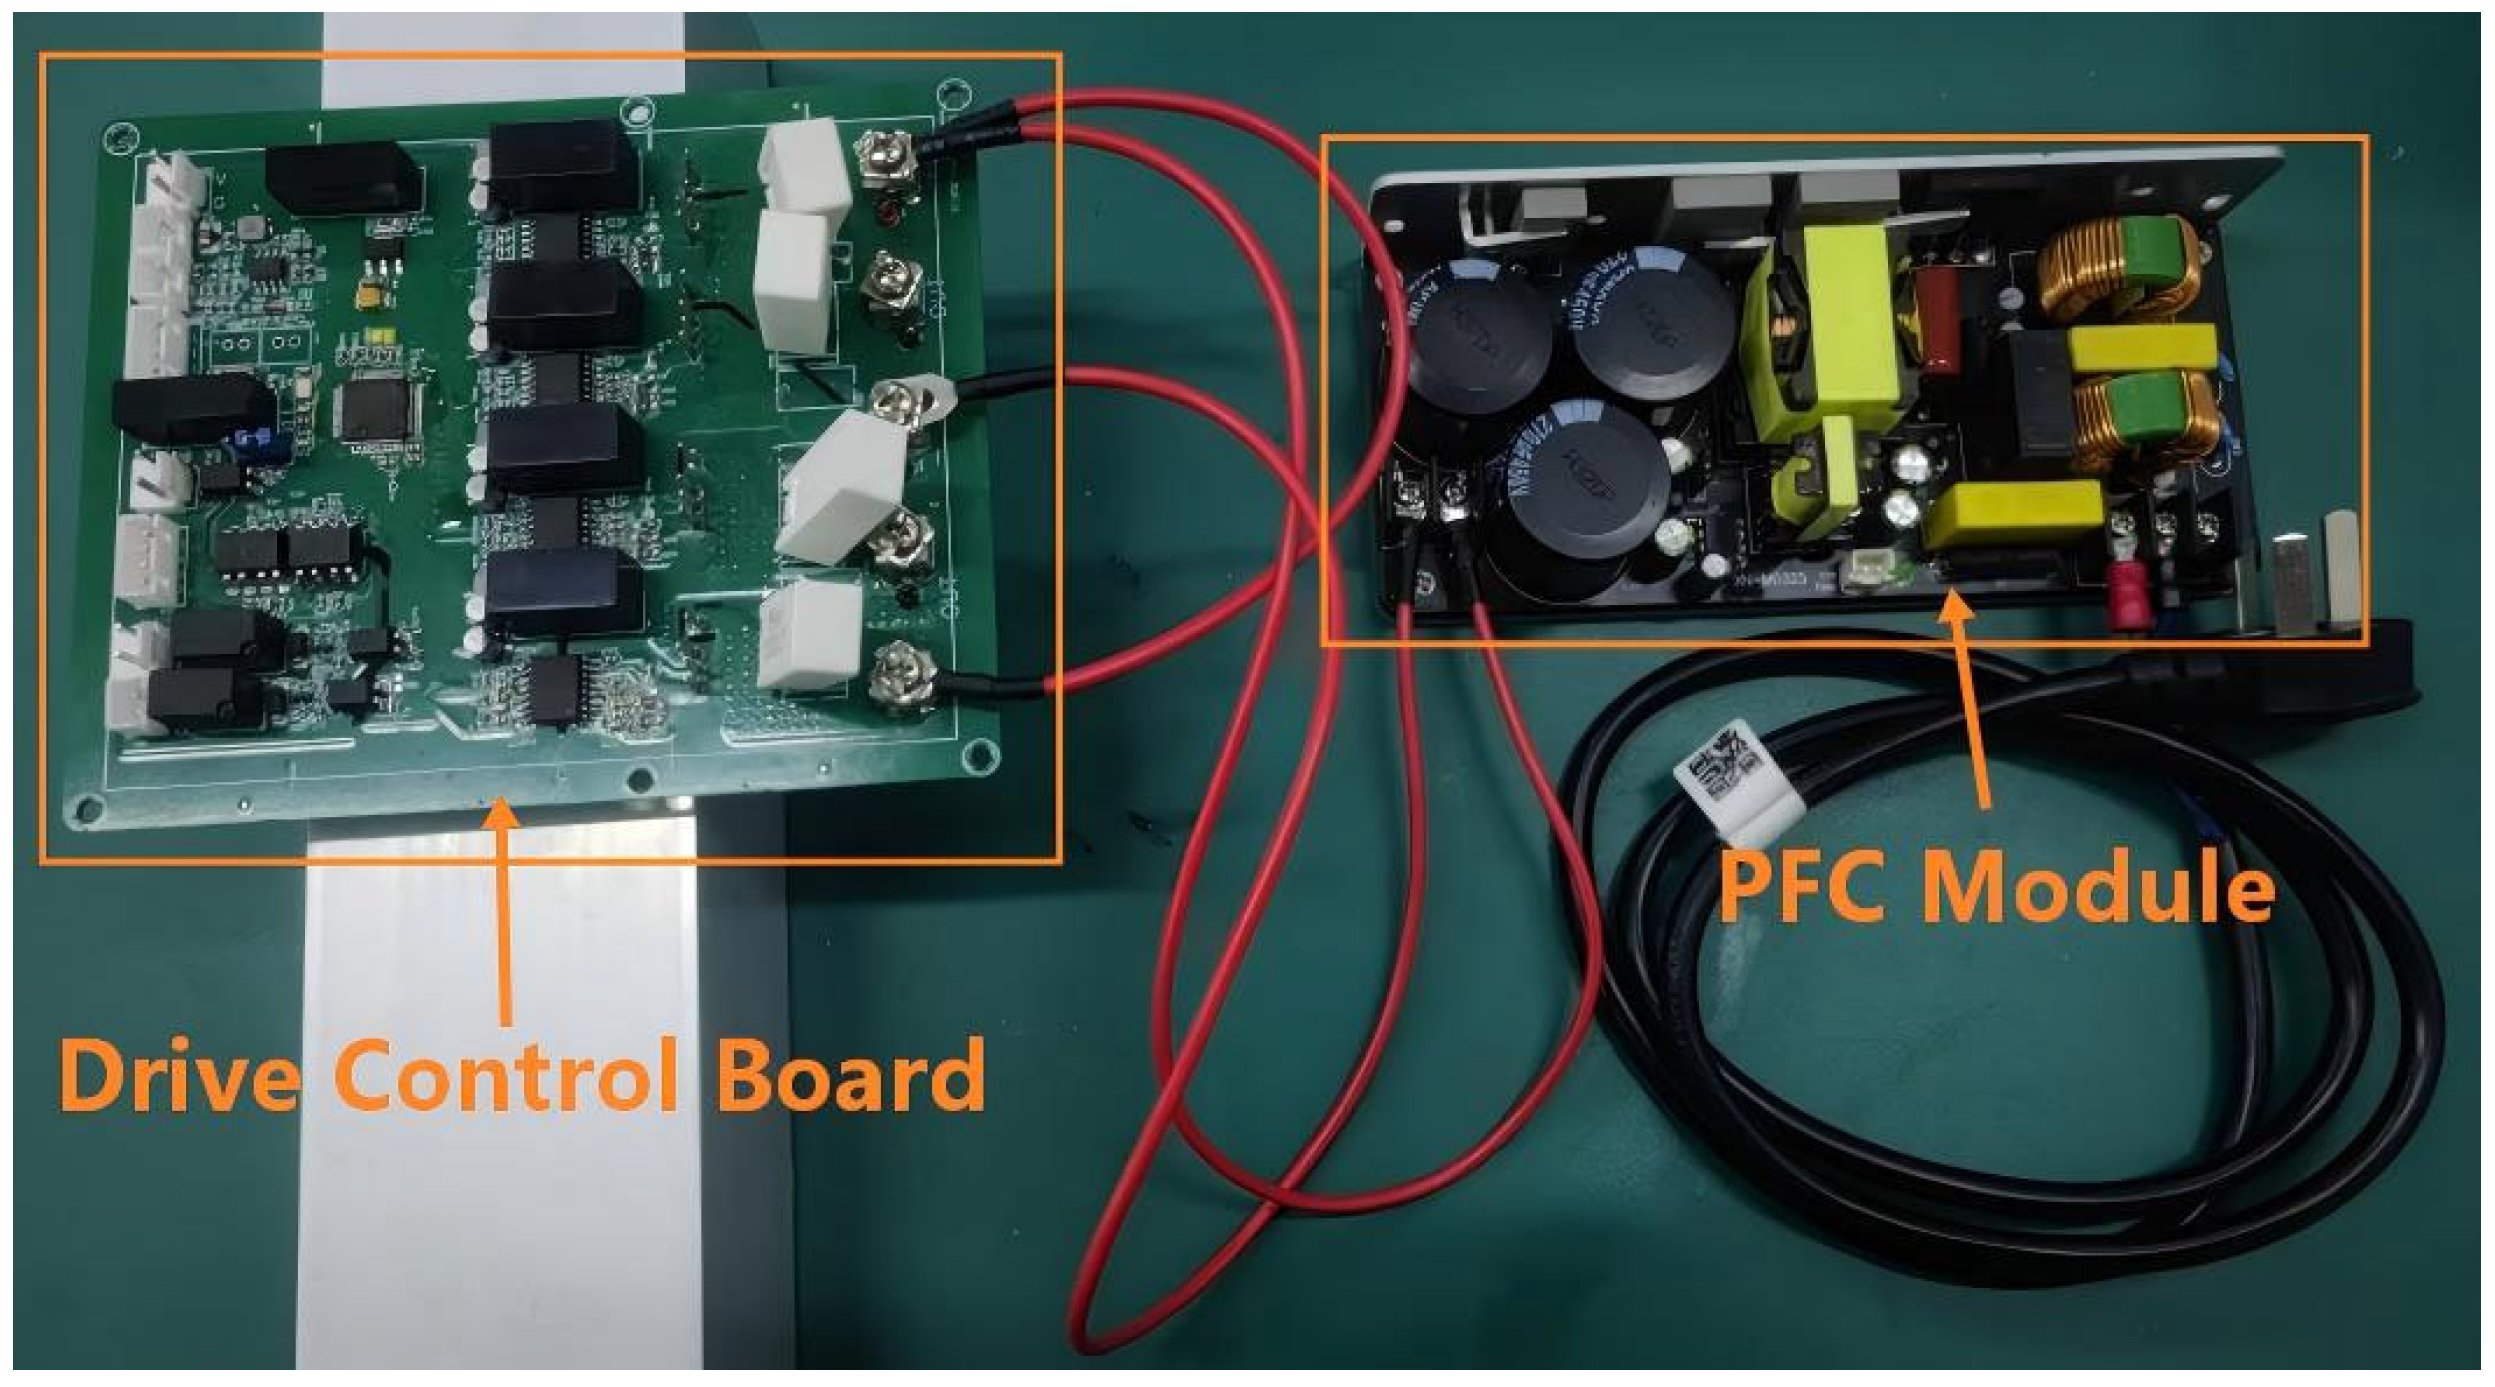
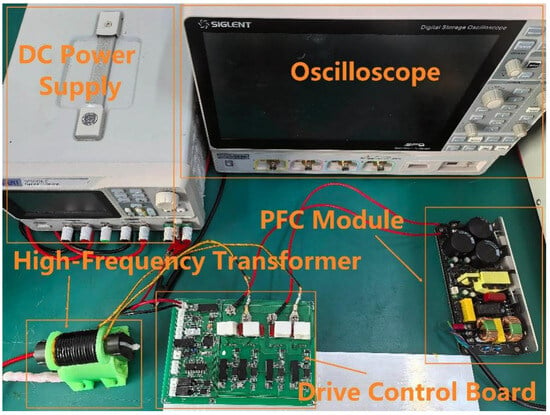
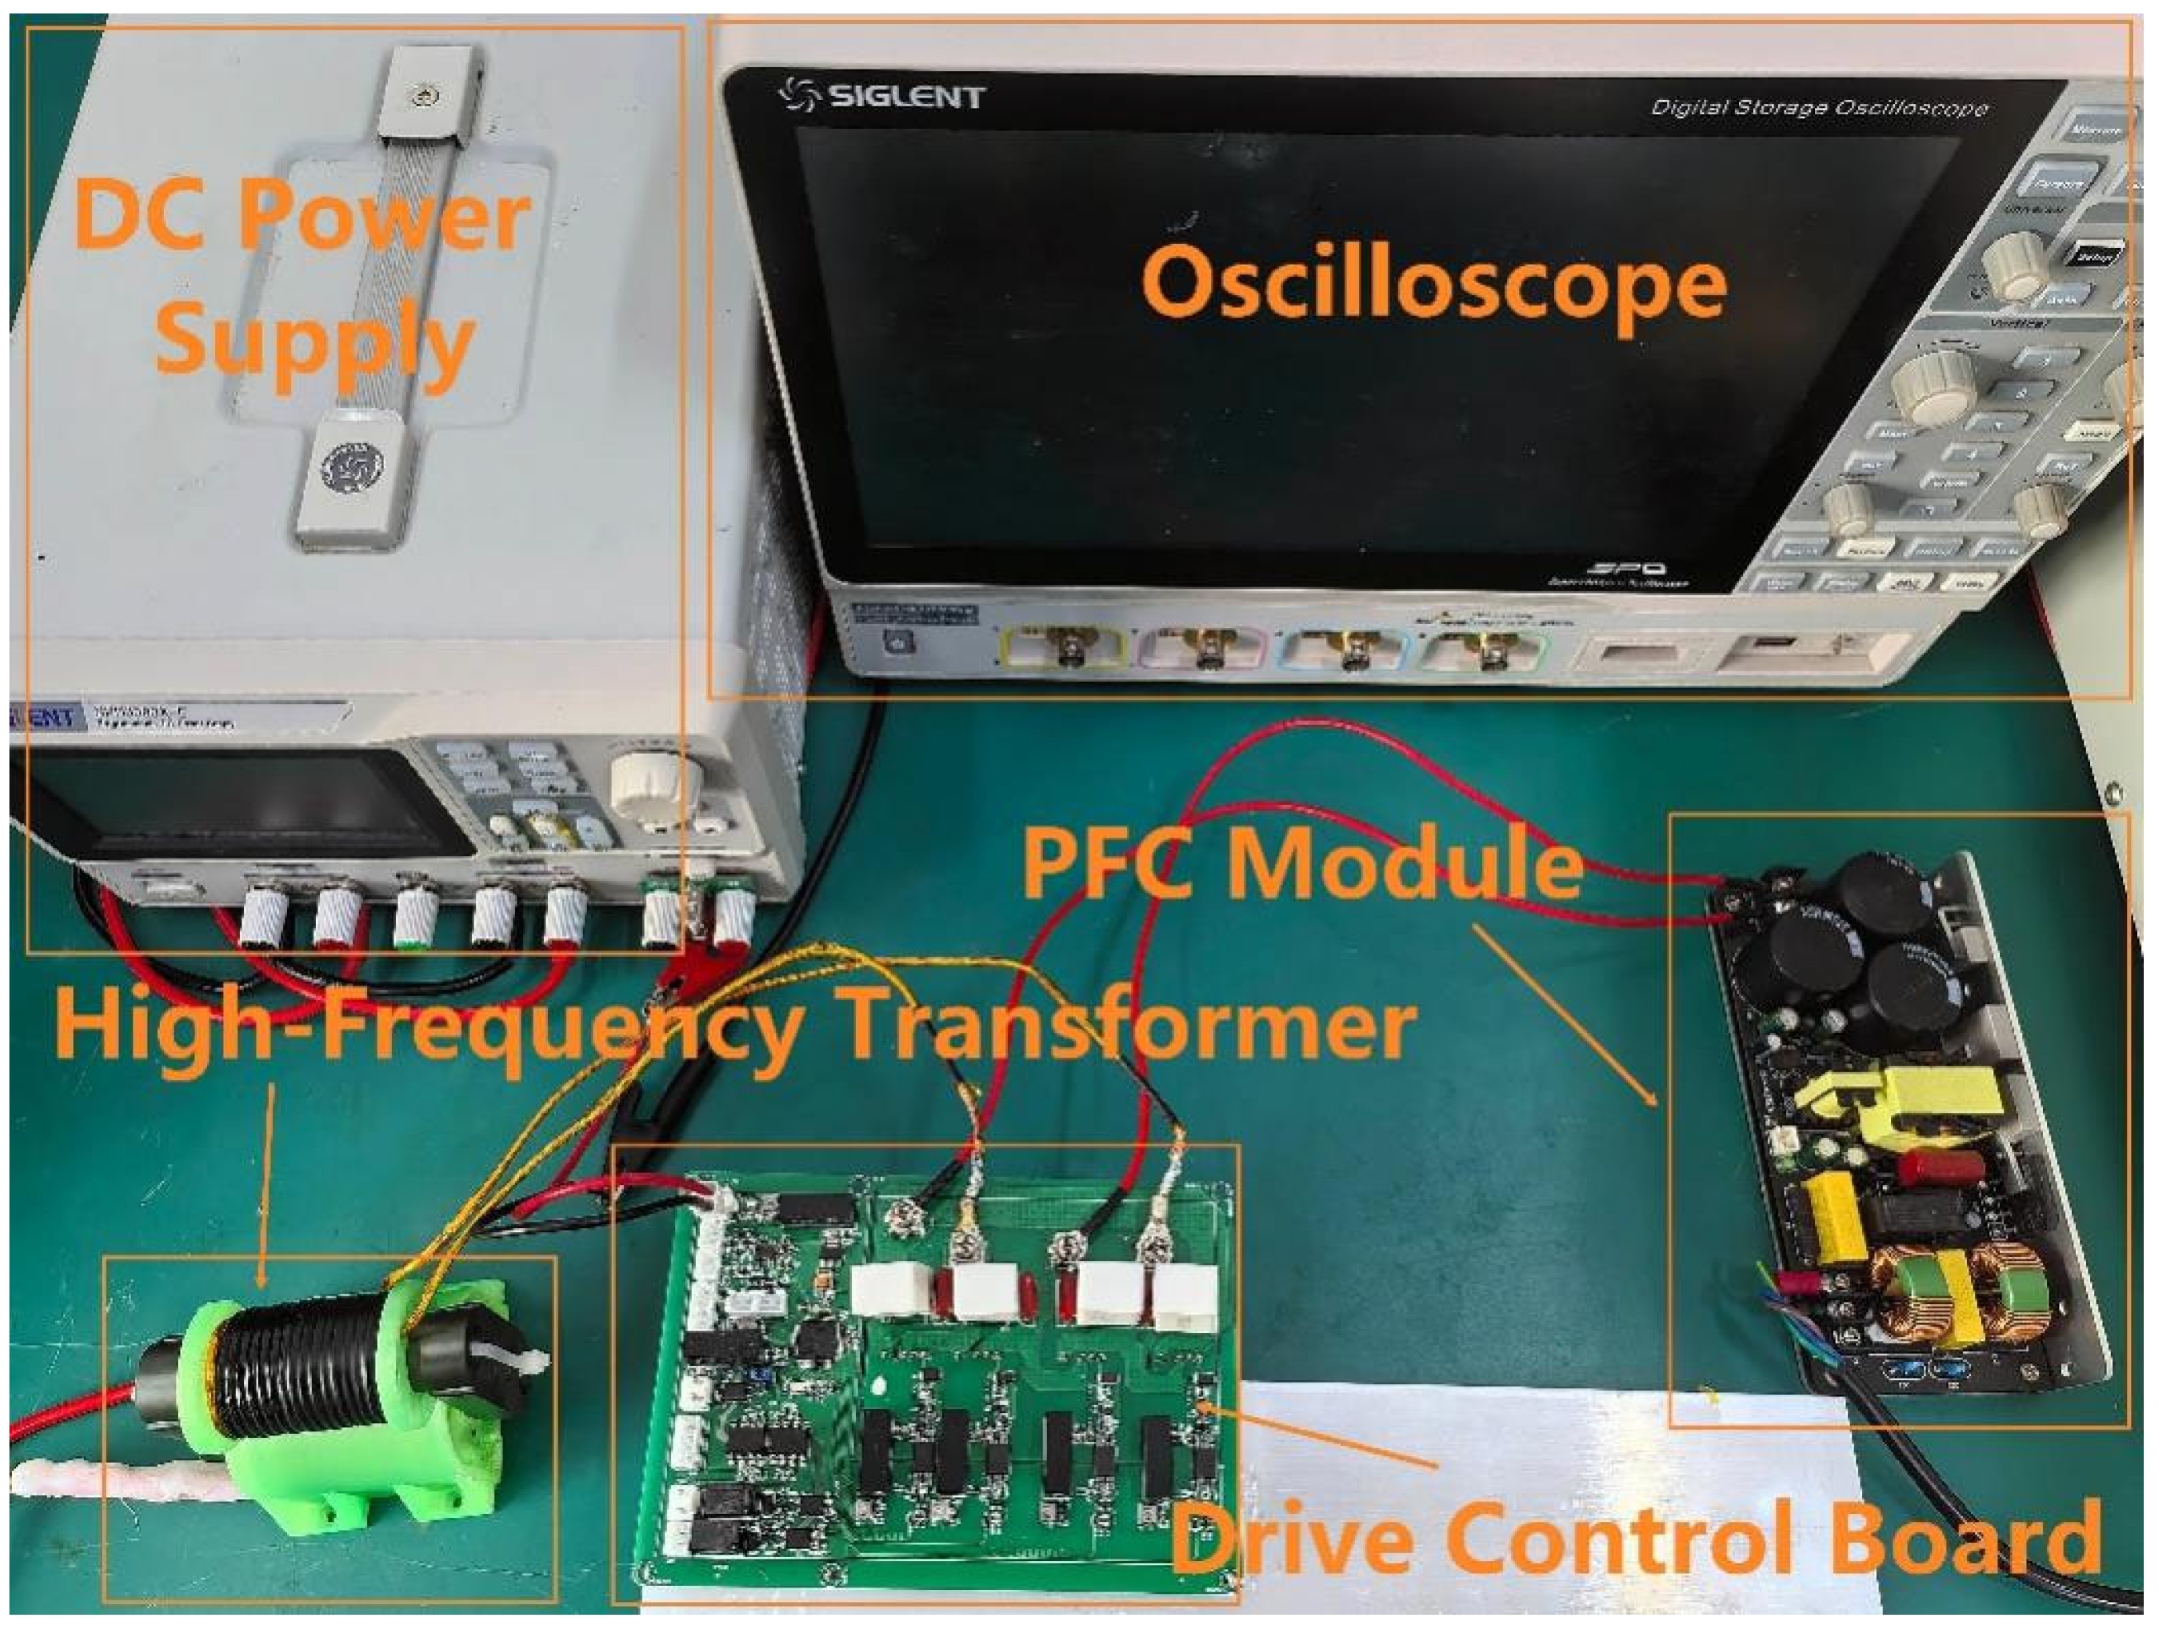
Following the topology design, component selection, and ZVS control strategy design and simulation of the dielectric barrier discharge plasma power supply system, this section focuses on the development of an engineering prototype and experimental verification. Figure 13 shows the proposed dielectric barrier discharge plasma power supply system, which mainly consists of a PFC power module, a plasma drive control board, a high-frequency transformer, an oscilloscope, and a DC power supply. The plasma drive control board is mounted on an aluminum heat sink to effectively enhance heat spreading and prevent local heat accumulation.
Figure 13.
Construction of the dielectric barrier discharge plasma power supply system.
5.1. Analysis of ZVS Soft-Switching Test Waveforms
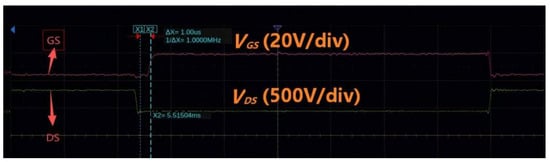
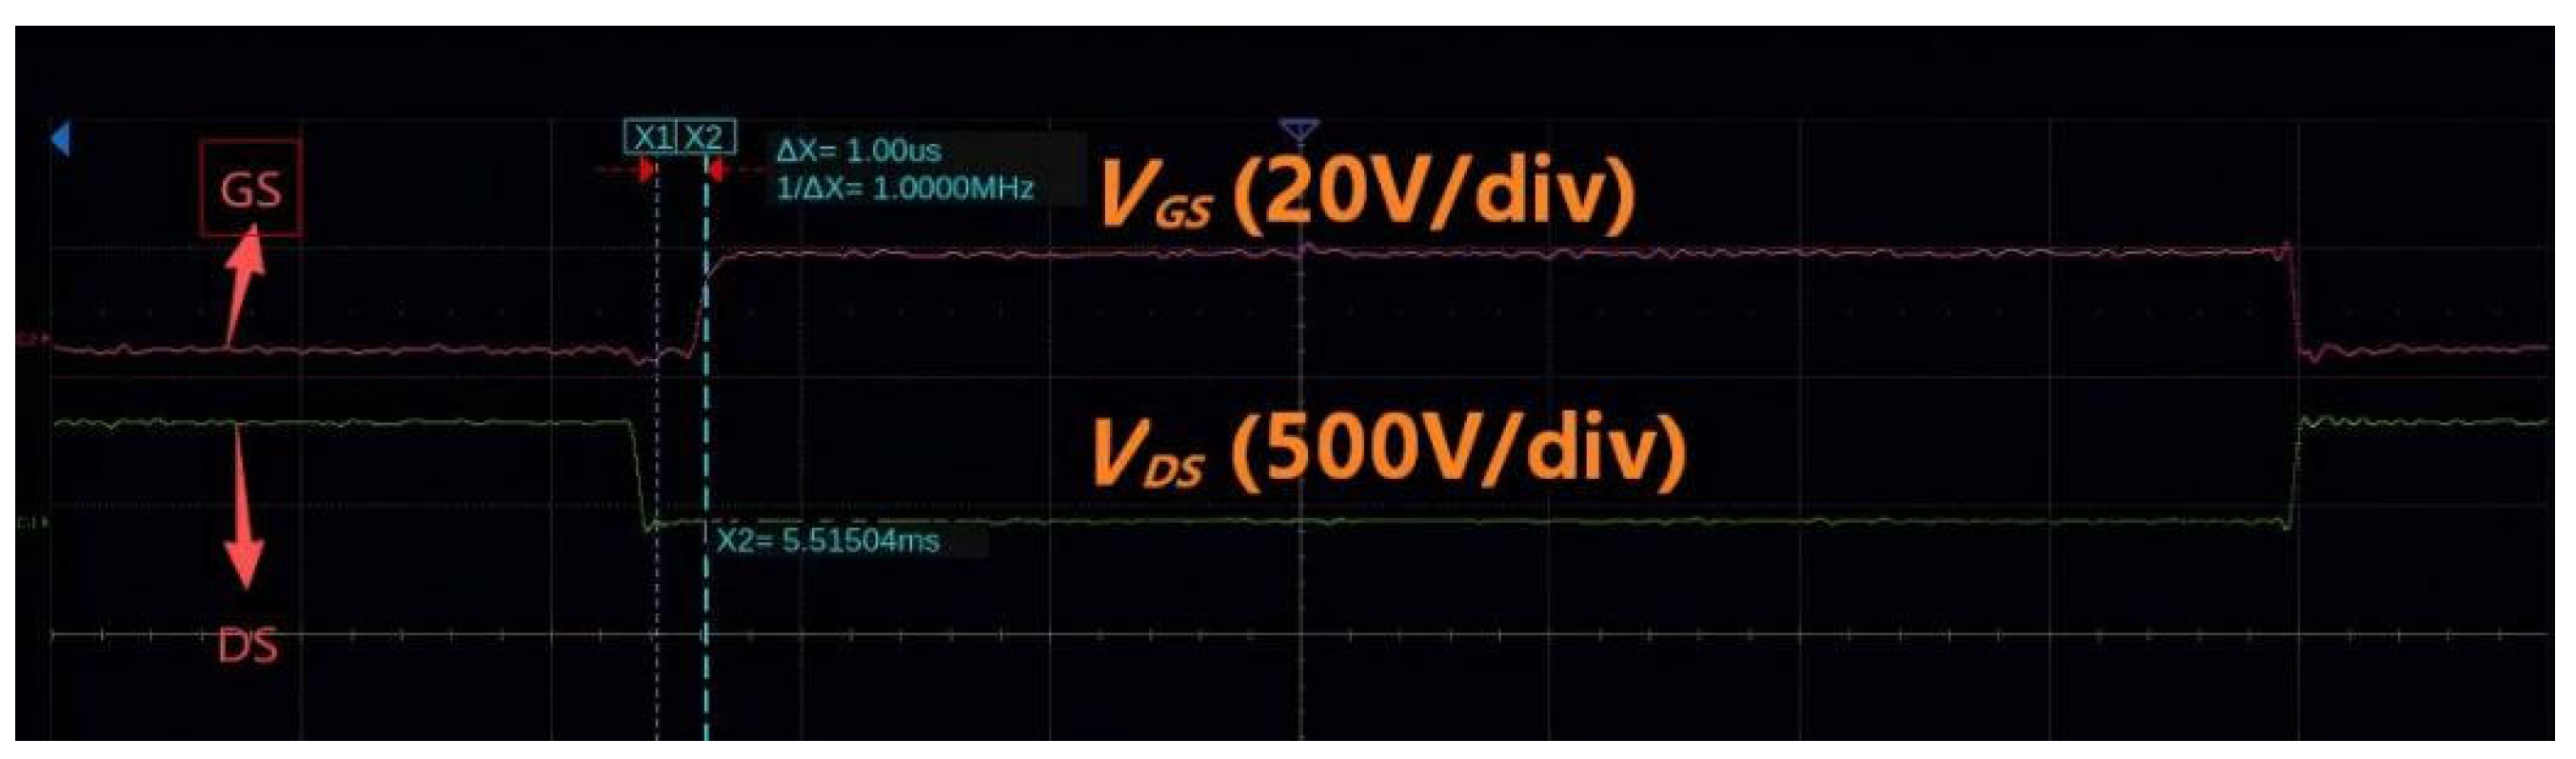
As shown in Figure 14, the oscilloscope captures the soft-switching waveforms of the full-bridge circuit. The red curve represents the gate-source drive voltage (), and the green curve represents the drain-source voltage (). At the time instant X2, it can be observed that at the moment the power switching device turns on (when the gate-source drive voltage transitions from low to high), the drain-source voltage across the device has already fallen to zero. Through the ZVS control strategy, the drain-source voltage is reduced to approximately zero before the device turns on, thereby avoiding the overlap of voltage and current inherent in hard switching, significantly reducing switching losses, and improving conversion efficiency.
Figure 14.
ZVS soft-switching test waveforms. (The red curve represents the gate-source drive voltage (), and the green curve represents the drain-source voltage ()).
In addition to the qualitative waveform analysis, quantitative measurements of switching losses were performed. The turn-on switching loss and turn-off switching loss were calculated by integrating the product of drain-source voltage and drain current during the switching transient. For the proposed ZVS-controlled system, the measured turn-on switching loss was 1.2 mJ per switching cycle, which is negligible compared to the 2.8 mJ measured under hard-switching conditions (i.e., when the dead time was set to less than the resonant period). The turn-off switching loss was measured as 1.5 mJ for the ZVS-controlled system, compared to 3.2 mJ for hard switching. The total switching loss per cycle was reduced from approximately 6.0 mJ (hard switching) to 1.62 mJ (ZVS control), representing a reduction of approximately 55%. This substantial reduction in switching losses directly contributes to the improved efficiency.
5.2. Output Waveform Testing and Analysis of the Drive Control Board
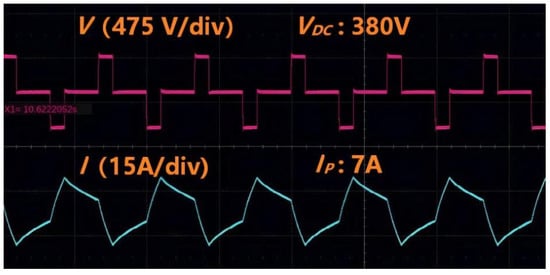
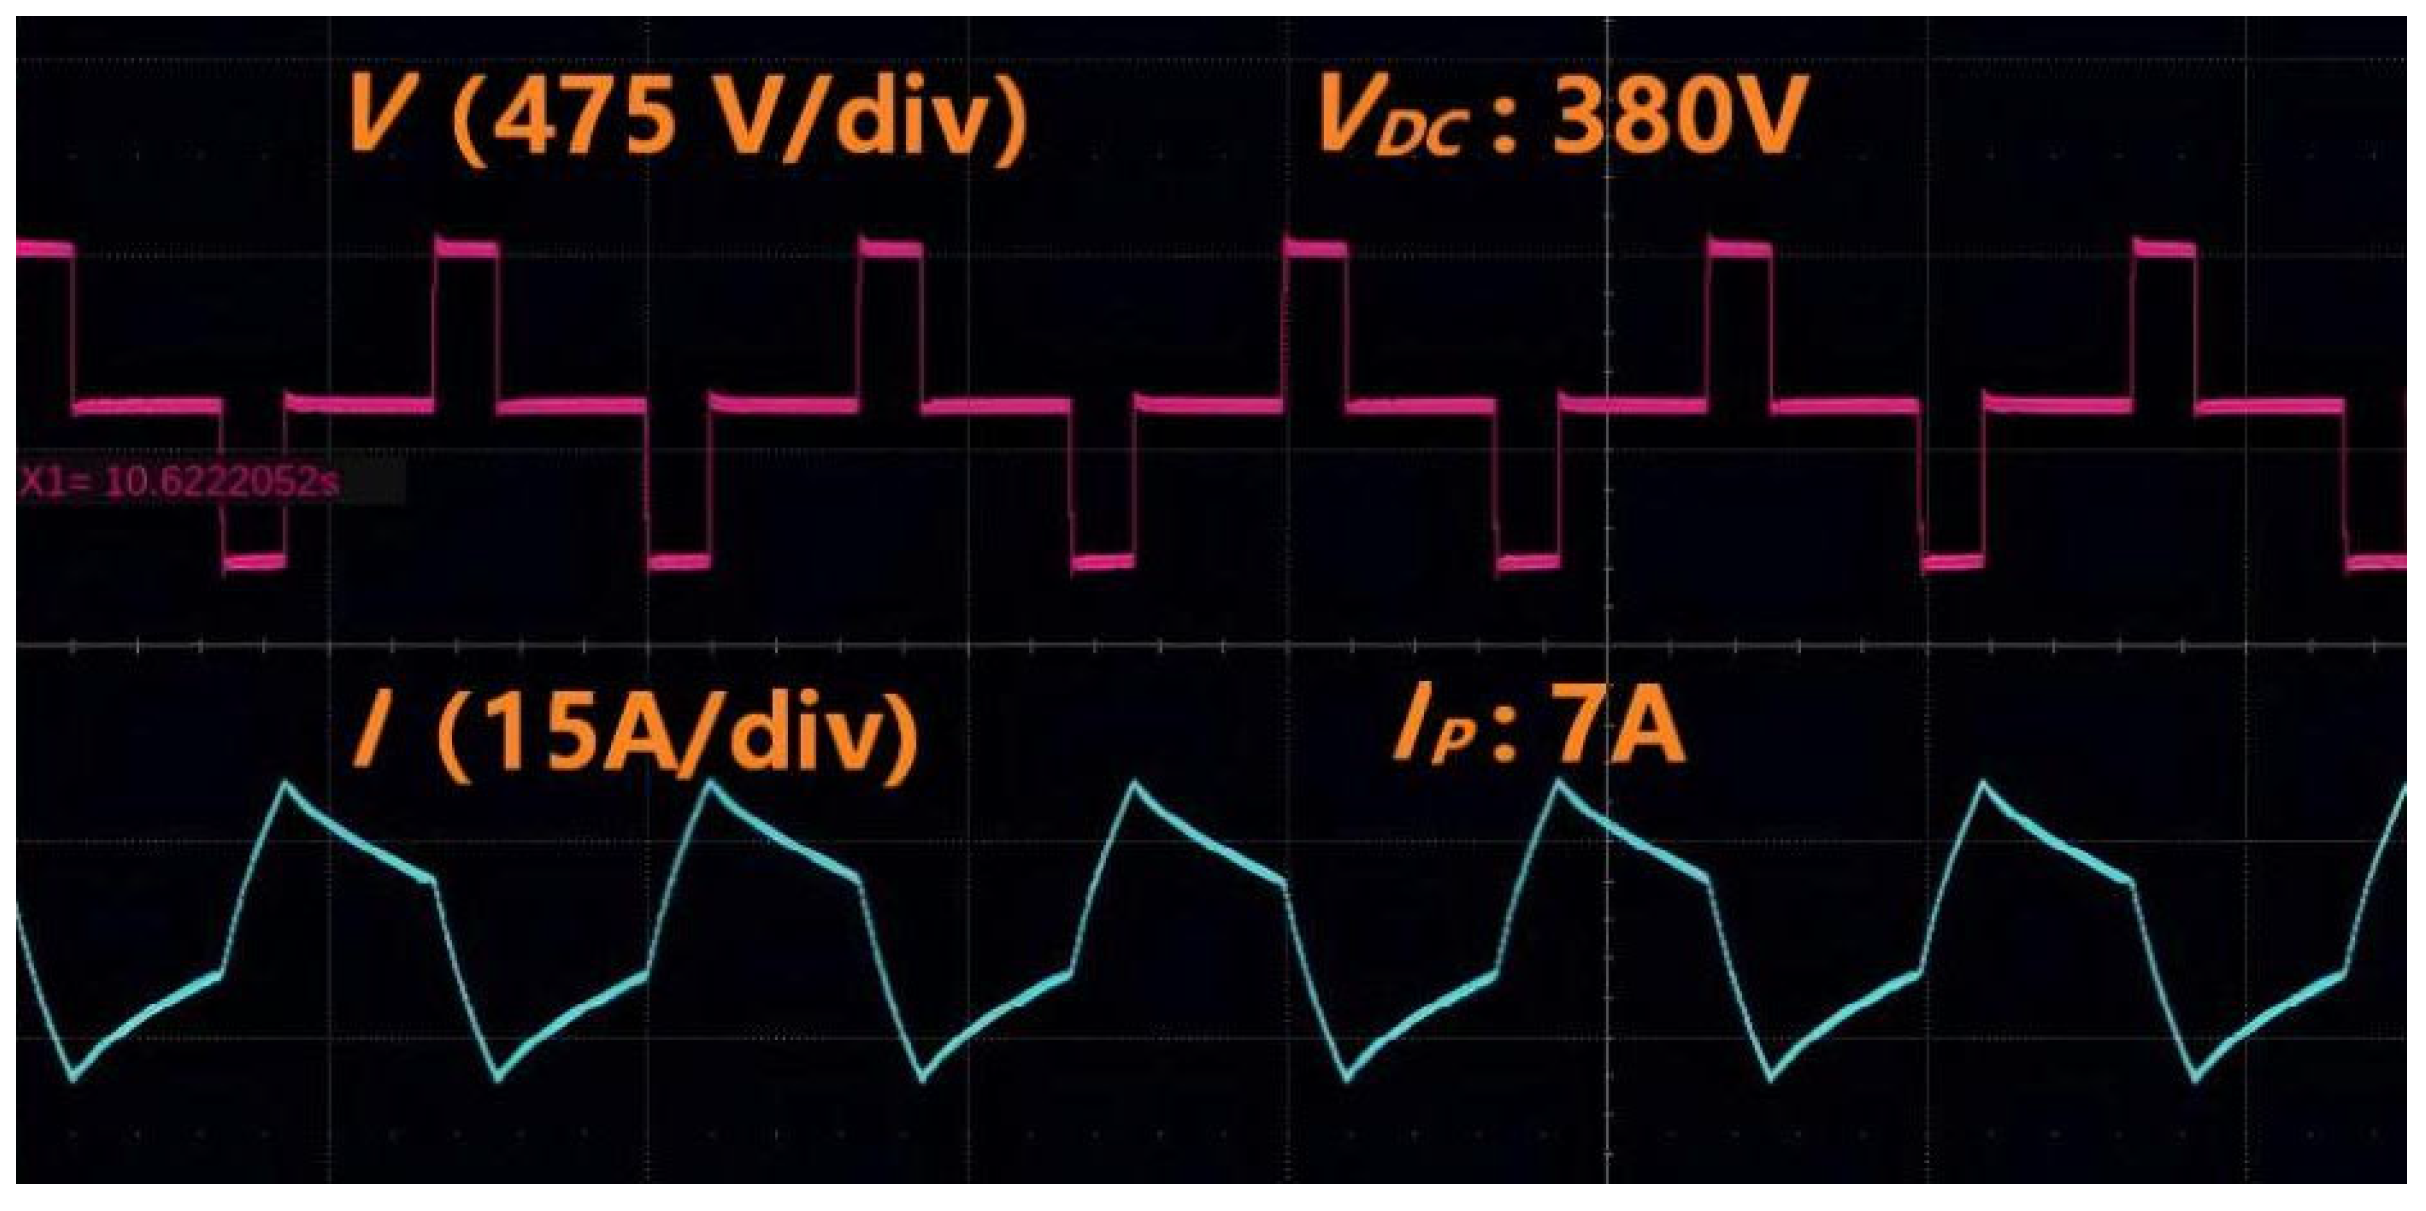
Figure 15 shows the transformer primary-side voltage signal and primary-side current signal . The output power of the transformer can be calculated from the primary-side voltage and current using Equation (5), yielding an output power .
Figure 15.
Transformer primary current and voltage waveforms.
The relationship between the primary-side DC voltage () and the secondary-side output voltage () in a phase-shifted full-bridge converter is governed by the following expression:
where n is the transformer turns ratio (23.5), and is the effective duty cycle, which accounts for both the phase shift modulation and the duty cycle loss. The effective duty cycle can be expressed as:
where φ is the phase shift angle, is the resonant inductance, is the load current reflected to the primary side, and is the switching period. The first term (2φ/π) represents the ideal duty cycle determined by the phase shift modulation, and the second term represents the duty cycle loss caused by the commutation interval. In this work, .
Thus, the output voltage is , which is close to the design target (8 kV) considering the actual transformer efficiency and parasitic effects.
5.3. Load Experimental Analysis of the Dielectric Barrier Discharge Plasma Power Supply Apparatus
When the transformer secondary voltage is applied to the upper and lower copper plates, a stable electric field is established between the plates, thereby generating plasma as shown in Figure 16. The plasma exhibits a uniform distribution and full coverage, meeting the uniformity requirements of dielectric barrier discharge.
Figure 16.
Load of the dielectric barrier discharge plasma power supply apparatus.
A non-contact temperature measurement of the case temperature on the plasma drive control board was performed using a DL333380 infrared thermometer, manufactured by Deli Group Co., Ltd. (Ningbo, China). This thermometer features fast response and high measurement accuracy. The temperature measurements were conducted under the following conditions: ambient temperature, operating frequency = 15 kHz, output peak power = 2.7 kW. The plasma generator load was operated continuously during the 5 h test period. The aluminum heat sink used for the drive control board had dimensions of 200 mm × 150 mm × 20 mm. No active cooling (e.g., forced air or liquid cooling) was employed during the measurements. The junction temperature was estimated using the relationship , where is the measured case temperature, is the estimated power loss per device (calculated from switching loss measurements and conduction losses), and is the junction-to-case thermal resistance specified in the device datasheet (0.5 °C/W for the SiC MOSFET used). The test results of the case temperature measurements and estimated junction temperature of the switching devices are presented in Table 2. The measured junction temperatures of the driving switches indicate that under prolonged continuous operation, the operating temperature of the dielectric barrier discharge plasma power supply apparatus remains within a reasonable range, demonstrating good controllability and thermal stability without significant uncontrolled temperature rise. Thus, the feasibility and reliability of the proposed dielectric barrier discharge plasma power supply apparatus under practical operating conditions are validated [47].
Table 2.
Case Temperature Measurements and Estimated Junction Temperature of the Switching Devices.
5.4. Performance Metrics and Operational Stability
To comprehensively assess the performance improvements and operational stability of the proposed system, the following key metrics were measured or calculated under nominal operating conditions (phase difference = 90°, duty cycle = 0.5, resonant inductance = 300 μH, dead time = 2 μs). Input power was measured using a JingRi DP1200 power supply, manufactured by Hangzhou Jingri Technology Co., Ltd. (Hangzhou, China), and output power was calculated from the measured primary-side voltage and current using the relationship (5). Table 3 presents the key performance parameters.
Table 3.
Key Performance Metrics.
This efficiency (93.1%) is notably higher than that of conventional hard-switching converters operating under similar conditions, which typically achieve efficiencies in the range of 70–75% due to significant switching losses. The efficiency improvement is attributed to the reduction in switching losses achieved through ZVS operation. The efficiency (93.1%) indicate that the proposed system generates high-quality output waveforms and operates efficiently from the grid, which are critical for industrial applications requiring stable and reliable power delivery.
6. Conclusions
To address the engineering challenges of high switching losses and significant device temperature rise in conventional dielectric barrier discharge plasma power supplies, this paper proposes a phase-shifted full-bridge dielectric barrier discharge plasma power supply scheme based on a ZVS control strategy, targeting the requirements of high-frequency, high-voltage, and high-power dielectric barrier discharge plasma applications. The design of the PFC power module, plasma drive control board, high-frequency transformer, and dielectric barrier discharge plasma generator load is completed. A ZVS phase-shifted full-bridge simulation model is built using PLECS, and the effects of duty cycle, phase difference, resonant inductance, and dead time on soft-switching implementation and waveform quality are systematically analyzed. The optimal combination of control parameters is determined as duty cycle of 0.5, phase difference of 90°, resonant inductance of 300 μH, and dead time of 2 μs. The key findings of this work are summarized as follows:
- (1)
- First systematic integration of optimized ZVS operation in a DBD plasma power supply at the 2.7 kW, 15 kHz power level. While PSFB-ZVS topologies are well-established in general power electronics, their application to DBD plasma power supplies with the specific constraints of high-voltage (8 kV) and nonlinear plasma loads has not been comprehensively addressed.
- (2)
- Elaborated on the optimization method of key control parameters (duty cycle, phase difference, dead time, resonant inductance) for ZVS control strategy to clear evaluating ZVS performance.
The experimental results show that the designed power supply, with an input of 220 V AC, outputs a stable DC bus voltage of 380 V after processing by the PFC module. The operating frequency reaches 15 kHz, and the transformer achieves a primary-side peak output current of 7 A, an output peak power of 2.7 kW, and a secondary-side peak output voltage of 8.9 kV, meeting the system design requirements for high frequency, high voltage, and high power. Stable ZVS soft-switching operation is realized, with the drain-source voltage of the power devices falling to nearly zero before turn-on, effectively avoiding the voltage–current overlap inherent in hard switching. Experimentally measured transformer primary voltage and current waveforms are free from distortion. The load of the dielectric barrier discharge plasma power supply generates a uniformly distributed plasma, and the junction temperature of the MOS switching devices remains within a reasonable range under prolonged operation. These results validate the feasibility and stability of the proposed power supply under high-frequency, high-voltage, and high-power conditions, providing a viable technical pathway for the efficient and engineering-oriented application of dielectric barrier discharge plasma systems.
The current study still has certain limitations. Adaptive control has not been adopted for the nonlinear dielectric barrier discharge load, resulting in insufficient operational adaptability. Future work will focus on implementing closed-loop control strategies to enhance the system’s adaptability and robustness, particularly under varying load conditions to further improve load adaptability and enhance multi-dimensional protection mechanisms, thereby promoting large-scale deployment of this power supply in fields such as exhaust gas treatment, material modification, and thin-film fabrication. In addition, we recognize that an actual DBD plasma reactor exhibits strongly nonlinear and time-varying characteristics, including frequency-dependent impedance, hysteresis, and dynamic variation in capacitance and resistance during discharge. The simplified model does not fully capture these characteristics, and the optimal parameter set obtained from simulations serves as a baseline that requires experimental tuning. In the experimental validation, the plasma load was operated under actual discharge conditions, and the observed uniform plasma generation and stable ZVS operation confirm the practical applicability of the optimized parameters. Nevertheless, the lack of a detailed nonlinear plasma load model in the simulation is a limitation of the current study, and future work will focus on developing more accurate equivalent circuit models of DBD plasma loads for simulation-based design and optimization.
Author Contributions
Conceptualization, J.X. and X.X.; methodology, J.X. and X.X.; software, K.C. and S.L.; validation, X.X. and K.C.; formal analysis, K.C. and Z.K.; investigation, X.X. and K.C.; resources, J.X. and X.X.; data curation, X.X. and S.L.; writing—original draft preparation, X.X.; writing—review and editing, J.X. and X.X.; visualization, S.L. and Z.K.; supervision, J.X. and X.X.; project administration, J.X. and X.X.; funding acquisition, J.X. All authors have read and agreed to the published version of the manuscript.
Funding
This research was supported by the National Natural Science Foundation of China (62164004) and the Plasma Generator Technology Development Project (CD24181X).
Data Availability Statement
Additional data are available upon request by contacting the corresponding author of this manuscript.
Conflicts of Interest
The authors declare that there are no conflicts of interest regarding the publication of this paper.
References
- Li, D.; Mao, X.; Huang, X. Effects of Reactor Geometry on Plasma-Assisted Ammonia Decomposition in Coaxial DBD Reactors at Low Pressures. Energies 2026, 19, 2171. [Google Scholar] [CrossRef] [Scilit]
- Su, C.-F.; Liu, C.-T.; Wu, J.-S.; Ho, M.-T. Development of a High-Power-Factor Power Supply for an Atmospheric-Pressure Plasma Jet. Electronics 2021, 10, 2119. [Google Scholar]
- Cai, X.; Fu, Z.; Xie, H.; Xue, J.; Ding, D.; Ou, N.; Zhou, G. Resonant Power Supply for Plasma Cleaning Based on Fuzzy Logic Power Tracking. Appl. Sci. 2022, 12, 4681. [Google Scholar] [CrossRef] [Scilit]
- Neretti, G.; Ricco, M. Self-Tuning High-Voltage and High-Frequency Sinusoidal Power Supply for Dielectric Barrier Discharge Plasma Generation. Electronics 2019, 8, 1137. [Google Scholar]
- Safder, M.U.; Rizvi, S.T.; Meng, Y. Low-frequency ac power transmission and distribution for subsea application using hexverter. Electronics 2020, 9, 61. [Google Scholar] [CrossRef] [Scilit]
- Wang, H.; Shang, M.; Khaligh, A. A PSFB-based integrated PEV onboard charger with extended ZVS range and zero duty cycle loss. IEEE Trans. Ind. Appl. 2016, 53, 585–595. [Google Scholar] [CrossRef] [Scilit]
- Cai, K.; Xiao, J.; Su, X.; Tang, Q.; Deng, H. Encapsulation process and dynamic characterization of SiC half-bridge power module: Electro-thermal co-design and experimental validation. Micromachines 2025, 16, 824. [Google Scholar] [PubMed]
- Cai, K.; Xiao, J.; Yang, Z. Three-level All-SiC high-frequency high-voltage plasma power supply system. Energies 2025, 18, 1617. [Google Scholar]
- Li, H.; Peng, F.Z.; Lawler, J.S. A natural ZVS medium-power bidirectional DC-DC converter with minimum number of devices. IEEE Trans. Ind. Appl. 2003, 39, 525–535. [Google Scholar]
- Kim, J.M.; Lee, J.; Ryu, K. Power device temperature-balancing control method for a phase-shift full-bridge converter. Energies 2020, 13, 1623. [Google Scholar]
- Zhao, L.; Li, H.; Hou, Y. Operation analysis of a phase-shifted full-bridge converter during the dead-time interval. IET Power Electron. 2016, 9, 1777–1783. [Google Scholar]
- Yang, J.W.; Do, H.L. Soft-switching dual-flyback DC–DC converter with improved efficiency and reduced output ripple current. IEEE Trans. Ind. Electron. 2017, 64, 3587–3594. [Google Scholar]
- Han, J.; Xu, N.; Yu, J. Energy autonomous paper modules and functional circuits. Energy Environ. Sci. 2022, 15, 5069–5081. [Google Scholar] [CrossRef] [Scilit]
- Yun, C.S.; Kim, B.C.; Kim, K.H. Reducing the high frequency transformer losses in an FB ZVT PWM converter. IEE Proc.-Electr. Power Appl. 2002, 149, 161–164. [Google Scholar] [CrossRef] [Scilit]
- Jin, K.; Ruan, X. Hybrid full-bridge three-level LLC resonant converter—A novel DC–DC converter suitable for fuel-cell power system. IEEE Trans. Ind. Electron. 2006, 53, 1492–1503. [Google Scholar]
- Zhou, Y.; He, X.; Sheng, L. Full-bridge resonant converter with hybrid control for wide input voltage range applications. J. Power Electron. 2021, 21, 269–281. [Google Scholar]
- Jiang, Y.; Wang, L.; Wang, Y. Phase-locked loop combined with chained trigger mode used for impedance matching in wireless high power transfer. IEEE Trans. Power Electron. 2019, 35, 4272–4285. [Google Scholar] [CrossRef] [Scilit]
- Mohapatra, K.K.; Gupta, R.; Thuta, S. New Research on AC–AC Converters without Intermediate Storage and Their Applications in Power-Electronic Transformers and AC Drives. IEEJ Trans. Electr. Electron. Eng. 2009, 4, 591–601. [Google Scholar]
- Dudrik, J.; Pastor, M.; Lacko, M. High-frequency soft-switching PWM DC-DC converter with active output rectifier operating as a current source for arc welding applications. Electr. Power Compon. Syst. 2017, 45, 681–691. [Google Scholar]
- Costi, T.A.; Zlatić, V. Thermoelectric transport through strongly correlated quantum dots. Phys. Rev. B—Condens. Matter Mater. Phys. 2010, 81, 235127. [Google Scholar] [CrossRef] [Scilit]
- Senthilnathan, S.; Selvaraj, R.J.; Patel, R. Noninvasive determination of HV interval using magnetocardiography. Pacing Clin. Electrophysiol. 2017, 40, 568–577. [Google Scholar] [CrossRef] [Scilit] [PubMed]
- Escudero, M.; Kutschak, M.A.; Meneses, D. A practical approach to the design of a highly efficient PSFB DC–DC converter for server applications. Energies 2019, 12, 3723. [Google Scholar]
- Zhao, L.; Li, H.; Yu, Y. A novel choice procedure of magnetic component values for phase shifted full bridge converters with a variable dead-time control method. Energies 2015, 8, 9655–9669. [Google Scholar] [CrossRef] [Scilit]
- Schopf, R.; Schork, N.; Amling, E. Structural characterisation of deposit layer during milk protein microfiltration by means of in-situ MRI and compositional analysis. Membranes 2020, 10, 59. [Google Scholar] [CrossRef] [Scilit] [PubMed]
- Ng, C.W.; Tam, I.C.K.; Wu, D. Thermo-economic performance of an organic rankine cycle system recovering waste heat onboard an offshore service vessel. J. Mar. Sci. Eng. 2020, 8, 351. [Google Scholar] [CrossRef] [Scilit]
- Khalil, F.A.; Anwar, S.; Asif, M. Energy management strategy for integrating photovoltaic energy in AC microgrid. J. Renew. Sustain. Energy 2018, 10, 065102. [Google Scholar] [CrossRef] [Scilit]
- Gao, T.; Wang, Y.; Gao, Y.; Sun, G.; Wang, H.; Hou, J. Hybrid Control-Based Closed-Loop Soft Start-Up Method for LLC Resonant Converters. Electronics 2023, 12, 4563. [Google Scholar]
- Huang, Z.; Tang, Y.; Guo, H. 3D printing of ceramics and graphene circuits-on-ceramics by thermal bubble inkjet technology and high temperature sintering. Ceram. Int. 2020, 46, 10096–10104. [Google Scholar]
- Lee, Y.S.; Kim, K.T.; Park, J.H. Characteristic analysis and design of novel high-frequency shell-type coaxial transformer. IET Electr. Power Appl. 2019, 13, 2027–2034. [Google Scholar]
- Tian, H.; Wang, A.; Xie, J. Numerical simulations of the Cu/Al composite plate continuous cast-rolling process. Mater. Res. Express 2018, 5, 126505. [Google Scholar]
- Yan, Y.; Zhang, Y.; Su, N. A novel data augmentation method for detection of specific aircraft in remote sensing RGB images. IEEE Access 2019, 7, 56051–56061. [Google Scholar] [CrossRef] [Scilit]
- Shi, Z.T.; Li, H.Y.; Li, Y. Modeling and simulation of a novel variable frequency series resonance withstand voltage test. J. Electr. Eng. 2020, 8, 131. [Google Scholar]
- Johnson, G.E.; Gunaratne, D.; Laskin, J. Soft-and reactive landing of ions onto surfaces: Concepts and applications. Mass Spectrom. Rev. 2016, 35, 439–479. [Google Scholar] [PubMed]
- Zhao, B.; Huangfu, Y.; Abramovitz, A. Derivation of OCC modulator for grid-tied single-stage buck-boost inverter operating in the discontinuous conduction mode. Energies 2020, 13, 3168. [Google Scholar]
- Li, R.; Shi, F.; Cai, X. Influence of parasitic parameters on DC–DC converters and their method of suppression in high frequency link 35 kV PV systems. Energies 2019, 12, 3743. [Google Scholar]
- Li, F.; Hao, R.; Lei, H. The influence of parasitic components on LLC resonant converter. Energies 2019, 12, 4305. [Google Scholar] [CrossRef] [Scilit]
- Everts, J. Closed-form solution for efficient ZVS modulation of DAB converters. IEEE Trans. Power Electron. 2016, 32, 7561–7576. [Google Scholar] [CrossRef] [Scilit]
- Xu, C.; Ma, Q.; Xu, P. Shaping SiC MOSFET voltage and current transitions by intelligent control for reduced emi generation. Electronics 2019, 8, 508. [Google Scholar] [CrossRef] [Scilit]
- Kim, E.S.; Joe, K.Y.; Kye, M.H. An improved soft-switching PWM FB DC/DC converter for reducing conduction losses. IEEE Trans. Power Electron. 1999, 14, 258–264. [Google Scholar]
- Lee, I.O.; Moon, G.W. Phase-shifted PWM converter with a wide ZVS range and reduced circulating current. IEEE Trans. Power Electron. 2012, 28, 908–919. [Google Scholar] [CrossRef] [Scilit]
- Dong, M.; Tian, X.; Li, L. Model-based current sharing approach for DCM interleaved flyback micro-inverter. Energies 2018, 11, 1685. [Google Scholar] [CrossRef] [Scilit]
- Tao, H.; Zhang, Y.; Ren, X. A novel circuit of marine controlled-source electromagnetic transmitter. Electr. Power Compon. Syst. 2016, 44, 1063–1070. [Google Scholar] [CrossRef] [Scilit]
- Qin, W.; Wu, X.; Zhang, J. Current-feed single-switch forward resonant DC transformer (DCX) with secondary diode-clamping. IEEE Trans. Ind. Electron. 2017, 64, 7790–7799. [Google Scholar]
- Yang, Z.; Forrester, J.; Davidson, J.N. Resonant current estimation and phase-locked loop feedback design for piezoelectric transformer-based power supplies. IEEE Trans. Power Electron. 2020, 35, 10466–10476. [Google Scholar]
- Alexanian, A.; Carrez, F. Differential Tx amplifier at 24 GHz in 0.13 μm CMOS technology. Microw. Opt. Technol. Lett. 2009, 51, 532–536. [Google Scholar]
- Yi, K.H. Capacitive coupling wireless power transfer with quasi-LLC resonant converter using electric vehicles’ windows. Electronics 2020, 9, 676. [Google Scholar] [CrossRef] [Scilit]
- Ahmad, F.; Vaccaro, L.; Nkembi, A.A.; Marchesoni, M.; Portesine, F. Surge Current Analysis of High-Power Press Pack Diodes: Junction Temperature and Forward-Voltage Modeling. Electronics 2025, 14, 4899. [Google Scholar]

Disclaimer/Publisher’s Note: The statements, opinions and data contained in all publications are solely those of the individual author(s) and contributor(s) and not of MDPI and/or the editor(s). MDPI and/or the editor(s) disclaim responsibility for any injury to people or property resulting from any ideas, methods, instructions or products referred to in the content. |
© 2026 by the authors. Licensee MDPI, Basel, Switzerland. This article is an open access article distributed under the terms and conditions of the Creative Commons Attribution (CC BY) license.