Article

Trust and Signaling: An Exploratory Study of Residential Attitudes Towards Energy Efficiency Advisors and Outdoor Media

Department of Public Administration, Portland State University, Portland, OR 97207, USA
*
Author to whom correspondence should be addressed.
Energies 2026, 19(13), 3117; https://doi.org/10.3390/en19133117
Submission received: 16 February 2026 / Revised: 22 April 2026 / Accepted: 23 June 2026 / Published: 1 July 2026
(This article belongs to the Special Issue Social Dimensions of Sustainable Household Energy Consumption)

Abstract

As the building sector shifts toward community-led energy efficiency (EE) initiatives to mitigate the climate crisis, scaling adoption requires understanding behavioral drivers. This study examines key drivers of EE measure adoption: perceived non-energy benefits, trusted advisors, and behavioral signaling. This research contributes to the energy policy and social science literature by empirically linking social trust with signaling preferences. It extends existing EE adoption decision theories by identifying distinct clusters of “expert” versus “close” advisors across demographic groups. Data from an experimental survey (n = 238) in Portland, Oregon, were analyzed using principal component analysis (PCA) and multivariate regression modeling. Results indicate that saving money and better indoor air quality are the most valued benefits with significant missing survey responses for other non-energy benefits, perhaps indicating a lack of respondent understanding. While family and contractors remain the most trusted advisors, findings highlight a clear split between expert actors and close social networks. Signaling via yard signs is the most preferred method for signaling EE behavior (31%), though “super-participators” prefer multi-channel signaling. These findings suggest that practitioners should thoughtfully leverage social networks and diverse signaling media to improve the salience and increase the adoption of residential energy efficiency programs.

1. Introduction

As policymakers and the public realize that the climate crisis is accelerating, the building sector’s ability to mitigate greenhouse gas emissions is receiving increased attention. The operation of residential and commercial buildings is responsible for about 21% of global greenhouse gas (GHG) emissions and a much higher share of emissions in many global cities [1]. Experience with energy efficiency and distributed solar photovoltaics (PV) has shown that building sector GHG emissions can be cost effectively reduced, reducing pollution as well as providing utility bill savings [1,2].
In addition to being highly polluting, residential buildings are also seen as needing other policy interventions around the world. US home prices increased by 75% nationally in the decade from 2012 to 2022, with much larger increases in coastal areas [3]. Clearly new housing supply is needed. But new construction is GHG-intensive and responsible for an additional 11% of global GHG emissions mostly due to cement and iron inputs in new buildings [4]. Furthermore, newly constructed properties are expensive to buy or rent and subsequently out of reach for many low- and moderate-income families. Retrofitting existing buildings to make them more energy-efficient can therefore help address both the housing equity crisis as well as the climate crisis.
Unfortunately, historical investments in energy efficiency (EE) by building owners and occupants have been sub-optimal due to significant biases in program design as well as barriers to the implementation of utility EE retrofit programs. Utility investments in EE programs disproportionally benefit higher-income households. Morales and Nadel state:
“low-income energy efficiency programs in our database only served an average of 5% of income-eligible households in 2019, and many only receive low-cost measures.”
[5] (p. vi)
Recognizing the climate and equity crises, municipalities in the US and national governments in the EU have jumped into the regulatory arena and are designing building performance standards for larger buildings to close the energy efficiency gap [6,7]. Some local governments are going all-in on building electrification for climate change mitigation and adaptation [8]. While these new ordinances will likely improve the performance of new constructions as well as large multi-family and commercial buildings, interventions to improve the energy performance of existing, smaller residential buildings still need to be scaled up.
This research contributes to the literature on residential energy efficiency (EE) by investigating attitudes toward building energy efficiency retrofits and identifying social mechanisms that drive EE technologies’ adoption. First, the regression modeling shows no statistically significant demographic predictors of the benefits of EE adoption. However, the paper offers insights into which residents struggle to conceptualize the benefits of energy efficiency. Respondents who have low stated knowledge of EE technologies and had not taken many EE actions did not, or could not, identify consistent non-energy benefits of EE retrofits. These findings, which correlate a lack of experience with EE technologies to similar deficits of knowledge about non-energy benefits, supplement other studies that have examined residential EE information deficits [9,10].
The second contribution of this research is to join research on social trust to EE retrofit decision-making. The results reveal a clear ranking of trusted advisors for EE information: family, contractor, and friend rank highest. Factor analysis shows a clustering of perceptions of EE advisors as “close” (neighbors, co-workers, friends and family) and “expert” (contractors, utility representatives, energy technology salespeople and members of community-based organizations). The findings support other studies that show a strong relational element to energy retrofits [11,12].
Finally, this research provides original insights into how residents prefer to display their EE actions to their friends and neighbors. The survey results indicate the respondents prefer yard signs to signal their participation to neighbors, with a significant minority that prefer all outdoor media (yard sign, flag, and window sign). These findings provide important implications for the study and practice of residential building retrofits.

1.1. Theories of Information on Residential Energy Retrofits

One of the reasons that new programs and stakeholders are entering the EE policy space is due to the need for better EE theory to drive program design and implementation. Existing policies have not been able to overcome the fact that energy is seen as an “invisible” good which makes it difficult for customers to understand their everyday energy usage, and to subsequently modify their behavior to reduce their energy use. A lack of information about energy and conservation activities is pervasive. Subsequently, there is an energy efficiency “gap” where residents do not optimize investments that maximize the benefits of energy-efficient technologies [10,13,14].
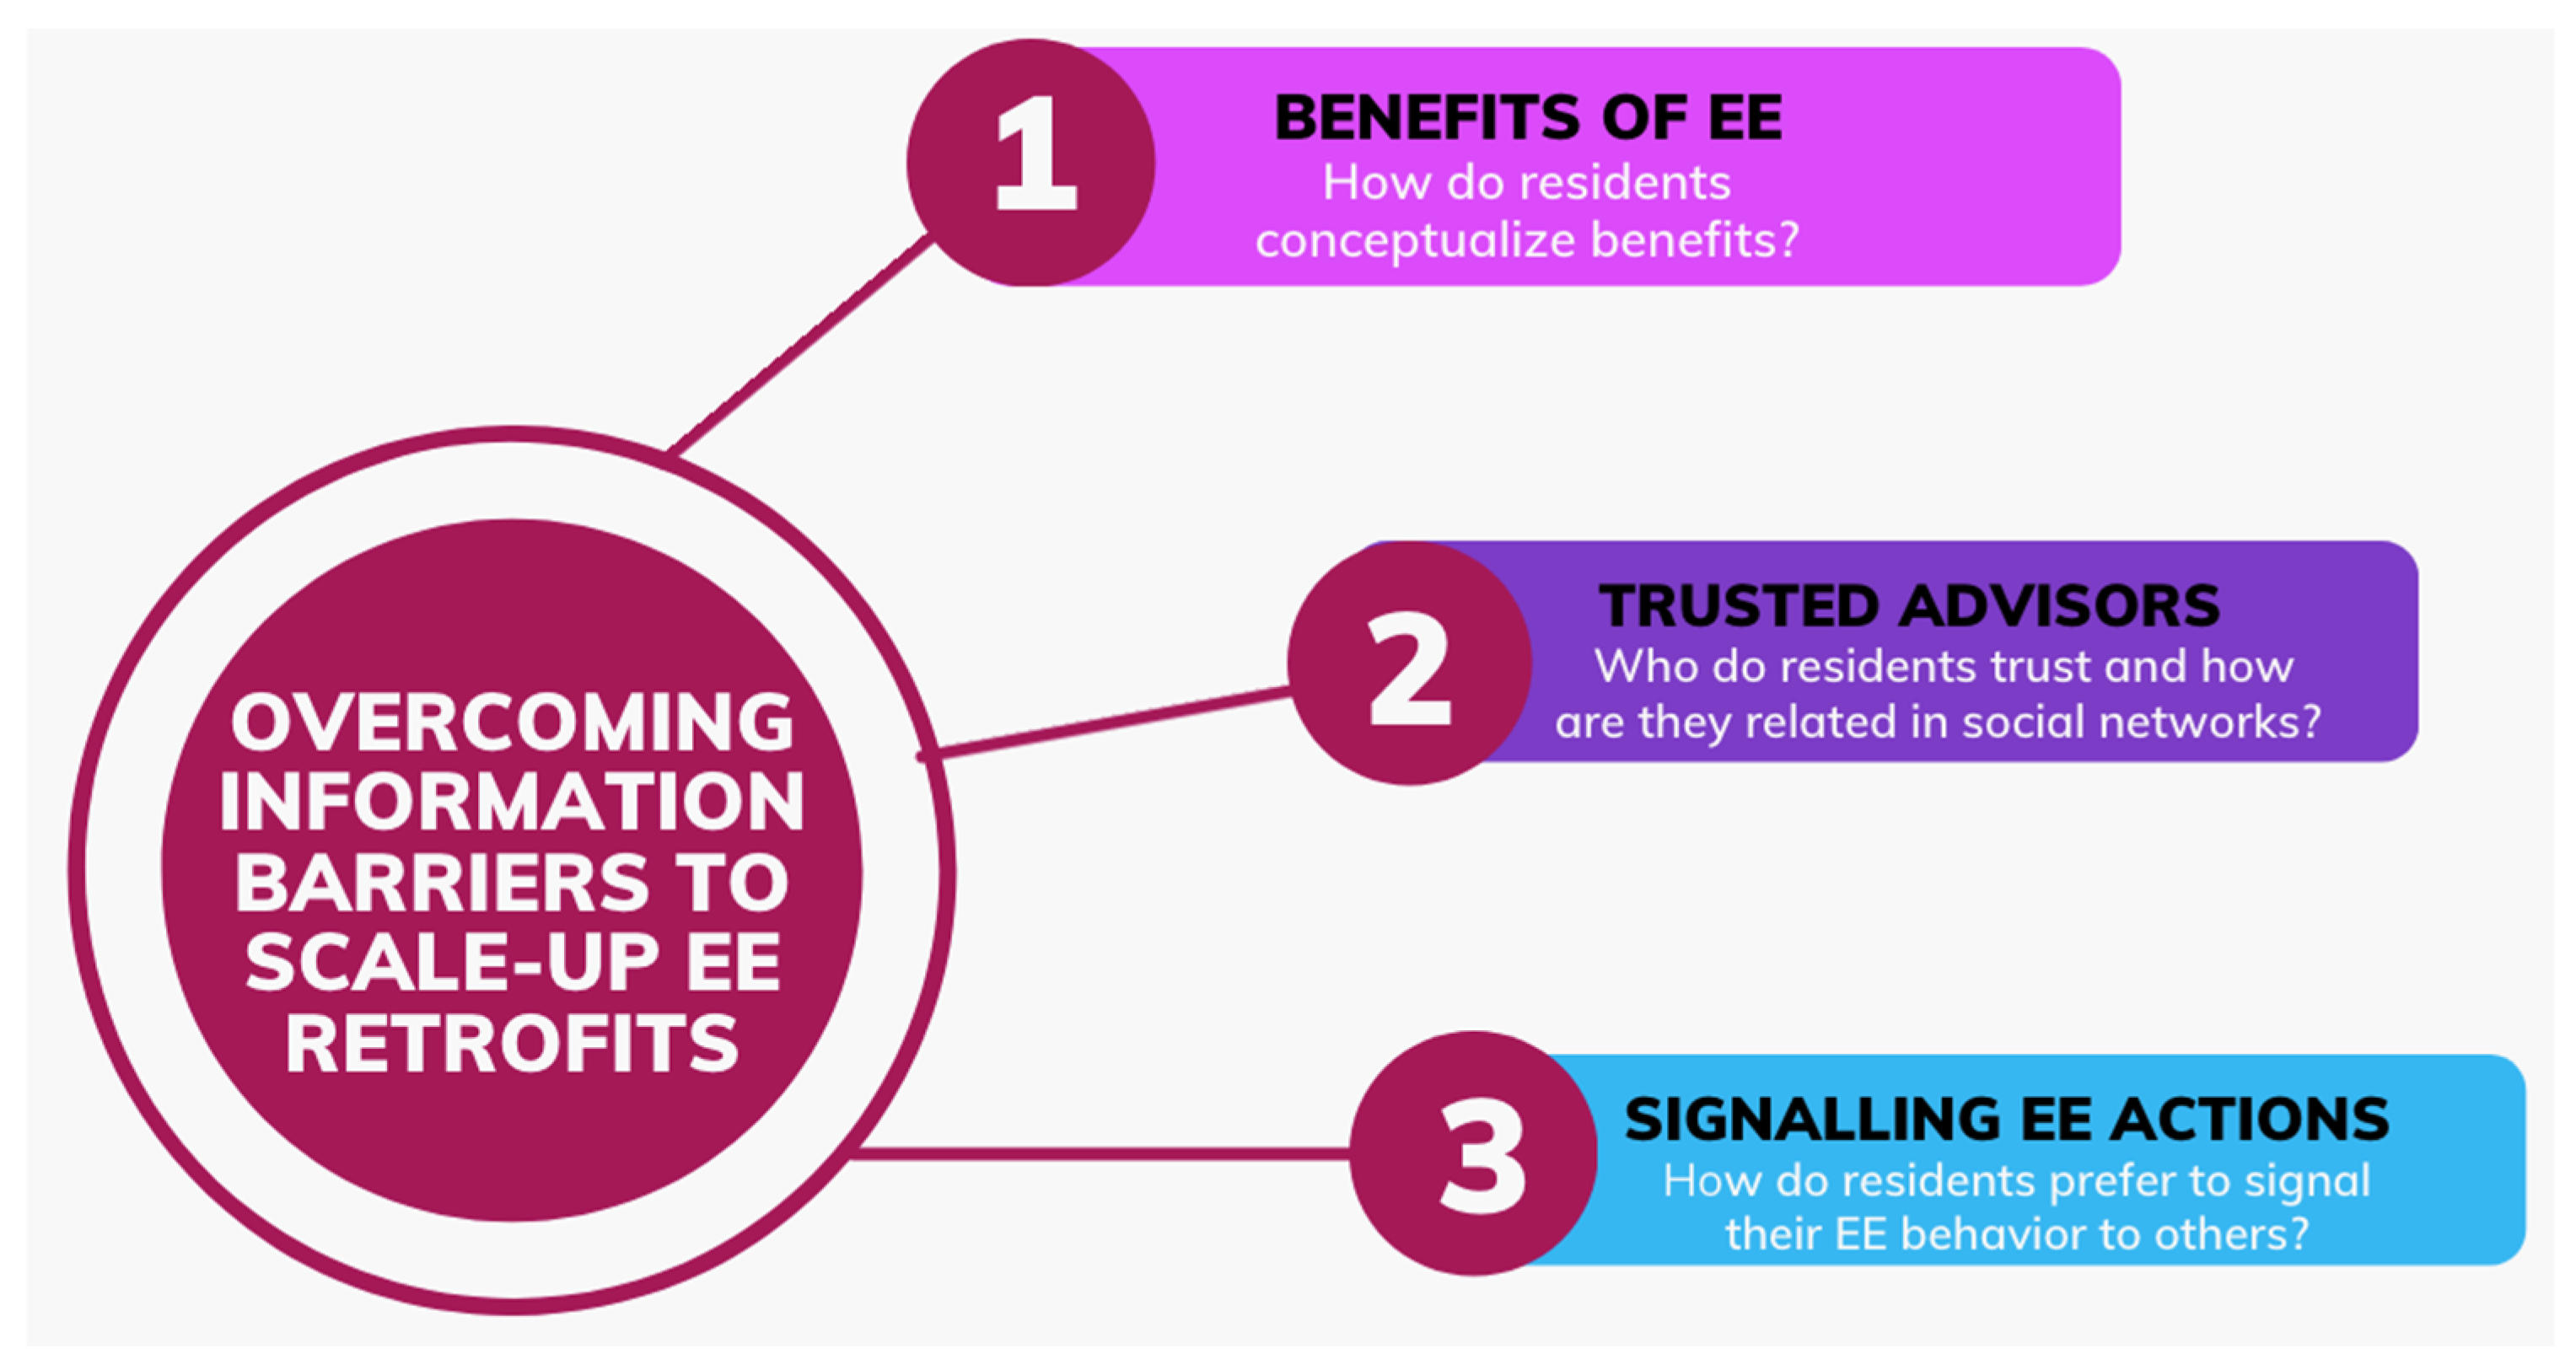
A requirement for scaling up EE programs to reduce this gap is increased resident participation. Utility marketing to residential customers has not been adequate for the task. A recent U.S. Department of Energy study in the US of 7024 homeowners found that only 9% could remember participating in a utility energy efficiency program [15]. Energy sector stakeholders are realizing what the marketing industry has known for decades as an iron law: top-of-mind matters. The explosion of rooftop solar PV and electric vehicles in affluent, liberal neighborhoods is an example of this iron law for these highly visible durable goods. Low-income neighborhoods exhibit much lower penetration of clean energy technologies. Most importantly for this research, EE retrofits occur inside the home and are not visible to neighbors. For EE retrofits to diffuse across neighborhoods they need to be made more visible and residents’ social networks need to be engaged to diffuse this information. This paper explores media and communication tools to better understand resident preferences about signaling their EE participation as well as who they trust for EE information. Figure 1 shows a diagram of the questions explored in this research.
The main theoretical domain that this research has identified that can inform our three research questions is the Theory of Planned Behavior (TPB) that serves as a major framework for understanding decision-making. The TPB posits that human actions are the direct result of behavioral intentions. According to this theory, intentions are constructed through three cognitive filters: attitudes (valuing the potential results of an action), subjective norms (responding to the social expectations of others), and perceived behavioral control (one’s perceived ability to successfully carry out the task). When a new technology is viewed as beneficial, is supported by one’s social circle, and the individual feels capable of adopting it, the likelihood of a successful adoption decision increases substantially [16]. The research regarding benefits, trust, and signaling enhances the TPB framework by showing how they can remove obstacles to forming positive intentions for residential EE upgrades.

1.1.1. The Perceived Benefits of Energy Efficiency Technologies

The TPB claims that people intentionally make rational decisions to maximize benefits and minimize costs [17]. EE technologies provide energy benefits as well as non-energy benefits, or co-benefits, to occupants. These benefits include improved occupant health, comfort, improved indoor air quality, reduced outside sound infiltration, as well as other indirect benefits such as reduced carbon emissions [18]. Outcault et al. [19] provide an exhaustive list of occupant non-energy benefits derived from the literature that can also include macroeconomic benefits like reduced import dependency [20]. Non-energy benefits are typically not monetized in utility cost-effectiveness tests, but they can be 3–7 times the magnitude of the energy benefits [21].
While energy savings may be a determining factor in making retrofit decisions, there is little information on how residential occupants conceptualize non-energy benefits. Part of the reason may be due to different research designs. Outcault et al. [19] notes that non-energy benefit studies conceptualize benefits such as comfort differently. However, after an extensive review of the predictors of energy use, Frederiks et al. [17] state that the “empirical evidence of the impact of these [socio-demographic] variables has been far from consistent and conclusive to date” (p. 573).
This research begins to investigate if residents perceive benefits as related to each other, or if they are considered distinct. Do older residents favor improved comfort, or does higher education lead to higher preferences for indoor air quality? This research question is explicated in the following way.
Research question (RQ) #1: How do residents conceptualize the benefits of energy efficiency and do conceptualizations vary by demographics?

1.1.2. Trusted Advisors

The second information barrier for residents considering adopting energy-efficient technologies is where to obtain information. Residents exhibit a deficit of accurate knowledge about energy use [9] and energy-efficient technologies [13]. Consumers also display a lack of knowledge about energy costs [10,22]. Sociologists have argued that socially constituted decision processes are more accurate for observed retrofit behavior [11,12]. This research complements sociological approaches by acknowledging that trust in the source of information matters, full stop [23]. The TPB also incorporates trust as it acts as a crucial heuristic for evaluating complex technologies, which shapes a resident’s attitudes and perceived behavioral control [16].
For energy, resident engagement on information presented in utility bills was higher for more trusted organizations [24]. Increased trust in institutions has been found in other settings to increase citizens’ willingness to pay for carbon reductions [25]. At the individual level, a lack of trust has been identified as a critical barrier to customer engagement for smart grid projects [26]. The effects of trust on adoption decisions are likely moderated by their experience with the technology. Huijts et al. [16] state:
When people know little about a technology, acceptance may mostly depend on trust in actors that are responsible for the technology, as a heuristic or alternative ground to base one’s opinion on.
(p. 528)
Knowledge about energy technologies can be sourced from energy experts such as utility representatives and contractors in addition to members of residents’ social networks. An individual who is trusted by consumers can be considered a trusted messenger [27] or “trusted advisor” [28]. This research utilizes the term trusted advisor because advisor implies a greater potential role for changing attitudes about energy. Trusted advisors possess the following qualities: (1) credibility—they provide trusted information; (2) reliability—they will carry out their obligations; and (3) customer-oriented—they put the customer’s long-term interests before their own [29].
One other question that this research contributes to is who residents trust for EE adoption information. Trust has been an important predictor of attitudinal and behavior change in other sectors, including facilities siting [30], medicine [31], healthy eating [32], and nudging consumers towards energy-efficient devices [33]. In the energy sectors, because home energy technologies—such as batteries and heat pumps—are often viewed by non-experts as complicated or risky, many households use trust as a shortcut when deciding whether to adopt them [16]. It has been well-established that trust in energy advisors matters at the organizational level [34]. But how do utility representatives, representatives of community-based organizations, and energy technology salespeople compare to friends and family and neighbors in terms of trust? In other domains, the diffusion of information and related persuasion influence tends to be stronger when people interact with members of their close social circle, such as friends, rather than strangers [35]. Information sharing is stronger with these “strong ties” (family and friends) versus “weak ties” (acquaintances) because the information is coming from a person they trust [36]. Peers are neighbors or members of residents’ social networks who residents are familiar with, likely share similar attributes with, and are more likely to trust. There are known peer effects on energy technology adoption [36]. The importance of peer effects on energy-related behavior has been extensively studied [17,27].
However, the role of technical knowledge possessed by social network members is less understood. Social media influencers might be considered (very) weak ties that are knowledgeable about the technology. Weenig et al. [34] claim that persuasive potential is higher from network ties who are knowledgeable. Network members with direct ties to a technology, like a contractor or utility representative, are likely to be more trusted and therefore have higher persuasion potential. Other research has shown that information from peer networks is less important when individuals already have strong attitudes about a topic [37]. Furthermore, while Wolske et al. [36] provide thorough review of peer influence on residential energy use, the demographics of relative trust need further exploration.
Research Question #2: What are the relative trust levels across residents’ social networks about energy-efficient technologies and do these vary by demographics and knowledge about EE technologies?

1.1.3. Neighbors as Sources of Energy Efficiency Information

Energy experts, friends, family and co-workers are not the only sources of information that residents can rely on to inform their retrofit decisions. There are “neighbor” effects for solar panels and electric vehicles whereby visible purchases are emulated by neighboring households [36,38]. Neighbors are not necessarily part of residents’ direct social networks, but they learn from viewing these technologies in their neighborhood. Rai and Robinson state that, with neighbor adoptions,
“influence accrues passively through merely witnessing [solar] PV systems in the neighborhood, increasing confidence and motivation, as well as actively through peer-to-peer communication”.
[39] (p. 1)
The neighbor effect can be substantive. One study estimated that each incremental solar panel adoption in a zip code increases an individual’s adoption propensity by nearly 0.78% [40]. One possible reason that the neighbor effect is so powerful is the segregation of neighborhoods on income and racial lines [41]. As neighbors become more similar to each other, it is likely that emulation and increased confidence and motivation are becoming more influential in adoption decisions. However, this hypothesis is beyond the scope of the current research.
A key causal driver of neighbor solar PV adoption is its visibility: more visible systems are likely to have strong peer effects [41]. Visibility is a necessary condition for the observational learning mechanism that causes the diffusion of technologies [38]. Unlike solar panels (and electric vehicles), energy efficiency retrofits are not visible on the exterior of a home and neighbors’ signals of their commitment to the technology cannot be publicly viewed. Min (2025) shows that the peer effects of heat pumps are much lower than for PV and electric vehicles [42].
Solar PV, as well as visible electric vehicles parked in driveways and streets, are forms of commitment that occur when a symbol is displayed publicly and externally [43].
An example of a commitment is the display of a yard sign in the resident’s front yard. It is well-known that yard signs are used as a sign of commitment in elections. They are more influential in changing neighbor behavior under conditions of poor information such as unknown candidates [44]. According to the TPB, this physical signaling from outdoor media is likely to create social pressure for neighbors to follow suit. This pressure could come through several related causal mechanisms including the development of descriptive social norms that make EE actions seem common in a resident’s neighborhood. It could also be a modeling mechanism which can include learning and emulation. And finally, outdoor media could be considered to signal public commitment to EE retrofits [35].
Given that most residents have a poor understanding of what energy efficiency retrofits entail, external media is likely to be effective in signaling their commitment to the technology to their neighbors. Yard signs that demonstrate energy retrofit behavior have been used for some time by community-based organizations (CBOs) [45]. Given the importance of neighbor effects and outdoor media this research explores:
Research Question#3: What types of outdoor media do residents prefer to signal their commitment to energy efficiency?
To address RQ#3, this research explores the stated preferences for yard signs, window stickers, and flags.

2. Material and Methods

In order to investigate the three research questions above, a survey was conducted in February 2021. The survey was administered by Symmetric Sampling, a commercial survey research firm, to 434 participants. The firm claimed to have a representative sample of the Portland metro area. However, 58 of the respondents indicated that they did not reside in the Portland, Oregon metro area and another 138 surveys were incomplete, resulting in 238 usable responses (55% usable responses). The complete survey instrument can be found in the Appendix A, Appendix B and Appendix C.
Key demographics of the survey (versus the Portland metro area median in parentheses) include: age 45–54 years (39 years), female 59% (50%), completed four-year college degree or more 44% (42%), a primary language other than English spoken at home 4% (18%), number of occupants 2.4 (2.5). The demographics indicate that the sample is slightly older, more likely to be female, and more likely to speak English at home compared to median regional values [46]. Approximately 43% of the respondents were homeowners, 48% renters, and 9% other which was mainly living with friends or family. This is largely consistent with the demographics of the Portland market where 47% of residents are renters [47]. Information on detached versus attached-style buildings was not part of the survey.
The survey explored three dimensions about residents’ perceptions of energy-efficient technologies. The first was how residents perceived the benefits of energy efficiency technologies. The question asked, “Please rank the following from 1 (least important) to 6 (most important) when deciding on energy efficient technology …?”. Benefit items included less drafty, better indoor air quality (IAQ), reduced outside sounds, better indoor temperature, and saves money.
The second dimension the survey explored was the likelihood of a consumer adopting an energy-efficient technology based on who recommended it. The question asked, “How likely are you to adopt an energy efficient technology if recommended by the following people: …?”. Items included: neighbor, co-worker, friend, family member, a contractor, a representative from their utility, an energy technology salesperson, and a community-based organization.
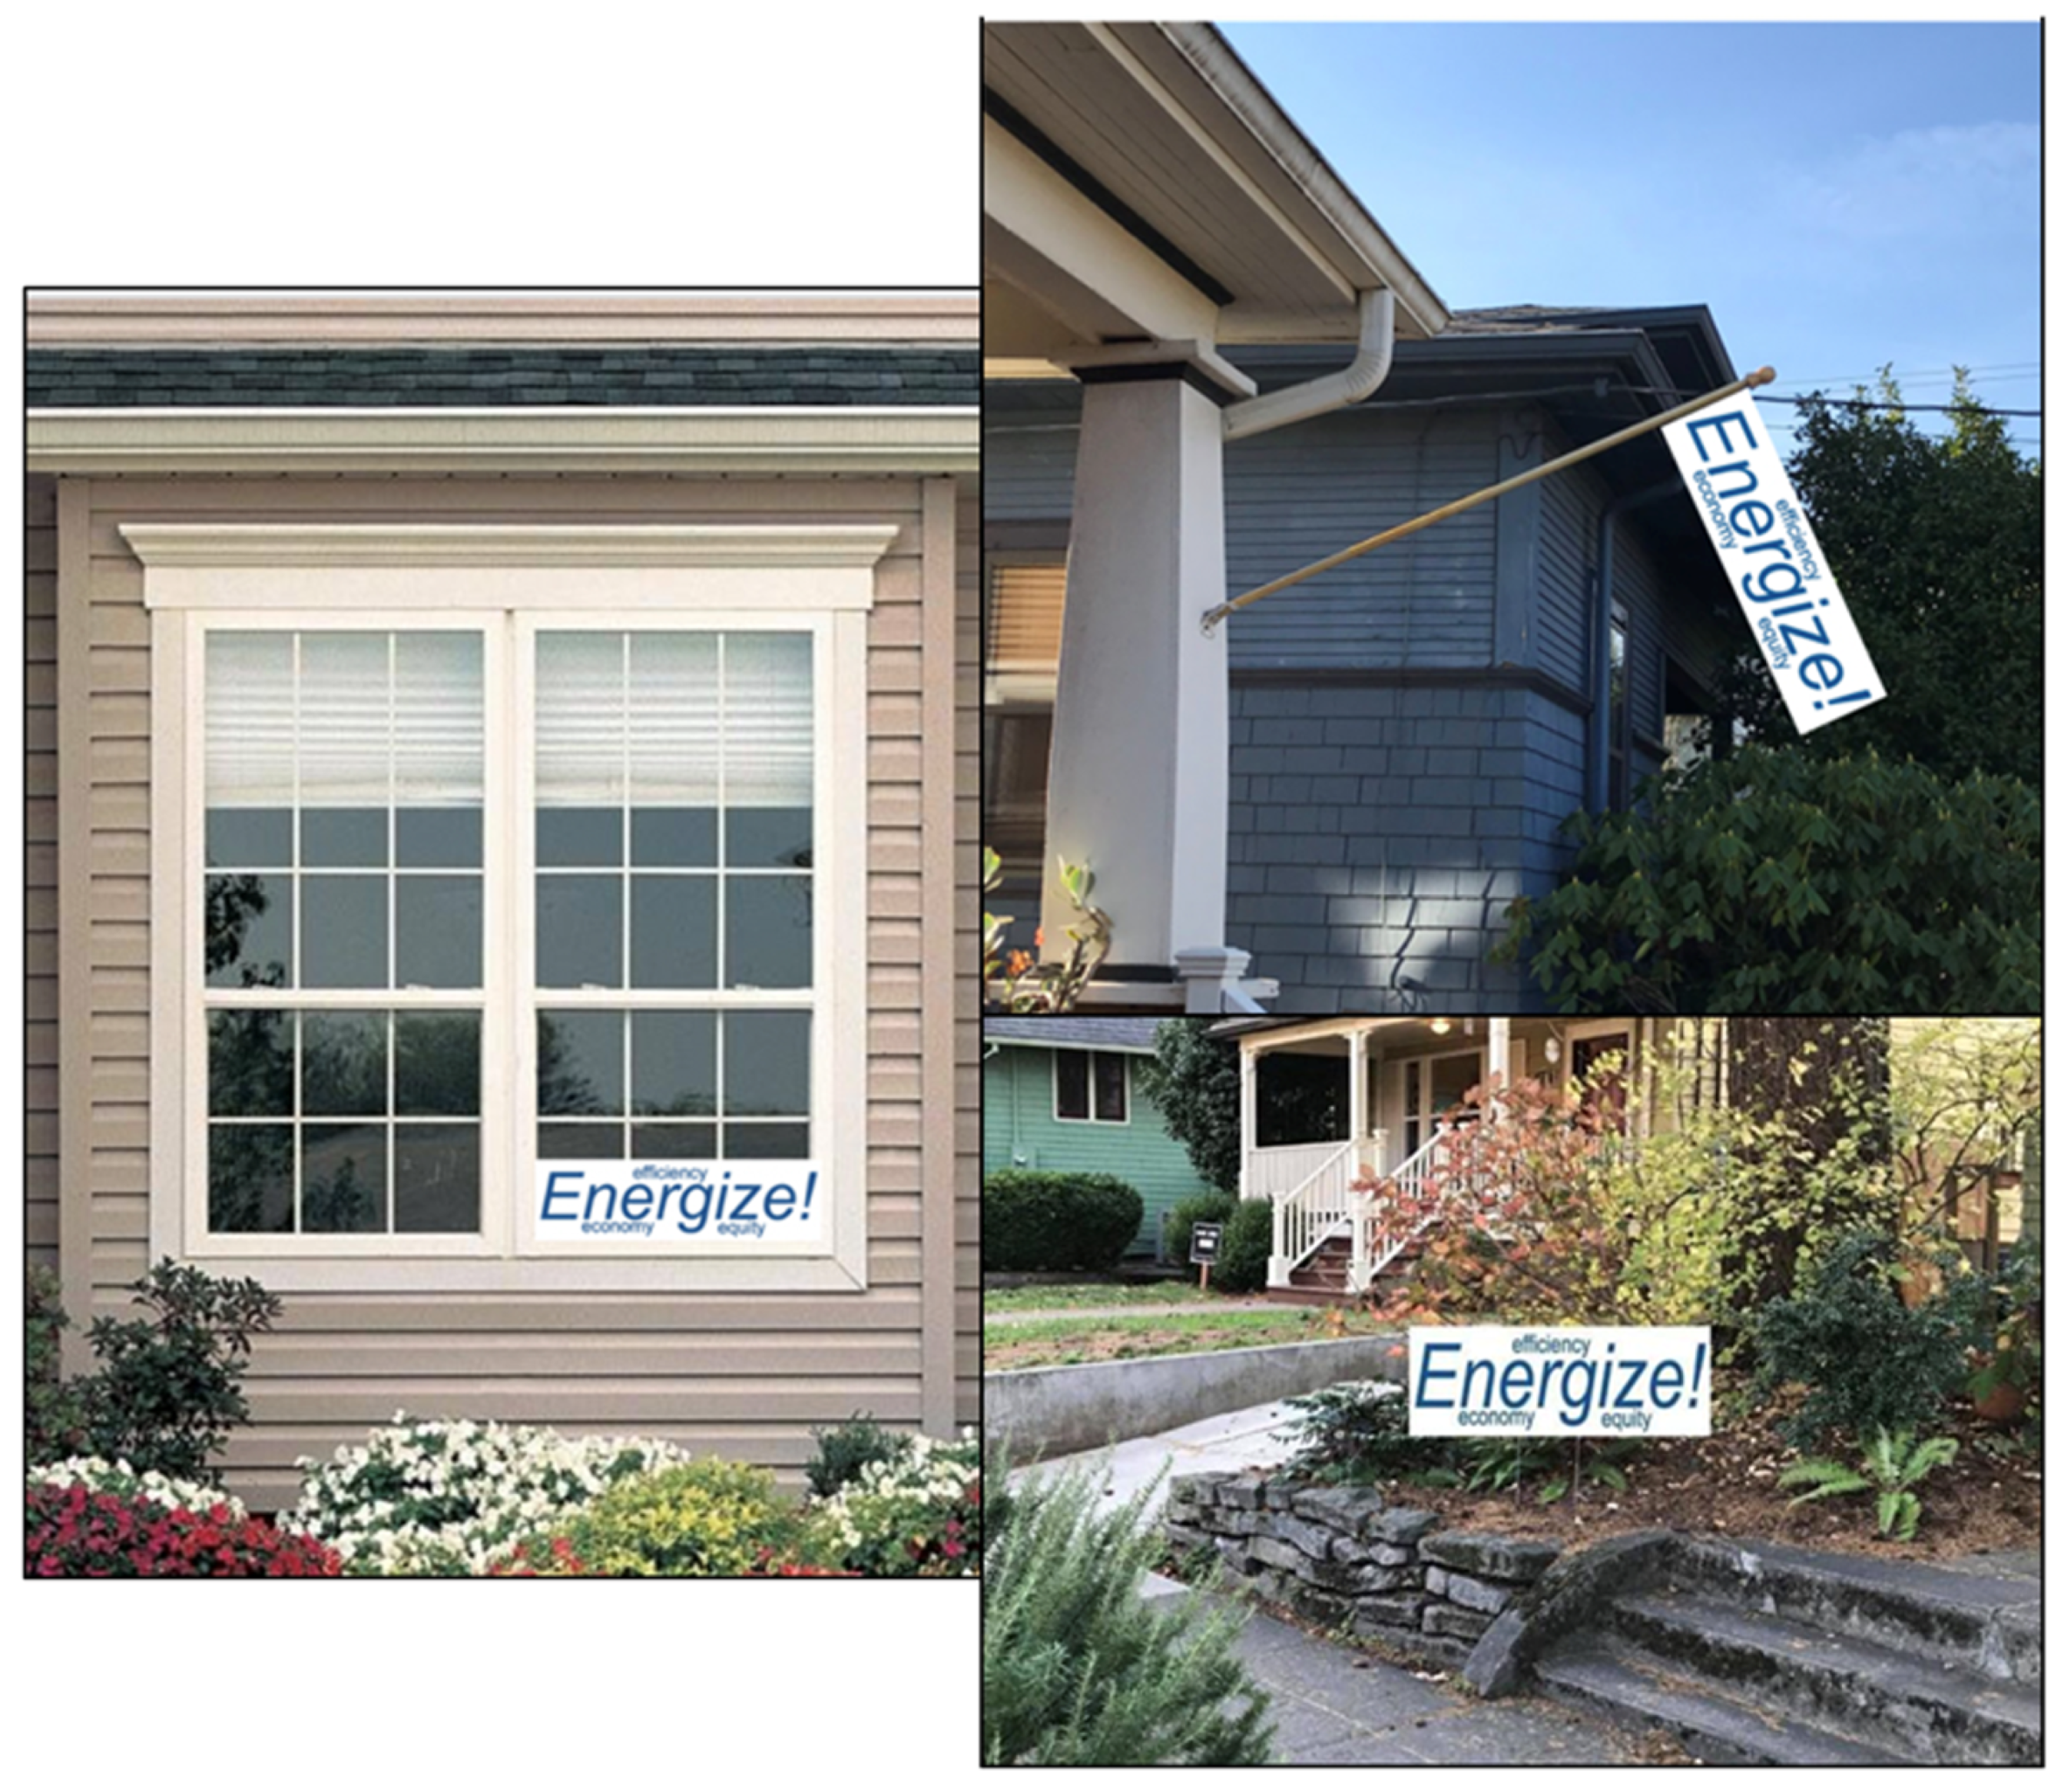
The third dimension the survey explored was participants’ stated preferences to signal to their neighbors that they had participated in a hypothetical energy efficiency program. The participants were asked to indicate whether they preferred to show a yard sign, a window sign, or a flag to show participation in “a community-led effort to help neighbors make their homes more energy efficient”. Participants were prompted to select only one option, or all the options, after being shown the images of hypothetical energy efficiency program media in Figure 2.
Respondents were also asked about their EE behavior, “What energy saving behavior(s) do you engage in at home?”, as well as their stated knowledge about EE technologies, “How much would you say you know about energy efficient technologies for your home? Some examples of this for your home might be heat pumps, water heaters and attic insulation”.

2.1. Data and Methods

As noted above, the data collection effort yielded approximately 238 completed surveys. However, the scale questions about the perceived benefits of energy efficiency recorded a much lower response rate than the balance of the survey. The authors considered if this could have been due to confusing survey question wording. As can be seen in the complete survey in the Appendix A, Appendix B and Appendix C, the benefits question included “Please rank the following from 1 (least important) to 6 (most important) when deciding on energy efficient technology (the survey will only let you pick each number only once): Reduced outdoor sounds”. The question was repeated for each benefit: better indoor air quality, less drafty, better indoor air temperature, saves money, recommended by a neighbor. While it is possible that the questions were confusing and this contributed to the lower response rate, further analysis is required because complete case analyses that delete cases with missing data (casewise deletion) can lead to biased and/or inefficient inferences using multivariate regression modeling [48]. As such, Multiple Imputations of Chained Equations (MICE) were used to impute missing responses to the EE benefit questions. Appendix A details the missing data methodology and results. The MICE approach is a best practice in multivariate regression modeling and increased the size of the regression sample by approximately 35 percent and minimized potential bias from missing data.

2.1.1. Principal Component Analyses

The scale of survey questions about trusted advisors was reduced to a usable form for the regression analysis using principal component analysis (PCA), an exploratory data analysis and data reduction tool. PCA extracts the underlying latent construct, or factor, from a panel of related survey questions [49]. Bartlett’s Test for Sphericity and the PCA Kaiser–Meyer–Olkin (KMO) test were performed to determine the suitability of the data for PCA and the results are presented in Appendix B. A varimax rotation technique was employed in Stata 17.
Recall that the eight social network questions inserted a different social network member following the shared introductory phrase: “How likely are you to adopt an energy efficient technology if recommended by the following people: …?” with 8 trusted advisors: neighbors, co-workers, friend, family member, a contractor you know, a representative from your utility, an energy technology salesperson, and a community-based organization. Responses included: extremely unlikely, moderately unlikely, slightly unlikely, neither likely nor unlikely, slightly likely, moderately likely, extremely likely.
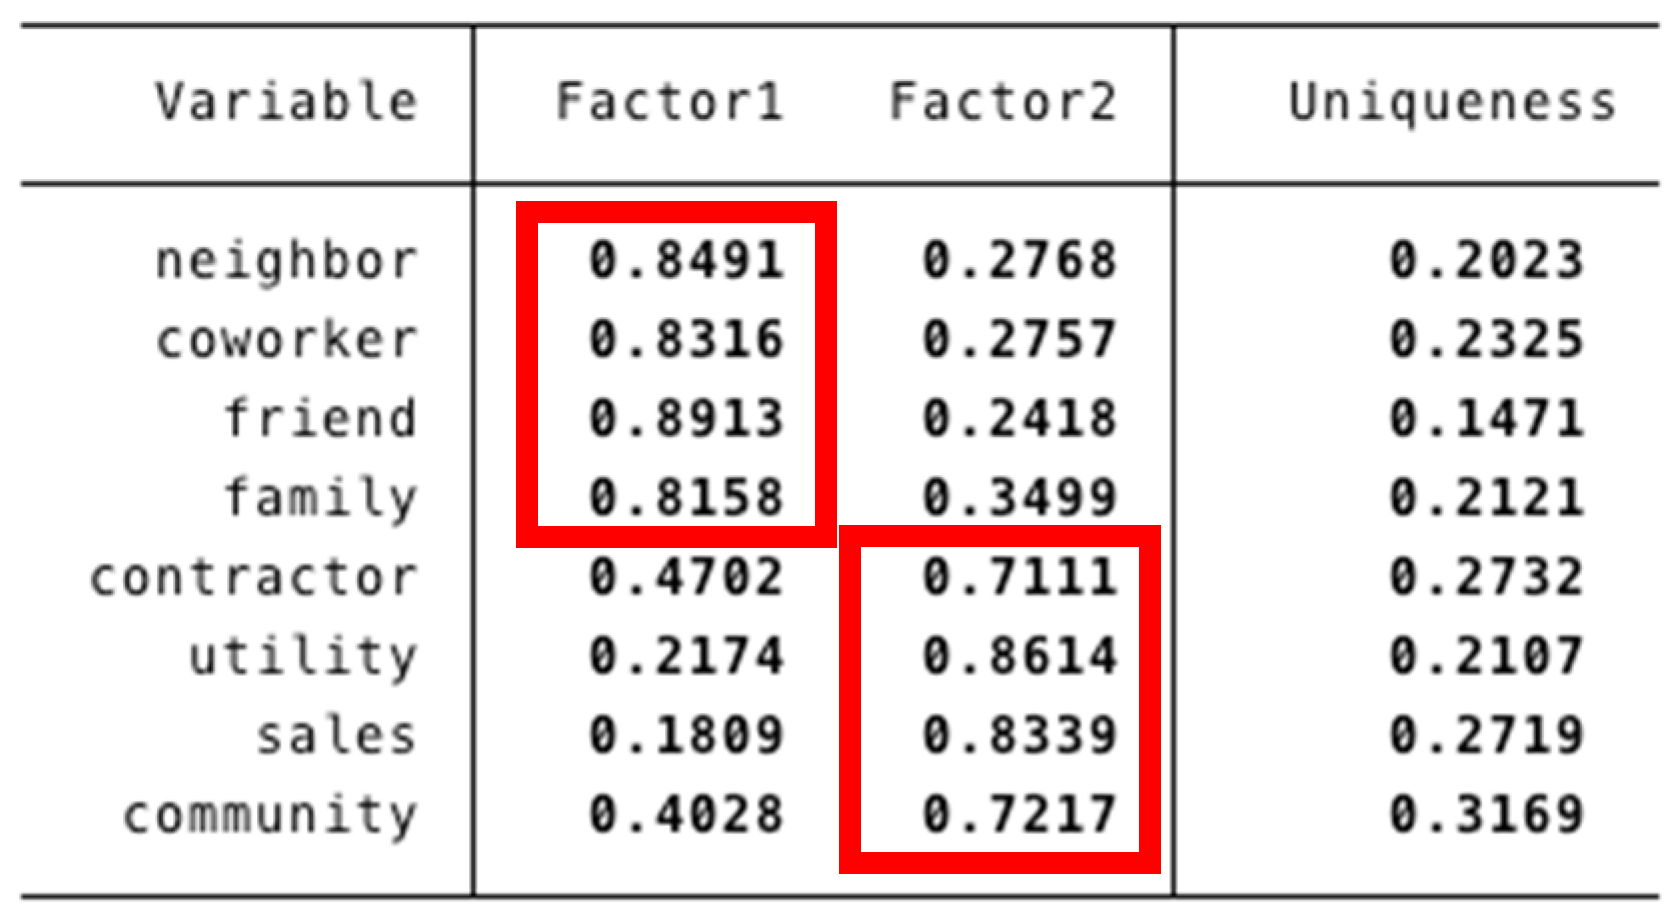
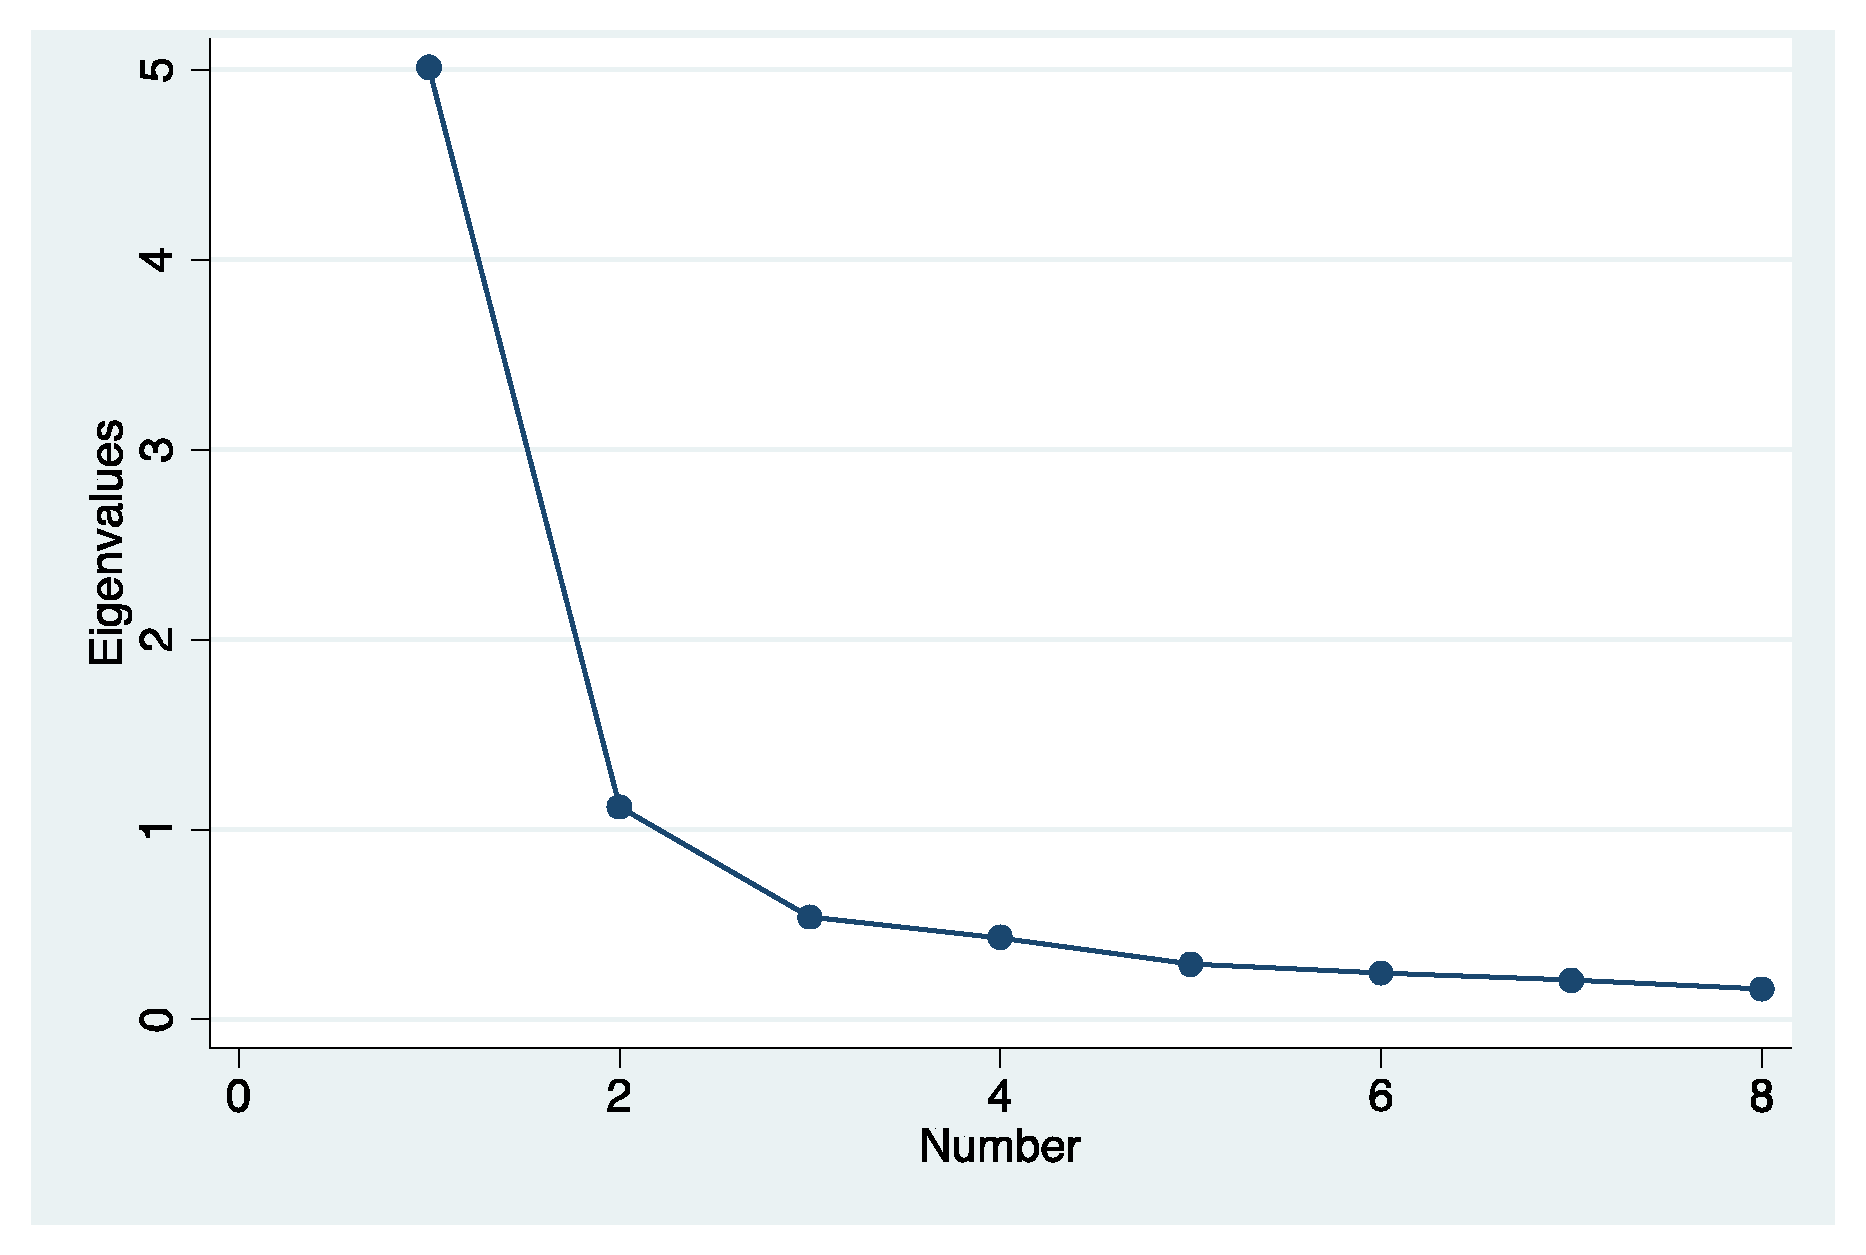
Two factors were identified from the eight advisor questions using the scree plot that shows the two-factor selection retains eigenvalues above 1.0. Individual factor loadings for each construct exceeded 0.71 which is far above the 0.25 cutoff suggested in the literature. More information on the PCA can be found in Appendix B.
  • The first factor includes those network members who are socially and geographically close to the respondent: neighbors, co-workers, friends. This factor was labeled “Close” and explains 41.7% of the variance in the data.
  • The second factor is energy experts: contractors, utility representatives, energy technology salespeople and members of community-based organizations. This factor was labeled “Expert” and explains an additional 35.0% of the variance in the data.
The close and expert factors are consistent with Schilke et al. [50] and Landesvatter & Bauer [51] who emphasize the distinction between generalized trust (trust in strangers/unknown others) and particularized trust (trust in specific groups or individuals, like contractors).
Also note that the survey asked residents the question “Would you be willing to pay $X to improve your home’s energy efficiency?” (Yes (1)/No (0) response). The $X amount of their willingness-to-pay (WTP) amount included a randomly generated value between $200 and $2400 with a mean of $1300 to represent out-of-pocket costs of EE improvements. A random WTP value is required to make valid inferences about participants’ WTP for EE improvements. It is expected that this random value is negatively correlated with a Yes response, which is less likely with larger out-of-pocket costs. But unfortunately the randomly assigned value was not recorded in the survey results. As such, the WTP aspect of the survey is used in the following multivariate modeling as a control variable only.

2.1.2. Multivariate Regression Modeling

Ordinary least squares (OLS) and logit regression modeling were employed to control for demographic factors and to isolate the independent effects of each independent variable in explaining the dependent variables. Robust standard errors are used in all models to mitigate the potential effects of heteroskedasticity. A variance inflation test showed no significant multicollinearity.
The two dependent variables in the OLS models (close and expert trusted advisors) are continuous 0.0–1.0 PCA factor scores. The key independent variables are the demographics of the respondents as well as the other PCA factor scores. Table 1 shows the descriptive statistics for the dependent and independent variables used in the regression modeling. Additional details on the outcome variables are presented in the next section.

3. Results

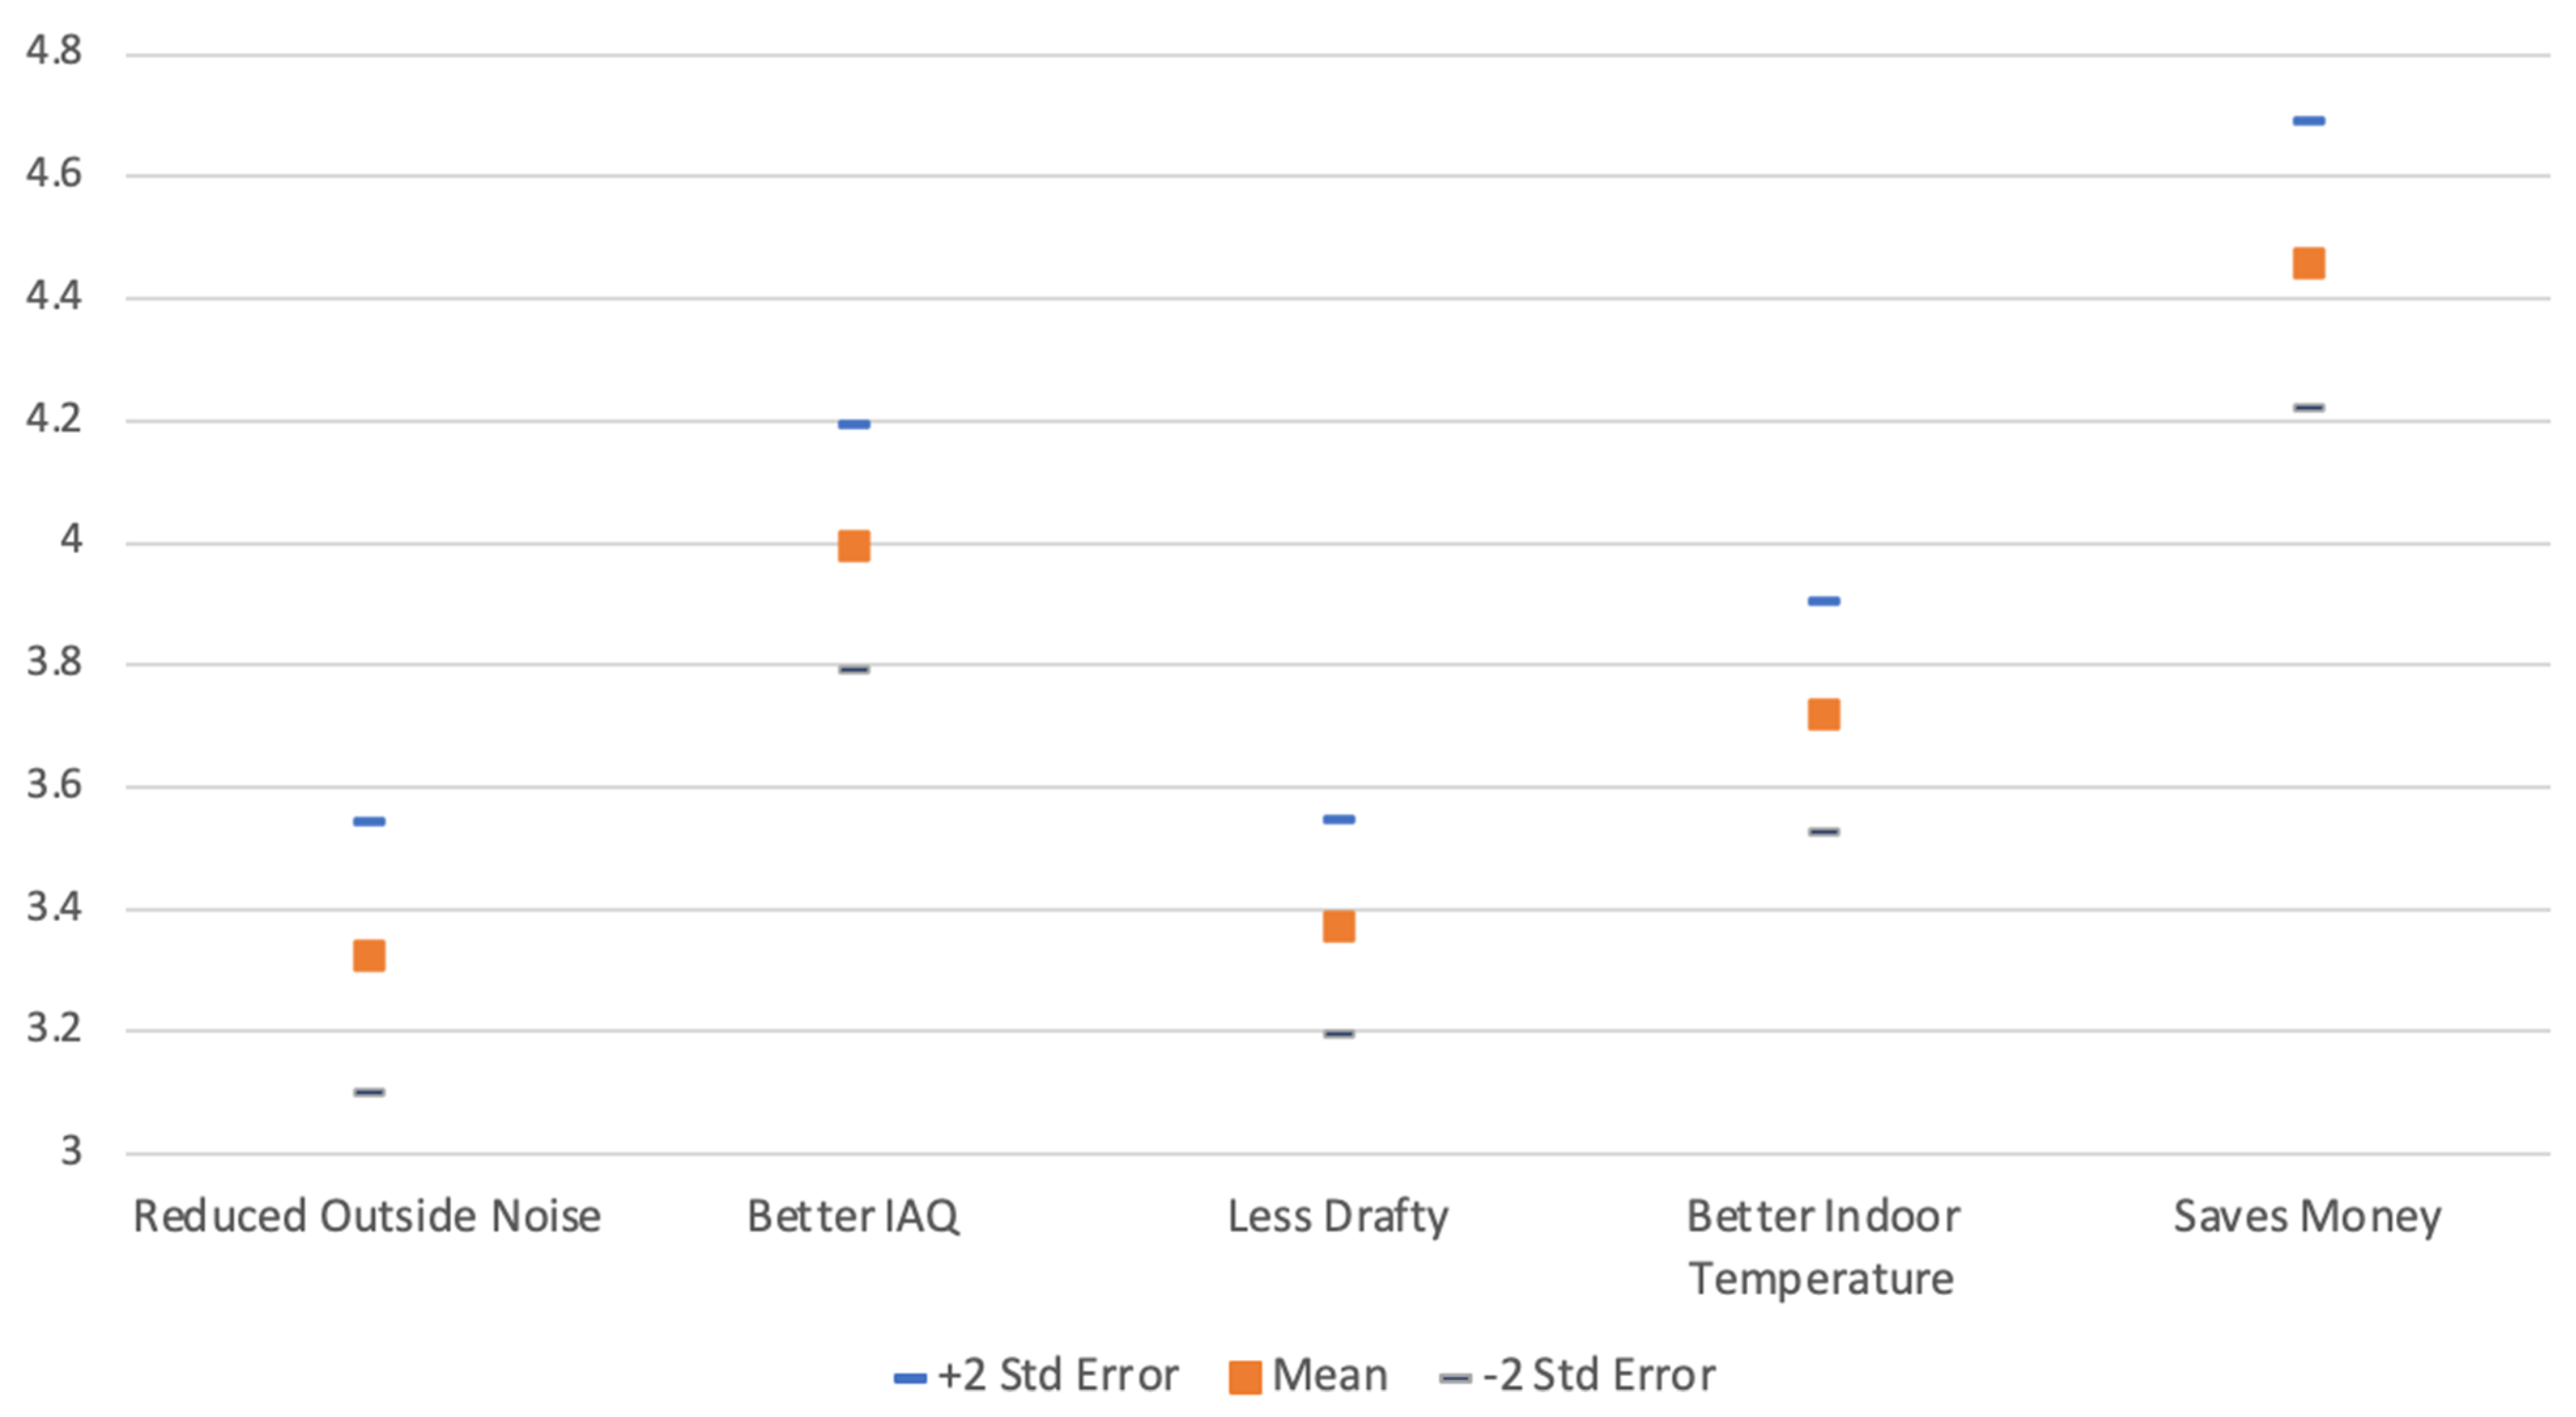
Figure 3 below shows the results for RQ#1 with average and two standard error ranges for the perceived benefits of EE. Responses to the question are on a 1–5 Likert scale. While saving money had the highest mean score, it also had a higher standard error. Less drafty scored lower but with less variation in responses. However, part of the lower variation could be due to the missing responses as discussed above and in Appendix A.
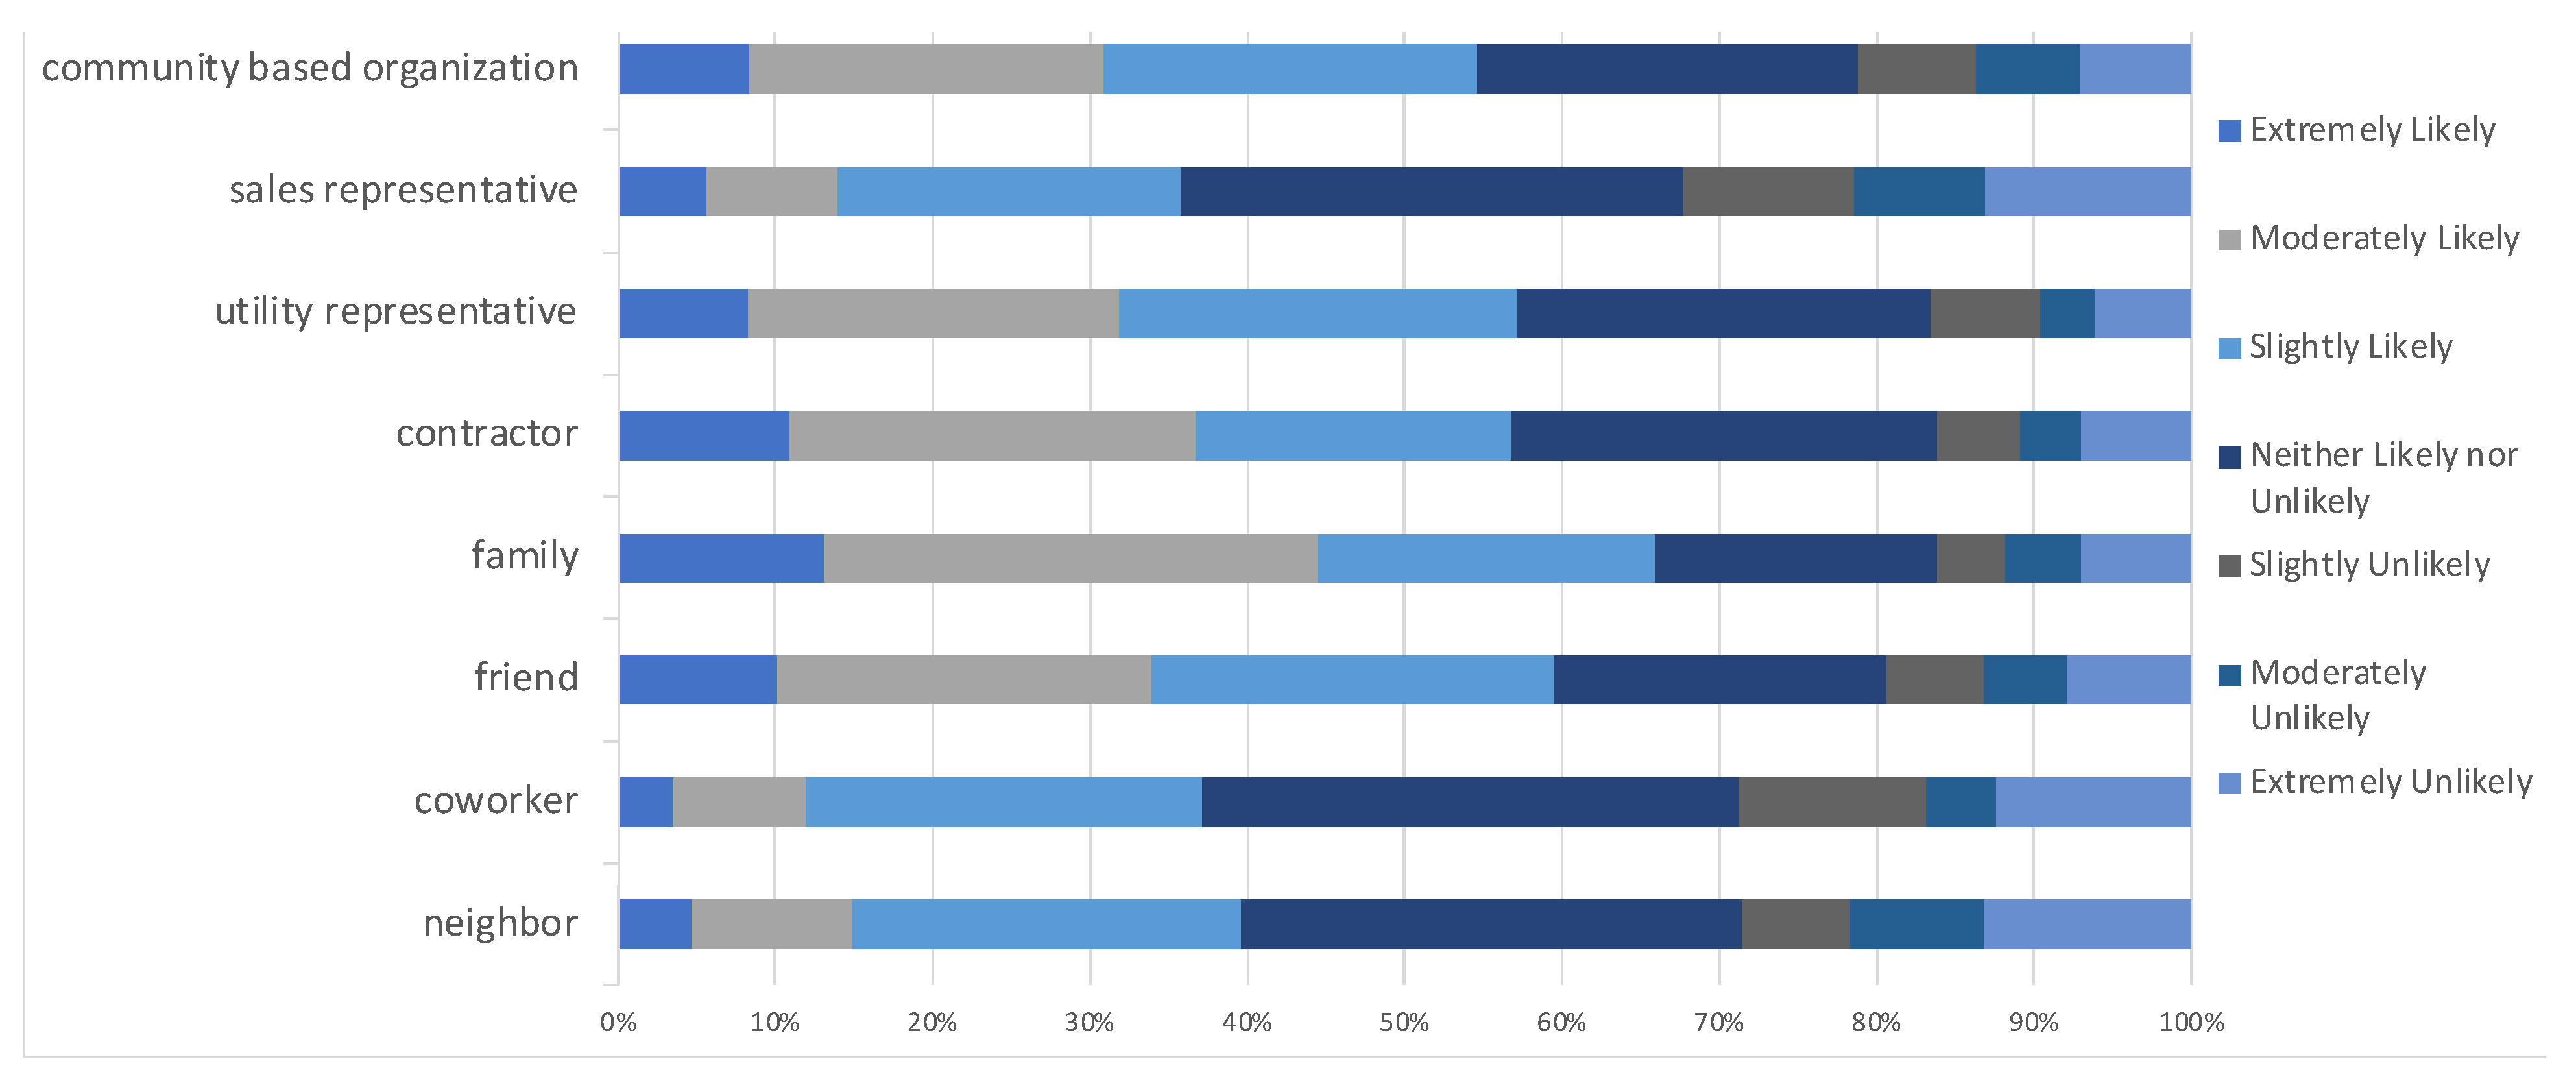
The detailed results for RQ#2 relating to trusted advisors are presented in Figure 4 below. The rank order of mean scores for trusted advisors is: 1. family; 2. contractor; 3. friend; 4. utility rep.; 5. CBO; 6. neighbor; 7. co-worker; 8. energy technology sales representative. Figure 4 also shows the composition of the scores. For example, family and contractors receive the highest share of extremely likely while neighbor, co-worker, and sales representative receive the highest share of extremely unlikely.
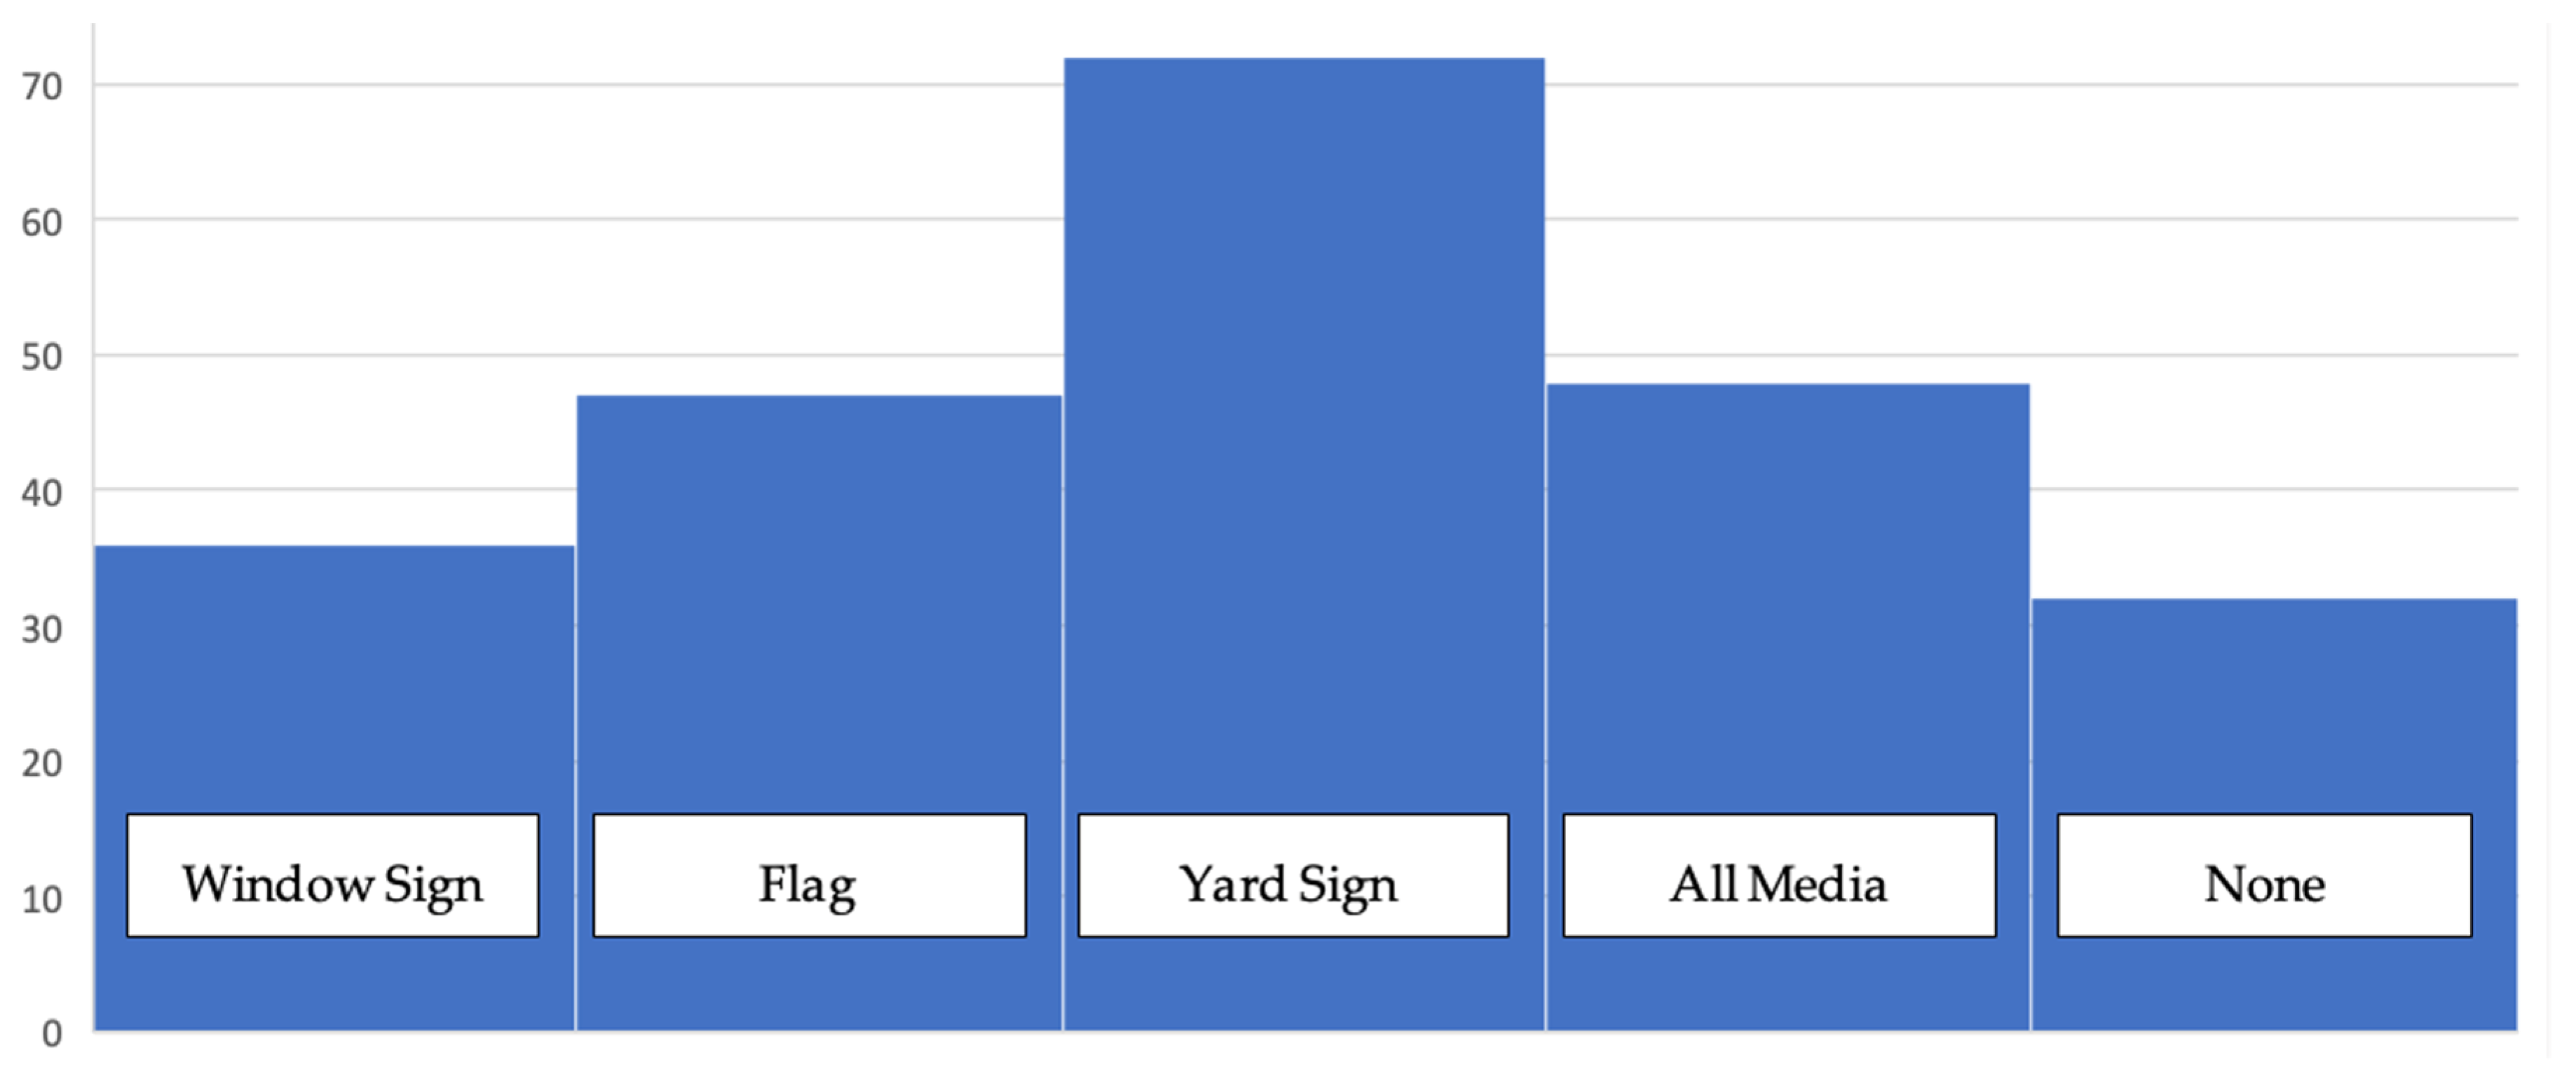
Figure 5 shows respondents’ preferences regarding RQ#3 with a histogram of the number of responses (out of 238) for each item for the question on preferred outdoor media preferences to show participation in “a community-led effort to help neighbors make their homes more energy efficient.” Yard signs are clearly preferred (N = 72), followed by all the outdoor media (N = 48) and flags (N = 47). Recall from Section 2 that nearly half of respondents were renters. In Portland, rental properties are nearly evenly split between single-family and multi-family homes [47]. It is unclear how the dwelling type influenced media preferences of respondents. However, it is likely that if yard signs are not feasible in some multi-family dwellings, the respondents would have selected window signs, or all media. In these cases, for renters, the results for yard signs in Figure 5 could be understated.

3.1. Linear Regression Results

Figure 3, Figure 4 and Figure 5 above summarize respondents’ univariate preferences for the survey items. However, to fully investigate the research questions, multivariate regression modeling is used to isolate the independent effects of key predictor variables while holding other factors constant. The OLS and logit regressions are presented in Table 2. The F-statistics and Chi-Squared statistics for the regressions are strongly significant. Table 2 shows three different regression results with each model’s name in the first row of each column. Models 1–2 use ordinary least squares (OLS) estimations while Model 3 uses logistic regression. The models’ coefficient of determination (R2) indicates that the combined effects of the variables in the model explain between 16% and 23% of the variation in the different dependent variables.
Models 1 and 2 in Table 2 assess RQ#2 regarding who respondents turn to for EE information. The results in Model 1 for the “close” advisor network shows each additional decade of resident age predicted a 2.3% lower score. Older residents appear to rely less on friends, family, co-workers, and neighbors as measured by the PCA factor. More experience with EE technologies predicts more favorable views of close advisor networks. Each additional stated action taken to improve EE in their home predicted a 3.8% higher close advisor trust score. Similarly, participants who said that they would pay to improve their home energy efficiency scored about 6.5% higher on the importance of close network advisors in adopting EE technologies. The combined effects of these demographics can be substantive: a respondent who stated Yes on willingness to retrofit in the youngest age category and who stated that they have undertaken the most EE measures is predicted to score about 35% higher on the importance of close advisors than the oldest residents that are uncommitted to EE.
The results for “Expert” advisors in Model 2 are less informative. Only self-reported responses to the question “How much would you say you know about energy efficient technologies for your home?” is statistically significant. Each one-point increase in the five-point Likert scale for EE knowledge predicts a ~5.0% decrease in the importance of expert advisors. This result is intuitive as more knowledgeable respondents are less likely to believe that they need advice from outsiders. Respondents with low levels of reported EE knowledge apparently are more willing to trust experts on EE adoption. Note that unlike close advisors, older residents are no more or less likely to rate expert advisors as important.

3.2. Logistic Regression Results

Finally, the variables that explain outdoor media preferences are examined: specifically what participant attributes are associated with saying Yes to all the outdoor media including yard signs, window stickers, and flags. Logit regression was used to predict the odds of this response outcome = 1 and are presented in Model 3. The regression coefficients are presented as odds ratios where values < 1 represent a reduction in the odds of choosing an outcome = 1, and coefficient values > 1 predict an increase in the odds of that outcome, given that the other variables in the model are held constant. Recall that odds are slightly different from probabilities (which are the ratio between an outcome and all possible outcomes) and represent the ratio of an outcome to another outcome. For example, 1:1 odds (even odds) are the same as a 50% probability (1/2), but 1:10 odds are equivalent to a 9.1% probability (1/11).
McFadden’s pseudo R2 for the logit model shows an improvement in the results for the full model with all predictors as opposed to the intercept-only models. However, this statistic is not comparable with R2 from OLS regressions and should be interpreted cautiously.
Model 3 in Table 2 is the logit estimation that investigates resident preferences about program media that signal their participation in EE activities under RQ#3. Recall that participants were asked “Please consider the hypothetical situation where Energize! is a community-led effort to help neighbors make their homes more energy-efficient. Neighbors that perform energy retrofits (such as weatherization, installing a new furnace, etc.) are eligible to receive something that shows their participation. Given this hypothetical situation would you prefer the yard sign, window sign, or flag to show your participation?” Participants were also given the choice of receiving all the above media. For the regression modeling, the responses that selected all media were recoded as 1s and all other responses were recoded as 0s. Thus, 1s represent the stated super-participators that are the most eager to signal their EE commitment to neighbors and those passing by.
Demographics are important in explaining media preferences. Model 3 shows that older respondents have statistically significant higher odds of being stated super-participators. Respondents who work less are less likely to be super-participators; or put another way, respondents with full-time employment are more likely to want all outdoor media. This question could be measuring household income which was not included in the survey. Also, of interest is that at p < 0.10 renters have higher odds of being super-participators. Recall that nearly half of respondents are renters and this is reflected in the results of Model 3.
Advisor preferences are also statistically significant predictors of preferring all outdoor media. A respondent who scored the highest (1.0) on the close trusted advisor score has almost 11 times the odds of wanting all program media than a participant scoring the lowest (0.0) at p < 0.10. A similar dynamic is seen for respondents who scored high on the expert advisor score who have over 47 times the odds of being a super-participator compared to someone who scored a 0.0 on this score. The takeaway here is that respondents who actively value both close and expert advisors (independent of their stated EE knowledge) are more likely to be super-participators.

4. Discussion

Regarding RQ#1, there is little consistent evidence about how resident demographics affect the perceived benefits of EE (Appendix C). This is similar to the findings of Frederiks et al. [17] who summarize the demographics literature as “far from consistent” (p. 573). However, recall that this section of the survey had the most missing responses by far. Missingness can be due to a lack of knowledge about non-energy benefits by residents. In survey research, it is generally understood that missing responses increase when respondents do not know the answer to a question [52]. The logit regression in Appendix A analyzed the predictors of whether a question was missing a response; it showed that higher EE knowledge and number of actions taken lowered the odds of a missing response by 25% and 42% respectively. It would appear that residents who were inexperienced with EE did not understand the questions and perhaps the concepts behind the non-energy benefits. More research on this is important.
The findings on respondents’ preferences for trusted advisors (RQ#2) also have insights for theories of EE adoption. The strong ties of family and friends have similar trust scores as contractors, but neighbors and co-workers have lower mean trust scores. Recall that the elements of a trusted advisor have been defined as credibility, reliability and customer-orientation [28]. Perhaps the lower scores for co-workers and neighbors reflect the lower credibility of information compared to other strong ties. Weak ties with high credibility and perceived customer-orientation (utility reps, CBO reps) score higher than sales representatives with lower perceptions of customer-orientation. The expert and close latent PCA factors show that residents tend to conceptually group trusted advisors into these two bins. Combining the findings of the latent factors as well as the mean trust scores indicates that CBO and utility reps, along with contractors, are likely to be the most effective expert messengers for residential EE adoption. The OLS regression in Model 3 shows that younger residents who are already engaged with EE actions are more likely to respond to close ties’ information about EE technologies.
The dominant preference for outdoor media under RQ#3 was yard signs, which is not surprising since these are commonly used for elections and contractor advertising. This effect is perhaps understated given that nearly half the sample consists of renters. Apartment dwellers who live in high-rise or mid-rise buildings might not have an appropriate outdoor space for a lawn sign and thus might not have selected this media option. The survey did not include a question on respondents’ detached versus attached housing type, so preferences for media by building type cannot be inferred. The second most common response was for all the program media including a yard sign, followed by a window sign, and then a flag. Importantly, the low number of “None of Them” responses indicate that outdoor media is acceptable to most residents and is a viable program outreach tool. This finding supports the findings from Wilson et al. [33] that residents want to be able to see EE investments (and that they want their neighbors to see them as well).
The logit model’s predictors of super-participators (Model 3) included older residents, those working full-time, and those with higher trust in close and expert network members. Higher trust in neighbors, co-workers, family and friends leading to a higher willingness to display outdoor media could reflect reduced perceived social risks from displaying the media or else stronger preferences for residents’ signaling their green attributes.
Note that political party affiliation was not significant in any of the regressions unlike Gromet et al. [53]. Although it is an imperfect indicator for ideology, it does perhaps indicate that ideology is perhaps not a significant predictor of signaling EE adoption in this sample.

4.1. Implications

There are important EE policy and program implications from the results about EE experience predicting both higher close network trust scores as well as stronger preferences for EE outdoor media. The success of an outdoor media outreach campaign could likely be made more effective by cross marketing of EE incentives to high-knowledge customers who have participated in existing rebate programs or are engaged with their utility through demand response, energy bill notifications, or other programs. It is also possible to use experts (weak ties) to link together cliques of strong ties (family, friends, co-workers, neighbors). This is consistent with Granovetter [54] and subsequent research on the importance of weak ties but with new insights about the value of the credibility (knowledge) of those weak ties. The use of weak ties for bridging close networks implies the scaling up of existing customer loyalty or referral programs where existing contractor or utility customers receive incentives for bringing in new customers. The results suggest that QR codes embedded in outdoor and social media could recruit participants’ neighbors and other network members into EE programs. Community-based organizations’ high relative perceived trust scores mean that they are good candidates to implement these media campaigns.
As the climate crisis continues to accelerate, policymakers will move to scale up GHG emissions reductions from the building sector. The utility-driven program model that currently predominates the sector will be complemented with municipal and community-led initiatives that will likely utilize community-designed solutions and networks. This paper examines three key drivers of EE programs: perceived non-energy benefits of EE, trusted advisors for EE adoption, as well as preferences for outdoor media to increase community salience of EE retrofits.
First, the results for how residents conceptualize benefits show that saving money is the highest priority followed by better indoor air quality. There was significant missingness in residents’ responses to some of the perceived benefit items, likely indicating a lack of understanding of these potential benefits or perhaps unclear questions in the survey.
Second, the results find family members and contractors have the highest adoption trust scores. Community-based organizations also score very highly. It is possible that these organizations bridge generalized and particularized types of trust. Since they are embedded in the community, they score higher in generalized trust; and are also expected to display technical energy expertise, ranking them higher in particularized trust. In addition to average trust scores, principal component analysis is used to discover two latent variables in the data: (1) “experts” (contractors, utility representatives, energy technology salespeople, and members of community-based organizations) and (2) those that are “close” to the decision-maker (friends, family, co-workers, and neighbors). Young residents with experience with EE technologies are much more likely to trust close advisors. A respondent who stated Yes on willingness to retrofit in the youngest age category and who stated that they have undertaken the most EE measures is predicted to score about 35% higher on the importance of close advisors than the oldest residents that are uncommitted to EE. And a higher close network trust score is associated with higher odds of being a “super-participator” that prefers yard signs, flags, as well as window signs to signal their participation in EE programs. Conversely, respondents with low levels of reported knowledge apparently are more willing to trust experts on EE recommendations.
Finally, the results for outdoor media show that yard signs have the highest preference score with about 31% of respondents preferring them. However, about 20% of respondents indicated that they would prefer all the outdoor media (a yard sign, a flag, and a window sign). The predictors of these super-participators include older residents, women, and those with higher trust in close network members. The implication for program design from low trust in neighbors combined with high trust in contractors and CBOs indicates that contractor/CBO co-branding on outdoor media might be an effective method to recruit neighbors who walk by houses hosting program media. To maximize the impact of these media tools for residential energy efficiency (EE) retrofit programs, the design must align social science theory with how residents process trust and information:
  • Maximizing peer influence (subjective norms): To maximize peer influence, yard signs and other media must be highly visible and physically located where neighbors can see them. Because residents learn from their peers, the sign should clearly indicate that the home is participating to trigger observational learning. Designs that feature community-based branding (e.g., a city-wide “Energize!” campaign logo) are more likely to create a social norm than generic contractor signs. When neighbors see a cohesive community identity, they are more likely to perceive the behavior as a community standard, increasing the subjective norm pressure to conform.
  • Maximizing Attitude Change: Attitudes are formed through an evaluation of expected outcomes. Outdoor media must overcome the barrier of energy being an “invisible good” by effectively signaling specific benefits. Since saving money and improved indoor air quality are the most valued benefits, the sign should explicitly communicate these. Integrating the logo or name of a highly trusted advisor (e.g., a local community-based organization) directly onto the sign signals the existing trust the resident has in that expert.
  • Maximizing perceived behavioral control (PBC): PBC is the belief in one’s ability to successfully execute the retrofit. Outdoor media can signal that retrofitting is accessible to the average neighbor. Modern, effective outdoor media should feature a clear QR code that links directly to a “one-stop-shop” or a simplified digital intake process. This reduces the perceived transaction costs of searching for information and provides a sense of control by immediately showing the path to participation. The media design should focus on empowerment. Messaging like “Easily make your home more comfortable” (using comfort/warmth sentiment) is superior to “Curtail your energy use,” which may signal a loss of control or comfort. In sum, unlike solar PV and EVs that have seen much greater adoption levels, heat pump technologies, envelope improvements, and other EE measures are not visible to neighbors. Utility and municipal and community-based EE programs can increase participation through these carefully designed outdoor media campaigns.

4.2. Study Limitations and Future Research

Like other studies that preceded it, this research includes some limitations. These limitations potentially limit the inferences made from the results. The survey sample was focused on the Portland metro area. The population of the Portland metro area is roughly 2.5 million residents and Portland area residents’ preferences are not necessarily representative of the US or other large jurisdictions. As discussed above, there were also considerable missing responses to the survey questions about the non-energy benefits of energy efficiency measures. While multiple imputations methods discussed in Appendix A addressed this possible bias in the Results section, the usable sample includes only 238 responses. The survey was also deployed during the COVID-19 period which could have also biased the results, but there is no clear indication of this.
There is a need for future research to complement this exploratory study. The first research need has to do with knowledge and preferences about EE benefits. The largely null findings regarding the demographic predictors of EE benefits indicate additional research is necessary to more fully develop and test theories that predict residential preferences about benefits of EE.
The second research need is to utilize more complex constructs of trust in EE information provision and decision-making. Schilke et al. [50] and Landesvatter & Bauer [51] have noted the distinction between generalized and particularized trust that is apparent in this research’s close and expert PCA factors. Fiske & Dupree [55] highlight that credibility (trust) relies on both competence (ability) and warmth (perceived intent). These are likely highly correlated with the two types of trust and could explain why community-based organizations score high in trust in this research: because they potentially possess technical competence as well as higher perceived intent to help the resident than a sales representative.
The final future research need is to integrate more complex purchase decisions into the data collection process about residential EE preferences. Biswas et al. [56] note that the role of information in EE decisions is more likely to impact appliance purchases rather than building retrofits, thus limiting its importance in large-scale energy savings. While this research did collect self-reported information on EE knowledge (and past EE actions), distinguishing between simpler appliance purchase decisions versus larger-scale weatherization projects (windows and insulation) is important in future survey efforts.

Author Contributions

H.T.N.: Conceptualization, Formal analysis, Funding acquisition, Investigation, Methodology, Software, Project administration, Resources, Supervision, Validation, Visualization, Writing—original draft, Writing—review and editing. I.O.: Investigation, Software, Project administration, Visualization, Writing—original draft, Writing—review and editing. All authors have read and agreed to the published version of the manuscript.

Funding

This research was supported by a Portland State University Faculty Development Grant #FEAHTN. The funder had no influence on the content of this article or on the selection of the journal for publication.

Data Availability Statement

The data presented in this study are available upon request.

Conflicts of Interest

The authors declare no conflicts of interest.

Appendix A. Missing Data Imputations

The key independent and dependent variables were evaluated for missing data.
Table A1. Variable Missingness.
Advisor Variables# Missing% MissingEE Benefits Variable# Missing% Missing
neighbor31.3Reduced outside noise2811.8
coworker72.9better iaq3514.7
friend62.5less drafty3113
family41.7better temperature3213.4
contractor41.7saves money93.8
utility41.7Other Variables# Missing% Missing
sales41.7wtp52.1
community52.1knowledge31.3
action_num00
all_media31.3
energy_media_pv104.2
Table A1 shows the survey question and the number of missing rows along with the percent of responses that these rows represented. Table A1 indicates that the missing rate for the EE Benefits scale questions was much higher than for the other variables.
Missing data can take one of three forms: (1) Missing Completely at Random (MCAR) in which the missing data is unrelated to observed or unobserved data. (2) Missing at Random (MAR) in which the probability of an independent variable (x) is missing is dependent on the dependent variable (y), (3) Missing not at Random (MNAR) where the probability of being missing is dependent on unobserved data. Since it is generated via unobserved data, MNAR is not typically tested for.
A test was run to determine if the EE benefits data was MCAR or MAR by generating a missingness indicator (0 = non missing, 1 = missing) for each EE benefits variable which was then used in a logit regression with the independent variables from the regression analysis. The logit coefficients are shown as odds ratios where negative coefficients are <1.0 and positive coefficients are >1.0.
Table A2 shows that missingness for the EE benefits are positively related to stated willingness to pay (WTP) for a retrofit and negatively related to the stated number of EE actions already taken. The missing data regression analysis shows that the EE benefits data is MAR and listwise deletion of the missing cases would likely bias the regression coefficients in subsequent analyses.
Table A2. Logit Regression of Missing Cases for EE Benefits.
VariablesBenefit_Miss
wtp2.808 ***
age0.950
employment0.893
language0.841
gender0.889
party10.928
household of color1.373
education0.833
renter0.943
tenure0.922
occupants0.794
close1.261
expert0.349
knowledge0.751 *
action_num0.580 ***
Constant106.0 *
Observations210
Pseudo R20.134
*** p < 0.01, ** p < 0.05, * p < 0.1.
The Multiple Imputations of Chained Equations (MICE) package called “mi impute chained” was used in Stata v.15 to impute missing responses to the EE benefits questions. Each of the five EE benefits variables were imputed iteratively with fully conditional (chained) specifications that use all of the other variables in prediction equation (Stata, 2021). Ten imputations using ordered logit regression were performed to predict the ordinal response for each of the EE benefits questions. The ordered logit imputation method is based on the asymptotic approximation of the posterior predictive distribution of the missing data. All the ordinal logit models converged to a solution. The results for the imputations are presented in Table A3. Note that the MICE package does not impute some cases with more than one missing variable in the scale as indicated by the difference between the incomplete and imputed columns.
Table A3. Results from MICE Analysis.
VariableCompleteIncompleteImputedTotal
noise2102824238
iaq2033528238
drafty2073122238
temperature2063226238
money22996238
The median value for each row (case) was calculated from the results of the 10 regressions to represent the completed response from each participant. This median value for each of the five questions was subsequently used in the PCA factor modeling.

Appendix B

Appendix B.1. PCA Methodology and Results

The principal components analysis (PCA) utilized a varimax rotation technique that maximizes the loadings of the columns but also restricts the correlation between variables to zero. None of the variables were standardized prior to the PCA as all the questions used the same response scale and had similar variances.

Appendix B.2. PCA for Trust in Adoption Likelihood

The eight questions inserted a different social network member following the leading phrase, “How likely are you to adopt an energy efficient technology if recommended by the following people: …?” with eight trusted advisors: Neighbors, Coworkers, Friend, Family member, A contractor you know, A representative from your utility, An energy technology salesperson, and A community-based organization. Responses included: Extremely unlikely, Moderately unlikely, Slightly unlikely, Neither likely nor unlikely, Slightly likely, Moderately likely, Extremely likely.
Several tests were performed to determine the suitability of the data for PCA. Bartlett’s Test for Sphericity was run to determine if the variable’s correlation matrix significantly differs from an identity matrix. The Chi-square statistic of 1274.6 indicates that we can accept the hypothesis of no correlation at the p < 0.001 level.
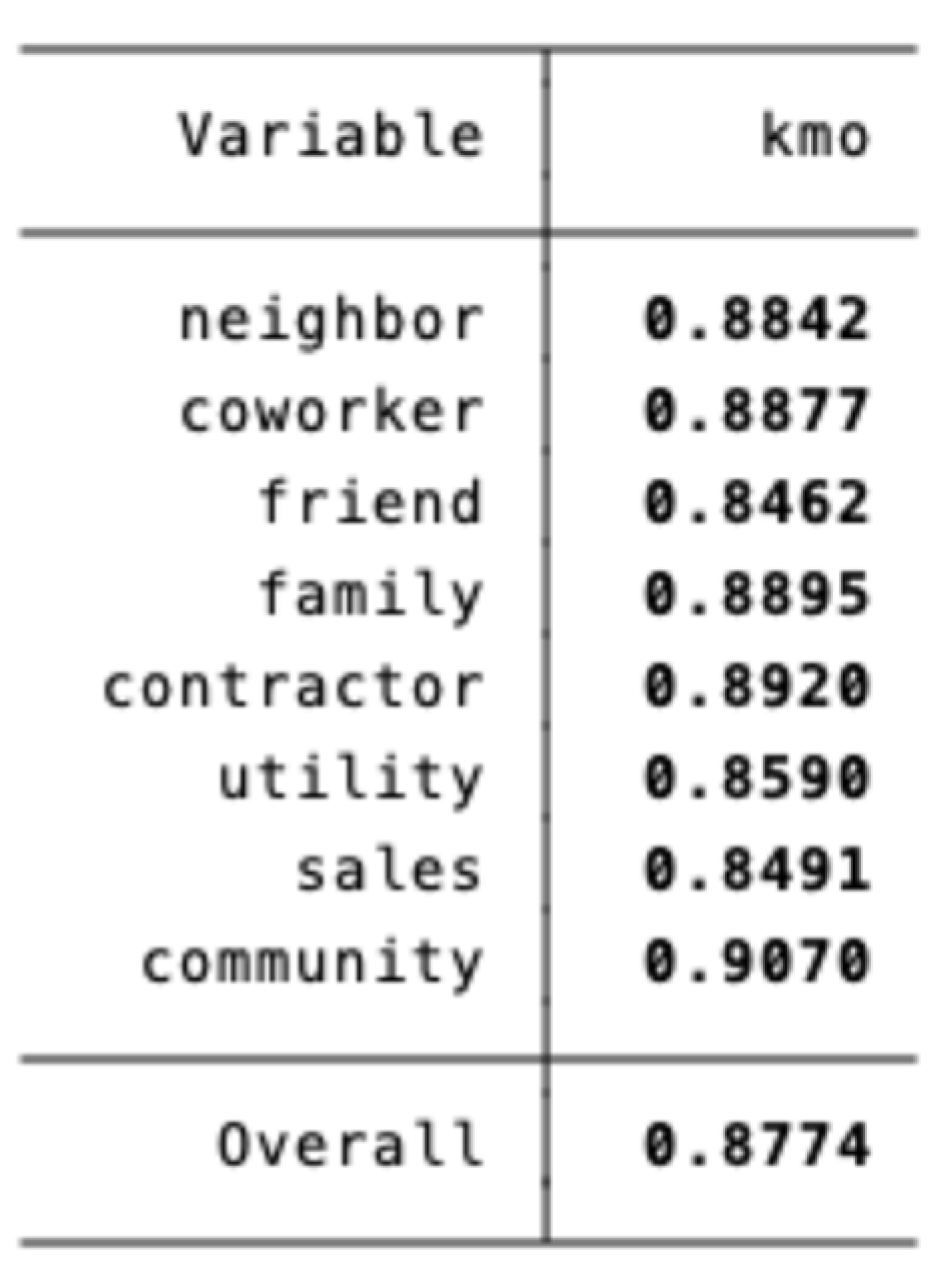
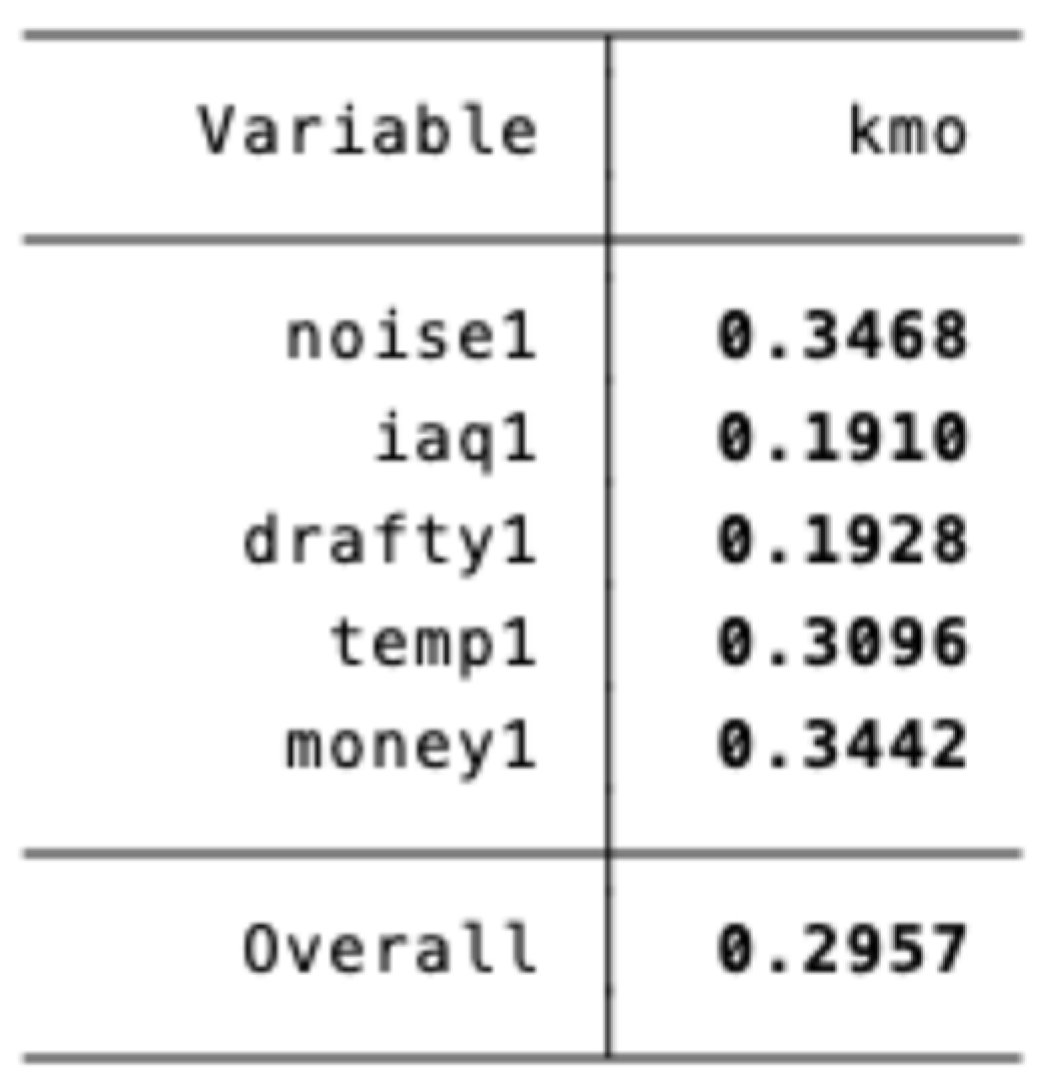
The PCA Kaiser–Meyer–Olkin (KMO) test that calculates the ratio of common variance (the overlap between variables) to the total variance was run. KMO values range from 0.0 to 1.0. A higher KMO score indicates that the PCA variables share a significant amount of information, making them ideal candidates for factor analysis. The component and overall KMO score results in the table at the right are above the 0.50 level recommended in the literature [57].
Figure A1. KMO Measure of Sampling Adequacy for Trust.
Energies 19 03117 g0a1
The PCA for trusted advisors yielded two latent constructs in the advisor data.
  • Factor 1 includes neighbors, co-workers, friends and family whose factor loadings in Factor 1 column exceeded the critical threshold of 0.25. This factor was labeled “Close” and explains 41.7% of the variance in the data.
  • Factor 2 includes contractors, utility representatives, energy technology salespeople and members of community-based organizations whose factor loadings in Factor 2 column exceeded the critical threshold of 0.25. This factor was labeled “Expert” and explains an additional 35.0% of the variance in the data.
Figure A2. Factor Loadings.
Energies 19 03117 g0a2
Two factors were identified from the eight questions using the scree plot that shows the two-factor selection retains eigenvalues above 1.0.
Figure A3. Scree Plot of Eigenvalues.
Energies 19 03117 g0a3
PCA for the Perceived Benefits from Energy Efficiency Technologies (Not Used).
Recall that the five questions about the perceived benefits of energy efficiency inserted a type of benefit following the leading phrase, “Please rank the following from 1 (least) important to 6 (most important) when deciding on energy efficient technology …?” with five benefits: Better indoor quality, Less drafty, Better indoor temperature, Save money, Recommended by a neighbor.
Figure A4. KMO Measure of Sampling Adequacy for Perceived Benefits.
Energies 19 03117 g0a4
Bartlett’s Test for Sphericity was run to determine if the variable’s correlation matrix significantly differs from an identity matrix. The Chi-square statistic of 173.0 indicates that we can accept the hypothesis of no correlation at the p < 0.001 level.
Unfortunately, the component and overall KMO score in the table at the right are below the 0.50 level recommended in the literature. Thus, the use of PCA for benefits of EE is not recommended for this research.

Appendix C. Ordinal Logit Results for Perceived Benefits from Energy Efficiency

While the PCA analysis presents an intuitive understanding of how survey participants viewed the benefits from EE, interpretation of the standard and health factors is made difficult because several of the variables are negatively correlated with the factors (as described in Appendix B).
As such, Table A4 provides ordinal logit regression models of the 1–6 Likert scale for each of the benefits. Note that these regressions utilize the missing data imputations described in Appendix A.
The results are presented in odds ratios where values less than one represent a reduction in the odds of scoring in the Most Important (6) category versus the combined Least Important-Important categories. Coefficient values greater than one predicts an increase in the odds of that outcome.
Notable findings include:
  • Indoor Air Quality: None of the treatment or demographic variables are statistically significant.
  • Drafts: Non-English primary language households and renters tended to score lower on this benefit.
  • Noise: Non-English primary language households were more likely to score higher, as did women.
  • Temperature: None of the treatment or demographic variables are statistically significant at p < 0.05.
  • Saves Money: Older residents tended to score lower on this benefit.
Table A4. Ordinal Logit Results for Perceived Benefits of Energy Efficiency.
(1)(2)(3)(4)(5)
VariablesOLogit-IAQOLogit-DraftyOLogit-NoiseOLogit-TempOLogit-Money
age0.9131.0691.0110.8840.791 **
employment1.122 *1.0340.9191.0560.942
language1.4900.137 ***3.150 ***0.6821.426
gender0.9131.0331.131 *0.9581.015
party11.1170.9281.1041.0071.011
nonwhite1.2940.8710.7031.3470.903
education1.0430.815 **0.9791.0570.973
renter0.9880.518 **0.7461.540 *1.011
tenure0.9470.9600.8891.153 *1.074
occupants1.2061.1270.8171.0721.013
close1.0410.7480.4741.5711.816
expert1.4511.6242.3670.6960.471
knowledge0.8571.0620.9441.0871.136
action_num1.0640.9930.9181.0201.008
wtp1.3001.3790.9280.8331.139
/cut10.0866 *0.0102 ***0.0337 **0.2490.0682 *
/cut20.3090.0884 *0.1661.2760.186
/cut31.0460.3500.3753.3180.301
/cut42.6131.1290.91114.21 *0.481
/cut512.89 *7.3582.59969.55 **0.970
Observations211211211211211
Pseudo R20.02800.03260.03150.02380.0310
*** p < 0.01, ** p < 0.05, * p < 0.1.
The ordinal logit models tested negative for violations of the proportional odds assumption.

References

  1. Pathak, M.; Slade, R.; Shukla, P.R.; Skea, J.; Pichs-Madruga, R.; Kalaba, D. Climate Change 2022: Mitigation of Climate Change. Contribution of Working Group III to the Sixth Assessment Report of the Intergovernmental Panel on Climate Change; Cambridge University Press: Cambridge, UK, 2022; Available online: https://www.ipcc.ch/report/ar6/wg3/ (accessed on 23 August 2023).
  2. Northwest Power and Conservation Council. The 2021 Northwest Power Plan. 2022. Available online: https://www.nwcouncil.org/reports/2021-northwest-power-plan/ (accessed on 15 February 2026).
  3. Federal Reserve Bank of St. Louis. S&P CoreLogic Case-Shiller U.S. National Home Price Index. 2022. Available online: https://fred.stlouisfed.org/series/CSUSHPISA (accessed on 15 February 2026).
  4. International Energy Agency. Global Status Report for Buildings and Construction 2019. Available online: https://www.iea.org/reports/global-status-report-for-buildings-and-construction-2019 (accessed on 15 February 2026).
  5. Morales, D.; Nadel, S. Meeting the Challenge: A Review of Energy Efficiency Program Offerings for Low-Income Households; American Council for an Energy-Efficient Economy (ACEEE): Washington, DC, USA, 2022; Available online: https://www.aceee.org/research-report/u2205 (accessed on 15 June 2023).
  6. Institute for Market Transformation. Building Performance Standards. 2026. Available online: https://www.imt.org/ (accessed on 16 February 2026).
  7. European Commission. Energy Performance of Buildings Directive. 2026. Available online: https://energy.ec.europa.eu/topics/energy-efficiency/energy-efficient-buildings/energy-performance-buildings-directive_en (accessed on 15 February 2026).
  8. US Department of Energy. Introduction to Local Policy and Program Approaches for Electrifying and Decarbonizing Existing Buildings. Communities LEAP. 2023. Available online: https://docs.nlr.gov/docs/fy24osti/88439.pdf (accessed on 15 June 2026).
  9. Attari, S.Z.; DeKay, M.L.; Davidson, C.I.; Bruine de Bruin, W. Public perceptions of energy consumption and savings. Proc. Natl. Acad. Sci. USA 2010, 107, 16054–16059. [Google Scholar] [CrossRef] [Scilit] [PubMed]
  10. Solà, M.d.M.; de Ayala, A.; Galarraga, I.; Spadaro, J.V. Promoting energy efficiency at household level: A literature review. Energy Effic. 2021, 14, 6. [Google Scholar] [CrossRef] [Scilit]
  11. Brown, D.; Middlemiss, L.; Davis, M.; Bookbinder, R.; Cairns, I.; Hannon, M.; Owen, A.; Brisbois, M.C.; Mininni, G.M. Rethinking retrofit: Relational insights for the design of residential energy efficiency policy. Energy Res. Soc. Sci. 2025, 120, 103863. [Google Scholar] [CrossRef] [Scilit]
  12. Davis, M.; Middlemiss, L.; Hall, S.; Brown, D.; Bookbinder, R.; Owen, A.; Brisbois, M.C.; Mininni, G.M.; Cairns, I.; Hannon, M. Towards a relational sociology of retrofit. Sociology 2025, 59, 466–484. [Google Scholar] [CrossRef] [Scilit]
  13. Gillingham, K.; Newell, R.G.; Palmer, K. Energy efficiency economics and policy. Annu. Rev. Resour. Econ. 2009, 1, 597–620. [Google Scholar] [CrossRef] [Scilit]
  14. Belaïd, F. The limits of energy conservation: Why doubling current energy efficiency progress is no easy feat. Energy Res. Soc. Sci. 2025, 127, 104253. [Google Scholar] [CrossRef] [Scilit]
  15. Antonopoulos, C.A. DOE’s Home Occupant Decision and Behavior Study: Occupant Data for Advancing Residential Decarbonization. Better Buildings Residential Network Peer Exchange Call Series; US Department of Energy: Washington, DC, USA, 2023. Available online: https://illumeadvising.com/files/2023-1-26-DOE-Peer-Exchange-Presentation.pdf (accessed on 30 June 2023).
  16. Huijts, N.M.A.; Molin, E.J.E.; Steg, L. Psychological factors influencing sustainable energy technology acceptance: A review-based comprehensive framework. Renew. Sustain. Energy Rev. 2012, 16, 525–531. [Google Scholar] [CrossRef] [Scilit]
  17. Frederiks, E.R.; Stenner, K.; Hobman, E.V. Household energy use: Applying behavioural economics to understand consumer decision-making and behaviour. Renew. Sustain. Energy Rev. 2015, 41, 1385–1394. [Google Scholar] [CrossRef] [Scilit]
  18. Ruiz-Valero, L.; Makaremi, N.; Haines, S.; Touchie, M. Co-benefits of residential retrofits: A review of quantification and monetization approaches. Build. Environ. 2025, 270, 112576. [Google Scholar] [CrossRef] [Scilit]
  19. Outcault, S.; Sanguinetti, A.; Dessouky, N.; Magaña, C. Occupant Non-Energy Impact Identification Framework: A human-centered approach to understanding residential energy retrofits. Energy Build. 2022, 263, 112054. [Google Scholar] [CrossRef] [Scilit]
  20. Reuter, M.; Patel, M.K.; Eichhammer, W.; Lapillonne, B.; Pollier, K. A comprehensive indicator set for measuring multiple benefits of energy efficiency. Energy Policy 2020, 139, 111284. [Google Scholar] [CrossRef] [Scilit]
  21. Skumatz, L.A. Efficiency programs’ non-energy benefits: How states are finally making progress in reducing bias in cost-effectiveness tests. Electr. J. 2015, 28, 96–109. [Google Scholar] [CrossRef] [Scilit]
  22. Ramos, A.; Labandeira, X.; Löschel, A. Pro-environmental households and energy efficiency in Spain. Environ. Resour. Econ. 2016, 63, 367–393. [Google Scholar] [CrossRef] [Scilit]
  23. Lutzenheiser, L. Social and behavioral aspects of energy use. Annu. Rev. Energy Environ. 1993, 18, 247–289. [Google Scholar] [CrossRef]
  24. Stern, P.C.; Aronson, E.; Darley, J.M.; Hill, D.H.; Hirst, E.; Kempton, W.; Wilbanks, T.J. The effectiveness of incentives for residential energy conservation. Eval. Rev. 1986, 10, 147–176. [Google Scholar] [CrossRef] [Scilit]
  25. Adaman, F.; Karalı, N.; Kumbaroğlu, G.; Özdemiroğlu, E.; Zenginobuz, Ü. What determines willingness to pay for carbon reductions in Turkey? Energy Policy 2011, 39, 689–698. [Google Scholar] [CrossRef] [Scilit]
  26. Gangale, F.; Mengolini, A.; Onyeji, I. Consumer engagement: An insight from smart grid projects in Europe. Energy Policy 2013, 60, 621–628. [Google Scholar] [CrossRef] [Scilit]
  27. Fuller, M.C.; Kunkel, C.; Zimring, M.; Mellicant, I.; Hoffman, I.H. Driving Demand for Home Energy Improvements. 2010. Available online: https://emp.lbl.gov/publications/driving-demand-home-energy (accessed on 16 February 2026).
  28. Maister, D.H.; Green, C.H.; Galford, R.M. The Trusted Advisor; Free Press: New York, NY, USA, 2001; Available online: https://www.simonandschuster.com/books/The-Trusted-Advisor/David-H-Maister/9780743212342 (accessed on 15 June 2026).
  29. van der Hulst, F.J.; Brabers, A.E.; de Jong, J.D. The relation between trust and the willingness of enrollees to receive healthcare advice from their health insurer. BMC Health Serv. Res. 2023, 23, 52. [Google Scholar] [CrossRef] [Scilit] [PubMed]
  30. Kasperson, R.E.; Golding, D.; Tuler, S. Social distrust as a factor in siting hazardous facilities and communicating risks. J. Soc. Issues 1992, 48, 161–187. [Google Scholar] [CrossRef] [Scilit]
  31. Ruani, M.A.; Reiss, M.J.; Kalea, A.Z. Diet-nutrition information seeking, source trustworthiness, and eating behavior changes: An international web-based survey. Nutrients 2023, 15, 4515. [Google Scholar] [CrossRef] [Scilit] [PubMed]
  32. European Commission. NUDging consumers towards enerGy Efficiency through behavioral science (NUDGE) (Horizon 2020 Project ID 957012). CORDIS EU Research Results. 2020. Available online: https://cordis.europa.eu/project/id/957012 (accessed on 15 June 2026).
  33. Wilson, C.; Dowlatabati, H. Models of decision making and residential energy use. Annu. Rev. Environ. Resour. 2007, 32, 169–203. [Google Scholar] [CrossRef] [Scilit]
  34. Weenig, M.W.; Midden, C.J. Communication network influences on information diffusion and persuasion. J. Personal. Soc. Psychol. 1991, 61, 734–742. [Google Scholar] [CrossRef]
  35. Abrahamse, W.; Steg, L. Social influence approaches to encourage resource conservation: A meta-analysis. Glob. Environ. Change 2013, 23, 1773–1785. [Google Scholar] [CrossRef] [Scilit]
  36. Wolske, K.S.; Gillingham, K.T.; Schultz, P.W. Peer influence on household energy decisions. Nat. Energy 2020, 5, 202–212. [Google Scholar] [CrossRef] [Scilit]
  37. Kumkale, G.T.; Albarracín, D.; Seignourel, P.J. The effects of source credibility in the presence or absence of prior attitudes. J. Appl. Soc. Psychol. 2010, 40, 1325–1356. [Google Scholar] [CrossRef] [Scilit] [PubMed]
  38. Manca, F.; Sivakumar, A.; Daina, N.; Axsen, J.; Polak, J.W. Modelling the influence of peers’ attitudes on choice behaviour: Theory and empirical application on electric vehicle preferences. Transp. Res. Part A Policy Pract. 2020, 140, 278–298. [Google Scholar] [CrossRef] [Scilit]
  39. Rai, V.; Robinson, S.A. Effective information channels for reducing costs of environmentally-friendly technologies: Evidence from residential PV markets. Environ. Res. Lett. 2013, 8, 014044. [Google Scholar] [CrossRef] [Scilit]
  40. Kim, M. Peer Effects in Electric Vehicle Adoption. SSRN Abstract #5365165. 24 July 2025. Available online: https://papers.ssrn.com/sol3/papers.cfm?abstract_id=53651650 (accessed on 15 February 2026).
  41. Bollinger, B.; Gillingham, K.; Oster, S. Peer Effects in the Diffusion of Solar Photovoltaic Panels. Mark. Sci. 2012, 31, 900–912. [Google Scholar] [CrossRef] [Scilit]
  42. Min, Y. Spatial dynamics of low-carbon transitions: Peer effects and disadvantaged communities in solar energy, electric vehicle, and heat pump adoption in the United States. Energy Res. Soc. Sci. 2025, 121, 103981. [Google Scholar] [CrossRef] [Scilit]
  43. Cialdini, R.B. Influence: Science and Practice, 5th ed.; Pearson Education Ltd.: Harlow, UK, 2013. [Google Scholar]
  44. Green, D.P.; Krasno, J.S.; Coppock, A.; Farrer, B.D.; Lenoir, B.; Zingher, J.N. The effects of lawn signs on vote outcomes: Results from four randomized field experiments. Elect. Stud. 2016, 41, 143–150. [Google Scholar] [CrossRef] [Scilit]
  45. Claremont, Sustainable. Community Home Energy Retrofit Project (CHERP). Sustainable Claremont. 2026. Available online: https://sustainableclaremont.org/what-we-do/cherp/ (accessed on 15 February 2026).
  46. Census Reporter. Portland, OR Metro Area Profile. 2026. Available online: https://censusreporter.org/profiles/31000US38900-portland-vancouver-hillsboro-or-wa-metro-area/ (accessed on 15 February 2026).
  47. Portland Housing Bureau. State of Housing in Portland 2023, Part 1: Portland Demographics and Housing Stock. City of Portland. 2023. Available online: https://www.portland.gov/phb/documents/2023-state-housing-part-1-portland-demographics-and-housing-stock/download (accessed on 4 April 2026).
  48. White, I.R.; Royston, P.; Wood, A.M. Multiple imputation using chained equations. Stat. Med. 2011, 30, 377–399. [Google Scholar] [CrossRef] [Scilit] [PubMed]
  49. Garson, G.D. Factor Analysis; Statistical Associates Publishing: Asheboro, NC, USA, 2013. [Google Scholar]
  50. Schilke, O.; Reimann, M.; Cook, K.S. Trust in social life: A review. Annu. Rev. Sociol. 2021, 47, 239–259. [Google Scholar] [CrossRef] [Scilit]
  51. Landesvatter, C.; Bauer, P.C. How valid are trust survey measures? New insights from open-ended probing data and supervised machine learning. Sociol. Methods Res. 2025, 54, 534–564. [Google Scholar] [CrossRef] [Scilit]
  52. de Leeuw, E.; Hox, J. Mixing data collection methods: Lessons from social survey research. In Advances in Mixed Methods Research: Theories and Applications; Bergman, M., Ed.; SAGE Publications: Thousand Oaks, CA, USA, 2008; pp. 138–151. Available online: https://uk.sagepub.com/en-gb/eur/advances-in-mixed-methods-research/book232050 (accessed on 4 April 2026).
  53. Gromet, D.M.; Kunreuther, H.; Larrick, R.P. Political ideology affects energy-efficiency attitudes and choices. Proc. Natl. Acad. Sci. USA 2013, 110, 9314–9319. [Google Scholar] [CrossRef] [Scilit] [PubMed]
  54. Granovetter, M.S. The strength of weak ties. Am. J. Sociol. 1973, 78, 1360–1380. [Google Scholar] [CrossRef] [Scilit] [PubMed]
  55. Fiske, S.T.; Dupree, C. Gaining trust as well as respect in communicating to motivated audiences about science topics. Proc. Natl. Acad. Sci. USA 2014, 111, 13593–13597. [Google Scholar] [CrossRef] [Scilit] [PubMed]
  56. Biswas, S.; Fuentes, T.L.; McCord, K.H.; Rackley, A.L.; Antonopoulos, C.A. Decisions and decision-makers: Mapping the sociotechnical cognition behind home energy upgrades in the United States. Energy Res. Soc. Sci. 2024, 109, 103411. [Google Scholar] [CrossRef] [Scilit]
  57. Kaiser, H.F. An index of factorial simplicity. Psychometrika 1974, 39, 31–36. [Google Scholar] [CrossRef] [Scilit]
Figure 1. Conceptual model.
Energies 19 03117 g001
Figure 2. Survey images of a window sign (left), flag (top right), yard sign (bottom right).
Energies 19 03117 g002
Figure 3. Perceived Benefits of EE.
Energies 19 03117 g003
Figure 4. Trusted advisors for EE.
Energies 19 03117 g004
Figure 5. Preferred participation media.
Energies 19 03117 g005
Table 1. Descriptive statistics.
VariableObsMeanStd. Dev.MinMax
age2383.550421.8881118
employment2353.1531911.99624117
non-English language2380.03781510.191150901
gender2373.426161.93753915
political party2374.215191.77079118
household of color2360.250.43393301
education2353.8680851.5034317
renter2381.6638660.640112213
tenure2373.4008441.56080115
occupants2352.3914891.26420615
close2240.62788070.19798840.01.0
expert2240.51121510.19504580.01.0
knowledge2353.0595741.07251215
EE actions taken2382.7773111.18570505
wtp2330.34763950.477246101
all_media2350.20425530.404016901
Table 2. Multivariate regression results.
(1)(2)(3)
VARIABLESOLS—CloseOLS—ExpertLogit—All Media
age−0.0232 **0.007731.372 **
employment−0.006910.0002560.785 *
gender−0.00427−0.003881.094
party−0.00618−0.01170.976
nonwhite−0.0134−0.03410.407
education0.009880.008590.890
renter0.0137−0.0005561.974 *
tenure−0.003670.0003150.977
occupants−0.0113−0.0275 **1.074
close 10.88 *
expert 47.41 ***
knowledge−0.000886−0.0500 ***1.342
action_num0.0378 ***0.01410.904
wtp0.0650 **0.04231.374
language−0.06300.0321
Constant0.632 ***0.687 ***0.000836 ***
Observations211211211
R20.1640.228
Adjusted R20.1090.177
Pseudo R2 0.142
*** p < 0.01, ** p < 0.05,* p < 0.1.
Disclaimer/Publisher’s Note: The statements, opinions and data contained in all publications are solely those of the individual author(s) and contributor(s) and not of MDPI and/or the editor(s). MDPI and/or the editor(s) disclaim responsibility for any injury to people or property resulting from any ideas, methods, instructions or products referred to in the content.