


Abstract
The increasing integration of renewable energy sources, high-voltage direct current (HVDC) and power-electronics-based equipment has intensified the exposure of transformer windings to high-frequency voltage components, steep-front transients and high-dv/dt stresses, highlighting the need for detailed high-frequency winding models. This study presents a high-frequency model of a six-section winding assembly corresponding to one phase of a 10 kV/0.41 kV, Dyn11, 2500 kVA distribution transformer. The winding assembly was experimentally investigated under coreless conditions using frequency response analysis (FRA) measurements over the frequency range of 20 Hz–2 MHz. Frequency-dependent resistance parameters were extracted from finite element method (FEM)-based electromagnetic field analyses, while the self- and mutual inductance matrix and the capacitance parameters were obtained from electromagnetic and electrostatic field solutions, respectively. The resulting segmented resistance–inductance–mutual inductance–capacitance (R-L-M-C) equivalent circuit model was solved in the frequency domain using Modified Nodal Analysis (MNA). Before the FRA-based validation, the low-frequency consistency of the model was checked at 50.431 Hz, where the calculated and measured magnitudes differed by only 0.1074 dB. Over the common frequency range, the model achieved a root mean square error (RMSE) of 3.09 dB and a mean absolute error (MAE) of 1.76 dB. The results show that the proposed field-extracted model can represent the overall FRA trend, the dominant attenuation region and the main resonance/anti-resonance characteristics of the winding assembly, although deviations remain around sharp resonance points.
1. Introduction
Power transformers are among the most critical and costly components in electrical power systems, since their reliable operation directly affects the continuity, stability and security of generation, transmission and distribution networks. In recent years, the operating conditions of power transformers have become increasingly complex due to the integration of renewable energy sources, high-voltage direct current (HVDC) links, flexible AC transmission system (FACTS) devices, energy storage systems and gas-insulated substations. These developments have increased the importance of electromagnetic transient studies, as high-frequency interactions between transformers and the surrounding network may create hazardous operating conditions and jeopardize the dielectric integrity of transformer insulation systems [1,2].
In addition to conventional lightning impulses, switching operations and short-circuit events, modern power systems may expose transformer windings to steep-front voltage excitations, high-dv/dt stresses and converter-induced high-frequency components. Such fast transients can produce non-uniform voltage distributions along the winding, local overvoltage concentrations, resonance phenomena and additional electrical stress on the insulation system. Although factory proof tests defined in existing standards are essential for transformer qualification, they do not completely address all types of transient events that may occur in field operation. Therefore, standard transient calculations based only on lightning or switching impulses may not be sufficient to assess the maximum dielectric stress during actual operating conditions [3].
Accurate high-frequency transformer models are therefore required to evaluate transient overvoltages, resonance behavior, damping and internal voltage distributions. Conventional low-frequency equivalent circuits are generally suitable for power-frequency studies, load-flow analysis and short-circuit calculations; however, they cannot represent the distributed electromagnetic interactions that dominate the winding response in the kHz–MHz frequency range. In detailed high-frequency studies, transformer windings are commonly represented by segmented resistance–inductance–mutual inductance–capacitance (R-L-M-C) networks, where the winding is divided into sections and described using series resistances, self-inductances, mutual inductances, series capacitances and shunt or coupling capacitances [4]. Such models are capable of representing not only terminal impedance or transfer functions, but also internal node voltages and segment-level voltage distributions [5].
Frequency Response Analysis (FRA) is widely used as a non-destructive technique for assessing transformer winding condition because the measured response is strongly related to the physical and geometrical properties of the winding [6]. The transformer winding behaves as a complex R-L-M-C network and mechanical or electrical changes in the winding alter the equivalent circuit parameters, which in turn modify the measured transfer function. However, despite its high sensitivity, FRA interpretation remains a major challenge because the relationship between a specific fault type and the corresponding change in the frequency response is not always explicit [7]. For this reason, interpretation approaches based on numerical indices, transfer-function estimation, artificial intelligence and detailed winding modelling have been proposed [8]. In addition to fault diagnosis, FRA measurements are also commonly used as reference data for validating high-frequency transformer winding models, since the measured response reflects the combined effect of resistive, inductive and capacitive interactions within the winding structure [9].
The need for physically interpretable winding models arises from the requirement to make the interpretation of FRA measurements more quantitative and objective for transformer fault diagnosis [10]. In cases where detailed design information is limited, model parameters are often estimated from measurement data obtained at the transformer terminals by using optimization-based, metaheuristic, artificial-intelligence-based, analytical, or system-identification methods [11,12,13]. These approaches are useful for practical applications; however, the main challenges of parameter estimation based only on terminal measurements are from non-unique solutions, dependence on initial parameter assumptions, convergence problems and physically ambiguous parameter sets [14]. In contrast, detailed physics-based high-frequency models can directly relate the model parameters to winding geometry, material properties and electromagnetic field distributions. However, such models require detailed design information and accurate field-based parameter extraction [15]. Among these approaches, physics-based winding models are particularly important because they can relate resonance shifts and amplitude variations in FRA traces to changes in physical circuit parameters [16].
The accurate representation of frequency-dependent parameters is another critical issue in high-frequency transformer winding modeling. At high frequencies, skin effect, proximity effect, eddy-current losses and dielectric behavior affect the winding resistance, inductance, mutual coupling and damping characteristics [17]. Neglecting these effects may result in significant deviations in resonance frequencies and resonance amplitudes. Previous high-frequency lumped-parameter studies have shown that frequency-dependent resistance and inductance parameters are necessary to correctly represent transient damping and resonance behavior [18,19]. In addition, frequency-dependent core and proximity effects have been shown to significantly influence the transient response of transformer windings. FEM-based and combined analytical–FEM approaches have also been used to calculate resistive, inductive and capacitive parameters for detailed high-frequency models [20,21].
In this context, the present study develops and experimentally validates a physics-based high-frequency white-box model of a coreless six-section winding assembly corresponding to one phase of a 10 kV/0.41 kV, Dyn11, 2500 kVA distribution transformer. The winding sections were arranged according to the axial configuration of the original transformer design and reference FRA measurements were performed over the frequency range of 20 Hz–2 MHz. The coreless configuration was selected to isolate the high-frequency behavior of the winding structure from the effects of the magnetic core, tank, low-voltage winding and terminal connections. This configuration enables the inter-section capacitive couplings, air-core self- and mutual-inductive interactions, frequency-dependent winding resistance and resonance formation mechanisms of the winding structure to be investigated more clearly.
The main innovation of this study is the experimental validation of a physics-based, FEM-extracted R-L-M-C white-box model for a real six-section transformer winding assembly under controlled air-core conditions. Unlike terminal-response-based curve-fitting approaches, the parameters of the proposed model are directly related to the winding geometry, material properties and electromagnetic and electrostatic field distributions. The model incorporates frequency-dependent winding resistance, an air-core self- and mutual-inductance matrix and field-extracted capacitance parameters. The internal winding nodes are retained and the resulting circuit is solved in the frequency domain using Modified Nodal Analysis (MNA). The controlled coreless configuration enables the winding-dominated electromagnetic and electrostatic interactions to be examined independently of the magnetic core, tank, low-voltage winding and external transformer connections. Accordingly, the proposed approach provides a physically interpretable winding model rather than a model obtained solely by fitting the measured FRA response.
The present validation is limited to a coreless six-section winding assembly under a single-section excitation condition. Therefore, the model should be interpreted as a validated winding submodel rather than a complete three-phase transformer model. The proposed methodology can be extended to model the high-frequency behavior of three-phase transformers with several modifications. An R-L-M-C model can be established for each phase winding. The magnetic and capacitive couplings between the phases can be included, while the magnetic core, tank, additional windings, leads and insulation structures can be incorporated into a three-dimensional field model. The parameters obtained from these field analyses can be transferred to the extended equivalent circuit. Finally, the complete model can be validated using FRA measurements performed separately for each phase under the same terminal, grounding and winding-termination conditions represented in the model.
The proposed model obtains the frequency-dependent winding resistance from FEM-based electromagnetic field analyses. The air-core self- and mutual-inductance matrix is extracted from electromagnetic field solutions and kept frequency-independent in the present coreless validation case. The capacitance parameters are obtained from electrostatic field solutions. These parameters are incorporated into a segmented R-L-M-C equivalent circuit model. The resulting frequency-domain response is governed by the frequency-dependent resistance model together with the and contributions of the inductive and capacitive networks. The equivalent circuit is solved using the MNA method and the calculated FRA responses are compared with experimental measurements obtained under the same connection configuration. The main contributions of this study are summarized as follows:
- FRA tests were performed on a coreless six-section winding assembly corresponding to one phase of a 10 kV/0.41 kV, Dyn11, 2500 kVA distribution transformer.
- A physics-based segmented R-L-M-C high-frequency equivalent circuit model is developed for the tested winding structure.
- Frequency-dependent winding resistance the air-core self- and mutual-inductance matrix and the capacitance parameters are extracted from field analyses and incorporated into the high-frequency circuit model.
- The developed model is solved using MNA in the frequency domain and validated against FRA measurements in the 20 Hz–2 MHz frequency range.
Section 2 describes the experimental setup, FRA measurement configuration, FEM-based parameter extraction, high-frequency equivalent circuit modeling and MNA-based frequency-domain solution procedure. Section 3 presents the measurement-model comparison results and discusses the validation of the proposed air-core model. Section 4 summarizes the main conclusions and future applications of the proposed modeling approach.
2. Materials and Methods
2.1. Experimental Setup and FRA Measurements
The main specifications of the transformer to which the investigated winding assembly belongs are given in Table 1. The transformer is rated at 2500 kVA, with a voltage ratio of 10 kV/0.41 kV and Dyn11 connection group. In this study, the measurements were not performed on the complete transformer. Instead, a six-section winding assembly corresponding to one phase of the transformer was experimentally investigated.
Table 1.
Main specifications of the transformer associated with the investigated winding assembly.
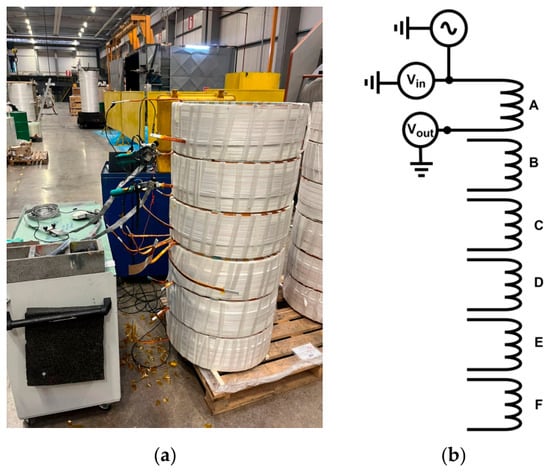
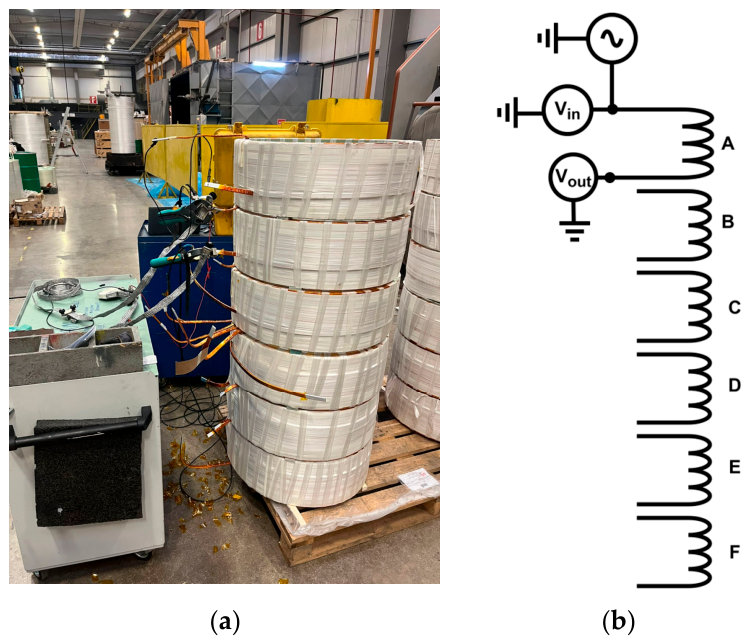
The winding sections were stacked according to the axial arrangement of the original transformer design, thereby preserving the relative positioning of the sections in the actual winding structure. This configuration was selected to isolate the high-frequency behavior of the winding from the effects of the magnetic core, tank, low-voltage winding and external terminal connections. The experimental setup used during the FRA measurements and the corresponding terminal connection configuration are shown in Figure 1.
Figure 1.
Experimental FRA measurement setup and terminal connection configuration: (a) six-section winding assembly used in the FRA test; (b) section-A measurement configuration, where section A is connected to the FRA device and sections B–F are left open-circuited.
In the measurement configuration, A, B, C, D, E and F denote the individual winding sections of the tested assembly. Therefore, the investigated structure should be considered as a controlled winding subassembly rather than a complete three-phase transformer model. This approach enables the inter-section electromagnetic interactions, capacitive couplings and resonance characteristics of the winding structure to be examined more clearly under coreless conditions. The FRA measurements obtained from this assembly were used as reference data for validating the proposed frequency-dependent high-frequency equivalent circuit model. Reference FRA measurements were carried out on the winding assembly over the frequency range of 20 Hz–2 MHz. In the measurement configuration considered in this study, the input and output terminals of section A were connected to the FRA device, while sections B, C, D, E and F were left open-circuited. This open-circuit boundary condition preserves the capacitive and inductive interactions between section A and the remaining unexcited sections. Therefore, it provides a resonance-rich response and a challenging validation case for assessing the proposed high-frequency model. The corresponding terminal and boundary conditions are summarized in Table 2. To ensure a consistent comparison between measurement and simulation, the same terminal and boundary conditions were also implemented in the high-frequency equivalent circuit model.
Table 2.
FRA measurement configuration used for section A under coreless condition.
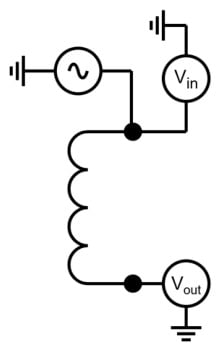
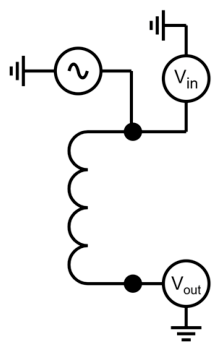
The general measurement principle used in the FRA tests is illustrated in Figure 2. In the section-A connection configuration used for the present validation, a sinusoidal excitation signal is applied to the input terminal of section A and the output response is measured at the corresponding terminal while both signals are referenced to the common ground. The FRA response is then obtained from the ratio between the measured output and input signals.
Figure 2.
General FRA measurement principle for the section-A connection configuration used in the air-core winding validation.
In this measurement, a swept-frequency voltage signal is applied to the input terminal of the investigated winding section and the response voltage is measured at the output terminal. For each frequency point, the transfer function of the winding structure is obtained from the ratio of the output voltage to the input voltage as
where is the applied input voltage, is the measured output voltage and represents the frequency response of the winding structure. The magnitude response in decibels is expressed as
2.2. Parameter Extraction Using FEM
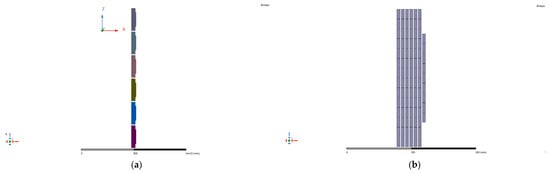
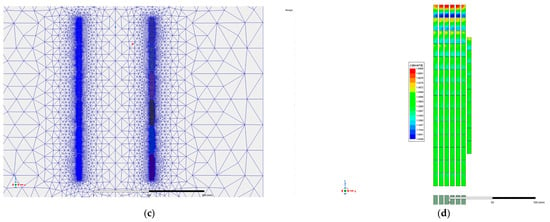
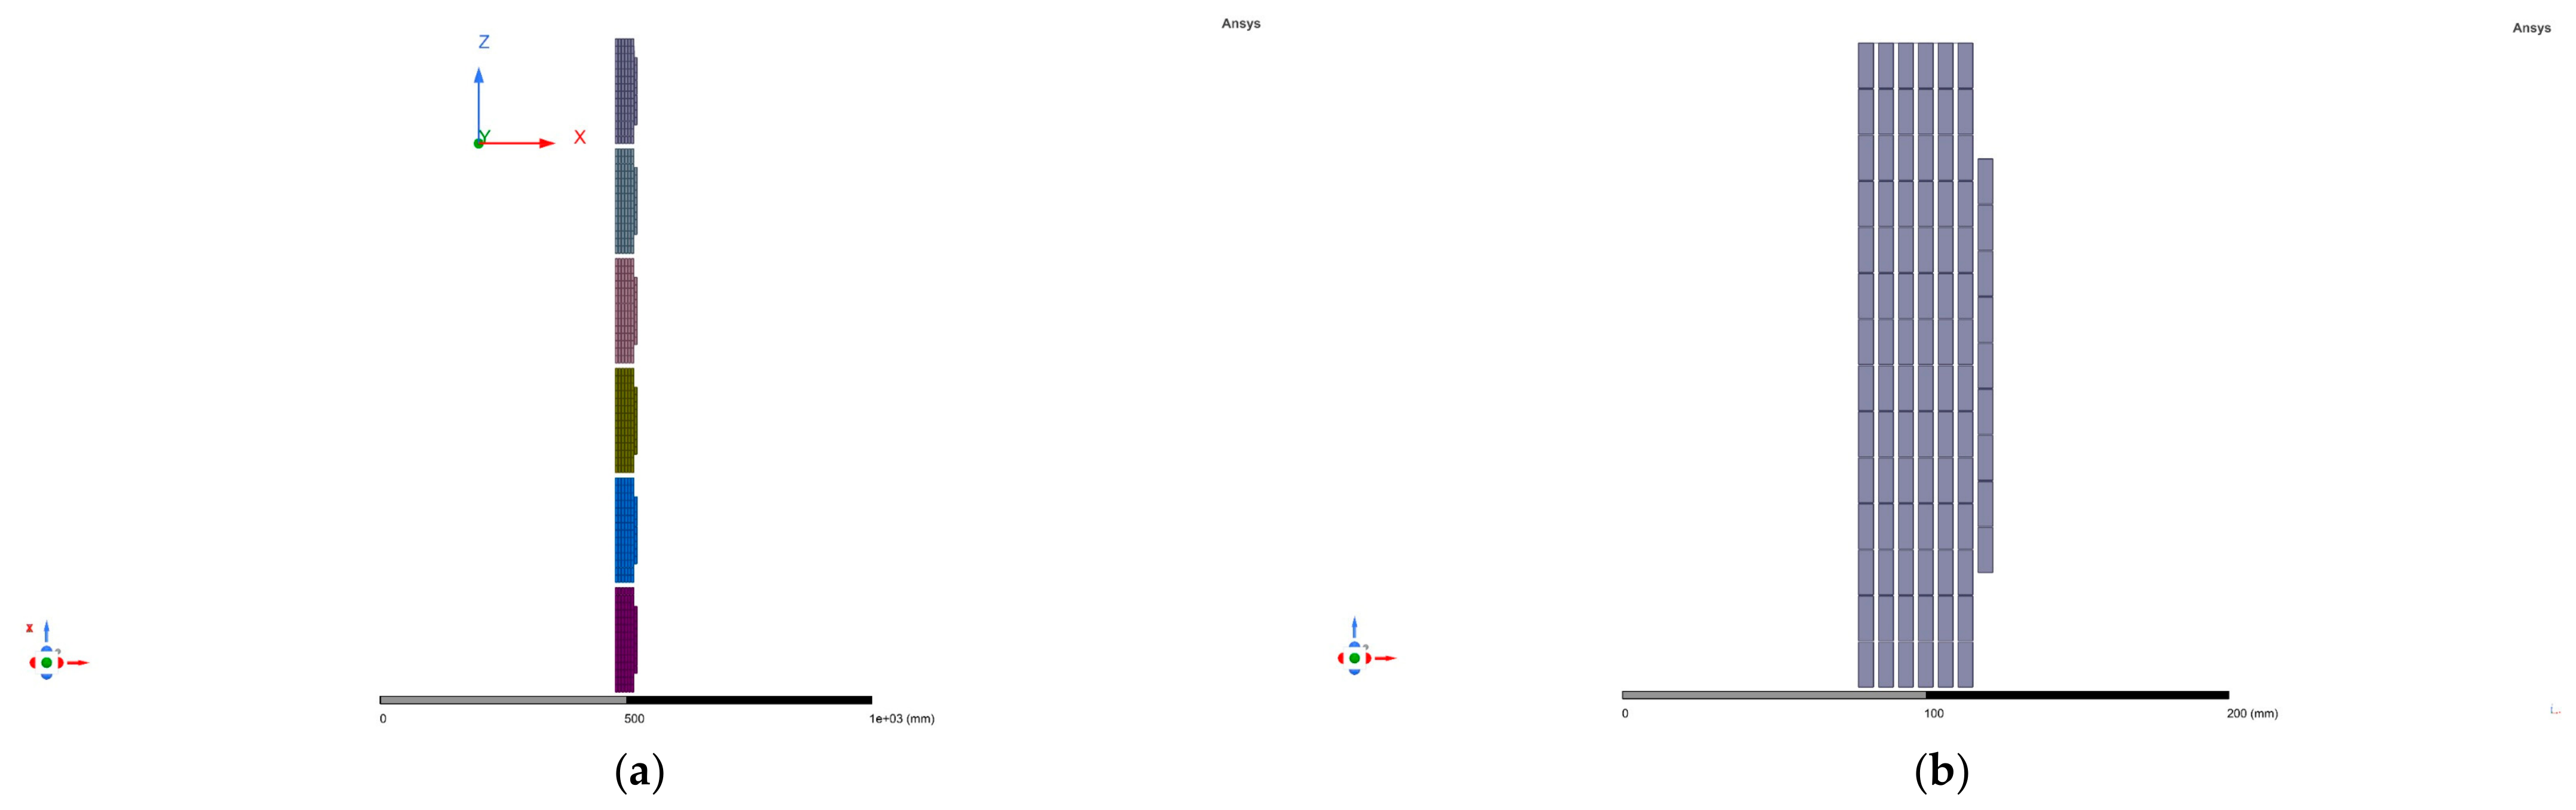
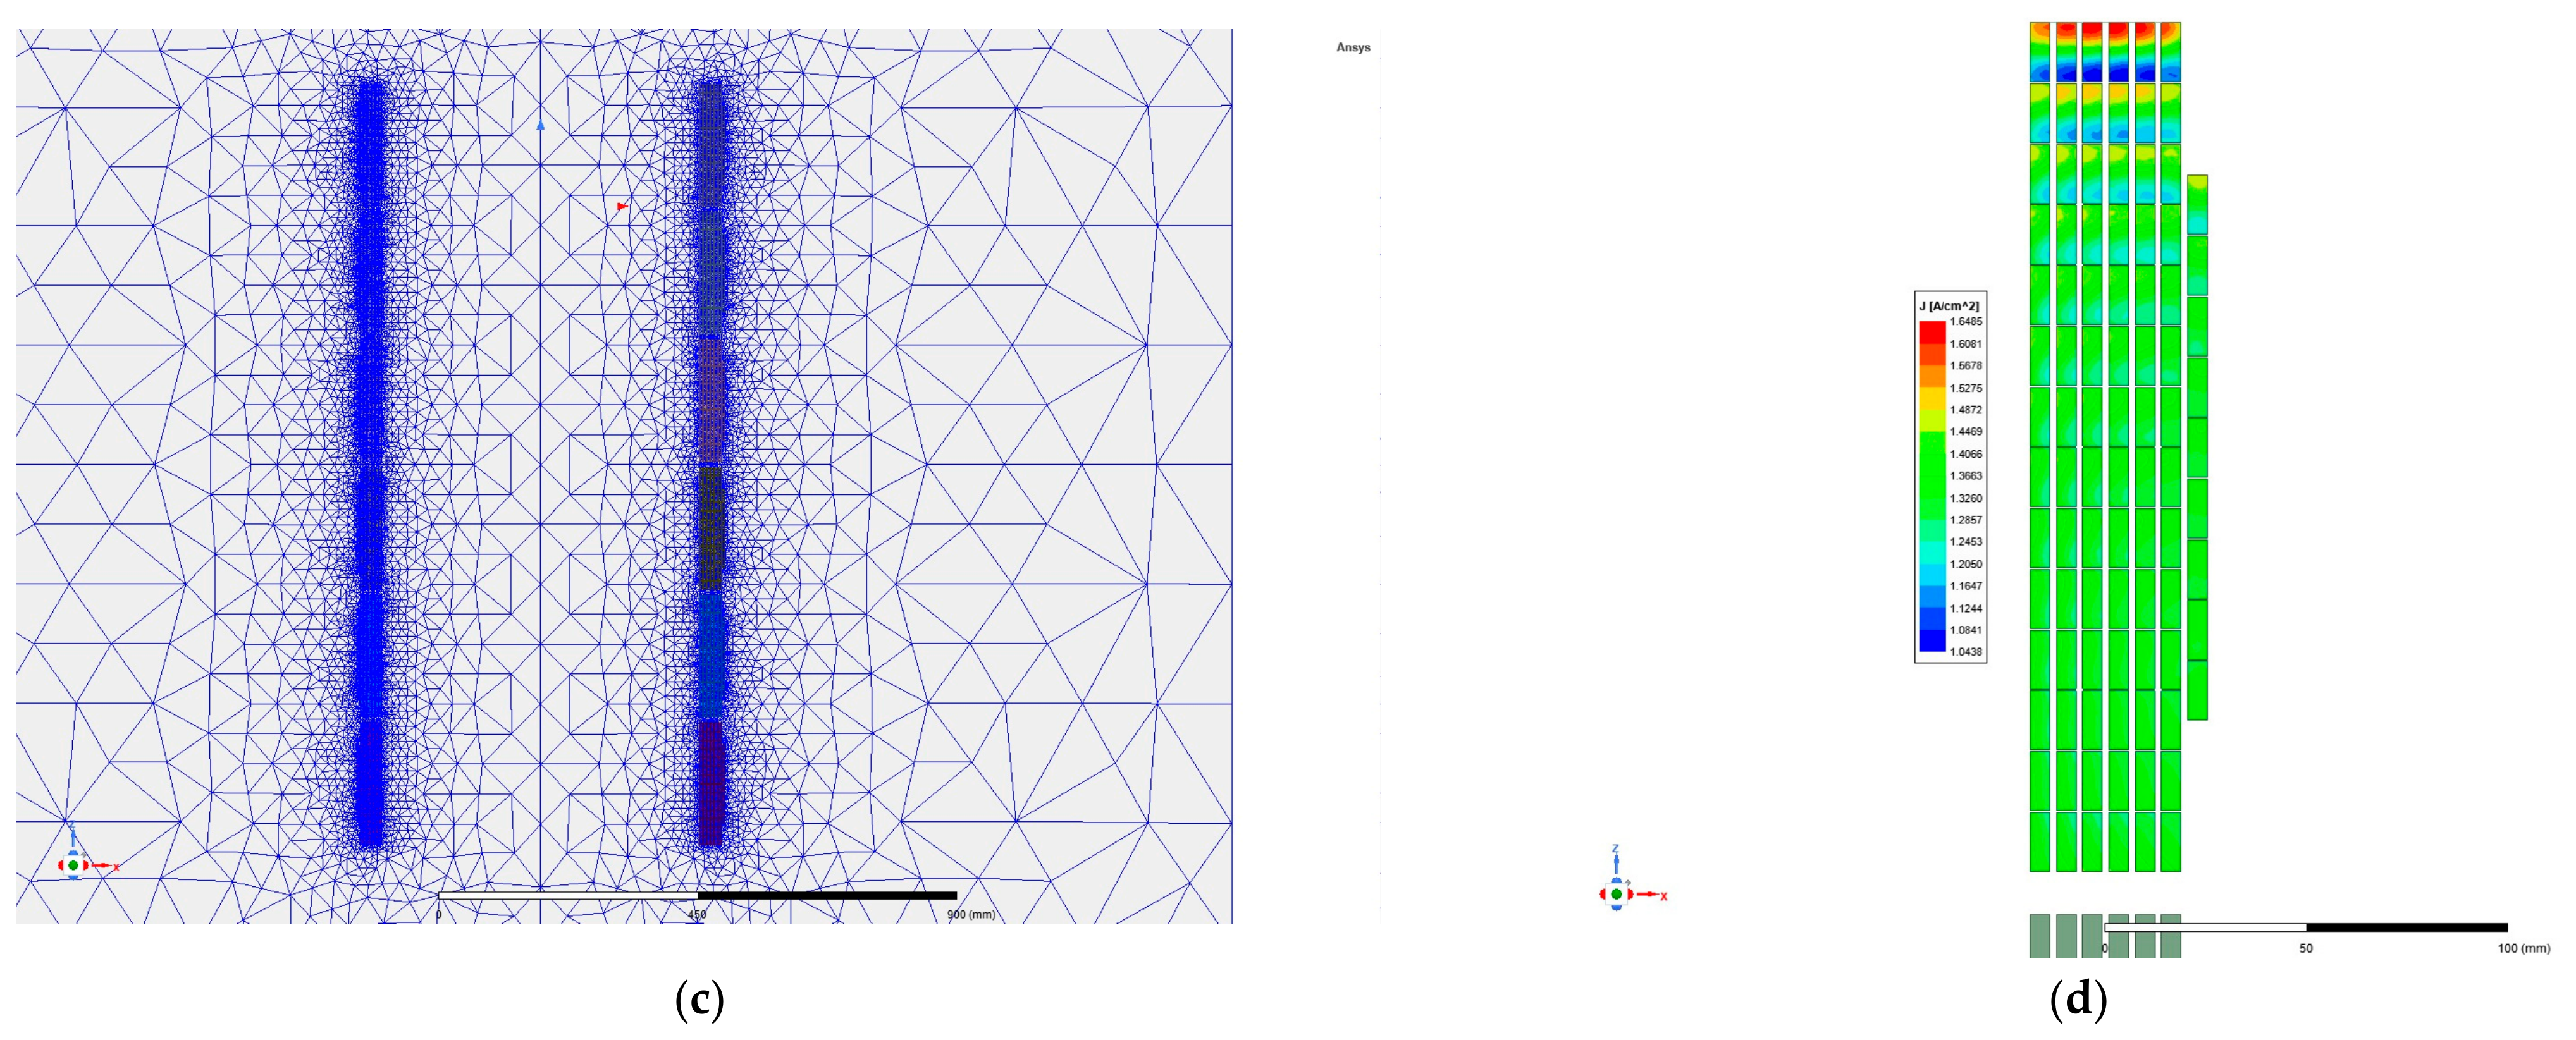
The FEM model used for field-based parameter extraction is shown in Figure 3. The winding assembly was modeled according to the physical geometry of the tested six-section structure. The same geometrical model was used as the basis for the electromagnetic and electrostatic field analyses. A refined finite-element mesh was applied around the winding conductors and insulation regions, where the field variation is more pronounced. The current-density distribution obtained from the AC electromagnetic solution was used to evaluate the frequency-dependent resistance parameters of the winding sections.
Figure 3.
FEM model used for field-based parameter extraction: (a) axial arrangement of the six-section winding assembly; (b) detailed conductor representation used in the field solution; (c) finite-element mesh around the winding conductors; (d) current-density distribution at 50 Hz obtained from the AC electromagnetic analysis.
2.2.1. Extraction of Frequency-Dependent Resistance Parameters
The frequency-dependent resistance parameters were obtained from AC electromagnetic field analyses performed in ANSYS Maxwell in Ansys Electronics Desktop 2022 R1. In these analyses, the winding conductors were modeled according to the actual geometry and material properties of the investigated winding structure. A frequency-domain eddy-current solution was used to account for the redistribution of current inside the conductors as the frequency increases.
At low frequencies, the current distribution in the conductors is relatively uniform. However, with increasing frequency, the skin effect and proximity effect cause the current density to become non-uniform. This increases the effective resistance of the winding sections and directly affects the damping of the high-frequency equivalent circuit model. Therefore, the winding resistance was not treated as a constant parameter.
For each selected frequency point, the electromagnetic field solution was used to calculate the current-density distribution and the corresponding ohmic losses in each winding section. The effective resistance of the i-th winding section was calculated from the loss-current relationship as
where is the ohmic loss obtained from the field solution and is the rms current of the corresponding winding section at frequency. In this way, the frequency-dependent branch resistance values were obtained and then assembled into the resistance matrix used in the MNA-based circuit model.
The branch resistance matrix can be written as
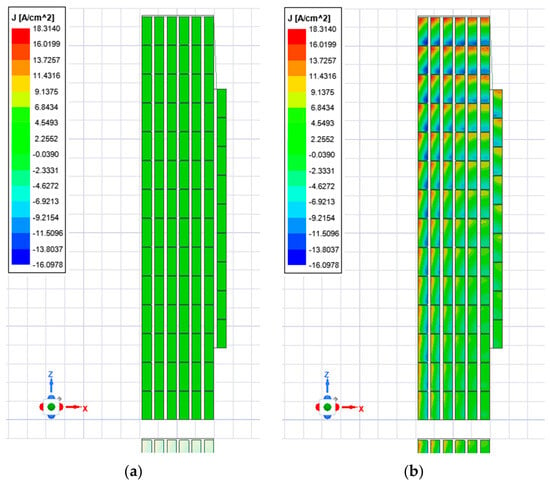
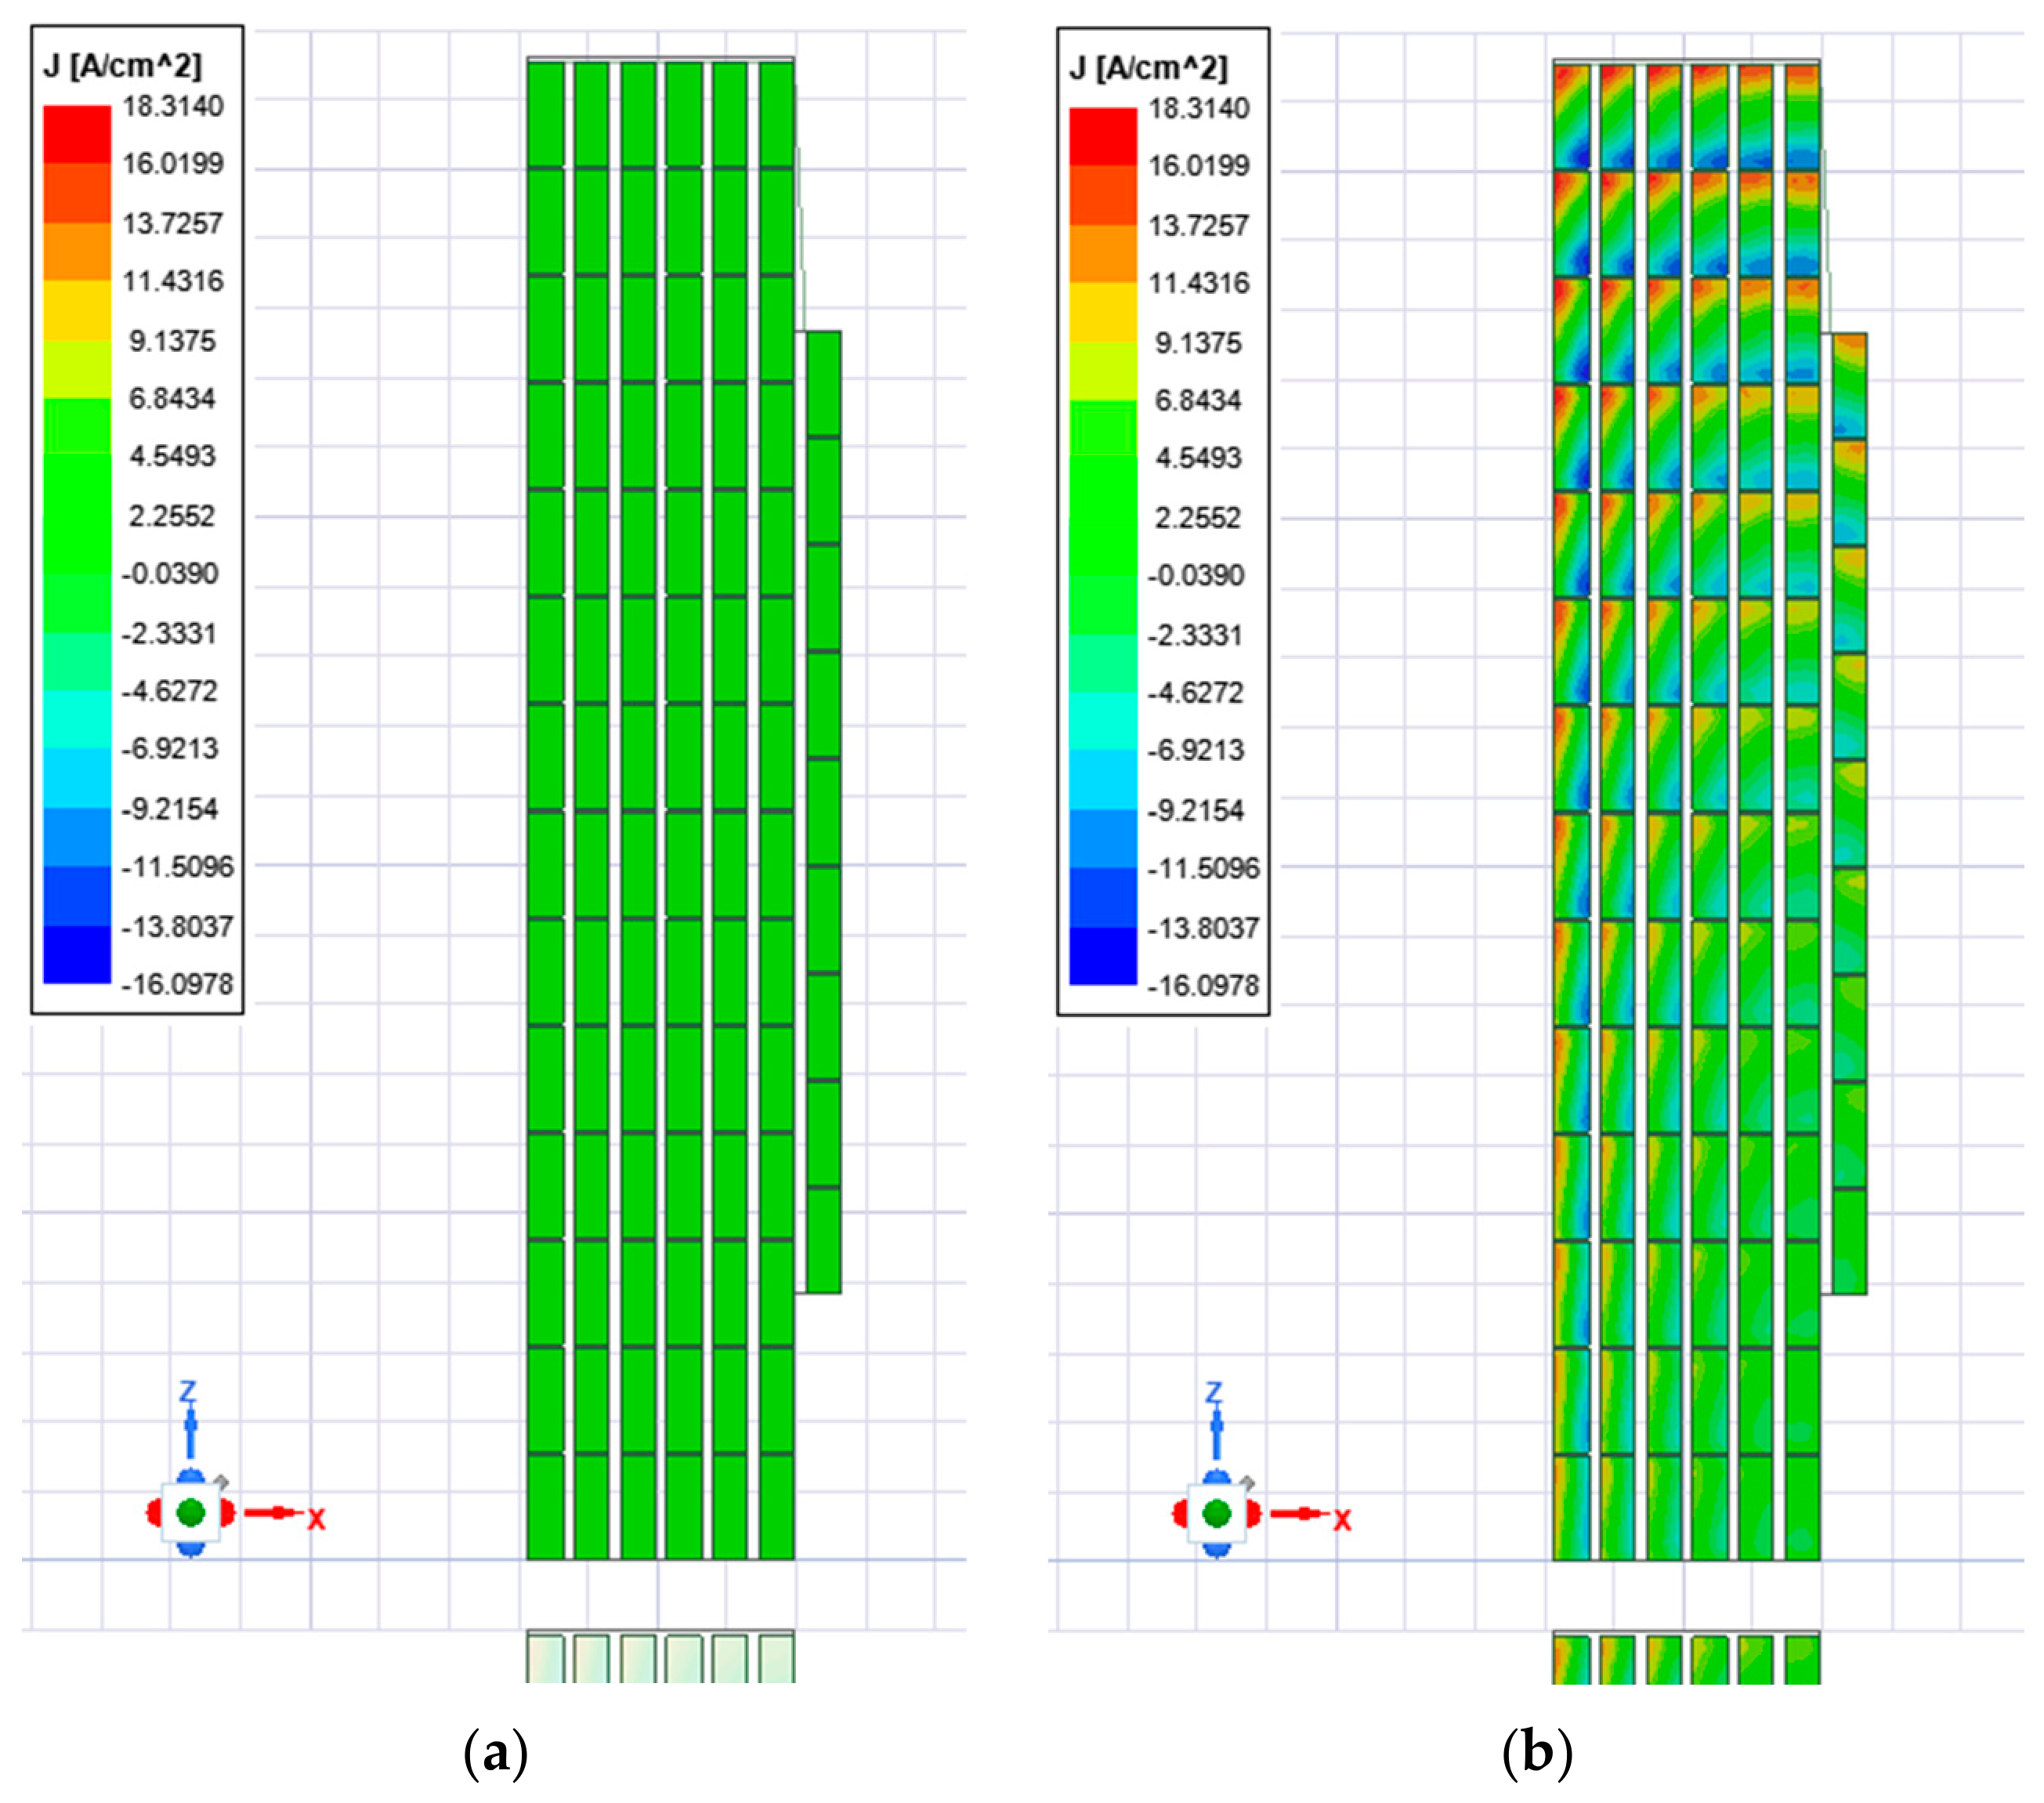
Here, n denotes the total number of conductor sections represented in the segmented equivalent circuit and corresponds to the frequency-dependent series resistance of the i-th conductor section. The current-density distributions obtained at 50 Hz and 1 kHz are shown in Figure 4. At 50 Hz, the current distribution is relatively uniform within the conductor regions.
Figure 4.
AC electromagnetic analysis results for resistance extraction: (a) current density at 50 Hz; (b) current density at 1 kHz.
As the frequency increases, the current density distribution becomes more non-uniform due to skin and proximity effects. This behavior is caused by the reduction in skin depth and by the time-varying magnetic fields produced by neighboring conductors. These fields induce eddy-current and proximity-effect current redistribution inside the conductors, forcing the current to concentrate near the conductor surfaces and in regions facing adjacent conductors. Therefore, for the same excitation current, the current flows through a smaller effective cross-sectional area, which increases the local current-density magnitude and the corresponding ohmic losses. This redistribution increases the effective AC resistance of the winding sections and was therefore considered in the extraction of the frequency-dependent resistance parameters.
2.2.2. Extraction of Air-Core Self- and Mutual-Inductance Parameters
The self- and mutual-inductance parameters of the winding assembly were obtained from an air-core electromagnetic field solution. Since the experimental FRA validation in this study was performed under coreless conditions, no magnetic-core contribution was included in the inductance extraction. This approach allows the inductive coupling behavior of the winding structure itself to be represented without the additional effects of core permeability, flux penetration, core losses, or magnetic saturation.
For the present air-core validation case, the extracted self- and mutual-inductance values were treated as frequency-independent parameters. The air-core inductance matrix can be written as
The diagonal terms of correspond to the self-inductances of the segmented winding sections, while the off-diagonal terms correspond to the mutual inductances between sections i and j. Here, n denotes the total number of conductor sections represented in the segmented equivalent circuit. For implementation in the circuit model, the mutual inductance terms were converted into coupling coefficients as
where is the coupling coefficient between winding sections i and j. Although the extracted air-core inductance matrix is kept constant, its contribution to the frequency-domain circuit equations varies with frequency through the term in the MNA formulation.
2.2.3. Extraction of Capacitive Parameters
The capacitance parameters were obtained from electrostatic field analyses performed in ANSYS Maxwell using the electrostatic solver. In this analysis, the winding sections, insulation regions and surrounding dielectric structure were modeled according to the physical geometry of the tested winding assembly. Since capacitance is mainly governed by geometry and dielectric properties, the capacitance parameters were extracted from the electric field and stored electrostatic energy distributions. The resulting capacitance network includes series capacitances along each winding section, capacitive couplings between neighboring winding nodes and inter-section capacitances between different winding sections. For two adjacent winding nodes and , the local capacitive contribution can be written as
where is the capacitance between adjacent winding nodes and and are the capacitances from the corresponding nodes to the reference potential, if applicable.
In the present air-core validation model, the extracted capacitance parameters were kept frequency-independent. Their effect in the frequency-domain MNA solution is represented through the term. Therefore, only the winding resistance was updated at each frequency point, whereas the air-core inductance matrix and the capacitance matrix C were kept constant.
2.3. Detailed High-Frequency Equivalent Circuit Modeling
Using the parameters extracted from the field analyses, a detailed segmented R-L-M-C high-frequency equivalent circuit model was developed for the six-section winding assembly. Unlike conventional low-frequency transformer equivalent circuits, which mainly represent the terminal behavior at power frequency, the proposed model preserves the internal electrical nodes of the winding structure. Therefore, it provides a more detailed physical representation of the winding structure than terminal-only equivalent circuits.
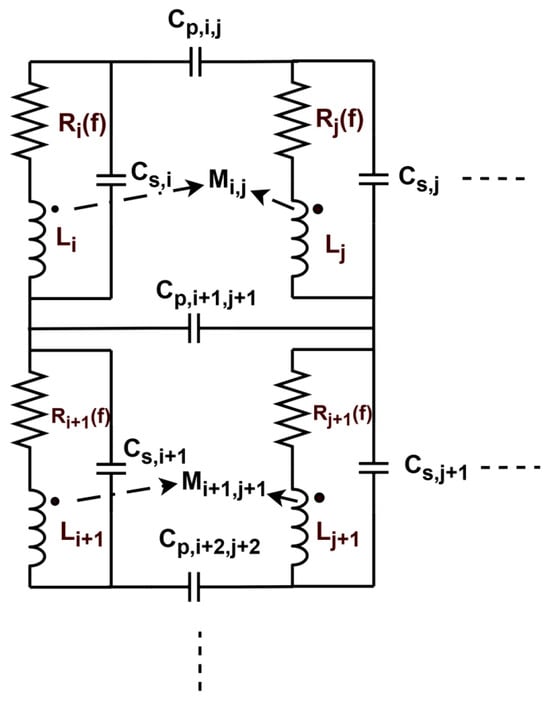
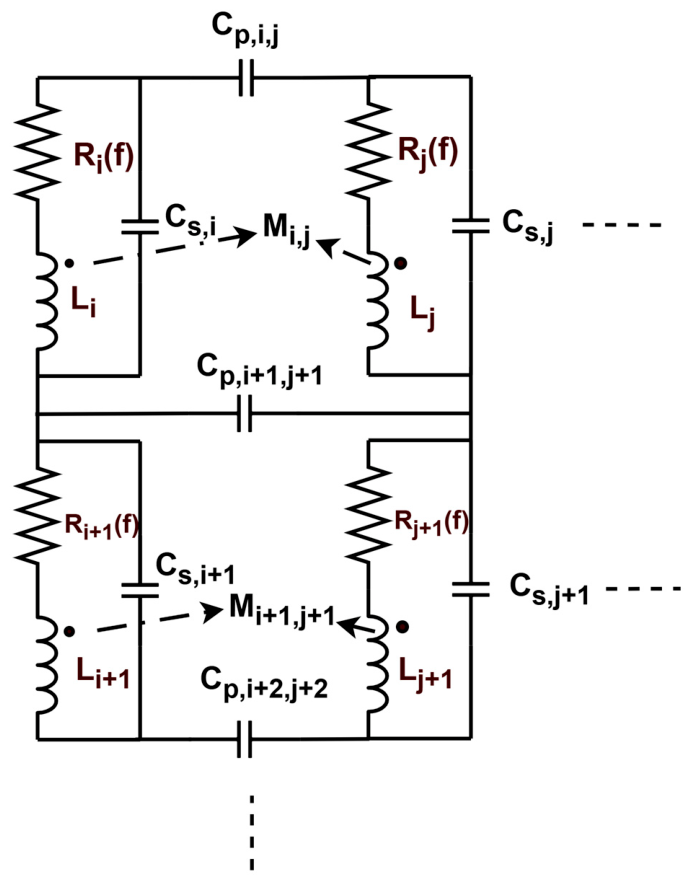
The circuit topology provides a physics-based representation of the dominant electromagnetic interactions that determine the high-frequency behavior of the winding assembly. As shown in Figure 5, each segmented conductor branch of the winding model is represented by a frequency-dependent series resistance and an air-core self-inductance. Mutual inductive couplings and capacitive couplings between neighboring sections are also included in the segmented network. The resonance and anti-resonance characteristics observed in the FRA measurements are governed by the combined effect of the inductive terms and the capacitive terms. All pairwise mutual inductive couplings between the segmented winding inductors were included in the model. In Figure 5, only representative mutual couplings are shown for clarity.
Figure 5.
Representative segment of the proposed segmented R-L-M-C high-frequency equivalent circuit.
Since the internal nodes of the winding are retained in the model, the proposed structure can also be used to investigate segment-level voltage distributions in future transient and insulation stress studies. In the implemented model, each of the six winding sections contains seven radially arranged turns and each turn was discretized into three axial subdivisions. Accordingly, each winding section was represented by 21 main R-L branches, resulting in a total of 126 main R-L branches for the complete six-section winding assembly. Figure 5 shows only a representative portion of the complete segmented network for clarity.
The winding resistances and are frequency-dependent, whereas the air-core self-inductances and , mutual inductances , and capacitance parameters and are kept frequency-independent in the present validation model. Only representative mutual couplings are shown for clarity.
2.4. MNA-Based Frequency-Domain Solution of the Equivalent Circuit Model
The segmented R-L-M-C equivalent circuit shown in Figure 5 was solved in the frequency domain using the MNA method. In the proposed circuit model, each winding section is represented by a frequency-dependent resistance element and an air-core self-inductance. The magnetic coupling between winding sections is represented by mutual inductance terms. All pairwise mutual inductive couplings between the segmented winding inductors were included in the model. The electrostatic couplings between winding sections are included through the capacitance matrix. No additional winding-to-ground or inter-winding conductance elements were considered in the present model.
At each frequency point, the resistance matrix was updated using the field-extracted data, while the extracted air-core inductance and capacitance matrices were directly used in the frequency-domain MNA formulation. The MNA system corresponding to the circuit in Figure 5 can be written as
Here, v is the vector of nodal voltages, is the vector of currents through the inductive branches and is the source current. The matrix is the admittance matrix assembled from the frequency-dependent resistance elements . The matrix C is the capacitance matrix obtained from electrostatic field solutions and is the incidence matrix of the inductive branches. The matrix denotes the extracted air-core inductance matrix, including both self- and mutual-inductance terms. In this formulation, enters the MNA system through the block, while the capacitance matrix contributes through the admittance term. The vector b defines the connection of the voltage source to the excited terminals.
It should be noted that does not represent additional dielectric conductance. It only represents the admittance contribution of the winding resistance elements included in the equivalent circuit. Therefore, the formulation is consistent with the R-L-M-C model structure adopted in this study.
In the implemented frequency-domain solution the terminal behavior of the modeled winding section was represented by the equivalent impedance . The 50 Ω impedance was not included as an additional physical resistor in the MNA network; it was used only as a reference impedance for converting the calculated equivalent impedance into an equivalent FRA magnitude. For comparison with the FRA magnitude measured in a 50 Ω system, was converted into an equivalent transfer magnitude using the same reference impedance as
and its magnitude in decibels is calculated as
3. Results and Discussion
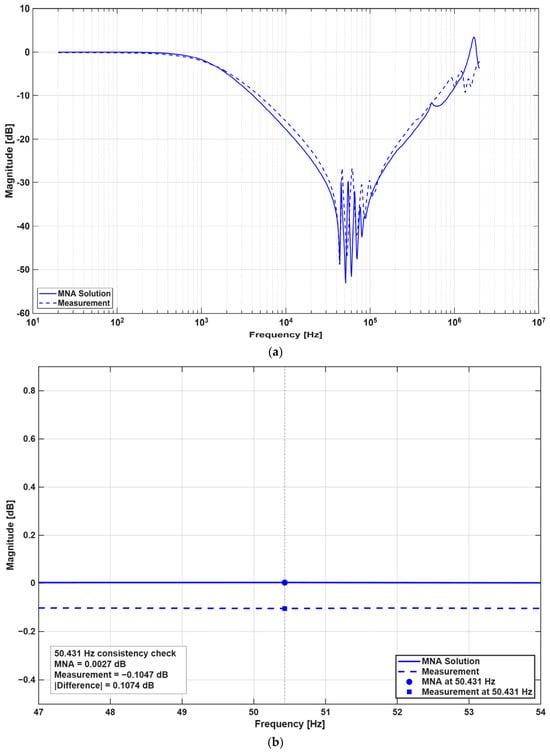
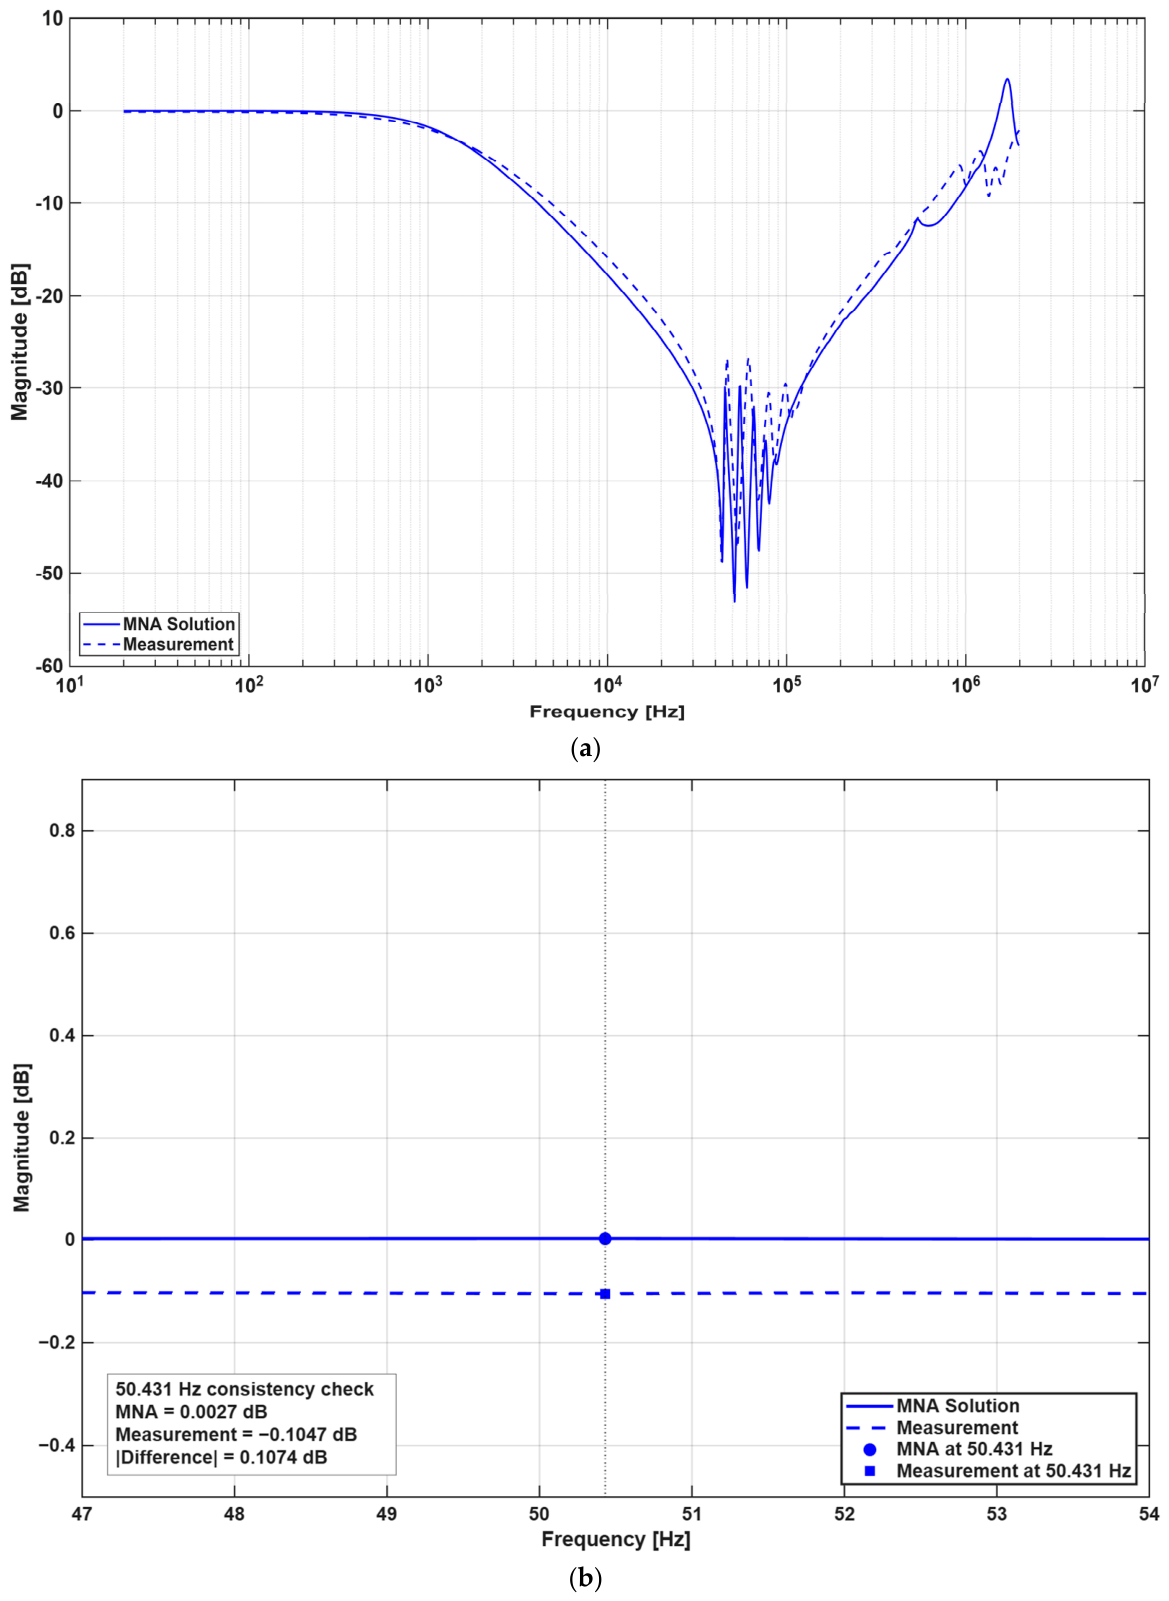
The measured and MNA-calculated FRA magnitude responses of section A are compared in Figure 6a. The calculated response follows the overall trend of the measured response over the investigated frequency range. Before evaluating the resonance behavior, the low-frequency response of the model was checked near the power frequency, at 50.431 Hz, as shown in Figure 6b. At this frequency, the MNA-calculated magnitude was 0.0027 dB, while the interpolated measured magnitude was −0.1047 dB, corresponding to an absolute difference of 0.1074 dB. The calculated equivalent impedance magnitude at the same frequency was 1.8697 Ω. This low-frequency comparison was used as an initial consistency check rather than as a standalone validation of the high-frequency model.
Figure 6.
Comparison of the measured and MNA-calculated FRA magnitude responses of section A: (a) full frequency range from 20 Hz to 2 MHz; (b) enlarged view of the low-frequency consistency check around 50.431 Hz.
Although the exact location and depth of the sharp resonance features are not captured perfectly, the model captures the overall attenuation trend, the dominant resonance region and the recovery behavior at higher frequencies. These results indicate that the field-extracted frequency-dependent the air-core self- and mutual-inductance matrix and the capacitance parameters represent the main electromagnetic interactions governing the FRA behavior of the tested winding assembly.
To evaluate the agreement between measurement and simulation quantitatively, the error between the measured and MNA-calculated FRA responses was calculated over the full frequency range and over three sub-bands. In this study, the frequency range was divided into a low-frequency region from 20 Hz to 2 kHz, a middle-frequency region from 2 kHz to 100 kHz and a high-frequency region from 100 kHz to 2 MHz. Root mean square error (RMSE) and mean absolute error (MAE) were calculated in decibels. The error at each frequency point was defined as the difference between the calculated and measured magnitude responses:
where is the MNA-calculated magnitude response, is the measured FRA magnitude response and is the -th frequency point. The RMSE and MAE were then calculated as
where N is the number of frequency points considered in the corresponding frequency range. These metrics were calculated for the full frequency range and for the low-, middle- and high-frequency sub-bands. The obtained error metrics are summarized in Table 3.
Table 3.
Error metrics between the measured and MNA-calculated FRA responses.
Over the full frequency range of 20 Hz–2 MHz, the RMSE and MAE were obtained as 3.09 dB and 1.76 dB, respectively. The lowest error was obtained in the low-frequency region, where the RMSE and MAE were 0.22 dB and 0.20 dB, respectively. This result shows that the proposed model represents the low-frequency behavior of the winding with good accuracy.
In the middle-frequency region, the RMSE increased to 4.15 dB and the MAE to 2.62 dB. This increase is mainly associated with the sharp resonance and anti-resonance behavior observed in this band. In this frequency range, small deviations in capacitance values, inductive coupling, connection geometry, or unmodeled parasitic effects can lead to noticeable shifts in the FRA curve. Therefore, the higher error in the middle-frequency region is expected and is mainly related to the sensitivity of the resonance points.
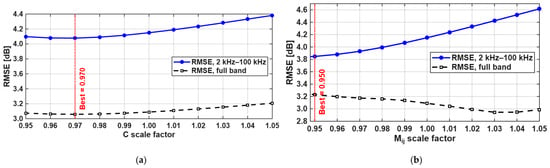
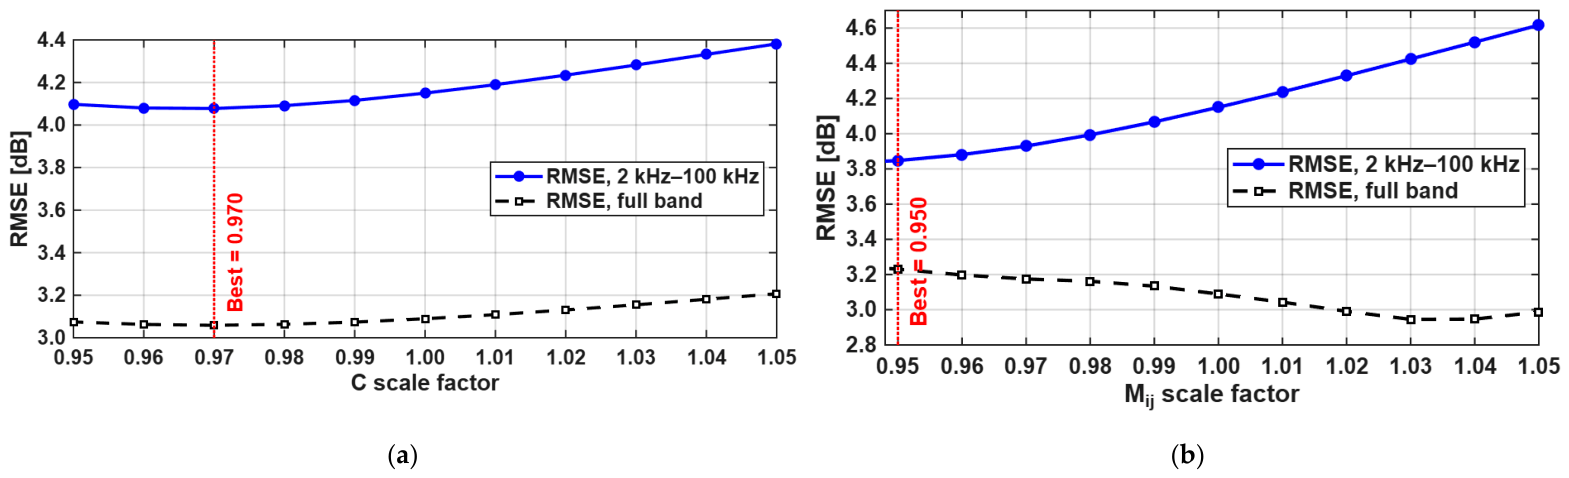
To investigate the larger error observed in the 2 kHz–100 kHz band, a sensitivity analysis was performed by scaling the assembled capacitance matrix and the mutual-inductance terms within a ±5% range around their nominal values. The results are shown in Figure 7. For the capacitance matrix, the minimum middle-frequency RMSE within this range was obtained at a scale factor of 0.970 (Figure 7a). For the mutual-inductance terms, the minimum middle-frequency RMSE was obtained at a scale factor of 0.950 (Figure 7b). These results show that the resonance-dominated middle-frequency response is sensitive to small variations in distributed capacitance and especially mutual inductive coupling. Therefore, the larger RMSE observed in this band can be attributed to small shifts in resonance and anti-resonance locations caused by uncertainties in distributed electromagnetic parameters, geometrical tolerances and measurement boundary conditions.
Figure 7.
Sensitivity analysis of the middle-frequency FRA error: (a) RMSE variation with capacitance matrix scaling within the ±5% range; (b) RMSE variation with mutual-inductance scaling within the ±5% range.
In the high-frequency region between 100 kHz and 2 MHz, the RMSE and MAE were 3.26 dB and 2.38 dB, respectively. Although some deviations remain, especially around sharp variations in the response, the model preserves the general frequency-response trend. The remaining differences can be attributed to measurement leads, contact resistances, unmodeled parasitic capacitances, dielectric losses and small geometrical tolerances in the physical test setup.
Overall, the results confirm that the proposed segmented R-L-M-C model provides a physically meaningful representation of the measured FRA behavior. The model is particularly effective in representing the low-frequency response and the general high-frequency trend, while the deviations in the resonance region highlight the sensitivity of FRA responses to small changes in distributed electromagnetic parameters and measurement boundary conditions.
Compared with terminal-response-based parameter estimation methods, the proposed approach uses field-extracted parameters that are directly related to the geometry and material properties of the investigated winding structure. This provides better physical interpretability of the equivalent circuit parameters. However, the approach also requires detailed geometrical information and accurate FEM-based parameter extraction. Therefore, the proposed model should not be considered as a purely curve-fitted representation of the measured FRA response, but rather as a physics-based model that approximates the measured behavior using electromagnetic and electrostatic field-derived parameters.
4. Conclusions
This study presented a physics-based high-frequency white-box model for a coreless six-section winding assembly corresponding to one phase of a 10 kV/0.41 kV, Dyn11, 2500 kVA distribution transformer. Frequency-dependent winding resistance values were extracted from FEM-based electromagnetic field analyses, while the air-core self- and mutual-inductance matrix and capacitance parameters were obtained from electromagnetic and electrostatic field solutions. The extracted parameters were incorporated into a segmented R-L-M-C equivalent circuit and solved in the frequency domain using MNA.
The proposed model was validated against FRA measurements performed in the 20 Hz–2 MHz range for the section-A air-core connection configuration. The model showed good agreement with the measured low-frequency response, with a magnitude difference of 0.1074 dB at 50.431 Hz. Over the full frequency range, the RMSE and MAE were 3.09 dB and 1.76 dB, respectively. The highest band-wise error was observed in the 2 kHz–100 kHz middle-frequency region, where multiple resonance and anti-resonance points occur. The sensitivity analysis showed that the response in this region is sensitive to variations in the mutual-inductance terms and the capacitance matrix, which can cause shifts in the resonance locations and corresponding magnitude deviations. The model represented the overall attenuation trend, the dominant resonance region and the high-frequency recovery behavior, although local deviations remained around sharp resonance and anti-resonance points.
The results indicate that the field-extracted segmented R-L-M-C model provides a physically interpretable representation of the healthy-state FRA behavior of the tested winding assembly. Future work will extend the proposed modeling framework to different winding sections, cored configurations and controlled winding fault scenarios such as axial displacement, radial deformation and shorted turns.
The present results are limited to a coreless six-section winding assembly under a single-section excitation condition. Future studies will extend and validate the proposed methodology for core-based transformer structures, multiple-section excitation configurations and controlled winding fault conditions.
Author Contributions
Conceptualization, R.B. and B.A.; methodology, R.B., Y.B.D. and İ.G.T.; validation, İ.G.T.; investigation, R.B. and Y.B.D.; visualization, R.B. and Y.B.D.; writing—original draft preparation, R.B.; writing—review and editing, R.B., Y.B.D., İ.G.T. and B.A.; supervision, İ.G.T. and B.A.; project administration, B.A. All authors have read and agreed to the published version of the manuscript.
Funding
This research was funded by the Scientific and Technological Research Council of Türkiye (TÜBİTAK), grant number 124E630.
Data Availability Statement
The original contributions presented in this study are included in the article. Further inquiries can be directed to the corresponding author.
Conflicts of Interest
Author Yunus Berat Demirol was employed by GENETEK Power & Energy Co., Ltd. The remaining authors declare that the research was conducted in the absence of any commercial or financial relationships that could be construed as a potential conflict of interest. The funders had no role in the design of the study; in the collection, analyses, or interpretation of data; in the writing of the manuscript; or in the decision to publish the results.
Abbreviations
The following abbreviations are used in this manuscript:
| AC | Alternating current |
| FACTS | Flexible AC transmission system |
| FEM | Finite element method |
| FRA | Frequency response analysis |
| GIS | Gas-insulated substation |
| HVDC | High-voltage direct current |
| MAE | Mean absolute error |
| MNA | Modified nodal analysis |
| R-L-M-C | Resistance–inductance–mutual inductance–capacitance |
| RMSE | Root mean square error |
References
- Singh, J.; Singh, S.; Singh, A. Distribution transformer failure modes, effects and criticality analysis (FMECA). Eng. Fail. Anal. 2019, 99, 180–191. [Google Scholar] [CrossRef] [Scilit]
- Diaz, G.A.; Høidalen, H.K.; Mombello, E.E.; Cortes, C.A. Implementation of the State-Space Power Transformer Model in ATP for High Frequency Transient Studies. IEEE Trans. Power Deliv. 2025, 40, 1344–1352. [Google Scholar] [CrossRef] [Scilit]
- CIGRE Joint Working Group A2/C4.39. Electrical Transient Interaction Between Transformers and the Power System—Part 1: Expertise; Technical Brochure 577A; CIGRE: Paris, France, 2014. [Google Scholar]
- Gustavsen, B.; Portillo, A. A damping factor-based white-box transformer model for network studies. IEEE Trans. Power Deliv. 2018, 33, 2956–2964. [Google Scholar] [CrossRef] [Scilit]
- Wu, H.; Zhang, N.; Du, J.; Li, J.; Dong, S.; Lv, Z. Modelling and analysis of transformers considering ultra-wide band frequency-dependent parameters for high altitude electromagnetic pulse. High Volt. 2025, 10, 374–384. [Google Scholar] [CrossRef] [Scilit]
- IEC 60076-18:2012; Power Transformers—Part 18: Measurement of Frequency Response. International Electrotechnical Commission: Geneva, Switzerland, 2012.
- Prasanna, K.L.; Samal, M.; Mondal, M.; Mishra, P. Frequency-domain subspace identification for noninvasive transformer winding parameter estimation and fault diagnostics. Int. J. Circuit Theory Appl. 2025, 54, 658–677. [Google Scholar] [CrossRef] [Scilit]
- Senobari, R.K.; Sadeh, J.; Borsi, H. Frequency response analysis (FRA) of transformers as a tool for fault detection and location: A review. Electr. Power Syst. Res. 2018, 155, 172–183. [Google Scholar] [CrossRef] [Scilit]
- Zhao, X.; Yao, C.; Abu-Siada, A.; Liao, R. High frequency electric circuit modeling for transformer frequency response analysis studies. Int. J. Electr. Power Energy Syst. 2019, 111, 351–368. [Google Scholar] [CrossRef] [Scilit]
- Abeywickrama, N.; Serdyuk, Y.V.; Gubanski, S.M. High-frequency modeling of power transformers for use in frequency response analysis. IEEE Trans. Power Deliv. 2008, 23, 2042–2049. [Google Scholar] [CrossRef]
- Yoon, Y.; Son, Y.; Cho, J.; Jang, S.; Kim, Y.-G.; Choi, S. High-frequency modeling of a three-winding power transformer using sweep frequency response analysis. Energies 2021, 14, 4009. [Google Scholar] [CrossRef] [Scilit]
- Chanane, A.; Houassine, H.; Belazzoug, M. A decentralized equivalent circuit modeling of power transformer winding using frequency response analysis and artificial intelligence. In Proceedings of the 2024 2nd International Conference on Electrical Engineering and Automatic Control (ICEEAC), Setif, Algeria, 12–14 May 2024. [Google Scholar] [CrossRef] [Scilit]
- Abu-Siada, A.; Mosaad, M.I.; Kim, D.W.; El-Naggar, M.F. Estimating power transformer high frequency model parameters using frequency response analysis. IEEE Trans. Power Deliv. 2020, 35, 1267–1277. [Google Scholar] [CrossRef] [Scilit]
- Mukherjee, P.; Satish, L. Construction of equivalent circuit of a single and isolated transformer winding from FRA data using the ABC algorithm. IEEE Trans. Power Deliv. 2012, 27, 963–970. [Google Scholar] [CrossRef] [Scilit]
- CIGRE Joint Working Group A2/C4.52. High-Frequency Transformer and Reactor Models for Network Studies—Part A: White-Box Models; Technical Brochure 900; CIGRE: Paris, France, 2023. [Google Scholar]
- Abed, N.Y.; Mohammed, O.A. Physics-based high-frequency transformer modeling by finite elements. IEEE Trans. Magn. 2010, 46, 3249–3252. [Google Scholar] [CrossRef] [Scilit]
- Bjerkan, E.; Høidalen, H.K. High frequency FEM-based power transformer modeling: Investigation of internal stresses due to network-initiated overvoltages. Electr. Power Syst. Res. 2007, 77, 1483–1489. [Google Scholar] [CrossRef] [Scilit]
- Popov, M.; van der Sluis, L.; Smeets, R.P.P.; Lopez-Roldan, J.; Terzija, V.V. Modelling, simulation and measurement of fast transients in transformer windings with consideration of frequency-dependent losses. IET Electr. Power Appl. 2007, 1, 29–35. [Google Scholar] [CrossRef] [Scilit]
- Eslamian, M.; Bigdeli, M.; Abu-Siada, A. High frequency modeling of dry type detuned reactor for transient studies: Simulation and experimental analyses. Electr. Power Syst. Res. 2024, 228, 110102. [Google Scholar] [CrossRef] [Scilit]
- Alkraimeen, Y.; Gómez, P. On the computation of frequency-dependent core and proximity effects for transient analysis of transformer windings. IEEE Trans. Power Deliv. 2019, 34, 891–898. [Google Scholar] [CrossRef]
- Eslamian, M.; Vahidi, B. New equivalent circuit of transformer winding for the calculation of resonance transients considering frequency-dependent losses. IEEE Trans. Power Deliv. 2015, 30, 1743–1751. [Google Scholar] [CrossRef] [Scilit]

Disclaimer/Publisher’s Note: The statements, opinions and data contained in all publications are solely those of the individual author(s) and contributor(s) and not of MDPI and/or the editor(s). MDPI and/or the editor(s) disclaim responsibility for any injury to people or property resulting from any ideas, methods, instructions or products referred to in the content. |
© 2026 by the authors. Licensee MDPI, Basel, Switzerland. This article is an open access article distributed under the terms and conditions of the Creative Commons Attribution (CC BY) license.