Article

Transaction-Driven Collaborative Optimization of Interconnected Integrated Energy Systems for County-Level Distribution Networks

1
School of Electrical Engineering, North China University of Water Resources and Electric Power, Zhengzhou 450045, China
2
School of Electrical Engineering, Xuchang University, Xuchang 511000, China
*
Author to whom correspondence should be addressed.
Energies 2026, 19(13), 3090; https://doi.org/10.3390/en19133090
Submission received: 22 April 2026 / Revised: 17 June 2026 / Accepted: 26 June 2026 / Published: 30 June 2026

Abstract

To address the key challenges of distributed generation and loads, insufficient edge computing capacity, significant data privacy risks among multiple participants, and immature market mechanisms in county-level distribution networks, this paper presents a transaction-driven two-tier distributed collaborative optimization approach for interconnected integrated energy systems. We develop a market-oriented architecture that combines upper-layer price coordination with lower-layer autonomous optimization. The overall system is decoupled using just two types of non-sensitive data—local electricity prices and regional net power—while preserving the operational independence and data privacy of all stakeholders. We further devise a Two-Stage Distributed Transactional Optimization (TSDTO) mechanism. This mechanism reformulates the intraday multi-variable collaborative optimization into a single-variable electricity price search problem, substantially reducing algorithm iterations and communication overhead. Simulations are conducted on three typical interconnected integrated energy systems in a county in northern China. The results demonstrate that the proposed method maintains main transformer power within safe limits, effectively lowers daily operating costs, and boosts the renewable energy accommodation rate. Compared with the conventional subgradient method, our algorithm offers higher computational efficiency, along with improved convergence and real-time performance. The proposed approach is capable of achieving a relatively satisfactory balance among privacy protection, low computational complexity, on-site renewable energy utilization, and rapid real-time operation. This paper provides theoretical references and guidance for the low-carbon, cost-effective, coordinated and sustainable operation of modern county-level power systems and integrated energy systems.

1. Introduction

Under the framework of the dual-carbon strategic objectives, China’s energy sector is accelerating its transition toward cleaner, low-carbon, and market-oriented development paradigms. The construction of an integrated energy system characterized by multi-energy complementarity and coordinated electricity–heat operation has emerged as a pivotal development orientation in the global energy domain [1]. Serving as a key pillar for the integrated development of urban and rural areas, counties constitute the core implementation scenarios for the rural revitalization strategy as well as the large-scale deployment of distributed renewable energy resources. The secure and efficient operation, alongside the low-carbon transition, of county-level distribution networks is inextricably linked to the high-quality advancement of county-level economic and social development endeavors [2].
The Regional Integrated Energy System (RIES) enables the cascade utilization of energy and the localized consumption of renewable energy via the coupling and complementarity of diverse energy carriers including electricity, heat, and gas, and thus serves as the core technical pathway for the upgrading of energy systems on the distribution network side [3,4]. Within the context of county-level distribution networks, a standalone RIES frequently faces challenges in achieving the complete utilization of renewable energy and operational economy, which is primarily attributed to the temporal–spatial mismatch between local resource endowments and load characteristics [5,6]. Various energy entities across counties, such as industrial sectors, residential users, and commercial operators, possess inherent temporal–spatial complementarity in terms of their energy consumption schedules, renewable energy generation outputs, and energy storage regulation capacities [7,8]. If individual RIES operate in an isolated manner, the excess renewable energy in surplus areas can only be connected to the grid at unfavorable low tariffs or even be curtailed, whereas deficit regions are compelled to procure electricity from the main grid at premium prices. This scenario inevitably results in a rise in overall operational costs and exacerbated fluctuations in main transformer power flow [9,10]. Establishing a Multi-region Integrated Energy System (MIES) by interconnecting multiple geographically proximate and mutually complementary RIES via tie lines allows for inter-regional power support and cross-time energy storage coordination, thereby overcoming the constraints imposed by single-region resource endowment limitations [11,12,13]. Consequently, multi-region interconnection has emerged as a critical technical approach for the advancement of integrated energy systems on the county-level distribution network side.
At present, China’s county-level distribution networks exhibit typical characteristics including distributed sources and loads, coexistence of multiple stakeholders, and a rapid rise in the penetration rate of distributed renewable energy. Meanwhile, they are confronted with practical constraints such as insufficient grassroots operation and maintenance capabilities, limited computing resources, sensitive information privacy concerns among multiple stakeholders, and underdeveloped market mechanisms [14,15,16]. This gives rise to prevalent technical issues in county-level distribution networks, including low energy utilization efficiency, inadequate renewable energy consumption, excessive peak-valley differences, and prominent risks of main transformer overload. Therefore, there is an urgent demand for collaborative optimization schemes featuring low complexity, strong practicability, and privacy protection [17,18].
Research on MIES collaborative optimization is primarily categorized into two established technical routes: distributed mathematical optimization and multi-stakeholder game optimization. Within the realm of distributed mathematical optimization, techniques such as the Alternating Direction Method of Multipliers (ADMM) and Lagrangian dual decomposition have achieved decoupling and privacy protection for global problems. However, these methods involve numerous iterations and significant communication overhead, rendering them poorly suited to the low-computing scenarios in counties [19,20,21]. For game optimization, models built on theories such as Nash equilibrium and Nash bargaining can characterize the autonomous decision-making behaviors of multiple stakeholders. Nevertheless, they suffer from high solution complexity, vulnerability to source–load fluctuations, and difficulty in meeting the requirements of intraday real-time scheduling [12,22,23]. In general, most current methodologies are targeted at urban power grids. Few customized collaborative optimization strategies with low complexity have been developed to accommodate the unique attributes of county-level distribution networks, namely constrained computing resources, stringent privacy protection demands, underdeveloped market mechanisms, and the requirement for on-site renewable energy consumption [5,24,25,26]. For this reason, these methods exhibit limited engineering potential in county-level scenarios.
Therefore, interconnected integrated energy systems, including residential, commercial, and industrial entities, on the county-level distribution network side are selected as the research object. Targeting the unique constraints of county-level scenarios and the limitations of existing approaches, a two-layer distributed collaborative optimization method based on regional transaction signals is developed. This framework facilitates inter-regional energy mutual aid via transaction signals, curtails algorithm iterations and communication overhead while safeguarding the data privacy and operational autonomy of multiple stakeholders, adapts to the low-computing and underdeveloped market environment in counties, and delivers technical support for the low-carbon and efficient operation of multi-region integrated energy systems on the county-level distribution network side. The core innovations are as follows:
We construct a market-driven two-layer architecture featuring upper-layer price coordination and lower-layer autonomy, which suits county-level distribution networks with multi-stakeholder operation, data privacy protection and limited computing capacity.
In response to national policies advocating on-site renewable energy consumption and addressing the practical safety risks in the operation of county-level distribution networks, this paper embeds the zero-export constraint into the scheduling model, which enhances local renewable accommodation and maintains reliable system operation simultaneously.
A coordinated two-stage distributed transactional optimization mechanism for day-ahead and intraday scheduling is developed. It cuts iterations and communication overhead while fulfilling the real-time demands of intraday operation.
The remainder of this paper is structured as follows: Section 2 formulates a two-layer optimization model for county-level interconnected integrated energy systems, specifying the objective function and operational constraints; Section 3 establishes a two-layer market-based transaction mechanism and devises a two-stage distributed optimal scheduling framework; Section 4 presents numerical examples to verify the proposed model and method, and Section 5 summarizes the main conclusions of this work.

2. Model Architecture of Regional Interconnected Integrated Energy Systems

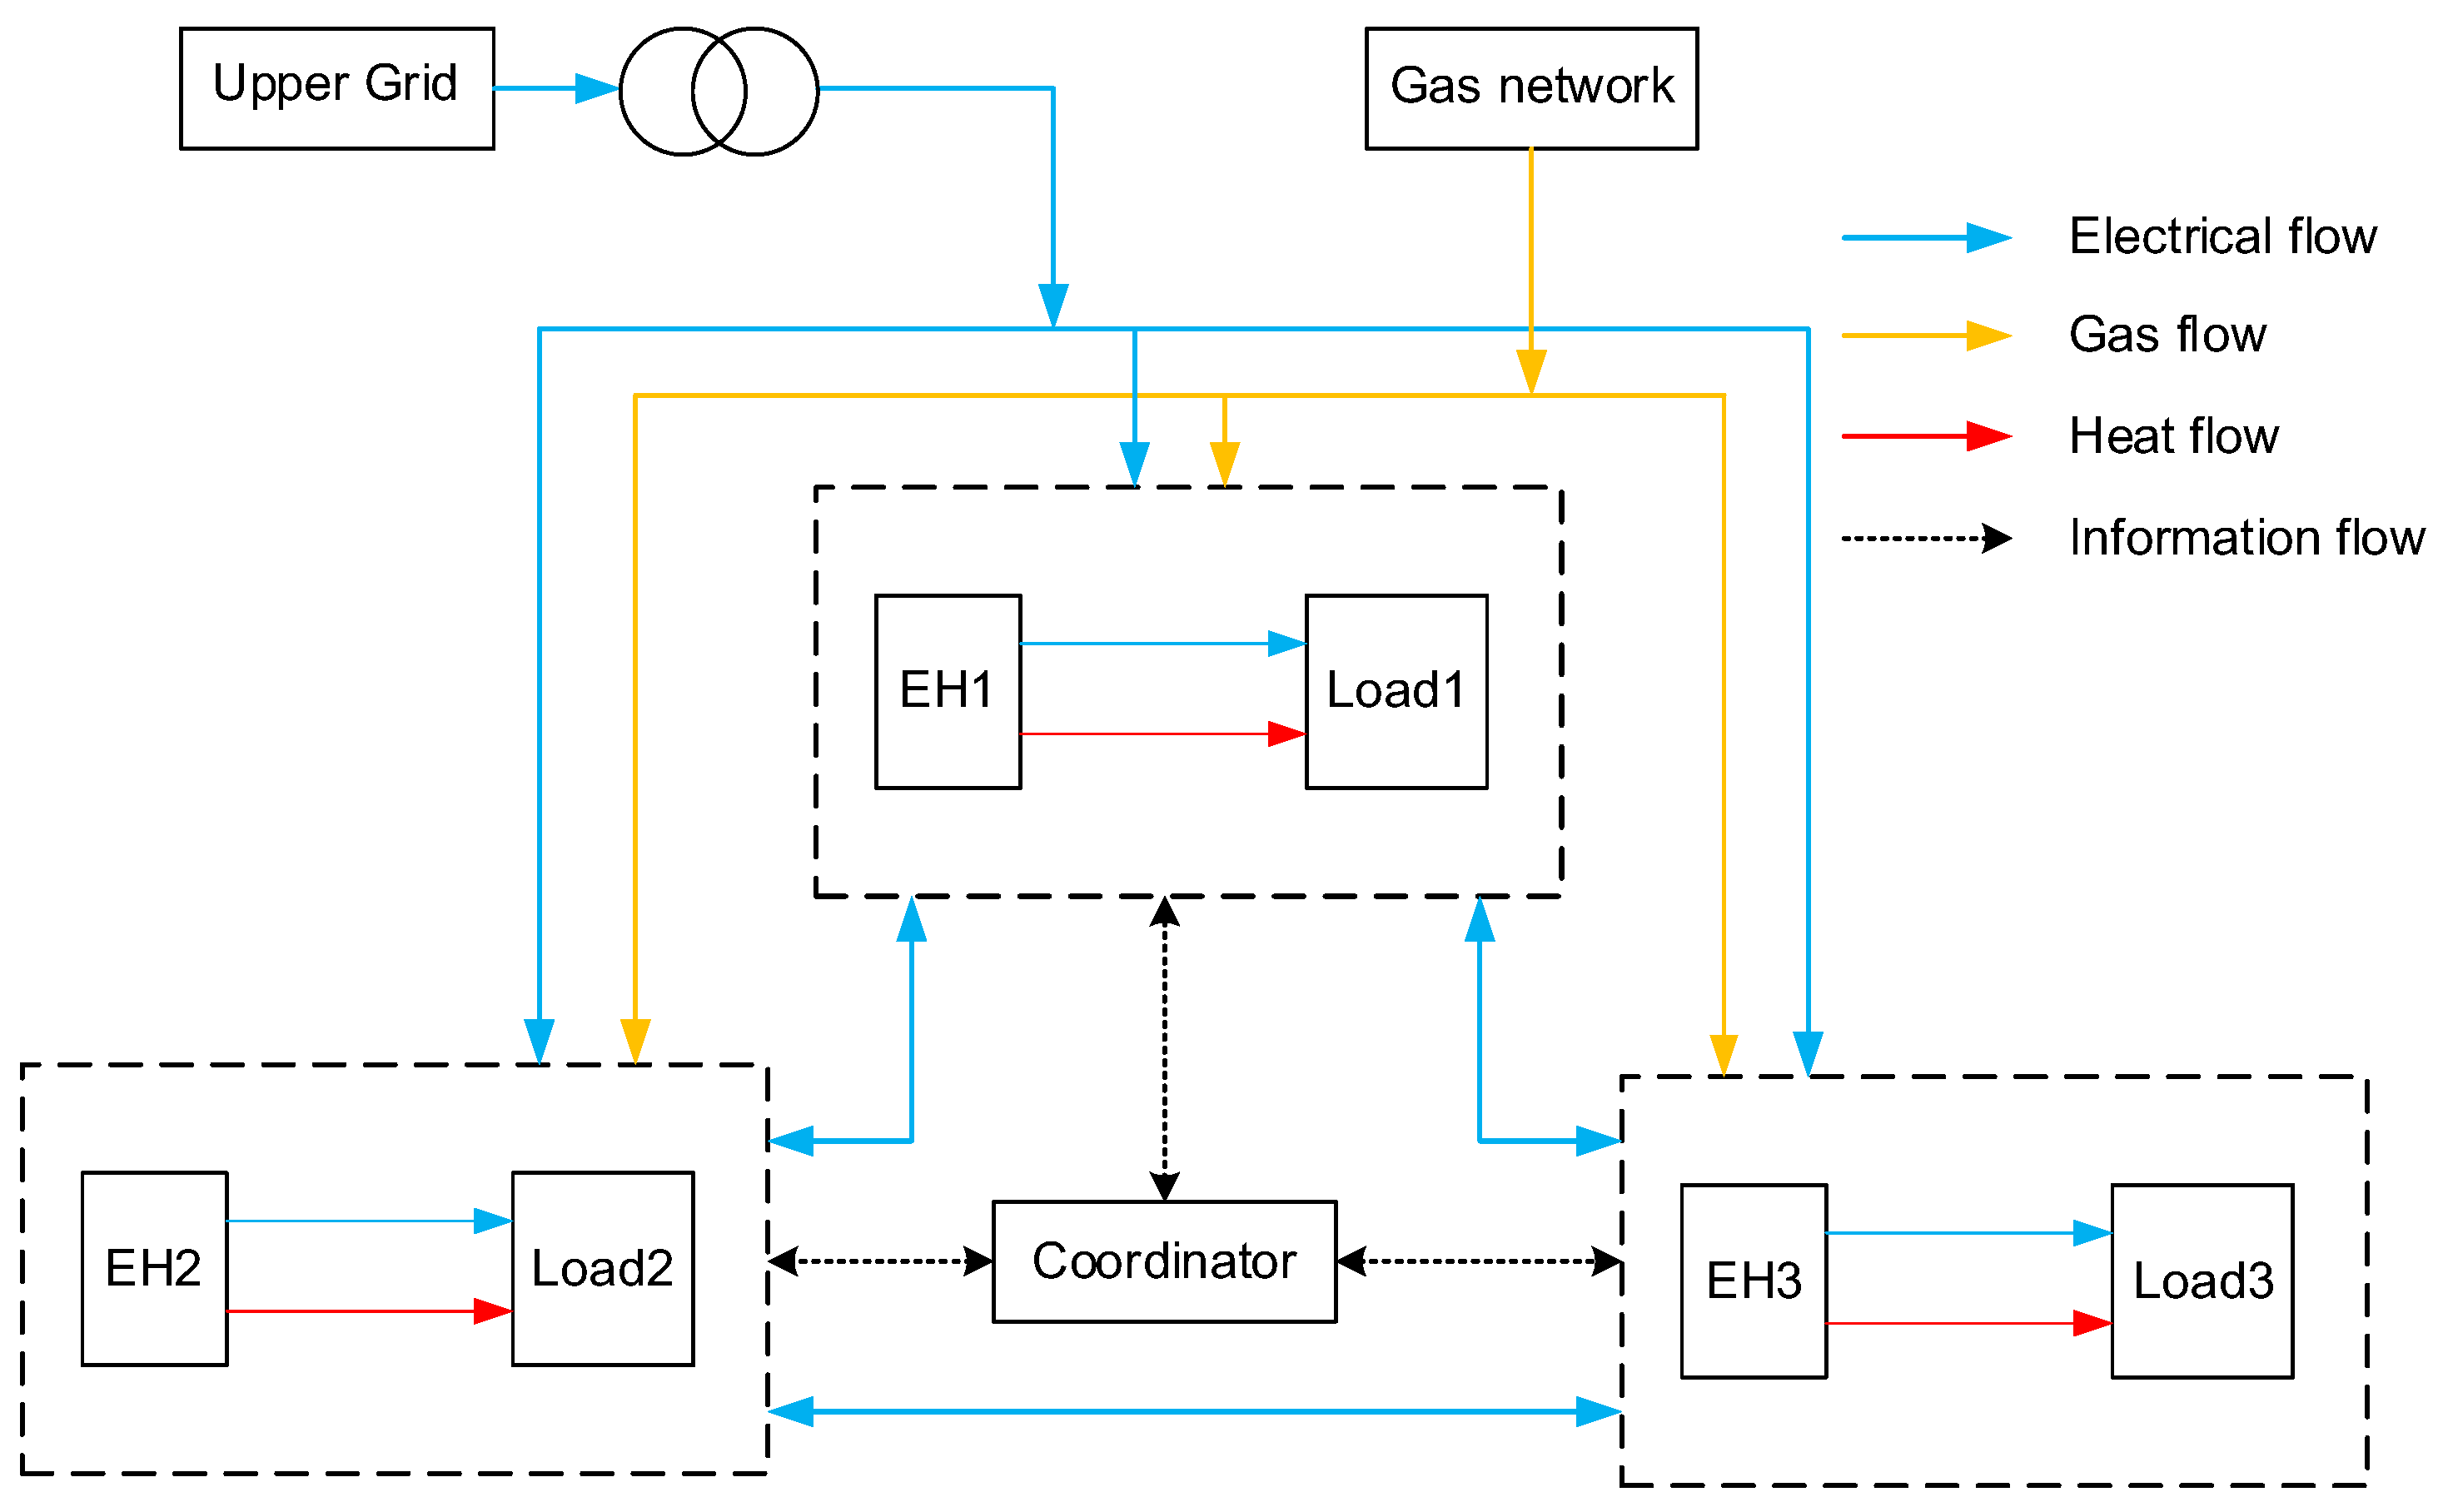
This chapter constructs a two-layer optimization model architecture featuring upper-layer coordination and lower-layer autonomy. The lower layers correspond to typical industrial, residential, and commercial RIES units in counties, while the upper-layer coordination unit is designed for lightweight management and control capabilities, eliminating the need for high-performance computing platforms. The overall system architecture is depicted in Figure 1, where EH denotes the Energy Hub and the Load refers to the aggregate electricity–heat load of the county-level unit [27,28].
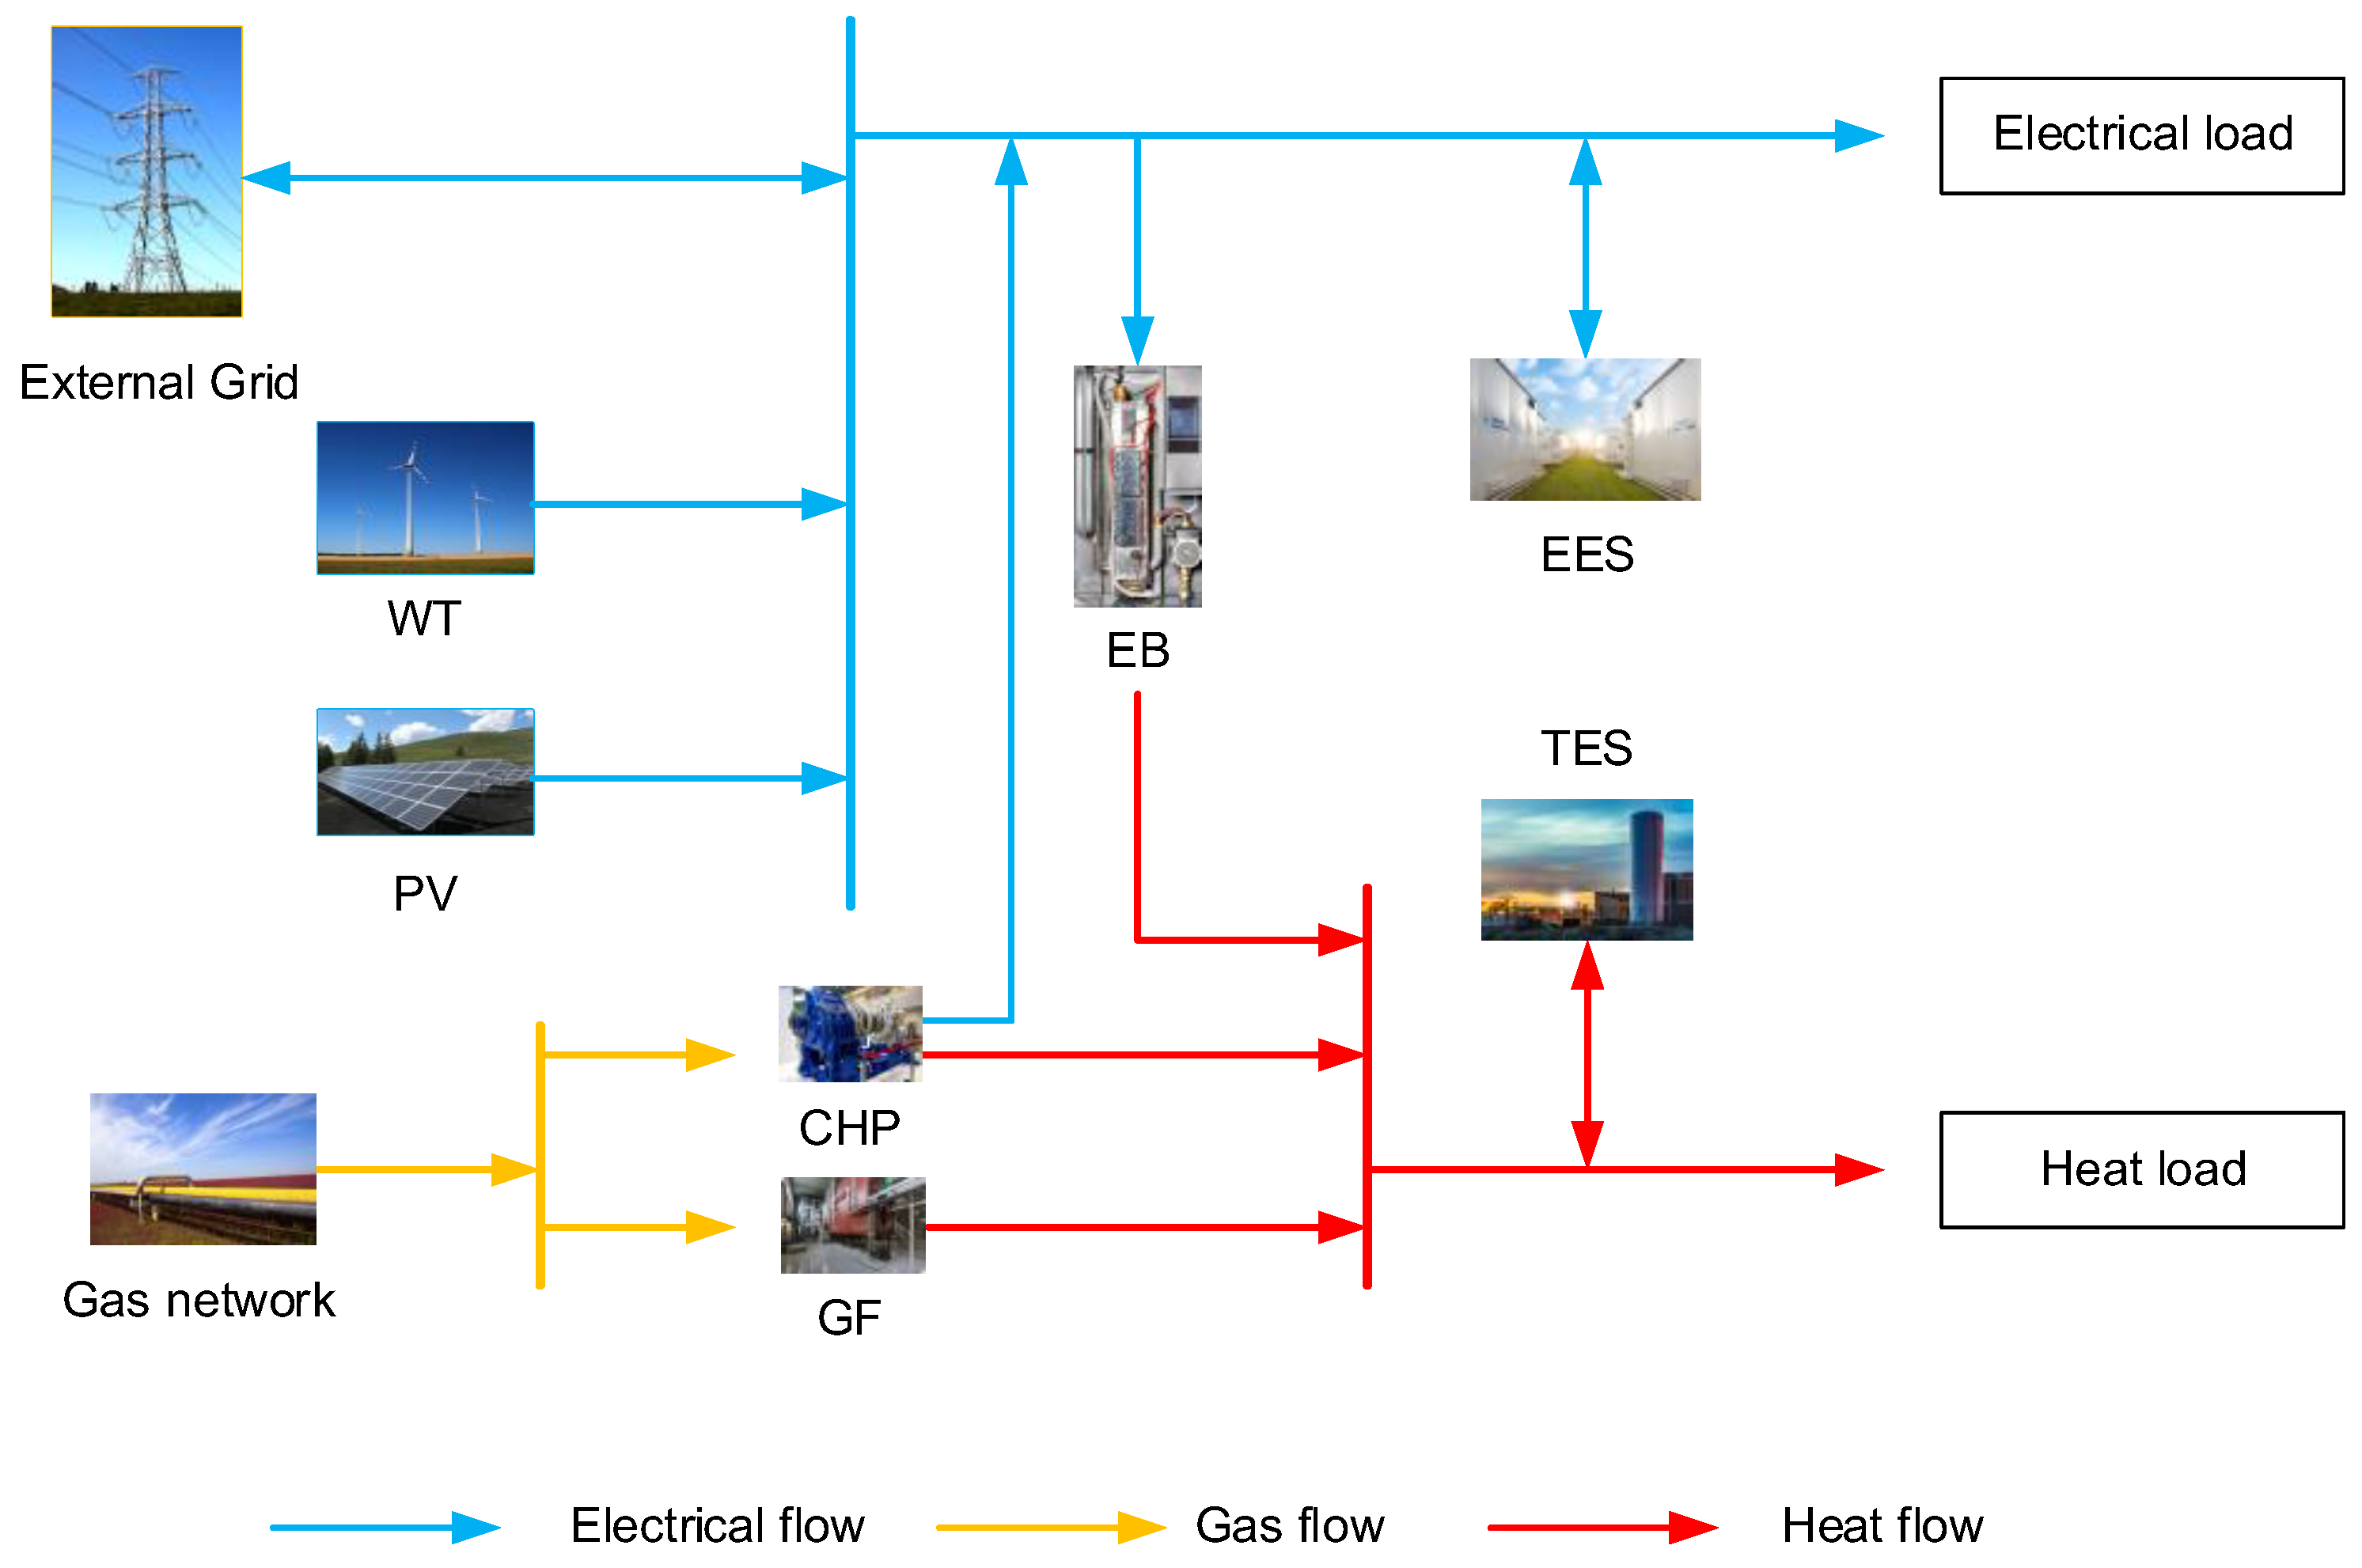
Each lower-layer RIES functions as an independent energy supply and consumption unit, outfitted with Combined Heat and Power (CHP), Gas Furnace (GF), Electric Boiler (EB), Electrical Energy Storage (EES), Thermal Energy Storage (TES), and distributed photovoltaic/wind power units. Its core objective is to satisfy the users’ electricity and heat load demands [29,30]. The detailed configuration of the RIES is illustrated in Figure 2:

2.1. System Optimization Scheduling Objective

Targeting the operational features of multi-region interconnected integrated energy systems located on the county-level distribution network side, while incorporating the global economic operation requirements of the whole system, a two-layer optimization objective framework is established. Integrated with the actual operational scenarios of county-level distribution networks, a dual-layer optimization objective system featuring upper-layer global coordination and lower-layer autonomous optimization is further constructed. Specifically, the upper layer takes the minimization of the system’s total cost within the remaining time period of the time domain as the optimization objective, and the corresponding objective function is presented as follows:
m i n C t o t a l = i = 1 N C t c , i
where i = 1,2 , 3 N is the regional number of RIES; C t o t a l is the aggregate system-wide operating cost over the interval from t c to T ; t c is the current time instant; T is the end time of the time horizon; and C t c , i corresponds to the cumulative autonomous operating cost of the i -th RIES throughout the same period.
For each lower-level RIES, the optimization objective is formulated as minimizing its total autonomous operating cost over the remaining scheduling period, with the objective function expressed as:
m i n C t c = t = t c T F t
F t = k e , t P t g r i d + k g , t ( G t C H P + G t G F )
where F t is the autonomous operating cost of the RIES at time t ; k e , t is the time-varying electricity purchase price (in yuan/kWh); k g , t is the time-varying natural gas price (in yuan/m3); P t g r i d is the amount of electricity purchased by the RIES from the external grid at time t (in kWh); and G t C H P and G t G F represent the natural gas consumption of the Combined Heat and Power (CHP) unit and Gas Furnace (GF), respectively.

2.2. Operational Constraints of a Single RIES

2.2.1. Electrical Power Balance Constraint

P t g r i d + P t R E S + P t E E S , d i s P t E E S , c h + P t C H P P t E B P t c u r t = L e , t f i x + L e , t s h f t
where P t g r i d denotes the electrical power exchanged between the RIES and the upper-level distribution network at time t , where a positive value represents electricity purchased from the grid and a negative value represents electricity sold back to the grid; P t R E S is the power generated by local renewable energy sources (RES); P t E E S , c h and P t E E S , d i s refer to the charging and discharging power of the Electrical Energy Storage (EES) system, respectively; P t C H P and P t E B correspond to the power output of the Combined Heat and Power (CHP) unit and the power consumption of the Electric Boiler (EB), respectively; P t c u r t is the curtailed renewable energy power at time t ; and L e , t f i x and L e , t s h f represent the fixed electrical load and shiftable electrical load demand, respectively.

2.2.2. Thermal Power Balance Constraint

H t C H P + H t G F + H t E B + H t T E S , d i s H t T E S , c h H t c u r t = L t h , t f i x + L t h , t s h f t
where H t C H P is the heat output of the CHP unit at time t ; H t G F represents the heat output of the Gas Furnace (GF); H t E B is the heat output of the EB unit; H t T E S , c h and H t T E S , d i s refer to the charging and discharging power of the Thermal Energy Storage (TES) system, respectively; H t c u r t denotes the curtailed thermal power; and L t h , t f i x and L t h , t s h f represent the fixed thermal load and shiftable thermal load demand, respectively.

2.2.3. Upper and Lower Output Limits of Equipment

(1)
CHP unit output constraint:
P m i n C H P P t C H P P m a x C H P t
where P m i n C H P and P m a x C H P denote the minimum allowable output and rated power output of the CHP unit, respectively; P t C H P = η e C H P G t C H P ; η e C H P represents the gas-to-electricity conversion efficiency of the CHP system; H t C H P = η t h C H P G t C H P ; η t h C H P is the gas-to-heat conversion efficiency of the CHP unit; and G t C H P corresponds to the natural gas consumption rate of the CHP system.
(2)
GF output constraint:
H m i n G F H t G F H m a x G F t
where H m i n G F and H m a x G F refer to the minimum allowable heat output and rated heat output of the Gas Furnace (GF), respectively; H t G F = η t h G F G t G F ; where η t h G F is the gas-to-heat conversion efficiency of the GF; and G t G F denotes the natural gas consumption of the GF unit.
(3)
EB output constraint:
P m i n E B P t E B P m a x E B t
where P m i n E B and P m a x E B represent the minimum allowable power input and rated power input of the Electric Boiler (EB), respectively; H t E B = η t h E B P t E B ; where η t h E B is the electricity-to-heat conversion efficiency of the EB unit.

2.2.4. Ramp Rate Constraints of Equipment

(1)
CHP unit ramp constraint:
P t + 1 C H P P t C H P Δ P m a x C H P t
(2)
EB ramp constraint:
P t + 1 E B P t E B Δ P m a x E B t
where Δ P m a x C H P and Δ P m a x E B are the maximum hourly ramping limits for the CHP unit and the Electric Boiler, respectively.

2.2.5. Charging and Discharging Power Constraints of Energy Storage Devices

(1)
EES charging/discharging power constraints and mutual exclusivity constraint:
0 P t E E S , c h P m a x E E S , c h , 0 P t E E S , d i s P m a x E E S , d i s t
(2)
TES charging/discharging power constraints and mutual exclusivity constraint:
0 H t T E S , c h H m a x T E S , c h , 0 H t T E S , d i s H m a x T E S , d i s t
where P m a x E E S , c h and P m a x E E S , d i s represent the maximum allowable charging and discharging power rates of the EES system, respectively; H m a x T E S , c h and H m a x T E S , d i s denote the maximum allowable charging and discharging power rates of the TES system, respectively.

2.2.6. Adjustable Constraints for Shiftable Loads

(1)
Shiftable electrical load constraint:
0 L e , t s h f L e , m a x s h f t
(2)
Shiftable thermal load constraint:
0 L t h , t s h f L t h , m a x s h f t
where L e , m a x s h f and L t h , m a x s h f represent the upper limits of shiftable electrical and thermal load power that can be activated in a single time interval, respectively.

2.2.7. Energy Storage Capacity Boundary Constraints

(1)
EES energy storage constraint:
E t E E S = ( 1 α E E S ) E t 1 E E S + Δ T P t E E S , c h η c h E E S P t E E S , d i s η d i s E E S t
E m i n E E S E t E E S E m a x E E S t
where E t 1 E E S denotes the stored energy level of the EES system at the prior time step; α E E S represents the self-discharge coefficient of the EES; Δ T is the duration of each scheduling interval; η c h E E S and η d i s E E S correspond to the charging and discharging efficiencies of the EES, respectively; E m i n E E S and E m a x E E S define the minimum and maximum allowable energy levels for the EES system.
(2)
TES thermal energy storage constraint:
H t T E S = ( 1 α T E S ) H t 1 T E S + Δ T ( H t T E S , c h η c h T E S H t T E S , d i s η d i s T E S ) t
H m i n T E S H t T E S H m a x T E S t
where H t 1 T E S is the stored thermal energy of the TES system at the previous time step; α T E S refers to the self-dissipation coefficient of the TES; η c h T E S and η d i s T E S are the charging and discharging efficiencies of TES, respectively; H m i n T E S and H m a x T E S are the minimum and maximum allowable thermal energy levels for the TES system.
It is worth noting that within the intraday scheduling cycle, equipment aging and degradation effects are not considered in this work, and key parameters including the energy storage charging/discharging efficiencies and self-discharge coefficients are assumed to remain constant throughout the scheduling horizon.

2.2.8. Terminal Energy Storage Target Constraints over the Time Horizon

(1)
EES terminal constraint:
E t c E E S + Δ T t = t c T P t E E S , c h η c h E E S P t E E S , d i s η d i s E E S = E t a r g e t E E S
(2)
TES terminal constraint:
H t c T E S + Δ T t = t c T H t T E S , c h η c h T E S H t T E S , d i s η d i s T E S = H t a r g e t T E S
where E t a r g e t E E S and H t a r g e t T E S denote the target energy levels of the EES and TES systems at the conclusion of the optimization scheduling horizon, respectively.

2.3. Operational Constraints of Multi-Region Interconnection

To adapt to the practical engineering scenarios of county-level distribution networks, this paper puts forward the following reasonable assumptions:
The inflexible electrical load demand of each RIES is always within the coverage of the main transformer capacity and renewable energy output, and there is no infeasible situation for the system power balance constraint. In addition, considering the engineering reality of limited grid connection of distributed power sources in county-level distribution networks and the national policy orientation of “local consumption, on-site balance, encouragement of local area network mutual aid, and restriction of unordered grid connection”, this paper sets that each RIES is only allowed to draw electricity from the upper-level distribution grid and is prohibited from injecting power back to the main grid (hereinafter referred to as the zero-export constraint) [31,32]. This mechanism can guide renewable energy to be preferentially consumed within the interconnected system, avoid bidirectional fluctuations of the main transformer active power caused by power reverse transmission, and simplify the system coordination and control logic [33,34].
Considering the short electrical distance between adjacent RIES in counties, the power loss on tie lines is ignored, which is a conventional assumption in the research on collaborative optimization of multi-region IES [13].

2.3.1. Main Transformer Power Constraint

The sum of the electrical power exchanged between each RIES and the upper-level distribution network is bounded by the rated capacity of the main transformer:
0 P t T r = i = 1 N P t , i g r i d P m a x T r t
where P t , i g r i d 0 denotes the electrical power imported by the i -th RIES from the upper-level distribution network. This constraint explicitly enforces that each RIES is only allowed to draw power from the main grid and prohibited from feeding electricity back to the main grid; P t T r denotes the total active power drawn from the main transformer at time t ; P m a x T r represents the maximum allowable active power rating of the main transformer.

2.3.2. Inter-Regional Tie Line Power Constraint

The power exchange between adjacent RIES is limited by the transmission capacity of the tie line:
P i j , m a x P i j , t P i j , m a x t
where P i j , t is the active power flow on the tie line connecting region i and region j at time t ; a positive value indicates that power flows from region i to region j , while a negative value indicates power flows from region j to region i ; P i j , m a x corresponds to the rated transmission capacity of the tie line.

3. Multi-RIES Collaborative Transaction Mechanism Based on a Two-Tier Market

In this chapter, drawing upon the single RIES autonomous optimization model developed in Section 2, a distributed collaborative transaction framework suitable for multi-RIES interconnected systems in county-level distribution networks is constructed. This framework adopts a two-layer market architecture with upper-layer coordination and lower-layer autonomy, relies on price signal guidance and limited information interaction, and realizes the optimal overall operating cost of the interconnected system while preserving the information privacy and autonomous operation capabilities of each RIES. The proposed method offers theoretical references for county-level practical engineering scenarios characterized by multi-stakeholder autonomous operation, limited computing capacity and local collaborative optimization.

3.1. Mathematical Description of the Two-Tier Market Framework

3.1.1. Optimization Model of the System Coordinator

At any scheduling time t c , the system coordinator takes the minimum total operating cost of all interconnected RIES in the future rolling time window t = t c , t c + 1 , , T as the optimization objective, and at the same time satisfies the system power balance requirement and the transformer physical capacity constraint. The corresponding optimization model is formulated as follows.
P 1 :   m i n i = 1 N t = t c T F t , i s . t .   ( 4 ) ( 22 )

3.1.2. Decomposition Method Based on Lagrangian Duality

Problem P1 contains the private operation information of each subject, making it difficult to directly solve using a centralized method. Therefore, the Lagrangian multiplier λ t (representing the system marginal electricity price at time t , λ t 0 ) is introduced to relax the power balance constraint, and the corresponding Lagrangian function is formulated as follows:
L = i = 1 N t = t c T F t , i + t = t c T λ t ( i = 1 N P t , i g r i d P t T r )  
After minimizing over the primal variables, the primal problem is converted into its corresponding Lagrangian dual problem:
P 2 :   max φ ( λ t ) = max inf L
Given λ t , the dual problem can be decomposed into N independent RIES autonomous optimization subproblems and 1 transformer power optimization subproblem, realizing distributed decoupled calculation of the global problem [35,36].

3.1.3. RIES Autonomous Optimization Subproblem

For any RIES, given the system marginal electricity price λ t , its autonomous optimization subproblem takes the minimum operating cost in its own remaining time period as its optimization objective, which is mathematically formulated as:
S P i :   min t = t c T [ k e , t + λ t P t , i g r i d + k g , t ( G t , i C H P + G t , i G F ) ] s . t .   ( 4 ) ( 20 )
Define the local electricity price λ e , t = k e , t + λ t , that is, superimpose the system marginal electricity price on the real-time power price of the bulk grid as the price signal issued by the coordination layer to each RIES. At this time, the form of the subproblem is completely consistent with the autonomous optimization model in Section 2, only replacing the real-time power price k e , t of the bulk grid with the derived local electricity price λ e , t .
The price signal has a clear regulation orientation: when the system power is tight, λ t increases, the local electricity price λ e , t rises, and each subject is incentivized to reduce electricity purchase and release energy storage; when the system power is surplus, λ t decreases, the local electricity price λ e , t falls, and each subject is guided to increase electricity purchase and store electric energy, thereby realizing the dynamic balance of system power [37,38,39].
After each RIES independently solves the above subproblem, it reports the converged interactive power P t , i g r i d , * to the coordination layer. The coordination layer calculates the main transformer power P t T r , * = i = 1 N P t , i g r i d , * t based on this, and verifies the transformer capacity constraint. If the constraint is not satisfied, update λ t and enter the next iteration.

3.2. Two-Stage Distributed Transactional Optimization Mechanism

Traditional distributed iterative methods (such as the subgradient method) suffer from excessive iterations, slow convergence and high communication overhead, which limits their practical engineering prospects for county-level scenarios with limited computing and communication resources [40,41,42]. Therefore, a TSDTO mechanism combining a zero-export constraint is proposed, which transforms intraday multi-variable optimization into a single-variable price search, significantly reducing iterations and communication overhead.

3.2.1. Day-Ahead Pre-Clearing Stage

The day-ahead pre-clearing stage takes 24 h as the time scale. The coordination layer uses the distributed iterative method to solve the complete 24 h collaborative optimization problem based on day-ahead prediction information (including renewable energy generation, system load, electricity prices, and gas tariffs). The mathematical expression is:
m i n i = 1 N t = 1 T F t , i
The predicted local locational electricity price vector covering each time slot of the subsequent day and the corresponding predicted day-ahead planned transformer power vector are:
Λ ^ = { λ ^ e , 1 , λ ^ e , 2 , , λ ^ e , 24 }  
P ^ T r = { P 1 T r , P 2 T r , , P 24 T r }
This stage only performs a global optimization once a day without adopting a rolling strategy. The core goal is to provide an initial price benchmark for intraday rolling scheduling, avoiding intraday scheduling starting from random initial values, and greatly reducing intraday calculation and communication burdens.

3.2.2. Intraday Receding-Horizon Scheduling Stage

On the basis of day-ahead pre-clearing results, this paper further refines the time granularity of intraday scheduling and establishes a distributed rolling optimization strategy with a minimum scheduling step of 15 min and a rolling time horizon of 1 h. The univariate bisection method is still adopted throughout the strategy to rapidly solve the electricity price, and the two-layer distributed architecture featuring upper-layer price coordination and lower-layer regional autonomous decision-making is maintained all the time.
For the implementation logic of intraday scheduling, each basic calculation step is set to 15 min at any scheduling moment, and the prediction and solution time horizon for each rolling optimization is fixed at 1 h, which consists of four consecutive 15 min time intervals. The system coordinator takes the time-of-use electricity price benchmark obtained from day-ahead pre-clearing as the reference, and only dynamically corrects the local electricity price of the current 15 min interval. The electricity price benchmarks of the subsequent three 15 min intervals follow the day-ahead pre-clearing results of the current hour. In this way, the high-dimensional multi-variable optimization problem is continuously simplified into a single electricity price variable optimization problem, which guarantees the solution efficiency.
The detailed implementation procedure is presented as follows:
(1)
Initialization:
The coordination layer broadcasts the day-ahead local electricity price vector Λ to each RIES, sets the convergence threshold for the current period’s absolute power imbalance ζ , and constructs the electricity price search interval for the current time slot based on the day-ahead electricity price of the present 15 min interval:
λ _ e = 0.8 λ ^ e , t c ,   λ ¯ e = 1.2 λ ^ e , t c
where t c denotes the current 15 min dispatching time instant.
(2)
Tentative price and distributed solution of subproblems:
Initialize the iteration counter p = 0 , and employ the midpoint of the defined range as the tentative price for the current time period:
λ e , t c ( p ) = λ _ e + λ ¯ e 2
Each RIES constructs the local electricity price vector Λ t c ( p ) = λ e , t c ( p ) , λ e , t c + 1 , , λ e , T , independently solves the autonomous optimization subproblem, and reports the converged interactive power P t c , i g r i d , ( p ) of the current time period.
(3)
Imbalance calculation and price update:
The coordination layer aggregates the interactive power of all regions and calculates the system power imbalance of the current 15 min interval:
Δ P t c ( p ) = i = 1 N P t c , i g r i d , ( p ) P t c T r
If | Δ P t c ( p ) | < ζ or the number of iterations reaches the preset maximum value, the iteration converges, and the current tentative price λ e , t c ( p ) is the converged local electricity price for this time period;
If Δ P t c ( p ) > 0 , the total electricity purchase demand of each RIES exceeds the day-ahead planned transformer power, and the local electricity price needs to be increased to suppress electricity purchase, let λ _ e = λ e , t c ( p ) ;
If Δ P t c ( p ) < 0 , it indicates that under the current tentative price, the total electricity purchase demand of each RIES is lower than the day-ahead planned transformer power, and the local electricity price needs to be lowered to incentivize electricity purchase, let λ ¯ e = λ e , t c ( p ) .
Let p = p + 1 , and go back to Step 2 to proceed with the iterative search.
(4)
Scheduling plan execution:
After the scheduling scheme for the current 15 min interval is implemented, the overall scheduling time horizon rolls forward by 15 min. The above procedures are repeated to accomplish the refined intraday full-cycle scheduling interval by interval. With a 1 h rolling window and a 15 min calculation step, this mechanism well balances the real-time performance and power fluctuation mitigation capability of scheduling. Meanwhile, the adoption of the bisection method maintains the core advantages of low iteration counts and low communication overhead in distributed operation scenarios.

4. Case Study

4.1. Case Scenario and Basic Parameter Settings

In this chapter, taking a typical county-level distribution network in northern China as the engineering background, three types of integrated energy systems, namely industrial park (RIES1), residential area (RIES2), and commercial area (RIES3) in the county, are selected to form an interconnected system to verify the effectiveness and superiority of the proposed TSDTO mechanism. Among them, the industrial area is a small processing industrial park in the county, the residential area is a contiguous residential community, and their load scales are similar; the commercial area is located in the county center with the highest energy intensity and the highest load. The simulation platform is Matlab R2025a, and the YALMIP toolbox and CPLEX solver are called to complete the calculation.

4.1.1. System Equipment Parameters

Each regional integrated energy system is equipped with CHP, GF, EB, EES, TES, and distributed photovoltaic/wind power units. Among them, RIES1 and RIES3 are equipped with CHP, RIES2 uses GF and EB as the main heat sources, and all three types of systems are equipped with EES and TES. The key parameters such as core energy conversion efficiency, equipment capacity, and energy storage constraints are shown in Table 1 [26].

4.1.2. Energy Price Parameters

The main grid price adopts the day-ahead hourly electricity price of the Shandong Province electricity spot market in January 2025, and the value range is 0.2~1.0 yuan/kWh after linear normalization [43]. The unified grid feed-in price for power transmitted from RIES to the main grid is set at 0.2 yuan/kWh. Natural gas price is fixed at 3.5 yuan/m3 according to the conventional price in the county.

4.1.3. Comparison Scheme Settings

To hierarchically verify the optimization effects of three technologies, namely regional interconnected operation, zero-export constraint and intraday rolling optimization with a 15 min time scale, four progressive comparative schemes are established in this paper. The day-ahead scheduling of all schemes adopts a 1 h time scale and the subgradient method to ensure a single variable for comparative analysis:
  • Scheme 1 (S1, Decentralized Operation Mode): Each regional RIES operates independently with converged scheduling results, without inter-regional energy interaction and information collaboration.
  • Scheme 2 (S2, Interconnection-only Mode): Power mutual support is realized among multiple regions via tie lines. The day-ahead scheduling is performed by the subgradient method with a 1 h time scale, and power reverse delivery from regions to the main grid is permitted.
  • Scheme 3 (S3, Interconnection with Zero-export Constraint Mode): The zero-export operational constraint is introduced on the basis of Scheme 2.
  • Scheme 4 (S4, Complete TSDTO Mode): The interconnection architecture and zero-export constraint are retained. The day-ahead scheduling still uses the 1 h time scale and the subgradient method, while a refined scheduling strategy based on the bisection method with a 15 min time scale and a 1 h rolling horizon is added for intraday operation. This scheme corresponds to the complete optimization strategy proposed in this paper.

4.2. Analysis of Load and Renewable Energy Output Characteristics

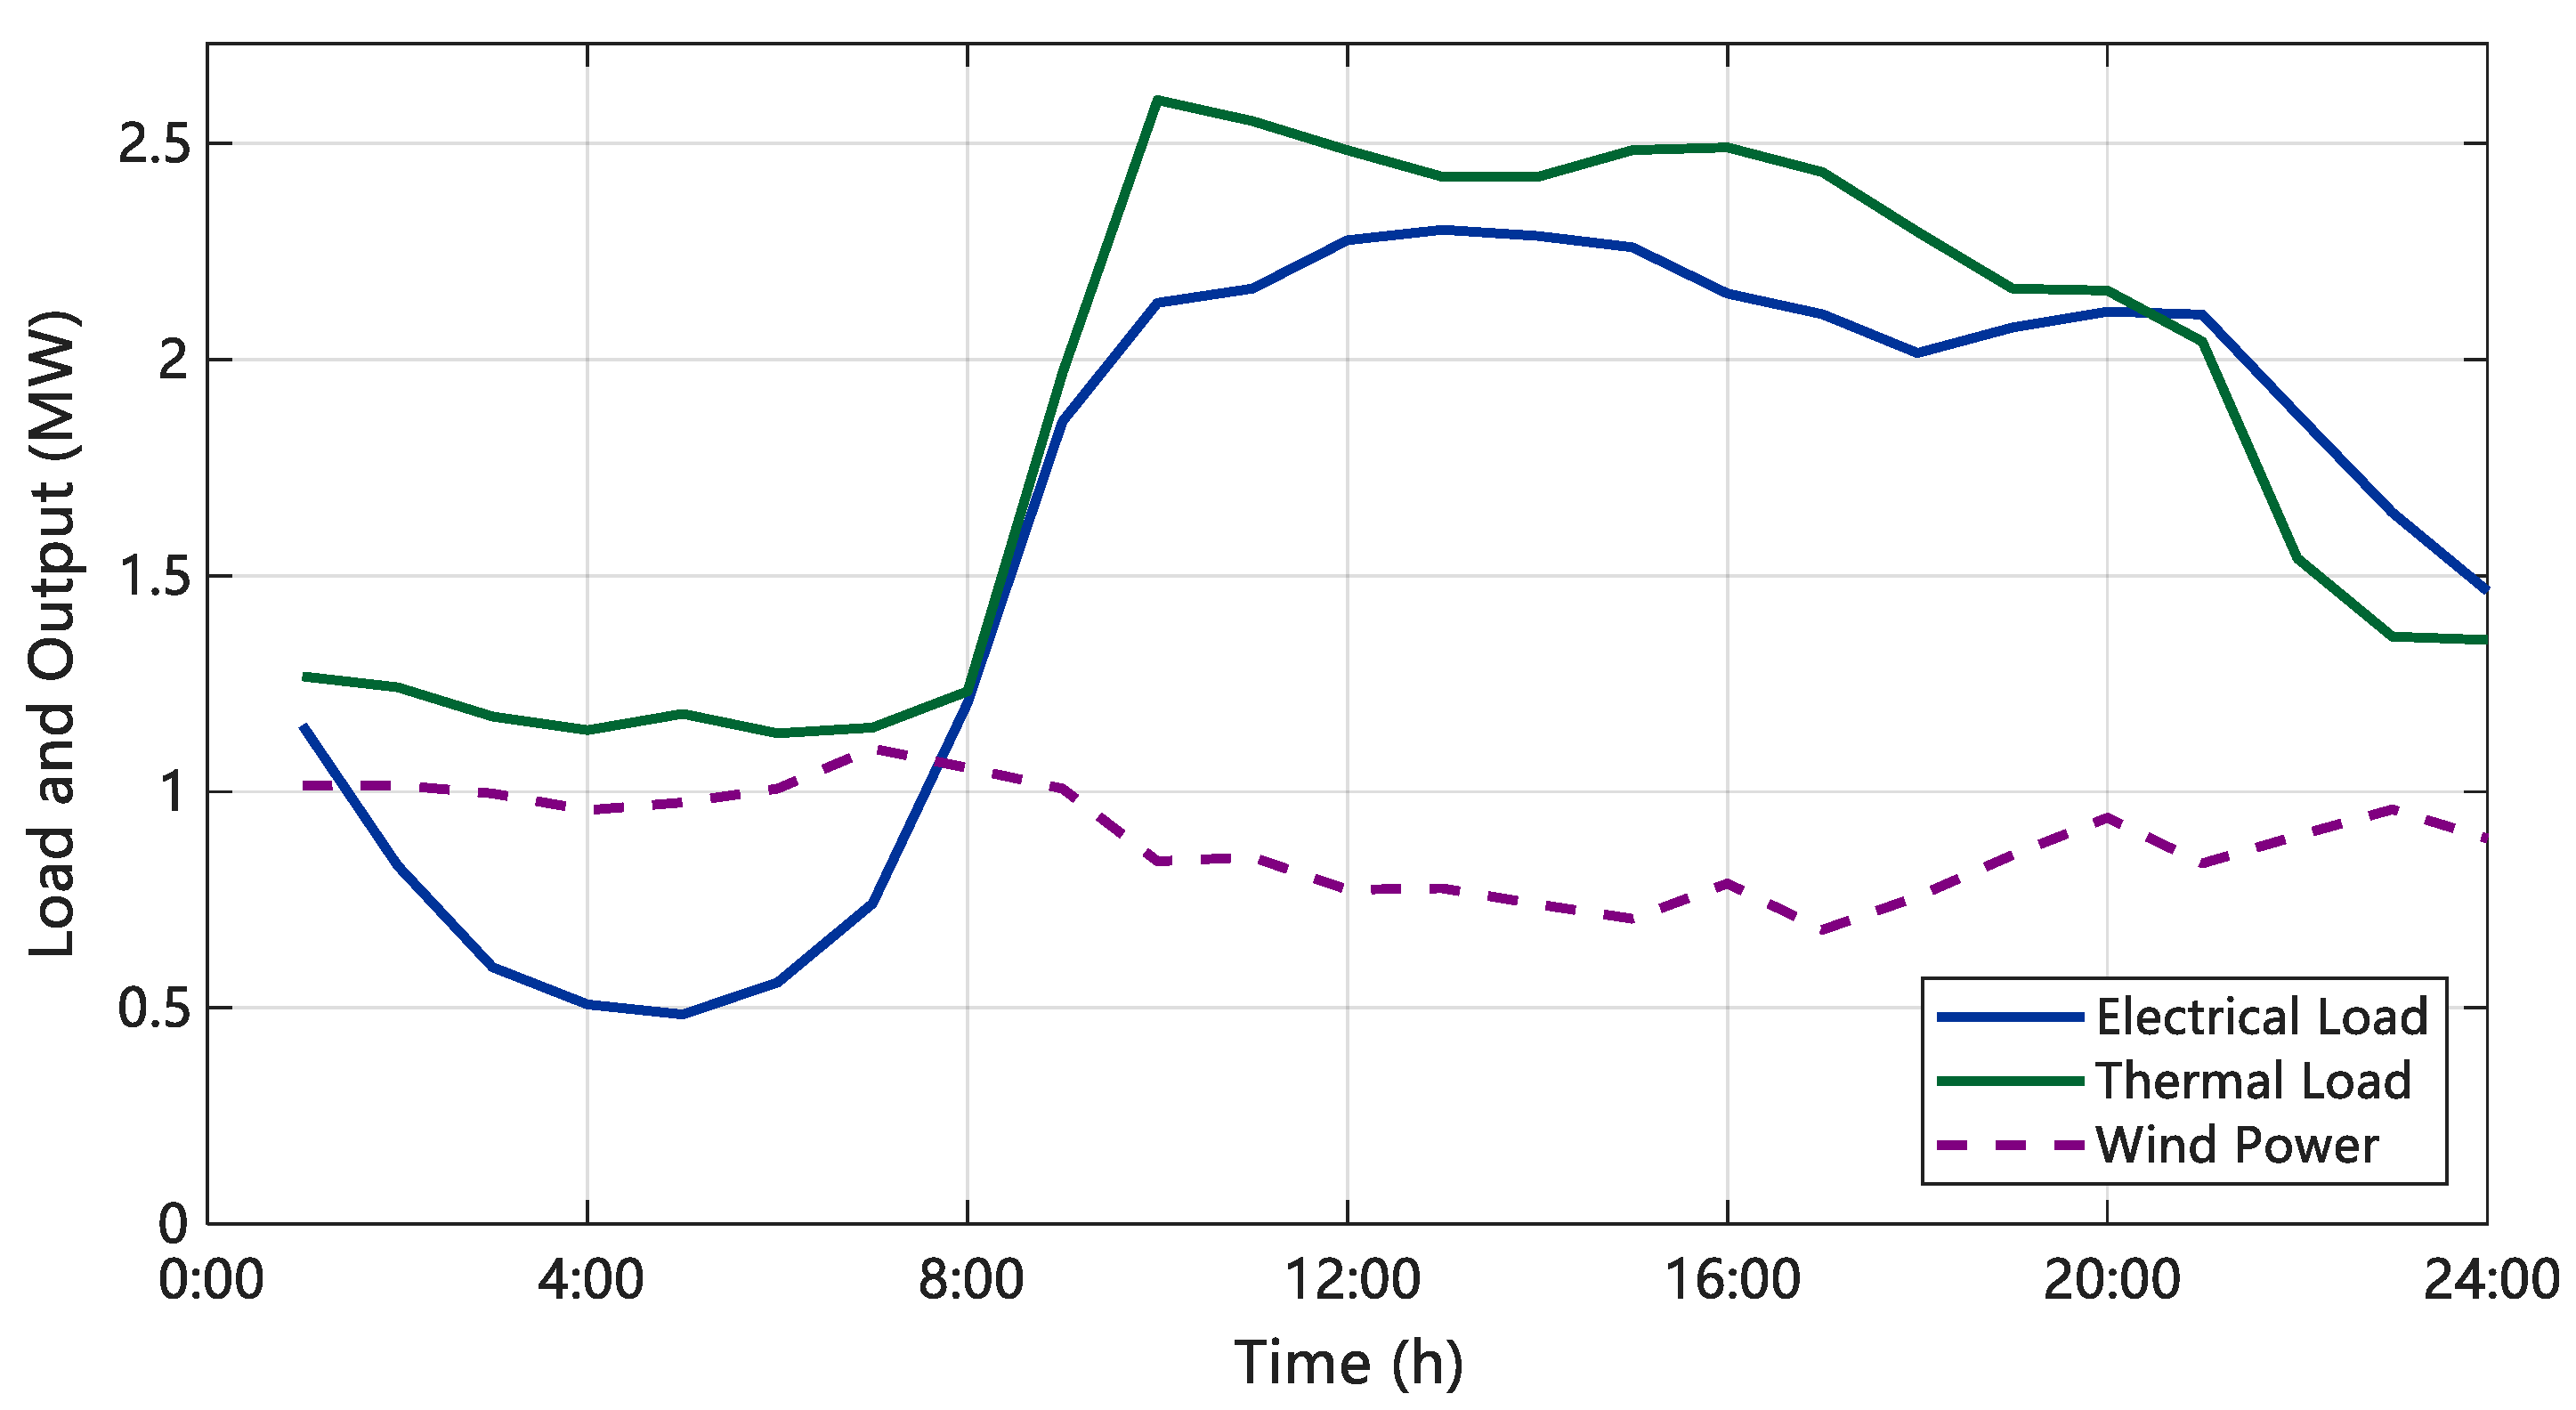
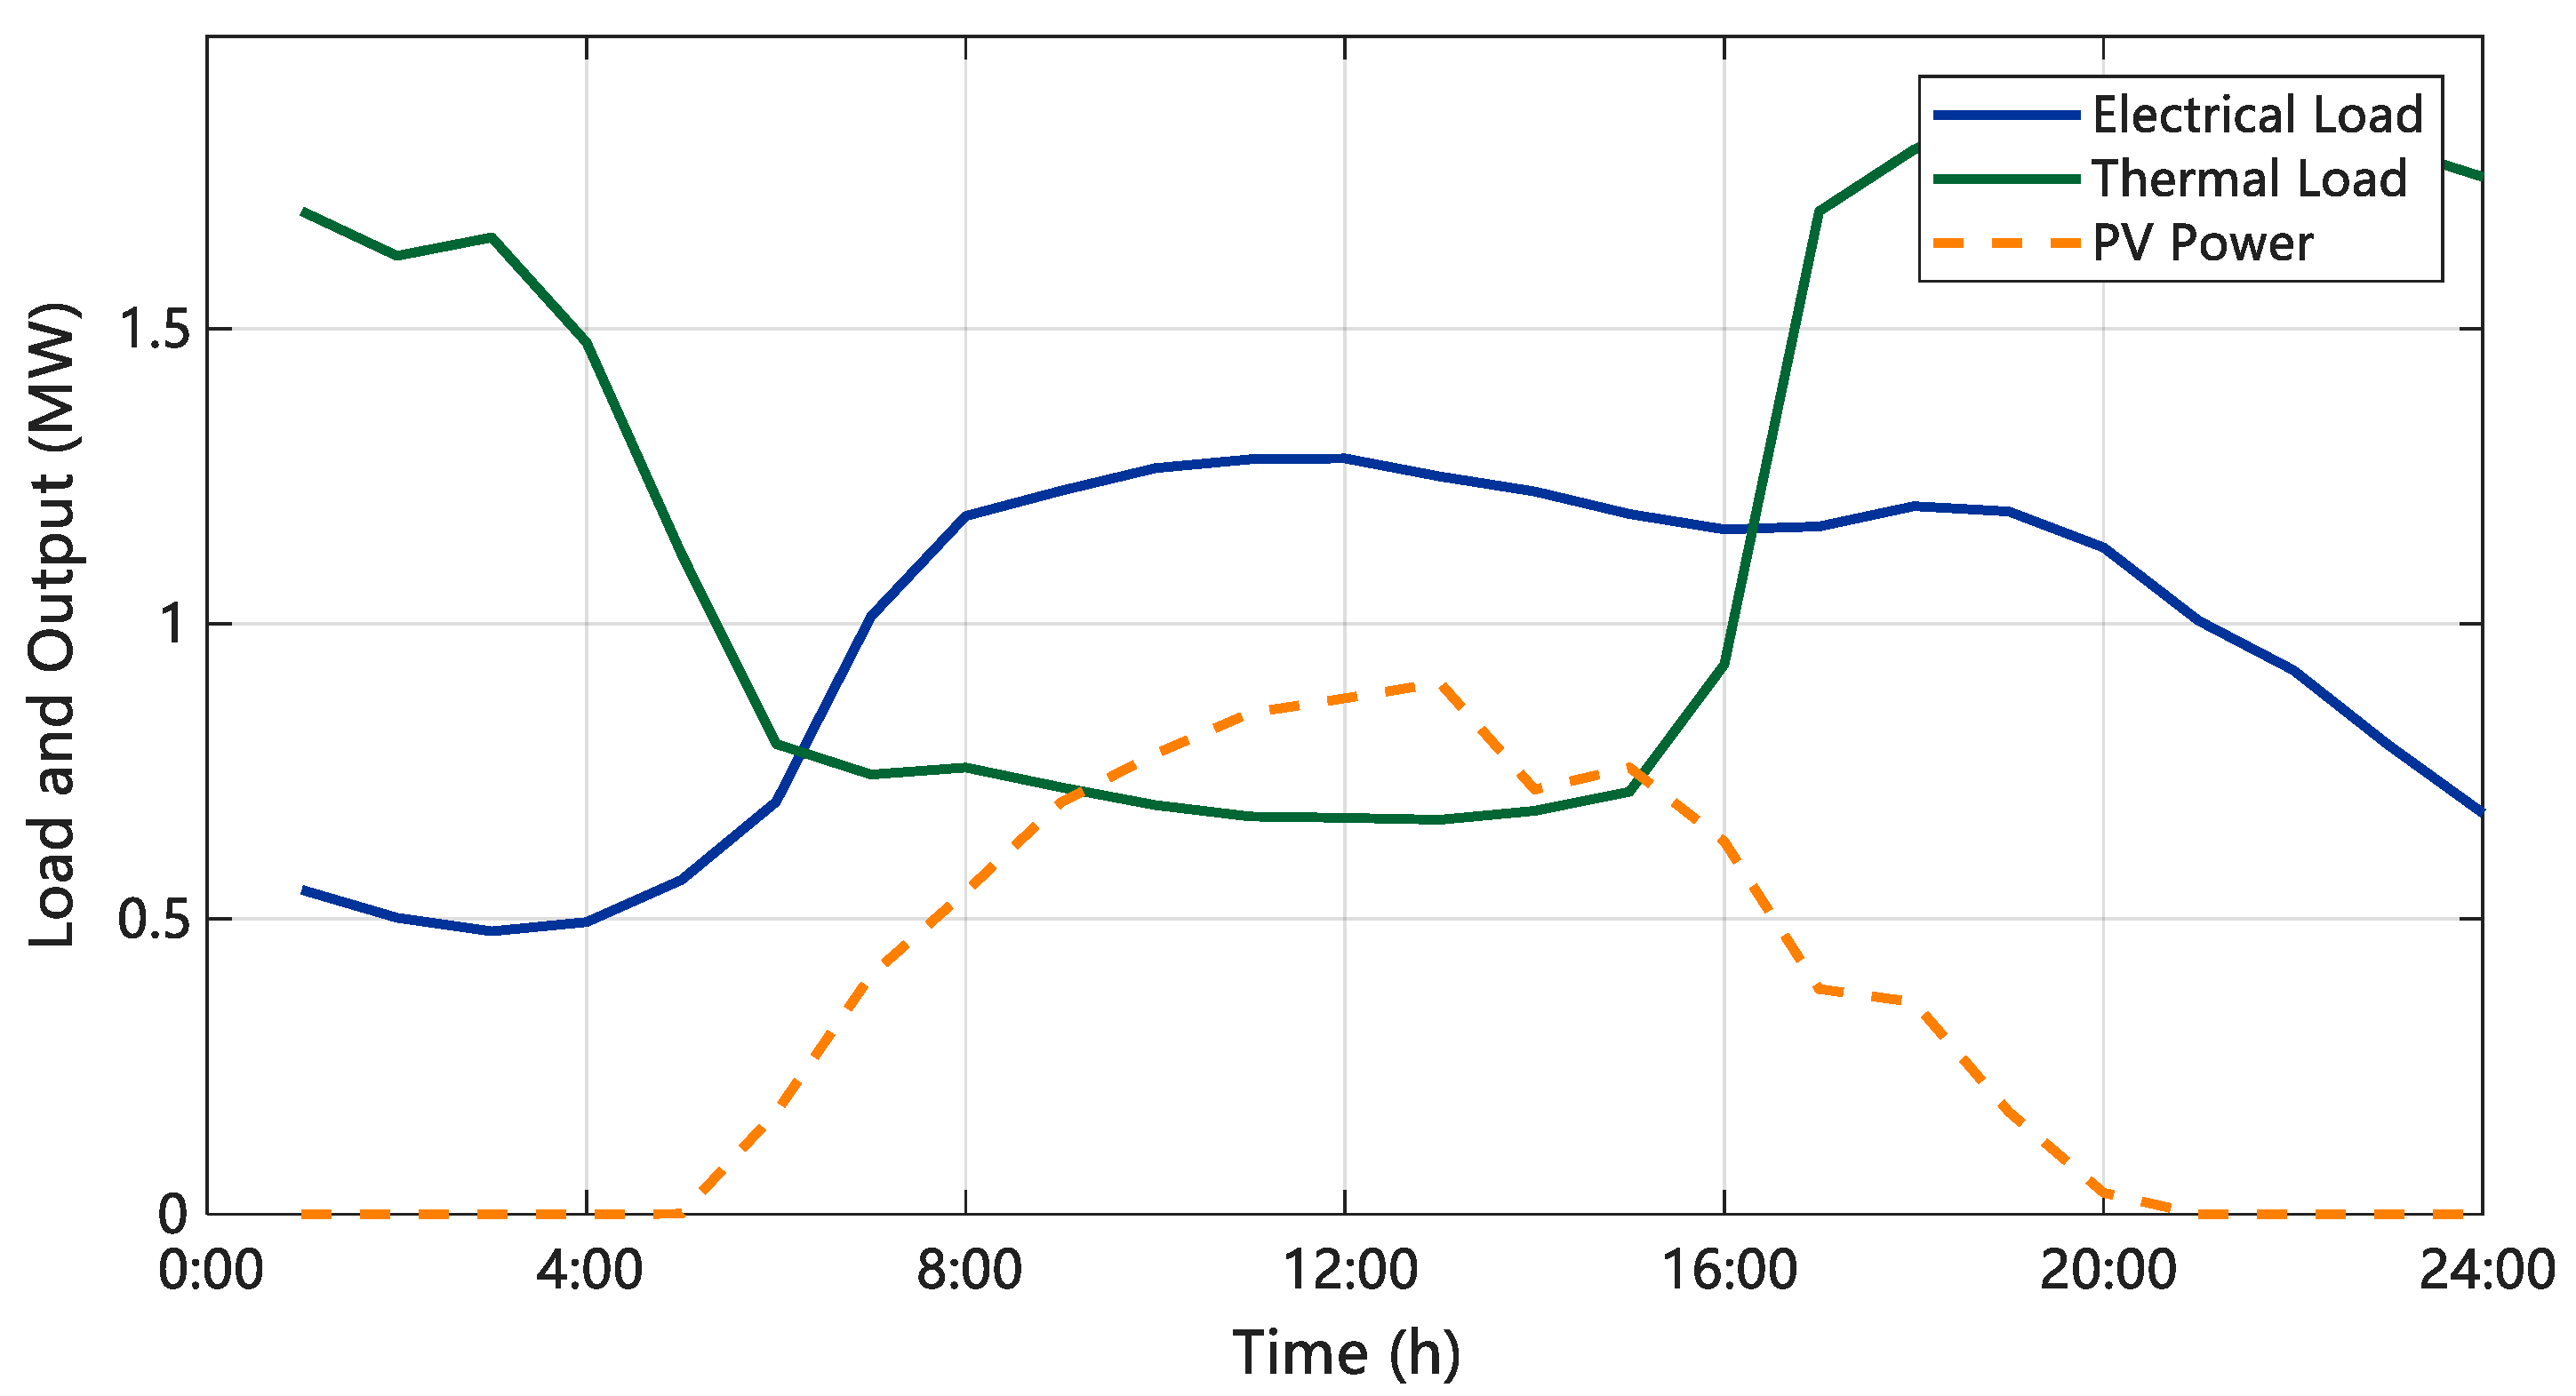
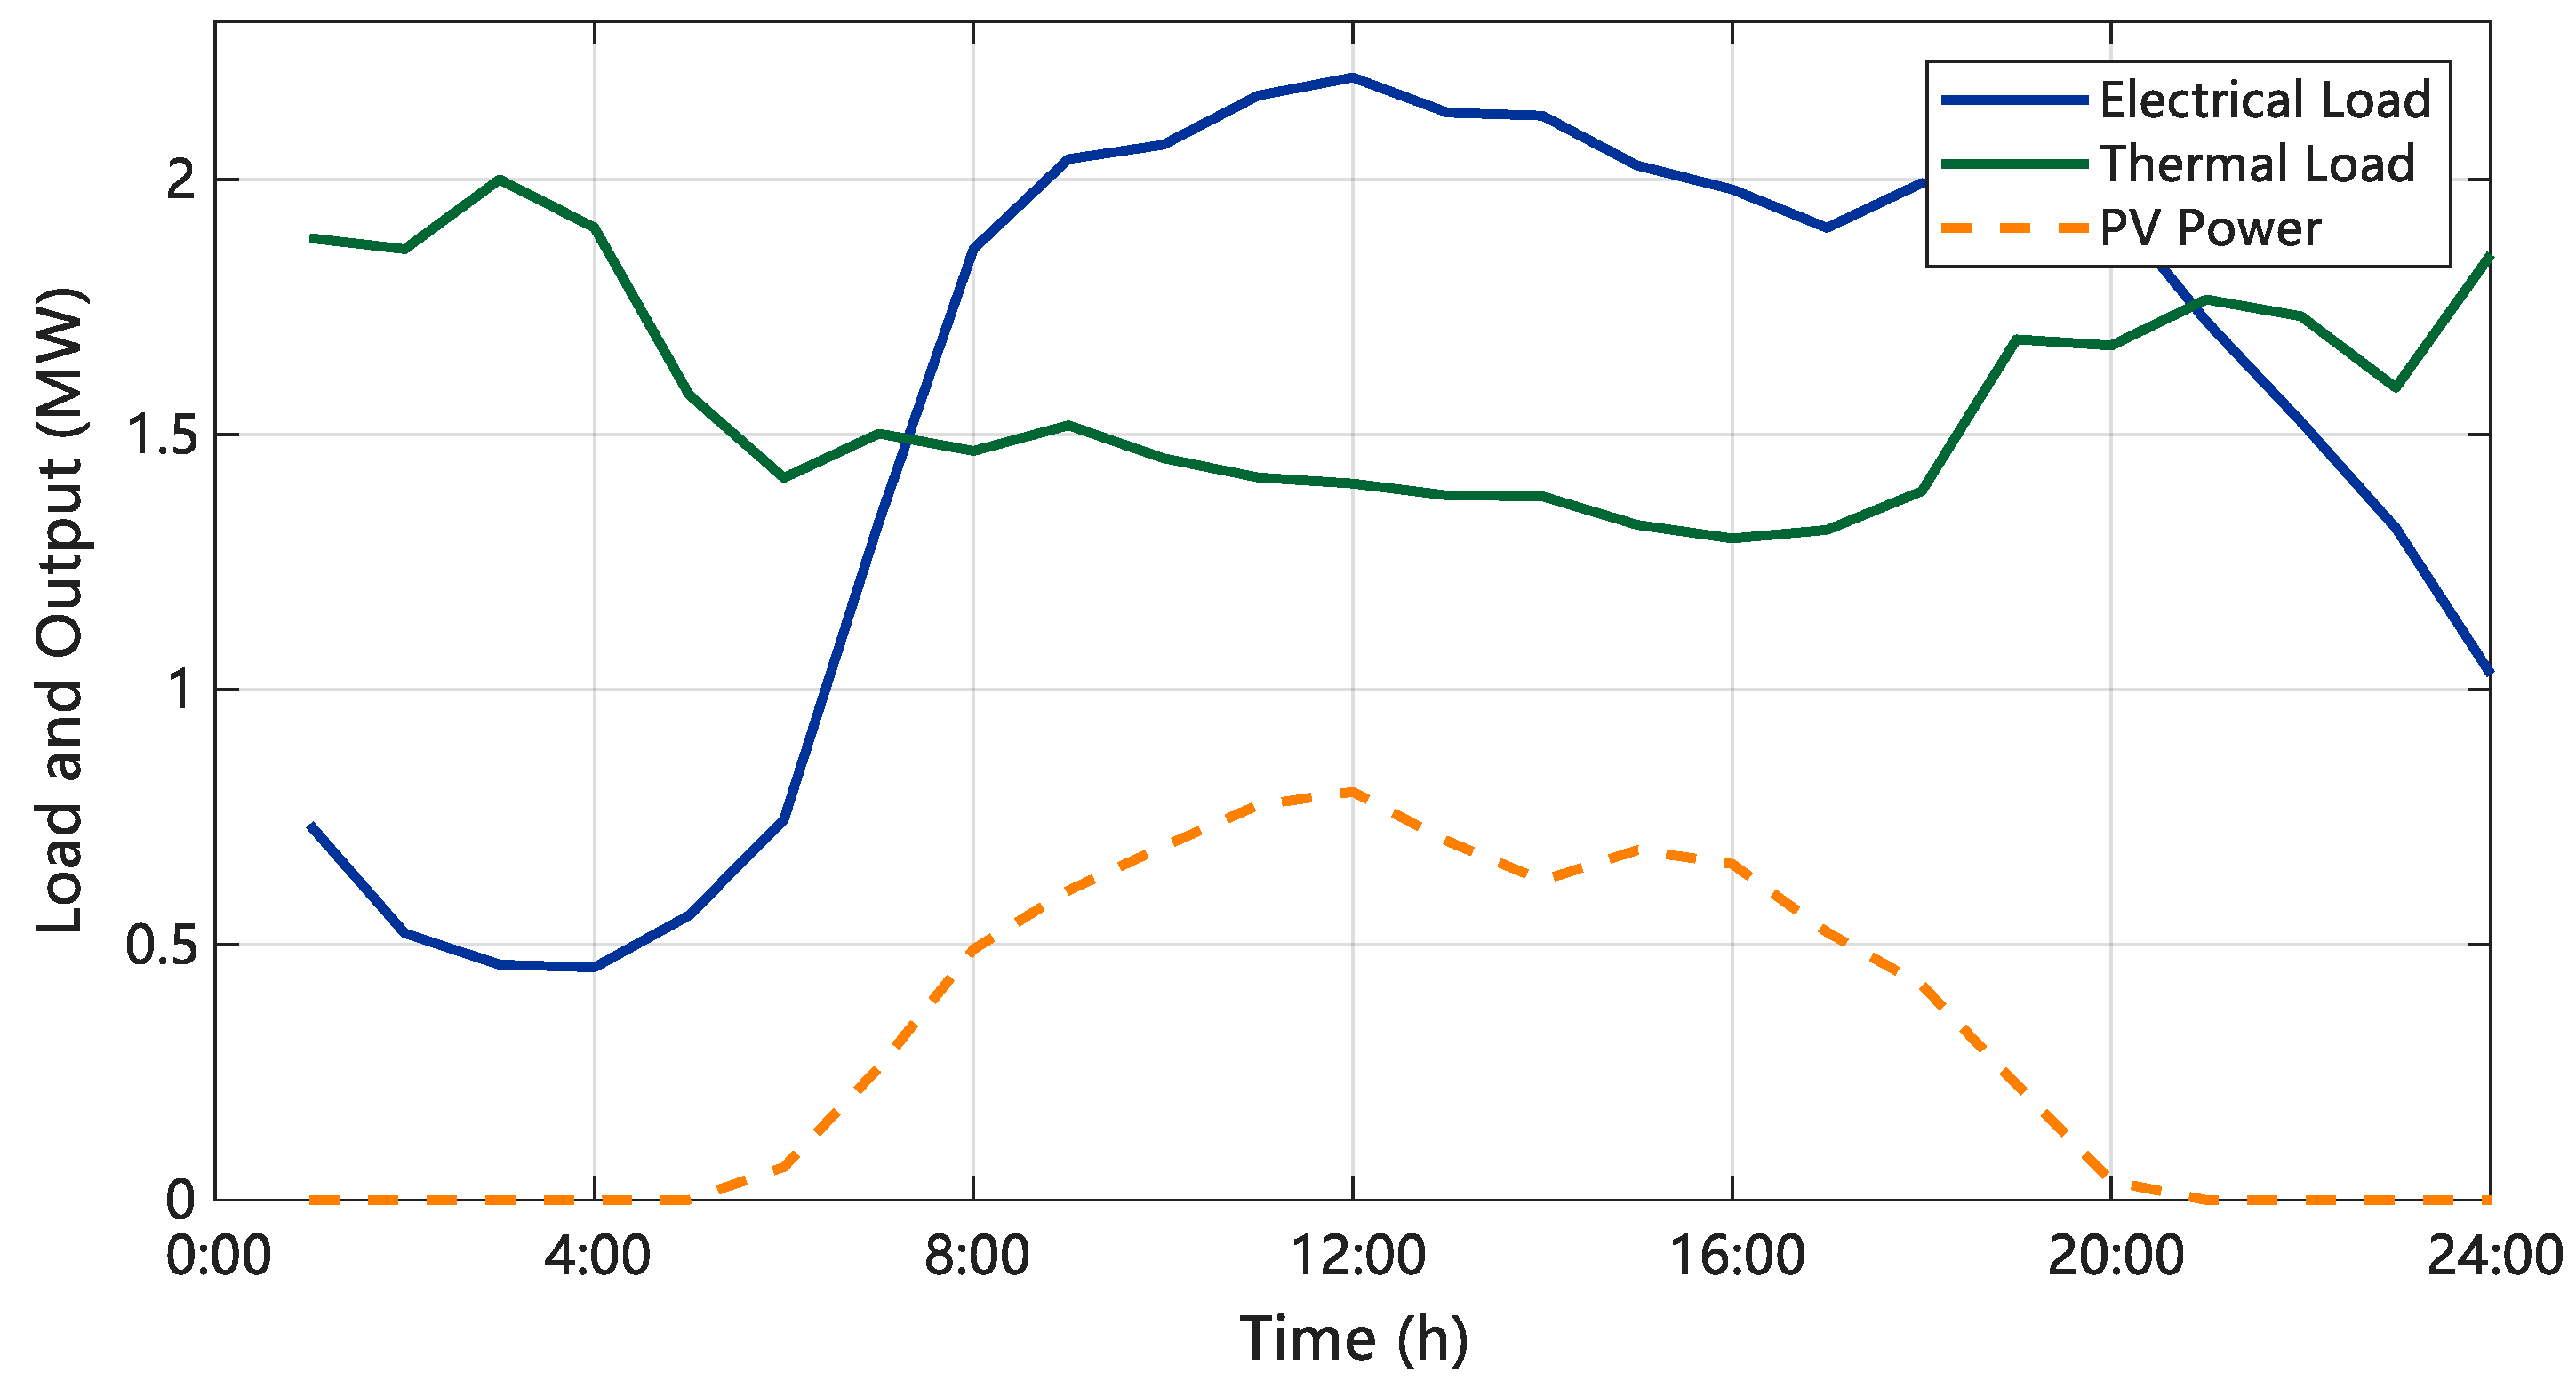
The day-ahead predicted electrical/thermal load and renewable energy generation of different regions are shown in Figure 3, Figure 4 and Figure 5:
The energy consumption characteristics and renewable energy output of the three types of RIES have significant temporal and spatial complementarity:
RIES1 (Industry): Electrical and thermal loads are mainly concentrated in the daytime production period with distinct temporal characteristics, and they are equipped with distributed wind power;
RIES2 (Residential): The electrical load presents a morning and evening double-peak characteristic, the thermal load is concentrated at night, and it is equipped with distributed photovoltaic;
RIES3 (Commerce): The overall energy consumption scale is the largest, the thermal load is relatively evenly distributed throughout the day, the electrical load is concentrated in the daytime business hours, and it is equipped with distributed photovoltaic.
The above temporal and spatial complementarity provides basic conditions for inter-regional power mutual aid and local consumption of renewable energy.

4.3. S1, S2 and S3: Comparative Analysis of Simulation Results

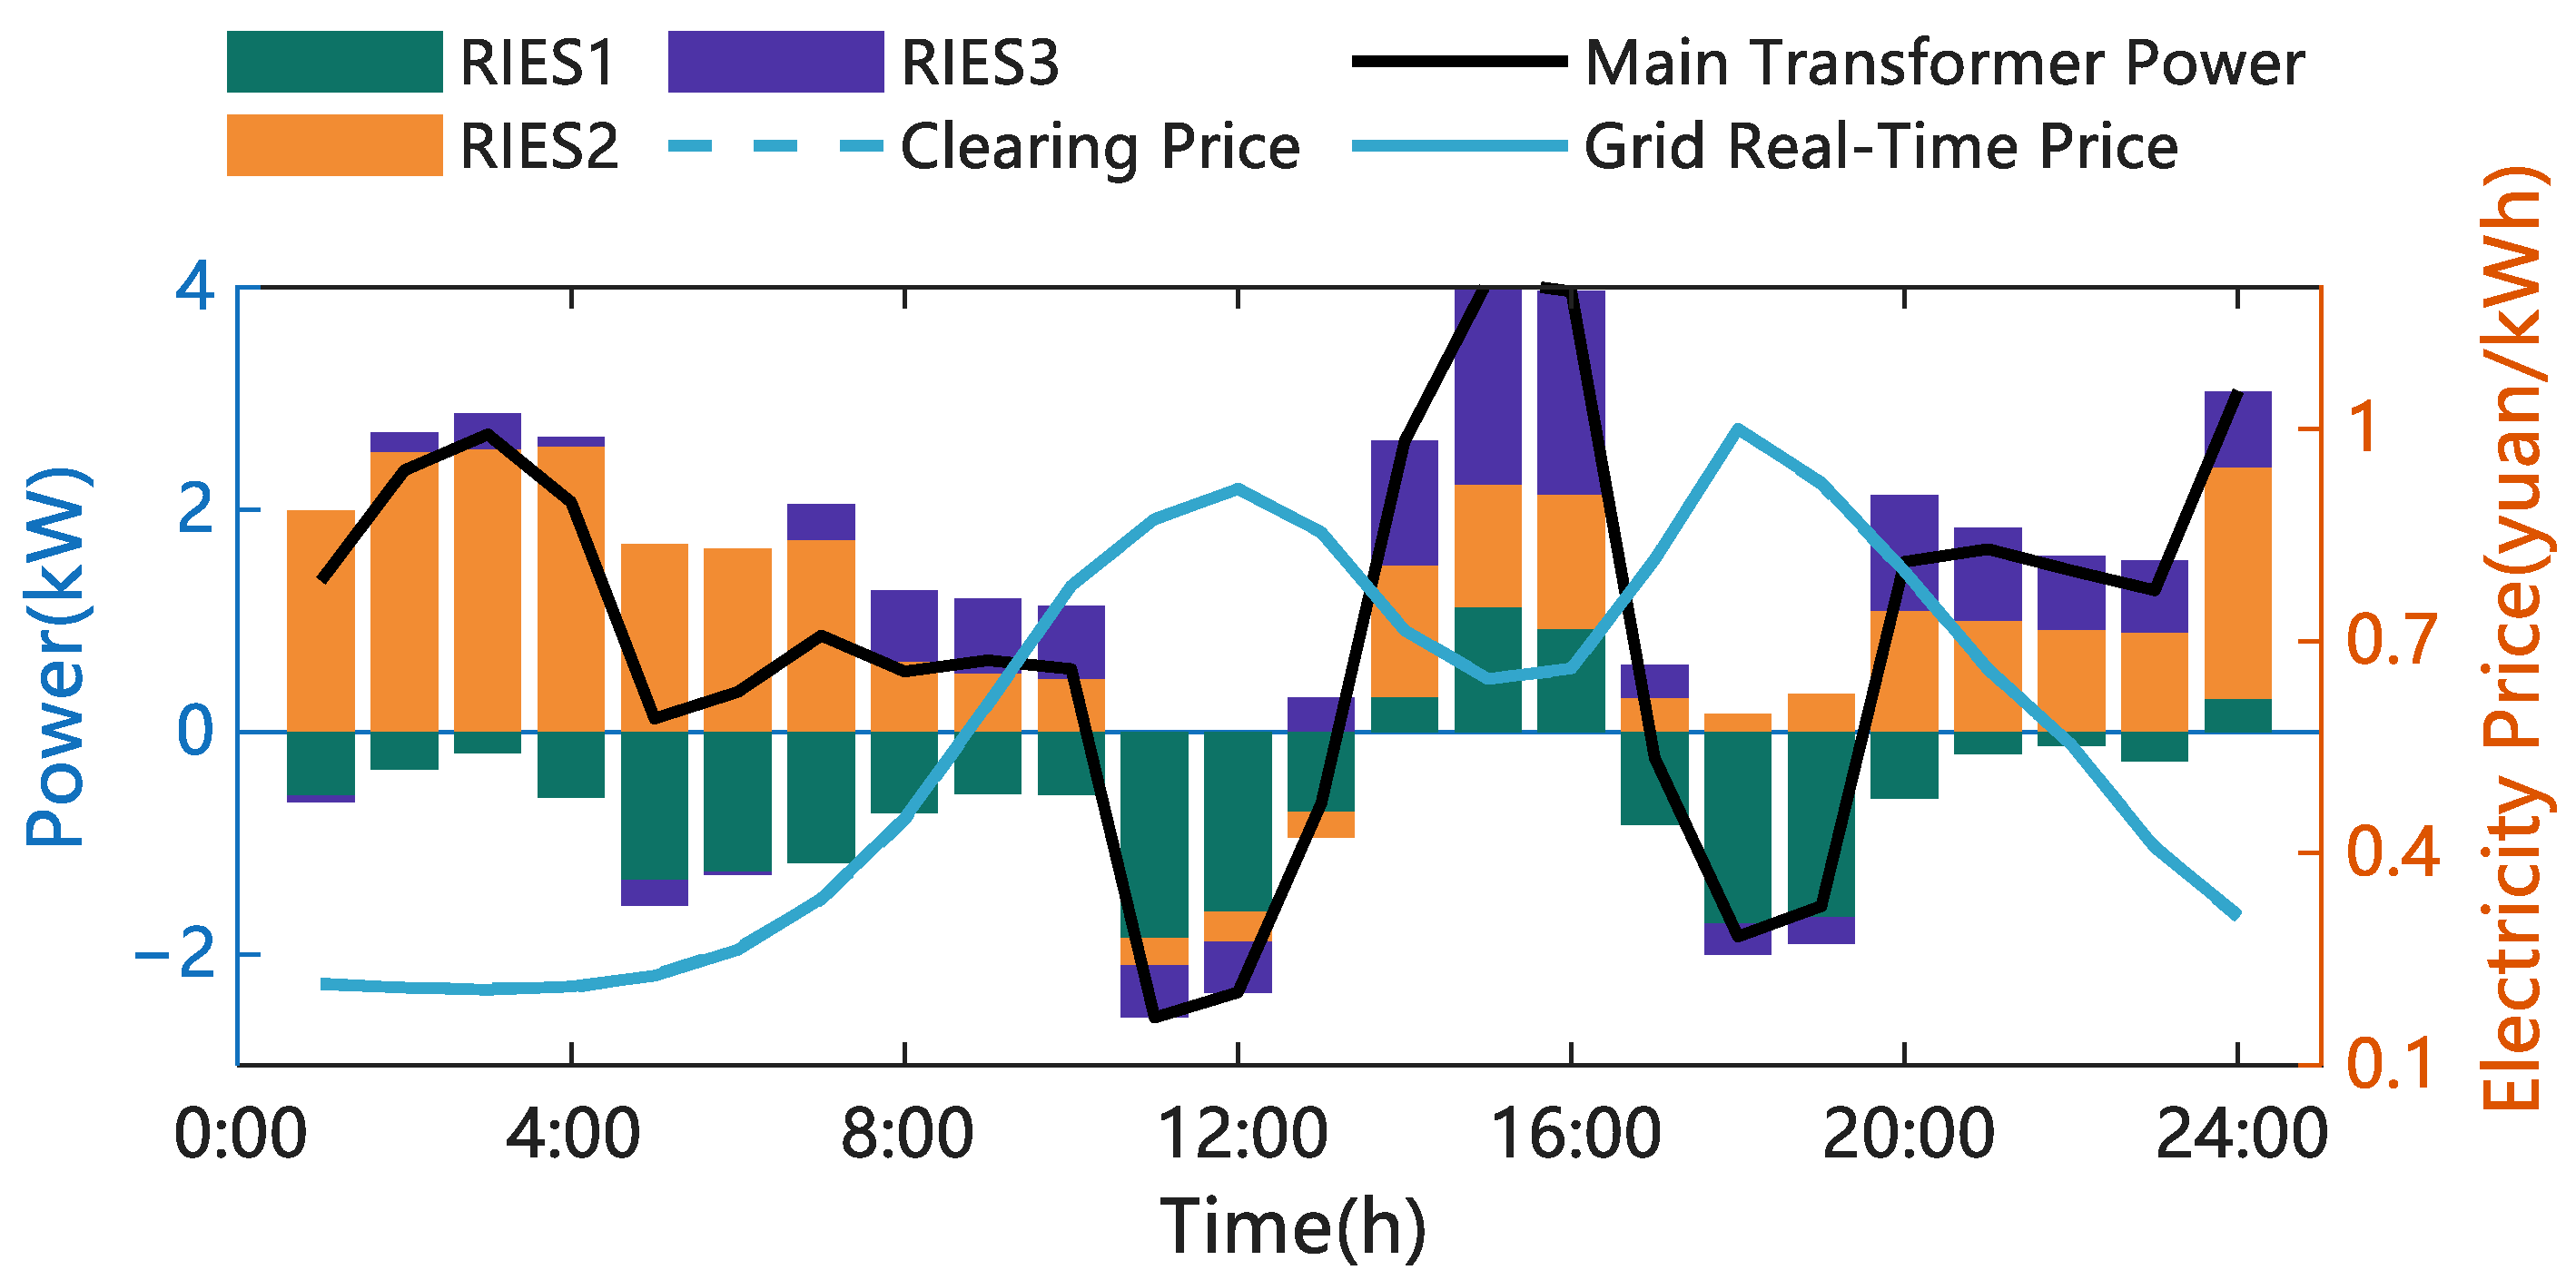
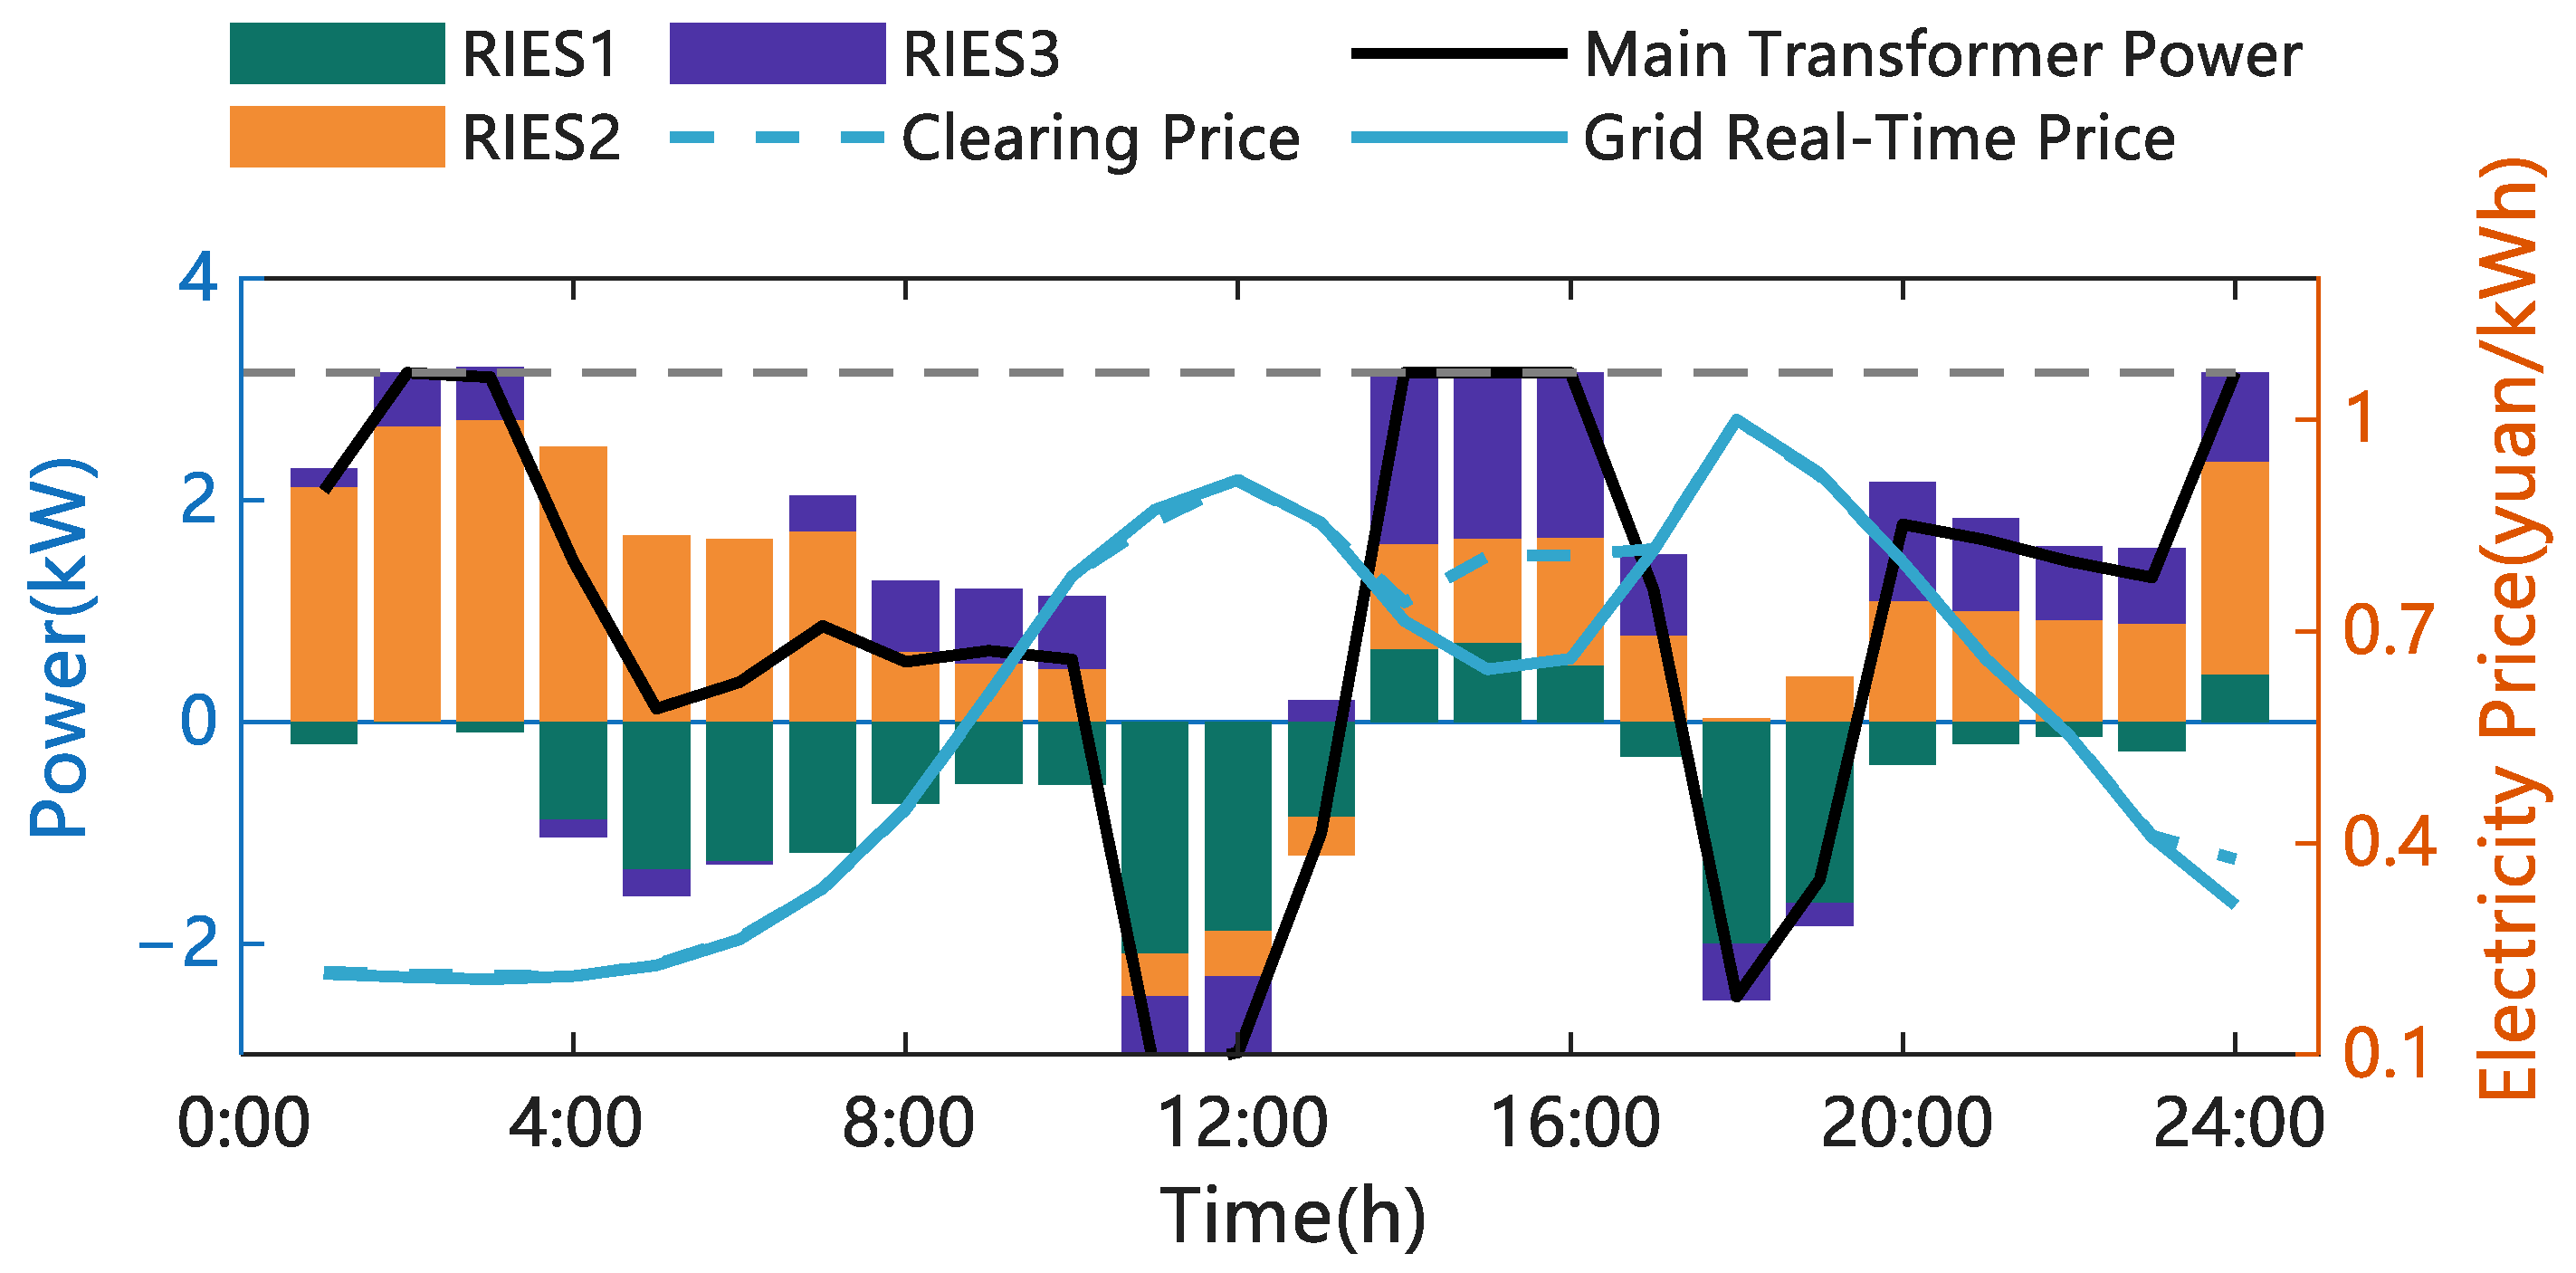
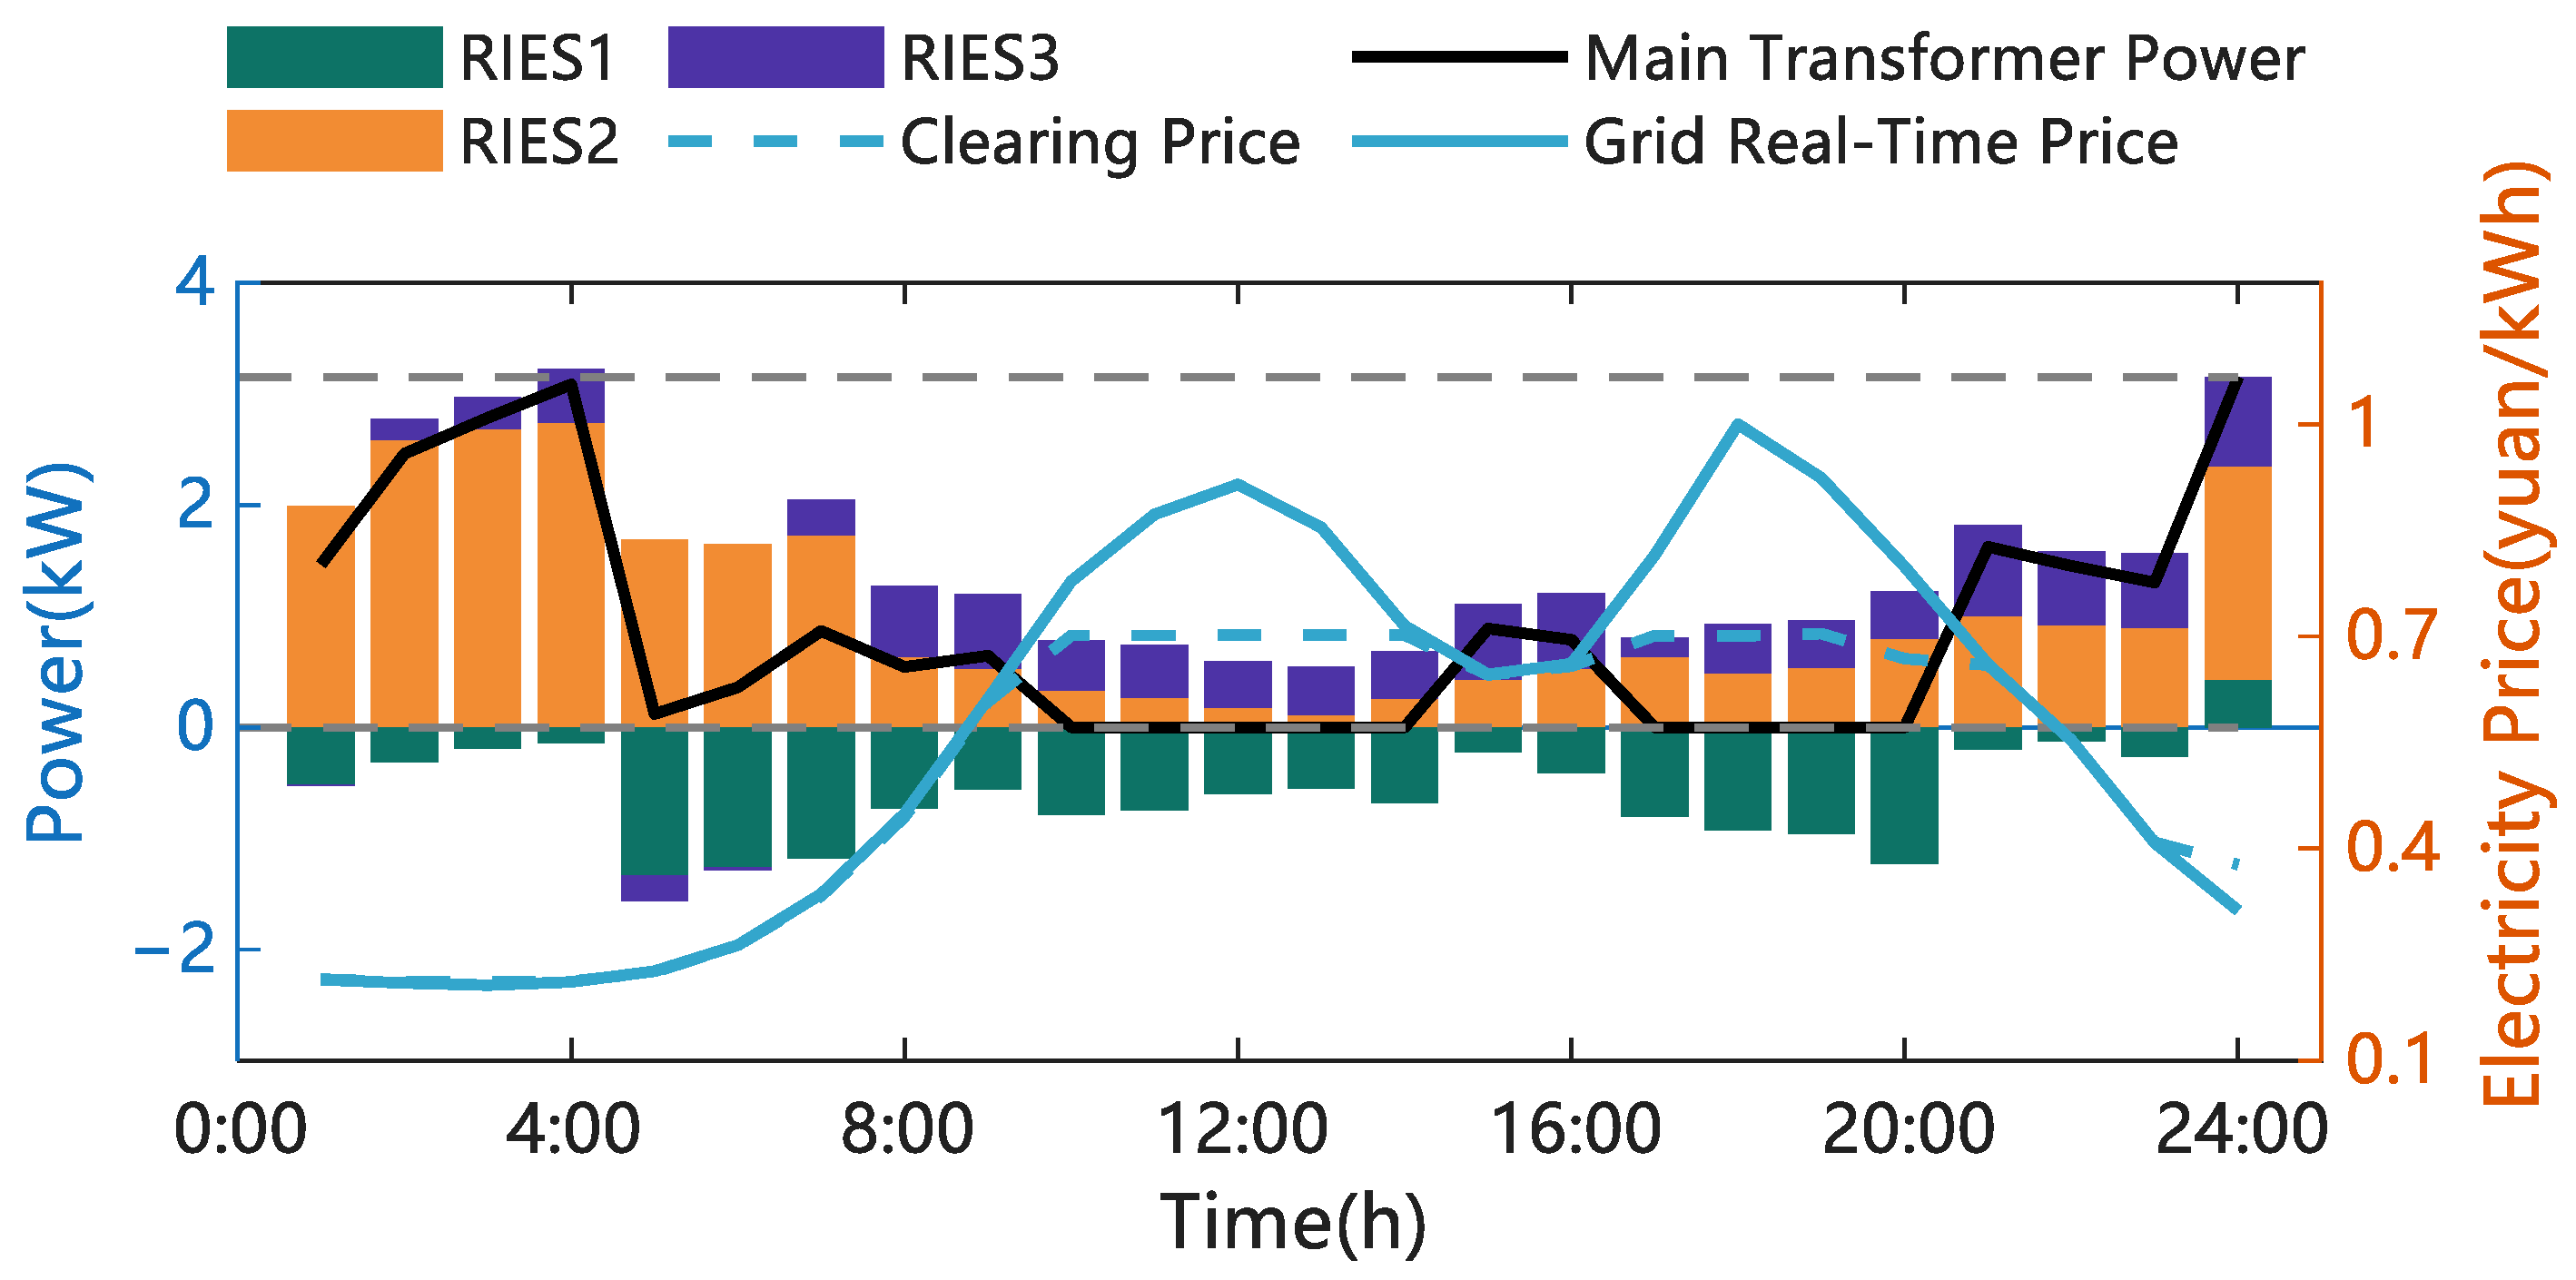
Figure 6, Figure 7 and Figure 8 illustrate the coupling relationship between regional power distribution and main transformer power under three operating scenarios of S1, S2 and S3, respectively.
(1)
S1:
Each region operates completely independently, and the power distribution is determined by local supply and demand. During the period of high renewable energy output (such as 11:00–13:00), RIES1 has abundant surplus power injected into the grid, while during the peak electricity consumption period (15:00–17:00), all three regions must draw power from the main grid, leading to main transformer overload. There is no energy interaction between regions, the main transformer power fluctuates violently, and surplus–deficit mutual aid cannot be realized, resulting in poor operation economy.
(2)
S2:
The subgradient method is adopted to realize energy interaction among regions. During the peak period (15:00–17:00), the power of the three regions presents obvious temporal and spatial transfer characteristics, and the main transformer power fluctuation is suppressed, but it is still close to the safety threshold in some periods, which cannot completely solve the congestion problem, with limited peak shaving effect and insufficient collaboration effect.
(3)
S3:
Through temporal distributed two-layer optimization, deep collaboration of multiple regions is realized. The power during the peak electricity consumption period is strictly controlled within the safety threshold without overload congestion risk; during the period of high renewable energy output, the surplus power of RIES1 is transmitted to RIES3 through collaborative temporal scheduling, greatly reducing surplus power grid connection and realizing the optimal allocation of resources among regions; the main transformer power operation curve is stable throughout the whole period without over-limit and large fluctuations. During the high electricity price periods of the main grid (11:00–14:00, 18:00–20:00), the main grid electricity purchase is reduced through inter-regional collaboration, and electricity is reasonably purchased during the low electricity price period, improving the system economy. The collaborative optimization effect shows clearer advantages over the other two strategies.
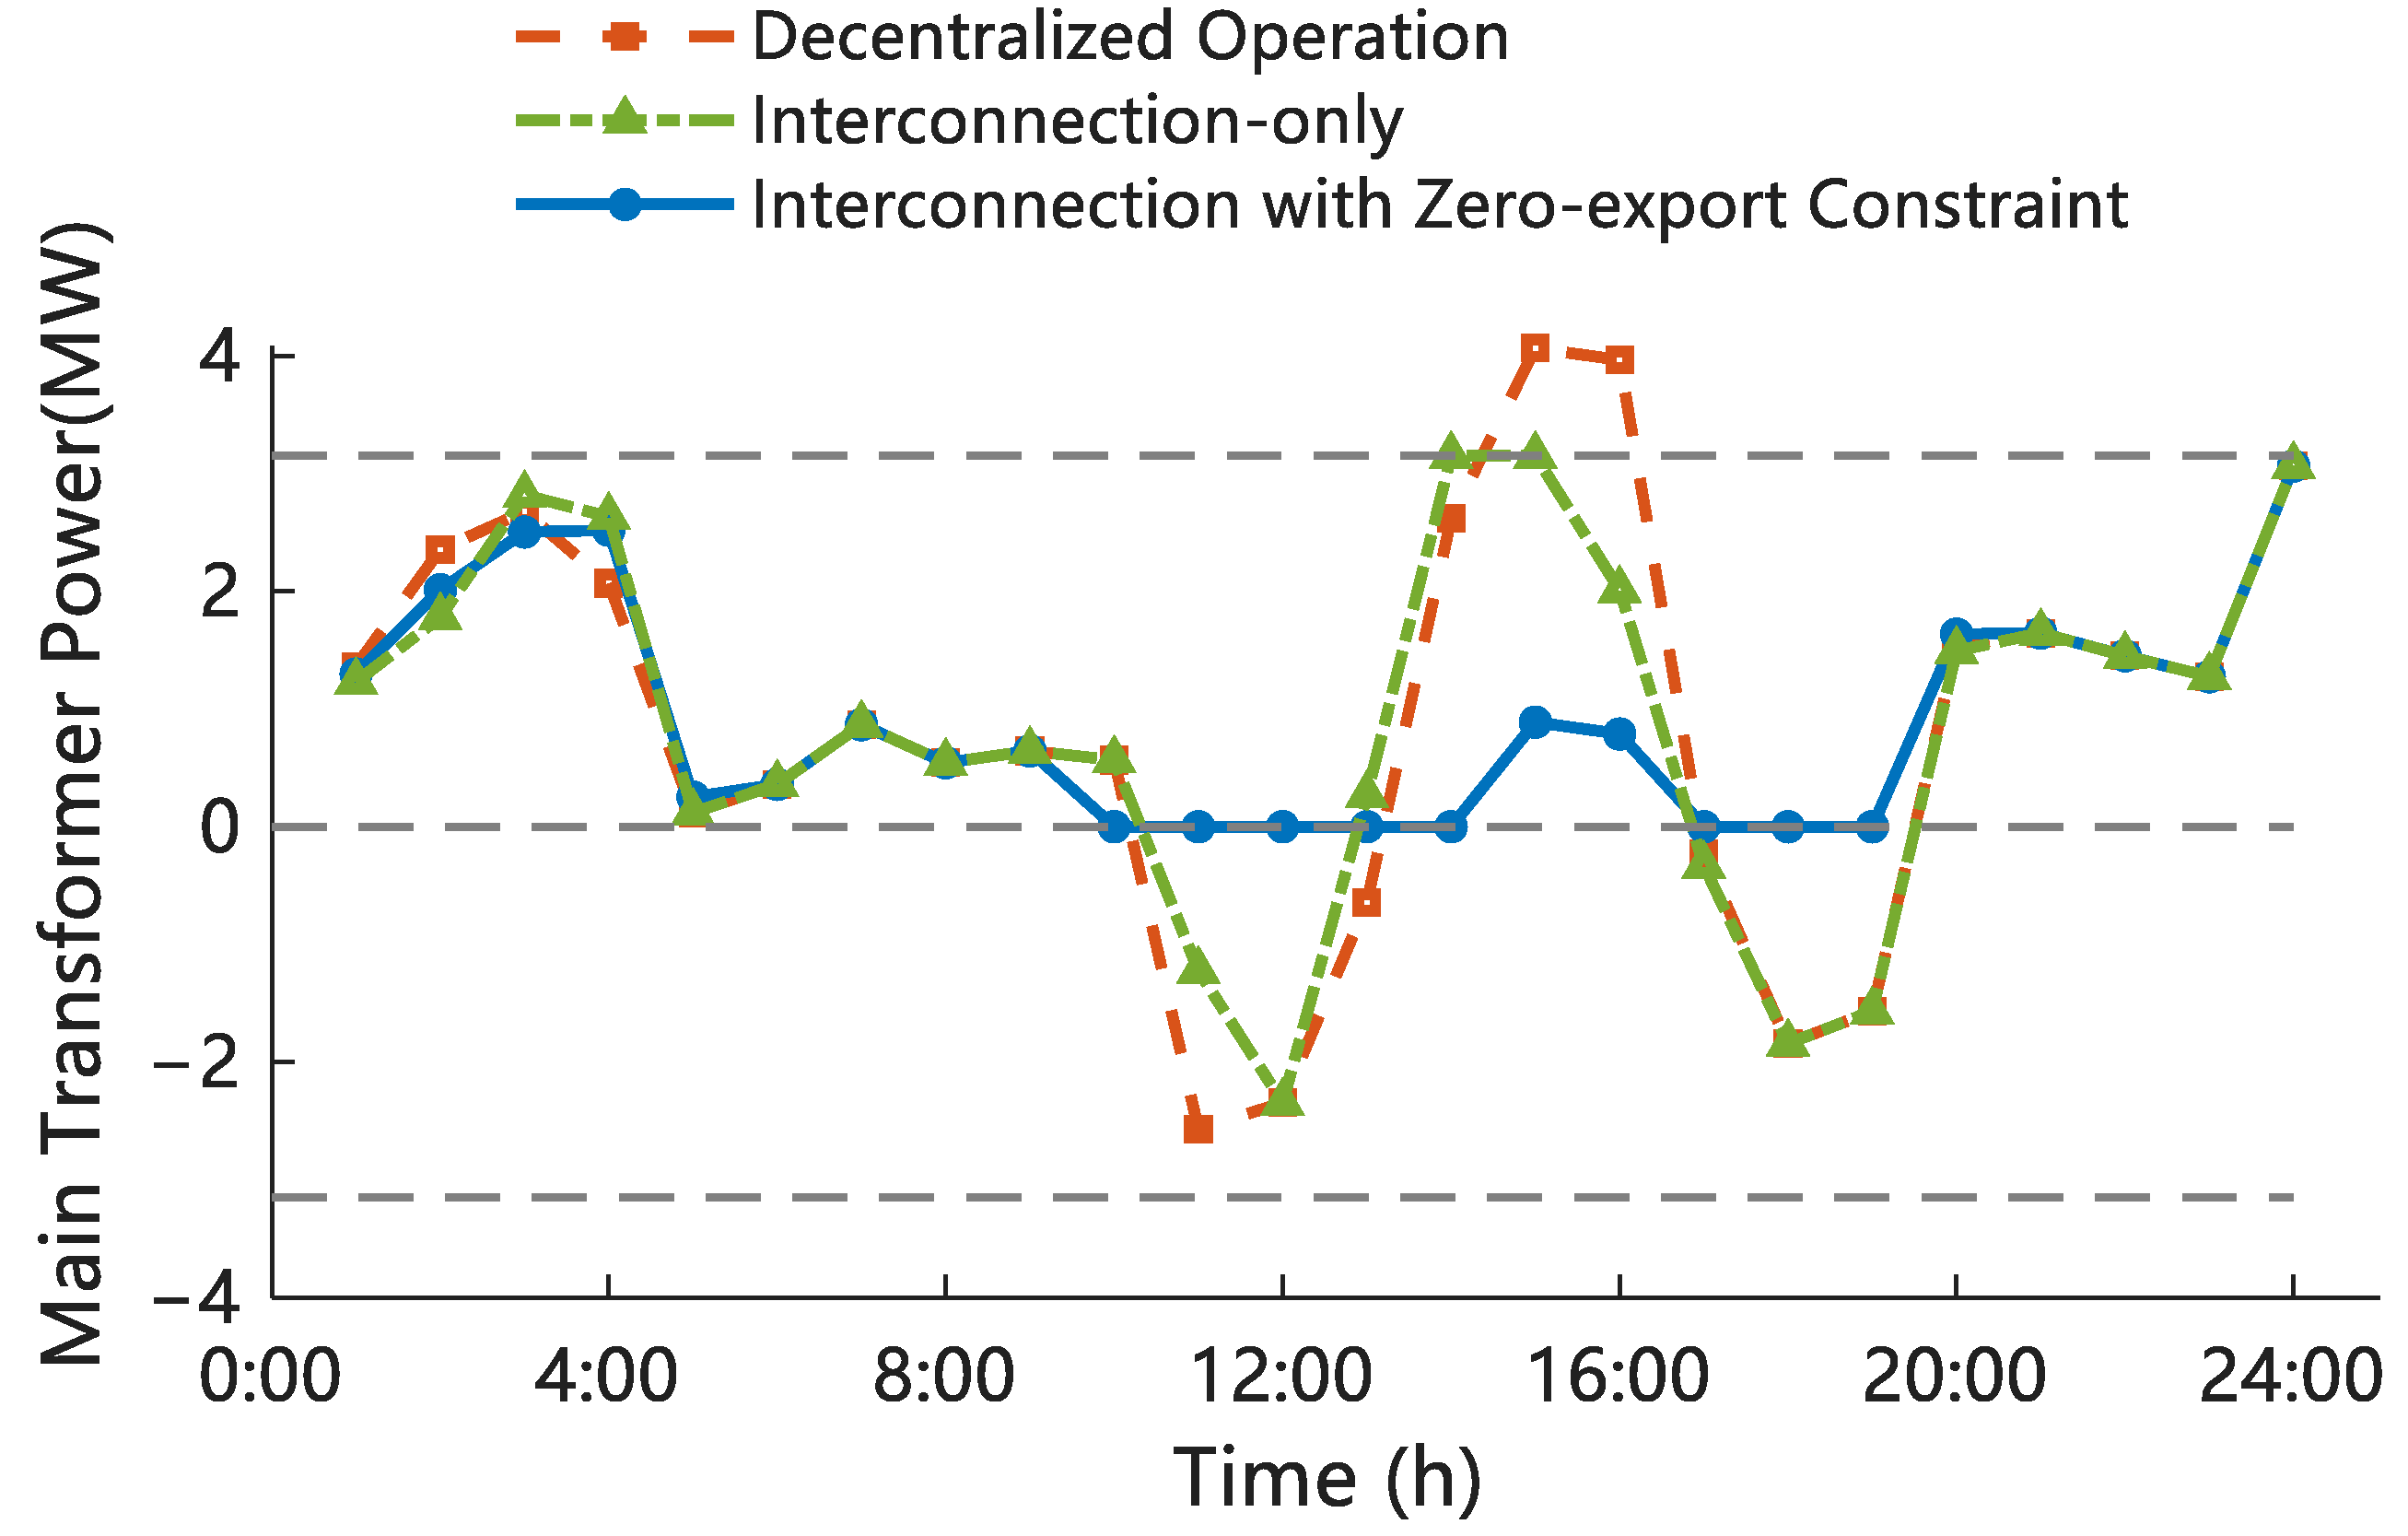
Figure 9 presents the comparison of 24 h power variation curves of the main transformer under the three scenarios:
By comparing the 24 h main transformer power curves under the three scenarios, it can be found that S3 exhibits a remarkably reduced fluctuation range and superior regulation performance for main transformer operation without over-limit risks, compared with S1 and S2. In addition, the peak-to-valley difference in the main transformer power during peak load periods in S3 decreases by 71.8% relative to S2, leading to more stable power variation.

4.4. Analysis of System Converged Operation Characteristics Under TSDTO Mode

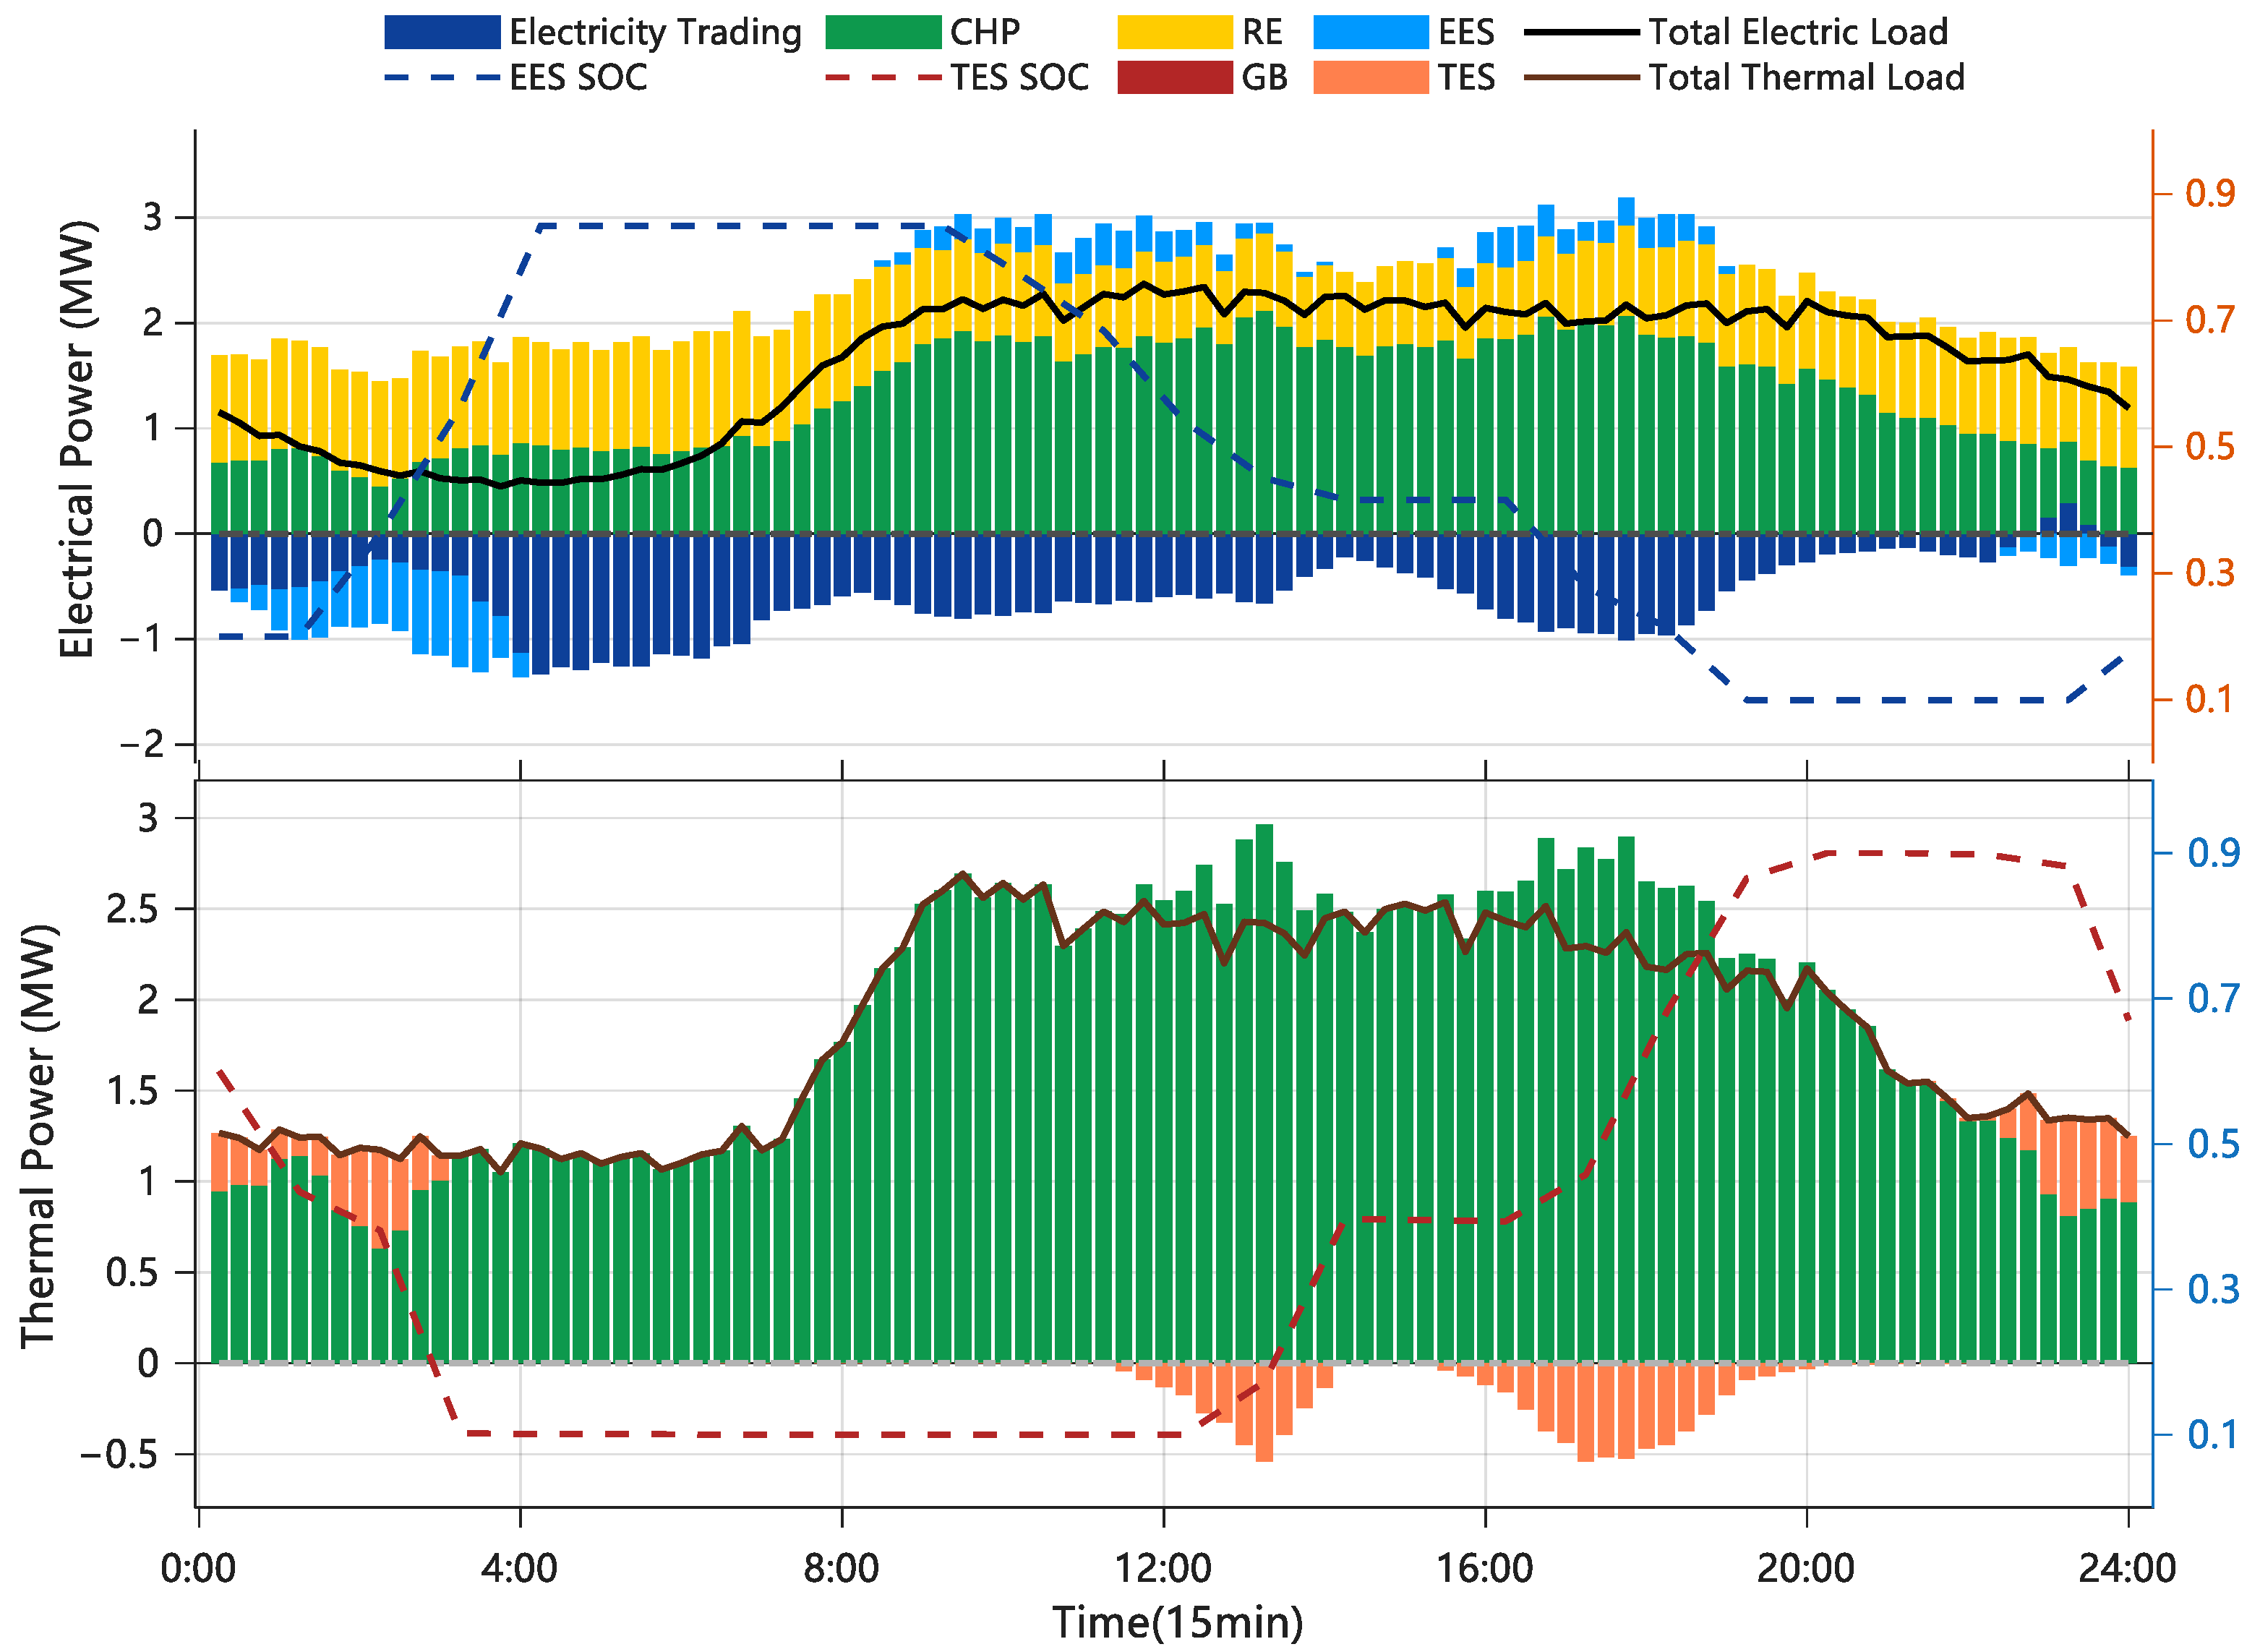
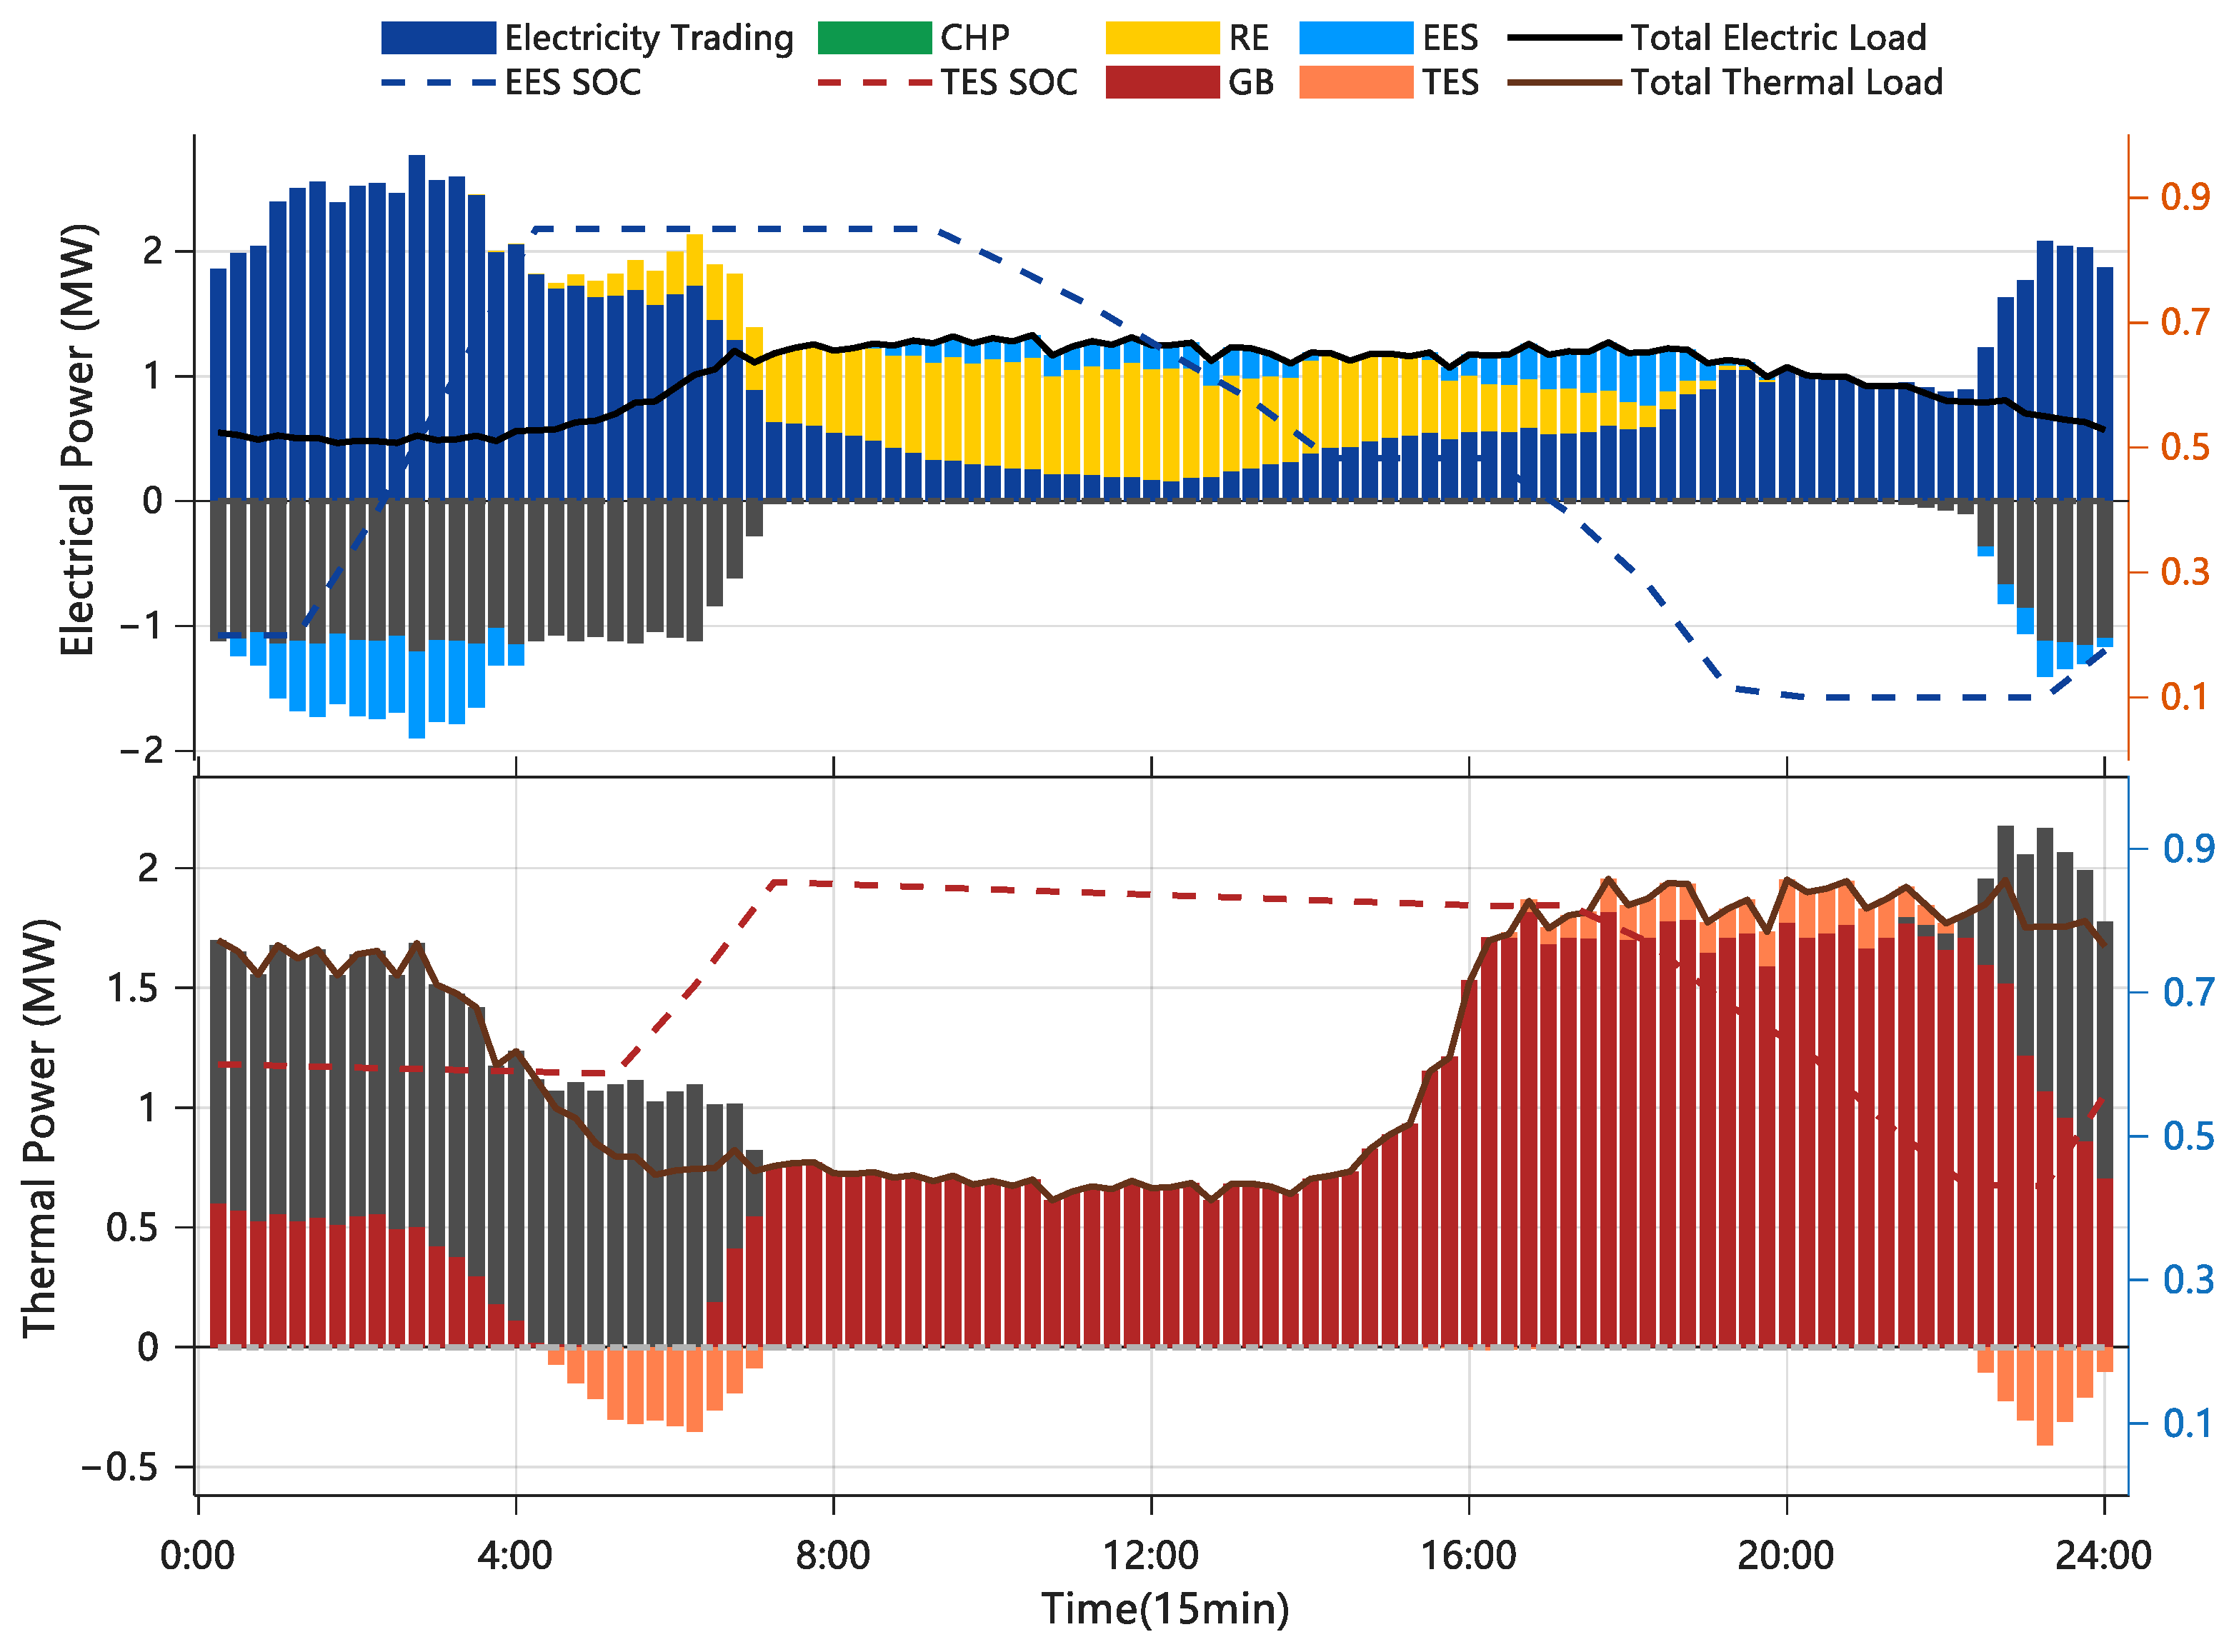
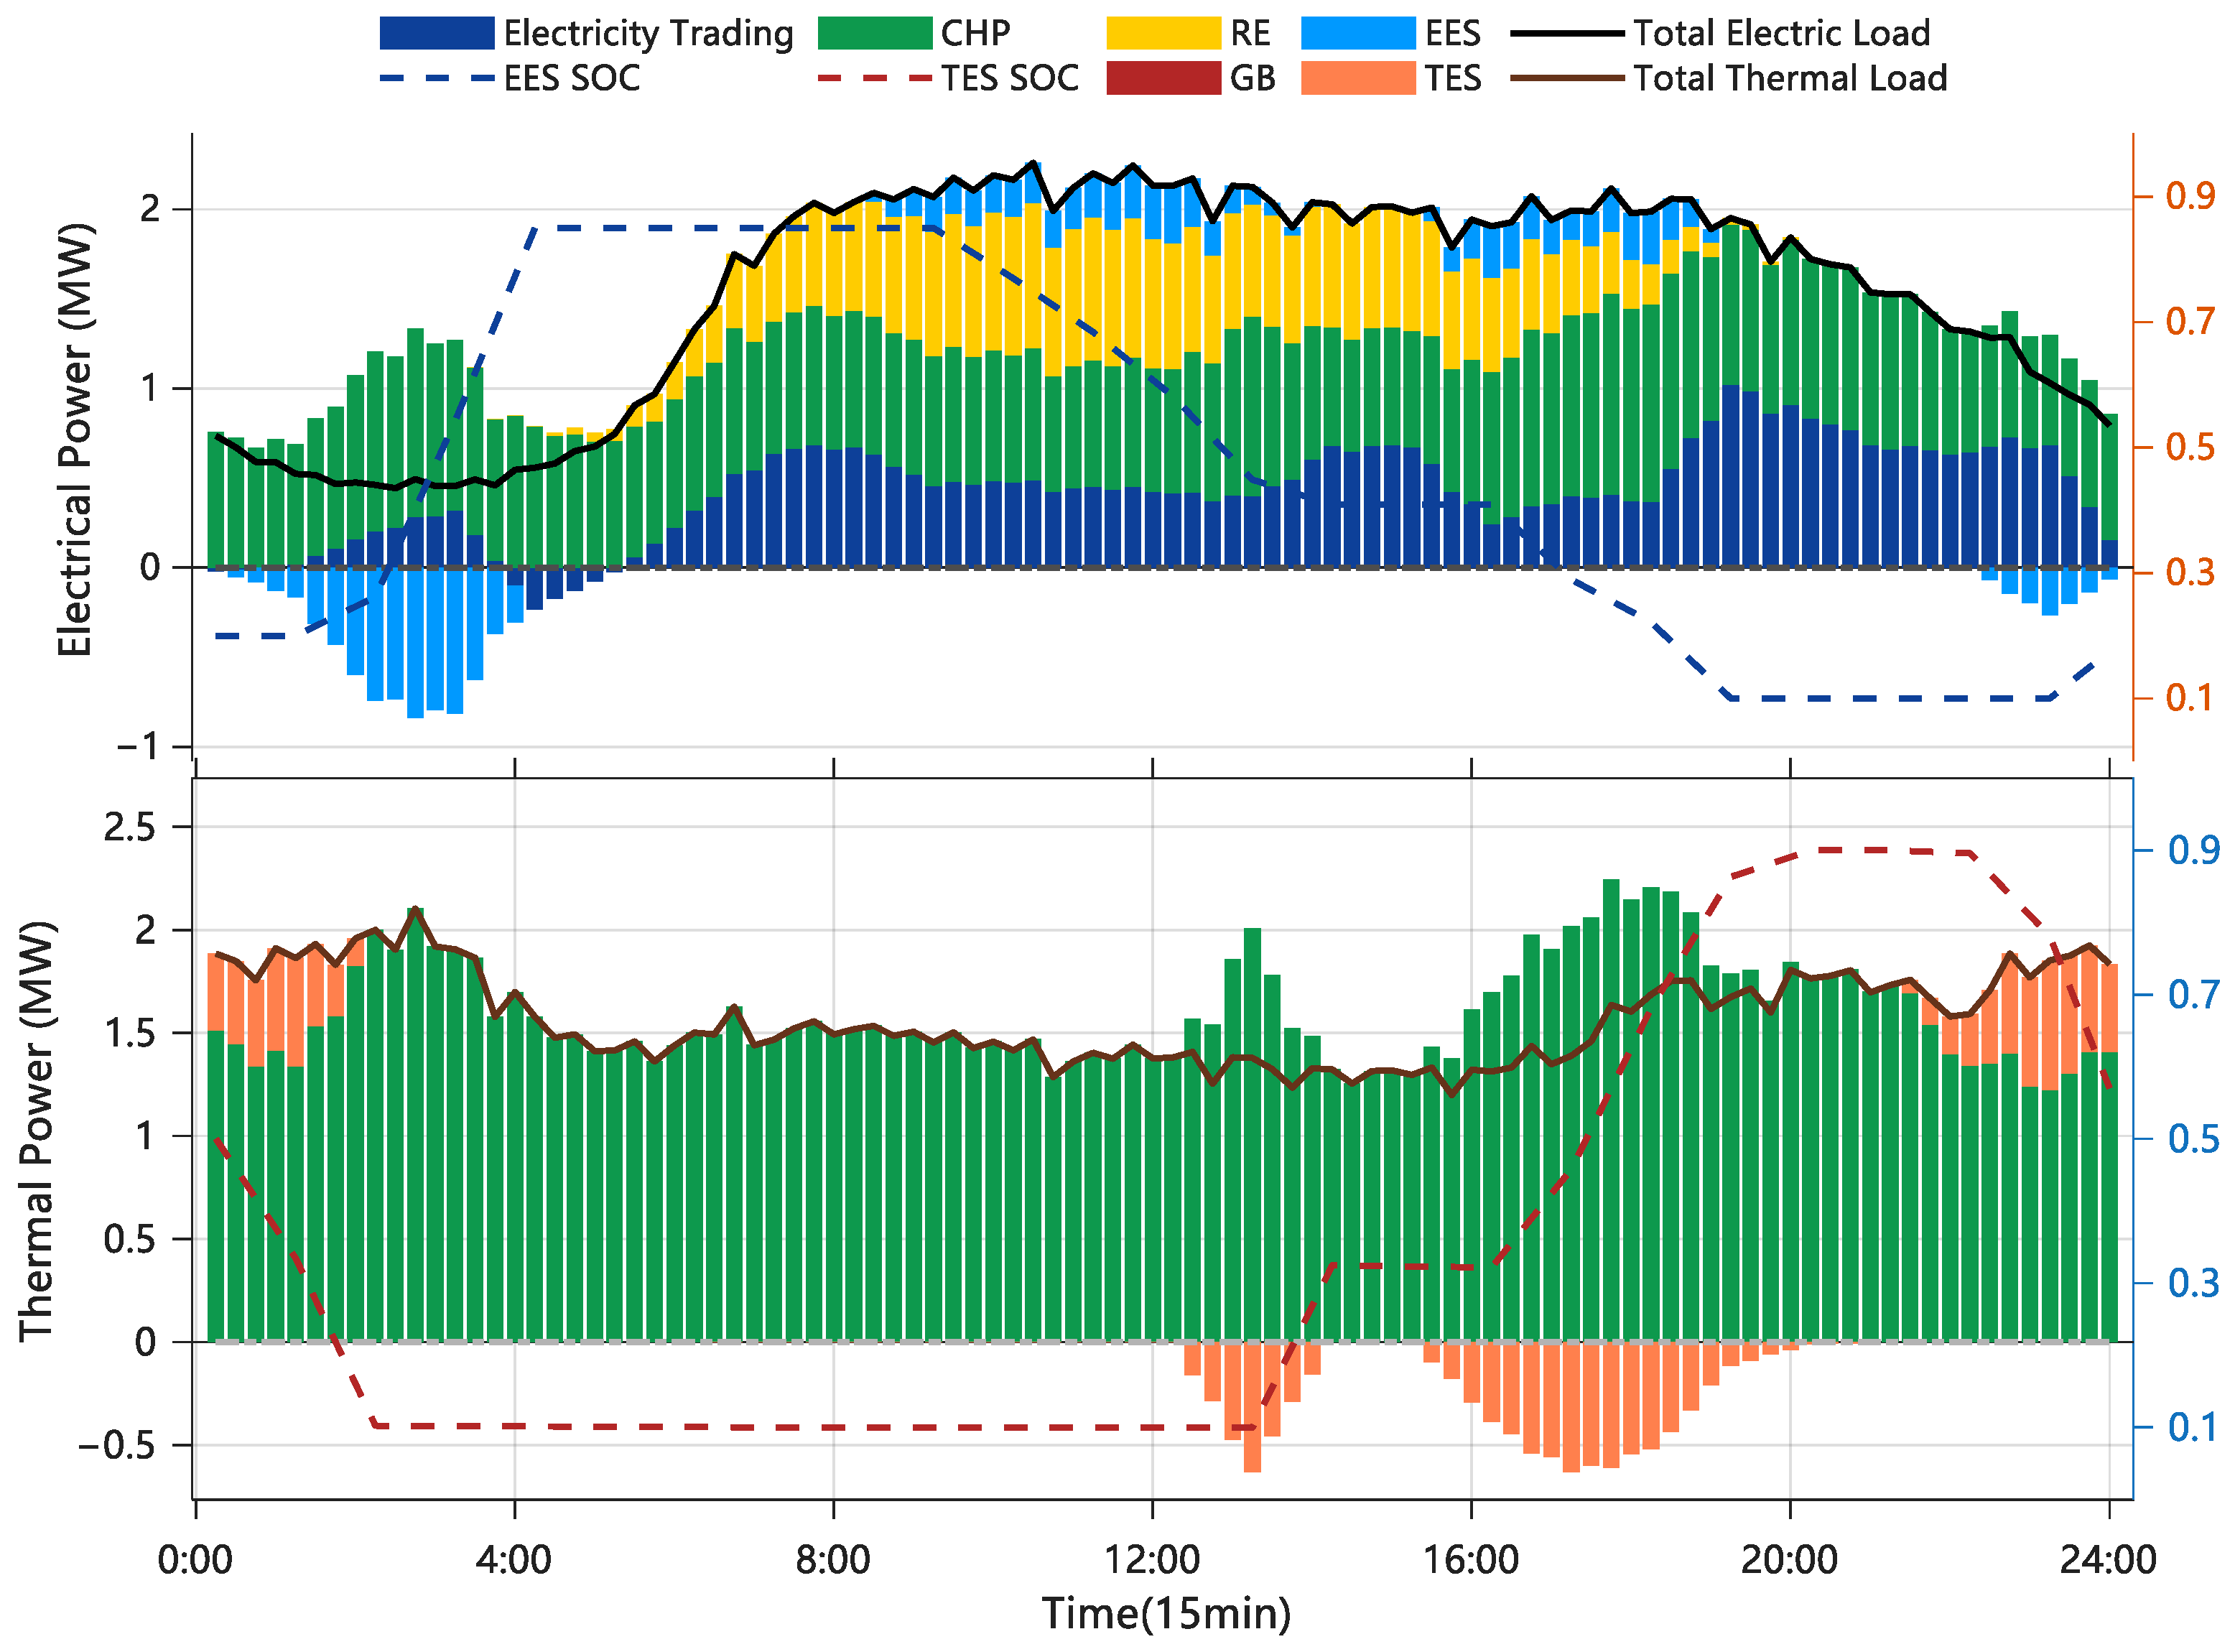
This section analyzes the operation characteristics of each RIES under the TSDTO framework. The 24 h electrical power, thermal power scheduling results, and battery State of Charge (SOC) profiles for energy storage systems of the three types of RIES are shown in Figure 10, Figure 11 and Figure 12, respectively. Among them, a positive power indicates that the equipment supplies energy to the outside, and a negative power indicates energy consumption behaviors including energy storage charging and Electric Boiler power consumption; SOC is specified as the proportion of the stored energy in the unit to its rated capacity.

4.4.1. Complementary Characteristics of Surplus-Deficit Among Regions

Both RIES1 and RIES3 are equipped with CHP units, and their electrical and thermal power outputs exhibit strong coupling with variations in the thermal load, presenting a significant “heat-led electricity” operation characteristic. RIES1 maintains low CHP electrical and thermal outputs overnight and in the early morning, when thermal demand is low; during the daytime and evening when the thermal load rises, the CHP heat supply output increases synchronously with the heat demand, and the electrical output also passively increases with the fixed heat–electricity ratio. RIES3 has a high thermal load throughout the day, but the electrical load is low at night, resulting in power surplus.
Affected by the thermoelectric coupling constraint, CHP units tend to generate excess electricity when meeting thermal demand requirements. During the midday hours of RIES1 and the evening hours of RIES3, the local electrical load cannot fully consume the total power supply, resulting in obvious power surplus in the two regions in the corresponding periods, and the interconnection power is manifested as outward transmission, providing conditions for inter-regional power mutual aid.
In contrast, RIES2 is not equipped with CHP, and its thermal load is mainly supplied by the combined operation of Electric Boilers and gas boilers. The operation of Electric Boilers will directly increase power consumption, resulting in RIES2 presenting a power deficit in most periods and needing to purchase electricity from other regions through interconnection. Under the TSDTO converged scheduling, a stable surplus–deficit complementary pattern is formed among multiple regions, creating a foundation for global collaborative optimization.

4.4.2. Guidance of Time-of-Use Electricity Price on Charging/Discharging and Power Purchase Behaviors

From the full-time power variation, it can be seen that the operational scheduling of each region is clearly guided by the time-of-use electricity price signal.
During the low electricity price period (0:00–6:00), the overall electrical load is at a low level, and the system preferentially purchases low-price electricity from surplus regions; the Electric Boiler (EB) output is significant, converting low-price electricity into thermal energy to meet the basic thermal load; the Electrical Energy Storage (EES) is in a charging state, and the SOC continues to rise, realizing low-price electricity storage.
During the peak electricity price period (10:00–20:00), the electrical and thermal loads increase concurrently, the system reduces external electricity purchase and instead relies on CHP to generate electricity based on heat demand; the Gas Furnace (GF) assists in heat supplementation at the peak of thermal load; the Electrical Energy Storage switches from charging to discharging to support local load and smooth the peak-valley difference, realizing electricity price arbitrage.
This time-sharing scheduling mode significantly reduces the overall energy consumption cost of the system and avoids power flow congestion caused by high-power electricity purchase during peak periods.

4.4.3. Coordinated Scheduling Characteristics of Electrical-Thermal Energy Storage

From the energy storage power and SOC curves, the typical scheduling rules of EES and TES can be clearly observed, and they present differentiated characteristics in different regions.
The Electrical Energy Storage (EES) shows consistent operation logic in all three regions. Low-valley charging: absorbs electric energy when the load and electricity price are both low at night, and the SOC rises; peak discharging: releases electric energy during the daytime load peak, and the SOC falls. The temporal transfer capability of energy storage effectively smooths the regional net load profile and enhances the system’s operational flexibility.
The Thermal Energy Storage (TES) presents a typical operation characteristic of low-valley heat storage during the day and peak heat release at night in RIES2 and RIES3; while in RIES1, affected by the characteristics of long duration of high thermal load and high overlap with the electrical load peak, TES shows an atypical scheduling trend of off-peak heat storage at noon and concentrated heat release in the evening. During the midday load rise period of RIES1, the surplus thermal energy generated by CHP under the “heat-led electricity” constraint is stored by TES, and the SOC rises accordingly; during the 14:00–16:00 and evening periods when the thermal load remains high, TES releases heat to compensate for the insufficient CHP heat supply, which not only reduces the input of gas boilers during peak periods but also effectively alleviates the operation rigidity constraint brought by CHP “heat-led electricity”.

4.4.4. Overall Optimization Effect Brought by Multi-Region Interconnection and Mutual Aid

Comparing the interconnection power (dark blue) of the three figures can intuitively reflect the advantages of multi-region collaboration: RIES1 and RIES3 transmit power outward during periods of high RES output or CHP surplus; RIES2 purchases electricity from the outside during periods of high Electric Boiler power consumption and load peak; the surplus and deficit of each region are staggered in time to achieve global power balance.
Compared with single-region decentralized operation, after multi-region interconnection: local surplus power is effectively consumed without wind and photovoltaic curtailment; the power deficit during peak periods is alleviated through inter-regional scheduling without forced power generation by local units; the main transformer load is more stable, effectively reducing the overload risk; the collaboration of energy storage, CHP, RES, EB, etc., is more sufficient, and the comprehensive energy utilization efficiency is higher.

4.4.5. Comparison of Economy and Operation Performance Under Different Operation Modes

To verify the comprehensive optimization benefits of the proposed method, the operating cost of each region, total operating cost, and renewable energy accommodation rate of the DO mode, 2S-TC mode, and TSDTO mode are compared. The unit of operating cost in the table is 104 yuan, and the renewable energy accommodation rate is a normalized value. The comparison results of the three schemes are as follows:
It can be concluded from Table 2 that Scenario S1 has the highest total cost with a new energy consumption rate of only 0.837, resulting in notable renewable energy curtailment. In Scenario S2, inter-regional interconnection and power interaction slightly raise the consumption rate and reduce the system operating cost. On the basis of inter-regional energy exchange, Scheme S3 introduces the zero power delivery constraint, realizing full consumption of new energy. Its total system cost is lower than that of S1 and S2, demonstrating superior overall economic performance. As the complete TSDTO model proposed in this paper, Scenario S4 also achieves full new energy consumption. Its total system cost is reduced by 22,034 yuan, 19,816 yuan and 1546 yuan compared with the other three scenarios respectively, ranking the lowest in total cost and presenting superior economic performance.

4.5. Solution Performance Analysis

To verify the computational efficiency of the proposed TSDTO method in low-computing and real-time scheduling scenarios of county-level distribution networks, its iterative convergence characteristics are counted. The results show that the average number of iterations for a single optimization of TSDTO is 6.3, the maximum number of iterations is 8, and the single-step solution time is 92 ms, meeting the real-time requirements of intraday rolling scheduling (<100 ms) [44,45]. For reference, the traditional subgradient method usually requires dozens to hundreds of iterations for similar problems, and the efficiency of the proposed method is significantly improved [26,41].
The developed approach constitutes an enhanced distributed optimization method formed by further integrating zero-export constraint on the basis of the two-stage transactional control framework, aiming at the actual operation scenarios of low computing power and difficult grid connection in county-level distribution networks. This does not destroy the fast solution structure of “day-ahead pre-clearing + intraday one-dimensional search” of the original framework. A single optimization only needs several iterations to converge, with small computational overhead and strong real-time performance, which can effectively meet the fast response requirements of intraday rolling scheduling of county-level integrated energy systems.
The convergence of the proposed TSDTO mechanism is guaranteed by the dichotomous price search. At each time period, the local electricity price is updated within the interval [ 0.8 λ ^ e , t c , 1.2 λ ^ e , t c ] using the dichotomous method, and the absolute power imbalance | Δ P t c ( p ) | decreases monotonically with the number of iterations. In all test scenarios, the convergence criterion | Δ P t c ( p ) | < ζ is satisfied within 8 iterations, with an average of 6.3 iterations. These results verify that the proposed method has fast and reliable convergence performance.
In summary, the proposed method effectively improves system power stability and local renewable energy consumption while retaining high solution efficiency, and presents outstanding engineering potential and promotion value.
It is worth clarifying that this study mainly focuses on the framework design of the two-layer distributed collaborative optimization and the performance verification of the proposed convex relaxation strategy. To highlight the core mechanism and reduce analytical complexity, appropriate simplifications are made in the modeling process. The model adopts structural assumptions including zero export to the main grid, negligible tie-line loss, ideal power balance without considering infeasible scenarios, and constant energy storage efficiency regardless of degradation characteristics. Meanwhile, network loss and source–load stochastic uncertainty are not fully taken into account. Such simplified assumptions are reasonable for analyzing the inherent characteristics of the proposed method under typical deterministic county-level scenarios. In terms of privacy protection, this paper concentrates on distributed architecture design and operational performance verification, while rigorous quantitative privacy deduction and information leakage risk analysis can be left for dedicated research in the future.

4.6. Sensitivity Analysis

To further validate the robustness of the proposed method, simple sensitivity tests are conducted by adjusting key parameters, including renewable forecast error, load uncertainty, and energy storage capacity. The results are summarized in Table 3.
The results show that the proposed method performs stably under minor parameter variations.

5. Conclusions

The two-stage distributed transactional optimization strategy proposed in this paper integrates three core technologies, namely the two-layer distributed framework, zero-export constraint and multi-time-scale rolling scheduling, which can effectively address the operational challenges of interconnected integrated energy systems in county-level distribution networks. Simulation results verify that:
The distributed two-layer framework realizes global system decoupling by exchanging only two types of non-sensitive data, namely electricity prices and regional net power. This framework can guarantee the operational autonomy and data privacy of all operating entities, and does not require high-performance computing power. This method demonstrates favorable engineering potential when applied to county-level distribution networks characterized by multi-agent autonomous operation and limited grassroots computing resources. Guided by electricity price signals, it facilitates energy interaction among regions and ensures the stable and coordinated operation of the whole system.
With the introduction of the zero-export constraint, surplus electric energy in each region is prioritized for consumption within the interconnected system, and reverse power transmission to the main grid is largely avoided. Simulation results show that this constraint can effectively reduce renewable energy curtailment and basically realize the full consumption of clean energy under all tested scenarios. It also eases the bidirectional fluctuation of main transformer power and keeps the power within the safe limit, thereby alleviating power flow congestion and equipment overload in the power grid. Comparative analysis of different schemes shows that the total operating cost of the system is reduced by 22,034 yuan compared with the isolated operation mode, leading to improved overall economic benefits.
This paper adopts a scheduling strategy combining day-ahead pre-clearing based on the subgradient method and intraday rolling optimization. The day-ahead phase generates reference electricity prices, while the intraday phase takes 15 min as the scheduling step and 1 h as the rolling time horizon. The bisection method is adopted to convert the complex multi-variable optimization into single-variable electricity price searching. This approach reduces algorithm iterations and communication overhead. Simulation results indicate that it averages 6.3 iterations, with a single-step solution time of 92 milliseconds. It delivers remarkably better computational efficiency and convergence performance than traditional methods, satisfies the requirements of intraday real-time scheduling, and balances long-term global planning and short-term dynamic adjustment.
All performance conclusions in this paper are only valid under the deterministic simulation scenario of three interconnected integrated energy systems in a northern county; rigorous mathematical convergence proof, quantitative privacy leakage analysis and source–load disturbance robustness tests are not included in this work, and hardware real-time delay measurement is not carried out.
Future work will focus on the following directions: robust collaborative optimization considering source–load uncertainty, where distributionally robust optimization and other advanced methods will be adopted to address the stochastic fluctuations of photovoltaic, wind power, and flexible loads, thereby further improving the stability and adaptability of the proposed method in practical operation; and exploring the coordinated operation of multi-type energy storage (e.g., electricity–hydrogen, electricity–heat–cold integrated energy supply) to extend the applicability of the proposed method to more complex county-level multi-energy complementary scenarios.

Author Contributions

Conceptualization, R.F. and Z.Y.; methodology, Z.Y.; software, Z.Y.; validation, Z.Y.; formal analysis, Z.Y.; investigation, Z.Y.; resources, R.F.; data curation, Z.Y.; writing—original draft preparation, Z.Y.; writing—review and editing, R.F. and Z.Y.; visualization, Z.Y.; supervision, R.F.; project administration, R.F.; funding acquisition, R.F. All authors have read and agreed to the published version of the manuscript.

Funding

This research received no external funding.

Institutional Review Board Statement

Not applicable.

Informed Consent Statement

Not applicable.

Data Availability Statement

Data will be available upon reasonable request from the corresponding author.

Conflicts of Interest

The authors declare no conflicts of interest.

References

  1. Hoang, A.T.; Pham, V.V.; Nguyen, X.P. Integrating Renewable Sources into Energy System for Smart City As a Sagacious Strategy Towards Clean and Sustainable Process. J. Clean. Prod. 2021, 305, 127161. [Google Scholar] [CrossRef]
  2. Zhang, J.; Hu, Z. Optimization Study of County Multi-Level Power Grid Co-Dispatch Based on Hybrid Game Considering Multivariate Source-Load Interaction. Expert Syst. Appl. 2025, 275, 126981. [Google Scholar]
  3. Yan, R.; Wang, J.; Zhu, S.; Liu, Y.; Cheng, Y.; Ma, Z. Novel Planning Methodology for Energy Stations and Networks in Regional Integrated Energy Systems. Energy Convers. Manag. 2020, 205, 112441. [Google Scholar] [CrossRef]
  4. Guo, Z.; Zhang, R.; Wang, L.; Zeng, S.; Li, Y. Optimal Operation of Regional Integrated Energy System Considering Demand Response. Appl. Therm. Eng. 2021, 191, 116860. [Google Scholar] [CrossRef]
  5. Ma, L.; Xiao, T.; Lu, S.; Yu, L.; Shen, X.; Li, J.; Xu, D.; Li, H. Distributionally Robust Optimization-Based Day-Ahead Optimal Scheduling of County-Level Distribution Network Considering Strong Uncertainty of High-Proportional Photovoltaic Output. In Proceedings of the 2024 3rd International Conference on Energy and Electrical Power Systems (ICEEPS), Guangzhou, China, 14–16 July 2024. [Google Scholar]
  6. Fu, X.; Zhou, Y. Collaborative Optimization of PV Greenhouses and Clean Energy Systems in Rural Areas. IEEE Trans. Sustain. Energy 2023, 14, 642–656. [Google Scholar]
  7. Jiang, T.; Zhang, R.; Li, X.; Chen, H.; Li, G. Integrated Energy System Security Region: Concepts, Methods, and Implementations. Appl. Energy 2021, 283, 116124. [Google Scholar] [CrossRef]
  8. Xu, B.; Guo, F.; Zhang, W.-A.; Wang, W.; Wen, C.; Li, Z. Distributed Successive Convex Approximation for Nonconvex Economic Dispatch in Smart Grid. IEEE Trans. Ind. Inform. 2021, 17, 8288–8298. [Google Scholar] [CrossRef]
  9. Li, X.; Wu, N. A Two-Stage Distributed Robust Optimal Control Strategy for Energy Collaboration in Multi-Regional Integrated Energy Systems Based on Cooperative Game. Energy 2024, 305, 132221. [Google Scholar]
  10. Lei, L.; Wu, N. An Optimal Scheduling Strategy for Electricity-Thermal Synergy and Complementarity among Multi-Microgrid Based on Cooperative Games. Renew. Energy 2024, 237, 121575. [Google Scholar]
  11. Yuan, G.; Gao, Y.; Ye, B. Optimal Dispatching Strategy and Real-Time Pricing for Multi-Regional Integrated Energy Systems Based on Demand Response. Renew. Energy 2021, 179, 1424–1446. [Google Scholar]
  12. Han, F.; Zeng, J.; Lin, J.; Zhao, Y.; Gao, C. A Stochastic Hierarchical Optimization and Revenue Allocation Approach for Multi-Regional Integrated Energy Systems Based on Cooperative Games. Appl. Energy 2023, 350, 121701. [Google Scholar] [CrossRef]
  13. Zhang, Z.; Jiang, P.; Liu, Z.; Fu, L.; Wang, P. Capacity Optimal Configuration and Collaborative Planning of Multi-Region Integrated Energy System. Energy 2023, 278, 127970. [Google Scholar] [CrossRef]
  14. Hu, Y.; Liu, W.; Wang, W. A Two-Layer Volt-Var Control Method in Rural Distribution Networks Considering Utilization of Photovoltaic Power. IEEE Access 2020, 8, 118417–118425. [Google Scholar]
  15. Narimani, A.; Nourbakhsh, G.; Arefi, A.; Ledwich, G.F.; Walker, G.R. SAIDI Constrained Economic Planning and Utilization of Central Storage in Rural Distribution Networks. IEEE Syst. J. 2019, 13, 842–853. [Google Scholar]
  16. Soares, I.; Alves, M.J.; Antunes, C.H. A Deterministic Bounding Algorithm Vs. a Hybrid Meta-Heuristic to Deal with a Bilevel Mixed-Integer Nonlinear Optimization Model for Electricity Dynamic Pricing. Comput. Oper. Res. 2023, 155, 106195. [Google Scholar]
  17. Vai, V.; Alvarez-Herault, M.-C.; Raison, B.; Bun, L. Optimal Low-Voltage Distribution Topology with Integration of PV and Storage for Rural Electrification in Developing Countries: A Case Study of Cambodia. J. Mod. Power Syst. Clean. Energy 2020, 8, 531–539. [Google Scholar] [CrossRef]
  18. Chen, J.; Zhang, Y. A Lagrange Relaxation-Based Alternating Iterative Algorithm for Non-Convex Combined Heat and Power Dispatch Problem. Electr. Power Syst. Res. 2019, 177, 105982. [Google Scholar]
  19. Wu, Y.; Wang, C.; Wang, Y. Cooperative Game Optimization Scheduling of Multi-Region Integrated Energy System Based on Admm Algorithm. Energy 2024, 302, 131728. [Google Scholar] [CrossRef]
  20. Du, Y.; Zhang, W.; Zhang, T. ADMM Based Distributed State Estimation for Integrated Energy System. CSEE J. Power Energy Syst. 2019, 5, 275–283. [Google Scholar] [CrossRef]
  21. Cheng, L.; Zhang, S.; Wang, Y. Distributed Optimal Capacity Allocation of Integrated Energy System Via Modified ADMM. Appl. Math. Comput. 2024, 465, 128369. [Google Scholar]
  22. Fu, Y.; Sun, Q.; Wennersten, R.; Pang, X.; Liu, W. Interactive Scheduling Optimization of Regional Multi-Agent Integrated Energy Systems Considering Uncertainties Based on Game Theory. J. Clean. Prod. 2024, 449, 141697. [Google Scholar] [CrossRef]
  23. Lin, J.; Gao, C.; Zeng, J.; Han, F. Stackelberg-Nash Asymmetric Bargaining-Based Scheduling Optimization and Revenue-Allocation for Multi-Operator Regional Integrated Energy System Considering Competition-Cooperation Relationship and Source-Load Uncertainties. Energy 2024, 291, 130262. [Google Scholar]
  24. Zhu, X.; Ma, L.; Shen, Z.; Shen, X.; Lu, D.; Guo, J.; Lin, Z. Optimization Scheduling Method for County-Level Distribution Network Considering Multi-Function Reuse of Mobile Energy Storage System. In Proceedings of the 2024 21st International Conference on Harmonics and Quality of Power (ICHQP), Chengdu, China, 15–18 October 2024. [Google Scholar]
  25. Deng, L.; Sun, Y.; Fu, Y. Market-Driven Joint Trading Strategy for Computing Service and Electricity in Cloud-Edge Collaborative Systems. IEEE Trans. Smart Grid 2026, 1. [Google Scholar] [CrossRef]
  26. Cheng, Y.; Zhang, P.; Liu, X. Collaborative Autonomous Optimization of Interconnected Multi-Energy Systems with Two-Stage Transactive Control Framework. Energies 2020, 13, 171. [Google Scholar]
  27. Ding, T.; Jia, W.; Shahidehpour, M.; Han, O.; Sun, Y.; Zhang, Z. Review of Optimization Methods for Energy Hub Planning, Operation, Trading, and Control. IEEE Trans. Sustain. Energy 2022, 13, 1802–1818. [Google Scholar] [CrossRef]
  28. Wang, S.; Wang, S.; Chen, H.; Gu, Q. Multi-Energy Load Forecasting for Regional Integrated Energy Systems Considering Temporal Dynamic and Coupling Characteristics. Energy 2020, 195, 116964. [Google Scholar] [CrossRef]
  29. Li, Q.; Xiao, X.; Pu, Y.; Luo, S.; Liu, H.; Chen, W. Hierarchical Optimal Scheduling Method for Regional Integrated Energy Systems Considering Electricity-Hydrogen Shared Energy. Appl. Energy 2023, 349, 121670. [Google Scholar] [CrossRef]
  30. Chen, F.; Deng, H.; Chen, Y.; Wang, J.; Jiang, C.; Shao, Z. Distributed Robust Cooperative Scheduling of Multi-Region Integrated Energy System Considering Dynamic Characteristics of Networks. Int. J. Electr. Power Energy Syst. 2023, 145, 108605. [Google Scholar]
  31. Chen, C.; Li, Y.; Qiu, W.; Liu, C.; Zhang, Q.; Li, Z.; Lin, Z.; Yang, L. Cooperative-Game-Based Day-Ahead Scheduling of Local Integrated Energy Systems with Shared Energy Storage. IEEE Trans. Sustain. Energy 2022, 13, 1994–2011. [Google Scholar]
  32. Shi, M.; Wang, H.; Xie, P.; Lyu, C.; Jian, L.; Jia, Y. Distributed Energy Scheduling for Integrated Energy System Clusters with Peer-to-Peer Energy Transaction. IEEE Trans. Smart Grid 2023, 14, 142–156. [Google Scholar]
  33. Liu, J.; Chen, X.; Yang, H.; Shan, K. Hybrid Renewable Energy Applications in Zero-Energy Buildings and Communities Integrating Battery and Hydrogen Vehicle Storage. Appl. Energy 2021, 290, 116733. [Google Scholar] [CrossRef]
  34. Mottaghizadeh, P.; Jabbari, F.; Brouwer, J. Integrated Solid Oxide Fuel Cell, Solar PV, and Battery Storage System to Achieve Zero Net Energy Residential Nanogrid in California. Appl. Energy 2022, 323, 119577. [Google Scholar] [CrossRef]
  35. Huang, Y.; Meng, Z.; Sun, J. Scalable Distributed Least Square Algorithms for Large-Scale Linear Equations Via an Optimization Approach. Automatica 2022, 146, 110572. [Google Scholar] [CrossRef]
  36. Jiao, W.; Chen, J.; Wu, Q.; Li, C.; Zhou, B.; Huang, S. Distributed Coordinated Voltage Control for Distribution Networks with DG and OLTC Based on MPC and Gradient Projection. IEEE Trans. Power Syst. 2022, 37, 680–690. [Google Scholar]
  37. Boyd, S.P.; Parikh, N.; Chu, E.; Peleato, B.; Eckstein, J. Distributed Optimization and Statistical Learning Via the Alternating Direction Method of Multipliers. Found. Trends Mach. Learn. 2010, 3, 1–122. [Google Scholar]
  38. Li, X.; Wu, Z.; Yang, L.; Sun, M.; Zhao, X. A Convex-Relaxation Based Method for Optimal Water-Power Flow. Energy Rep. 2022, 8, 973–983. [Google Scholar]
  39. Notarnicola, I.; Notarstefano, G. Constraint-Coupled Distributed Optimization: A Relaxation and Duality Approach. IEEE Trans. Control Netw. Syst. 2020, 7, 483–492. [Google Scholar]
  40. Doan, T.T.; Maguluri, S.T.; Romberg, J. Fast Convergence Rates of Distributed Subgradient Methods with Adaptive Quantization. IEEE Trans. Autom. Control 2021, 66, 2191–2205. [Google Scholar]
  41. Nedic, A.; Ozdaglar, A. Distributed Subgradient Methods for Multi-Agent Optimization. IEEE Trans. Autom. Control 2009, 54, 48–61. [Google Scholar] [CrossRef]
  42. Hayashi, N. Distributed Subgradient Method in Open Multiagent Systems. IEEE Trans. Autom. Control 2023, 68, 6192–6199. [Google Scholar]
  43. State Grid Shandong Electric Power Company. January 2025 Electricity Market Information Bulletin; State Grid Shandong Electric Power Company: Jinan, China, 2025. [Google Scholar]
  44. Wang, L.; Lin, J.; Dong, H.; Wang, Y.; Zeng, M. Demand Response Comprehensive Incentive Mechanism-Based Multi-Time Scale Optimization Scheduling for Park Integrated Energy System. Energy 2023, 270, 126893. [Google Scholar]
  45. Pan, C.; Fan, H.; Zhang, R.; Sun, J.; Wang, Y.; Sun, Y. An Improved Multi-Timescale Coordinated Control Strategy for an Integrated Energy System with a Hybrid Energy Storage System. Appl. Energy 2023, 343, 121137. [Google Scholar] [CrossRef]
Figure 1. Two-layer optimization architecture of multi-region integrated energy systems.
Energies 19 03090 g001
Figure 2. Structure of a single regional integrated energy system.
Energies 19 03090 g002
Figure 3. Electrical/thermal demand and renewable power output profiles for RIES1.
Energies 19 03090 g003
Figure 4. Electrical/thermal demand and renewable power output profiles for RIES2.
Energies 19 03090 g004
Figure 5. Electrical/thermal demand and renewable power output profiles for RIES3.
Energies 19 03090 g005
Figure 6. Power distribution and electricity price characteristics under DO mode.
Energies 19 03090 g006
Figure 7. Power distribution and electricity price characteristics under 2S-TC mode.
Energies 19 03090 g007
Figure 8. Power distribution and electricity price characteristics under TSDTO mode.
Energies 19 03090 g008
Figure 9. Comparison curves of main transformer power under different operation modes.
Energies 19 03090 g009
Figure 10. Electrical and thermal power optimization results of RIES1.
Energies 19 03090 g010
Figure 11. Electrical and thermal power optimization results of RIES2.
Energies 19 03090 g011
Figure 12. Electrical and thermal power optimization results of RIES3.
Energies 19 03090 g012
Table 1. Key equipment parameters.
ParameterValue
η e C H P 0.3
η t h C H P 0.42
P C H P 0.4 MW
η t h E B 0.98
P E B 0.5 MW
η t h G F 0.9
P i j , m a x 2.25 MW
η c h E E S η d i s E E S 0.9/0.9
E m i n E E S E m a x E E S 0.1/0.85
α E E S 0
η c h T E S η d i s T E S 0.9/0.9
H m i n T E S H m a x T E S 0.1/0.9
α T E S 0.1
P m a x T r 3.15 MW
Table 2. Comparison of economy and renewable energy accommodation rate under different operation modes.
MethodCost 1Cost 2Cost 3Total CostAccommodation Rate
S13.59332.32883.82659.74830.837
S23.52192.27203.73279.52650.868
S32.84001.83743.02217.69951
S42.77581.80182.96747.54491
Table 3. Sensitivity analysis results.
ParameterVariationCost 1Cost 2Cost 3Total Cost
Base0%2.77581.80182.96747.5449
Renewable Energy+10%2.65951.74132.91097.3116
Renewable Energy−10%2.89201.86223.02407.7782
Load+10%3.19972.06033.34598.6058
Load−10%2.35181.54322.58896.4840
P m a x T r −10%2.77581.80182.96747.5449
P i j , m a x −10%2.77581.80182.96747.5449
Disclaimer/Publisher’s Note: The statements, opinions and data contained in all publications are solely those of the individual author(s) and contributor(s) and not of MDPI and/or the editor(s). MDPI and/or the editor(s) disclaim responsibility for any injury to people or property resulting from any ideas, methods, instructions or products referred to in the content.